the Creative Commons Attribution 4.0 License.
the Creative Commons Attribution 4.0 License.
 | 11 Oct 2022
Differential response of plant transpiration to uptake of rainwater-recharged soil water for dominant tree species in the semiarid Loess Plateau
Lina Wang
Yongqiang Yu
Dongxu Lu
Establishing whether uptake of rainwater-recharged soil water (RRS) can increase plant transpiration in response to rainfall pulses requires an investigation to evaluate plant adaptability, especially in water-limited regions where rainwater is the only replenishable soil water source. In this study, the water sources from RRS and three soil layers, the predawn leaf water potential (Ψpd), the midday leaf water potential (Ψm), the gradient of leaf water potential (Ψpd−Ψm), and the plant transpiration in response to rainfall pulses were analyzed for two dominant tree species, Hippophae rhamnoides subsp. sinensis and Populus tomentosa, in pure and mixed plantations during the growing period (June–September). Mixed afforestation significantly enhanced Ψpd−Ψm, RRS uptake proportion (RUP), and the relative response of daily normalized sap flow (SFR) and reduced the water source proportion from the deep soil layer (100–200 cm) for both species (P<0.05). In pure and mixed plantations, the large Ψpd−Ψm was consistent with high SFR for H. rhamnoides and the small Ψpd−Ψm was consistent with low SFR for P. tomentosa in response to rainfall pulses. Therefore, H. rhamnoides and P. tomentosa exhibited anisohydric and isohydric behavior, respectively, and the former plant species was more sensitive to rainfall pulses than P. tomentosa. Furthermore, in pure plantations, the SFR was significantly affected by RUP and Ψpd−Ψm for H. rhamnoides and significantly influenced by Ψpd−Ψm for P. tomentosa (P<0.05). However, the SFR was significantly influenced by RUP and Ψpd−Ψm for both species in the mixed plantation. These results indicate that mixed afforestation enhanced the influence of RRS uptake on plant transpiration for these different rainfall-pulse-sensitive plants. This study provides insights into suitable plantation species selection and management considering the link between RRS uptake and plant transpiration in water-limited regions.
- Article
(6103 KB) - Full-text XML
-
Supplement
(1899 KB) - BibTeX
- EndNote


Rainwater-recharged soil water (RRS) uptake by plants and plant transpiration in response to rainfall pulses drive the survival of plant species and ecosystem ecohydrological processes, especially in arid and semiarid regions where rainwater is the only replenishable soil water source (Berkelhammer et al., 2020; Gebauer and Ehleringer, 2000; West et al., 2012). Generally, RRS uptake after a rainfall pulse refers to the root uptake of soil water that was recharged by recent rainwater, and can be quantified through water stable isotopes (Cheng et al., 2006; Meier et al., 2018). The variability and intermittency of rainfall, which plays an important role in plant water uptake and transpiration (Swaffer et al., 2014; J. Wang et al., 2020), have been predicted to increase in water-limited regions (Mendham et al., 2011). Clarifying the influence of RRS uptake on plant transpiration after rainfall pulses is essential to understand the process of plant species adaptation in water-limited regions (Meier et al., 2018; Tfwala et al., 2019).
RRS uptake by a plant is expected to increase plant transpiration after a rainfall pulse (Cheng et al., 2006; Liu et al., 2019). However, the uptake of RRS may also be mainly used to reduce the water uptake from deep soil layers or decrease the risk of cavitation in stems by some plant species (Plaut et al., 2013; Tfwala et al., 2019). This variability in the response of plants to a rainfall pulse – either RRS uptake or plant transpiration – may be mainly attributed to an inconsistent influence of plant leaf physiological characteristics (West et al., 2007), root morphology adjustment (J. Wang et al., 2020), or environmental conditions (Tfwala et al., 2019) on these two water processes. (Tfwala et al., 2019) on these two water processes. Generally, plant transpiration is observed to increase after rainfall pulses for plants with shallow (Liu et al., 2019) or dimorphic (Swaffer et al., 2014) root systems; meanwhile, no increase or a decrease in plant transpiration is observed for plants with deep root systems (West et al., 2012). However, regardless of the root distribution, the plant leaf water potential gradient (, the difference between the predawn (Ψpd) and midday (Ψm) leaf water potentials) has been observed to regulate plant transpiration after rainfall pulses (Kumagai and Porporato, 2012; Liu et al., 2019). For example, plant species that show isohydric behavior generally maintain relatively small Ψpd−Ψm values to protect the stem hydraulic architecture, which is vulnerable to cavitation and limited plant transpiration under varied soil water conditions (Franks et al., 2007; McDowell et al., 2008). However, plant species that show anisohydric behavior are generally less vulnerable to cavitation and adopt relative large Ψpd−Ψm values to allow high plant transpiration after rainfall pulses (West et al., 2007; Klein, 2014; Ding et al., 2021). Thus, taking into consideration plant leaf physiological or root morphological parameters could aid understanding of the mechanisms underlying the influence of RRS uptake on plant transpiration in response to rainfall pulses.
Uptake of contrasting water sources by coexisting species usually shows water source separation and can minimize water source competition (Munoz-Villers et al., 2020; Silvertown et al., 2015); however, overlapping water sources among plant species may lead to competition in arid and semiarid regions (Tang et al., 2019; Yang et al., 2020). Rainfall pulses have been observed to relieve or eliminate water competition among coexisting species and thus maintain or increase plant transpiration in some water-limited regions (J. Wang et al., 2020; Tfwala et al., 2019). Meanwhile, plant species with strong RRS uptake abilities generally exhibit more competitiveness than coexisting species with weak RRS uptake abilities (Stahl et al., 2013; West et al., 2012). However, Liu et al. (2019) attribute opposite RRS uptake abilities to the stable coexistence of species in mixed plantations in semiarid regions, where the rainfall events are variable and less RRS is taken up by one of the coexisting plant species. In addition, coexisting species may also cope with or minimize water resource competition through plant leaf water potential or root distribution adjustment (Chen et al., 2015; Silvertown et al., 2015). It is still unclear whether these adjustments could influence the RRS uptake and plant transpiration for coexisting species in water-limited regions.
The “Grain for Green” project has increased vegetation coverage by 25 % in the Loess Plateau through afforestation activities since the 1990s in order to deal with vegetation degradation and water and soil loss (Tang et al., 2019; Wu et al., 2021). Hippophae rhamnoides subsp. sinensis and Populus tomentosa are typical deciduous broadleaved tree species that have similar leaf expansion (April) and falling (November) periods and occupy nearly 30 % of the plantation area in this region (Liu et al., 2017; Tang et al., 2019). Our previous study indicated that H. rhamnoides generally took up soil water from 0–40 or >100 cm soil depths and adopted a large value and variation of Ψpd−Ψm to cope with varied soil water conditions in this region (Tang et al., 2019). Meanwhile, P. tomentosa generally took up soil water from >100 cm soil depths throughout the growing season under varied soil water conditions (Xi et al., 2013). In addition, mixed plantations of these two species were widely promoted by local government due to their higher soil and water conservation capacity than pure plantations in the original afforestation stage (Tang et al., 2019; J. Wang et al., 2020). Tang et al. (2019) also suggested that mixed afforestation with Ulmus pumila, a deciduous broadleaved tree species with a similar leaf growth phenology to H. rhamnoides, increased the water source from 0–40 cm soil depth and enlarged Ψpd−Ψm for H. rhamnoides compared with the values for this species in a pure plantation. Furthermore, rainfall events have obvious seasonal variability, and the rainfall amount is generally lower than the reference evapotranspiration (ET0) during the plant growth period in this semiarid region (Zhang et al., 2017). The imbalance between rainwater input and plant water demand may weaken the sustainability of plantations with further plant growth (Jia et al., 2020; Wu et al., 2021). To understand the adaptation of plantation species, the plant transpiration, water sources from RRS and different soil layers, and plant leaf water potentials for H. rhamnoides and P. tomentosa in pure and mixed plantations were analyzed in this study. The specific objectives were as follows: (1) to investigate the influence of RRS uptake and leaf water potential on plant transpiration after rainfall events in pure plantations, and (2) to assess the effect of mixed afforestation on these influences. Based on the variations of plant water uptake from different soil layers and the leaf water potentials for these species in Xi et al. (2013) and Tang et al. (2019), we hypothesize that (1) the influences of RRS uptake and leaf water potential on plant transpiration may differ for these species in pure plantations, and that (2) these influences may differ for specific species in pure and mixed plantations.
2.1 Study site
The study was conducted in the Ansai Ecological Station in the semiarid Loess Plateau (36.55∘ N, 109.16∘ E, 1221 m a.s.l. – above sea level), Northern China (Fig. S1 in the Supplement). The study area has a semiarid continental climate. The annual average (mean ± SD) rainfall amount and air temperature are 454.8±105.2 mm and 10.6±0.4 ∘C (2000–2017), respectively, with higher monthly rainfall amounts and air temperatures generally occurring during June–September and lower values during the other months (Fig. S1).
Three adjacent plantations were chosen for the study: a pure H. rhamnoides plantation, a pure P. tomentosa plantation, and an H. rhamnoides–P. tomentosa mixed plantation (Fig. S1), with corresponding plantation slopes of 5.2, 4.5, and 5.5∘. All plantations were planted on abandoned grassland in 2004, where Bothriochloa ischaemum was the dominant herbaceous species at that time. Three adjacent plots were selected (16 m × 10 m) for each plantation type, and no soil and water conservation measure was conducted in the plantations. In the pure plantations, the original planted spacing for each individual plant was 2.0 m × 2.0 m. In the mixed plantation, P. tomentosa was originally planted in the 4.0 m gaps in rows of H. rhamnoides, with individual plants spaced 2.0 m × 2.0 m apart. Based on a survey performed in July 2018, in pure plantations, the average tree trunk diameter (at 1.2 m height above the ground) and height were 50.5±3.6 mm and 4.11±0.81 m for H. rhamnoides, respectively, and the corresponding values were 52±4.6 mm and 4.05±0.63 m for P. tomentosa. Meanwhile, in mixed plantations, the average trunk diameter and tree height were 51.3±2.9 mm and 4.49±0.7 m for H. rhamnoides, respectively, and the corresponding values were 56.3±3.8 mm and 4.23±0.79 m for P. tomentosa. B. ischaemum and Glycyrrhiza uralensis were the dominant herbaceous species in the H. rhamnoides and P. tomentosa pure plantations, respectively; meanwhile, B. ischaemum was dominant in the mixed plantation. Based on an experiment conducted in July 2018 using the cutting ring (Wu et al., 2016), constant water head (Reynolds et al., 2002), and centrifugation (Qiao et al., 2019) method, the soil bulk density, total porosity, saturated hydraulic conductivity, field capacity, and permanent wilting point at 0–200 cm soil depth were found to be similar in the three plantations. The average soil bulk density was 1.38±0.08, 1.35±0.11, and 1.35±0.09 g cm−3 for pure H. rhamnoides, pure P. tomentosa, and mixed plantations, respectively, and the corresponding soil total porosity was 48.2±0.6, 48.1±0.4, and 48.1±0.7 %. The average soil saturated hydraulic conductivity was 0.44±0.08, 0.46±0.09, and 0.46±0.08 mm min−1 for pure H. rhamnoides, pure P. tomentosa, and mixed plantations, respectively. The average field capacity was 0.26±0.02, 0.25±0.03, and 0.25±0.02 m3 m−3 for pure H. rhamnoides, pure P. tomentosa, and mixed plantations, respectively, and the corresponding permanent wilting point was 0.06±0.02, 0.06±0.01, and 0.06±0.02 m3 m−3. The soil is characterized as a silt loam soil according to United States Department of Agriculture soil taxonomy, with average sand (2–0.05 mm), silt (0.05–0.002 mm), and clay (<0.002 mm) compositions of 24.3±1.3, 63.2±1.1, and 12.5±2.1 %, respectively, for the three plantation types at 0–200 cm soil depth. These compositions were determined using a Mastersize 2000 (Malvern Instruments Ltd., UK).
2.2 Environmental parameter measurements and ET0 calculation
Net radiation (Rn, CNR4, Kipp & Zone Inc., the Netherlands), atmospheric pressure (CS105, Vaisala Inc., Finland), air temperature (Ta) and relative humidity (HMP45D, Vaisala Inc.), and wind velocity (Ws, A100R, Vector Inc., UK) were measured using a weather station nearly 500 m from the research plots. Soil heat flux (G) and rainfall amount were measured 5 cm belowground using two HFT-3 plates (Campbell Scientific Inc., USA) and a TE525 rain gauge (Campbell Scientific Inc.), respectively. At each plot, soil water content (SW) was measured 5, 20, 50, 100, 150, and 200 cm belowground (SW5 cm, SW20 cm, SW50 cm, SW100 cm, SW150 cm, and SW200 cm) by CS615 probes (Campbell Scientific Inc.). All these parameters were measured and stored at 30 min intervals by a CR3000 datalogger (Campbell Scientific Inc.).
ET0, which considers both aerodynamic characteristics and the energy balance, was used to indicate atmospheric evaporative demand (Allen et al., 1998).
Here, γ, s, and VPD are the psychrometric constant (kPa K−1), the slope between saturation vapor pressure and air temperature (kPa K−1), and the vapor pressure deficit (kPa), respectively. The units of Rn and G are MJ m−2 d−1, and the unit of Ws is m s−1.
2.3 Sap flow observation
Three standard individuals of specific species that were of approximately mean height and trunk diameter were chosen in each of the nine plots (Table S1 in the Supplement). In each plot in the mixed plantation, three individuals of H. rhamnoides were chosen first, and then a neighboring P. tomentosa individual at approximately 2 m distance from each chosen H. rhamnoides individual was selected. The sap flow was monitored by a pair of Granier-type thermal dissipation probes (TDPs) 10 mm in length and 2 mm in diameter in 36 selected individuals. During the plant growing season, ranging from 11 May (DOY 132) to 30 September (DOY 273) in 2018, the 30 s original and 30 min average sap flow values were monitored using a CR3000 data logger (Campbell Scientific Inc.). Waterproof silicone and aluminum foil were used to avoid the impact of the external environment on and physical damage to TDPs (Du et al., 2011). The standard sap flow density (Fd, mL m−2 s−1) was calculated as follows (Granier, 1987):
where Δt and Δtmax are the temperature difference between heated and unheated probes at 30 min intervals and the maximum Δt each day, respectively.
Steppe et al. (2010) suggested that Fd should have a species-specific calibration to validate Eq. (2). Meanwhile, the possibility of underestimating the Fd value with the Granier-type thermal dissipation method (Du et al., 2011) should be considered when the whole tree transpiration is calculated. However, due to the lack of species-specific calibration of Eq. (2) in the present study, the daily normalized Fd for each replicate individual was calculated as the index of plant transpiration by dividing Fd by the maximum value from DOY 132 to DOY 273. Thus, each monitored individual had a maximum daily normalized Fd of 1. For each plantation type, the average daily normalized Fd for a specific species was calculated for each plot to determine the plant transpiration characteristics rather than the absolute transpiration amount (Du et al., 2011).
2.4 Rainwater, plant stem, soil water, and leaf sample collection and measurement
From April to October 2018, at the end of each rainfall event, 19 rainwater samples were collected immediately using a polyethylene rain gauge cylinder placed in the weather station and then stored at 4 ∘C. A funnel containing a ping-pong ball was connected to the top of rain gauge cylinder to avoid rainwater evaporation (Yang et al., 2015). To avoid the influence of sample collection on sap flow observation, one standard individual for the specific species near to each sap-flow-monitored individual was selected for plant stem and soil water collection. In the mixed plantation, the distance was approximately 2 m between the selected standard individuals of H. rhamnoides and P. tomentosa in each plot for sample collection. For plant stem and soil water collection, five rainfall events were selected: 3.4 mm (DOY 194), 7.9 mm (DOY 265), 15.4 mm (DOY 249), 24 mm (DOY 204), and 35.2 mm (DOY 155–156). Rainfall events with an interpulse period of longer than 7 d were selected to eliminate the potential influence of the previous rainfall event. In addition, no runoff was generated during the selected rainfall events in the three plantations according to the simulated results from the HYDRUS-1D software (version 4.15) (Appendix A), which is based on the Richards equation to describe soil water dynamics (Šimůnek et al., 2008). This software has been widely used to simulate the runoff and soil water dynamics in the Loess Plateau (Yi and Fan, 2016; Bai et al., 2020; S. F. Wang et al., 2020).
On each of the 3 successive days after every selected rainfall event, one suberized stem with the bark removed was collected at midday (11:30–13:30 LT) for each standard individual. Meanwhile, one soil core was collected at seven depths (0–10, 10–20, 20–30, 30–50, 50–100, 100–150, and 150–200 cm) by soil drilling approximately 0.5 m from the stem of each standard individual in the pure plantations and in the middle between the two species in the mixed plantation. The suberized stem and collected soil samples were placed into glass bottles. These bottles were sealed with parafilm and stored at −15 ∘C. On the same day as plant stem and soil sample collections were performed, one leaf was selected from each sap-flow-monitored individual for leaf water potential measurement. Ψpd and Ψm were measured by a PMS1515D analyzer (PMS Instrument, Corvallis Inc., OR, USA) at predawn (04:30–05:30 LT) and midday (11:20–12:40 LT), respectively.
All the plant stem, soil, and leaf samples collected on the first day after a rainfall pulse were used for analysis, with further details given in Sect. 2.6. There were 180 stem and 945 soil samples for water extraction and 180 leaf samples for Ψpd and Ψm measurement, respectively.
A vacuum line (LI-2100, LICA Inc., China) was used to extract water from soil samples and plant stems. The water isotopic values of rainwater, soil samples, and plant stems were determined using a DLT-100 water isotope analyzer (LGR Inc., USA) with accuracies of ±0.1 for δ18O and ±0.3 ‰ for δD. The potential influence of organic matter on water isotopic values produced during water extraction from stems was eliminated using the method of Yang et al. (2015). The isotopic values (‰) were calculated as follows:
where Rstandard and Rsample indicate the () molar ratios in sample and standard water, respectively. Vienna Standard Mean Ocean Water is the standard water for 18O and D. The average water δ18O and δD values of plant stems for specific species and corresponding soil samples in each plot were calculated for further analysis.
2.5 Plant fine root investigation
In August 2018, four soil cores were dug around each selected standard individual for plant stem and soil water collection using a soil drill with a diameter of 20 cm to investigate plant fine roots. The collected soil depths were 0–10, 10–20, 20–30, 30–50, 50–70, 70–100, 100–130, 130–150, and 150–200 cm, and the cores were approximately 0.5 m from the stem of the selected standard individual. The sum of the root samples from the four soil cores taken at each soil depth for each selected standard individual was used for fine root distribution analysis, giving 324 fine root samples. WinRHIZO (Regent Instruments Inc., Quebec, Canada) was used to determine the fine root (diameter < 2 mm) surface area at each soil depth. The average fine root surface area for each species in each plot was calculated for further analysis.
2.6 Statistical analysis
2.6.1 Calculation of plant transpiration and leaf water potential in response to a rainfall pulse
In the present study, the maximum normalized Fd within 3 days of a rainfall event for H. rhamnoides and P. tomentosa occurred on the first day after rainfall in both plantation types, except after 24 and 35.2 mm events, where the maximum normalized Fd for P. tomentosa in the pure plantation occurred on the second day. However, for P. tomentosa in the pure plantation, there was no significant difference (P>0.05) in diurnal sap flow between the first and second day after each of these two rainfall events based on an independent-sample t-test (Fig. S2). Therefore, the normalized Fd on the first day after each selected rainfall amount was used in Eq. (4) to calculate the relative response of the daily normalized Fd (SFR, %) to rainfall pulses:
where Xafter and Xbefore are the normalized Fd on the first day after and on the day before the rainfall event, respectively.
Meanwhile, neither Ψpd nor Ψm nor Ψpd−Ψm showed significant differences between the first and second day after each rainfall event (P>0.05) for these two species in both plantation types (Table S2). On the first day after each rainfall event, the average Ψpd, Ψm, and Ψpd−Ψm for specific plant species in each plot were used in the following analysis to illustrate the influence of leaf water potential on SFR in response to rainfall pulses.
2.6.2 Calculation of RRS uptake proportion and water sources from different soil layers
The RRS uptake proportion (RUP, %) after a recent rainfall pulse for a plant was calculated as the proportion of rainwater in the plant stem as follows: (Cheng et al., 2006):
where δ18O(D)rain and δ18O(D)p are the isotopic values for the rainwater and the plant stem after the rainfall, respectively; δ18O(D)swb and δ18O(D)swa are the isotopic values of soil water immediately before and after the rainfall, respectively. Equation (6) is derived through the linear mixing model for the water isotopic value in a plant stem after the rainfall considered in Eq. (5). The RUP was the average value calculated in Eq. (6) based on δ18O or δD for specific plant species in each plot.
Equations (5) and (6) are based on the assumption that little or no soil water is lost through evaporation. Thus, in this study, only the values of plant stem and soil water collected on the first day immediately after rainfall were used, and only the RUP on the first day after each rainfall event was calculated.
In this study, the δ18O(D)swb could not be directly and accurately determined through soil water sample collection due to the unpredictability of natural rainfall events. A linear mixed model can be used to calculate the δ18O(D)swb based on the isotopic values for rainwater and soil water after rainfall and the soil-depth-interval-weighted SW before (SWb, m3 m−3) and after (SWa, m3 m−3) rainfall:
In addition to RUP, the water uptake proportions from different soil layers were calculated on the first day after a rainfall event using the MixSIR program to complement the analysis of plant water source variations in response to rainfall pulses. The RUP method only calculated the proportion of recent rainwater in the plant stem and did not include soil water before the recent rainfall event (Gebauer and Ehleringer, 2000; Cheng et al., 2006). The water taken up from different soil layers by the plant is a mixture of soil water from before the recent rainfall event and the recent rainwater.
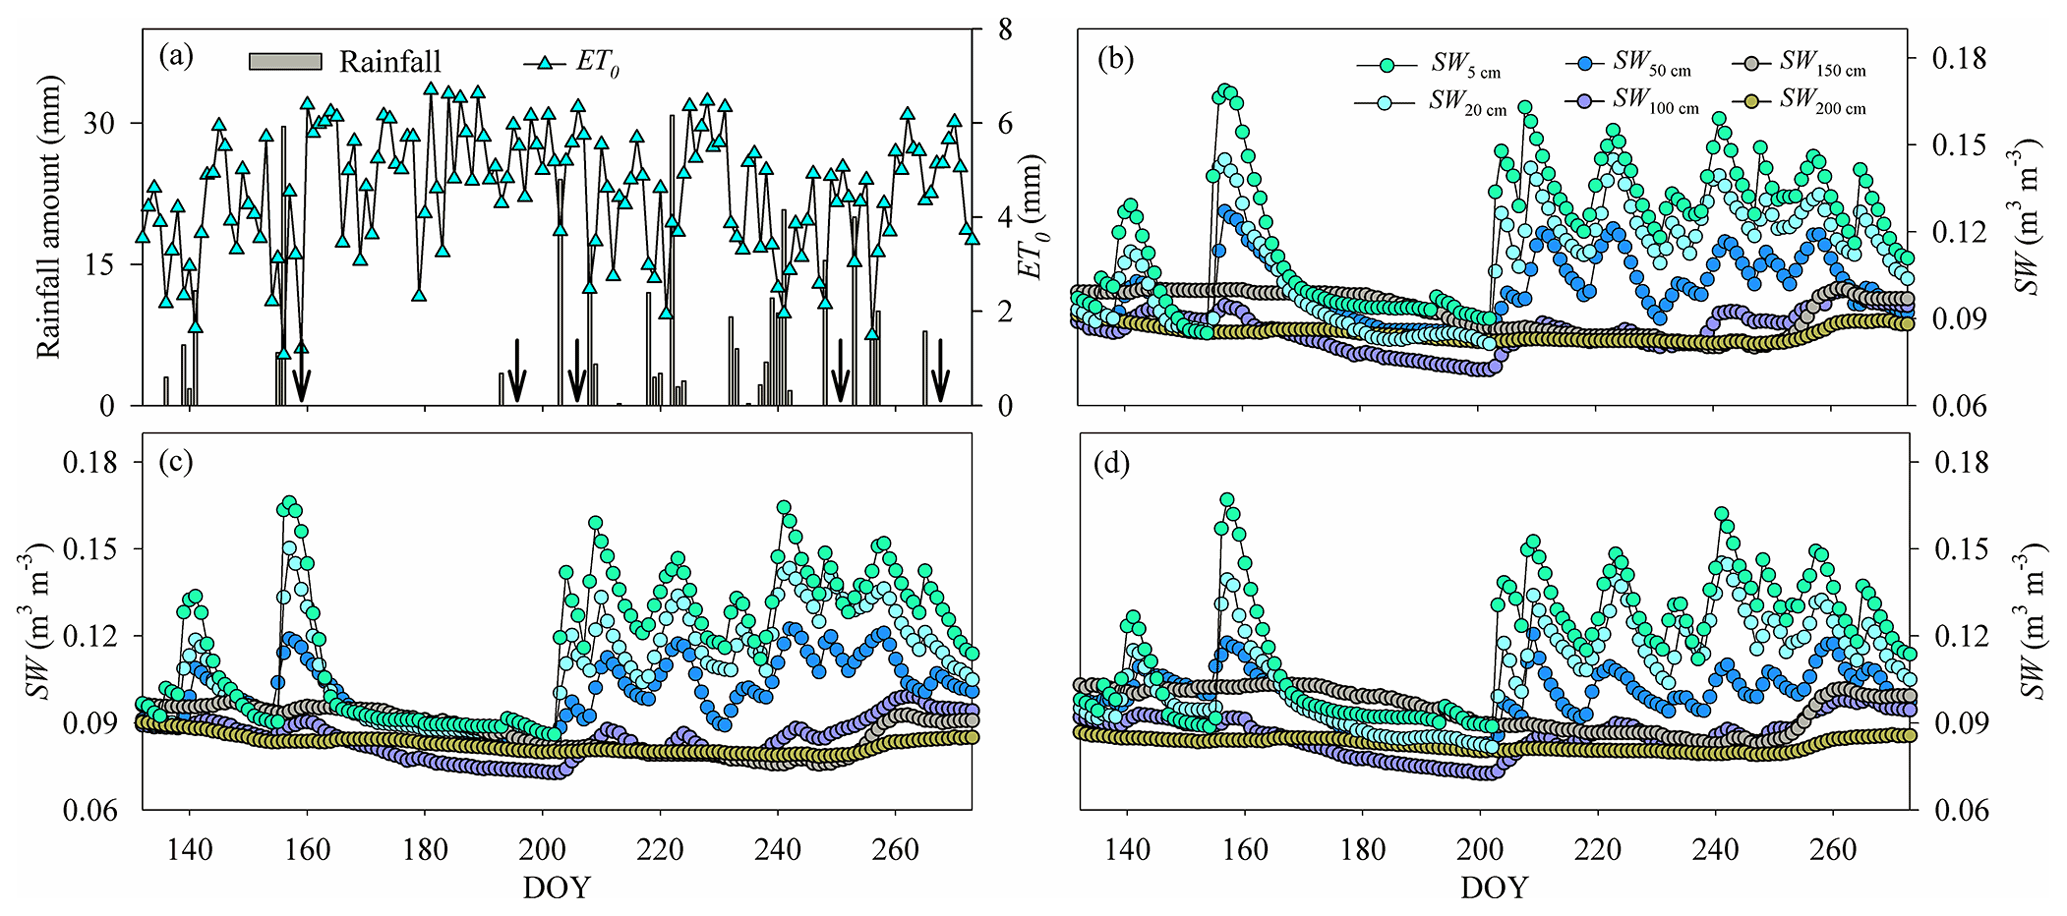
Figure 1(a) Variation in the rainfall amount and reference evapotranspiration (ET0). (b)–(d) Variation in the average soil water content (SW) in (b) the pure H. rhamnoides plantation, (c) the pure P. tomentosa plantation, and (d) the mixed plantation from DOY 132 to 273 (11 May to 30 September) (n=3) n is the number, indicating that each point in (b)–(d) is the average value of 3 number values. Standard deviation bars for the SW in each soil layer are not shown to allow the variation of SW for each plantation to be displayed clearly. Arrows in (a) indicate dates of sample collection (the first day after each rainfall event): DOY 157 (6 June), DOY 194 (12 July), DOY 204 (23 July), DOY 249 (6 September), and DOY 266 (23 September).
Firstly, the seven soil depths (0–10, 10–20, 20–30, 30–50, 50–100, 100–150, and 150–200 cm) were combined into three soil layers (shallow, middle, and deep) based on the variation of soil water δ18O and δD and SW to facilitate a water source comparison (J. Wang et al., 2020; Zhao et al., 2021). The shallow (0–30 cm) soil layer was vulnerable to rainfall, which exhibited high soil water δ18O and δD values and large water isotope and SW variations (Table S3, Fig. S3). The middle (30–100 cm) soil layer was less vulnerable to rainfall, with moderate soil water isotope values and water isotope and SW variations. The deep (100–200 cm) soil layer was relatively stable, with lower soil water isotope values and smaller water isotope and SW variations compared with the shallow and middle soil layers. In addition, based on one-way ANOVA followed by Tukey's post hoc test, significant differences (P<0.05) were observed in soil water δ18O and δD among the three soil layers in each plot. Then, the water uptake proportions from the three soil layers were calculated using the MixSIR program (Moore and Semmens, 2008), with the model's input parameters being the average δ18O and δD values in plant stem water and soil water at each soil layer in each plot. The SD for δ18O and δD at each soil layer was also used to accommodate the uncertainties of these values. No fractionation during water source uptake by these plant roots was considered because none of the plants exhibited xerophytic or halophytic characteristics. Ellsworth and Williams (2007) and Moore and Semmens (2008) suggested that water stable isotope fractionation generally occurred during root uptake by xerophytic or halophytic plants.
2.6.3 Statistical analysis of plant transpiration, water sources, and leaf water potential in response to rainfall pulses
A repeated ANOVA (ANOVAR) was used to analyze the differences in plant transpiration, water sources, and plant physiological parameters between these species in pure and mixed plantations. This analysis was conducted with SFR, RUP, relative water uptake proportions from the three soil depths, and Ψpd−Ψm used as response variables and “species” and “rainfall” used as between-subject and within-subject factors, respectively. The same analysis was used to detect the mixed afforestation effect on response variables for each plant species, with “plantation type” and “rainfall” used as between-subject and within-subject factors, respectively. Furthermore, significant differences in fine root proportion for each soil layer (shallow, middle, and deep) for specific species between pure and mixed plantations were detected through the independent-samples t-test. All of these analyses were calculated with SPSS 18 (IBM Inc., New York, USA) after the data had been tested for a normal distribution and homogeneity of variance.
3.1 Variation in environmental parameters and the plant fine root vertical distribution
The rainfall amount during the study period (262.7 mm, DOY 132–273) was 15.6 % lower than the average value during 2000–2017. Rainfall varied seasonally, with 36 consecutive days having no rainfall event (DOY 157–192) and 5 days having successive rainfall events (DOY 237–241) (Fig. 1). The ET0 (554.7 mm) was approximately twice the rainfall amount during the study period, with higher and lower values occurring during the low (DOY 132–202) and high (DOY 203–273) rainfall event periods, respectively (Fig. 1). The Rn and VPD also exhibited higher and lower values during the low and high rainfall event periods, respectively (Fig. S4). The SW increased and subsequently decreased by different degrees following rainfall events, with the shallow soil layer (0–30 cm) exhibiting higher variation than the corresponding value below 30 cm in the three plantations (Fig. 1, Table S3). The coefficients of variation (CVs, SD/mean) for SW in the shallow soil layer were 18.2 %, 16.7 %, and 17.3 % in the H. rhamnoides and P. tomentosa pure plantations and the mixed plantation, respectively. The SW in the shallow and middle (30–100 cm) soil layers exhibited lower values than the SW in some deep soil layers (100–200 cm) during the periods with fewer rainfall events (such as DOY 157–192) in the three plantations. In addition, compared with the shallow and middle soil layers, the deep soil layer SW exhibited a time lag in its response to rainfall events.
The H. rhamnoides and P. tomentosa in the pure plantations exhibited different fine root vertical distributions, with more than 40 % of the fine roots observed in shallow and deep soil layers, respectively (Fig. 2). In the shallow soil layer, no significant differences in fine root proportion were observed for H. rhamnoides between the pure and mixed plantations (P>0.05). However, the fine root proportion of P. tomentosa in the shallow soil layer significantly increased from 21.9 % in the pure plantation to 31.3 % in the mixed plantation (P<0.05).
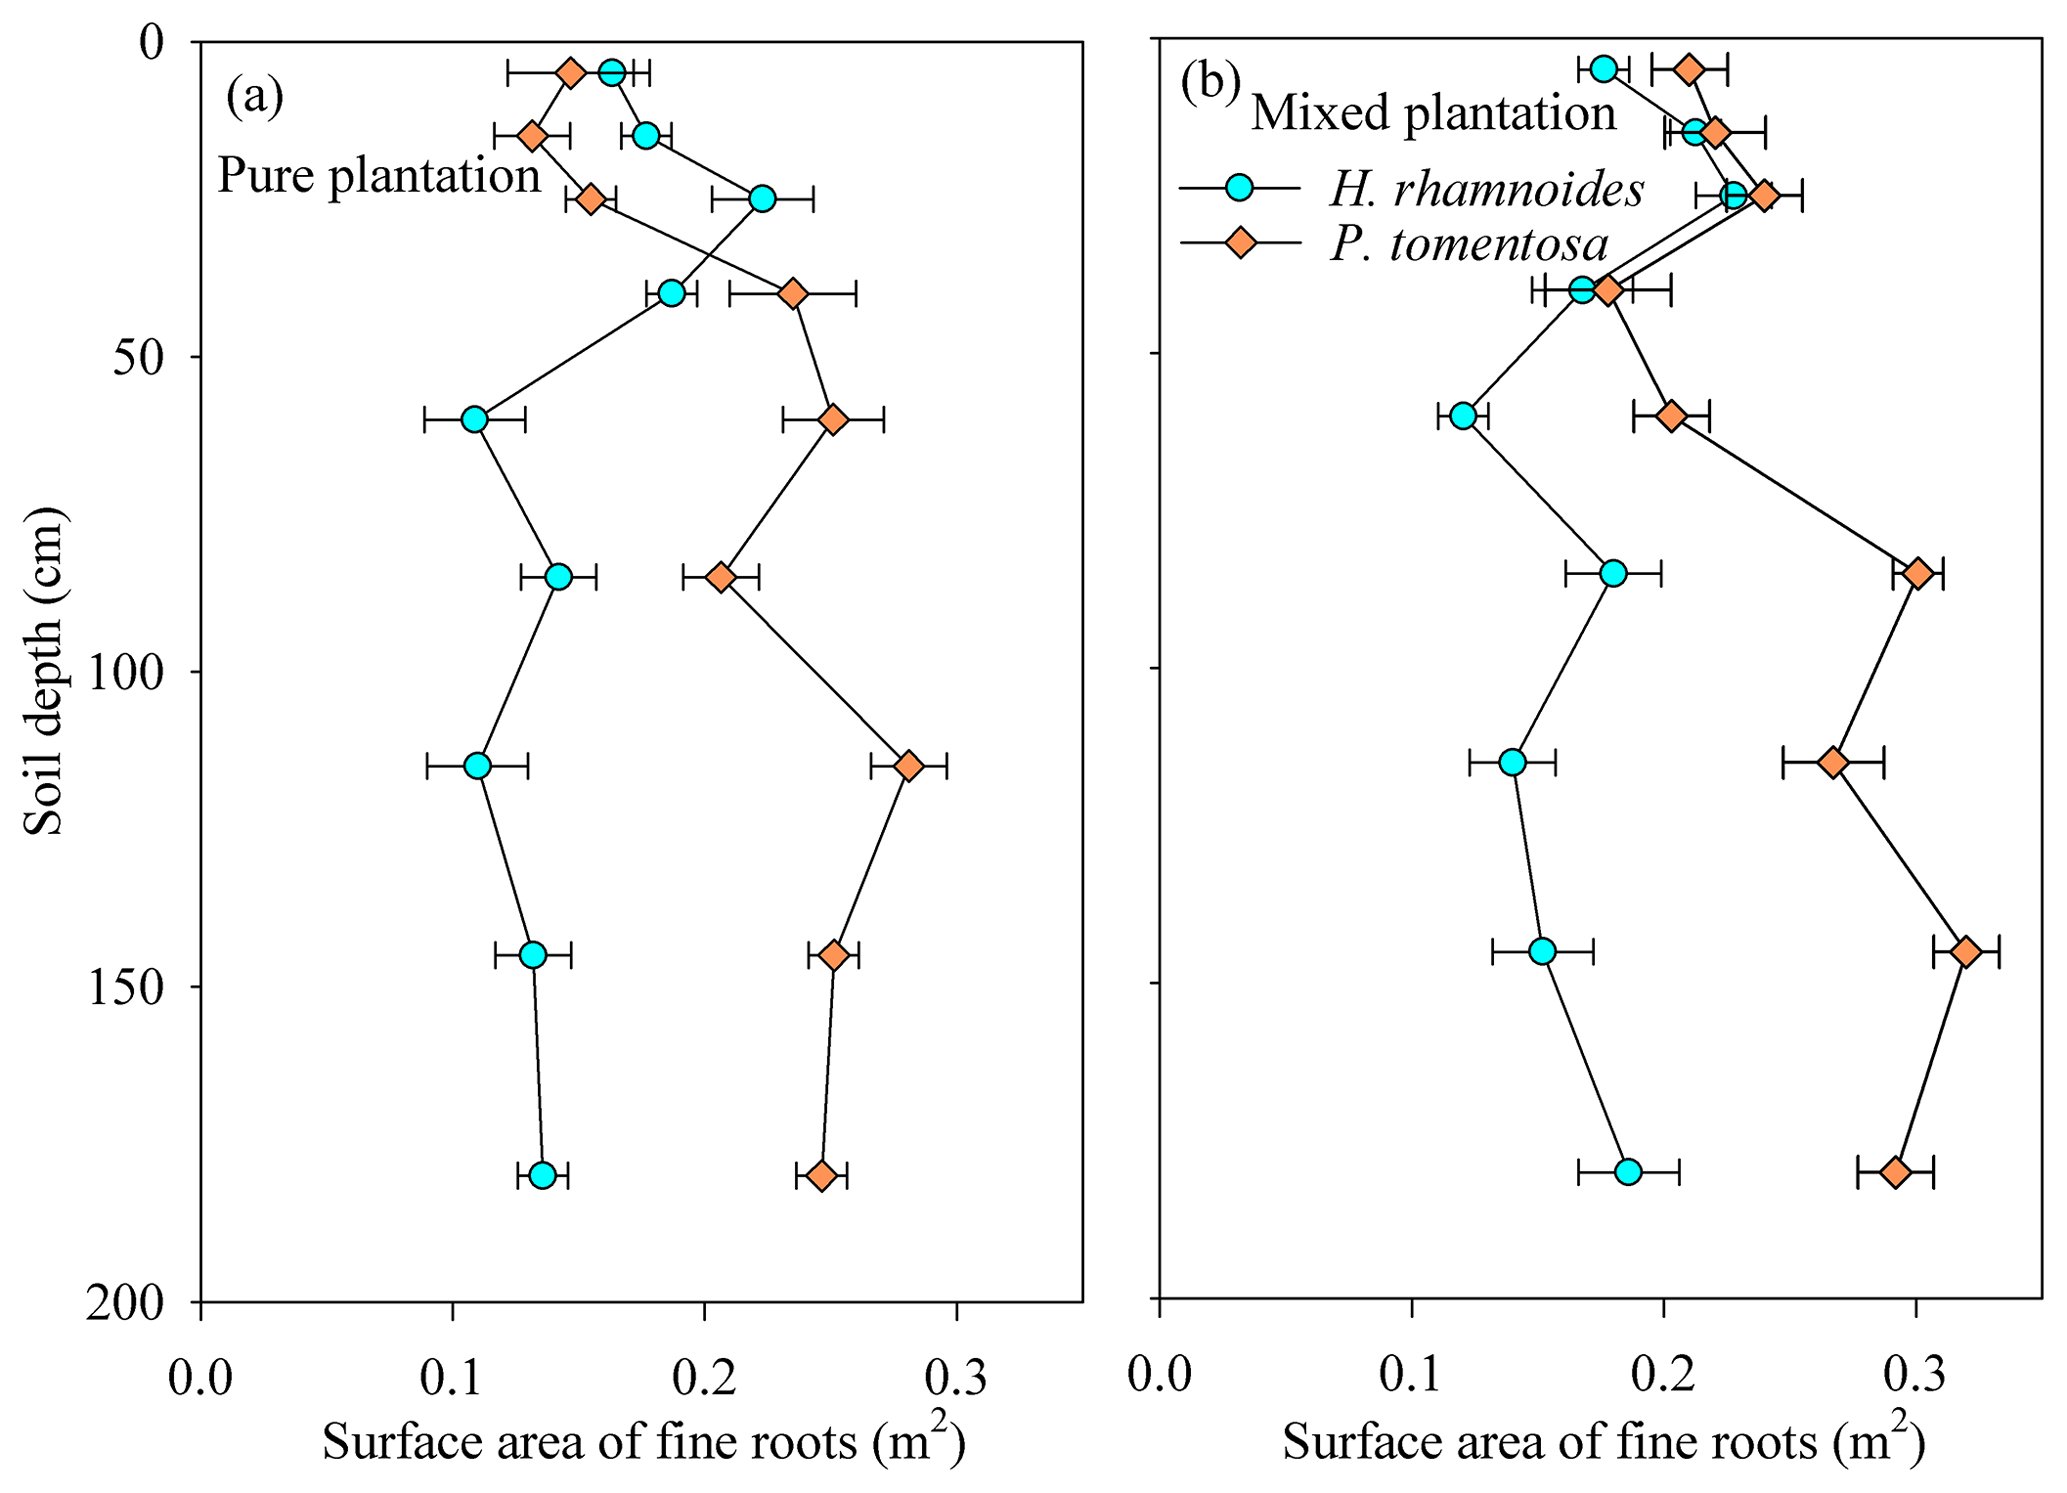
Figure 2Variation in the average surface area of fine roots at different soil depths for H. rhamnoides and P. tomentosa in (a) pure and (b) mixed plantations. Error bars indicate the standard deviation (n=3).
3.2 Variations in sap flow
Daily normalized Fd for H. rhamnoides and P. tomentosa fluctuated with rainfall events in pure and mixed plantations (Fig. 3). The variation of normalized Fd for H. rhamnoides and P. tomentosa in the mixed plantation was higher than that for the specific species in pure plantations, with corresponding CVs of 29.4 % and 31.8 % in the mixed plantation and 19.8 % and 24.9 % in the pure plantations (Fig. 3). The SFR after rainfall pulses was significantly influenced by both rainfall amount and plant species (P<0.001) (Fig. 3, Table S4). Following large rainfall amounts (≥15.4 mm), the diurnal variation of sap flow was significantly higher than the value before rainfall (P<0.05) for H. rhamnoides in the pure plantation and for P. tomentosa in both plantation types (Figs. S5 and S6). The lowest rainfall amount (7.9 mm) that significantly increased the diurnal variation of sap flow was observed for H. rhamnoides in the mixed plantation (Fig. S5). Furthermore, in response to rainfall pulses, the SFR for H. rhamnoides in pure (range 6.7±1.2 % to 106.3±4.7 %) and mixed (range 2.2±0.5 % to 190.9±15.5 %) plantations was significantly higher (P<0.001) than the corresponding values for P. tomentosa (ranges of 4.2±0.5 % to 60.3±5.7 % and 3.1±0.5 % to 83.0±14.2 %; Table S4). Mixed afforestation significantly enhanced SFR for both species (P<0.001) (Table S4).

Figure 3Variation in (a) rainfall amount and (a)–(d) average daily normalized Fd for H. rhamnoides in (a) pure and (b) mixed plantations and for P. tomentosa in (c) pure and (d) mixed plantations from DOY 132 to 273 (11 May to 30 September) (n=3). Arrows in (a) indicate dates of sample collection (the first day after a rainfall event): DOY 157 (6 June), DOY 194 (12 July), DOY 204 (23 July), DOY 249 (6 September), and DOY 266 (23 September).
3.3 Variations in plant water sources
The soil water δ18O and δD for pure H. rhamnoides, pure P. tomentosa, and mixed plantations showed large vertical variations following small rainfall events (≤7.9 mm) and exhibited relatively small vertical variations following large rainfall events (≥15.4 mm) (Fig. S7). The average isotopic values of soil water decreased from shallow to deep soil layers (Table S3), and water isotopic values in the shallow and middle soil layers were close to those of rainwater in the three plantations following large rainfall events.
Although no significant difference in RUP was observed between H. rhamnoides (14.2±7.8 %) and P. tomentosa (12.4±7.3 %) in pure plantations (Fig. 4, Table S4), the RUP was significantly higher for H. rhamnoides (19.2±8.6 %) than P. tomentosa (14.6±5.9 %) in the mixed plantation (P<0.05) (Table S4). In addition, H. rhamnoides mainly took up water from the middle soil layer in pure and mixed plantations based on the MixSIR result, with corresponding average values of 36.3±2.4 % and 44.1±3.1 % (Fig. 5). The main water source for P. tomentosa in pure and mixed plantations was from the deep and middle soil layer, respectively, with corresponding average values of 41.4±15.2 % and 40.2±5.9 %. In the pure plantation, the water absorbed from the shallow and middle soil layers for H. rhamnoides was significantly higher than for P. tomentosa; however, the water absorbed from the deep soil layer was significantly lower for the former species (P<0.05) (Table S5). No significant differences in the water sources from each soil layer were observed between these species in the mixed plantation (Table S5). In addition, mixed afforestation significantly enhanced RUP and decreased the deep soil water uptake proportion for H. rhamnoides and P. tomentosa (P<0.05) (Table S4, Figs. 4 and 5).

Figure 4Variation in average rainwater-recharged soil water uptake proportion (RUP) for H. rhamnoides and P. tomentosa in (a) pure and (b) mixed plantations after five rainfall events (n=3).
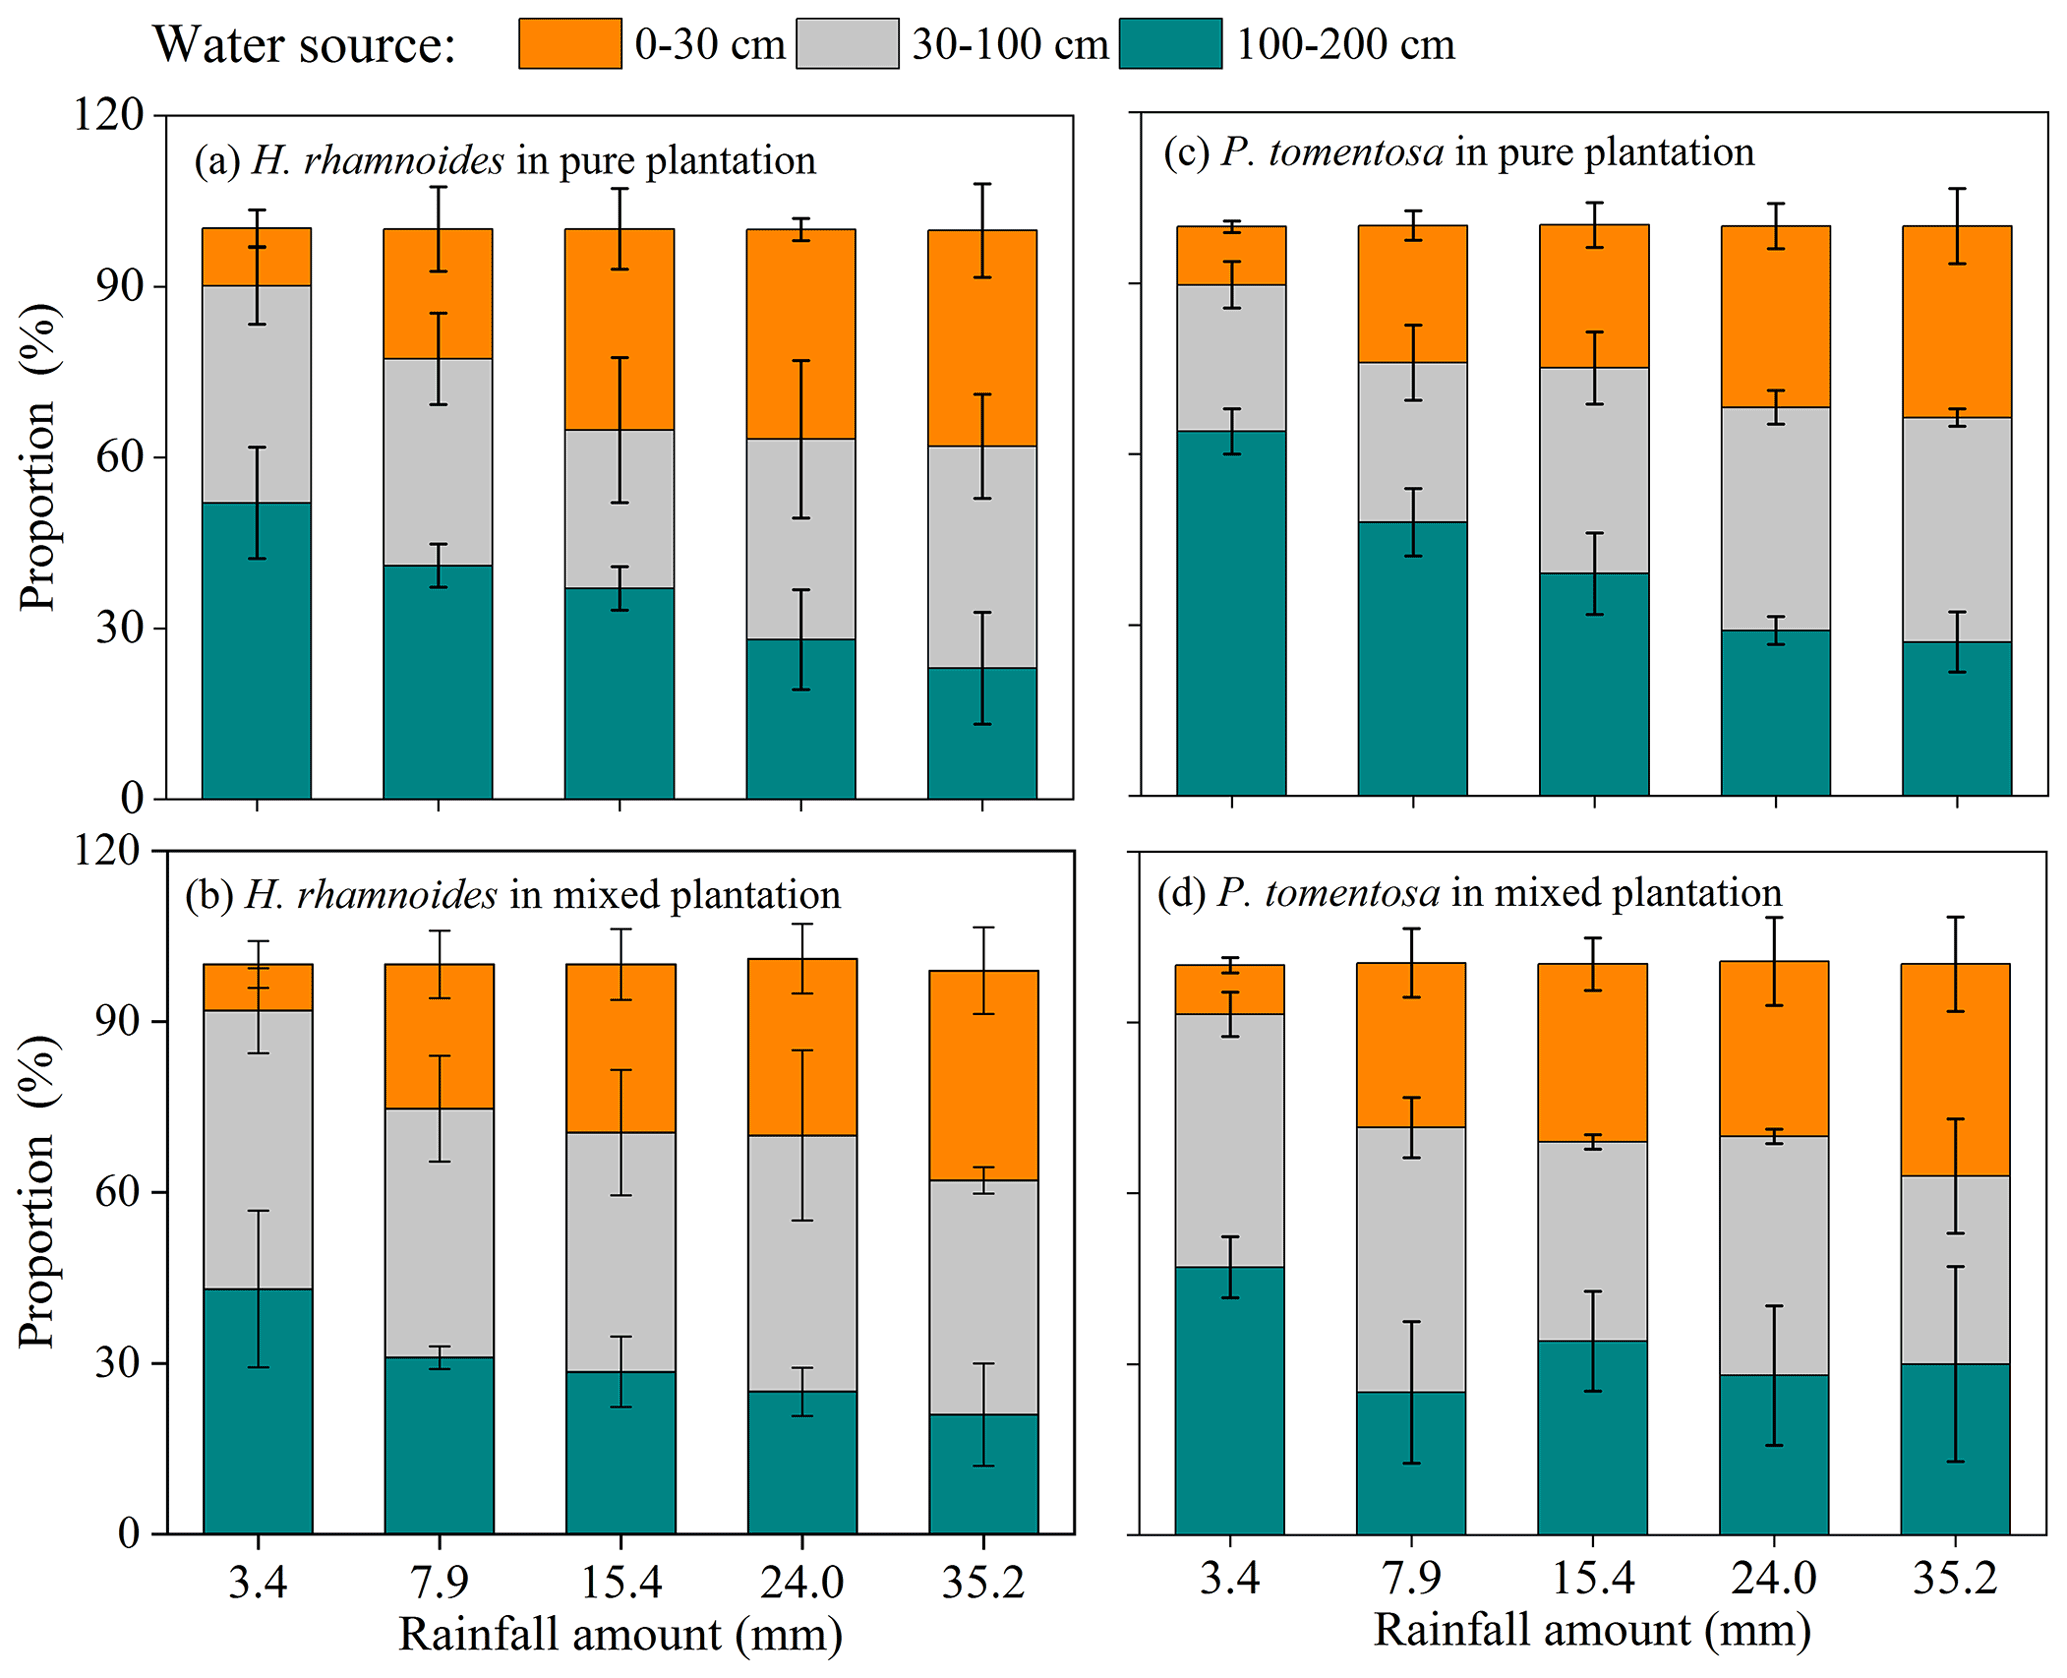
Figure 5Variation in average plant water sources from three soil layers (0–30, 30–100, and 100–200 cm) for H. rhamnoides in (a) pure and (b) mixed plantations, and for P. tomentosa in (c) pure and (d) mixed plantations, after five rainfall events (n=3).
3.4 Variations in plant leaf water potential
In response to rainfall pulses, H. rhamnoides exhibited higher CVs for Ψm and Ψpd−Ψm than the corresponding values for P. tomentosa in both plantation types; meanwhile, H. rhamnoides exhibited lower CVs for Ψpd than P. tomentosa did in pure (16.9 % and 18.3 %, respectively) and mixed (13.5 % and 19.7 %, respectively) plantations (Fig. 6). Compared with P. tomentosa, H. rhamnoides exhibited significantly higher Ψpd in the pure plantation, lower Ψm in the mixed plantation, and larger Ψpd−Ψm in both plantation types (P<0.05) (Table S6). Meanwhile, mixed afforestation significantly reduced the Ψm and increased the Ψpd for H. rhamnoides and P. tomentosa (P<0.05), respectively, and it significantly increased Ψpd−Ψm for both species (Table S6).
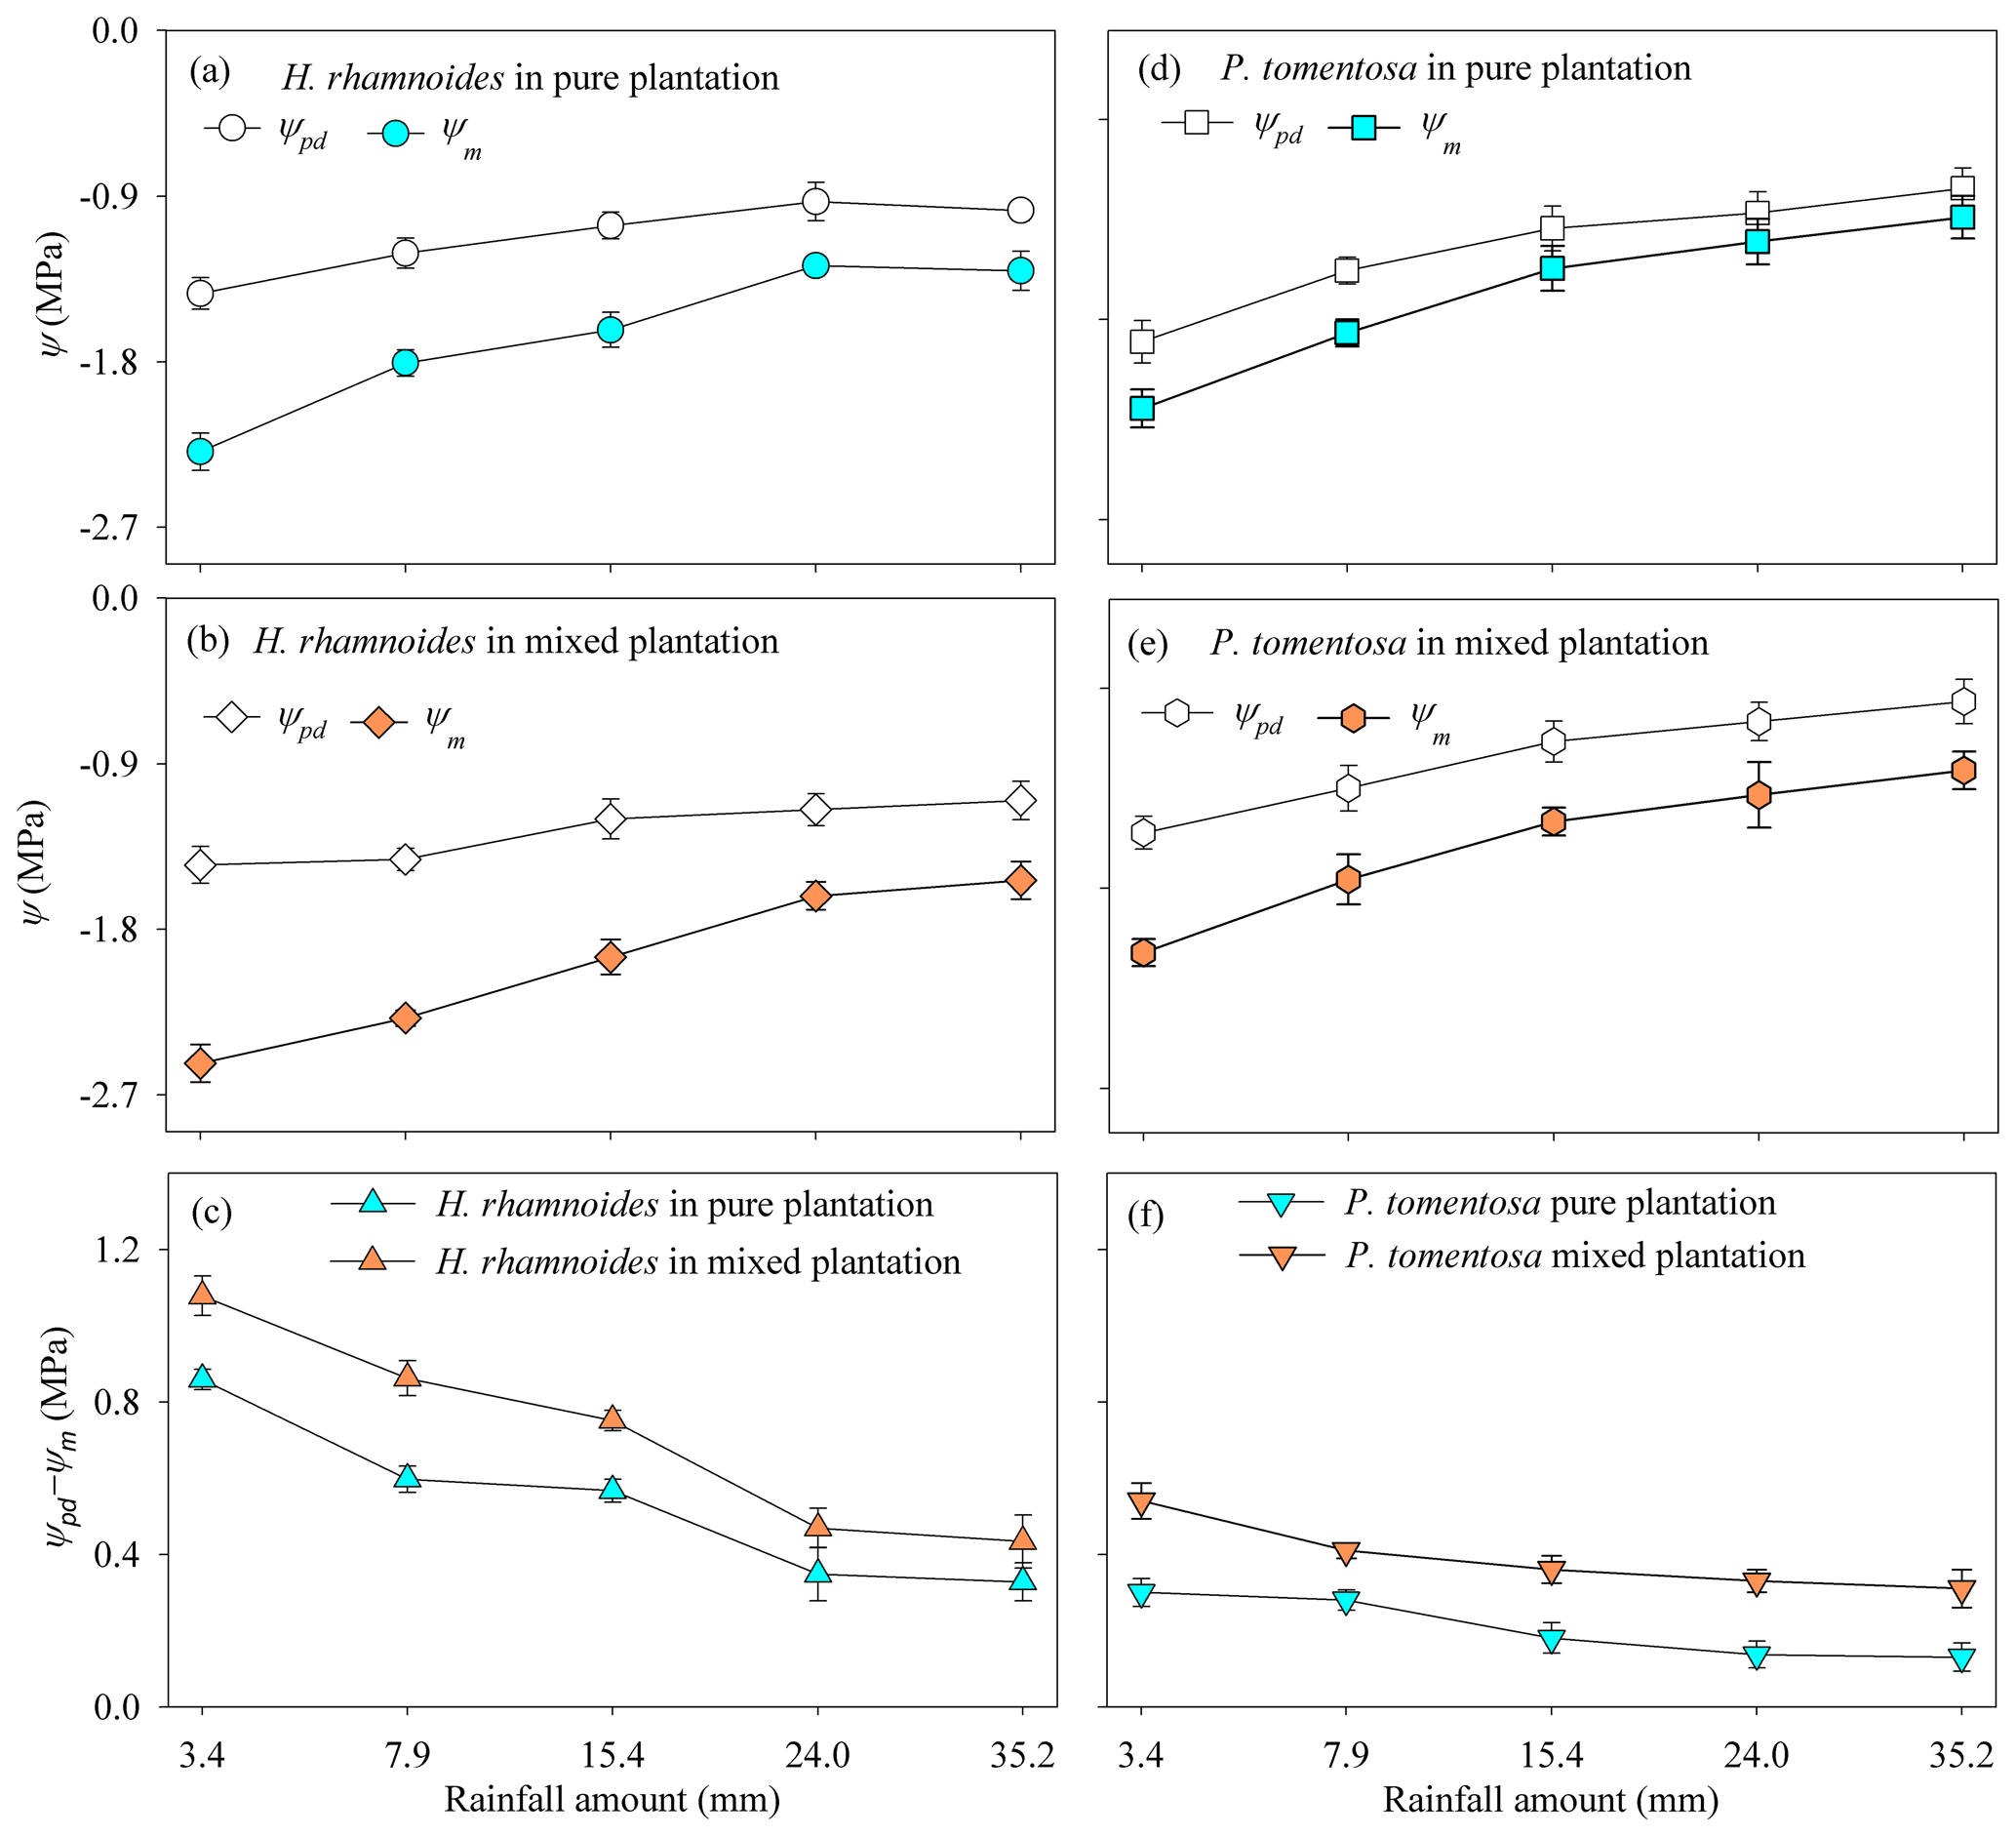
Figure 6Variation in average plant predawn (Ψpd), midday leaf water potential (Ψm), and leaf water potential gradient (Ψpd−Ψm) for (a–c) H. rhamnoides and (d–f) P. tomentosa in both plantation types after five rainfall events (n=3).
3.5 Influences of water sources and Ψpd−Ψm on plant transpiration
The SFR significantly increased with increasing RUP and decreasing Ψpd−Ψm for H. rhamnoides (P<0.01) in both plantation types (Fig. 7). Meanwhile, SFR significantly increased with decreasing Ψpd−Ψm for P. tomentosa in both plantation types (P<0.05). However, a significant relationship between SFR and RUP was observed for P. tomentosa in the mixed plantation (P<0.05) (Fig. 7).
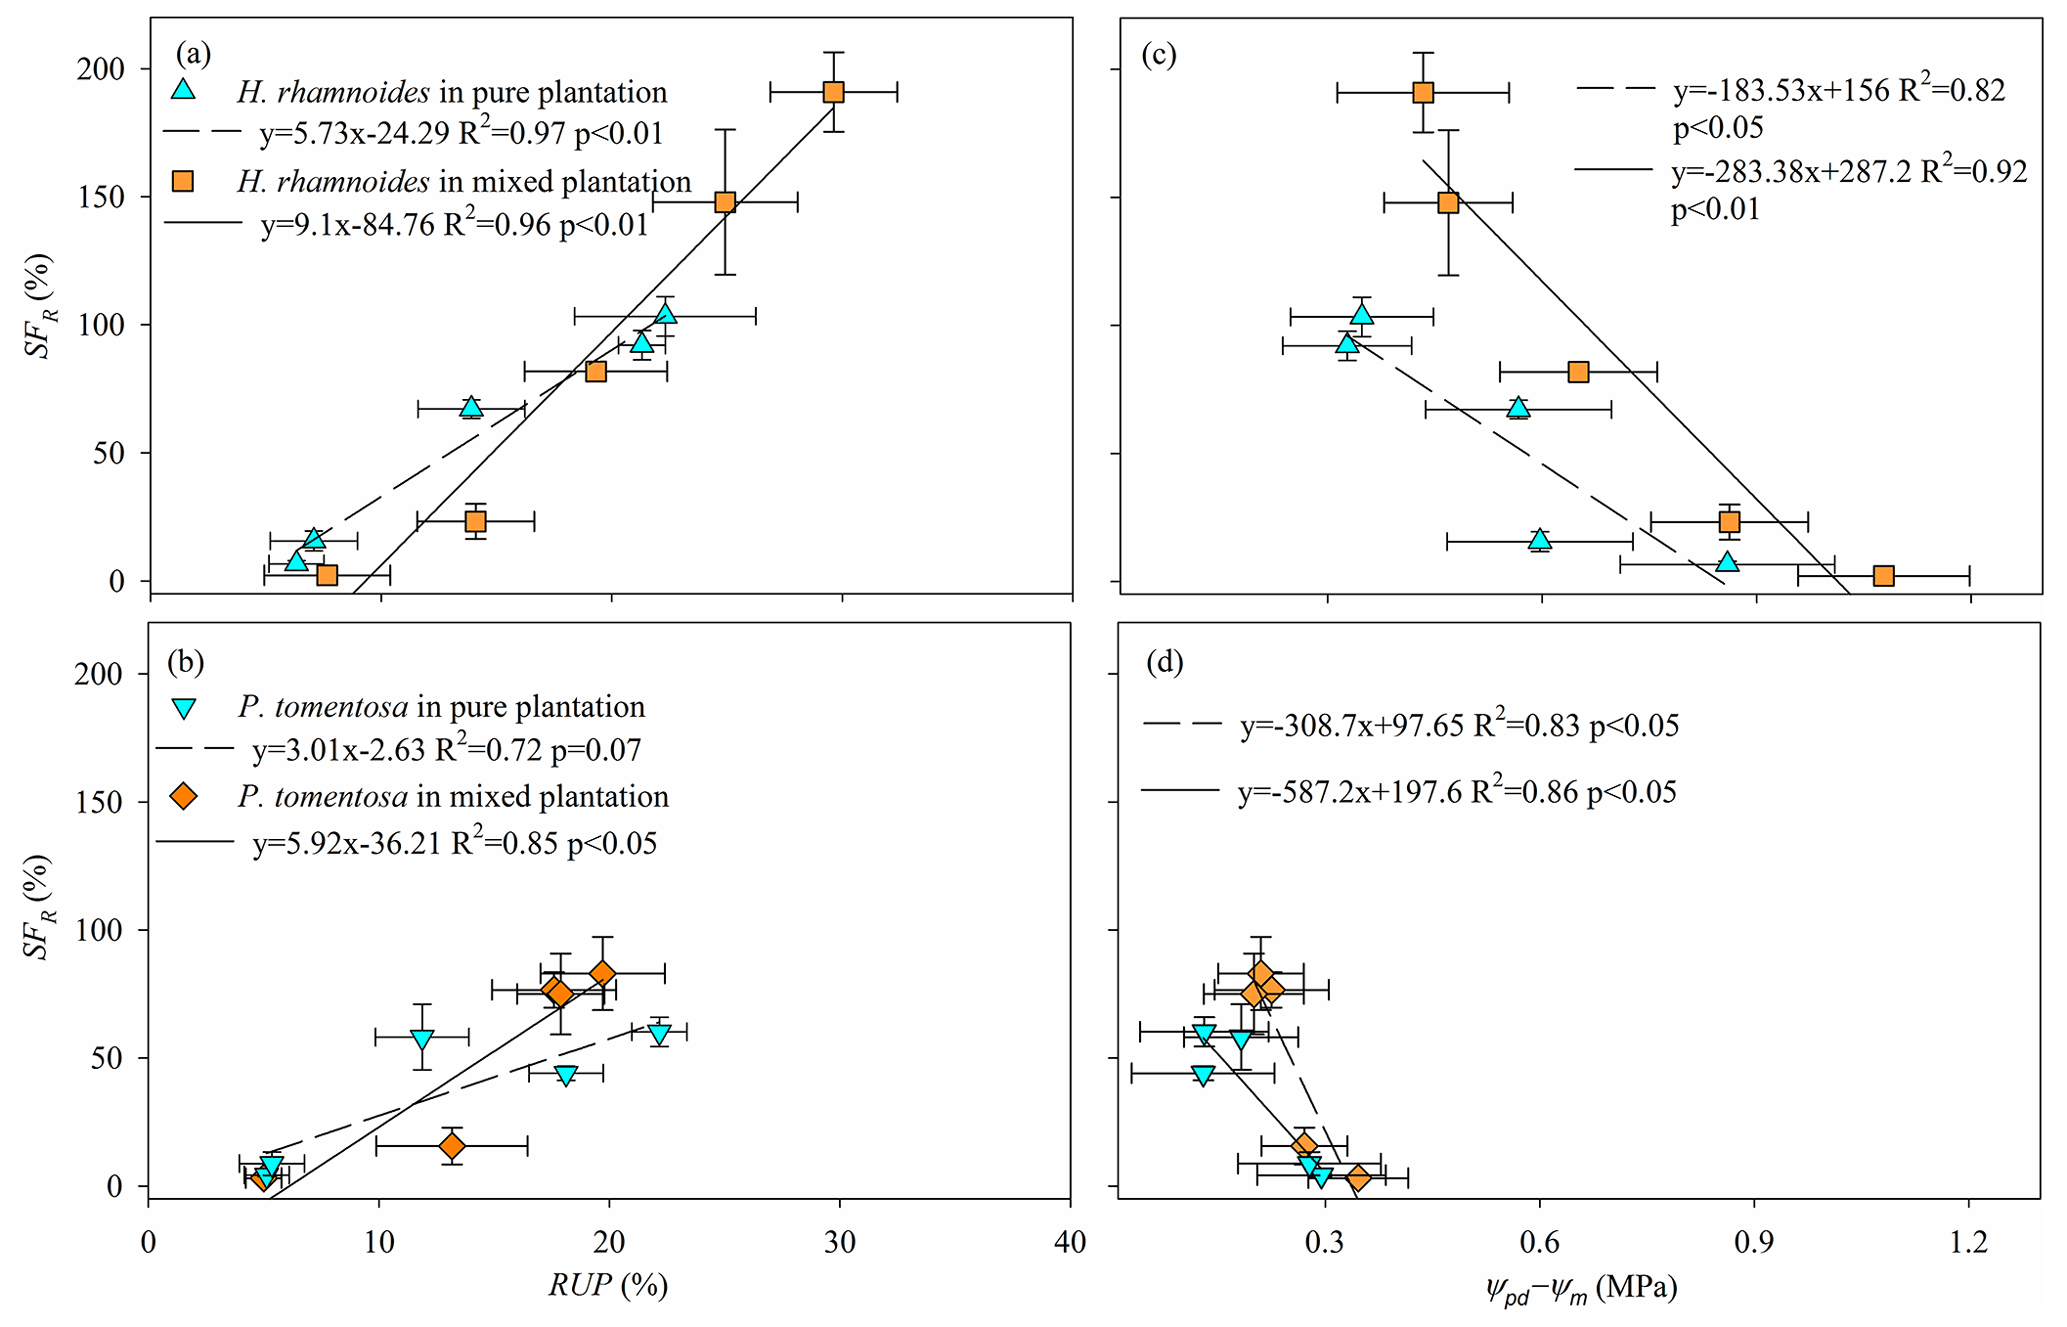
Figure 7Relationships between (a, b) average relative response of normalized Fd (SFR) and rainwater-recharged soil water uptake proportion (RUP) and (c, d) SFR and leaf water potential gradient (Ψpd−Ψm) for H. rhamnoides and P. tomentosa in both plantation types (n=3).
4.1 RRS uptake enhances plant transpiration for H. rhamnoides but not P. tomentosa in pure plantations
Rainwater is the only replenished soil water source in the studied region (Shao et al., 2018) because plants cannot take up groundwater as it is approximately 150 m below the surface (as determined through well observation; unpublished data). Small rainfall events generally only wet the soil surface and may evaporate before plant root uptake (Gebauer and Ehleringer, 2000). However, large rainfall events are most likely to recharge soil water and enhance the metabolic activity of plant fine roots (Hudson et al., 2018), thus enhancing plant water uptake. Furthermore, the δ18O and δD values in small rainfall events are generally higher than those in large rainfall events (Fig. S7). Salamalikis et al. (2016) attribute this phenomenon to the sub-cloud evaporation effect in dry conditions, where rainwater in small rainfall event is more vulnerable to evaporation during its descent process compared to rainwater in a large rainfall event. Similar to Salix psammophila and Caragana korshinskii in the studied region (Zhao et al., 2021), both H. rhamnoides and P. tomentosa take up water from different soil layers under varied soil water conditions following rainfall pulses in pure plantations (Fig. 5). In pure plantations, large water uptake proportions from the deep soil layer after 3.4 mm of rainfall for H. rhamnoides (52.5±8.7 %) and P. tomentosa (64.1±5.1 %) (Fig. 5) suggested that this rainfall amount did not relieve the drought caused by 36 d (DOY 157–192) of no rainfall. The RUP for H. rhamnoides but not that for P. tomentosa significantly increased following an increase in rainfall amount (P<0.05) (Fig. S8), indicating that water uptake was more sensitive to rainfall pulse for H. rhamnoides. This may be mainly due to the greater proportion of fine root surface area distributed in the shallow soil layer for H. rhamnoides (40.9±3.1 %) compared to P. tomentosa (21.9±2.3 %) (Fig. 2).
The RRS uptake does not permit a plant transpiration increase after rainfall pulses, especially in semiarid and arid environments (Grossiord et al., 2017; West et al., 2007), and the influence of the water potential gradient (Ψpd−Ψm) on plant transpiration should also be considered (Hudson et al., 2018; Kumagai and Porporato, 2012). For example, although Juniperus osteosperma, a deep-rooted plant species, could take up RRS after large rainfall events in the west of the United States, the plant transpiration did not increase with increasing rainfall amount (West et al., 2007). The asynchronization between RRS uptake and plant transpiration for J. osteosperma was mainly attributed to the uptake of RRS by plants that were unable to reverse the cavitation in their roots and stems (Grossiord et al., 2017; West et al., 2007). Our previous investigations in the studied region indicated that P. tomentosa is more vulnerable to cavitation than H. rhamnoides, with a water potential at a 50 % loss of conductivity of −1.15 MPa (Zhang et al., 2013) and −1.49 MPa (Dang et al., 2017), respectively, based on stem vulnerability curves. Being less vulnerable to stem cavitation allowed H. rhamnoides to experience a significantly lower Ψm and larger Ψpd−Ψm compared with P. tomentosa in response to soil water conditions after rainfall pulses. Meanwhile, Ψpd−Ψm was significantly higher for H. rhamnoides (0.54±0.26 MPa) compared to P. tomentosa (0.2±0.06 MPa) (P<0.01), indicating that H. rhamnoides and P. tomentosa exhibited anisohydric and isohydric behavior, respectively, based on the definitions of Franks et al. (2007) and Klein (2014). Previous studies demonstrated that isohydric plants generally exhibit more conservative transpiration than anisohydric plants when contending with varied soil water conditions (West et al., 2007; McDowell et al., 2008; Ding et al., 2021). The significantly higher (P<0.001) SFR for H. rhamnoides (56.9±43.9 %) than for P. tomentosa (35.1±26.9 %) indicated that plant transpiration was more sensitive to rainfall pulses for H. rhamnoides than for P. tomentosa. Furthermore, after rainfall events, the SFR for H. rhamnoides, but not that for P. tomentosa, significantly increased following rainfall amount increases (P<0.05) (Fig. S8), which also confirmed the greater sensitivity to rainfall pulses of H. rhamnoides compared with P. tomentosa.
Consistent with the first hypothesis, the influences of RRS uptake and Ψpd−Ψm on SFR differed between these species in pure plantations. The SFR was significantly influenced by RUP and Ψpd−Ψm for H. rhamnoides in the pure plantation, indicating that RRS uptake and leaf physiological adjustment enhanced its plant transpiration (Figs. 7 and 8). However, the SFR was significantly influenced by Ψpd−Ψm for P. tomentosa (Fig. 7), suggesting that its transpiration was mainly constrained by plant physiological characteristics. The ET0 and VPD represent the atmospheric evaporative demand factors and Rn represents the energy factor, and these factors have been observed to influence plant transpiration (Du et al., 2011; Iida et al., 2016; Li et al., 2021). However, in the present study, none of ET0, Rn, and VPD after rainfall significantly influenced SFR for either species in pure plantations; nor did the relative responses of ET0, Rn, and VPD (Table S7). The influence of plant physiological characteristics (i.e., Ψpd−Ψm) on SFR for both species may partially contribute to the lack of effect of atmospheric evaporative demand and energy on plant transpiration in the studied region, although these species exhibited different rainfall pulse sensitivities.
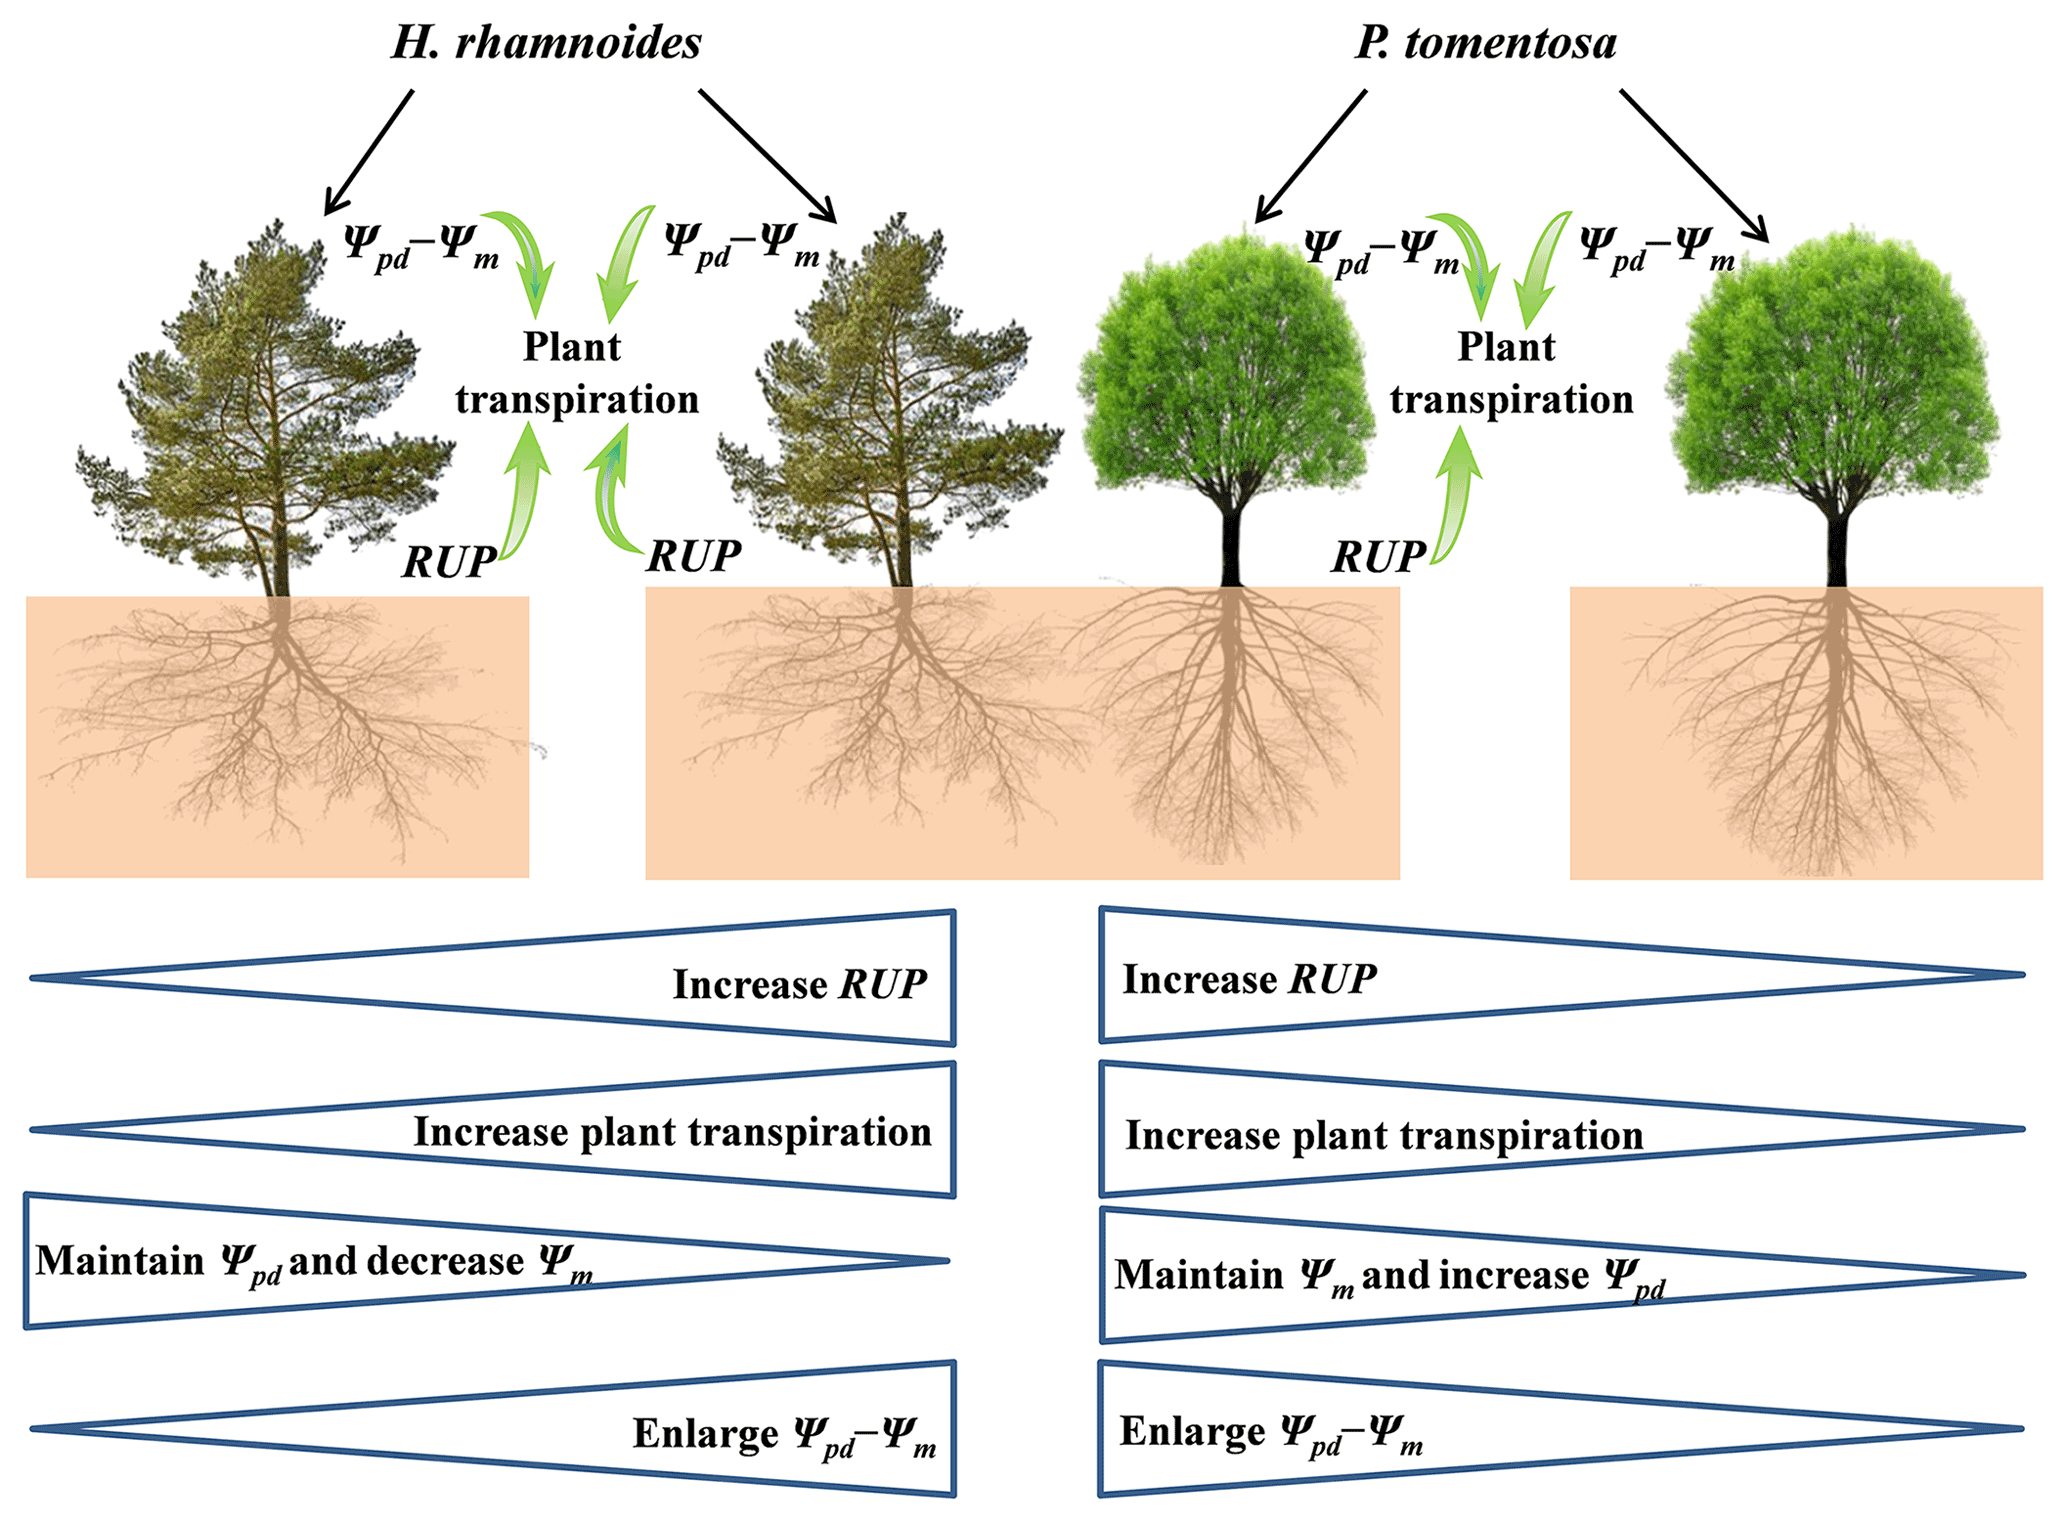
Figure 8Schematic of rainwater-recharged soil water (RRS) uptake, leaf water potential gradient, and plant transpiration for H. rhamnoides and P. tomentosa in both plantation types. Both RRS uptake proportion (RUP) and leaf water potential gradient (Ψpd−Ψm) enhanced plant transpiration after rainfall pulses for H. rhamnoides in pure and mixed plantations and for P. tomentosa in the mixed plantation. However, Ψpd−Ψm significantly influenced plant transpiration after rainfall pulses for P. tomentosa in the pure plantation. Mixed afforestation effects on these parameters for each species are indicated at the bottom half of the schematic, with “increase”, “decrease”, or “enlarge” indicating a significant difference (P<0.05) for a species between pure and mixed plantations. Mixed afforestation significantly enhanced RUP and plant transpiration, decreased Ψm, and enlarged Ψpd−Ψm for H. rhamnoides, and it significantly enhanced RUP and plant transpiration, increased Ψpd, and enlarged Ψpd−Ψm for P. tomentosa.
4.2 RRS uptake enhances plant transpiration for coexisting species in a mixed plantation
Spatial water resource partitioning is considered one of the essential plant strategies to maintain coexistence in mixed plantations, especially in semiarid and arid regions (Munoz-Villers et al., 2020; Silvertown et al., 2015; Yang et al., 2020). However, water source competition has been widely observed among coexisting plant species, according to the literature surveys by Silvertown et al. (2015) and Tang et al. (2018), in either water-sufficient or water-limited regions. In the present study, the nonsignificant differences in xylem δ18O and δD (P>0.05) and plant water sources for the three soil layers (Fig. 5, Table S5) indicated water competition between these species in the mixed plantation, although the RUP was significantly higher for H. rhamnoides (Table S4).
Generally, two types of adaptation can be adopted by plants to cope with resource competition: increased competition ability or minimized competition interactions (West et al., 2007). Consistent with the first adaptation type, mixed afforestation significantly increased the RUP for H. rhamnoides and P. tomentosa (P<0.01) (Table S4). Although mixed afforestation did not significantly alter the Ψpd and Ψm for H. rhamnoides and P. tomentosa, respectively, significantly lower Ψm and higher Ψpd were observed for the corresponding species (P<0.01) (Table S6). Mixed afforestation significant increased Ψpd for P. tomentosa, possibly due to the advantage of access to soil moisture recharged by rainwater through an increased root surface area in the shallow soil layer for this species in the mixed plantation (Fig. 2). Thus, plant physiological (Ψm) and root morphological adjustments were adopted by H. rhamnoides and P. tomentosa in the mixed plantation, respectively, to significantly enlarge Ψpd−Ψm and increase RUP (Fig. 8). Similar to the results in pure plantations, the significant higher Ψpd−Ψm (0.72±0.32 MPa) and SFR (89.2±80.2 %) for H. rhamnoides compared to P. tomentosa (0.39±0.09 MPa and 50.7±38.1 %, respectively) in the mixed plantation (Figs. 3 and 6) suggested that H. rhamnoides and P. tomentosa exhibited anisohydric and isohydric behavior in the mixed plantation, respectively, and the former plant species was more sensitive to rainfall pulses than P. tomentosa. In addition, the changing influences of RUP and Ψpd−Ψm on SFR for the specific species depending on whether they were in pure or mixed plantations are consistent with the second hypothesis. Significant influences of both RUP and Ψpd−Ψm on SFR were observed for P. tomentosa in the mixed rather than in the pure plantations (Fig. 7). Meanwhile, for H. rhamnoides in the mixed plantation, compared to the specific value in the pure plantation, larger and smaller slopes were observed in the linear regressions between SFR and RUP and between SFR and Ψpd−Ψm, respectively (Fig. 7). Furthermore, no significant relationship of SFR with ET0, VPD, or Rn after rainfall, nor of SFR with the relative responses of ET0, VPD, and Rn, was observed for these species in the mixed plantation from DOY 132 to 273 and from DOY 203 to 273 (Table S7). This result also confirmed the influence of physiological or morphological factors on plant transpiration for these species in the mixed plantation in response to rainfall pulses.
Additionally, consistent with other studies in the Loess Plateau (J. Wang et al., 2020; Wu et al., 2021), the deep soil layer generally exhibited lower SW than other soil layers in all plantation types in the present study (Fig. 1, Table S3). Jia et al. (2017) and J. Wang et al. (2020) attributed the lower SW in deep soil layers to the imbalance between rainwater replenishment and plant uptake of water from this soil layer in the studied region. Silvertown et al. (2015) and Tang et al. (2019) suggested that coexisting plant species generally reduce water uptake from soil layers that exhibit low soil water content to avoid water source competition in these layers and maintain a stable coexistence. In the present study, consistent with the second adaptation type, mixed afforestation significantly decreased the water uptake proportion from the deep soil layer for these species (Table S5). Thus, both increased rainwater-recharged soil water uptake and decreased water source competition from the deep soil layer were adopted by these species in the mixed plantation to minimize competition for water sources under water-limited conditions.
4.3 Implications for plantation species selection based on RRS uptake and plant transpiration
The RRS uptake and plant transpiration in response to rainfall pulses may influence plant physiological processes and the water cycle (Meier et al., 2018; Zhao et al., 2021). In pure plantations, H. rhamnoides rather than P. tomentosa showed an advantage in RRS uptake due to the large Ψpd−Ψm and high fine-root surface area proportions distributed in the shallow soil layer for the former species. The excessive water uptake from the deep soil may desiccate deep soil (Wu et al., 2021), weakening plant resilience to drought stress and thus plant community sustainability in the Loess Plateau region (Song et al., 2018; Zhao et al., 2021). West et al. (2012) and Wu et al. (2021) suggested that increased RRS uptake can reduce plant water uptake from deep soil layers and is essential for plantation adaptation in water-limited regions. In the present study, physiological (e.g., Ψm) and morphological (fine root distribution) adjustments by H. rhamnoides and P. tomentosa, respectively, to enlarge Ψpd−Ψm and enhance the RUP and plant transpiration were observed in the mixed plantation (Figs. 2 and 8). Meanwhile, the significantly increased RUP and decreased deep soil water uptake proportion for both species in the mixed plantation may relieve the deep soil water deficit and strengthen plantation sustainability (Tables S4 and S5). Furthermore, mixed afforestation also increased the total biomass of H. rhamnoides and P. tomentosa calculated through the allometric equation indicated in Zhou et al. (2018) and Tang et al. (2019) (Table S8). Thus, in the studied region, rainfall-pulse-sensitive species should be considered more often for use in pure plantations, and plant species that can physiologically or morphologically adjust to enhance rainwater-recharged soil water uptake and reduce excessive water uptake from deep soil layers should be considered more often for use in mixed plantations.
The influences of water sources and Ψpd−Ψm on plant transpiration in response to rainfall pulses were determined for H. rhamnoides and P. tomentosa in the semiarid Loess Plateau region. In pure and mixed plantations, the large Ψpd−Ψm was consistent with high SFR for H. rhamnoides, suggesting that this species exhibited anisohydric behavior and sensitivity to rainfall pulses. Meanwhile, the small Ψpd−Ψm was consistent with low SFR for P. tomentosa in both plantation types, indicating that this species exhibited isohydric behavior and less sensitivity to rainfall pulses. In addition, significantly lower plant Ψm and increased fine root surface area were adopted by H. rhamnoides and P. tomentosa, respectively, in the mixed plantation to enlarge Ψpd−Ψm, enhance RRS uptake, and decrease water source competition from the deep soil layer. The SFR was significantly influenced by RUP and Ψpd−Ψm for H. rhamnoides in both plantation types; however, the SFR for P. tomentosa was significantly influenced by Ψpd−Ψm in the pure plantation and by RUP and Ψpd−Ψm in the mixed plantation. This study indicates that, through plant physiological or morphological adjustment, RRS uptake can enhance plant transpiration in a mixed plantation regardless of species sensitivity to rainfall pulses in water-limited regions.
The HYDRUS-1D model is based on the Richards equation (Richards, 1931) to describe soil water dynamics (Šimůnek et al., 2008, 2013):
where θ, t, h, and z are the soil moisture content (SW, cm3 cm−3), simulation time (day), pressure head (cm), and vertical coordinate (cm), respectively. K(h,z) and Sr(z,t) are the unsaturated hydraulic conductivity (cm d−1) (Mualem, 1976; van Genuchten, 1980) and root water uptake (cm3 cm−3 d−1), respectively.
This model has been widely used with HYDRUS-1D software (Šimůnek et al., 2013) to simulate soil water hydrological processes such as soil water content dynamics and runoff in the Loess Plateau (Yi and Fan, 2016; Bai et al., 2020; S. F. Wang et al., 2020). his software (version 4.15) was used to calculate the runoff for each plantation type in this study after calibrating and validating this model using the observed SW. Based on suggestions in Yi and Fan (2016) and Bai et al. (2020), the atmospheric boundary condition with surface runoff and free drainage were selected as the upper and lower boundary conditions, respectively, to calibrate and validate this model and calculate runoff (Fig. A1).
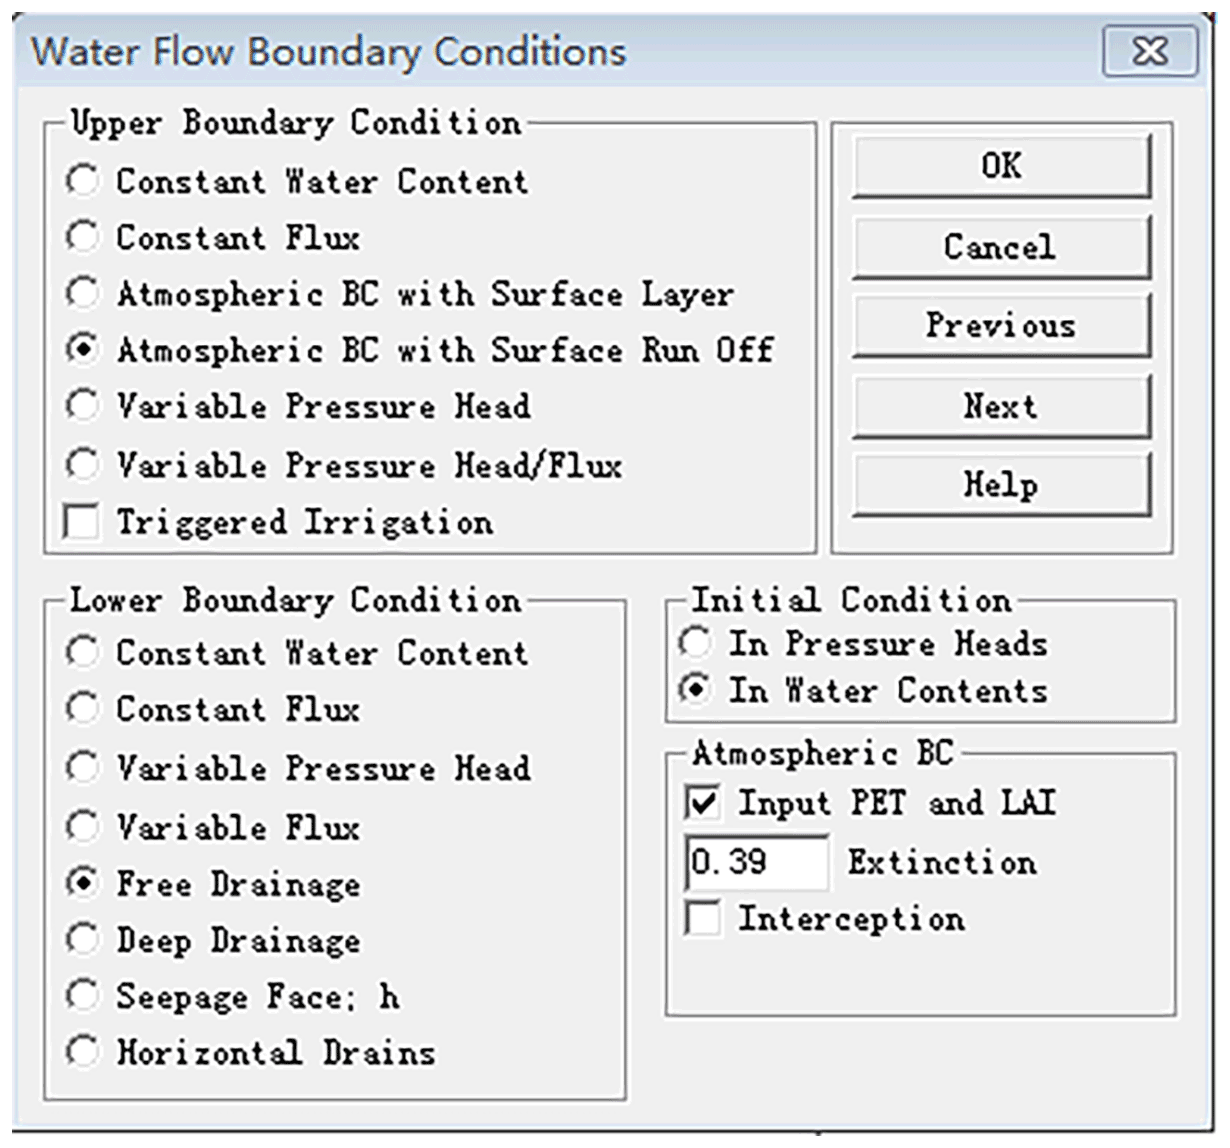
Figure A1Upper and lower boundary condition selection in HYDRUS-1D software (version 4.15).
A1 Data sources
The observed meteorological, plant, and soil hydraulic parameters were the basic inputs for this model.
A1.1 Meteorological parameters
The meteorological parameters required for HYDRUS-1D include relative humidity, wind speed (WS), air temperature, rainfall amount, and reference evapotranspiration (ET0). Daily relative humidity, maximum, minimum, and average air temperatures, WS, and rainfall amount were measured by a weather station approximately 500 m from the research plots. The ET0 (cm d−1) was calculated through a method described by Allen et al. (1998). The detailed information can be observed in Sect. 2.2.
A1.2 Plant parameters
The plant parameters required for HYDRUS-1D include plant height, root depth, and potential transpiration rate. Plant height and root depth in each plantation type can be observed in Table S1 and Figure S4, respectively. The leaf area index (LAI) was measured monthly from May to September for each plantation type using an LAI-2200 (LiCor Inc., Lincoln, USA). The potential transpiration rate (cm d−1) was calculated using the Beer equation (Ritchie, 1972) based on the measured LAI and extinction coefficient value (0.39) suggested in Šimůnek et al. (2013).
Table A1Measured soil hydraulic parameters and particle compositions in both pure and mixed plantations.
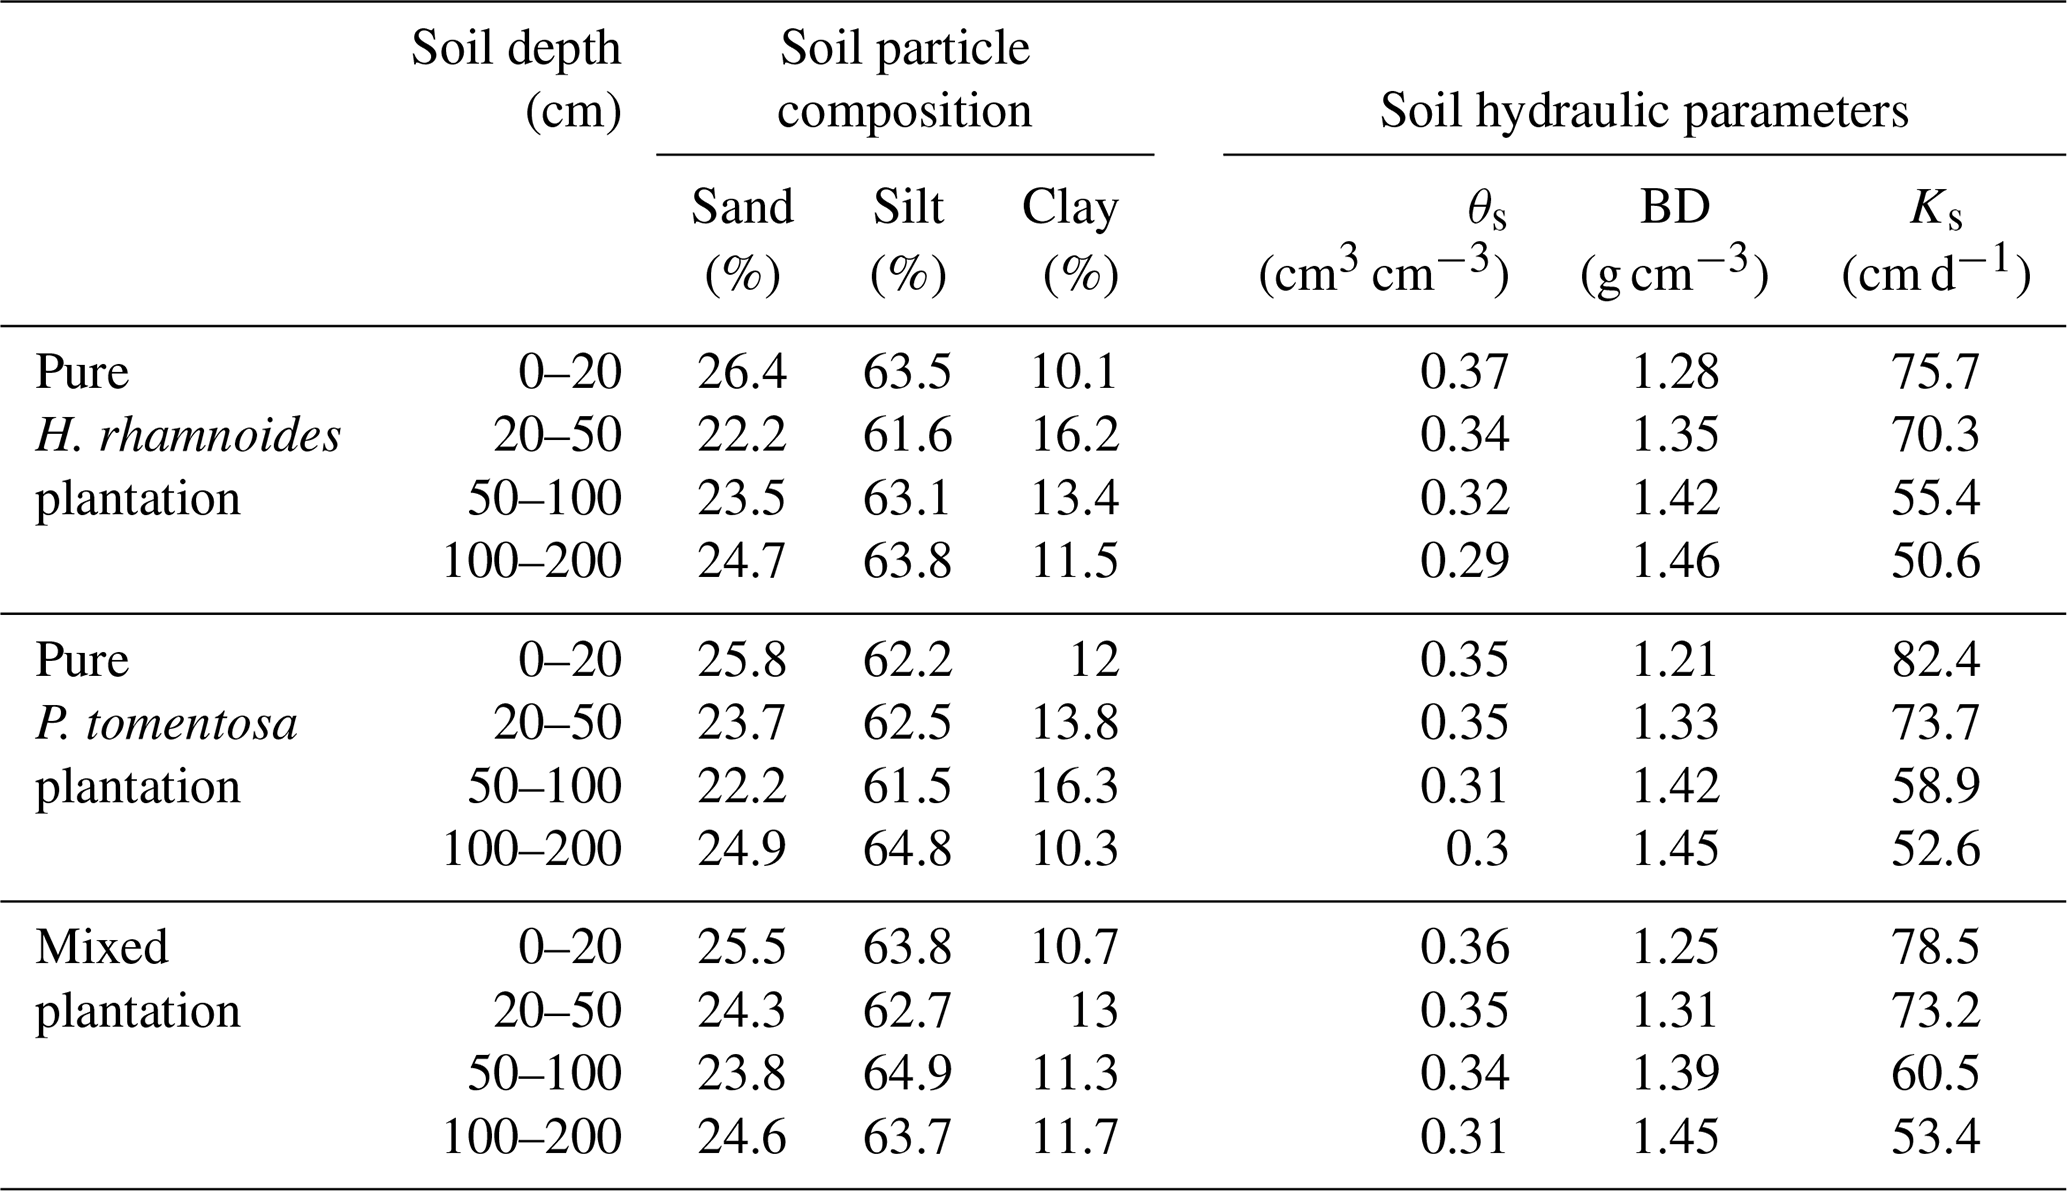
θs is the saturated soil water content, Ks is the saturated hydraulic conductivity, and BD is the soil bulk density.
Table A2Optimized soil hydraulic parameters in both pure and mixed plantations obtained through HYDRUS-1D.
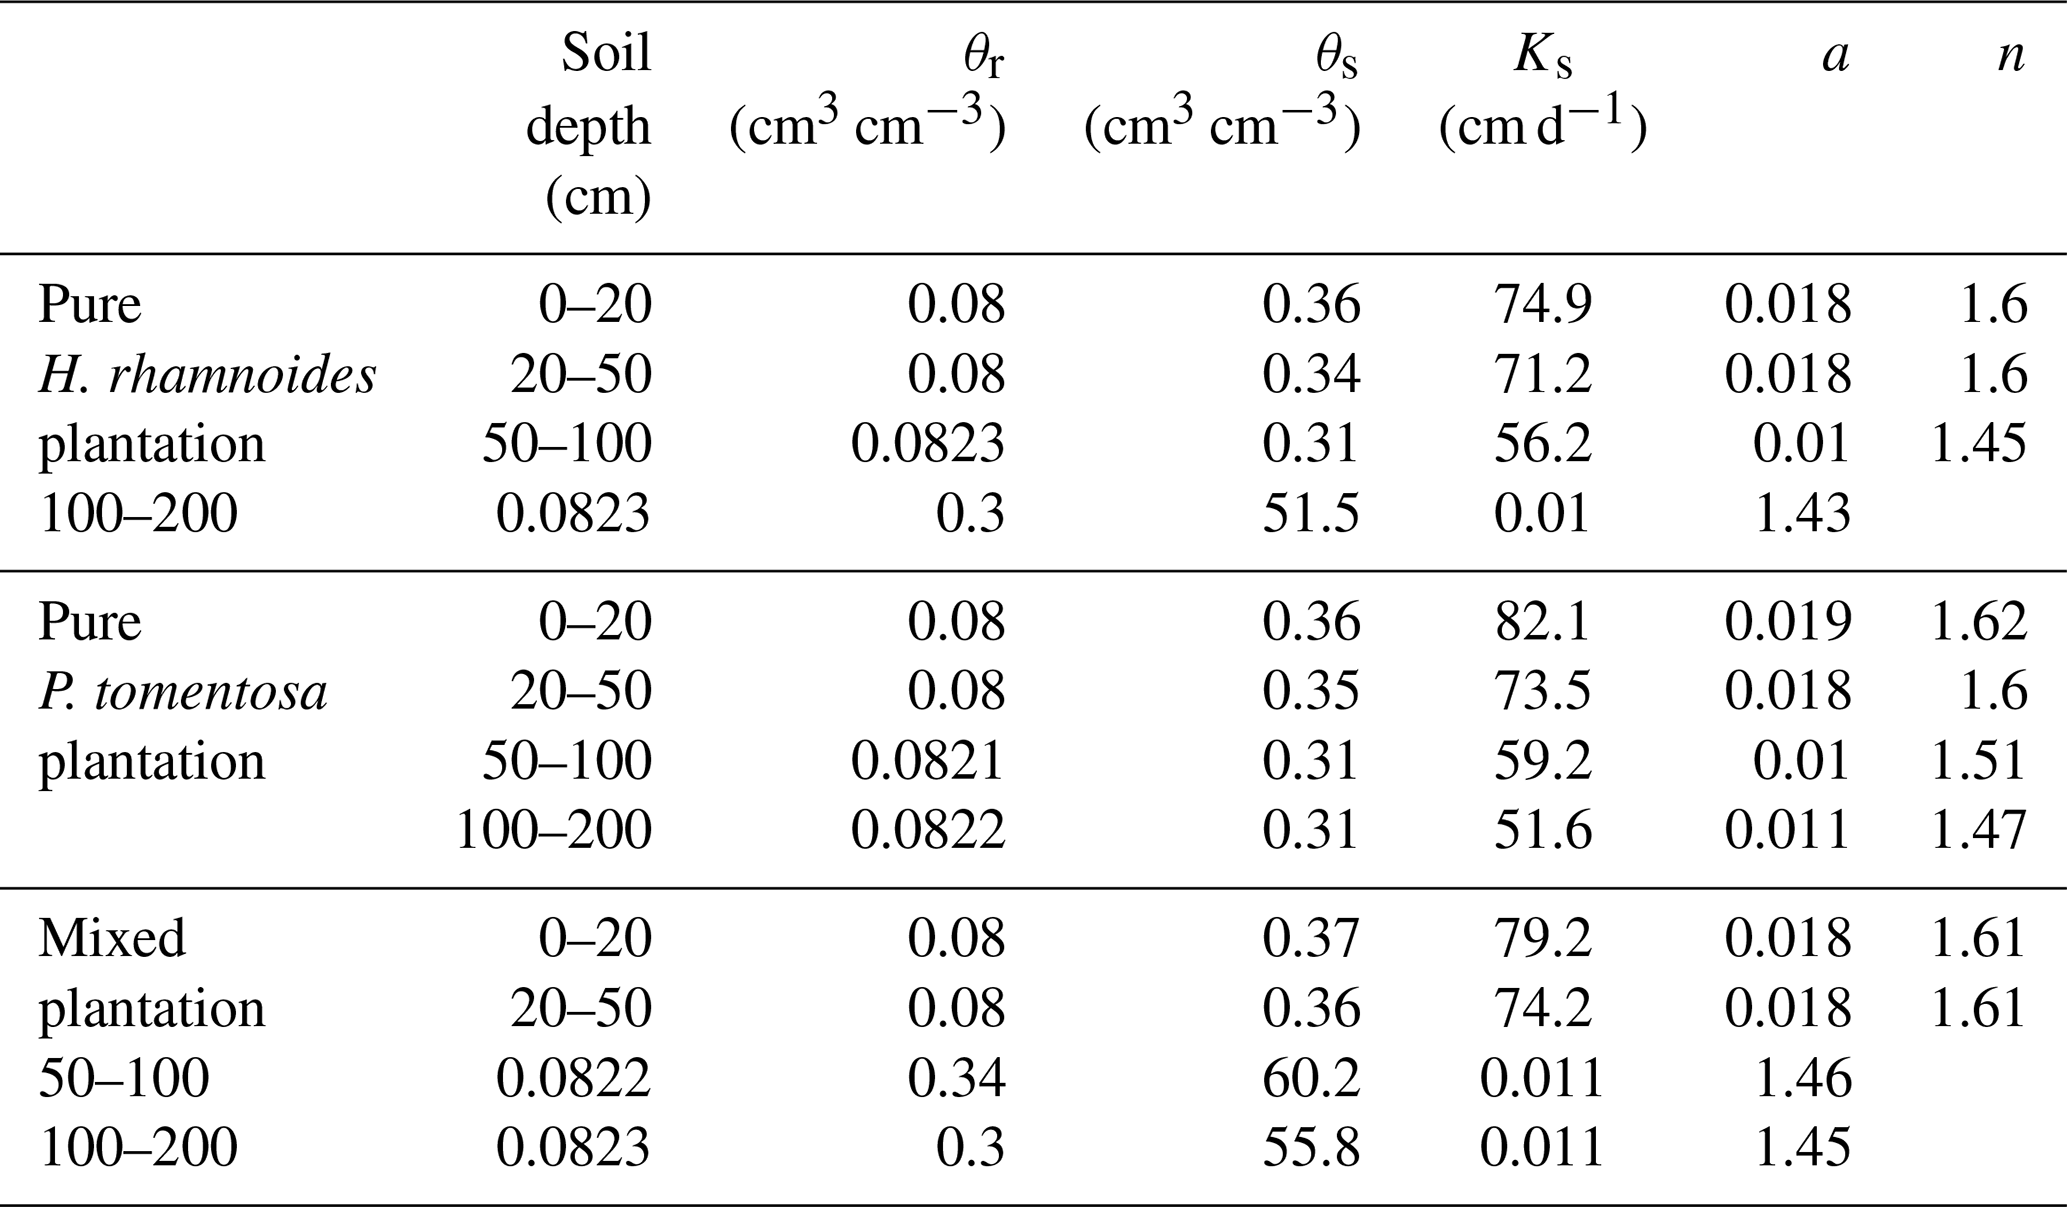
θr is the residual soil water content, Ks is the saturated hydraulic conductivity, θs is the saturated soil water content, and a and n are parameters of the van Genuchten model.
A1.3 Soil hydraulic parameters
The saturated soil water content (θs) and hydraulic conductivity (Ks), the van Genuchten model parameters (α and n), and the residual soil water content (θr) were required parameters for HYDRUS-1D. The Ks, θs, and soil bulk density (BD) at soil depth intervals of 0–20, 20–50, 50–100, and 100–200 cm were measured in July 2018 using the cutting ring (Wu et al., 2016) and constant water head (Reynolds et al., 2002) method in each plantation type. The soil particle composition was determined using a Mastersize 2000 (Malvern Instruments Ltd., UK). Additionally, the slopes for these three plantation types were required for HYDRUS-1D. The detailed information can be observed in Sect. 2.1. The measured soil hydraulic parameters for the three plantation types are shown in Table A1. The Rosetta pedotransfer function was used to calculate θr, α, and n (Jana and Mohanty, 2012; Bai et al., 2020).
A2 Model calibration and validation and runoff calculation
In each plantation type, SW was measured 5, 20, 50, 100, 150, and 200 cm belowground (SW5 cm, SW20 cm, SW50 cm, SW100 cm, SW150 cm, and SW200 cm) by CS615 probes (Campbell Scientific Inc.). The detailed information can be observed in Sect. 2.1. The SW at each soil depth in each plantation type from DOY 132 to 202 was used to calibrate HYDRUS-1D. Ks, θs, θr, a, and n were optimized using the inverse solution module in HYDRUS-1D (Table A2).
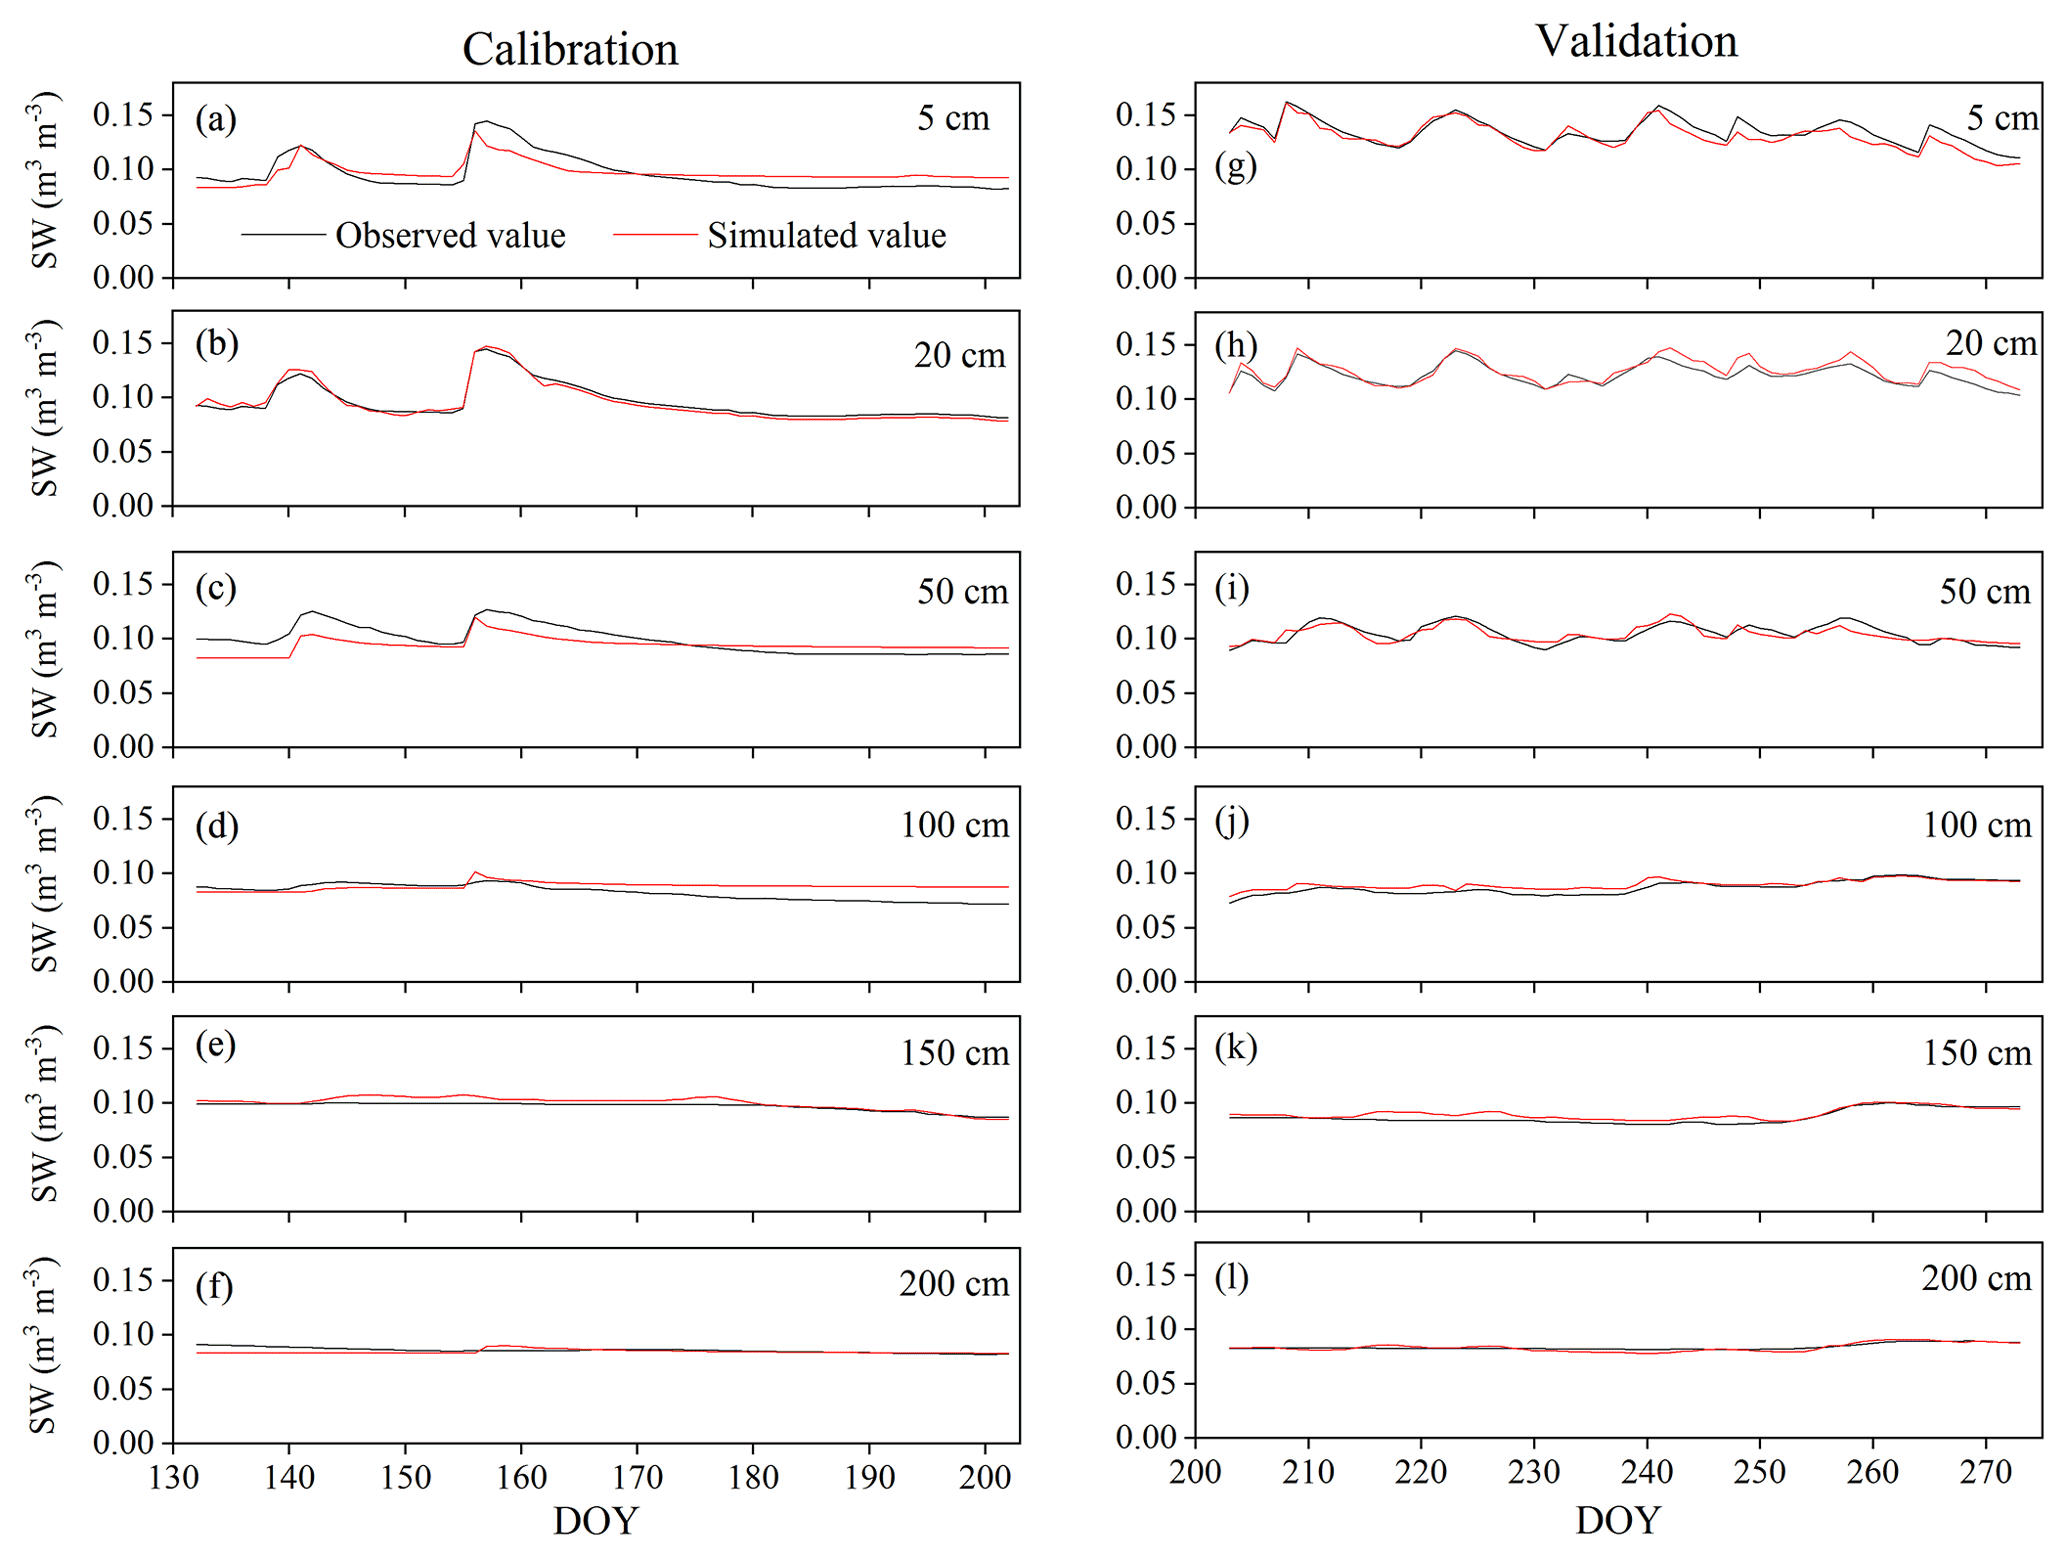
Figure A2Variation in soil water content (SW) at 5, 50, 50, 100, 150, and 200 cm depths during the HYDRUS-1D (a–f) calibration (from DOY 132–202) and (g–l) validation (from DOY 203–273) periods in the pure H. rhamnoides plantation.
Subsequently, the SW values from DOY 203 to 273 in each plantation type were used to validate the model. The root mean square error (RMSE), Nash–Sutcliffe efficiency coefficient (NSE), and determinant coefficient (R2) based on the observed and simulated SW were used to evaluate the model performance (Bai et al., 2020):
where SWo and SWs are the observed and simulated SW at time i at each soil depth, respectively. N is the observation number. SWoave is the average observed SW. A low RMSE and (or) NSE and R2 values that were close to 1 indicated a high accuracy of SW simulation.
The simulated SWs at different soil depths closely matched the variation of these values observed from DOY 203 to 273. Examples from the pure H. rhamnoides plantation can be observed in Figs. A2 and A3. The RMSE ranged from 0.005–0.008, 0.006–0.009, and 0.006–0.01 in the pure H. rhamnoides, pure P. tomentosa, and mixed plantations, respectively (Table A3). The NSE ranged from 0.52–0.7, 0.57–0.67, and 0.54–0.76 in the pure H. rhamnoides, pure P. tomentosa, and mixed plantations, respectively, and the corresponding R2 ranged from 0.71–0.84, 0.76–0.83, and 0.76–0.82. The calculated RMSE, NSE, and R2 indicated that the simulated results were acceptable for three plantation types in this study (Table A3), based on the criteria suggested in Bai et al. (2020) and S. F. Wang et al. (2020). The RMSE ranged from 0.022–0.036 and the NSE ranged from −0.54 to 0.71 in Bai et al. (2020) and the RMSE ranged from 0.005–0.032 and the R2 ranged from 0.8–0.92 in S. F. Wang et al. (2020) when comparing the observed and simulated SW for this model.
Finally, for each plantation type, runoff was calculated based on HYDRUS-1D (Šimůnek et al., 2013). The results from the model indicated that no runoff was generated during the studied period from DOY 132 to 273 in the pure H. rhamnoides plantation, the pure P. tomentosa plantation, and the mixed plantation. Thus, we expect that no runoff would be generated during the selected rainfall events.
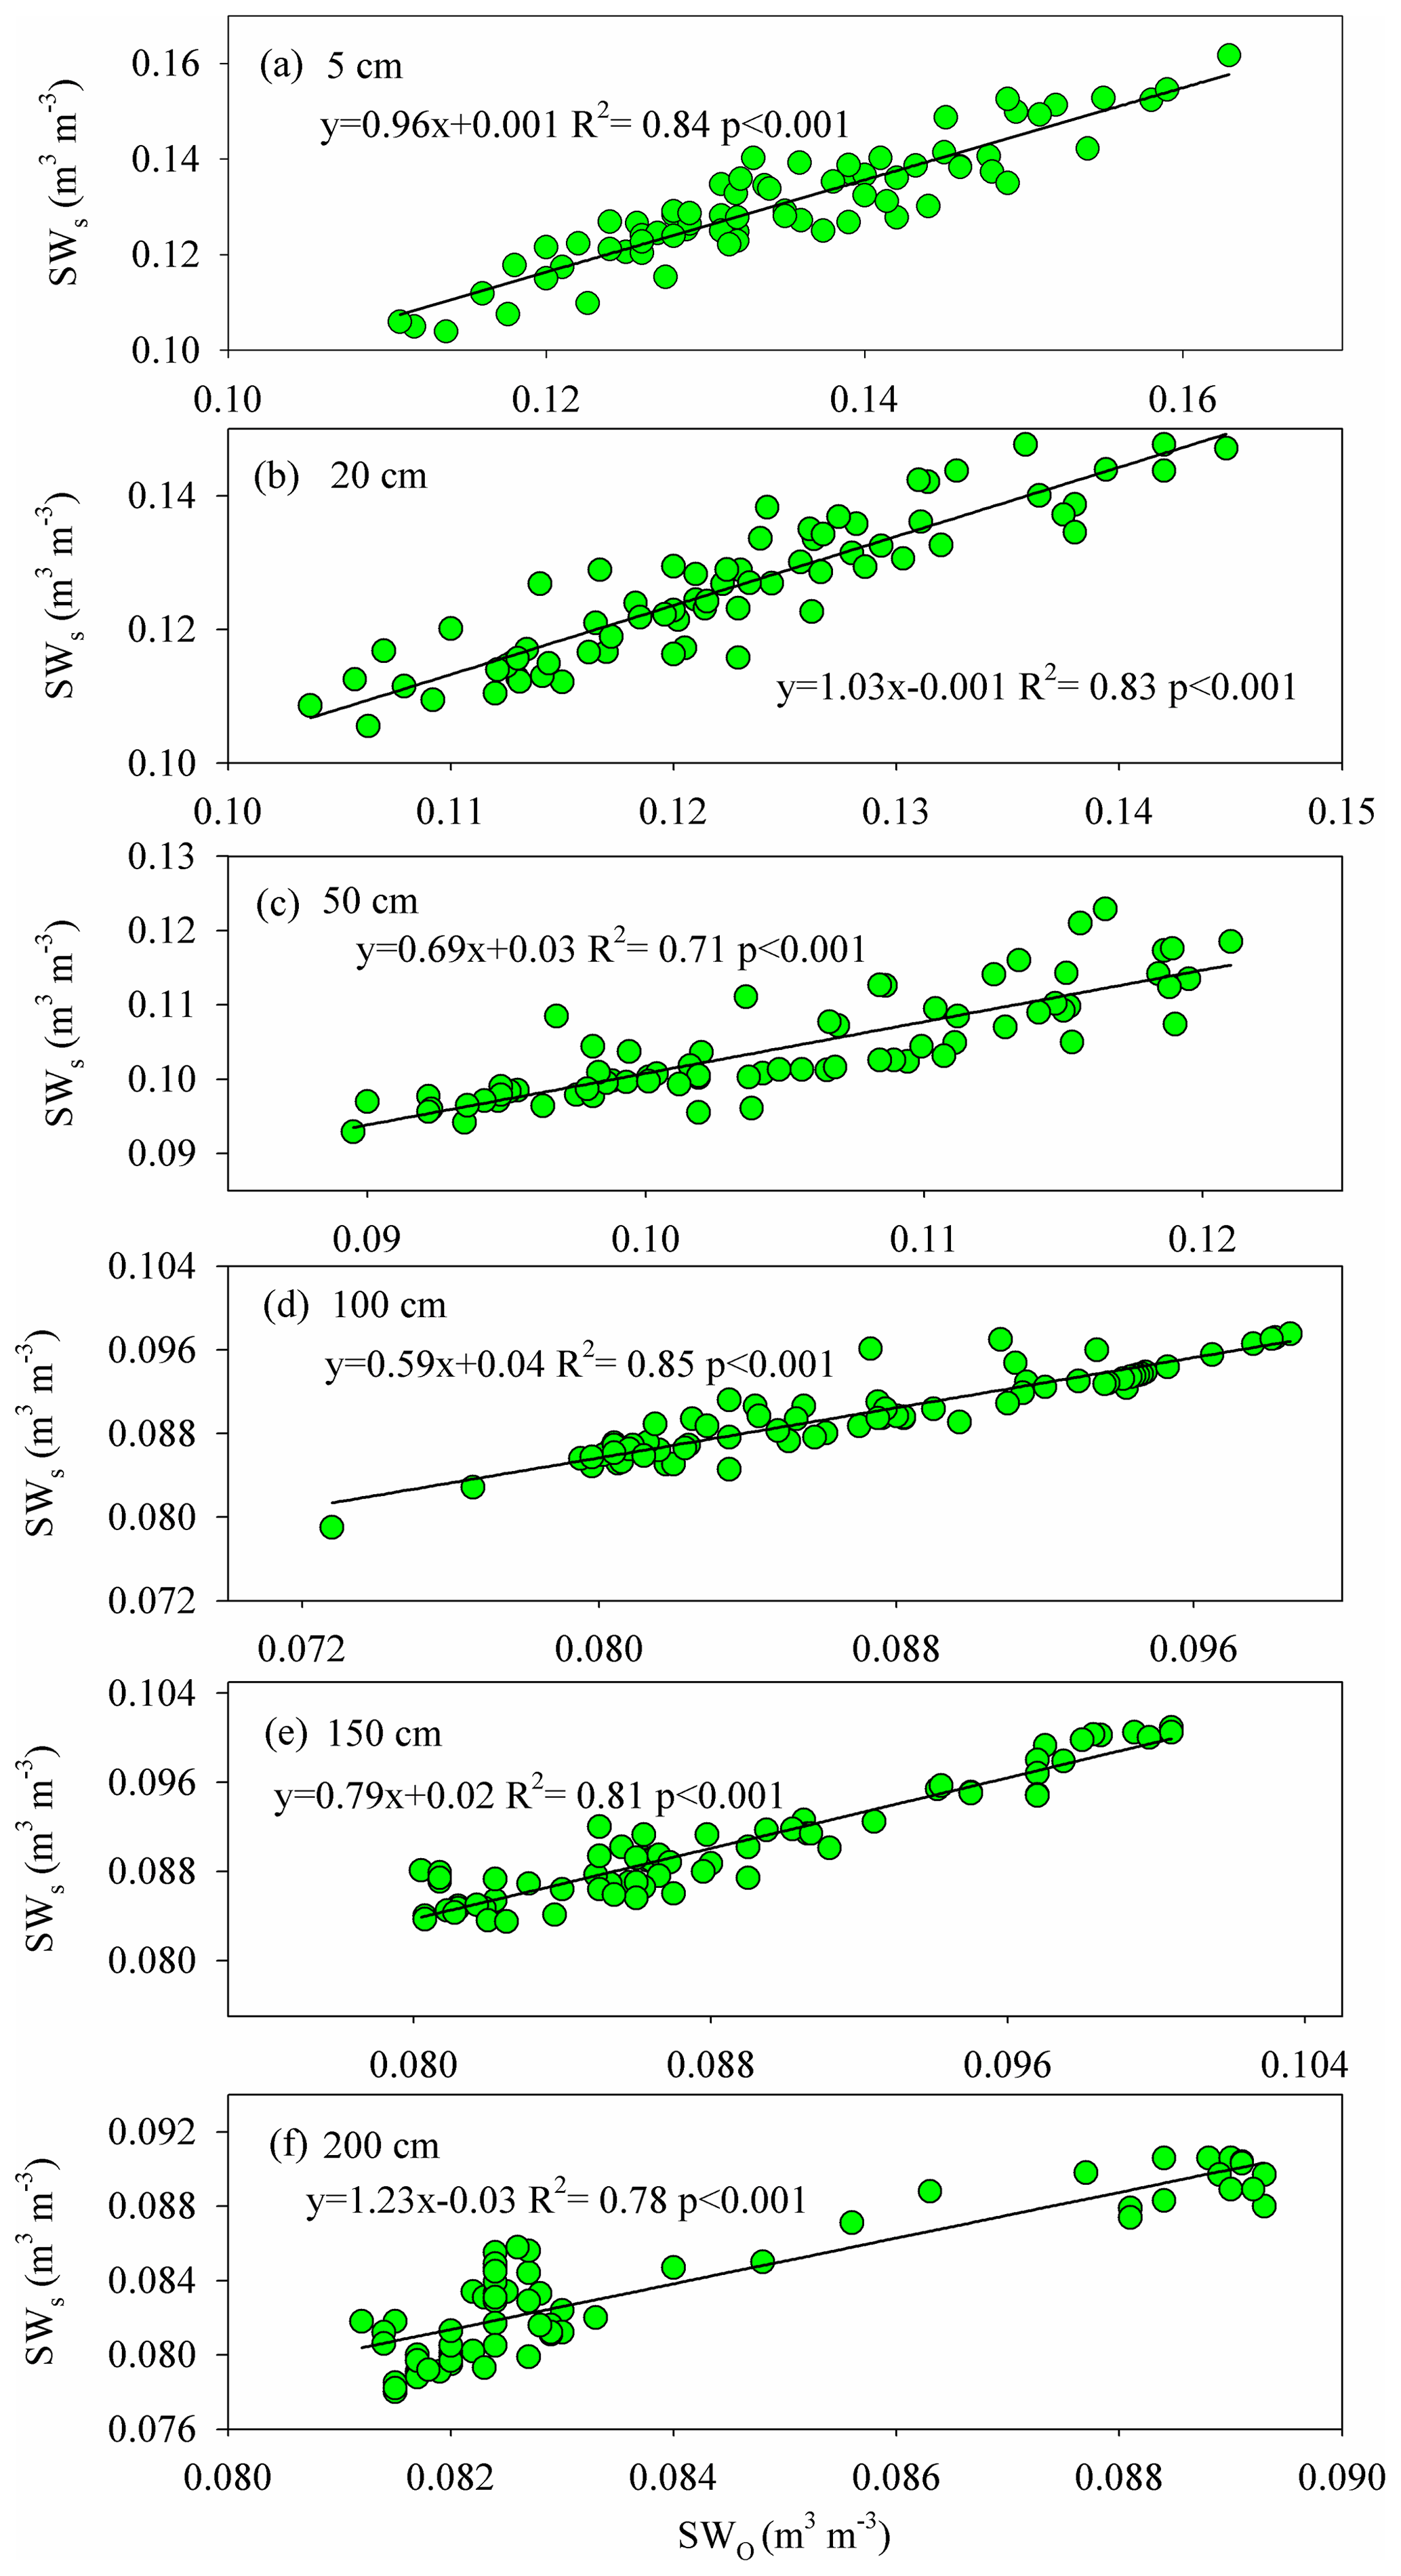
Figure A3The relationship between the observed (SWO) and simulated (SWs) soil water contents at 5, 50, 50, 100, 150, and 200 cm depths during the HYDRUS-1D validation period (from DOY 203–273) in the pure H. rhamnoides plantation.
Table A3The RMSE, NSE, and R2 between the observed and simulated SW during the HYDRUS-1D validation period (from DOY 203–273).
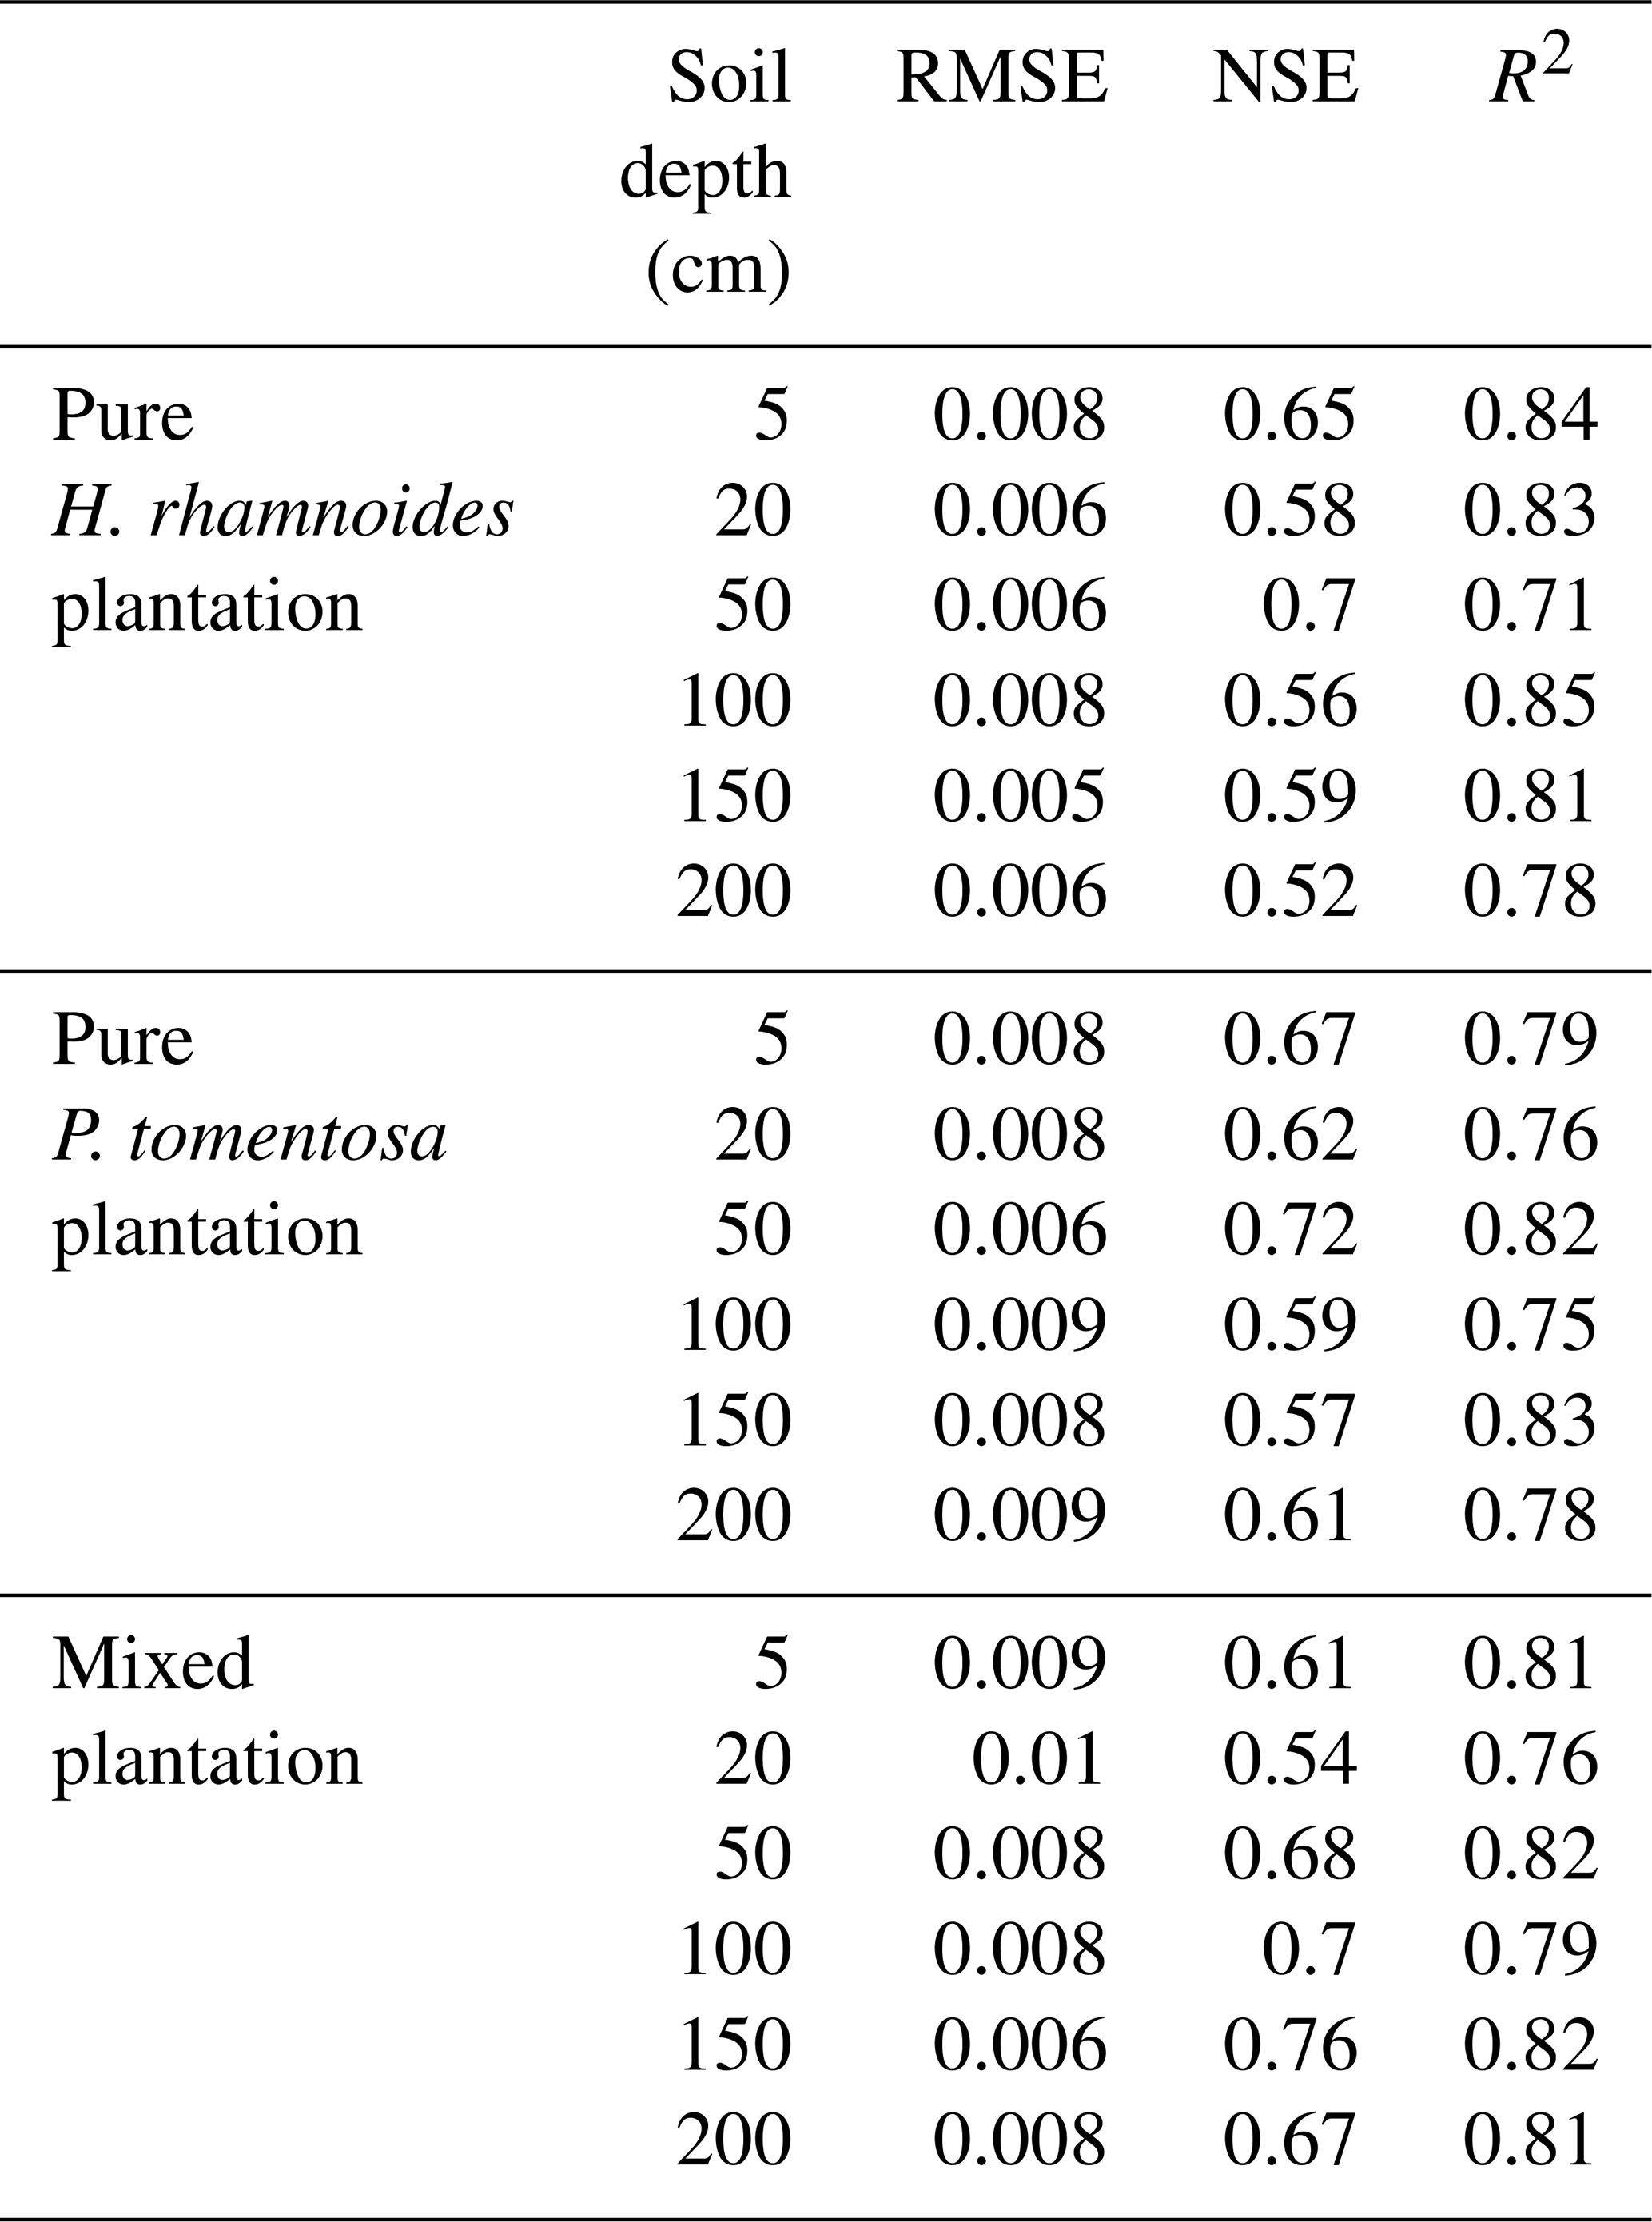
RMSE is the root mean square error, NSE is the Nash–Sutcliffe efficiency coefficient, and R2 is the determinant coefficient.
The SPSS (version 18) software can be publicly accessible at https://www.ibm.com/uk-en/products/spss-statistics (IBM, 2022). The HYDRUS-1D (version 4.15) software can be publicly accessible at https://www.pc-progress.com/en/Default.aspx?hydrus-1d (PC-PROGRESS, 2022).
The data that support the findings of this study are available from the corresponding author upon request.
The supplement related to this article is available online at: https://doi.org/10.5194/hess-26-4995-2022-supplement.
YT designed the study, performed the statistical analyses and wrote the original manuscript draft. LW and YY performed the experiments and collected the data. DL collected the data.
The contact author has declared that none of the authors has any competing interests.
Publisher's note: Copernicus Publications remains neutral with regard to jurisdictional claims in published maps and institutional affiliations.
This work was supported by the National Natural Science Foundation of China (41977425) and the National Key Research and Development Program of China (2017YFA0604801). We acknowledge the insightful suggestions of the editor and reviewers.
This research has been supported by the National Natural Science Foundation of China (grant no. 41977425) and the National Key Research and Development Program of China (grant no. 2017YFA0604801).
This paper was edited by Loes van Schaik and reviewed by three anonymous referees.
Allen, R. G., Periera, L. S., Raes, D., and Smith, M.: Crop evapotranspiration: Guidelines for Computing Crop Requirements, Irrigation and Drainage paper No. 56, FAO, Rome, Italy, 17–28, https://www.fao.org/3/X0490E/x0490e00.htm (last access: 9 October 2022), 1998.
Bai, X., Jia, X. X., Jia, Y. H., Shao, M. A., and Hu, W.: Modeling long-term soil water dynamics in response to land-use change in a semi-arid area, J. Hydrol., 585, 124824, https://doi.org/10.1016/j.jhydrol.2020.124824, 2020.
Berkelhammer, M., Still, C., Ritter, F., Winnick, M., Anderson, L., Carroll, R., Carbone, M., and Williams, K. H.: Persistence and Plasticity in Conifer Water-Use Strategies, J. Geophys. Res.-Biogeo., 125, e2018JG004845, https://doi.org/10.1029/2018JG004845, 2020.
Chen, Y. J., Cao, K. F., Schnitzer, S. A., Fan, Z. X., Zhang, J. L., and Bongers, F.: Water-use advantage for lianas over trees in tropical seasonal forests, New Phytol., 205, 128–136, https://doi.org/10.1111/nph.13036, 2015.
Cheng, X. L., An, S. Q., Li, B., Chen, J. Q., Lin, G. H., Liu, Y. H., Luo, Y. Q., and Liu, S. R.: Summer rain pulse size and rainwater uptake by three dominant desert plants in a desertified grassland ecosystem in northwestern China, Plant Ecol., 184, 1–12, 2006.
Dang, E., Jiang, Z. M., Li, R., Zhang, S. X., and Cai, J.: Relationship between hydraulic traits and refilling of embolism in the xylem of one-year-old twigs of six tree species, Scientia Silvae Sinicae, 53, 49–59, https://doi.org/10.11707/j.1001-7488.20170306, 2017.
Ding, Y. L., Nie, Y. P., Chen, H. S., Wang, K. L., and Querejeta, J. I.: Water uptake depth is coordinated with leaf water potential, water-use efficiency and drought vulnerability in karst vegetation, New Phytol., 229, 1339–1353, 2021.
Du, S., Wang, Y. L., Kume, T., Zhang, J. G., Otsuki, K., Yamanaka, N., and Liu, G. B.: Sapflow characteristics and climatic responses in three forest species in the semiarid Loess Plateau region of China, Agr. Forest Meteorol., 151, 1–10, 2011.
Ellsworth, P. Z. and Williams, D. G.: Hydrogen isotope fractionation during water uptake by woody xerophytes, Plant Soil, 291, 93–107, https://doi.org/10.1007/s11104-006-9177-1, 2007.
Franks, P. J., Drake, P. L., and Froend, R. H.: Anisohydric but isohydrodynamic: Seasonally constant plant water potential gradient explained by a stomatal control mechanism incorporating variable plant hydraulic conductance, Plant Cell Environ., 30, 19–30, 2007.
Gebauer, R. L. E. and Ehleringer, J. R.: Water and nitrogen uptake patterns following moisture pulses in a cold desert community, Ecology, 81, 1415–1424, 2000.
Granier, A.: Evaluation of transpiration in a Douglas-fir stand by means of sap flow measurements, Tree Physiol., 3, 309–320, 1987.
Grossiord, C., Sevanto, S., Dawson, T. E., Adams, H. D., Collins, A. D., Dickman, L. T., Newman, B. D., Stockton, E. A., and McDowell, N. G.: Warming combined with more extreme precipitation regimes modifies the water sources used by trees, New Phytol., 213, 584–596, https://doi.org/10.1111/nph.14192, 2017.
Hudson, P. J., Limousin, J. M., Krofcheck, D. J., Boutz, A. L., Pangle, R. E., Gehres, N., McDowell, N. G., and Pockman, W. T.: Impacts of long-term precipitation manipulation on hydraulic architecture and xylem anatomy of pinon and juniper in Southwest USA, Plant Cell Environ., 41, 421–435, https://doi.org/10.1111/pce.13109, 2018.
IBM: IBM SPSS Statistics, https://www.ibm.com/uk-en/products/spss-statistics, last access: 9 October 2022.
Iida, S., Shimizu, T., Tamai, K., Kabeya, N., Shimizu, A., Ito, E., Ohnuki, Y., Chann, S., and Keth, N.: Interrelationships among dry season leaf fall, leaf flush and transpiration: insights from sap flux measurements in a tropical dry deciduous forest, Ecohydrology, 9, 472–486, https://doi.org/10.1002/eco.1650, 2016.
Jana, R. B. and Mohanty, B. P.: A comparative study of multiple approaches to soil hydraulic parameter scaling applied at the hillslope scale, Water Resour. Res., 48, W02520, https://doi.org/10.1029/2010WR010185, 2012.
Jia, X. X., Zhao, C. L., Wang, Y. Q., Zhu, Y. J., Wei, X. R., and Shao, M. A.: Traditional dry soil layer index method overestimates soil desiccation severity following conversion of cropland into forest and grassland on China's Loess Plateau, Agr. Ecosyst. Environ., 291, 106794, https://doi.org/10.1016/J.Agee.2019.106794, 2020.
Klein, T.: The variability of stomatal sensitivity to leaf water potential across tree species indicates a continuum between isohydric and anisohydric behaviours, Funct. Ecol., 28, 1313–1320, 2014.
Kumagai, T. and Porporato, A.: Strategies of a Bornean tropical rainforest water use as a function of rainfall regime: isohydric or anisohydric?, Plant Cell Environ., 35, 61-71, https://doi.org/10.1111/j.1365-3040.2011.02428.x, 2012.
Li, H. Q., Zhang, F. W., Zhu, J. B., Guo, X. W., Li, Y. K., Lin, L., Zhang, L. M., Yang, Y. S., Li, Y. N., Cao, G. M., Zhou, H. K., and Du, M. Y.: Precipitation rather than evapotranspiration determines the warm-season water supply in an alpine shrub and an alpine meadow, Agr. Forest Meteorol., 300, 108318, https://doi.org/10.1016/j.agrformet.2021.108318, 2021.
Liu, G. B., Shangguan, Z. P., Yao, W. Y., Yang, Q. K., Zhao, M. J., Dang, X. H., Guo, M. H., Wang, G. L., and Wang, B.: Ecological effects of soil conservation in Loess Plateau, Bull. Chin. Acad. Sci., 32, 11–19, https://doi.org/10.16418/j.issn.1000-3045.2017.01.002, 2017.
Liu, Z. Q., Yu, X. X., and Jia, G. D.: Water uptake by coniferous and broad-leaved forest in a rocky mountainous area of northern China, Agr. Forest Meteorol., 265, 381–389, https://doi.org/10.1016/j.agrformet.2018.11.036, 2019.
McDowell, N. G., Pockman, W. T., Allen, C. D., Breshears, D. D., Cobb, N., Kolb, T., Plaut, J., Sperry, J., West, A., and Williams, D. G.: Mechanisms of plant survival and mortality during drought: why do some plants survive while others succumb to drought?, New Phytol., 178, 719–739, https://doi.org/10.1111/nph.16971, 2008.
Meier, I. C., Knutzen, F., Eder, L. M., Muller-Haubold, H., Goebel, M. O., Bachmann, J., Hertel, D., and Leuschner, C.: The Deep Root System of Fagus sylvatica on Sandy Soil: Structure and Variation Across a Precipitation Gradient, Ecosystems, 21, 280–296, https://doi.org/10.1007/s10021-017-0148-6, 2018.
Mendham, D. S., White, D. A., Battaglia, M., McGrath, J. F., Short, T. M., Ogden, G. N., and Kinal, J.: Soil water depletion and replenishment during first- and early second-rotation Eucalyptus globulus plantations with deep soil profiles, Agr. Forest Meteorol., 151, 1568–1579, https://doi.org/10.1016/j.agrformet.2011.06.014, 2011.
Moore, J. W. and Semmens, B. X.: Incorporating uncertainty and prior information into stable isotope mixing models, Ecol. Lett., 11, 470–480, https://doi.org/10.1111/j.1461-0248.2008.01163.x, 2008.
Mualem, Y.: A new model for predicting the hydraulic conductivity of unsaturated porous media, Water Resour. Res., 12, 513–522, https://doi.org/10.1029/wr012i003p00513, 1976.
Munoz-Villers, L. E., Geris, J., Alvarado-Barrientos, M. S., Holwerda, F., and Dawson, T.: Coffee and shade trees show complementary use of soil water in a traditional agroforestry ecosystem, Hydrol. Earth Syst. Sci., 24, 1649–1668, https://doi.org/10.5194/hess-24-1649-2020, 2020.
PC-PROGRESS: HYDRUS-1D, https://www.pc-progress.com/en/Default.aspx?hydrus-1d, last access: 9 October 2022.
Plaut, J. A., Wadsworth, W. D., Pangle, R., Yepez, E. A., McDowell, N. G., and Pockman, W. T.: Reduced transpiration response to precipitation pulses precedes mortality in a pinon-juniper woodland subject to prolonged drought, New Phytol., 200, 375–387, https://doi.org/10.1111/nph.12392, 2013.
Qiao, J. B., Zhu, Y. J., Jia, X. X., Huang, L. M., and Shao, M. A.: Pedotransfer functions for estimating the field capacity and permanent wilting point in the critical zone of the Loess Plateau, China, J. Soils Sediment., 19, 140–147, https://doi.org/10.1007/s11368-018-2036-x, 2019.
Reynolds, W. D., Elrick, D. E., Youngs, E. G., Booltink, H. W. G., and Bouma, J.: Saturated and field-saturated water flow parameters, in: Methods of soil analysis, edited by: Dane, J. H. and Topp, G. C., Soil Science Society of America, Madison, Wisconsin, USA, 797–878, https://doi.org/10.2136/sssabookser5.4.c30 (last access: 9 October 2022), 2002.
Richards, L.: Capillary conduction of liquids through porous mediums, J. Appl. Phys., 1, 318–333, https://doi.org/10.1063/1.1745010, 1931.
Ritchie, J. T.: Model for predicting evaporation from a row crop with incomplete cover, Water Resour. Res., 8, 1204–1213, https://doi.org/10.1029/WR008i005p01204, 1972.
Salamalikis, V., Argiriou, A. A., and Dotsika, E.: Isotopic modeling of the sub-cloud evaporation effect in precipitation, Sci. Total Environ., 544, 1059–1072, 2016.
Shao, J., Si, B. C., and Jin, J. M.: Extreme Precipitation Years and Their Occurrence Frequency Regulate Long-Term Groundwater Recharge and Transit Time, Vadose Zone J., 17, 180093, https://doi.org/10.2136/Vzj2018.04.0093, 2018.
Silvertown, J., Araya, Y., and Gowing, D.: Hydrological niches in terrestrial plant communities: a review, J. Ecol., 103, 93–108, https://doi.org/10.1111/1365-2745.12332, 2015.
Šimůnek, J., van Genuchten, M. T., and Šejna, M.: Development and applications of the HYDRUS and STANMOD software packages and related codes, Vadose Zone J., 7, 587–600, 2008.
Šimůnek, J., Šejna, M., Saito, H., Sakai, M., and van Genuchten, M. T.: The Hydrus-1D Software Package for Simulating the Movement of Water, Heat, and Multiple Solutes in Variably Saturated Media, Version 4.17, HYDRUS Software Series 3, Department of Environmental Sciences, University of California Riverside, Riverside, California, USA, 105–149, https://www.pc-progress.com/en/Default.aspx?hydrus-1d (last access: 9 October 2022), 2013.
Song, X. P., Hansen, M. C., Stehman, S. V., Potapov, P. V., Tyukavina, A., Vermote, E. F., and Townshend, J. R.: Global land change from 1982 to 2016, Nature, 560, 639–643, https://doi.org/10.1038/s41586-018-0411-9, 2018.
Stahl, C., Herault, B., Rossi, V., Burban, B., Brechet, C., and Bonal, D.: Depth of soil water uptake by tropical rainforest trees during dry periods: does tree dimension matter?, Oecologia, 173, 119—1201, https://doi.org/10.1007/s00442-013-2724-6, 2013.
Steppe, K., De Pauw, D. J. W., Doody, T. M., and Teskey, R. O.: A comparison of sap flux density using thermal dissipation, heat pulse velocity and heat field deformation methods, Agr. Forest Meteorol., 150, 1046–1056, https://doi.org/10.1016/j.agrformet.2010.04.004, 2010.
Swaffer, B. A., Holland, K. L., Doody, T. M., Li, C., and Hutson, J.: Water use strategies of two co-occurring tree species in a semi-arid karst environment, Hydrol. Process., 28, 2003–2017, https://doi.org/10.1002/hyp.9739, 2014.
Tang, Y. K., Wu, X., Chen, Y. M., Wen, J., Xie, Y. L., and Lu, S. B.: Water use strategies for two dominant tree species in pure and mixed plantations of the semiarid Chinese Loess Plateau, Ecohydrology, 11, E1943, https://doi.org/10.1002/Eco.1943, 2018.
Tang, Y. K., Wu, X., Chen, C., Jia, C., and Chen, Y. M.: Water source partitioning and nitrogen facilitation promote coexistence of nitrogen-fixing and neighbor species in mixed plantations in the semiarid Loess Plateau, Plant Soil, 445, 289–305, https://doi.org/10.1007/s11104-019-04301-9, 2019.
Tfwala, C. M., van Rensburg, L. D., Bello, Z. A., and Zietsman, P. C.: Transpiration dynamics and water sources for selected indigenous trees under varying soil water content, Agr. Forest Meteorol., 275, 296–304, https://doi.org/10.1016/j.agrformet.2019.05.030, 2019.
van Genuchten, M. T.: A closed-form equation for predicting the hydraulic conductivity of unsaturated soils, Soil Sci. Soc. Am. J., 44, 892–898, https://doi.org/10.2136/sssaj1980.03615995004400050002x, 1980.
Wang, J., Fu, B. J., Wang, L. X., Lu, N., and Li, J. Y.: Water use characteristics of the common tree species in different plantation types in the Loess Plateau of China, Agr. Forest Meteorol., 288, 108020, https://doi.org/10.1016/j.agrformet.2020.108020, 2020.
Wang, S. F., An, J., Zhao, X. N., Gao, X. D., Wu, P., Huo, G. P., and Robinson, B. H.: Age- and climate-related water use patterns of apple trees on China's Loess Plateau, J. Hydrol., 582, 124462, https://doi.org/10.1016/j.jhydrol.2019.124462, 2020.
West, A. G., Hultine, K. R., Jackson, T. L., and Ehleringer, J. R.: Differential summer water use by Pinus edulis and Juniperus osteosperma reflects contrasting hydraulic characteristics, Tree Physiol., 27, 1711–1720, https://doi.org/10.1093/treephys/27.12.1711, 2007.
West, A. G., Dawson, T. E., February, E. C., Midgley, G. F., Bond, W. J., and Aston, T. L.: Diverse functional responses to drought in a Mediterranean-type shrubland in South Africa, New Phytol., 195, 396–407, https://doi.org/10.1111/j.1469-8137.2012.04170.x, 2012.
Wu, G. L., Yang, Z., Cui, Z., Liu, Y., Fang, N. F., and Shi, Z. H.: Mixed artificial grasslands with more roots improved mine soil infiltration capacity, J. Hydrol., 535, 54–60, 2016.
Wu, W. J., Li, H. J., Feng, H., Si, B. C., Chen, G. J., Meng, T. F., Li, Y., and Siddique, K. H. M.: Precipitation dominates the transpiration of both the economic forest (Malus pumila) and ecological forest (Robinia pseudoacacia) on the Loess Plateau after about 15 years of water depletion in deep soil, Agr. Forest Meteorol., 297, 108244, https://doi.org/10.1016/j.agrformet.2020.108244, 2021.
Xi, B. Y., Wang, Y., Jia, L. M., Bloomberg, M., Li, G. D., and Di, N.: Characteristics of fine root system and water uptake in a triploid Populus tomentosa plantation in the North China Plain: Implications for irrigation water management, Agr. Water Manage., 117, 83–92, 2013.
Yang, B., Wen, X. F., and Sun, X. M.: Seasonal variations in depth of water uptake for a subtropical coniferous plantation subjected to drought in an East Asian monsoon region, Agr. Forest Meteorol., 201, 218–228, https://doi.org/10.1016/j.agrformet.2014.11.020, 2015.
Yang, B., Meng, X. J., Singh, A. K., Wang, P. Y., Song, L., Zakari, S., and Liu, W. J.: Intercrops improve surface water availability in rubber-based agroforestry systems, Agr. Ecosyst. Environ., 298, 106937, https://doi.org/10.1016/J.Agee.2020.106937, 2020.
Yi, C. Q. and Fan, J.: Application of HYDRUS-1D model to provide antecedent soil water contents for analysis of runoff and soil erosion from a slope on the Loess Plateau, Catena, 139, 1–8, 2016.
Zhang, H. D., Wei, W., Chen, L. D., and Yang, L.: Evaluating canopy transpiration and water use of two typical planted tree species in the dryland Loess Plateau of China, Ecohydrology, 10, E1830, https://doi.org/10.1002/Eco.1830, 2017.
Zhang, H. X., Li, S., Zhang, S. X., Xiong, X. Y., and Cai, J.: Relationships between xylem vessel structure and embolism vulnerability in four Populus clones, Scientia Silvae Sinicae, 49, 54–61, https://doi.org/10.11707/j.1001-7488.20130508, 2013.
Zhao, Y., Wang, L., Knighton, J., Evaristo, J., and Wassen, M.: Contrasting adaptive strategies by Caragana korshinskii and Salix psammophila in a semiarid revegetated ecosystem, Agr. Forest Meteorol., 300, 108323, https://doi.org/10.1016/j.agrformet.2021.108323, 2021.
Zhou, G. Y., Yin, G. C., Tang, X. L., Wen, Z. D., Liu, C. P., Kuang, Y. W., and Wang, W. T.: Carbon reserves in forest ecosystems of China: Biomass allometric equation, Science Press, Beijing, China, 44–54, ISBN 978-7-5088-5392-5, 2018.