the Creative Commons Attribution 4.0 License.
the Creative Commons Attribution 4.0 License.
 | 06 Oct 2022
Impacts of different types of El Niño events on water quality over the Corn Belt, United States
Wenhong Li
The United States Corn Belt region, which primarily includes two large basins, namely, the Ohio–Tennessee River basin (OTRB) and the Upper Mississippi River basin (UMRB), is responsible for the Gulf of Mexico hypoxic zone. Climate patterns such as El Niño can affect the runoff and thus the water quality over the Corn Belt. In this study, the impacts of eastern Pacific (EP) and central Pacific (CP) El Niño events on water quality over the Corn Belt region were analyzed using the Soil and Water Assessment Tool (SWAT) models. Our results indicated that, at the outlets, annual total nitrogen (TN) and total phosphorus (TP) loads decreased by 13.1 % and 14.0 % at OTRB and 18.5 % and 19.8 % at UMRB, respectively, during the EP El Niño years, whereas during the CP El Niño years, they increased by 3.3 % and 4.6 % at OTRB and 5.7 % and 4.4 % at UMRB, respectively. On the subbasin scales, more subbasins showed negative (positive) anomalies of TN and TP during EP (CP) El Niño. A seasonal study confirmed that water quality anomalies showed the opposite patterns during EP and CP El Niño years. At the outlet of OTRB, seasonal anomalies in nutrients matched the El Niño–Southern Oscillation (ENSO) phases, illustrating the importance of climate variables associated with the two types of El Niño events on water quality in the region. At the UMRB, TN and TP were also influenced by agricultural activities within the region, and their anomalies became greater in the growing seasons during both EP and CP El Niño years. A quantitative analysis of precipitation, temperature, and their effects on nutrients suggested that precipitation played a more important role than temperature did in altering the water quality in the Corn Belt region during both types of El Niño years. We also found specific watersheds (located in Iowa, Illinois, Minnesota, Wisconsin, and Indiana) that faced the greatest increases in TN and TP loads and were affected by both the precipitation and agricultural activities during the CP El Niño years. The information generated from this study may help proper decision-making for water environment protection over the Corn Belt.
- Article
(12053 KB) - Full-text XML
-
Supplement
(3060 KB) - BibTeX
- EndNote


The Corn Belt region of the United States (U.S.) primarily includes the Ohio–Tennessee River basin (OTRB) and the Upper Mississippi River basin (UMRB; Kellner and Niyogi, 2015; Panagopoulos et al., 2017; Ting et al., 2021). The Corn Belt is a very important area for the agricultural activity of the country, as 75 % of the corn and 60 % of the soybean produced in the U.S. are grown in the region (Thaler et al., 2021). The region's agricultural activities, such as using fertilizers, contribute to the increase in nitrogen and phosphorus levels, which are responsible for the Gulf of Mexico hypoxic zone (Panagopoulos et al., 2014, 2015; Rabalais et al., 2007). The required nutrient reduction in the Corn Belt to decrease hypoxia is the highest among all regions in the Mississippi River basin (Mississippi River/Gulf of Mexico Watershed Nutrient Task Force, 2008). Hence, water quality changes in the Corn Belt region have been receiving considerable attention.
The El Niño–Southern Oscillation (ENSO) is a coupled ocean–atmosphere phenomenon that occurs across the tropical Pacific (Trenberth, 1997; Wang and Kumar, 2015). Precipitation and temperature are influenced by ENSO in many places in the U.S., including the Corn Belt region (Gershunov, 1998; Lee et al., 2014; Thomson et al., 2003; Wang and Asefa, 2018). For example, more frequent dry conditions were found east of the Ohio River in the early spring of a decaying El Niño event (Wang and Asefa, 2018). ENSO events could also have a significant impact on the water quality of a basin through changing climate factors. Heavy or prolonged rains might contribute to the pollutant loading from agricultural runoff (Paul et al., 1997). Temperature anomalies might change river water quality by affecting evaporation and water temperature. Keener et al. (2010) showed that ENSO significantly altered water flow and nitrate concentration in a southeastern U.S. basin. Sharma et al. (2012) found that worse water quality in southeastern Alabama was linked to the stream temperature anomalies during El Niño years. However, the impacts of ENSO on water quality in the Corn Belt region have not been studied.
In recent years, studies have found two different types of El Niño events, i.e., eastern Pacific (EP) and central Pacific (CP) El Niño events (Larkin and Harrison, 2005; Li et al., 2011; Tan et al., 2020; Tang et al., 2016; Yeh et al., 2009). The former has warmer sea surface temperature anomalies (SSTAs) in the Niño 3 region (5∘ N–5∘ S, 150–90∘ W), while the latter, also called the El Niño Modoki, is manifested by maximum SSTAs in the Niño 4 region (5∘ N–5∘ S, 160∘ E–150∘ W). The effects of these two types of El Niño events on regional climate and runoff are different. For example, reduced rainfall was found in the northern, central, and eastern parts of the Amazon during the EP El Niño years (EP ENYs), while increased rainfall anomalies were observed in most of the Amazon during the CP El Niño years (CP ENYs; Li et al., 2011). CP El Niño events were more effective in causing drought conditions in India due to atmospheric subsidence than EP El Niño events (Kumar et al., 2006). How these two types of El Niño events affect the water quality of the Corn Belt has not been studied. Over recent years, the EP El Niño has appeared less frequently, whereas CP El Niño has become more common (Kao and Yu, 2009; Yeh et al., 2009). In the future, CP El Niño will likely happen more frequently (Yeh et al., 2009; Yu et al., 2010). Understanding the impact of these different El Niño events on water quality over the Corn Belt is of critical importance for the water quality management of streams and rivers.
In this study, we used the Soil and Water Assessment Tool (SWAT) model to estimate the water quality changes due to EP and CP El Niño events over the Corn Belt. The SWAT model is widely used to assess climate change and alternative land use/land management scenarios on runoff and nutrients in a basin (Afonso de Oliveira Serrão et al., 2022; Chaplot et al., 2004; P. Chen et al., 2021; Johnson et al., 2015; Vaché et al., 2002; Zhang et al., 2020). The detailed objectives of this study were to (1) analyze the impacts of the two types of El Niño events on water quality in the Corn Belt region and (2) identify the main climate factors that affect the change in water quality due to these El Niño events. Water quality change associated with future El Niño change was also discussed. Such information is particularly important to enable decision-makers to take timely actions to reduce nutrient loading under climate change.

Figure 1The Ohio–Tennessee River basin (OTRB) and Upper Mississippi River basin (UMRB) (a) available United States Geological Survey (USGS) gauge sites (black triangles), reaches (light blue), and the two watersheds (heavy red – OTRB; heavy dark – UMRB) and (b) land use/land cover.
2.1 Data
The study area includes two large basins in the U.S., namely, OTRB (528 000 km2) and UMRB (492 000 km2), as shown in Fig. 1. OTRB comprises a significant portion of Pennsylvania, Ohio, West Virginia, Indiana, Illinois, Kentucky, and Tennessee (Fig. 1a). The amount of annual rainfall in OTRB was high, with an average of nearly 1200 mm during 1975–2016. OTRB's slopes are steep, especially in the forested Tennessee basin, with slopes greater than 5 % in most (60 %) of the area. The primary land use types are 50 % forest, 20 % cropland, and 15 % pasture (Fig. 1b). The cropland is mainly grown with corn, soybean, and wheat (Santhi et al., 2006). UMRB mainly includes five states, i.e., Iowa, Illinois, Missouri, Wisconsin, and Minnesota (Fig. 1a). The mean annual value of rainfall in UMRB during 1975–2016 was 900 mm. UMRB is relatively flat, and most of the basin (75 %) has a slope lower than 5 %. Cropland is the major land use type in the basin (50 %) and corn and soybean are primarily grown (Fig. 1b).
Table 1Available periods of measured streamflow, total suspended sediment (TSS), total nitrogen (TN), and total phosphorus (TP) at 15 USGS gauge at the OTRB and UMRB.
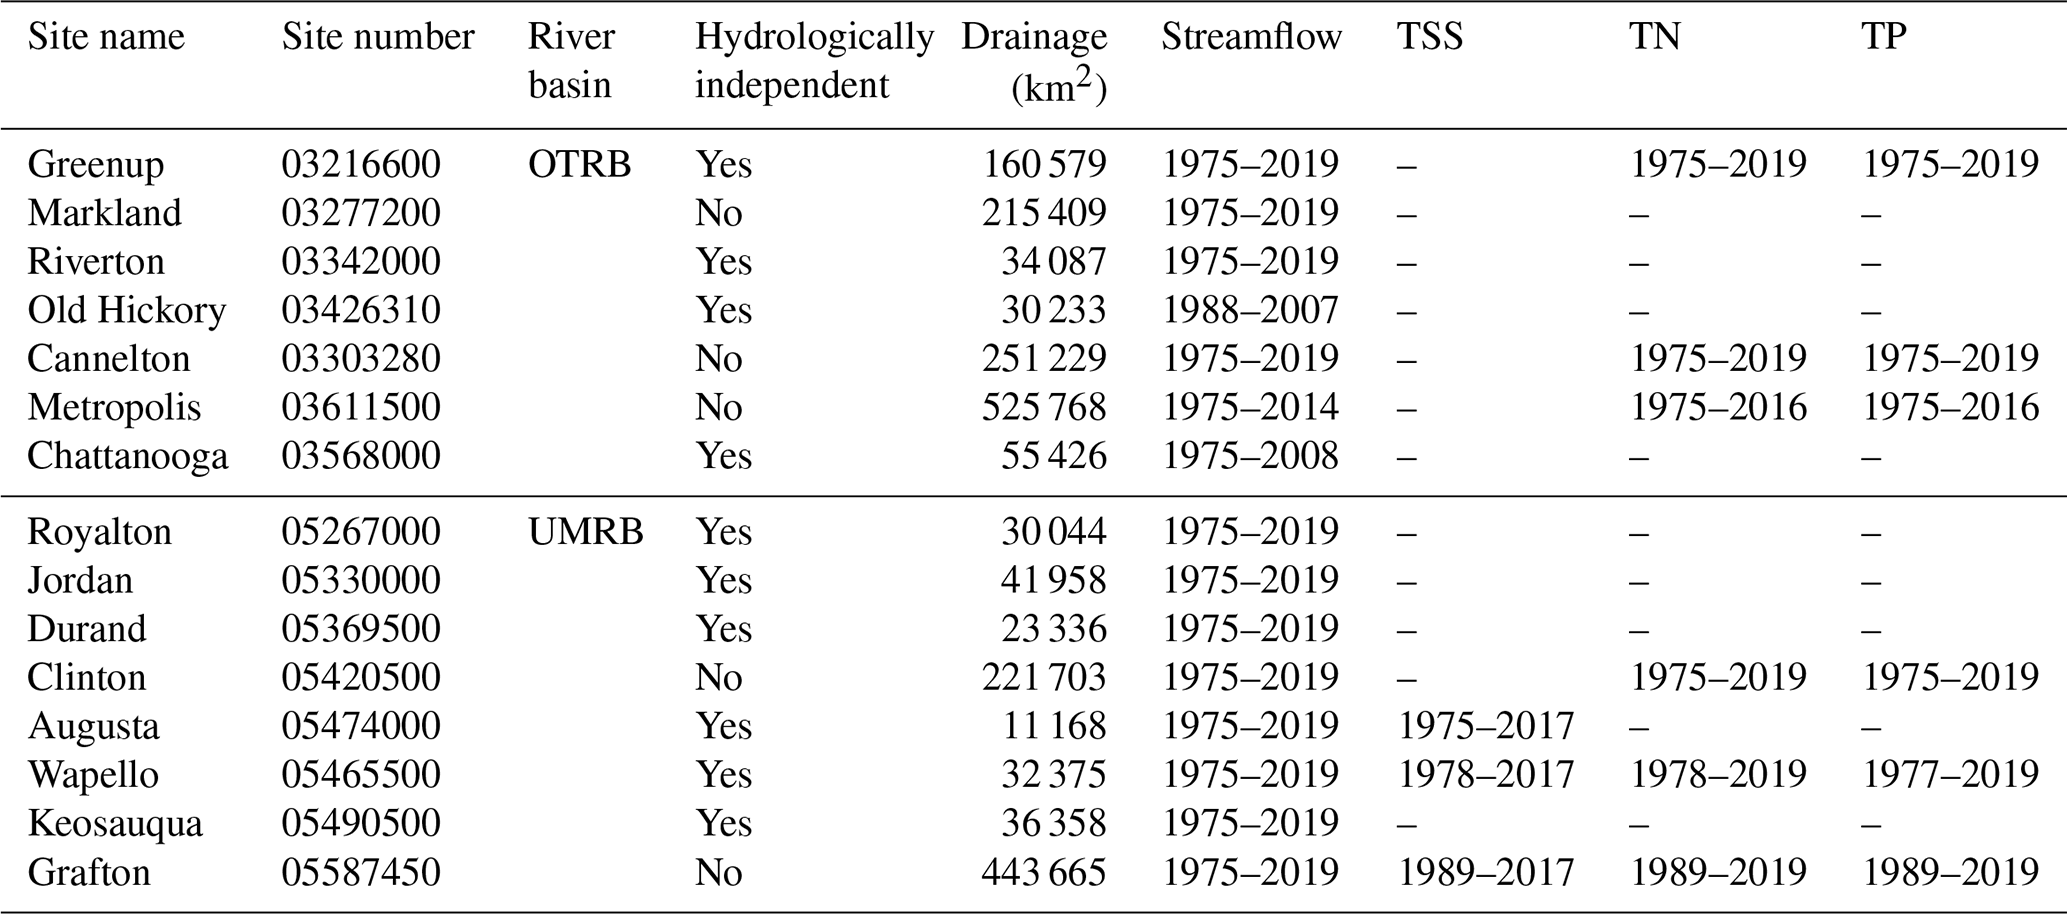
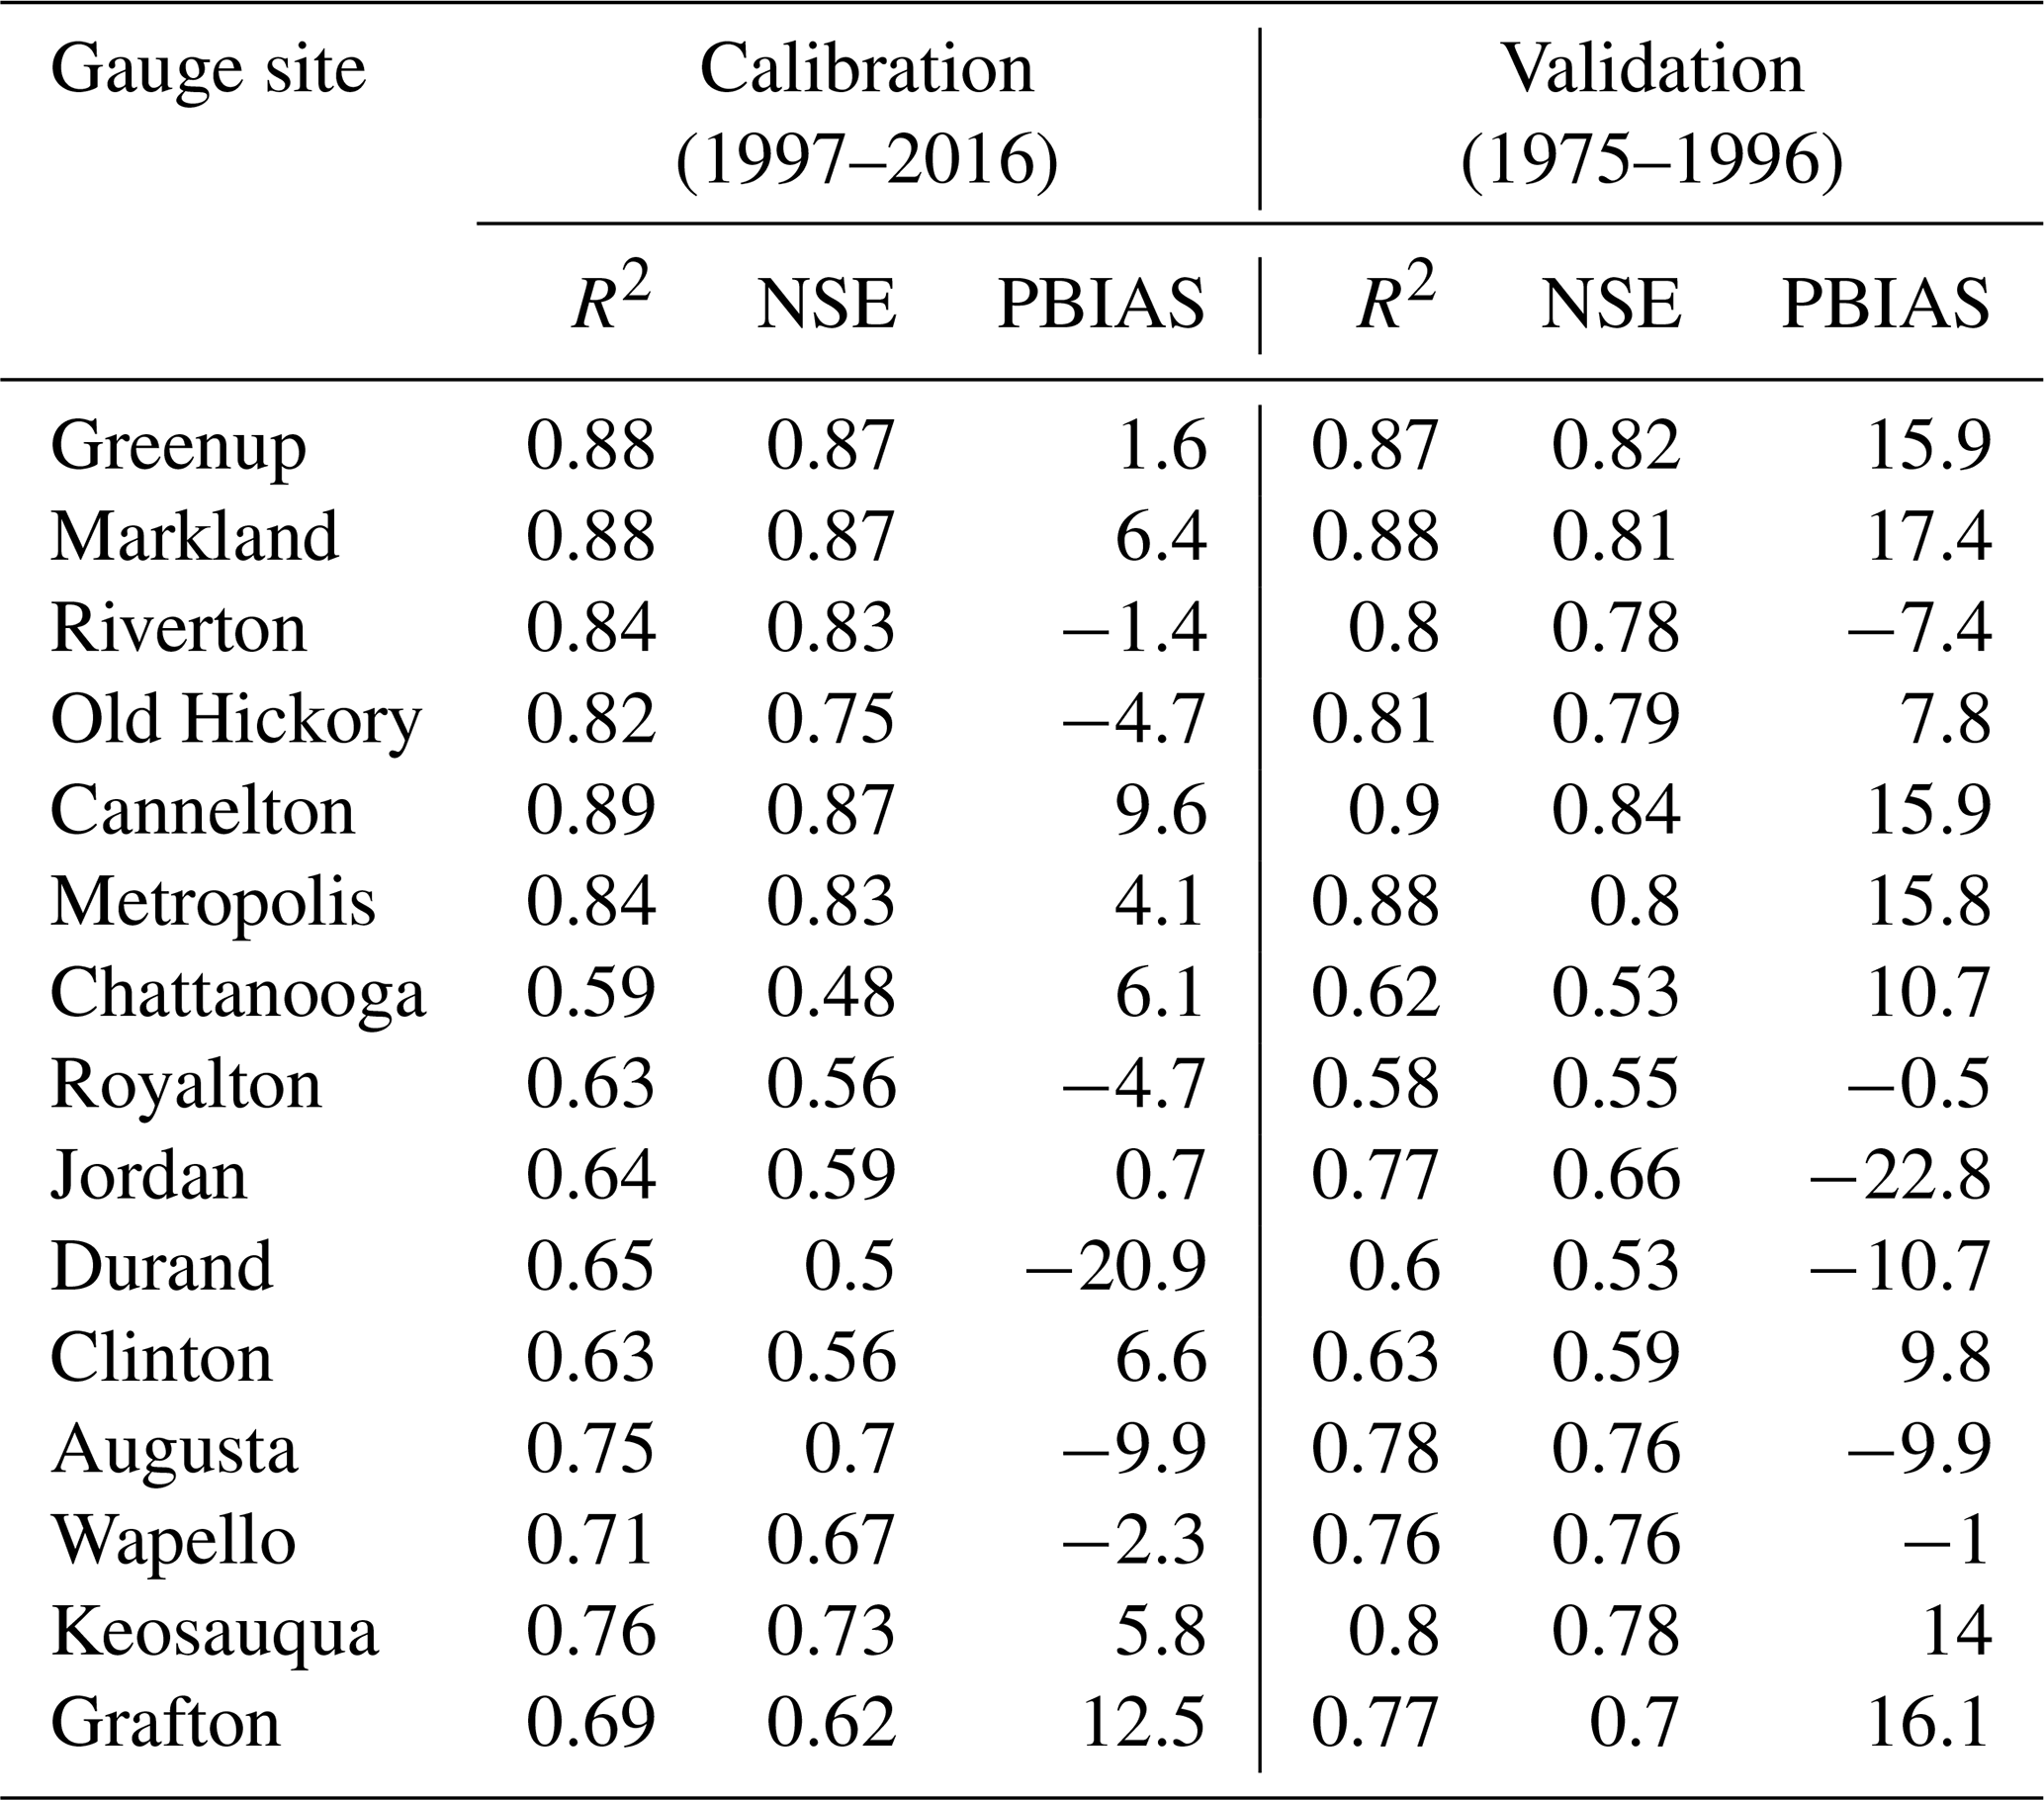
Table 2Monthly streamflow calibration and validation statistics. Note: Nash–Sutcliffe efficiency is denoted as NSE, and percent bias is denoted as PBIAS.
The weather data, including precipitation and temperature, were obtained from 2242 National Weather Service (NWS) stations in the study area. The historical El Niño years were based on Table 1 in Li et al. (2011) and Table 2 in Ren et al. (2018). In summary, nine EP El Niño events (1976–1977, 1979–1980, 1982–1983, 1986–1987, 1987–1988, 1991–1992, 1997–1998, 2006–2007, and 2015–2016) and six CP El Niño events (1977–1978, 1990–1991, 1994–1995, 2002–2003, 2004–2005, and 2009–2010) occurred during the study period (1975–2016).
Available monthly streamflow and water quality data from 1975 to 2016 came from the 15 United States Geological Survey (USGS) gauging stations in the study area. The final data used for calibration and validation of the model are shown in Table 1.
The statistical significance of precipitation, temperature, runoff, evaporation, TN, or TP anomalies in El Niño years was tested by the Monte Carlo method (Mo, 2010). The underlying concept of the method is to use randomness to solve problems that might be deterministic in principle (Wilks, 1995). Taking TN as an example, in order to test whether TN anomalies in EP El Niño years were significantly different from those in normal years, we first composited (i.e., averaged) TN anomalies for the nine EP El Niño years. The composite analysis is a useful technique to determine some of the basic structural characteristics of a climatological phenomenon, such as El Niño which occur over time. We then randomly selected 9 years out of 1975–2016 (i.e., keeping the same number of years as the EP El Niño years) and averaged/composited TN anomalies for the 9 randomized years as the first sample. The process was repeated 500 times. These composite samples were used to generate a distribution corresponding to the null hypothesis against which we could evaluate whether TN anomalies during EP El Niño were significantly different from those in normal years at a 95 % confidence level. Similarly, significance levels of the composite results of precipitation, temperature, runoff, evaporation, and TP anomalies in EP El Niño years could be determined. Such a method has been widely used in climate-related studies (Laken and Čalogović, 2013; Mo, 2010; Sanchez and Karnauskas, 2021) due to its robustness.
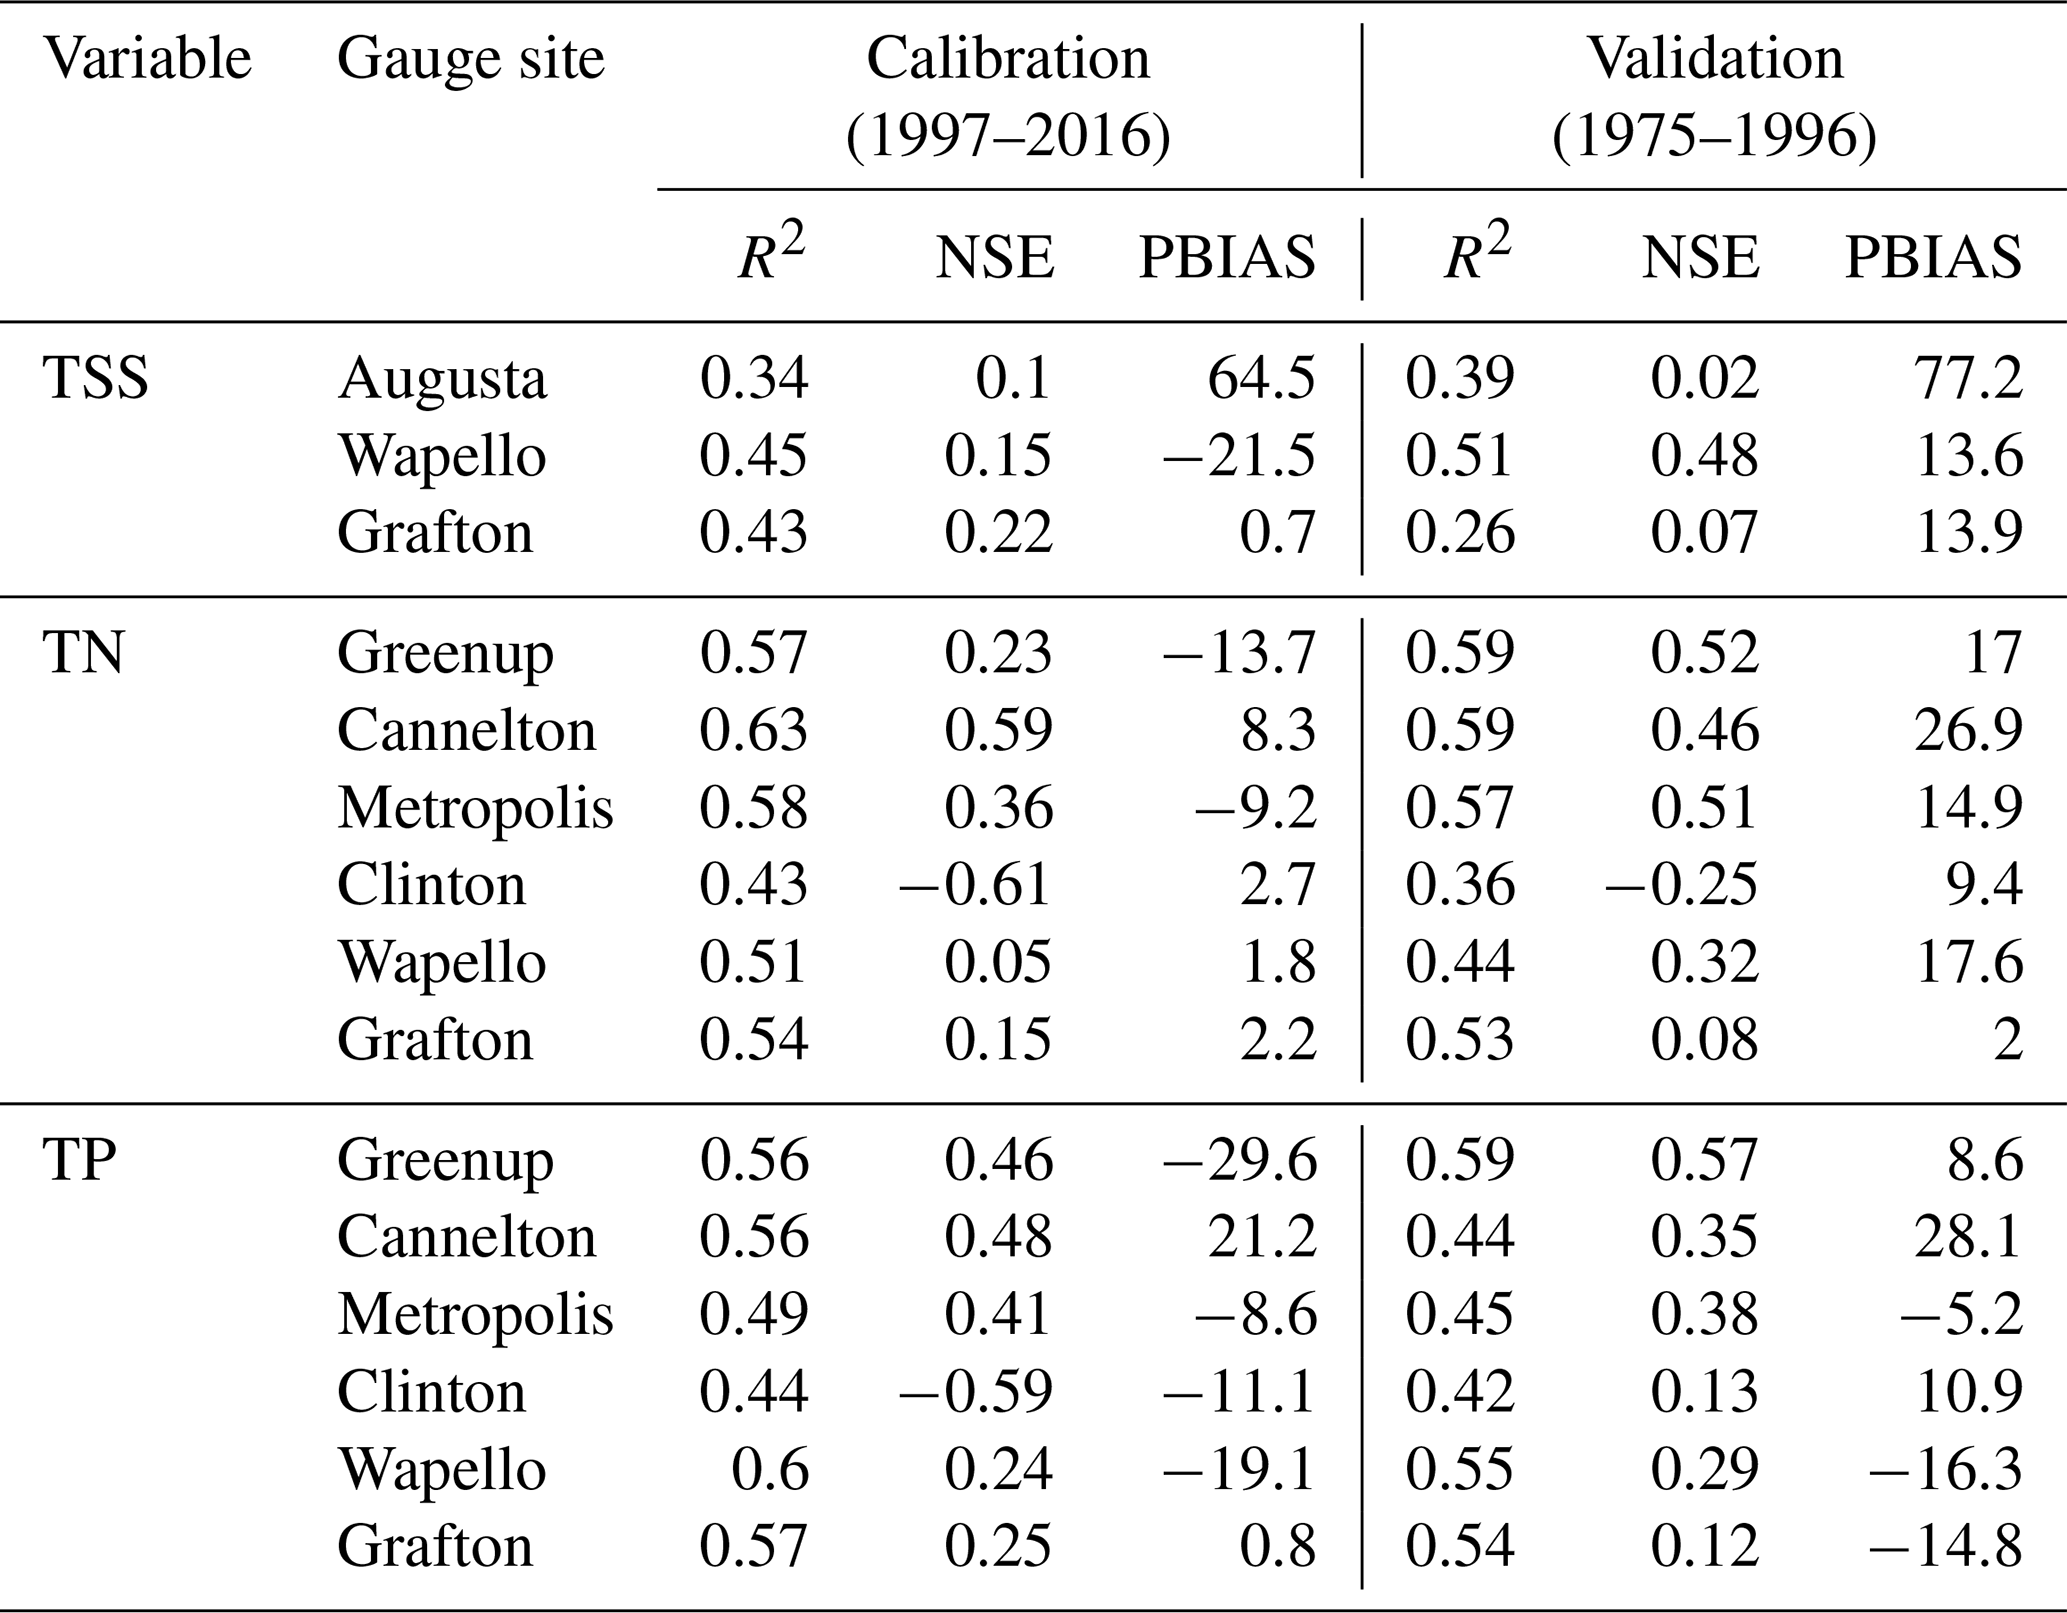
Table 3Monthly TSS, TN, and TP calibration and validation statistics. Note: Nash–Sutcliffe efficiency is denoted as NSE, and percent bias is denoted as PBIAS.
2.2 SWAT model
2.2.1 Model description
SWAT was developed by the U.S. Department of Agriculture Agricultural Research Services (Arnold et al., 1998). It has been widely used in assessing the effects of climate and land use change on hydrological processes, sediment, and nutrients in a basin (Neitsch et al., 2011; Pagliero et al., 2014; Yen et al., 2016). In the SWAT model, a basin is partitioned into subbasins, which are further divided into hydrological response units (HRUs; Gassman et al., 2007; Neitsch et al., 2011; Williams et al., 2008). Runoff, sediment, and nutrient loads are simulated for each HRU and then aggregated for the subbasins (P. Chen et al., 2021; Gassman et al., 2007; Neitsch et al., 2011). Thus, the spatial resolution of the model is measured by the number of HRUs and subbasins. The pollution situation of each subbasin during different El Niño years could be obtained from this model. The model was calculated on a daily timescale, and the results were analyzed on a monthly timescale.
2.2.2 Model setup and calibration
In this study, eight-digit Hydrologic Unit Codes (HUCs; HUC-8) defined by the USGS were selected as SWAT subbasins. In total, the OTRB and UMRB included 152 and 131 subbasins, respectively. Flow paths between the subbasins were determined using the stream network of the National Hydrography Dataset Plus (NHDPlus) dataset developed by the USGS and U.S. Environmental Protection Agency. Each of the subbasins was further divided into several spatially uniform HRUs based on land use, soil type, and slope (P. Chen et al., 2021; Neitsch et al., 2011). Thresholds of 0 %, 10 %, and 5 % were used for land use, soil, and slope, respectively, resulting in a total of 20 157 and 20 581 HRUs in the OTRB and UMRB. Then, point sources (Schwarz et al., 2006), crop management (U.S. Department of Agriculture (USDA) and National Agricultural Statistics Service (NASS); USDA-NASS, 2017), and tillage (Baker, 2011) dataset were incorporated to build the SWAT model (P. Chen et al., 2021).
The SWAT Calibration and Uncertainty Programs (SWAT-CUP) with the Sequential Uncertainty Fitting (SUFI-2) algorithm was selected in this large-scale study to complete the calibration of the SWAT model (Abbaspour et al., 2012). The parameters of water flow and water quality in OTRB and UMRB were selected based on a manual experimentation with SWAT parameters and a literature review (P. Chen et al., 2021; Panagopoulos et al., 2014, 2015; Yen et al., 2016). The calibration steps followed a recent study by P. Chen et al. (2021). The final parameters are shown in Tables S1 and S2 in the Supplement. The calibration results indicated that the SWAT model could rationally capture the observation (see Sect. 2.2.3).
2.2.3 Model performance
Overall, SWAT simulated the water flow of the OTRB and UMRB reasonably well in both the calibration (1997–2016) and validation (1975–1996) periods (Table 2). The coefficient of determination (R2) and Nash–Sutcliffe efficiency (NSE) values were larger than 0.5 for almost all the USGS gauges, except Chattanooga, and percent bias (PBIAS) values were all acceptable during the calibration periods (1997–2016) based on the ≤ ± 25 % deviation criterion (Moriasi et al., 2015). The validation results also showed acceptable static values and, in some cases, were even better, such as Chattanooga and Grafton. Figures S1 and S2 in the Supplement further demonstrated good agreement between the calculated and observed streamflow across OTRB and UMRB; particularly, most of the peaks and recession limbs were well matched in the simulations.
Modeled water quality was generally in agreement with the observations for the two river basins, as most of the PBIAS values were within the bias criteria for sediment, TN, and TP during both the calibration and validation periods (Santhi et al., 2014) (Table 3). The only exception that did not meet the criteria was the sediment simulation at Augusta. The upstream drainage area of Augusta was relatively small (only around 3 % of the UMRB); thus, its influence on downstream sediment and pollutant transport downstream was minor (Fig. 1a). The sediment statistics in OTRB were not calculated here because of a lack of observations (Panagopoulos et al., 2015). Instead, we compared the simulated annual sediment at Metropolis with observations during 1975–2010 and found that the difference was also within the bias criteria for sediment (Panagopoulos et al., 2015; Santhi et al., 2014). Moreover, most of the NSE and R2 values were positive, and many R2 values were greater than 0.5, indicating that the simulated water quality was reasonable (P. Chen et al., 2021). This finding could be further proved by the graphs of observed and simulated sediment and nutrients (Figs. S3 and S4 in the Supplement).
3.1 Impacts of the EP and CP El Niño events on the water quality in the Corn Belt
3.1.1 Annual composite
-
Water quality at the outlet
Figure 2 showed the nutrient change during EP and CP ENYs at the outlet of OTRB and UMRB. Annual loads of TN and TP decreased during the EP ENYs, while the pattern reversed during the CP ENYs in the U.S. Corn Belt region. Specifically, compared to normal years, the TN and TP decreased by 13.1 % (61 300 t yr−1 or metric tonnes per year) and 14.0 % (7300 t yr−1) during EP ENYs, respectively, whereas they increased by 3.3 % (15 500 t yr−1) and 4.6 % (2400 t yr−1) during CP ENYs at the outlet of the OTRB, respectively (Fig. 2). TN and TP at the outlet of the UMRB showed a similar pattern to that of the OTRB, decreasing (increasing) by 18.5 % (5.7 %) and 19.8 % (4.4 %) in EP (CP) ENYs. Furthermore, EP El Niño events had a much greater impact on water quality than CP El Niño events at the outlets of OTRB and UMRB. The magnitudes of variation in both TN and TP during the EP ENYs were 3 to 4 times greater than those during the CP ENYs (Fig. 2).
-
Water quality at the subbasin scale
We analyzed the water quality change at the subbasin scale during EP ENYs and CP ENYs, respectively (Fig. 3). Anomalous patterns of water quality associated with El Niño events within the Corn Belt varied in space. Clearly, more subbasins showed negative anomalies of TN and TP during EP ENYs, whereas more subbasins showed positive anomalies during CP ENYs (Fig. 3). Specifically, during EP ENYs, significant and below-average TN and TP values were found almost in the whole OTRB and UMRB, with maximum reductions in TN and TP up to −11.7 and −0.9 kg ha−1, respectively, which were of similar magnitudes to the mean values (12.7 kg N ha−1 and 1.0 kg P ha−1) in the Corn Belt region (Fig. 3a and b). During CP ENYs, positive anomalies mainly occurred throughout the southern OTRB and UMRB. In the northern UMRB and OTRB, about 42.4 % and 41.7 % of subbasins tended to have below-average TN and TP values (Fig. 3c and d). These patterns coincided with the TN and TP changes at the outlets of the two basins, which could also explain why greater changes in TN and TP occurred in EP ENYs than in CP ENYs at the outlets of the OTRB and UMRB (Fig. 2).
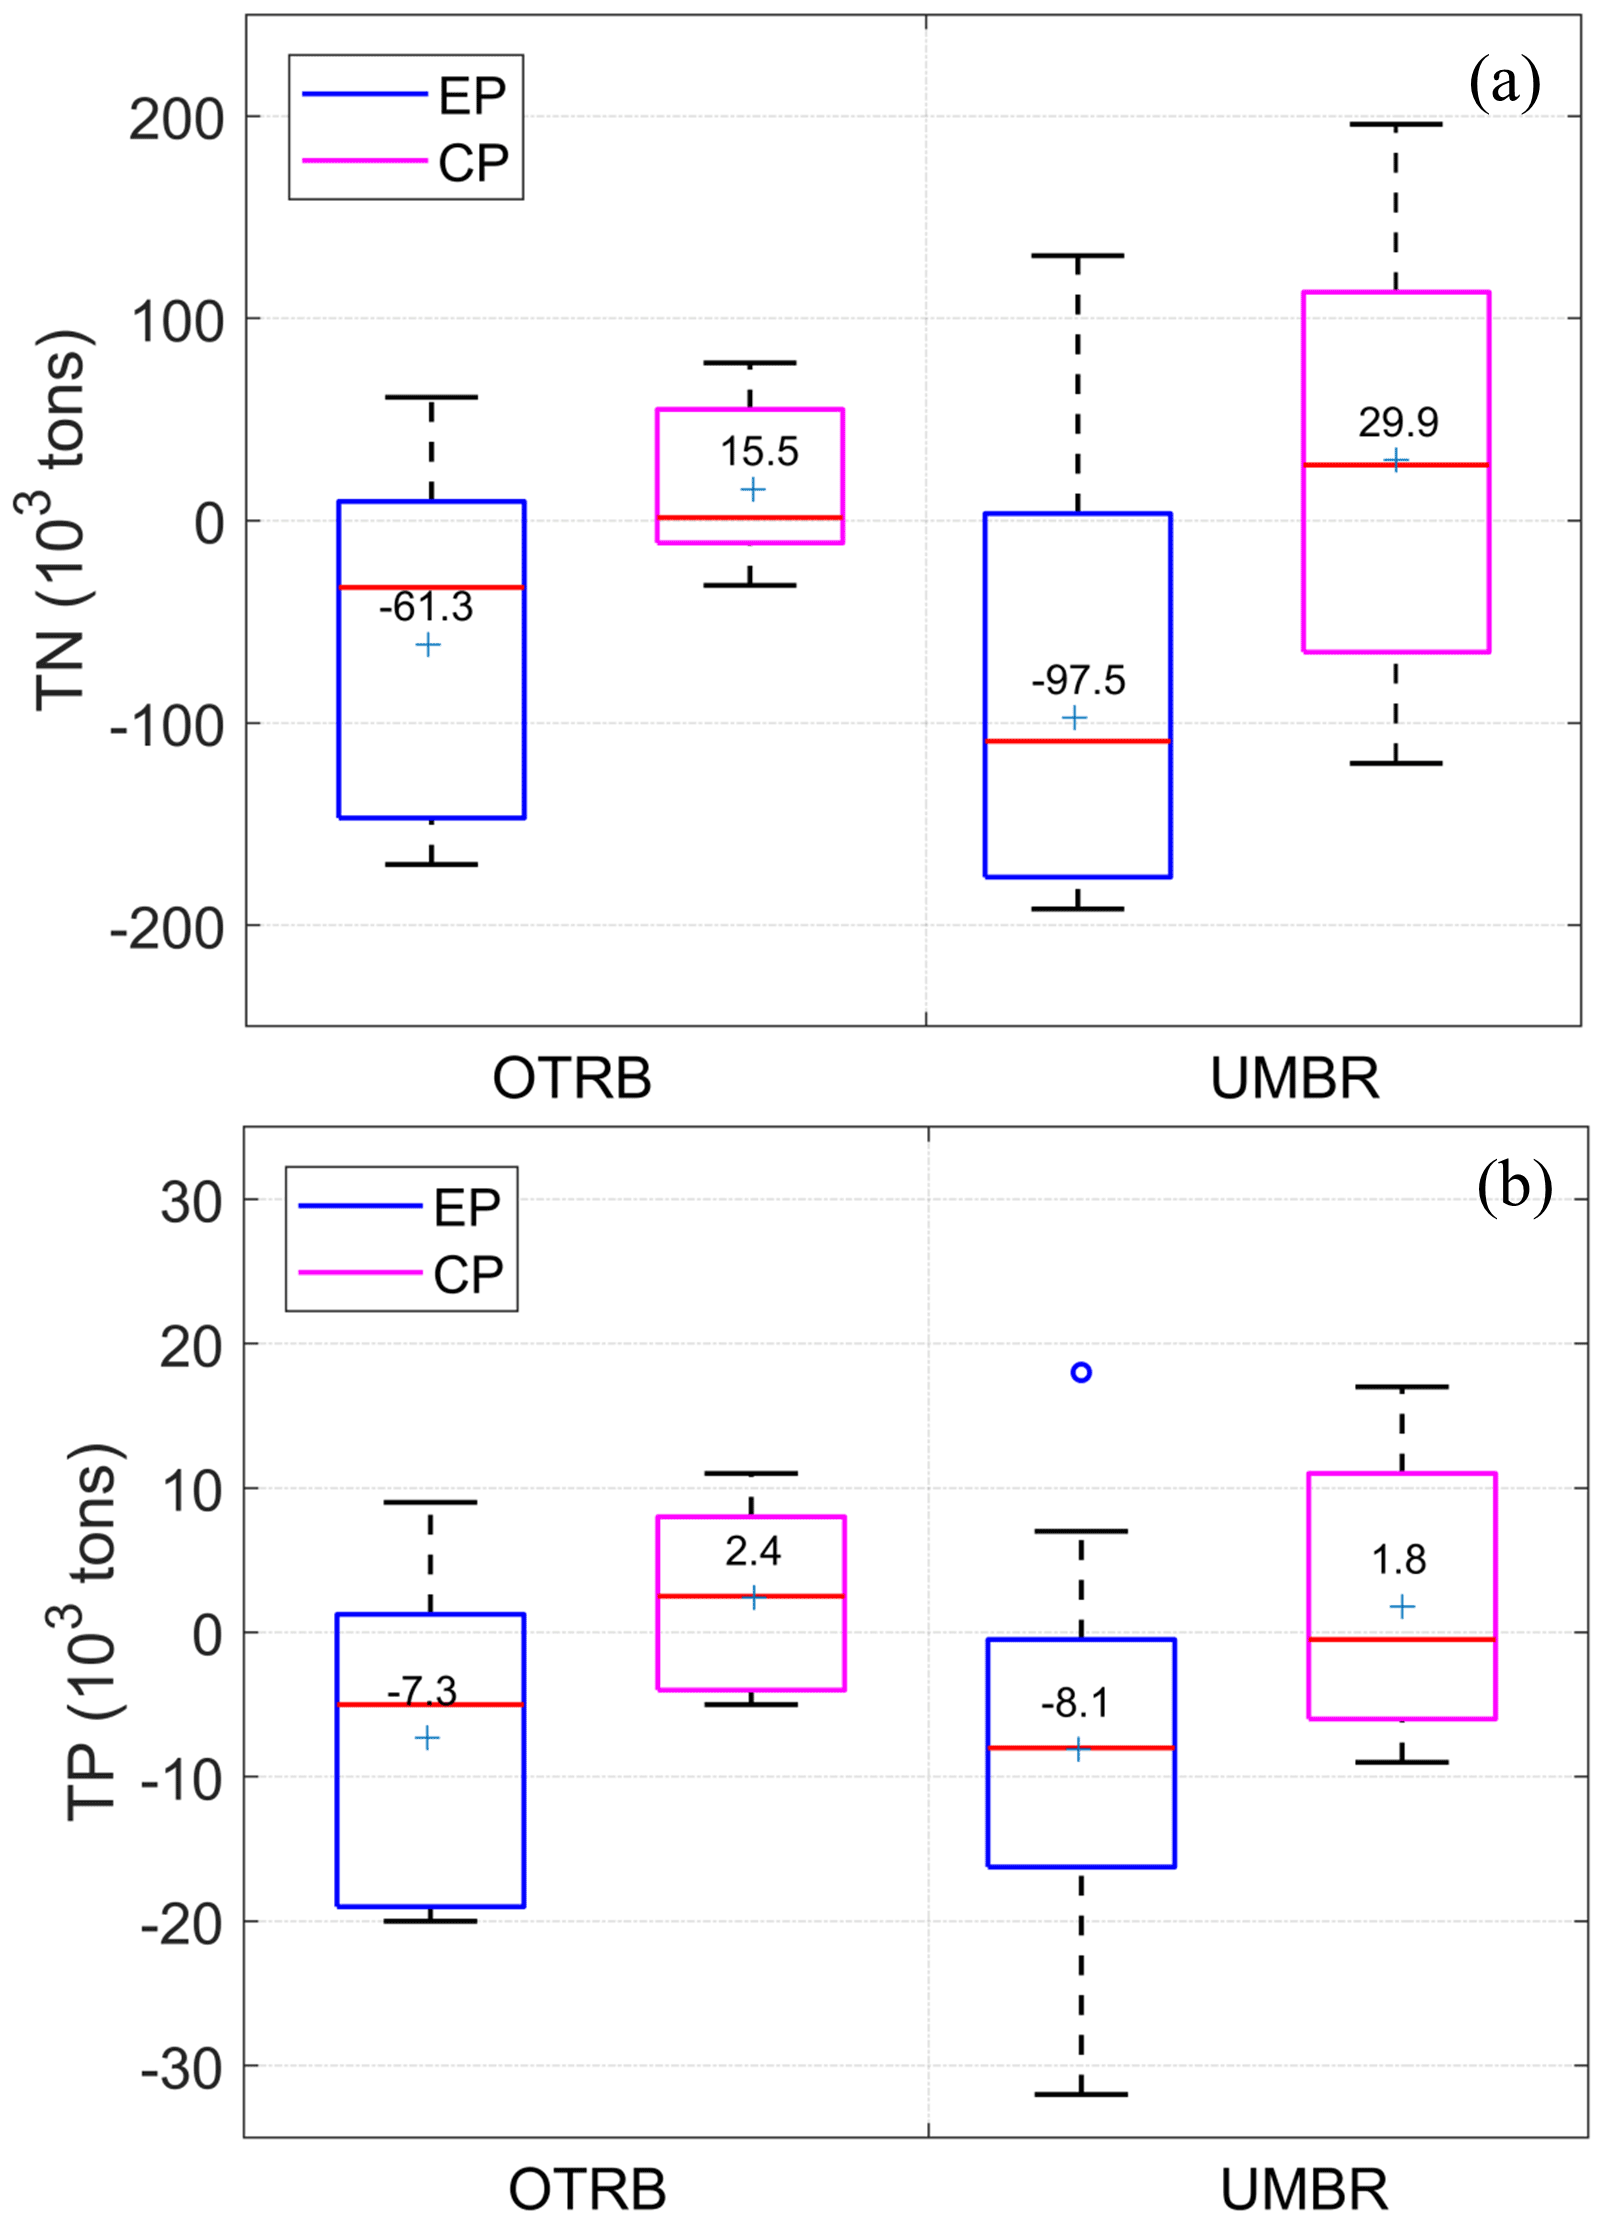
Figure 2Box plots of annual (a) TN and (b) TP anomalies (103 t) at the outlets of the OTRB and UMRB during EP El Niño years and CP El Niño years, respectively. The green plus sign (+), red solid horizontal line, box, and whisker ends indicate the mean, median, 25th and 75th percentiles, and 10th and 90th percentiles, respectively. The data points outside the ranges are shown in hollow dots.
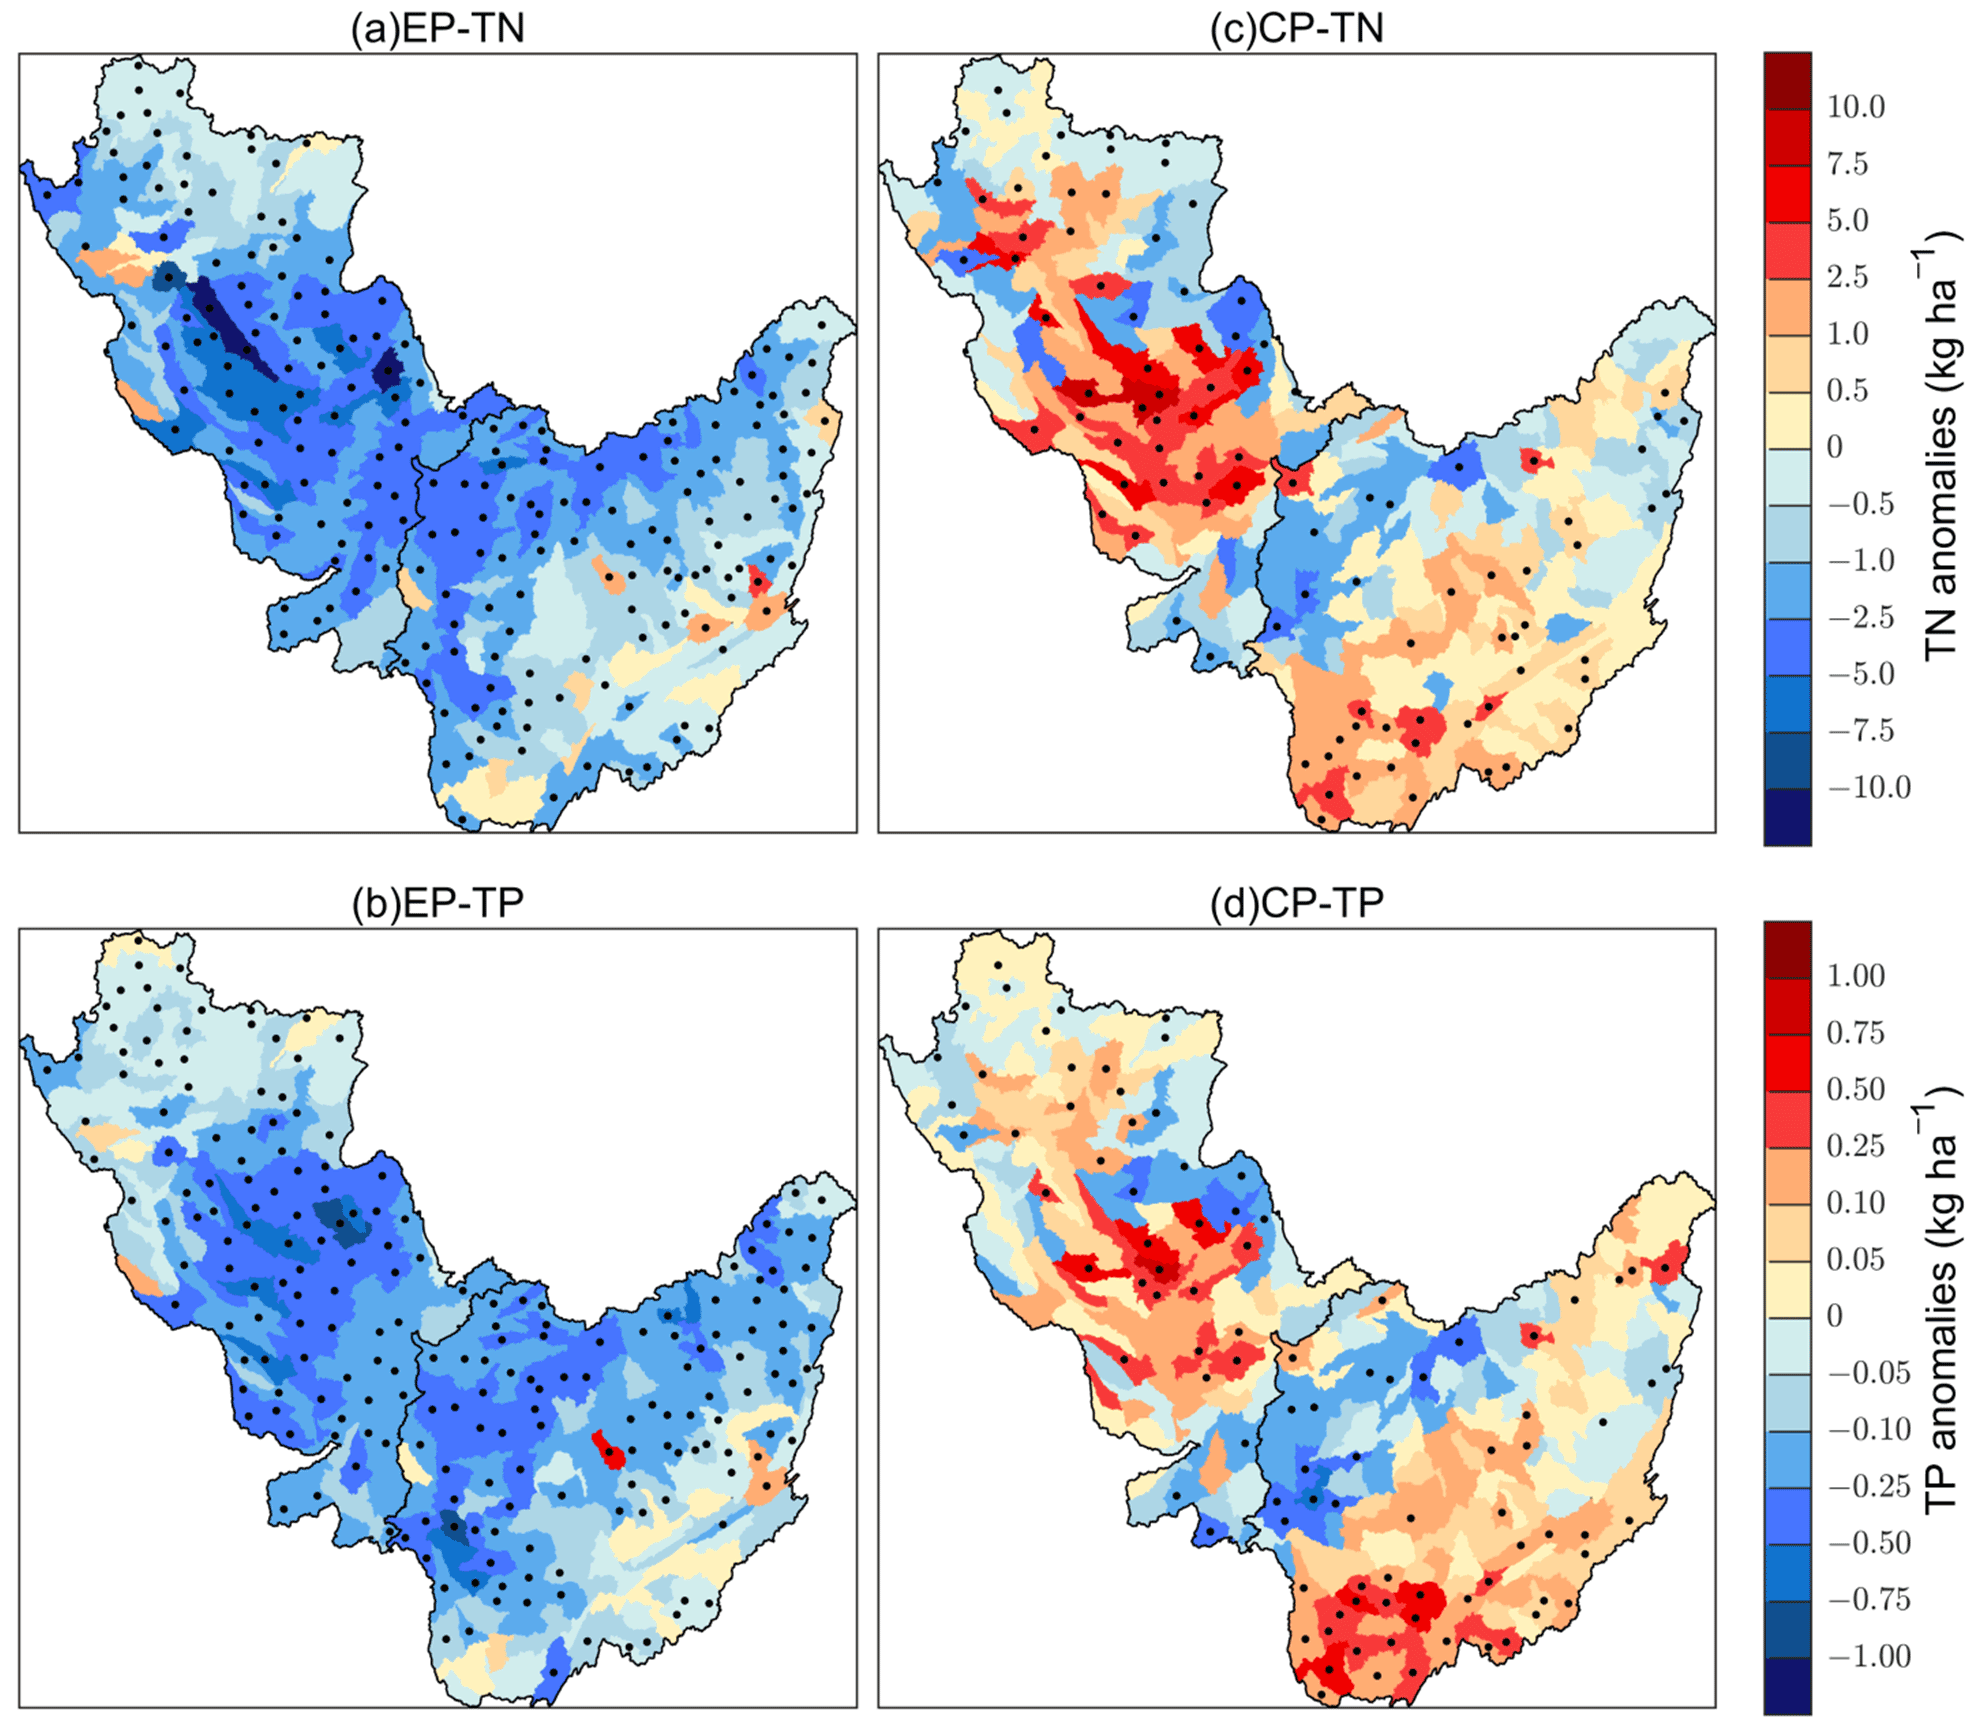
Figure 3Composite results of annual TN and TP anomalies (kg ha−1) in EP El Niño years (a, b) and in CP El Niño years (c, d) during the period of 1975–2016. Stippling denotes anomalies that are significantly different from zero at the 95 % confidence level based on the Monte Carlo test.
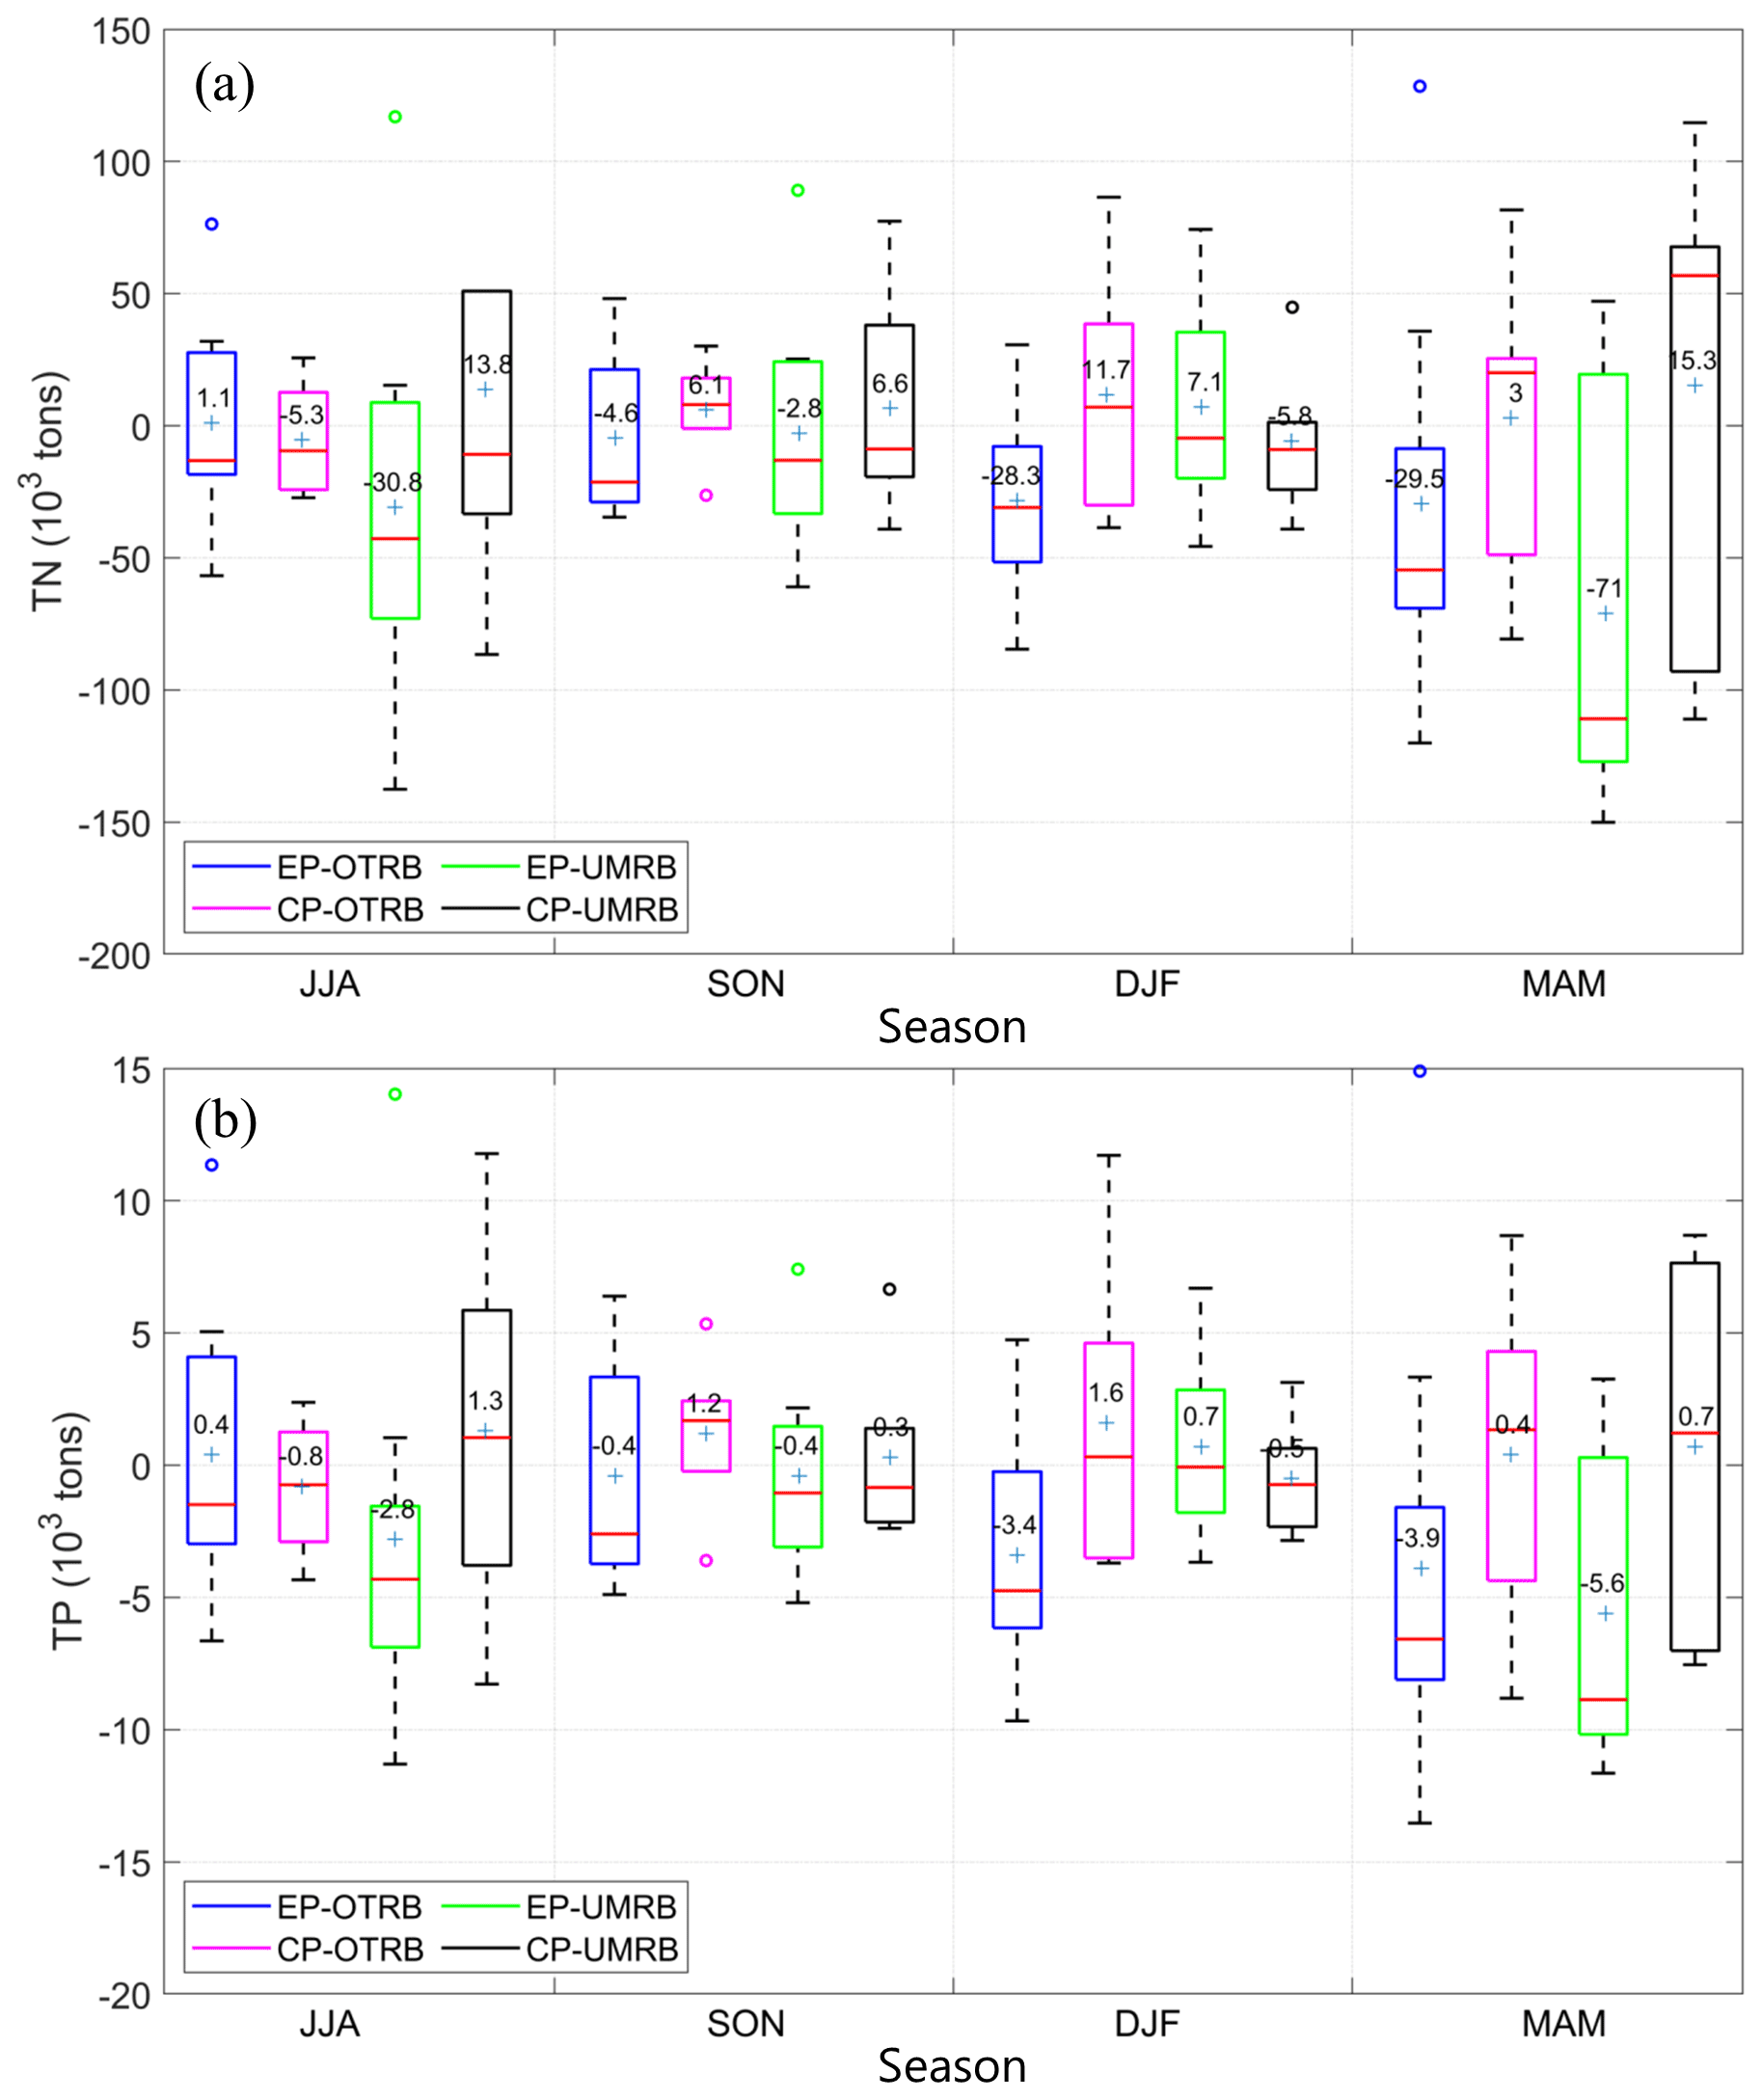
Figure 4Same as Fig. 2 but for seasonal scales, i.e., summer (June–August, JJA), autumn (September–November, SON), winter (December of the current year and January and February of the following year, DJF), and spring (March–May, MAM).
3.1.2 Seasonal composite
-
Water quality at the outlet
Figure 4a shows TN anomalies at the OTRB and UMRB outlets in each season during EP and CP ENYs. At the outlet of the OTRB, seasonal anomalies of the water quality reached the maximum when ENSO signals were the strongest (Fig. 4a). El Niño usually developed in boreal summer (June–August, JJA) and autumn (September–November, SON), peaked in winter (December of the current year and January and February of the following year, DJF), and decayed in spring (March–May, MAM; Trenberth, 1997; Li et al., 2011). Maximum changes in TN occurred in the winter and spring seasons during EP ENYs (decreased by 28.3 × 10³ and 29.5 × 10³ t, respectively; Fig. 4a). During CP ENYs, TN increased by 11.7 × 10³ t in winter and did not change much in the rest of the three seasons (spring, summer, and autumn) compared to that in the normal years (Fig. 4a). Seasonal TN anomalies at the outlet of the UMRB were different from those of the OTRB. Figure 4a shows that TN decreased by 71.0 × 10³ and 30.8 × 10³ t, respectively, in the spring and summer seasons during EP ENYs, but in winter and autumn, TN did not change much compared to normal years. Similarly, during CP ENYs, TN anomalies were greater in spring and summer, although TN anomalies became positive during CP ENYs, which is different from TN changes during EP ENYs (Fig. 4a).
Figure 4b demonstrates that the seasonal changes in TP during EP and CP ENYs were similar to those of TN in both OTRB and UMRB during EP ENYs. At the OTRB, the magnitudes of the TP reduction in boreal winter and spring were greater than those in the summer and autumn seasons during EP ENYs. During CP ENYs, TP anomalies were greater in both autumn and winter (Fig. 4b). This phenomenon was probably related to the different durations of the two types of El Niño. The mean duration of EP El Niño was about 15 months (Mo, 2010), and its impact on water quality could last into the following spring, while El Niño Modoki usually lasted for about 8 months (Mo, 2010; Yu et al., 2010). Therefore, the impacts of the CP El Niño on water quality usually ended in winter. Besides, at the UMRB, maximum changes in TP occurred in the spring and summer seasons during both EP and CP ENYs.
In summary, more seasons showed negative anomalies of water quality during EP ENYs, whereas more seasons showed positive anomalies during CP ENYs (Fig. 4). Consequently, the annual TN and TP anomalies over the Corn Belt region showed the opposite pattern during EP ENYs and CP ENYs (Fig.2).
-
Water quality at the subbasin scale
Water quality at the Corn Belt can vary in different locations/subbasins and change between seasons. Figure 5 shows spatial patterns of TN and TP anomalies at the OTRB and UMRB in each season during the CP and EP ENYs, separately. EP El Niño was characterized by negative TN and TP anomalies over most of the OTRB and UMRB for all seasons (Fig. 5a–d and i–l). Significant below-average TN and TP occurred in almost all of the UMRB and the eastern OTRB in the summer when EP El Niño was developing in the tropical Pacific, with maximum reductions up to −4.5 and −0.45 kg ha−1, respectively (Fig. 5a and i). The negative water quality anomalies moved to the southern UMRB and northern OTRB in the autumn (Fig. 5b and j). These negative anomalies further moved to the whole OTRB when EP El Niño was mature in the winter (Fig. 5c and k). This result generally agreed with previous findings of the El Niño impacts on the precipitation in the study area, which indicated that the precipitation in the Ohio Valley was sensitive to El Niño events and showed negative precipitation anomalies at EP ENYs (Mo, 2010; Twine et al., 2005). In spring, severe TN and TP deficits were most apparent almost all over the Corn Belt area (Fig. 5d and l).
In contrast, during CP ENYs, positive TN and TP anomalies were scattered in most of the Corn Belt region, with the highest TN and TP anomalies increase of up to 4.5 and 0.45 kg ha−1, respectively (Fig. 5e–h and m–p). In summer, northern UMRB and eastern OTRB were characterized by above-normal water quality (Fig. 5e and m). The positive TN and TP anomalies moved to the southern UMRB and the whole OTRB in the autumn (Fig. 5f and n). In winter, these positive anomalies were concentrated in the southern OTRB and northern UMRB (Fig. 5g and o). In the spring, abnormally high TN and TP mainly occurred in the southern part of the UMRB, while most of the positive and negative anomalies in the OTRB region were insignificant (Fig. 5h and p).
In conclusion, water quality anomalies showed opposite patterns during EP ENYs and CP ENYs on both annual and seasonal timescales in the Corn Belt region. Furthermore, EP El Niño seemed to have a greater and long-lasting impact on TN and TP than CP El Niño. Hence, treating the two as a single phenomenon was not appropriate when analyzing the impacts of ENSO on water quality.
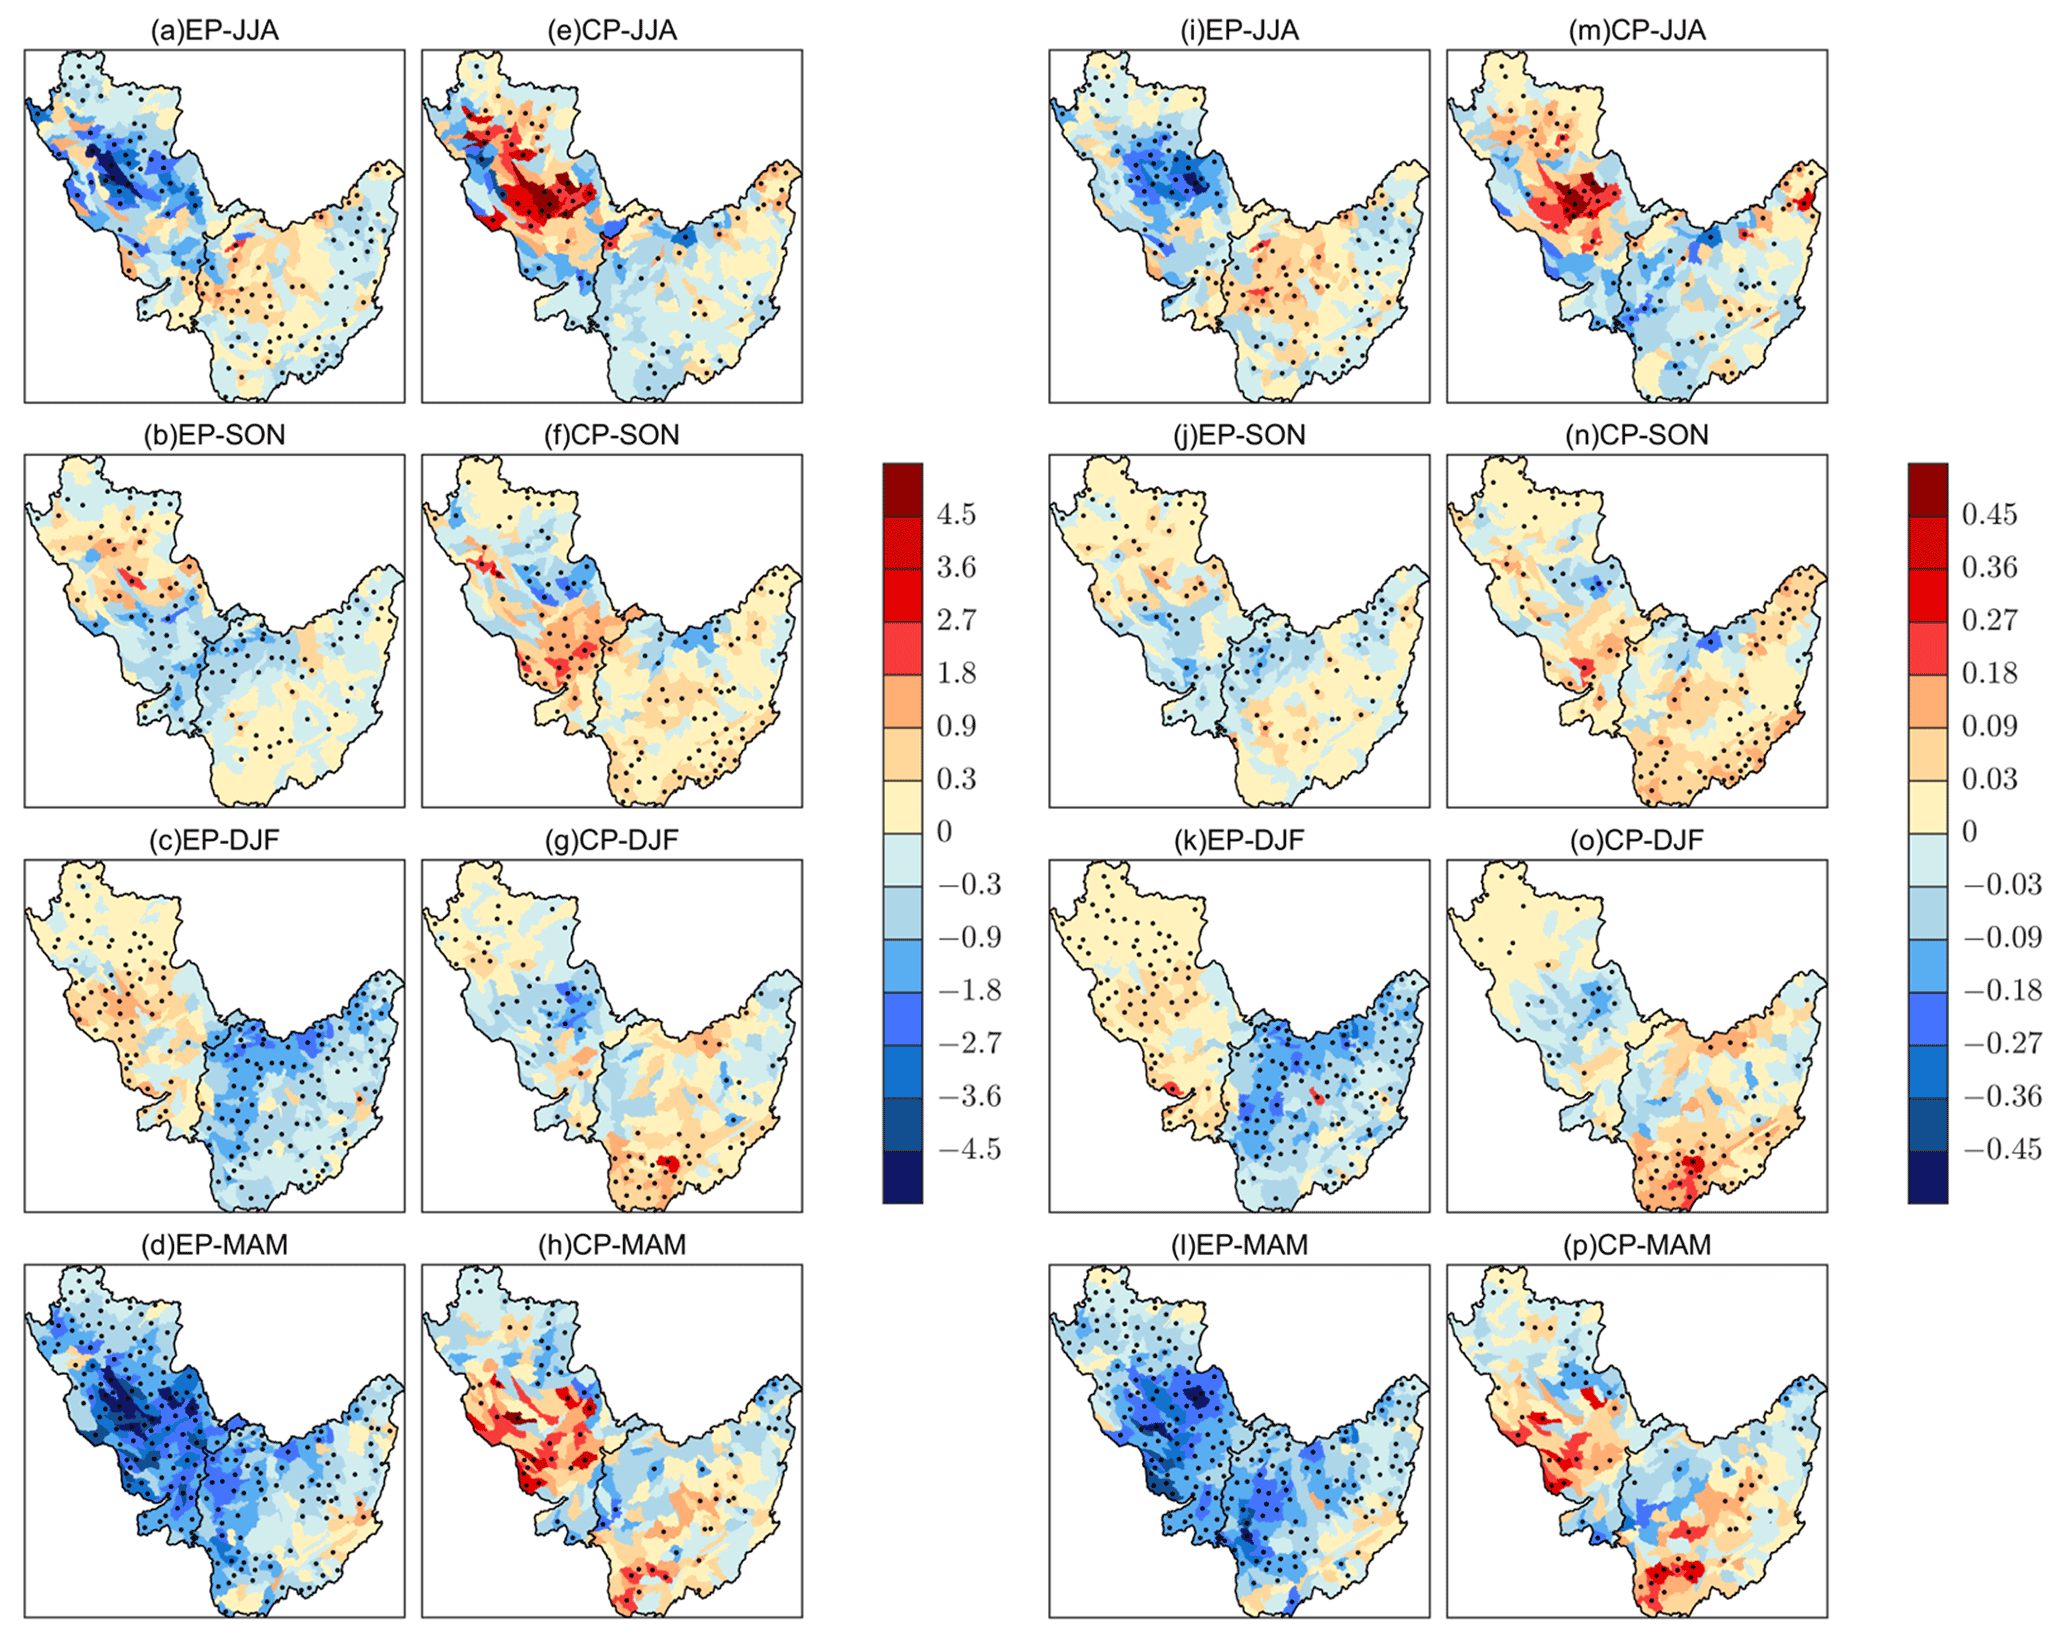
Figure 5Seasonal composite of (a–h) TN and (i–p) TP anomalies (kg ha−1) in summer (JJA) (a, i), autumn (SON) (b, j), winter (DJF) (c, k), and spring (MAM) (d, l) in EP El Niño years during the period of 1975–2016. Panels (e–h) and (m–p) are the same as panels (a–d) and (i–l) but for CP El Niño years. Stippling denotes anomalies that are significantly different from zero at the 95 % confidence level based on the Monte Carlo test.
3.2 Possible climate reasons for the water quality change during CP and EP El Niño events
As precipitation and temperature usually respond differently to the two types of El Niño events at different temporal and spatial scales (Li et al., 2011; Tan et al., 2020), we hereafter analyzed these climate factor impacts accordingly in the Corn Belt region.
3.2.1 Precipitation
Decreased precipitation in EP ENYs was one of the important reasons that improved water quality in the Corn Belt region. This finding could be shown in the spatial patterns of annual precipitation (Fig. 6a) and TN and TP anomalies (Fig. 3a and b). For example, significantly below-normal precipitation occurred in much of the OTRB and UMRB (278 out of 283 subbasins) during EP ENYs (Fig. 6a); thus, TN and TP were reduced in most parts of the Corn Belt (Fig. 3a and b). During CP ENYs, precipitation anomalies became positive in 226 out of 283 subbasins (Fig. 6c). Correspondingly, TN and TP concentrations were elevated compared to normal years (Fig. 3c and d). Spatially, there were more subbasins (98.2 %) and a larger area with negative precipitation anomalies in EP ENYs than positive anomalies (79.9 % subbasins) during CP ENYs in the Corn Belt, indicating that EP El Niño tended to have a much wider impact on precipitation and thus water quality than CP El Niño.
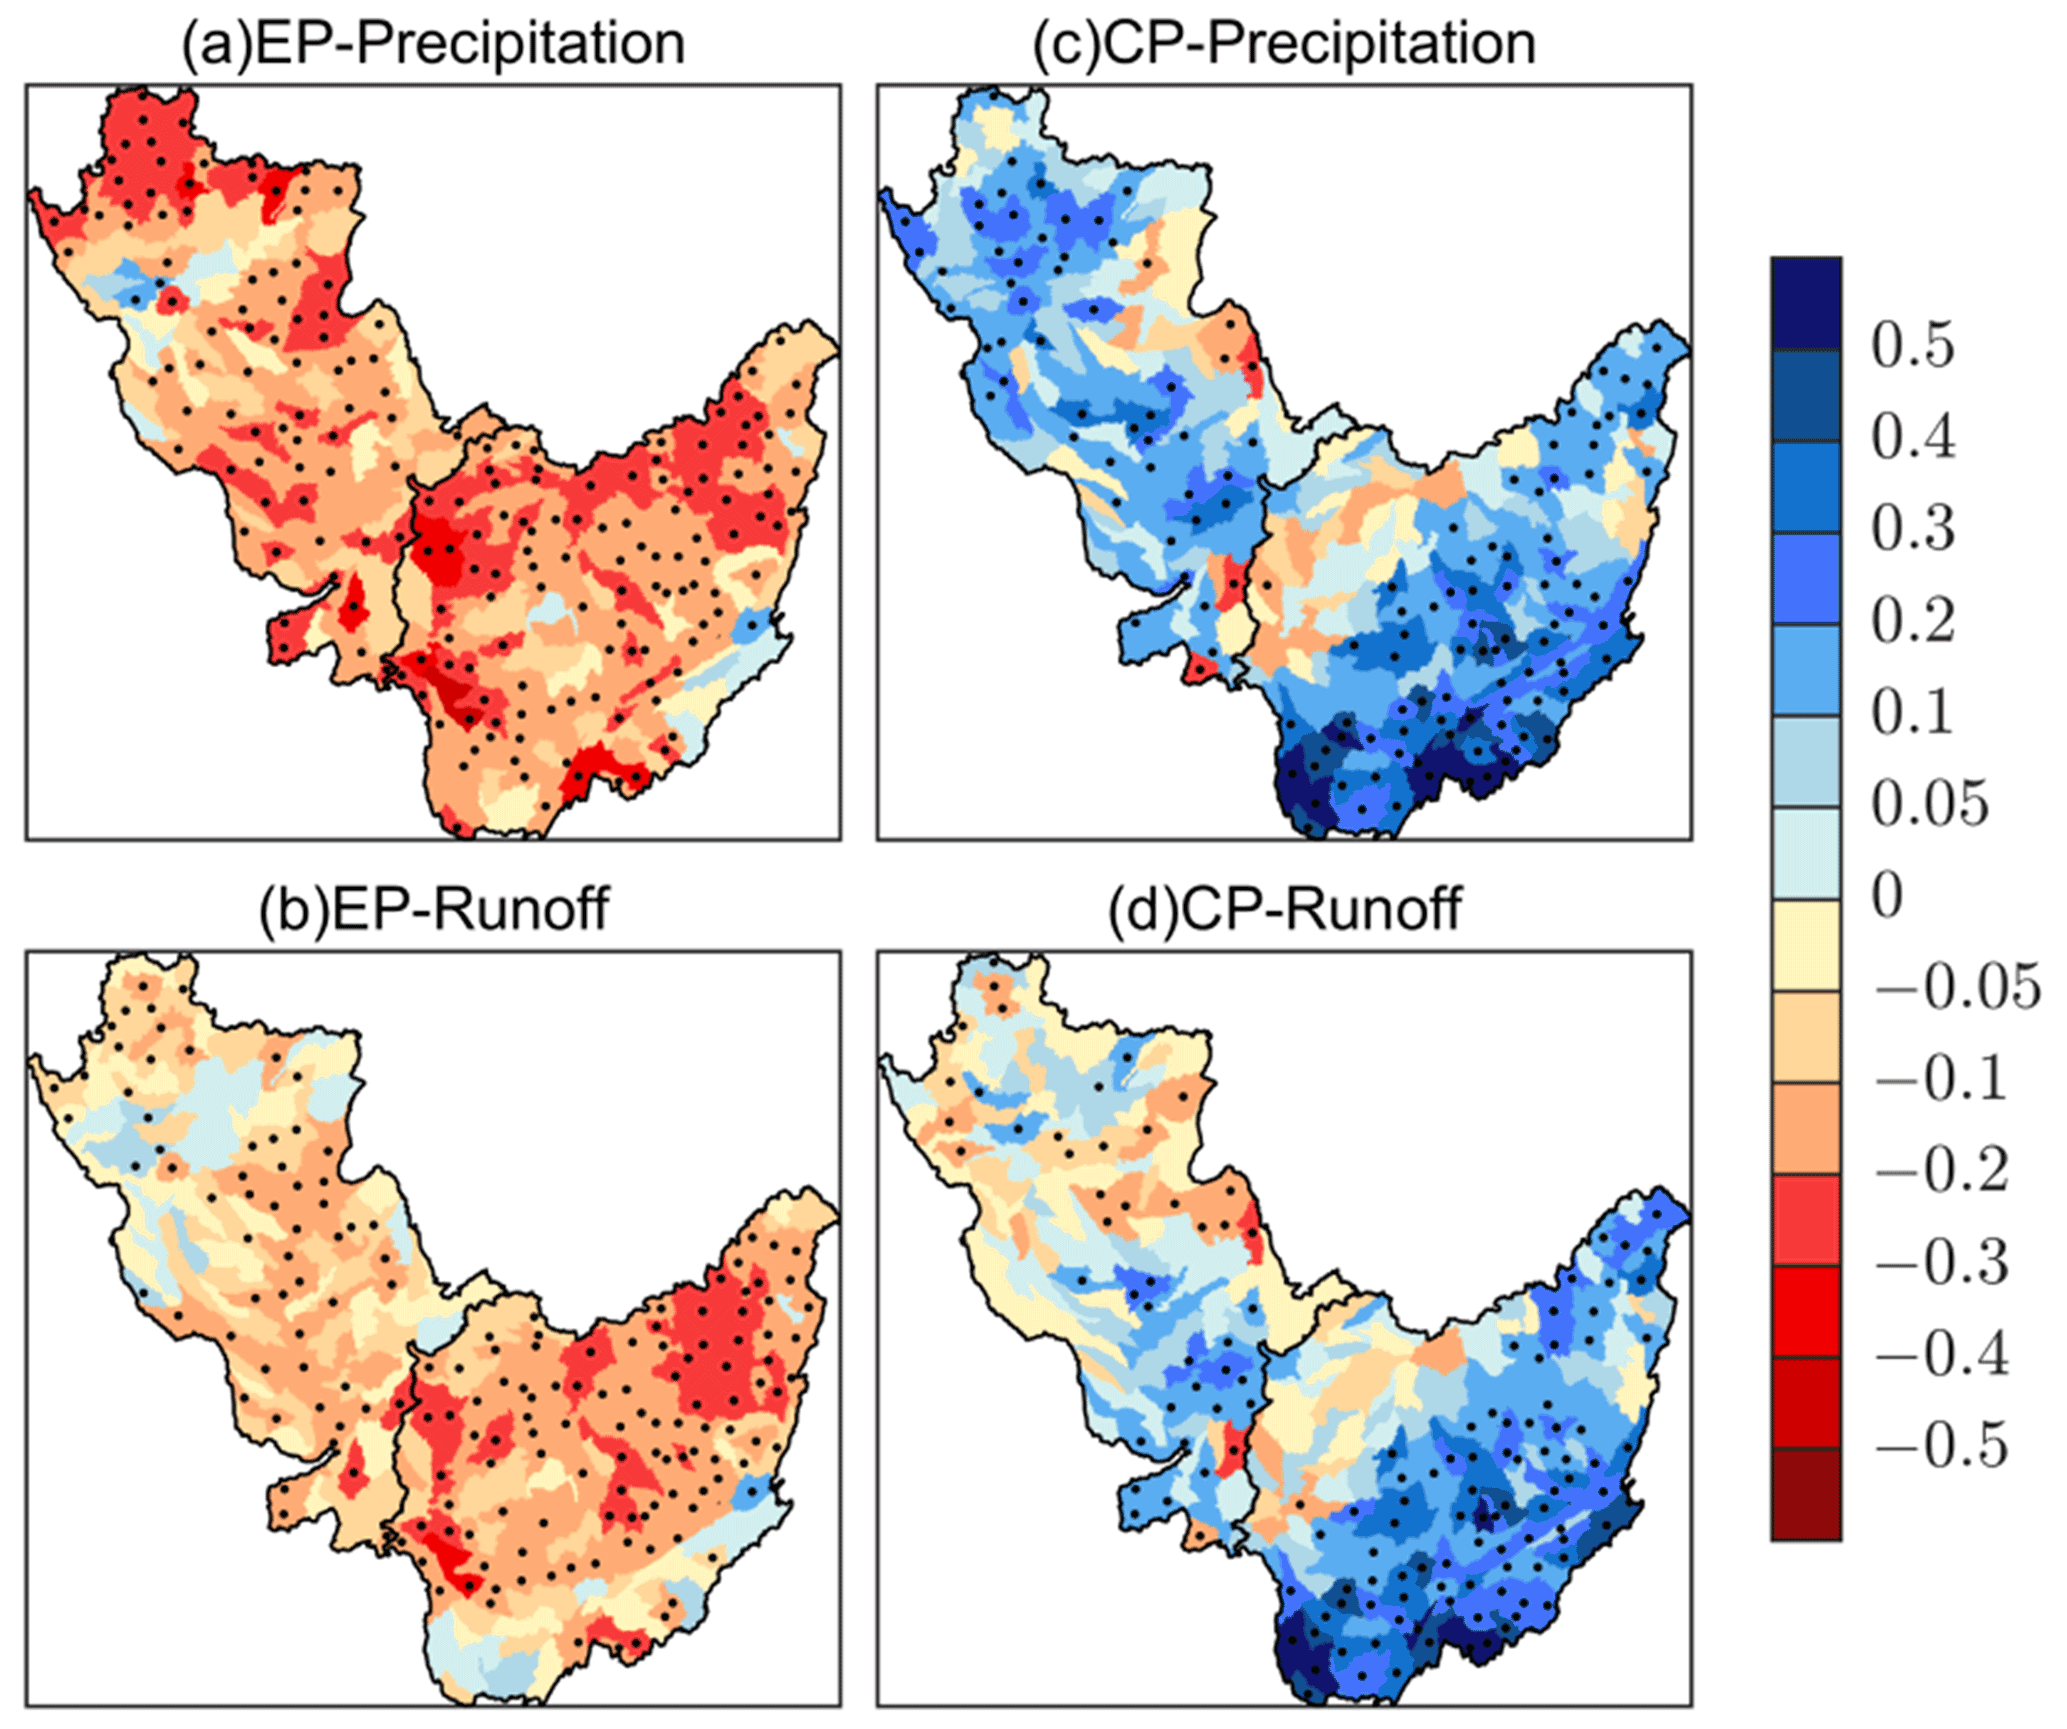
Figure 6Composite of annual precipitation and runoff anomalies (mm d−1) for the two types of El Niño events during the period of 1975–2016 (a, b) in EP El Niño years and (c, d) in CP El Niño years. Stippling denotes anomalies that are significantly different from zero at the 95 % confidence level based on the Monte Carlo test.
To better understand how precipitation affected water quality in the Corn Belt, variations in annual runoff during EP ENYs and CP ENYs were also discussed because nitrogen and phosphorus were transported by runoff (Neitsch et al., 2011), and precipitation was a very important source of runoff (Gassman et al., 2007). The overall patterns of runoff anomalies (Fig. 6b and d) were similar to those of precipitation anomalies (Fig. 6a and c) during the two types of El Niño events, with pattern correlations of 0.79 at OTRB and 0.75 at UMRB in EP ENYs and 0.96 and 0.77 in CP ENYs, respectively. Specifically, during EP ENYs, negative annual runoff anomalies occurred in most of the Corn Belt region (Fig. 6b), resulting in reduced TN and TP compared to normal years (Fig. 3a and b). In contrast, in CP ENYs, positive runoff anomalies were mainly concentrated in southern OTRB and UMRB (Fig. 6d). More nutrients were thus carried out by the runoff associated with above-normal precipitation in the area (Fig. 3c and d). We also noticed that EP El Niño had a wider influence on runoff than CP El Niño, as 71 more subbasins (259 vs. 188) and larger areas with significant runoff anomalies were found in EP ENYs than in CP ENYs (Fig. 6b and d), which is generally consistent with the spatial patterns of precipitation changes due to the El Niño events (Fig. 6a and c). The phenomena could partly explain why EP El Niño events tended to have greater impacts on the water quality than CP El Niño events at the outlets of the OTRB and UMRB.
Some differences also existed among precipitation, runoff, and nutrients. For precipitation and runoff, annual precipitation anomalies were greater than runoff anomalies in the El Niño years. For example, precipitation anomalies of many subbasins in northern UMRB were stronger than −0.2 mm d−1 during EP ENYs, but the magnitudes of runoff anomalies were weaker than −0.2 mm d−1 (Fig. 6a and b). During CP ENYs, most annual precipitation and runoff anomalies were positive, but the magnitudes of precipitation anomalies were generally higher than that of runoff anomalies (Fig. 6c and d). These findings suggested that the impact of El Niño on runoff was weakened by the land surface hydrological process. For runoff and nutrients, changes in runoff in El Niño years were greater in the OTRB than in the UMRB (Fig. 6b and d), whereas changes in TN and TP were smaller in the OTRB than in the UMRB during both EP ENYs and CP ENYs (Fig. 3). The discrepancies between annual runoff and nutrient anomalies in the OTRB and UMRB may be related to the presence of more cropland in the UMRB, where more fertilizers were used (P. Chen et al., 2021; see Sect. 4.1 for details). Hence, a relatively small change in runoff due to El Niño-induced precipitation could lead to large TN and TP variations.
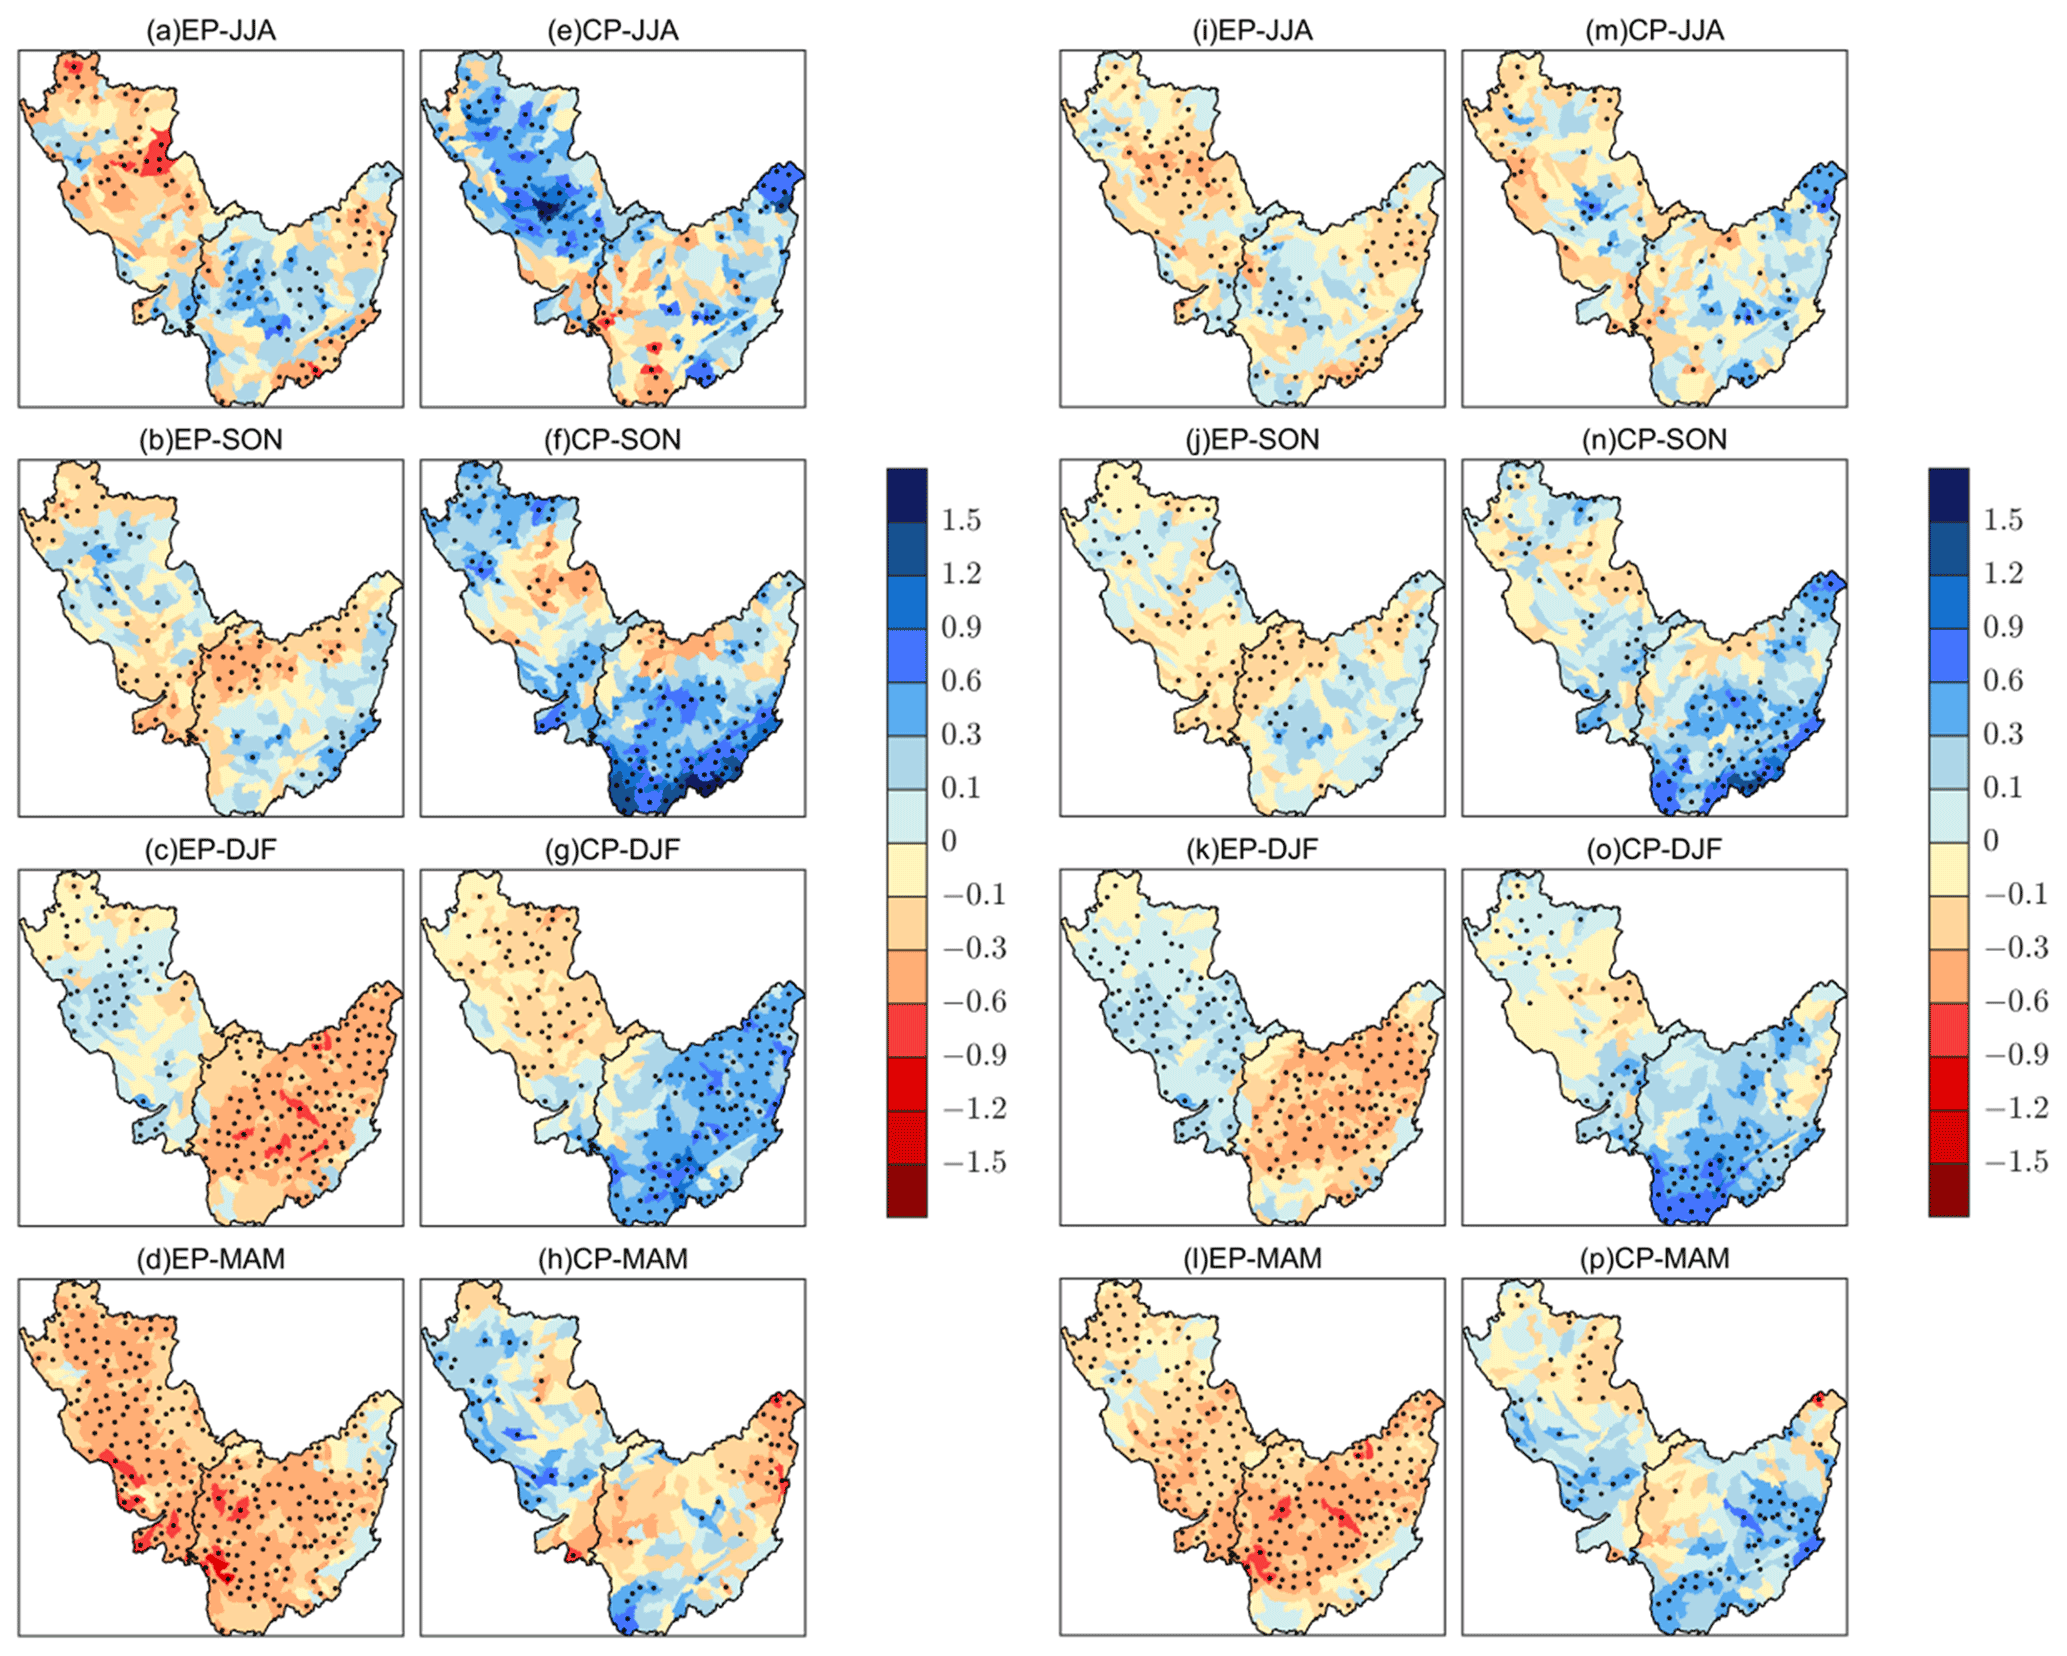
Figure 7Composite of seasonal (a–h) precipitation and (i–p) runoff anomalies (mm d−1) in JJA (a, i), SON (b, j), DJF (c, k), and MAM (d, l) in EP El Niño years during the period of 1975–2016. Panels (e–h) and (m–p) are the same as panels (a–d) and (i–l) but for CP El Niño years. Stippling denotes anomalies that are significantly different from zero at the 95 % confidence level based on the Monte Carlo test.
Seasonal patterns of precipitation and runoff anomalies (Fig. 7) further proved the impacts of precipitation on water quality through runoff during EP ENYs and CP ENYs. In summer, significantly below-normal precipitation occurred in almost all of the UMRB when EP El Niño was developing in the tropical Pacific, with maximum reductions in precipitation up to −0.9 mm d−1 in the region (Fig. 7a). The runoff anomaly pattern was much the same as that of precipitation but in a weaker magnitude at less than −0.6 mm d−1 in UMRB (Fig. 7i). At the same time, TN and TP decreased in the area (Fig. 5a and i) because fewer nutrients were carried out by the reduced runoff in summer (Fig. 7i). A similar change in the patterns of precipitation (Fig. 7b–d), runoff (Fig. 7j–l), and nutrients (Fig. 5b–d and j–l) could also be found in other seasons during EP ENYs. We noticed that negative runoff and precipitation anomalies reached their maximum in spring throughout the Corn Belt, leading to better water quality in the region compared to the normal years. CP El Niño events caused the opposite patterns of seasonal precipitation (Fig. 7e–h) and runoff anomalies (Fig. 7m–p) in the Corn Belt region. TN and TP thus increased in central and southern UMRB in the spring, summer, and autumn and most of OTRB from autumn to winter (Fig. 5e–h and m–p). Some differences also existed between precipitation and water quality in the UMRB, especially in spring and summer. During these two seasons, the variation in the seasonal precipitation at each subbasin was relatively uniform in both EP ENYs (Fig. 7a and d) and CP ENYs (Fig. 7e and h), but nutrient variations were high in some subbasins of the UMRB (Fig. 5a, d, e, h, i, l, m, and p). This phenomenon suggested that water quality was also influenced by local factors besides climate variables associated with El Niño events.
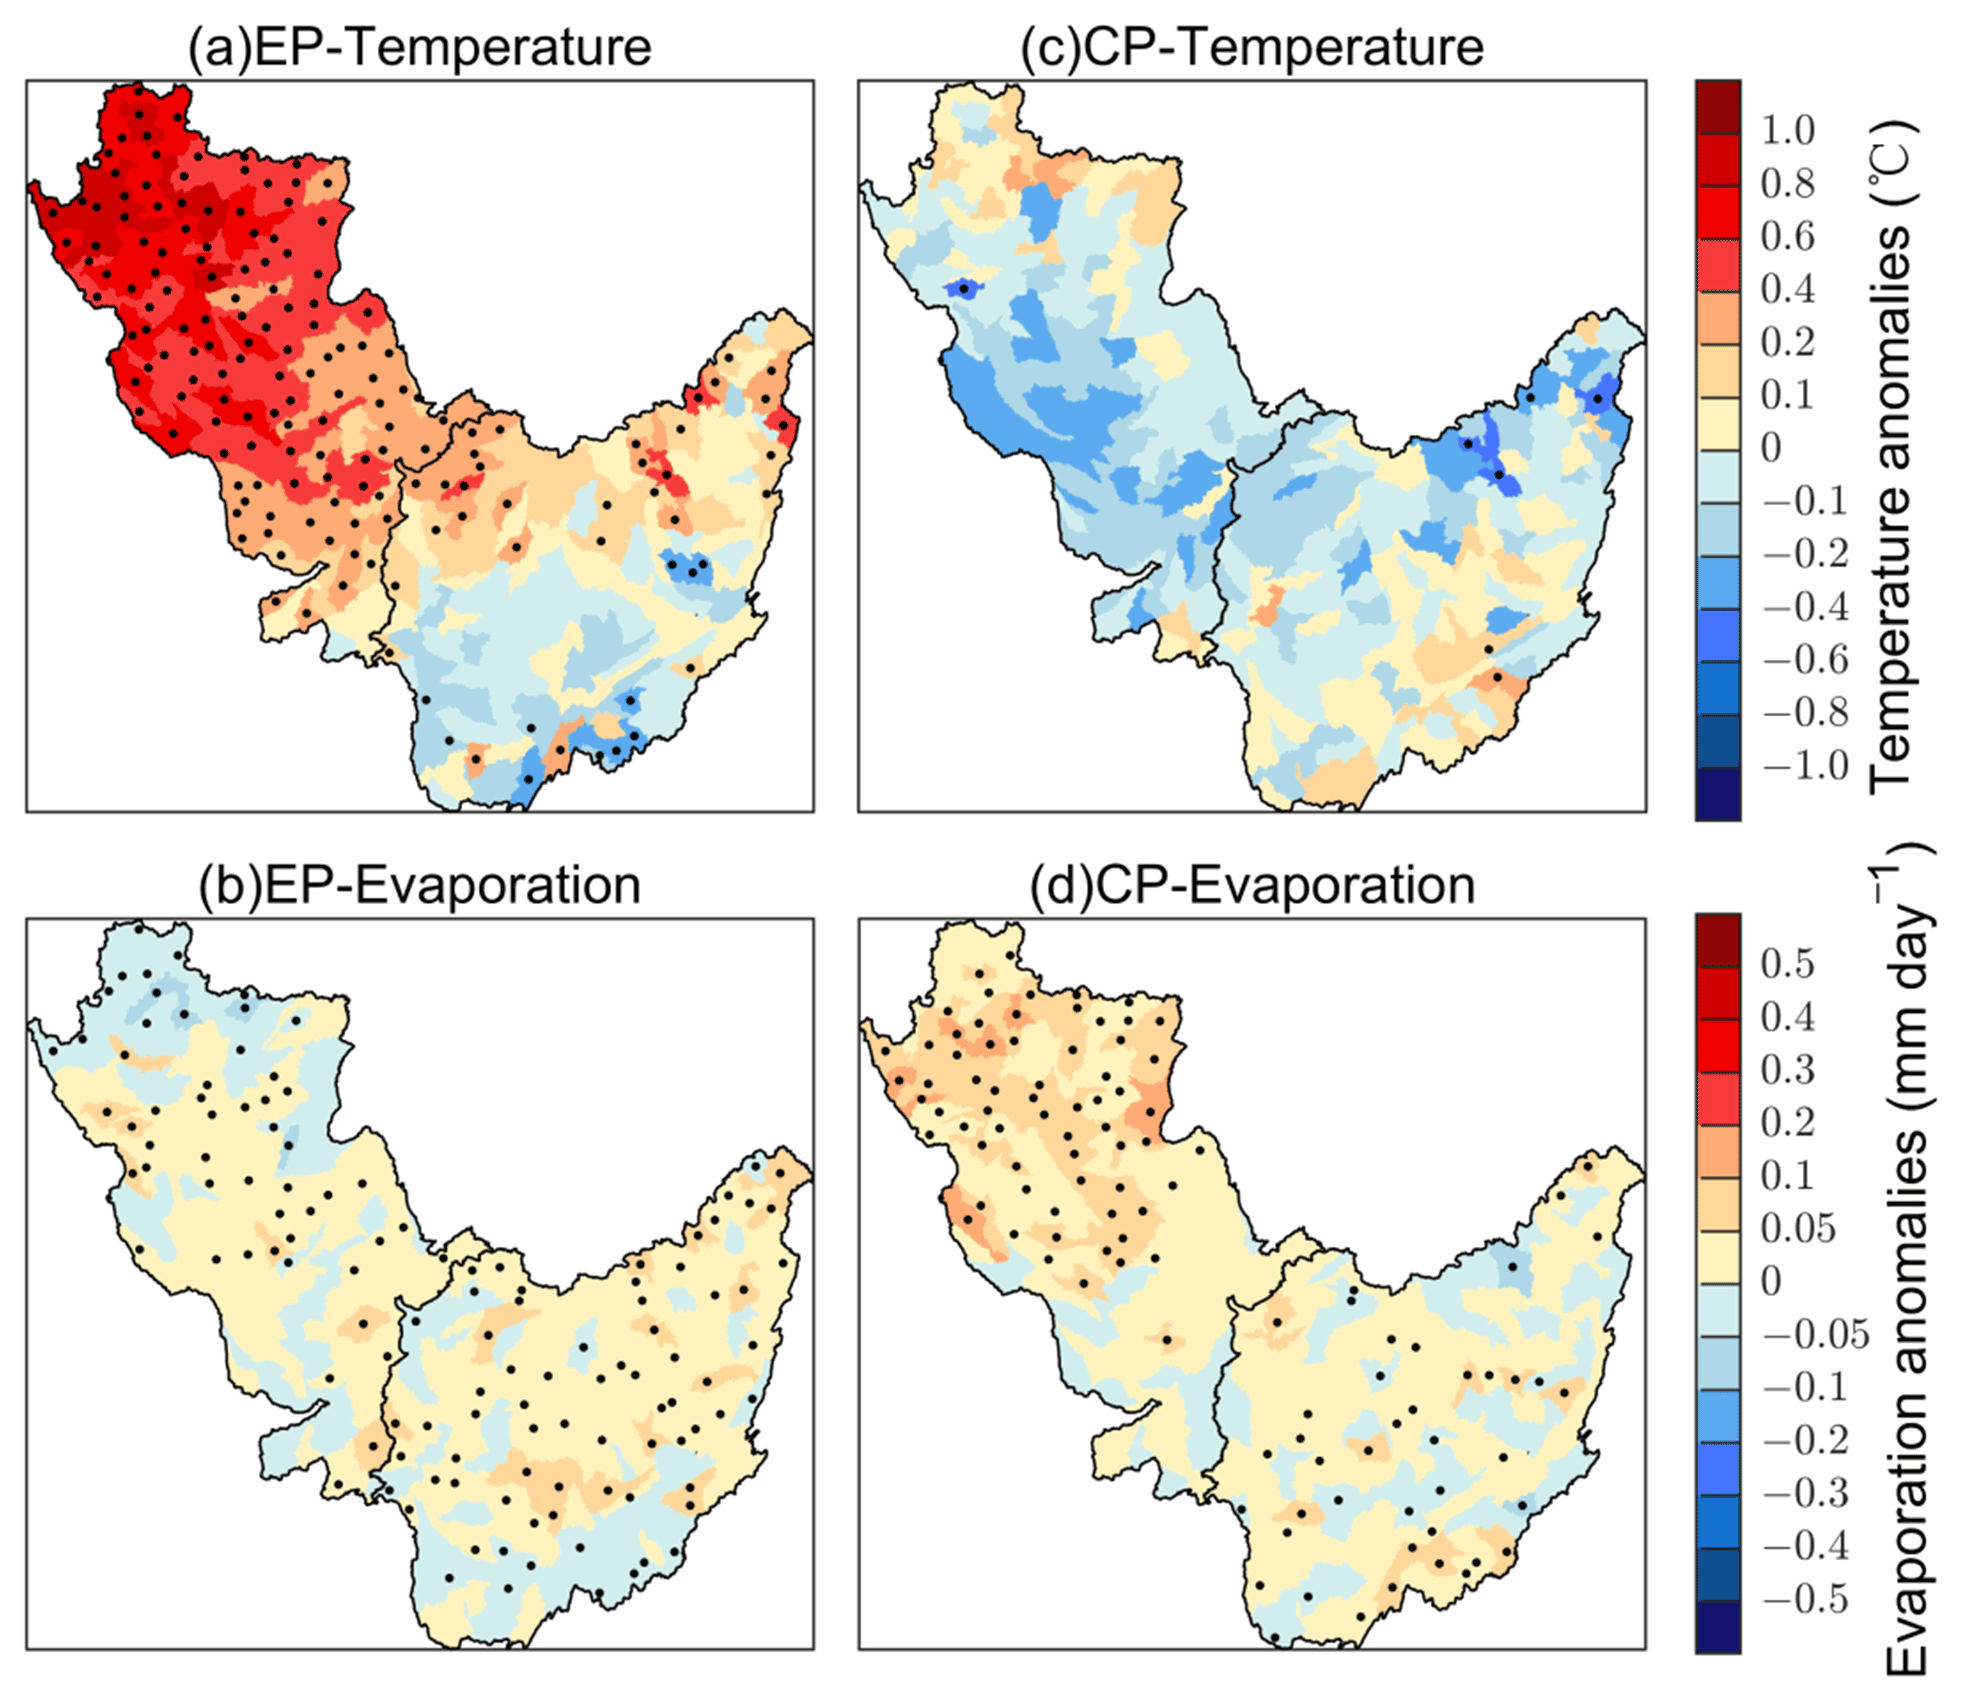
Figure 8Composite results of annual average temperature (a, c; ∘C) and evaporation (b, d; mm d−1) anomalies for EP El Niño years (a, b) and CP El Niño years (c, d), respectively. Stippling denotes anomalies that are significantly different from zero at the 95 % confidence level based on the Monte Carlo test.
3.2.2 Temperature
Temperature changes have previously been found to affect water quality by changing the evaporation process of the water cycle (Neitsch et al., 2011 Sun et al., 2011). Thus, how evaporation varied when associated with temperature change during El Niño events in the Corn Belt region was analyzed. Compared to normal years, the annual temperature increased over the UMRB but decreased in the OTRB, especially in the southern OTRB during EP ENYs (Fig. 8a). Evaporation slightly increased in most of OTRB (Fig. 8b), which did not share the same pattern with temperature change at the annual timescale (Fig. 8a). This might be due to the fact that temperature directly affected potential evapotranspiration (Neitsch et al., 2011), the ability of the atmosphere to remove water from the surface through both evaporation and transpiration, but the actual evaporation/evapotranspiration was also related to other variables such as the amount of water available for evaporation besides temperature. Enhanced evaporation further reduced runoff (Bales et al., 2018). Thus, decreased precipitation (Fig. 6a) and enhanced evaporation (Fig. 8b) during the EP ENYs would facilitate runoff decline and cause a much wider impact of EP El Niño events on water quality in the Corn Belt region (Fig. 3). During CP ENYs, temperature decreased insignificantly in most of the Corn Belt region (Fig. 8c). Evaporation increased in more subbasins over the UMRB (Fig. 8d). The enhanced evaporation (Fig. 8d) tended to offset, to some extent, the impact of higher-than-normal precipitation (Fig. 6c) on water quality during CP ENYs.
The impacts of the two climate factors, precipitation and temperature (through evaporation), on runoff were compared. During the El Niño years, the magnitude of the annual precipitation change was often greater than 0.1 mm d−1 (Fig. 6a and c), while most of the annual evaporation varied between −0.05 and 0.05 mm d−1 (Fig. 8b and d). This suggested that both precipitation and evaporation influence water quality through runoff, but precipitation seemed to play a more important role in altering water quality over the Corn Belt region during El Niño years.
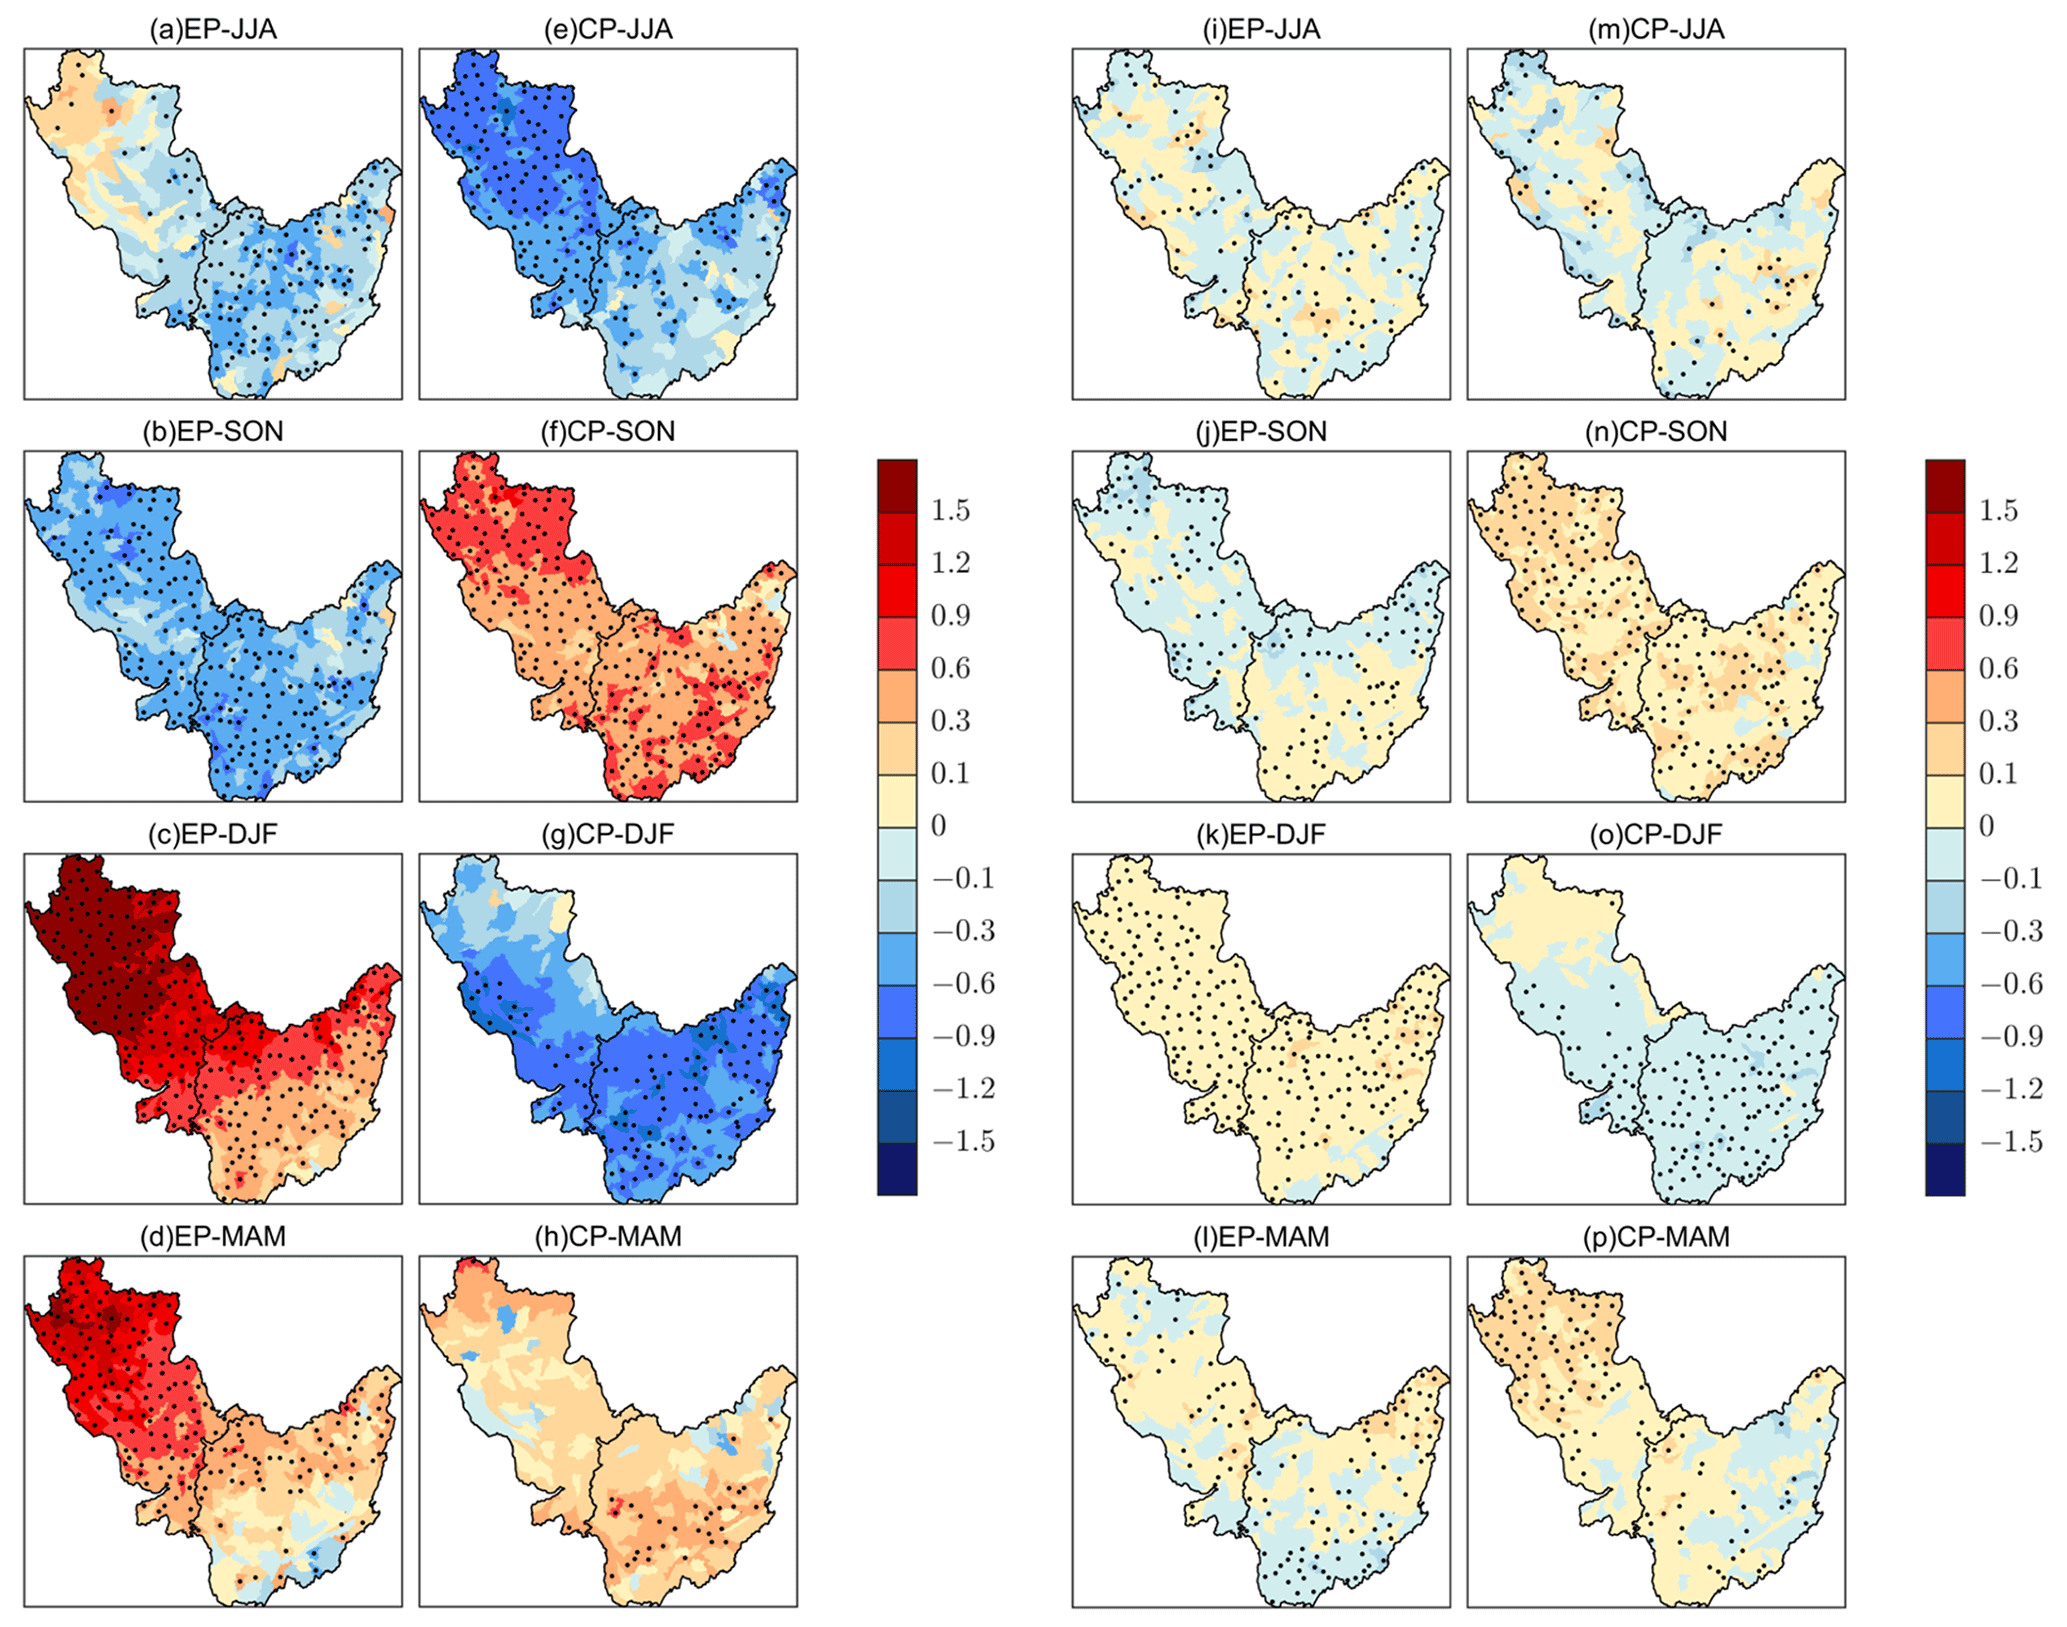
Figure 9Composite results of seasonal temperature (a–h; ∘C) and evaporation (i–p; mm d−1) anomalies in JJA (a, i), SON (b, j), DJF (c, k), and MAM (d, l) in EP El Niño years (a–d and i–l) and CP El Niño years (e–h and m–p), respectively. Stippling denotes anomalies that are significantly different from zero at the 95 % confidence level based on the Monte Carlo test.
Figure 9 shows seasonal patterns of temperature and evaporation anomalies during the CP and EP ENYs. In EP ENYs, significantly below-normal temperature occurred throughout the OTRB in the summer (Fig. 9a) and expanded to the entire Corn Belt region in the autumn (Fig. 9b). In winter and spring, significantly positive temperature anomalies were shown in the UMRB and most of OTRB (Fig. 9c and d). Corresponding to the seasonal temperature anomalies, evaporation varied for different seasons (Fig. 9i–l). In the summer and autumn, most subbasins had negative evaporation anomalies with decreased temperature (Fig. 9i and j), but in winter and spring, significantly above-normal evaporation occurred with increased temperature in EP ENYs (Fig. 9k and l). During CP ENYs, the summer season was characterized by negative temperature anomalies throughout the Corn Belt region, with the maximum anomalies up to −1.2 ∘C (Fig. 9e). Evaporation anomalies became negative in most subbasins (Fig. 9m). The temperature pattern was reversed in the autumn, with positive temperature and evaporation anomalies over the entire region (Fig. 9f and n). In winter, temperature anomalies became negative again (Fig. 9g), and evaporation also reduced, with significantly negative anomalies in the OTRB and central and southern UMRB (Fig. 9o). Temperature anomalies in spring were insignificant (Fig. 9h), most likely due to the short 8-month duration of the CP El Niño (Mo, 2010; Yu et al., 2010), although positive evaporation anomalies appeared in the northern UMRB (Fig. 9p).
4.1 Agricultural activity
This study focused on climate impact on water quality during EP ENYs and CP ENYs. We did not perform sensitivity experiments on agriculture activities. In the SWAT model runs, the distribution of agriculture activities pattern (2008 Cropland Data Layers (CDL); USDA-NASS, 2016) was kept the same during El Niño and normal years. Corresponding to the described agriculture activities, the corn-growing areas, i.e., the southern UMRB and northern OTRB, usually produced greater annual TN loads (> 10 kg N ha−1) and TP loads (> 1 kg P ha−1) (Fig. S5 in the Supplement). During EP ENYs, the nutrients were largely reduced (> 1 kg N ha−1 and > 0.1 kg P ha−1) in the two corn-growing regions because of decreased precipitation (< −0.1 mm d−1; Figs. 3a, b and 6a). In CP ENYs, the nutrient level increased in the southern UMRB (Fig. 3c and d), since enhanced precipitation in CP ENYs exacerbated the water quality in the area of heavy agriculture activities (Fig. 6c). Water quality in the OTRB region showed different change patterns from the agriculture activities, i.e., TN and TP decreased in the northern OTRB but increased in the southern OTRB (Fig. 3c and d). Such changes in water quality followed the precipitation change in the OTRB (Fig. 6c), demonstrating that the CP El Niño-induced precipitation change played a more important role in modulating water quality in OTRB.
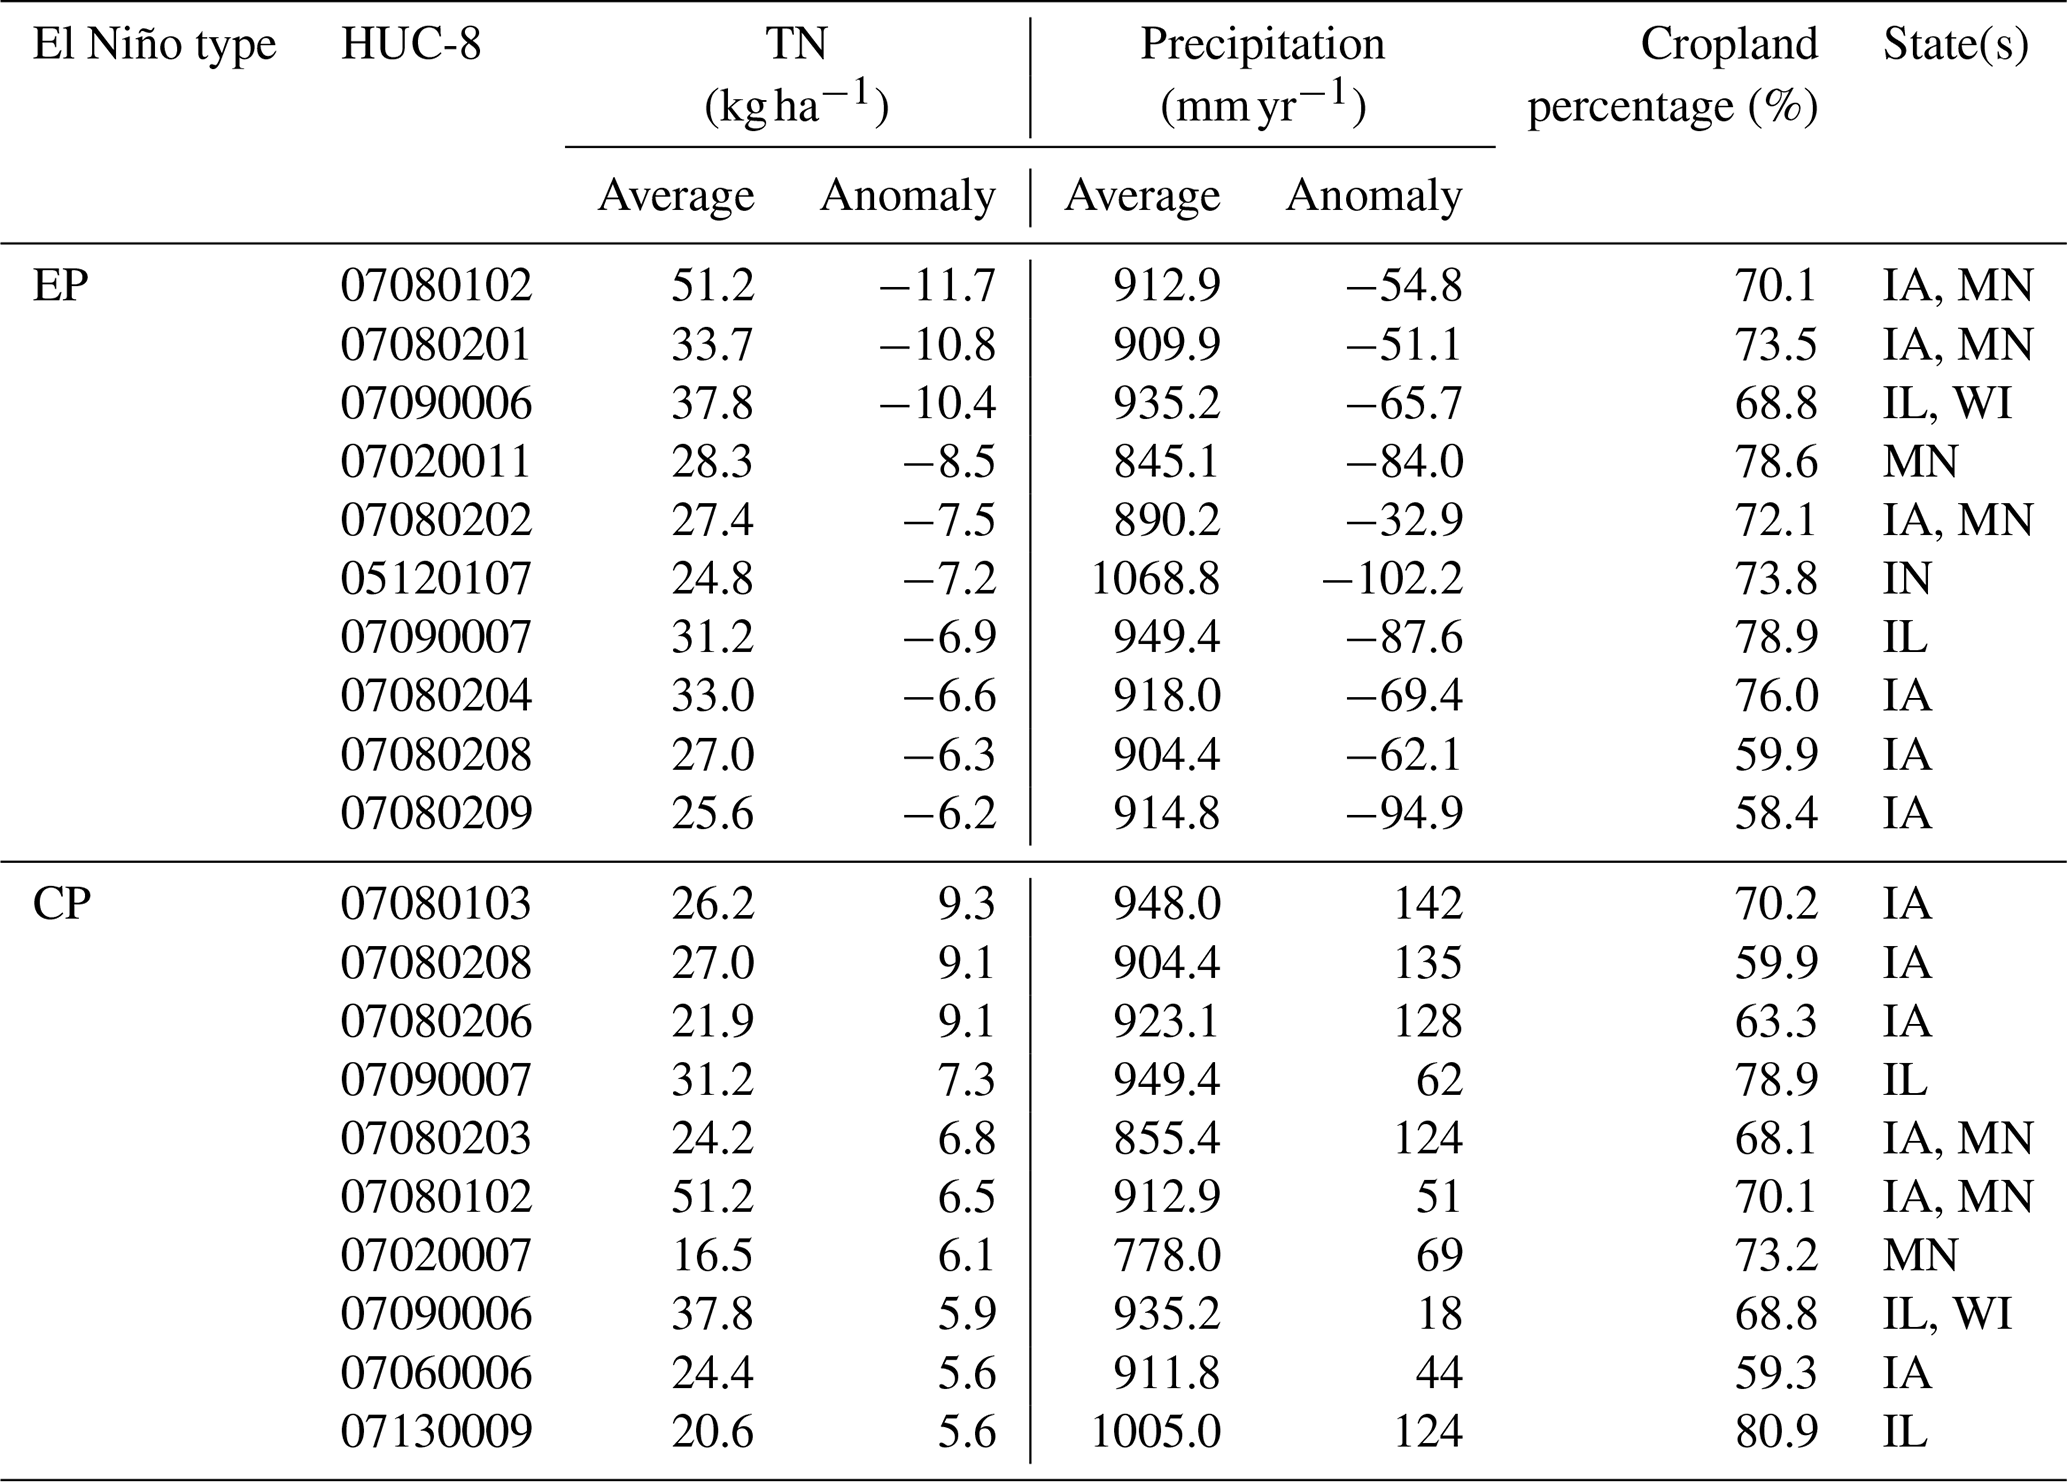
Table 4Information on the top 10 eight-digit Hydrologic Unit Codes (HUC-8) subbasins with the greatest TN anomalies during EP and CP El Niño years.
On seasonal scales, changes in the nutrient magnitudes were stronger in spring and summer, especially in UMRB (Fig. 5). The heavy loading of nutrients was related to the agriculture activities during the growth period of crops in the Corn Belt. The major crops here are corn and soybean, which are often planted and fertilized in May and harvested in October (Chiang et al., 2014). Hence, the higher nutrient levels were likely associated with the removal of fertilizers from the soil during spring and summer.
4.2 Equivalent impacts of CP and EP El Niño on water quality in specific watersheds
Section 3 discusses the impacts of El Niño on water quality at the outlets and subbasin scales. At the outlets, EP El Niño had a much greater impact on TN and TP than CP El Niño, both at annual and seasonal timescales. But at the subbasin scale, CP and EP El Niño could have equivalent impacts on water quality in specific watersheds, predominantly in Iowa (IA), Illinois (IL), Minnesota (MN), Wisconsin (WI), and Indiana (IN), which contributed the greatest amounts of nutrient change to the whole basin loads (Fig. 3). Table 4 listed the top 10 HUC-8 subbasins with the largest nutrient change during the two types of El Niño years. In EP ENYs, TN anomalies changed from 6.2 and 11.7 kg ha−1 among the top 10 HUC-8 subbasins, while in CP ENYs, TN anomalies changed from 5.6 and 9.3 kg ha−1 (Table 4). These changes in TN during classic El Niño and El Niño Modoki were comparable. An analysis of the top 10 HUC-8 subbasins with the largest TP change during the EP and CP El Niño illustrated similar results (not shown). These findings indicated that CP El Niño could have comparable impacts on TN and TP as that of EP El Niño at the hot spot subbasins, although EP El Niño had a much broader and longer impact on water quality at the outlets.
4.3 Biogeochemical process variation due to temperature change
The effect of temperature on water quality through affecting evaporation and runoff has been analyzed in Sect. 3.2.2. In fact, the temperature can also affect water quality through some biochemical processes of nutrients (Neitsch et al., 2011). In order to analyze the biogeochemical process variations due to temperature changes during EP and CP El Niño events, new analyses on nitrogen and phosphorus components, such as nitrate, organic nitrogen, soluble phosphorus, mineral phosphorus, and organic phosphorus have been carried out. Results from the analyses demonstrated that, compared to precipitation, temperature plays a secondary role in altering nutrient levels through biogeochemical processes. Taking nitrate as an example, we showed the composite results of annual and seasonal nitrate anomalies (Figs. S6 and S7 in the Supplement), respectively, during EP and CP El Niño events. Figures S6 and S7 indicate that the pattern of nitrate was more similar to that of precipitation (Figs. 6a, c and 7a–h) but different from that of temperature (Figs. 8a, c and 9a–h) in the Corn Belt region during El Niño events. This could be further confirmed by the pattern correlation results. The correlation coefficients of annual nitrate and precipitation were 0.47, 0.36, 0.22, and 0.39, respectively, at OTRB and UMRB during EP and CP El Niño events. The correlation coefficients between nitrate and temperature were relatively small (the coefficients were −0.15, 0.08, 0.30, and −0.31, respectively). The coefficient values altered between positive and negative at the two basins during EP and CP El Niño events. The inconsistent relationships between nitrate and temperature were mainly because the nitrate content could vary through nitrification, mineralization, denitrification, and plant uptake processes (Neitsch et al., 2011). When the temperature rises, the former two processes increase nitrate content, but the latter two decrease nitrate content. Thus, the final sign of the correlation coefficient between nitrate and temperature really depends on the dominant processes. Similar results were also found at seasonal scales (not shown). These results indicated that nitrate variations were dominated by precipitation variations in the two basins during EP and CP El Niño events, instead of temperature impacts on the biogeochemical processes. Similar results were also found for other nutrient components, such as organic nitrogen, soluble phosphorus, mineral phosphorus, and organic phosphorus (not shown).
4.4 Future water quality change
Existing studies suggested that CP El Niño episodes occurred more frequently in a warming climate (Yeh et al., 2009; Yu et al., 2010). We found that annual loads of TN and TP tend to increase in the Corn Belt region during CP ENYs in the current climate. As the CP El Niño frequency increases in the future, TN and TP loads would likely increase over the Corn Belt region even under the same agricultural conditions, indicating a possible deterioration of water quality in this region when the climate warms.
The spatial patterns of TN and TP anomalies during CP ENYs (Fig. S8 in the Supplement) also suggested that specific watersheds, predominantly in southern UMRB and western OTRB, such as Iowa, Illinois, Wisconsin, Indiana, and Kentucky, will likely experience the most increases in TN and TP loads in the future. Such information is critical to ensure proper decision-making for watershed protection.
4.5 Limitations and future work
The model evaluation suggested that SWAT reasonably captured the hydrological and water quality behaviors in the Corn Belt. However, this result could be influenced by the uncertainty in the model simulations. For example, the limited number of observation sites might bring uncertainties at the regional scales. The model was assessed by the best available observation data, and the good agreement between the calculations and observations at 15 sites showed that the model reasonably captured the changes in the water flow, TN, and TP. However, further assessment of the model is needed when more observations are available.
The impacts of irrigation on runoff and nutrient levels were not analyzed in the study due to a lack of irrigation data over the Corn Belt. Existing documents suggest that vast acreages of corn and soybeans are watered by center pivot irrigation in the region, which uses an apparatus that sprays water across a field with a 75 %–90 % efficiency; thus, irrigation water mostly infiltrates into the soil (Grassini et al., 2011, 2014; Green et al., 2018). In other words, precipitation likely plays a dominant role in runoff. We thus focus on the impact of precipitation on runoff and water quality in the study. Further discussions on irrigation are needed once detailed irrigation data are available.
In addition, as M. Chen et al. (2021) suggested that the CP El Niño needed to be further classified into CP I and CP II types due to the differences in sea surface temperature (SST) evolution patterns and climate impacts, the distribution of nutrients in these two CP El Niño events might also differ and therefore need to be further studied in the future.
The impacts of EP and CP El Niño events on water quality were investigated by using the SWAT model in the U.S. Corn Belt region. Calibration and validation results indicated that the simulated streamflow and water quality generally agreed with observations at most USGS gauges. Then, the common features of the annual and seasonal loads of TN and TP for the EP and CP El Niño events in the OTRB and UMRB were analyzed using a composite method based on the simulation results during 1975–2016.
Annual composite results suggested that TN and TP loads decreased by 13.1 % and 14.0 % during EP ENYs, respectively, whereas they increased by 3.3 % and 4.6 % during CP ENYs at the outlet of the OTRB, respectively. TN and TP also showed a similar pattern at the outlet of the UMRB (18.5 % and 19.8 % reductions during EP ENYs and 5.7 % and 4.4 % increases during CP ENYs, respectively). Furthermore, more subbasins showed negative annual anomalies of TN and TP during EP ENYs, with maximum reductions up to −11.7 and −0.9 kg ha−1, which were comparable to the normal year mean values (12.7 kg N ha−1 and 1.0 kg P ha−1, respectively), whereas they showed positive anomalies during CP ENYs.
Seasonal composite results confirmed that water quality anomalies showed opposite patterns during EP ENYs and CP ENYs, and the changes in the water quality matched the ENSO phases at the outlet of the OTRB. Maximum reduction of or increase in the nutrients during EP ENYs or CP ENYs, respectively, occurred in winter, the peak season of El Niño. At the outlet of the UMRB (corn-growing region), TN and TP anomalies were also influenced by agriculture activities and became greater in spring and summer during both EP ENYs and CP ENYs, consistent with the distribution of rainfall changes in the basin. These results suggested that small changes in climate variables such as precipitation in the growing season could have greater impacts on water quality in the UMRB during El Niño events.
Our analysis also found that, at the outlets of UMRB and OTRB, EP El Niño had a much greater impact on TN and TP than CP El Niño at both annual and seasonal timescales. But CP El Niño could have comparable impacts on water quality to that of EP El Niño at specific watersheds or hot spots, predominantly in Iowa, Illinois, Minnesota, Wisconsin, and Indiana, which contributed the greatest amounts of nutrient change to the whole basin loads.
Examination of the climate factors/processes on water quality change indicated that El Niño-induced precipitation and temperature changes altered runoff and evaporation and thus TN and TP in both UMRB and OTRB on annual and seasonal timescales and at the outlet and subbasin scales. It is also found that nutrient levels were largely determined by precipitation through runoff during both EP and CP ENYs, especially at the outlet, as precipitation was a major source of runoff, and nitrogen and phosphorus components were transported by runoff. At the subbasin scale, water quality was affected by the combination of precipitation and agricultural activities, especially in the UMRB during the growing season.
In the future, when the climate continues to warm, the CP El Niño episode is projected to occur more frequently, and TN and TP loads might increase in the Corn Belt region even under the same agricultural conditions, while water quality would generally become better in EP El Niño years. The findings from this study may help ensure proper decision-making for watershed protection and offer possible ways to address anticipated water quality change associated with El Niño events.
Data are available upon request to the corresponding author.
The supplement related to this article is available online at: https://doi.org/10.5194/hess-26-4875-2022-supplement.
WL and PC designed the research. PC and KH performed the data collection and model calculation. WL and PC contributed to the interpretation of the results. PC and WL wrote the paper.
The contact author has declared that none of the authors has any competing interests.
Publisher's note: Copernicus Publications remains neutral with regard to jurisdictional claims in published maps and institutional affiliations.
We thank Yongping Yuan, for the suggestions on simulations of water quality in the OTRB and UMRB.
The first author has been supported by the Shanxi Province Science Foundation for Youths, China (grant nos. 202103021223106, 202103021223079, and 20210302124458), the Research Project Supported by Shanxi Scholarship Council of China (grant nos. 2022-080 and 2021-051), the Shanxi Province Water Science and Technology Research and Promotion Project, China (grant nos. 2022GM023 and 2022GM017), the National Key Research and Development Program, China (grant no. 2018YFC0406406), the China Scholarship Council (grant no. 201806935023), the Institute–Local Cooperation Project of the Chinese Academy of Engineering (grant no. 2020SX8), the Government Financial Grants Project, China (grant no. ZNGZ2015-036), the Key Research and Development Program (Social Development Field) of Shanxi Province, China (grant no. 201903D321052), and the Natural Science Foundation of Shanxi Province, China (grant nos. 201901D111059 and 201901D111060).
This paper was edited by Stacey Archfield and reviewed by two anonymous referees.
Abbaspour, H., Saeidi-Sar, S., Afshari, H., and Abdel-Wahhab, M. A.: Tolerance of Mycorrhiza infected Pistachio (Pistacia vera L.) seedling to drought stress under glasshouse conditions, J. Plant Physiol., 169, 704–709, https://doi.org/10.1016/j.jplph.2012.01.014, 2012.
Afonso de Oliveira Serrão, E., Silva, M. T., Ferreira, T. R., Paiva de Ataide, L. C., Assis dos Santos, C., Meiguins de Lima, A. M., de Paulo Rodrigues da Silva, V., de Assis Salviano de Sousa, F., and Cardoso Gomes, D. J.: Impacts of land use and land cover changes on hydrological processes and sediment yield determined using the SWAT model, Int. J. Sediment Res., 37, 54–69, https://doi.org/10.1016/j.ijsrc.2021.04.002, 2022.
Arnold, J. G., Srinivasan, R., Muttiah, R. S., and Williams, J. R.: Large area hydrologic modeling and assessment part I: Model development, J. Am. Water Resour. Assoc., 34, 73–89, https://doi.org/10.1111/j.1752-1688.1998.tb05961.x, 1998.
Baker, N. T.: Tillage practices in the conterminous United States, 1989–2004 – Datasets aggregated by watershed, Data Series 573, U.S. Geological Survey, U.S. Department of the Interior, http://pubs.usgs.gov/ds/ds573/pdf/dataseries573final.pdf (last access: 1 September 2021), 2011.
Bales, R. C., Goulden, M. L., Hunsaker, C. T., Conklin, M. H., Hartsough, P. C., O'Geen, A. T., Hopmans, J. W., and Safeeq, M.: Mechanisms controlling the impact of multi-year drought on mountain hydrology, Sci. Rep.-UK, 8, 690, https://doi.org/10.1038/s41598-017-19007-0, 2018.
Chaplot, V., Saleh, A., Jaynes, D. B., and Arnold, J.: Predicting water, sediment and NO3-N loads under scenarios of land-use and management practices in a flat watershed, Water Air Soil Poll., 154, 271–293, https://doi.org/10.1023/B:WATE.0000022973.60928.30, 2004.
Chen, M., Chang, T. H., Lee, C. T., Fang, S. W., and Yu, J. Y.: A study of climate model responses of the western Pacific subtropical high to El Niño diversity, Clim. Dynam., 56, 581–595, https://doi.org/10.1007/s00382-020-05500-2, 2021.
Chen, P., Yuan, Y., Li, W., LeDuc, S. D., Lark, T. J., Zhang, X., and Clark, C.: Assessing the Impacts of Recent Crop Expansion on Water Quality in the Missouri River Basin Using the Soil and Water Assessment Tool, J. Adv. Model. Earth Sy., 13, e2020MS002284, https://doi.org/10.1029/2020MS002284, 2021.
Chiang, L. C., Yuan, Y., Mehaffey, M., Jackson, M., and Chaubey, I.: Assessing SWAT's performance in the Kaskaskia River watershed as influenced by the number of calibration stations used, Hydrol. Process., 28, 676–687, https://doi.org/10.1002/hyp.9589, 2014.
Gassman, P. W., Reyes, M. R., Green, C. H., and Arnold, J. G.: The soil and water assessment tool: Historical development, applications, and future research directions, T. ASABE, 50, 1211–1250, 2007.
Gershunov, A.: ENSO influence on intraseasonal extreme rainfall and temperature frequencies in the contiguous United States: Implications for long-range predictability, J. Climate, 11, 3192–3203, https://doi.org/10.1175/1520-0442(1998)011<3192:EIOIER>2.0.CO;2, 1998.
Grassini, P., Yang, H., Irmak, S., Thorburn, J., Burr, C., and Cassman, K. G.: High-yield irrigated maize in the Western U. S. Corn Belt: II. Irrigation management and crop water productivity, Field Crop. Res., 120, 133–141, https://doi.org/10.1016/j.fcr.2010.09.013, 2011.
Grassini, P., Torrion, J. A., Cassman, K. G., Yang, H. S., and Specht, J. E.: Drivers of spatial and temporal variation in soybean yield and irrigation requirements in the western US Corn Belt, Field Crop. Res., 163, 32–46, https://doi.org/10.1016/j.fcr.2014.04.005, 2014.
Green, T. R., Kipka, H., David, O., and McMaster, G. S.: Where is the USA Corn Belt, and how is it changing?, Sci. Total Environ., 618, 1613–1618, https://doi.org/10.1016/j.scitotenv.2017.09.325, 2018.
Johnson, M. V. V., Norfleet, M. L., Atwood, J. D., Behrman, K. D., Kiniry, J. R., Arnold, J. G., White, M. J., and Williams, J.: The Conservation Effects Assessment Project (CEAP): A national scale natural resources and conservation needs assessment and decision support tool, IOP Conf. Ser. Earth and Environmental Science, 25, 012012, https://doi.org/10.1088/1755-1315/25/1/012012, 2015.
Kao, H. Y. and Yu, J. Y.: Contrasting Eastern-Pacific and Central-Pacific types of ENSO, J. Climate, 22, 615–632, https://doi.org/10.1175/2008JCLI2309.1, 2009.
Keener, V. W., Feyereisen, G. W., Lall, U., Jones, J. W., Bosch, D. D., and Lowrance, R.: El-Niño/Southern Oscillation (ENSO) influences on monthly NO3 load and concentration, stream flow and precipitation in the Little River Watershed, Tifton, Georgia (GA), J. Hydrol., 381, 352–363, https://doi.org/10.1016/j.jhydrol.2009.12.008, 2010.
Kellner, O. and Niyogi, D.: Climate variability and the U. S. corn belt: Enso and AO episode-dependent hydroclimatic feedbacks to corn production at regional and local scales, Earth Interact., 19, 1–32, https://doi.org/10.1175/EI-D-14-0031.1, 2015.
Kumar, K. K., Rajagopalan, B., Hoerling, M., Bates, G., and Cane, M.: Unraveling the mystery of Indian monsoon failure during El Niño, Science (80-), 314, 115–119, https://doi.org/10.1126/science.1131152, 2006.
Laken, B. A. and Čalogović, J.: Composite analysis with monte carlo methods: An example with cosmic rays and clouds, J. Space Weather Space Clim., 3, A29, https://doi.org/10.1051/swsc/2013051, 2013.
Larkin, N. K. and Harrison, D. E.: On the definition of El Niño and associated seasonal average U. S. weather anomalies, Geophys. Res. Lett., 32, 1–4, https://doi.org/10.1029/2005GL022738, 2005.
Lee, S. K., Mapes, B. E., Wang, C., Enfield, D. B., and Weaver, S. J.: Springtime ENSO phase evolution and its relation to rainfall in the continental U. S., Geophys. Res. Lett., 41, 1673–1680, https://doi.org/10.1002/2013GL059137, 2014.
Li, W., Zhang, P., Ye, J., Li, L., and Baker, P. A.: Impact of two different types of El Niño events on the Amazon climate and ecosystem productivity, J. Plant Ecol., 4, 91–99, https://doi.org/10.1093/jpe/rtq039, 2011.
Mississippi River/Gulf of Mexico Watershed Nutrient Task Force: Gulf Hypoxia: Action Plan 2008 for Reducing, Mitigating and Controlling Hypoxia in the Northern Gulf of Mexico and Improving Water Quality in the Mississippi River Basin, in Hypoxia in the Northern Gulf of Mexico, Washington, D.C., U.S., 265–305, 2008.
Mo, K. C.: Interdecadal modulation of the impact of ENSO on precipitation and temperature over the United States, J. Climate, 23, 3639–3656, https://doi.org/10.1175/2010JCLI3553.1, 2010.
Moriasi, D. N., Gitau, M. W., Pai, N., and Daggupati, P.: Hydrologic and water quality models: Performance measures and evaluation criteria, T. ASABE, 58, 1763–1785, https://doi.org/10.13031/trans.58.10715, 2015.
Neitsch, S. L., Arnold, J. G., Kiniry, J. R., and Williams, J. R.: Soil and Water Assessment Tool Theoretical Documentation Version 2009, Texas Water Resources Institute, http://hdl.handle.net/1969.1/128050 (last access: 1 September 2021), 2011.
Pagliero, L., Bouraoui, F., Willems, P., and Diels, J.: Large-Scale Hydrological Simulations Using the Soil Water Assessment Tool, Protocol Development, and Application in the Danube Basin, J. Environ. Qual., 43, 145–154, https://doi.org/10.2134/jeq2011.0359, 2014.
Panagopoulos, Y., Gassman, P. W., Arritt, R. W., Herzmann, D. E., Campbell, T. D., Jha, M. K., Kling, C. L., Srinivasan, R., White, M., and Arnold, J. G.: Surface water quality and cropping systems sustainability under a changing climate in the Upper Mississippi River Basin, J. Soil Water Conserv., 69, 483–494, https://doi.org/10.2489/jswc.69.6.483, 2014.
Panagopoulos, Y., Gassman, P. W., Jha, M. K., Kling, C. L., Campbell, T., Srinivasan, R., White, M., and Arnold, J. G.: A refined regional modeling approach for the Corn Belt – Experiences and recommendations for large-scale integrated modeling, J. Hydrol., 524, 348–366, https://doi.org/10.1016/j.jhydrol.2015.02.039, 2015.
Panagopoulos, Y., Gassman, P. W., Kling, C. L., Cibin, R., and Chaubey, I.: Water Quality Assessment of Large-scale Bioenergy Cropping Scenarios for the Upper Mississippi and Ohio-Tennessee River Basins, J. Am. Water Resour. Assoc., 53, 1355–1367, https://doi.org/10.1111/1752-1688.12594, 2017.
Paul, J. H., Rose, J. B., Jiang, S. C., Zhou, X., Cochran, P., Kellogg, C., Kang, J. B., Griffin, D., Farrah, S., and Lukasik, J.: Evidence for groundwater and surface marine water contamination by waste disposal wells in the Florida Keys, Water Res., 31, 1448–1454, https://doi.org/10.1016/S0043-1354(96)00374-0, 1997.
Rabalais, N. N., Turner, R. E., Sen Gupta, B. K., Boesch, D. F., Chapman, P., and Murrell, M. C.: Hypoxia in the northern Gulf of Mexico: Does the science support the plan to reduce, mitigate, and control hypoxia?, Estuar. Coast., 30, 753–772, https://doi.org/10.1007/BF02841332, 2007.
Ren, H. L., Lu, B., Wan, J., Tian, B., and Zhang, P.: Identification Standard for ENSO Events and Its Application to Climate Monitoring and Prediction in China, J. Meteorol. Res.-PRC, 32, 923–936, https://doi.org/10.1007/s13351-018-8078-6, 2018.
Sanchez, S. C. and Karnauskas, K. B.: Diversity in the Persistence of El Niño Events Over the Last Millennium, Geophys. Res. Lett., 48, e2021GL093698, https://doi.org/10.1029/2021GL093698, 2021.
Santhi, C., Srinivasan, R., Arnold, J. G., and Williams, J. R.: A modeling approach to evaluate the impacts of water quality management plans implemented in a watershed in Texas, Environ. Model. Softw., 21, 1141–1157, https://doi.org/10.1016/j.envsoft.2005.05.013, 2006.
Santhi, C., Kannan, N., White, M., Di Luzio, M., Arnold, J. G., Wang, X., and Williams, J. R.: An Integrated Modeling Approach for Estimating the Water Quality Benefits of Conservation Practices at the River Basin Scale, J. Environ. Qual., 43, 177–198, https://doi.org/10.2134/jeq2011.0460, 2014.
Schwarz, G. E., Hoos, A. B., Alexander, R. B., and Smith, R. A.: The SPARROW Surface Water-Quality Model, U. S. Geol. Surv. Tech. Methods. Sect. B, B. 6, 6-B3, U.S. Geological Survey, U.S. Department of the Interior, 1–29, https://water.usgs.gov/nawqa/sparrow/sparrow-mod.html (last access: 1 September 2021), 2006.
Sharma, S., Srivastava, P., Fang, X., and Kalin, L.: Incorporating climate variability for point-source discharge permitting in a complex river system, T. ASABE, 55, 2213–2228, https://doi.org/10.13031/2013.42507, 2012.
Sun, G., Alstad, K., Chen, J., Chen, S., Ford, C. R., Lin, G., Liu, C., Lu, N., Mcnulty, S. G., Miao, H., Noormets, A., Vose, J. M., Wilske, B., Zeppel, M., Zhang, Y., and Zhang, Z.: A general predictive model for estimating monthly ecosystem evapotranspiration, Ecohydrology, 4, 245–255, https://doi.org/10.1002/eco.194, 2011.
Tan, W., Wei, Z., Liu, Q., Fu, Q., Chen, M., Li, B., and Li, J.: Different influences of two El Niño types on low-level atmospheric circulation over the subtropical western North Pacific, J. Climate, 33, 825–846, https://doi.org/10.1175/JCLI-D-19-0223.1, 2020.
Tang, T., Li, W., and Sun, G.: Impact of two different types of El Niño events on runoff over the conterminous United States, Hydrol. Earth Syst. Sci., 20, 27–37, https://doi.org/10.5194/hess-20-27-2016, 2016.
Thaler, E. A., Larsen, I. J., and Yu, Q.: The extent of soil loss across the US Corn Belt, P. Natl. Acad. Sci. USA, 118, 1–8, https://doi.org/10.1073/pnas.1922375118, 2021.
Thomson, A. M., Brown, R. A., Rosenberg, N. J., Izaurralde, R. C., Legler, D. M., and Srinivasan, R.: Simulated impacts of El Niño/Southern Oscillation on United States water resources, J. Am. Water Resour. Assoc., 39, 137–148, https://doi.org/10.1111/j.1752-1688.2003.tb01567.x, 2003.
Ting, M., Seager, R., Li, C., Liu, H., and Henderson, N.: Future Summer Drying in the U. S. Corn Belt and the Role of Midlatitude Storm Tracks, J. Climate, 34, 9043–9056, https://doi.org/10.1175/JCLI-D-20-1004.1, 2021.
Trenberth, K. E.: The Definition of El Niño, B. Am. Meteorol. Soc., 78, 2771–2777, https://doi.org/10.1175/1520-0477(1997)078<2771:TDOENO>2.0.CO;2, 1997.
Twine, T. E., Kucharik, C. J., and Foley, J. A.: Effects of El Niño-Southern Oscillation on the climate, water balance, and streamflow of the Mississippi River basin, J. Climate, 18, 4840–4861, https://doi.org/10.1175/JCLI3566.1, 2005.
USDA-NASS: CDL Online Website, U.S. Department of Agriculture – National Agricultural Statistics Service, https://nassgeodata.gmu.edu/CropScape/ (last access: 1 September 2021), 2016.
USDA-NASS: Census of Agriculture Online Website, U.S. Department of Agriculture – National Agricultural Statistics Service, https://www.nass.usda.gov/AgCensus/ (last access: 1 September 2021), 2017.
Vaché, K. B., Eilers, J. M., and Santelmann, M. V.: Water quality modeling of alternative agricultural scenarios in the U. S. Corn Belt, J. Am. Water Resour. Assoc., 38, 773–787, https://doi.org/10.1111/j.1752-1688.2002.tb00996.x, 2002.
Wang, H. and Asefa, T.: Impact of different types of ENSO conditions on seasonal precipitation and streamflow in the southeastern United States, Int. J. Climatol., 38, 1438–1451, https://doi.org/10.1002/joc.5257, 2018.
Wang, H. and Kumar, A.: Assessing the impact of ENSO on drought in the U. S. Southwest with NCEP climate model simulations, J. Hydrol., 526, 30–41, https://doi.org/10.1016/j.jhydrol.2014.12.012, 2015.
Wilks, D. S.: Statistical Methods in the Atmospheric Sciences: An Introduction, Academic Press, London, UK, https://doi.org/10.1016/C2017-0-03921-6, 1995.
Williams, J. R., Arnold, J. G., Kiniry, J. R., Gassman, P. W., and Green, C. H.: History of model development at Temple, Texas, Hydrolog. Sci. J., 53, 948–960, https://doi.org/10.1623/hysj.53.5.948, 2008.
Yeh, S. W., Kug, J. S., Dewitte, B., Kwon, M. H., Kirtman, B. P., and Jin, F. F: El Niño in a changing climate, Nature, 461, 511–514, https://doi.org/10.1038/nature08316, 2009.
Yen, H., Daggupati, P., White, M. J., Srinivasan, R., Gossel, A., Wells, D., and Arnold, J. G.: Application of large-scale, multi-resolution watershed modeling framework using the Hydrologic and Water Quality System (HAWQS), Water-Sui., 8, 164, https://doi.org/10.3390/w8040164, 2016.
Yu, J. Y., Kao, H. Y., and Lee, T.: Subtropics-related interannual sea surface temperature variability in the central equatorial pacific, J. Climate, 23, 2869–2884, https://doi.org/10.1175/2010JCLI3171.1, 2010.
Zhang, H., Wang, B., Liu, D. L., Zhang, M., Leslie, L. M., and Yu, Q.: Using an improved SWAT model to simulate hydrological responses to land use change: A case study of a catchment in tropical Australia, J. Hydrol., 585, 124822, https://doi.org/10.1016/j.jhydrol.2020.124822, 2020.