the Creative Commons Attribution 4.0 License.
the Creative Commons Attribution 4.0 License.
 | 26 Sep 2022
Challenges and benefits of quantifying irrigation through the assimilation of Sentinel-1 backscatter observations into Noah-MP
Sara Modanesi
Christian Massari
Michel Bechtold
Hans Lievens
Angelica Tarpanelli
Luca Brocca
Luca Zappa
Gabriëlle J. M. De Lannoy
In recent years, the amount of water used for agricultural purposes has been rising due to an increase in food demand. However, anthropogenic water usage, such as for irrigation, is still not or poorly parameterized in regional- and larger-scale land surface models (LSMs). By contrast, satellite observations are directly affected by, and hence potentially able to detect, irrigation as they sense the entire integrated soil–vegetation system. By integrating satellite observations and fine-scale modelling it could thus be possible to improve estimation of irrigation amounts at the desired spatial–temporal scale.
In this study we tested the potential information offered by Sentinel-1 backscatter observations to improve irrigation estimates, in the framework of a data assimilation (DA) system composed of the Noah-MP LSM, equipped with a sprinkler irrigation scheme, and a backscatter operator represented by a water cloud model (WCM), as part of the NASA Land Information System (LIS). The calibrated WCM was used as an observation operator in the DA system to map model surface soil moisture and leaf area index (LAI) into backscatter predictions and, conversely, map observation-minus-forecast backscatter residuals back to updates in soil moisture and LAI through an ensemble Kalman filter (EnKF).
The benefits of Sentinel-1 backscatter observations in two different polarizations (VV and VH) were tested in two separate DA experiments, performed over two irrigated sites, the first one located in the Po Valley (Italy) and the second one located in northern Germany. The results confirm that VV backscatter has a stronger link with soil moisture than VH backscatter, whereas VH backscatter observations introduce larger updates in the vegetation state variables. The backscatter DA introduced both improvements and degradations in soil moisture, evapotranspiration and irrigation estimates. The spatial and temporal scale had a large impact on the analysis, with more contradicting results obtained for the evaluation at the fine agriculture scale (i.e. field scale). Above all, this study sheds light on the limitations resulting from a poorly parameterized sprinkler irrigation scheme, which prevents improvements in the irrigation simulation due to DA and points to future developments needed to improve the system.
- Article
(4586 KB) - Full-text XML
-
Supplement
(1459 KB) - BibTeX
- EndNote


Irrigation has been applied by humans for as long as they have been cultivating plants. However, in the last century irrigation has become one of the most impactful human activities on the terrestrial water cycle, accounting for nearly 85 % of global water consumption (Gleick, 2003; Kustu et al., 2010) and for 40 % of the world's food production (Foley et al., 2011; Massari et al., 2021; Siebert and Döll, 2010).
In the next decades, the foreseen increase in population (FAO, 2009) and climate change is expected to ask for larger amounts of water resources for food production and consequently increases in irrigation applications (Matthews and Germain, 2007; Ozdogan et al., 2010b). Busschaert et al. (2022) found that under a high CO2 emission scenario, a significant increase in net irrigation requirements for all of Europe (+30 % during the summer months) is expected by the end of the century. Even though accurate information on farmers' decisions related to quantities and timing of irrigation applications is often not available for public use, it is critical to understand how much water is used for irrigation to design an optimal water management strategy and to understand the consequences of irrigation on climate in the future (Alter et al., 2015).
Therefore, many studies have focused on detecting and quantifying irrigation through modelling and remote-sensing (RS) observations. From the modelling perspective, Girotto et al. (2017) highlighted the key role in representing anthropogenic processes into land surface models (LSMs). The authors realized a study in India, where irrigation provides a large contribution to winter crop production, and they found that data assimilation (DA) of total water storage (TWS) RS observations into the catchment land surface model (CLSM) introduces a negative trend in groundwater due to pumping for irrigation, along with an associated erroneous negative trend in modelled evapotranspiration when irrigation is unmodelled. Other studies have attempted to incorporate irrigation schemes into global LSMs, including the Interaction between Soil, Biosphere, and Atmosphere (ISBA) LSM (Druel et al., 2021), the Community Land Model (CLM; Pokhrel et al., 2012), and the Organizing Carbon and Hydrology in Dynamic Ecosystems (ORCHIDEE) model (De Rosnay et al., 2003), demonstrating the regional impact of irrigation on different water storages and on energy partitioning between sensible and latent heat fluxes (Lawston et al., 2015). Different types of irrigation systems were also implemented into the NASA Land Information System (LIS; Kumar et al., 2006; Peters-Lidard et al., 2007) framework and coupled with several LSMs, such as the Noah LSM (Chen et al., 1996; Chen and Dudhia, 2001; Mahrt and Pan, 1984) and the Noah-MP LSM (Niu et al., 2011). Drip and flood irrigation systems (Evans and Zaitchik, 2008) as well as a sprinkler scheme (Ozdogan et al., 2010a) are currently part of the LIS framework. The sprinkler irrigation scheme, in particular, adds irrigation water as fictitious rainfall based on a root-zone soil moisture threshold, and it was recently improved accounting for groundwater extraction in Nie et al. (2019).
Beyond these efforts, the human influence on the water distribution is still poorly described in LSMs due to simplifying assumptions, such as limitations related to soil texture maps, static crop maps or irrigation intensity inputs (Modanesi et al., 2021; Monfreda et al., 2008; Ozdogan et al., 2010a; Salmon et al., 2015). Another key issue is related to the farmer's irrigation application decision, which is not necessarily related to crop irrigation requirements or based on the root-zone soil moisture availability but mainly on water resource availability (Massari et al., 2021).
On the other hand, RS observations can indirectly disclose the presence of irrigation activities when they sense the entire integrated soil–vegetation system. For instance, visible and near-infrared measurements were mainly used in previous studies for developing irrigation mapping techniques (Ambika et al., 2016; Ozdogan and Gutman, 2008; Peña-Arancibia et al., 2014; Salmon et al., 2015), and, in recent years, optical data have also been combined with microwave (MW) observations (Ferrant et al., 2019) or with thermal sensor data (i.e. land surface temperature data) via energy and water balance models (van Eekelen et al., 2015; Olivera-Guerra et al., 2020; Brombacher et al., 2022), to investigate the advantages of multi-sensor approaches. On the other hand, MW satellite data were exploited in the last decade for both detecting (Dari et al., 2021; Gao et al., 2018; Kumar et al., 2015) and quantifying irrigation (Brocca et al., 2018; Dari et al., 2020; Jalilvand et al., 2019; Zaussinger et al., 2019). All these studies highlighted the importance of high spatial resolution of RS observations for a better estimation of irrigation quantities. In this context, the Copernicus Sentinel-1 mission represents the new era of satellite observations, providing Synthetic Aperture Radar (SAR) backscatter data at a fine spatial resolution (up to 10–20 m) since 2014, which are freely accessible. A recent study by Jalilvand et al. (2021) has highlighted the potential of high-resolution Sentinel-1-based soil moisture data, such as the 1 km SMAP/Sentinel-1 product (Das et al., 2019) to detect the irrigation signal over agricultural areas. However, despite the advances in RS, satellite observations are still characterized by limitations, such as the low revisit time typically associated with higher spatial resolution data, noise in the measurements, and the uncertainties of satellite retrieval algorithms.
The optimal integration of fine-scale modelling and satellite observations using DA in LSMs could be a promising solution to account for anthropogenic activities alongside improving the estimation of irrigation amounts and model predictions. Lawston et al. (2017) and Jalilvand et al. (2021) suggested the use of MW-based surface soil moisture retrievals from SMAP or SMAP/Sentinel-1 respectively, to incorporate the irrigation signal into models via DA. In light of this, Abolafia-Rosenzweig et al. (2019) designed an innovative system to assimilate RS-based soil moisture into the VIC (variable infiltration capacity) model through a particle batch smoother in order to improve irrigation estimates. Further studies investigated the use of surface soil moisture retrievals and vegetation indices such as leaf area index (LAI) or vegetation optical depth to improve model predictions (Albergel et al., 2018; De Lannoy and Reichle, 2016b; Kumar et al., 2020). However, MW-based retrievals could also add unreliable information into LSM systems due to the RS observation preprocessing and the retrieval algorithm. More specifically, passive MW retrievals are produced with ancillary data that might be inconsistent with those used in the LSM (De Lannoy and Reichle, 2016a), and active MW retrieval products based on change detection methods often rely on a climatological approximation of the vegetation signal (Wagner et al., 1999). To avoid this limitation, previous studies investigated the direct assimilation of MW observations, such as brightness temperature (Tb) derived from Soil Moisture and Ocean Salinity (SMOS) or Soil Moisture Active Passive (SMAP) missions (De Lannoy and Reichle, 2016a, b; Reichle et al., 2019), radar backscatter from the Advanced Scatterometer (ASCAT; Lievens et al., 2017a), or the joint assimilation of Sentinel-1 backscatter and SMAP Tb (Lievens et al., 2017b), through the use of calibrated observation operators. The assimilation of Level-1 observations has the potential to limit inconsistencies in the DA system and to address the climatological bias correction through the observation operator calibration, as compared to classical soil moisture bias correction techniques (i.e. cumulative distribution function (CDF) matching).
The earlier studies on the direct assimilation of MW observations did not include any irrigation or dynamic vegetation modelling. Consequently, they did not investigate the benefits of jointly updating soil moisture and vegetation or any consequences on irrigation estimation. This work aims at filling those gaps using the Noah-MP v.3.6 (Niu et al., 2011) equipped with a dynamic vegetation model, a sprinkler irrigation scheme (Ozdogan et al., 2010a) and a calibrated backscatter forward operator, the Water Cloud Model (WCM; Attema and Ulaby, 1978), within the NASA LIS framework. The main target of this study is then to assimilate 1 km Sentinel-1 radar backscatter observations for a joint update of modelled soil moisture and vegetation in order to correct them for actual irrigation applications and thereby improve the initial land surface conditions for subsequent irrigation forecasts. The backscatter from Sentinel-1 contains information on both soil moisture (Bauer-Marschallinger et al., 2018; Liu and Shi, 2016; Zribi et al., 2011) and vegetation (Vreugdenhil et al., 2020, 2018), and we hypothesize that assimilating these data could correct for misrepresented or missed irrigation events. Furthermore, we assume that when coupling the Noah-MP DA system with a poorly parameterized sprinkler irrigation module, irrigation water amounts can be optimally forecasted when optimal soil moisture and vegetation estimates are available. In this framework, the WCM calibration is a necessary step to obtain unbiased predictions over intensively irrigated areas, and this topic was deeply investigated in Modanesi et al. (2021). The ensemble Kalman filter (EnKF; Evensen, 1994) algorithm is selected to perform the DA analysis. The EnKF was used in previous studies for non-linear dynamics, and it is popular in hydrological and land surface modelling studies (Reichle et al., 2002; De Lannoy and Reichle, 2016a; Kumar et al., 2019, 2020; De Santis et al., 2021, to cite a few). It uses an ensemble of model trajectories to represent the background error covariance at each time of an update. With the support of a near-optimal DA system, this study aims at improving irrigation estimates, and the following points are discussed:
- i.
the improvement (or deterioration) of LSMs simulations in terms of irrigation, soil moisture, vegetation and evapotranspiration due to the sequential assimilation of Sentinel-1 backscatter in vertical transmit and receive (VV) or in vertical transmit and horizontal receive (VH) polarizations and the differences in results obtained using co- and cross-polarization observations to update both soil moisture and vegetation;
- ii.
the limitations due to the spatial scale and shortcomings of the system in terms of model parameterization and DA consistency.
The analysis was carried out over two pilot sites: (i) the Po Valley, one of the most intensively cultivated and irrigated areas in Italy (Po River Watershed Authority, 2016), and (ii) an irrigated area located in northern Germany, in more humid conditions.
The paper is organized as follows. Section 2 describes the study areas, the datasets used (i.e. in situ benchmark data and RS observations), methods (including the LSM description and the DA system) and the experimental setup. Section 3 presents the results obtained from the DA experiments: first the quality of the DA system design is evaluated in terms of DA diagnostics, and then the estimates of irrigation and model state variables and fluxes are evaluated. In Sect. 4 we provide a discussion, and conclusions are reported in Sect. 5.
2.1 Study areas and in situ data
Two European pilot sites characterized by different climatic conditions were selected (Fig. 1). The first one is located in the Lower Saxony region in northern Germany and has an extent of 160 km2, marked by the transparent red box in Fig. 1a. It can be classified as Cfb (temperate oceanic climate) in the Köppen–Geiger classification (Peel et al., 2007). Mean annual temperature and precipitation are around 9 ∘C and 550 mm, respectively. For more general information on this pilot site, the reader can refer to the work by Zappa et al. (2021). The test site is composed of 49 fields (ranging from 1.3 to 30 ha) characterized by a wide variety of crops, which include potatoes, sugar beet, summer barley and winter wheat. Daily irrigation data, available for each field, were provided for the year 2018.
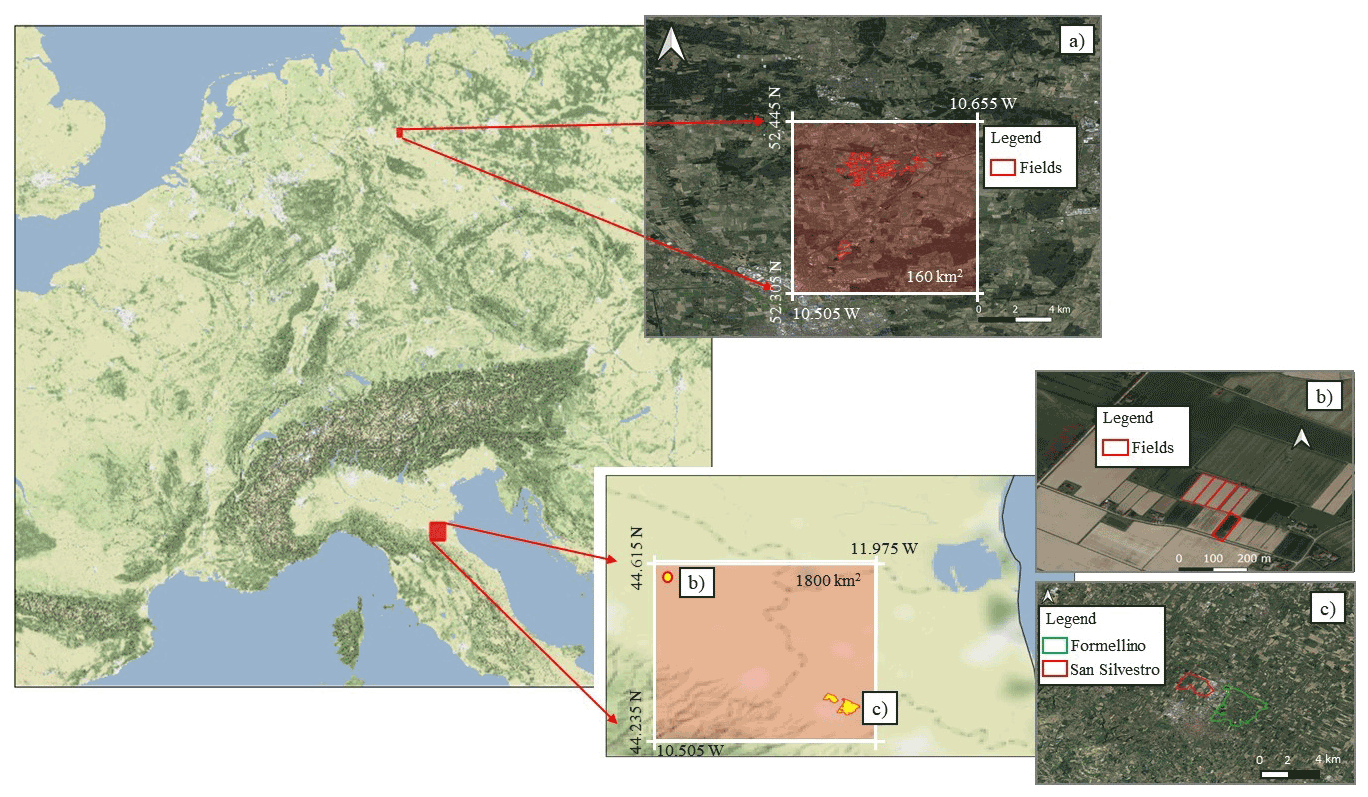
Figure 1Study area composed of the German and Italian pilot sites (represented by the red boxes). The pilot sites include three test sites: (a) Lower Saxony with 49 fields; (b) five fields in Budrio; and (c) two small districts close to the city of Faenza, called San Silvestro and Formellino. Map data © Google Maps 2019.
The second pilot site is located within the Po Valley, one of the most important agricultural areas in Italy, intensively equipped for irrigation (Salmon et al., 2015). According to the Köppen–Geiger climate classification, this area can be ascribed to the Cfa class (temperate climate, without dry season and with hot summers). The simulation area (red box on Fig. 1b–c) is mainly characterized by croplands, except the south, south-western area where forests and more complex topography are dominant. This pilot site has an extension of 1800 km2; it is located in the Emilia Romagna region and is characterized by one of the most technologically advanced Italian irrigation hydraulic systems – the Canale Emiliano Romagnolo (CER; https://consorziocer.it/it/, last access: 27 November 2021). In recent years, this area has been affected by frequent water scarcity periods (Ceppi et al., 2014; Strosser et al., 2012), which have increased the need for optimal water management. In situ data, used for evaluation, were collected over the test site of Budrio (Fig. 1b) and Faenza (Fig. 1c). In particular, the Budrio farm is managed by CER and includes five small fields extended for 0.4 ha each. The most common crop types are tomatoes and maize, and daily irrigation data are available for the period 2015–2016 for four out of the five fields and for the year 2017 for the last plot. The second Italian test site is located around the city of Faenza, consisting of two small-districts: San Silvestro (hereafter Faenza F1), which has an extension of 290 ha, and Formellino (Faenza F2 hereafter), reaching 760 ha. The crops growing on the Faenza small-districts are pear and kiwi, which typically require a significant amount of water. The water used for irrigation at daily timescale was provided by CER for the 2 years 2016–2017. Daily rainfall data are collected from the national rainfall network managed by the Department of Civil and Environmental Protection (DPC) of Italy for the irrigated periods.
2.2 Remote-sensing observations
The European Space Agency (ESA) and Copernicus Sentinel-1 mission collects active microwave backscatter data at C-band (5.4 GHz) at a high spatial (∼ 20 m) and temporal (less than weekly) resolution in interferometric wide (IW) swath mode. The processing of the ground-range detected (GRD) backscatter observations in VV and VH polarization was done using the ESA Sentinel Application Platform (SNAP) software and included standard techniques: precise orbit file application, border noise removal, thermal noise removal, radiometric calibration to backscatter as beta nought, terrain flattening to backscatter as gamma nought (γ0 hereafter) and range-Doppler terrain correction. Furthermore, the γ0 observations, originally acquired at ∼ 20 m spatial resolution, were aggregated by multilooking, masked for urban area and water bodies, and projected on the 0.01∘ latitude–longitude grid as used in LIS Noah-MP LSM. After applying an orbit bias correction (Lievens et al., 2019), the observations from different orbits, either from Sentinel-1A or Sentinel-1B and ascending or descending tracks, were combined at the daily timescale, with a mean temporal resolution of one assimilated observation every ∼ 3 d over the pilot sites.
Additional RS observations were used for the evaluation of Noah-MP LSM simulations.
-
The Metop ASCAT surface soil moisture (SSM) Climate Data Records H115 and its extension H116 are provided by the European Organization for the Exploitation of Meteorological Satellites (EUMETSAT) Support to Operational Hydrology and Water Management (H SAF; http://hsaf.meteoam.it/, last access: 20 May 2021). The SSM retrieval is characterized by a spatial sampling of 12.5 km and a temporal resolution of one to two observations per day, depending on the latitude.
-
The PROBA-V leaf area index (LAI) is provided by the Copernicus Global Land Service programme (CGLS, https://land.copernicus.eu/global/, last access: 13 September 2022). The CGLS product at 1 km spatial resolution and 10 d temporal resolution is developed based on the work by Verger et al. (2014).
-
The Moderate Resolution Imaging Spectroradiometer (MODIS) is a multispectral sensor on board TERRA and AQUA satellites acquiring image data of the Earth's surface simultaneously in visible and infrared bands. For this work, the MOD16A2 Version 6 Evapotranspiration product was used for evaluation. This is an 8 d composite product characterized by 500 m spatial resolution.
ASCAT SSM, PROBA-V LAI and MODIS ET were extracted over the test sites and re-gridded over the LIS grid spatial domain (0.01∘) as well as sampled to a daily timescale in order to match the LIS outputs.
2.3 Land surface and irrigation modelling
The LSM selected for this study is the Noah-MP.v.3.6 (Niu et al., 2011). This model is able to dynamically simulate vegetation and soil moisture in four layers, i.e. 0–10, 10–40, 40–100 and 100–200 cm depth. For this study, the Noah-MP model was coupled to a sprinkler irrigation module (Ozdogan et al., 2010a) embedded within the NASA's LIS version 7.3 (Kumar et al., 2008). For a more detailed description of the Noah-MP parameterization used in this study, the reader can refer to Modanesi et al. (2021).
The irrigation module adds water as pseudo-precipitation to mimic sprinkler systems (Ozdogan et al., 2010a) and does not further change processes related to, for example, vapour fluxes (which would be needed for highly efficient drip irrigation systems; Evans and Zaitchik, 2008). In order to identify the irrigation season, timing and location of irrigation, four conditions need to be met: (i) irrigable land cover (i.e. croplands), (ii) irrigated land fraction, (iii) growing season and (iv) dry enough root-zone soil moisture. The first two conditions are tested against static land cover (LC) and irrigation intensity (areal fraction) maps. The growing season was defined based on a user-defined threshold of simulated LAI (LAI > 1). The LAI value is then converted to the greenness vegetation fraction (GVF) in accordance with Fang et al. (2018):
where b (–) is an empirical parameter that depends on plant canopy (Fang et al., 2018; Norman et al., 1995). Finally, the irrigation is applied when the root-zone soil moisture availability falls below a user-defined threshold, which has been set to 50 % of field capacity (FC) as in Ozdogan et al. (2010a) for the German pilot site and 45 % in Italy (a previous analysis has shown large overestimations using a threshold of 50 % in the Po Valley). The irrigation amount is determined by the amount of water needed to increase the root-zone soil moisture back to FC. In this context, the maximum rooting depth is an important input parameter, impacting the frequency of irrigation events as well as the amount of irrigated water.
Table 1Parameters needed to activate the irrigation scheme in Noah-MP, based on the two pilot sites.

The modelled irrigation estimates are thus primarily controlled by five datasets: static LC, irrigation fraction, soil texture, crop type and dynamic meteorological forcing. In this study, the static 1 km LC is derived from the CGLS 100 m global LC map for the year 2015 (Buchhorn et al., 2020; available at https://land.copernicus.eu/global/products/lc, last access: 21 December 2021). The 23 classes of this global LC map were reclassified to the 14 classes supported by LIS and re-gridded to 0.01∘ (for additional details on the reclassification, the reader can refer to Modanesi et al., 2021). The global 500 m rain-fed, irrigated and paddy croplands dataset (GRIPC) by Salmon et al. (2015) is used to map the irrigation fractional area. However, the GRIPC input lacks important information over the German test site, which is classified as non-irrigated. In order to allow for irrigation simulations over Germany, the irrigation fractional area was set to 100 % over the known irrigated LIS grid pixels (based on irrigation benchmark data). The parameters needed to activate the irrigation scheme are summarized in Table 1.
Soil texture and the associated parameters were extracted from the 1 km Harmonized Soil World Database (HWSD v1.21) and mapped to discrete soil classes with their associated soil hydraulic parameters as in Modanesi et al. (2021). Given the lack of European or large-scale dynamic crop map datasets, the crop type was set to a generic type, with a maximum rooting depth of 1 m in Italy (Modanesi et al., 2021) and 0.8 m Germany. In particular, in the Lower Saxony test site, an averaged rooting depth was calculated based on the main crop types cultivated on the irrigated fields.
The dynamic meteorological forcing data were extracted from Modern-Era Retrospective analysis for Research and Applications, version 2 (MERRA-2; Gelaro et al., 2017), which is not corrected for surface or screen-level observations (and are thus unlikely to contain feedback from – unmodelled and unobserved – irrigation). The meteorological data, at original spatial resolution of 0.5∘ × 0.625∘, were remapped to 0.01∘ spatial resolution via bilinear interpolation.
2.4 Observation operator and calibration
The observation operator used to ingest Sentinel-1 γ0 observations into the Noah-MP LSM is represented by the Water Cloud Model (WCM) introduced by Attema and Ulaby (1978). The WCM simulates the total γ0 as the sum of the γ0 from the vegetation () and the γ0 from the soil () attenuated by the vegetation (t2) as follows:
For more information on the WCM, the reader can refer to the Appendix section as well as to Lievens et al. (2017a) and Modanesi et al. (2021). The WCM includes four fitting parameters, two of them related to the scattering and attenuation by vegetation and the other two parameters to model the soil backscatter contribution as a linear function of the SSM. Those parameters were calibrated to limit long-term biases between Sentinel-1 observations, which include an irrigation signal over irrigated areas, and the LSM simulations. The WCM calibration was performed for each individual grid cell using the procedure designed in Modanesi et al. (2021), which includes (i) the use of Noah-MP SSM and LAI as inputs for the WCM (ensemble mean time series from an open loop simulation); (ii) the use of Sentinel-1 γ0 VV and VH separately to tune the parameters for the simulation of γ0 VV and VH independently; (iii) the activation of the irrigation scheme to reduce seasonal inconsistencies between simulated and observed γ0 during irrigation periods; (iv) the optimization of a Bayesian objective function represented by the sum of square error between γ0 observations and simulations, and a constraint on prior parameter estimates, using the DiffeRential Evolution Adaptive Metropolis (DREAM(ZS); Vrugt et al., 2008; De Lannoy et al., 2014). The calibration was realized for the period January 2018–December 2020. As a final note, the WCM calibration procedure acts as a climatological bias correction method to meet the assumption of unbiased observations and simulations in a DA system. It is worth mentioning that after the calibration step, no further interannual, seasonal or shorter-term bias correction was performed.
2.5 Data assimilation
The DA system was developed in order to directly assimilate Sentinel-1 γ0 observations into Noah-MP and sequentially update both soil moisture and vegetation within the LIS framework. The direct assimilation of γ0 observations requires that simulated land surface state variables are first mapped to γ0 predictions (forecast) via a second modelling step, i.e. via the WCM as observation operator (Sect. 2.4). The assimilation was performed via an ensemble Kalman filter (EnKF; Evensen, 2003, 1994), which updates the land surface state, where and when satellite-based γ0 observations are available. Specifically, a 1-dimensional EnKF was applied (Reichle et al., 2002), using Sentinel-1 observations on the same spatial grid as that of the model simulations. In this study, the updated land surface state variables during the assimilation include both surface soil moisture (0–10 cm) and LAI, and the deeper profile layers are also updated (10–40, 40–100 and 100–200 cm) via error cross-correlations. All other fluxes and state variables, including irrigation estimates, are consistently adjusted via model propagation.
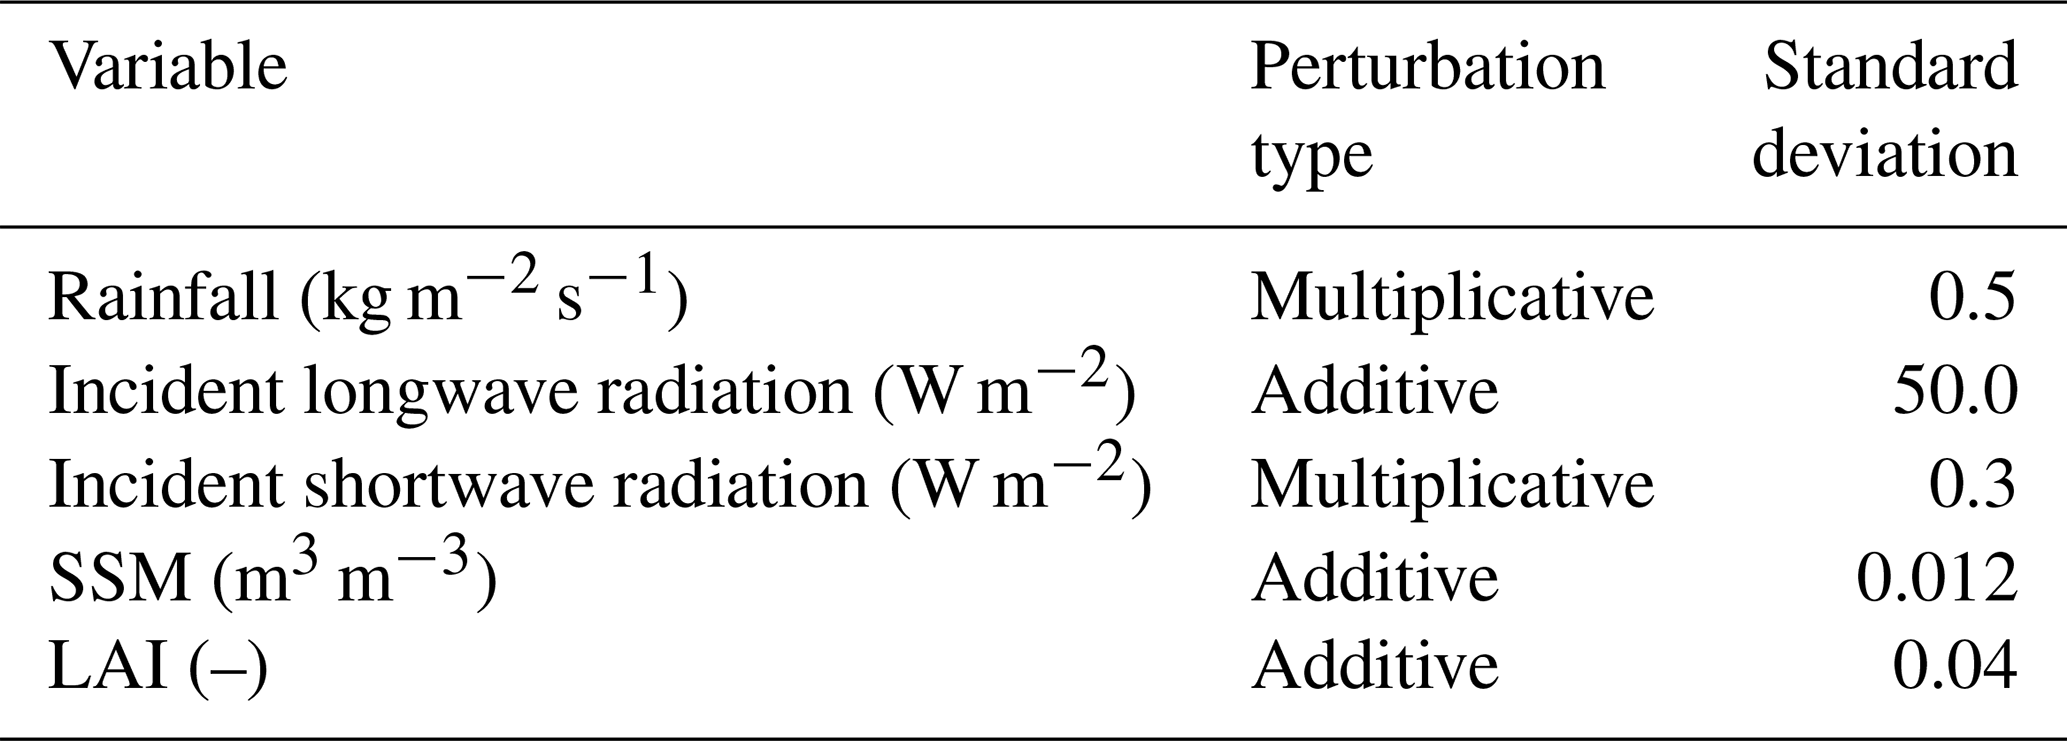
The EnKF assumes unbiased observations and forecasts. This is achieved by running the Noah-MP with a poor guess of irrigation activated and using calibrated WCM parameters to produce unbiased γ0 forecasts relative to Sentinel-1 γ0 (which “senses” irrigation). The optimality of the Kalman filter further strongly depends on the characterization of the random component of forecast and observation errors. In this context, the forecast errors are diagnosed from an ensemble of 24 land model (including WCM) trajectories, from which the error covariances are estimated at the time of an update. The ensembles are generated by perturbing selected meteorological input forcings (i.e. rainfall and incidence longwave and shortwave radiation) and state variables. The perturbation parameters, summarized in Table 2, are based on Kumar et al. (2014), aiming at a unit standard deviation of normalized γ0 innovations (De Lannoy and Reichle, 2016a; Reichle et al., 2017). Only the SSM and LAI state variables are perturbed, and no temporal autocorrelation is used to avoid excessive uncertainty estimates. The observation error standard deviation is set to 1 dB, regardless of the polarization or orbit of the γ0 observations.
Table 2Perturbation parameters for forcing (i.e. rainfall, incident and shortwave radiation) and state variables (i.e. SSM and LAI).
The main equation of the EnKF can then be written as follows:
where i represents the time step, is an ensemble of model states after assimilation and represents the forecast ensemble state (i.e. SSM and LAI), yobs,i is the assimilated observations at time i and hi(.) is the WCM observation operator. The term is the γ0 observation-minus-forecast (O−F) residual in dB and is mapped to updates in the model state via the Kalman gain Ki described as follows:
In Eq. (4), CYM,i is the error cross-covariance matrix between the state and observation predictions, and CM,i is the forecast error covariance matrix of the backscatter (observation) predictions.
The above method will update forecasted irrigation estimates by correcting random errors in land surface state forecasts. An alternative method would be to run the Noah-MP without irrigation activated and to derive irrigation estimates from the amount of water or vegetation added to the system via DA (i.e. the increments), if the true precipitation is used as input and if the observation operator is also not compensating for irrigation. More specifically, positive and autocorrelated increments in the growing season would be indicative of irrigation. However, this would also be indicative of a suboptimal assimilation system. In this study, we use imperfect reanalysis precipitation input, and we simulate irrigation through an irrigation scheme. Increments of any sign could thus be related to over- or underestimation of irrigation.
2.6 Experiments
In this study we considered two different experimental lines, (i) the assimilation of Sentinel-1 γ0 VV (Sentinel-1 γ0 VV DA hereafter) and (ii) the assimilation of Sentinel-1 γ0 VH (Sentinel-1 γ0 VH DA hereafter), both to sequentially update SSM and LAI. The experimental workflow is described in the scheme of Fig. 2.
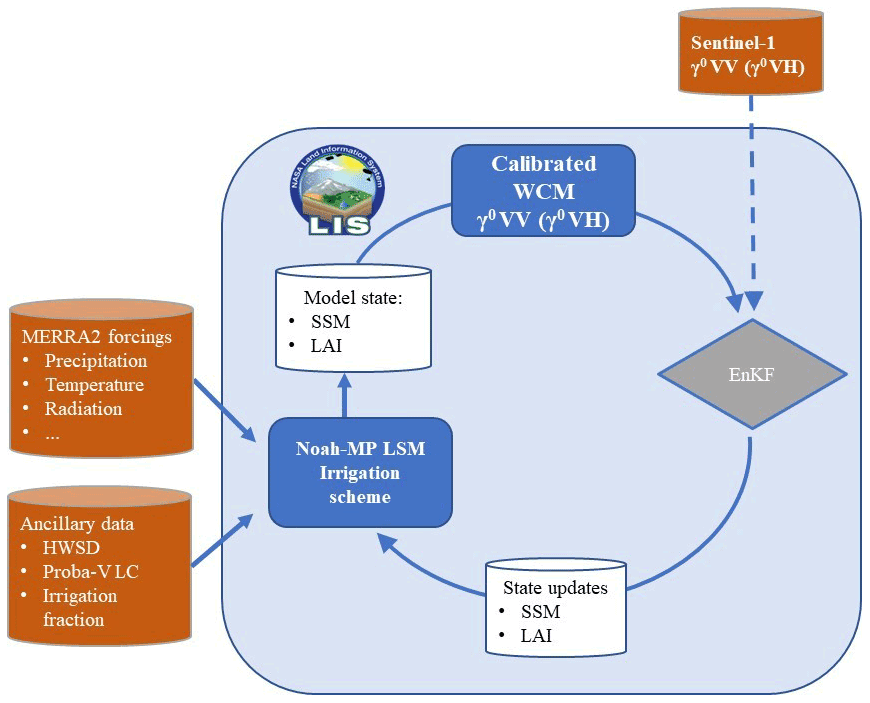
Figure 2Workflow of the DA experiments realized within the LIS framework. The scheme describes how the Sentinel-1 γ0 (VV or VH) is assimilated into the Noah-MP LSM to sequentially update SSM and LAI using an EnKF.
For each pilot site, the Noah-MP model was previously spun up from January 1982 to May 2014. Then, an ensemble spin-up was realized in open loop (OL) mode using 24 ensemble members from May 2014 to January 2015, in order to obtain optimal initial conditions. The OL run was continued thereafter from January 2015 onwards through December 2020. Similarly, the Sentinel-1 γ0 VV DA and Sentinel-1 γ0 VH DA experiments were run from January 2015 through December 2020. Note that all instantaneous state and flux variables in the OL and DA experiments were described by ensemble distributions, and consequently irrigation was activated for different individual ensemble members at different times and with different quantities.
2.7 Evaluation
The evaluation aimed at (i) verifying the goodness of the DA system in terms of DA diagnostics; (ii) highlighting benefits of the Sentinel-1 DA for irrigation, soil moisture and LAI estimation, as well as testing the differences between the Sentinel-1 γ0 VV DA and the Sentinel-1 γ0 VH DA configurations; (iii) verifying the influence of the spatial scale of the test sites on the irrigation simulation and evaluation; and (iv) identifying shortcomings of the system.
To achieve those targets, two types of evaluation were carried out.
-
The optimality of the DA system design was evaluated regionally for each pilot site, for the period January 2015–December 2020. Following Reichle et al. (2017), three different filter diagnostics were analysed. First, the difference between the temporal mean ensemble standard deviation (or ensemble spread) of the DA and OL runs was computed to test whether the DA system successfully reduces the uncertainties (i.e. ensemble spread) as compared to the OL run. Second, the time series standard deviation of the normalized γ0 O−F residuals was computed to check if observation and model errors were adequately chosen. In ideal conditions, this metric should be equal to unity over the entire study area. The normalized O−F residuals were obtained by normalizing each O−F residual by their simulated (expected) (forecast and observation error) standard deviation and then calculating the time series standard deviation (Bechtold et al., 2020; Reichle et al., 2019). Third, the time series standard deviations of the increments (analysis – forecast) in SSM and LAI were investigated in order to verify whether those values are small relative to the values of the update state variables.
-
The OL and DA estimates of irrigation, SSM, LAI and ET were evaluated using independent reference data for the years 2015–2017 and 2016–2017 at the Budrio and Faenza (Italian) sites and for the year 2018 at the German sites. The evaluation of ensemble mean irrigation simulations was assessed in terms of correlation and percentage bias (Pearson R and bias hereafter) between estimated irrigation volumes and benchmark irrigation data. As the irrigation timing is often driven by stakeholders' turns to withdraw water and by water availability rather than by the root-zone moisture conditions, and because short-term DA increments influence short-term activations of the irrigation system, the comparisons between simulations and in situ observations were carried out by accumulating irrigation data in a biweekly time window. An evaluation of daily SSM and LAI outputs was performed against ASCAT SSM and PROBA-V LAI, respectively, in terms of Pearson R. The ET outputs were tested against MODIS ET, considering the important role that irrigation has in affecting ET (Haddeland et al., 2014; Lawston et al., 2015). The latter however, must be considered more a comparison than a real validation given the inherent uncertainties contained in the MODIS ET product.
The evaluation of the 0.01∘ irrigation simulations with benchmark data asks for careful data handling and offers opportunities to relate skill metrics to properties of the irrigated regions. First, the Italian pilot site is composed of Budrio with five small fields of 0.4 ha within one LIS grid cell (0.01∘), the Faenza F1 test site of 290 ha, covering three LIS grid cells, and Faenza F2 of 760 ha including eight LIS grid cells. The benchmark irrigation data for the five fields in Budrio were averaged to obtain a unique time series, whereas at the Faenza test sites the LIS simulations were averaged to obtain a single time series for each field (and for each analysed variable). This allows us to relate skill metrics to the spatial scale (1 pixel at Budrio, to district scale at Faenza) of simulations and reference data.
Second, the German pilot site is composed of 49 fields, covering 24 LIS pixels. The irrigation data of the fields falling within each grid cell were averaged, assigning a weight to each time series based on the percentage area of the field falling within the LIS pixel. By considering only pixels with a percentage of irrigated area larger than 25 %, 8 irrigated pixels of the 24 pixels were retained. For these 8 pixels, statistical distributions of the skill metrics could be obtained.
3.1 Data assimilation diagnostics
The two DA experiments (Sentinel-1 γ0 VV DA and Sentinel-1 γ0 VH DA) were evaluated in terms of DA optimality and increments over the period January 2015–December 2020 for both Germany and Italy. Figure 3 shows a general reduction in the time–mean ensemble spread in SSM or LAI due to DA compared to the spread of the OL runs (ΔSSM ens. spread mean; ΔLAI ens. spread mean), for both the Sentinel-1 γ0 VV and VH DA experiments. In Italy (Fig. 3a, c, e and g), a larger reduction of the ensemble SSM and LAI spread is identified over croplands and particularly over the western, north-western part of the study area where a higher number of observations is assimilated (maps representing the number of assimilated observations for each experiment and each test site are displayed in Fig. S3 of the Supplement). The patches with a lower spread reduction are associated with input soil parameters and in particular with the presence of silty-loam soil texture, which contrasts the sandy-loam soil of the remaining area (LIS input is shown in Fig. S1). The two texture classes lead to very different soil moisture time series. In a previous study (Modanesi et al., 2021), a lower agreement of calibrated WCM simulations with Sentinel-1 observations was found over the silty-loam soil texture, and this is reflected in the lower reduction of SSM spread when assimilating Sentinel-1 (Fig. 3a and c). These features are much less visible in the difference of LAI spreads (LAI is mainly associated with the almost homogenous vegetation class, not so much with texture). Furthermore, the Sentinel-1 γ0 VH DA displays larger spread reduction in terms of LAI over croplands compared to the Sentinel-1 γ0 VV DA experiment, showing a large influence of the vegetation in the γ0 VH signal. For Germany the results show a similar link between the soil texture and the SSM spread reduction, especially for the Sentinel-1 γ0 VV DA experiment (Fig. 3b), where pixels with a stronger spread reduction are associated with sandy-loam soil texture (LIS input is shown in Fig. S2 for Germany). The absolute mean decrease in spread (m) over Germany is less pronounced than for the Italian pilot site (e.g. for Sentinel-1 γ0 VH DA, ΔLAI ens. spread mean for Italy and for Germany), which is partly due to the state dependency of the spread (e.g. higher LAI values and larger spreads in Italy than in Germany).
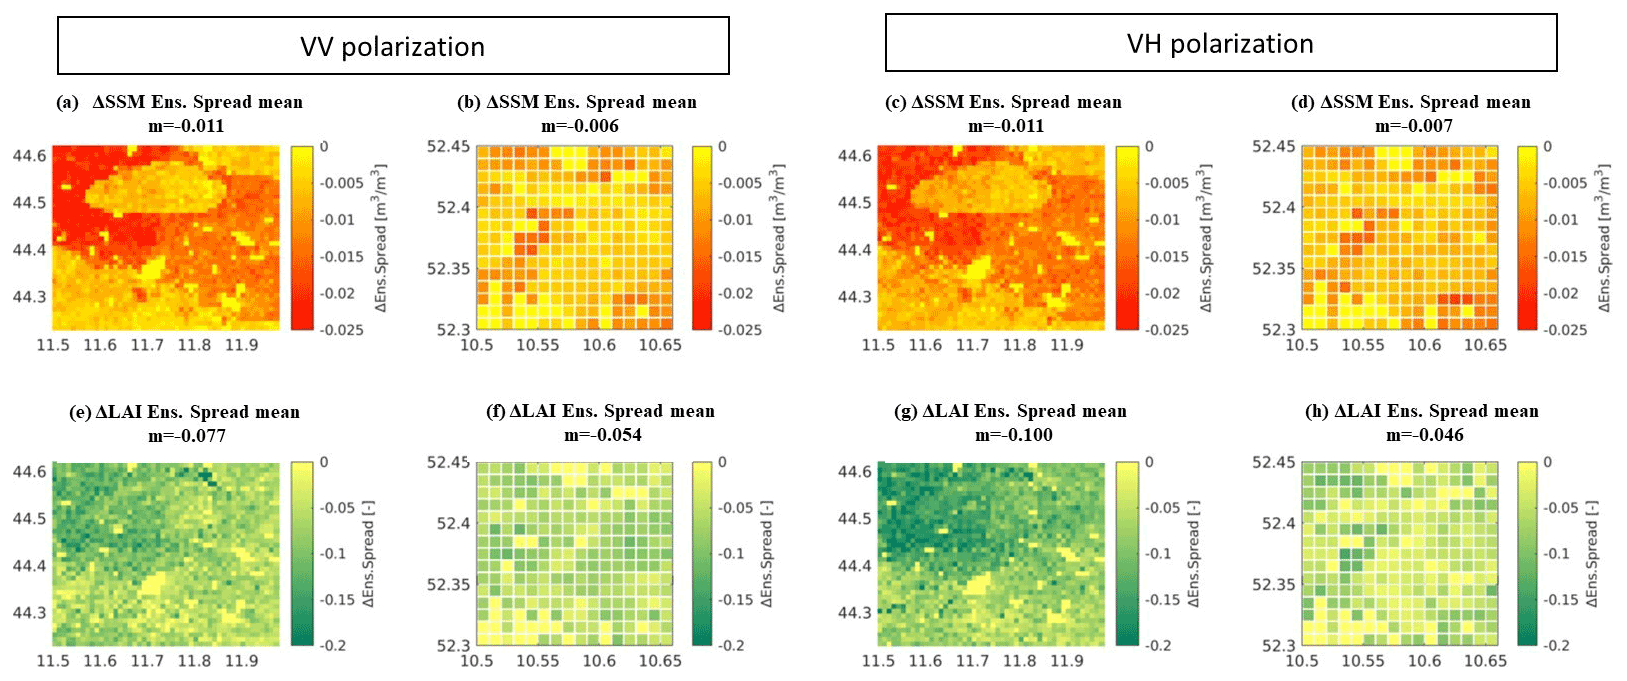
Figure 3Maps of the difference in time–mean ensemble spread between the DA and OL runs for (a–d) SSM (ΔSSM ens. spread) and (e–h) LAI (ΔLAI ens. spread). ΔSSM ens. spread after Sentinel-1 γ0 VV DA (a) in Italy and (b) in Germany; Sentinel-1 γ0 VH DA (c) in Italy and (d) in Germany. (e–h) Similar to (a)–(d) but for ΔLAI ens. spread. m is the mean over the entire study area. The reference period is January 2015–December 2020.
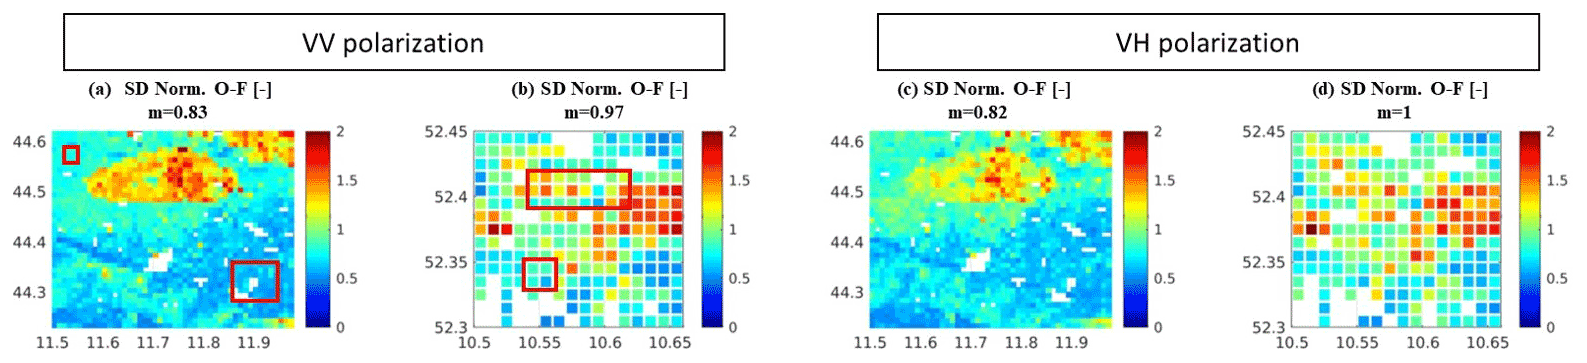
Figure 4Maps of the standard deviation (SD) of the normalized O−F residuals for Sentinel-1 γ0 VV DA (a) in Italy and (b) in Germany; Sentinel-1 γ0 VH DA (c) in Italy and (d) in Germany. m is the mean over the entire study area. Red boxes in (a) and (b) indicate areas where the test sites are located. The reference period is January 2015–December 2020. No Sentinel-1 data were assimilated in the white areas (Fig. S3).
Figure 4 shows the standard deviation of the normalized O−F residuals time series, for both the Sentinel-1 γ0 VV DA and Sentinel-1 γ0 VH DA. In an optimal DA system, these values should be equal to 1 over the entire study area for an agreement between the actual and simulated (expected) forecast and the observation errors. In Italy, m=0.83 and m=0.82 are obtained for the Sentinel-1 γ0 VV DA and the Sentinel-1 γ0 VH DA experiments respectively, but, once again, the spatial patterns are consistent with the soil texture distribution. The large ellipsoid feature, in the northern side of the study area, is characterized by values exceeding unity, meaning that the sum of observation and forecast error, prescribed in the ensemble perturbation, underestimates the actual errors. Similarly, in Germany we obtain near-optimal results in terms of m values over the entire study area, but larger error underestimations are observed over the silty-loam soil texture, with values larger than 1.5 for both DA experiments (Fig. 4b and d). In Germany an additional source of uncertainty is related to the irrigation fraction information, which is zero over the entire cropland area, except for the pixels for which we collected irrigation benchmark data (see discussion on GRIPC input, Sect. 2.3). We hypothesize that the lack of accurate information on the irrigated fraction over other pixels can negatively affect the WCM calibration and indeed the results in terms of DA diagnostics.
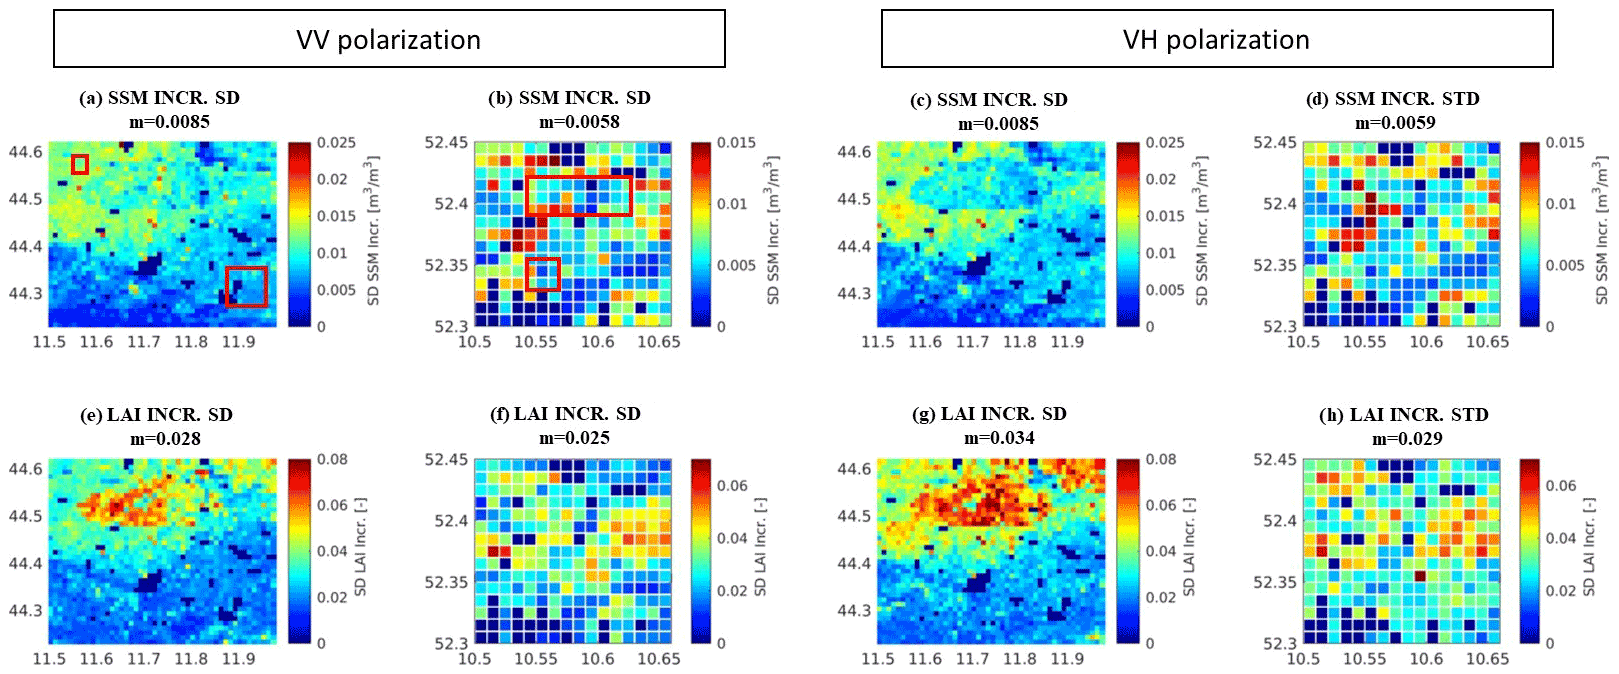
Figure 5Same as Fig. 3 but for the standard deviation (SD) of the increments in (a–d) SSM and (e–h) LAI. Red boxes in (a) and (b) indicate areas where the test sites are located.
Finally, we analysed the increments of SSM and LAI over the study area. In a well-calibrated DA system, the long-term mean of the increments is expected to be close to zero at each pixel. As explained in Reichle et al. (2019), values close to zero indicate that no long-term net addition or subtraction of water (or vegetation) is generated by the analysis. As expected, the temporal mean values of SSM and LAI analysis increments vanish in the regional average (results not shown). However, the standard deviation of the analysis increments provides valuable information, which has been summarized in Fig. 5. Maps of SSM (Fig. 5a–d) and LAI (Fig. 5e–h) show generally small increment standard deviations for both DA experiments and both study areas. Note that zero standard deviations are found where no data were assimilated (see Fig. S3). For both areas, complementary patterns are observed for SSM and LAI increments. Larger SSM variances can be observed over the cropland area characterized by sandy soil (e.g. north-west in Italy) and where a higher number of observations are assimilated (especially in Italy), whereas larger LAI updates are related to the silty-loam soil type (e.g. ellipsoid-shaped area in Italy), corresponding to the patterns in O−F (not shown, but the pattern of standard deviations of normalized O−F in Fig. 4 is similar to that of O−F). This is particularly true for the Sentinel-1 γ0 VH DA experiment.
Although the DA diagnostics show satisfactory results in terms of consistency of the system, input parameters, such as soil texture and vegetation (i.e. lack of dynamic crop maps in the model), seem to have a strong impact on the performance of the DA system. In this context, the red squares in Figs. 4a–b and 5a–b show areas where the test sites are located. In Italy (Figs. 4a or 5a) the Budrio test site (north-west square) is placed over an area where results are close to optimal in terms of standard deviation of normalized O−F. On the other hand, the Faenza test site shows a certain overestimation of the actual observation error (south-east square in Fig. 4a). In any case, although influences related to the mentioned input data are present, overall, the results are acceptable and near-optimal over both the Italian and German test sites.
3.2 SSM, LAI, ET and irrigation evaluation: DA vs OL
In this section we show the results of the DA and OL runs in terms of irrigation, SSM, LAI and ET. We first discuss the Italian pilot site, where the longest record (2–3 year) of benchmark data is available for three test sites with different spatial extents. This allows us to focus on the impact of the spatial scale on the performance of the DA system. Next, we discuss the pilot site in Germany, where the availability of 1 year of data for 49 small irrigated fields (24 LIS pixels, of which only 8 were retained considering a percentage of irrigated area larger than 25 %) allows for a statistical interpretation of the results.
3.2.1 Italy
Figure 6 shows an example time series of SSM, LAI, ET and irrigation at the Budrio farm for the OL and Sentinel-1 γ0 VV DA experiment, including a comparison in terms of γ0 observations and forecasts. Also shown are the reference data of ASCAT SSM, PROBA-V LAI and MODIS ET observations at daily timescale. For irrigation, the benchmark reference data, OL and DA output, are aggregated to a biweekly timescale.
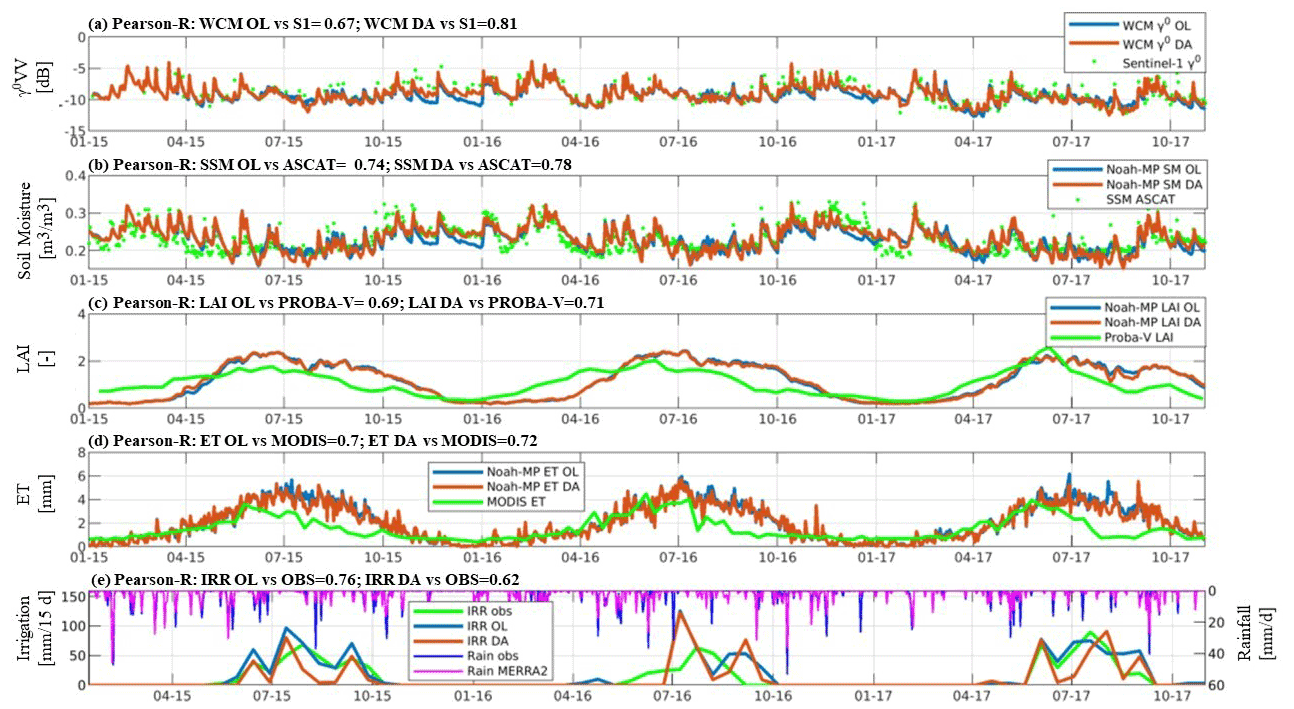
Figure 6Evaluation of the OL (blue lines) and DA (orange lines) results at the Budrio test site for the Sentinel-1 γ0 VV DA experiment: (a) Sentinel-1 γ0 VV against WCM γ0 VV; (b) ASCAT SSM against simulated SSM; (c) Proba-V LAI against simulated LAI; (d) MODIS ET against simulated ET; and (e) irrigation benchmark against simulated irrigation, with an indication of MERRA2 and in situ rainfall estimates.
The irrigation simulations (Fig. 6e) show a general deterioration of the performance with DA, with a decrease in Pearson R from 0.76 (OL) to 0.62 (DA). However, the DA run provides interesting results in terms of irrigation quantities. The observed irrigation amounts in the years 2015, 2016 and 2017 are about 345, 223 and 350 mm, respectively. The corresponding OL and DA estimates are 419 and 220 mm in 2015, 356 and 306 mm in 2016, and finally 445 and 315 mm in 2017. This indicates that the DA reduces the bias in some years (2016, 2017), but in other years DA might worsen the irrigation estimate (2015), increasing the annual bias. This could be related to the lower number of assimilated observations during the year 2015, due to the solely acquisition from Sentinel-1A. However, the lack of benchmark irrigation data for this year over other test sites makes it difficult to test this hypothesis. An inset of Fig. 6 for the period March 2017–November 2017 was added in the Supplement (Fig. S4), with the objective to help the visualization of the irrigation quantification improvement due to DA during the irrigation season. Figure 6e additionally shows the time series of rainfall from rain-gauge observations and MERRA-2 forcing (upper axes). Although a good agreement is observed between MERRA-2 and gauge rainfall in terms of Pearson R (0.78), it is worth noting that the precipitation from MERRA-2 during the summer is typically less than in situ rainfall, and this aspect could also contribute to create overestimation in irrigation simulation, which is only slightly corrected by the Sentinel-1 γ0 VV DA.
Figure 6b shows the impact of DA in the SSM dynamics during both the summer and winter seasons. The Sentinel-1 γ0 corrects a dry winter bias that is observed in the OL run SSM time series, while during the summer the increments affect mainly the short-term dynamics. The LAI time series are less affected by the ingestion of Sentinel-1 during the growing season (Fig. 6c) than SSM. The larger updates in terms of SSM are also reflected in a larger improvement in terms of Pearson R for SSM as compared to LAI: for SSM, the Pearson R increases from 0.74 for the OL to 0.78 for the DA, while for LAI (Fig. 6c) the increase in Pearson R is smaller (from 0.69 to 0.71). This is also explained by the results shown in Fig. 6a, where the daily WCM γ0 VV forecast time series are compared with Sentinel-1 observations: it is worth noting that the soil contribution in both the simulated and observed γ0 signal is much higher than the vegetation contribution, confirming what was highlighted in previous studies (i.e. Bauer-Marschallinger et al., 2018; Modanesi et al., 2021; Wagner et al., 2013). By design, the DA run provides better agreement (Pearson R = 0.81) between the WCM forecasts and Sentinel-1 observations than the OL run (Pearson R = 0.67).
When comparing the ET results against MODIS ET, a slight improvement is observed when DA is performed (Fig. 6d; Pearson R increases from 0.69 to 0.72), and a general overestimation in the model outputs was observed for both the OL and DA runs over the late summer months (from July to October of each year). The general decrease of MODIS ET during the late summer is not explained by the irrigation benchmark time series reported in Fig. 6e and shows a dubious response to irrigation events. This highlights possible uncertainties related to reference ET observations or benchmark irrigation data, and we believe that in this case the ET estimates are the least reliable.
Additional time series analyses for the other Italian sites and for γ0 VH DA are reported in the Supplement (Figs. S5 through S7).
Table 3Evaluation results at all the Italian test sites and for both the DA experiments.
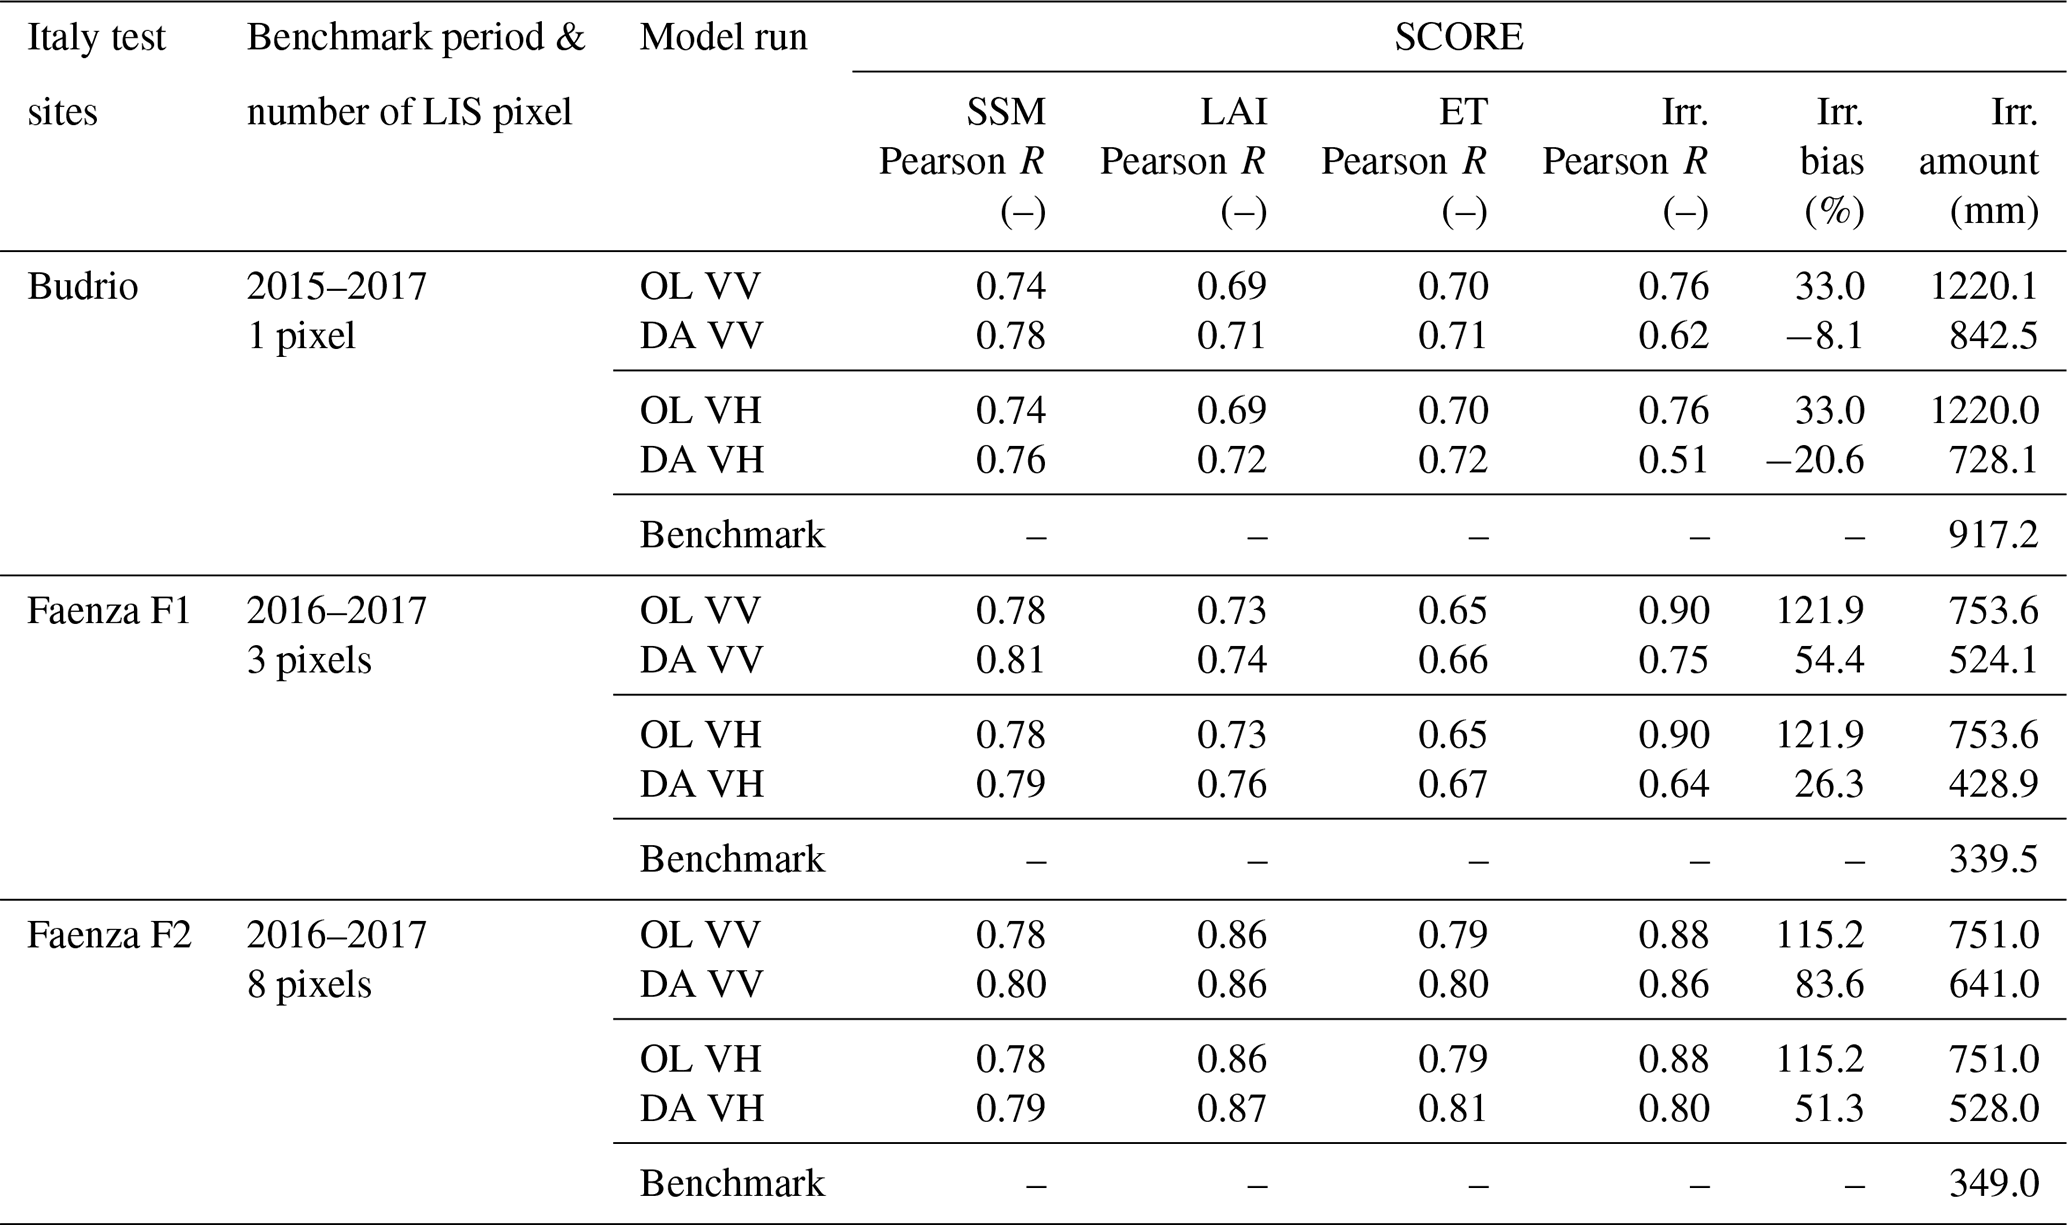
Table 3 summarizes the results obtained for the three test sites within the Italian pilot site. For the Faenza sites, the results are first spatially aggregated over 3 or 8 pixels before computing time series metrics. The uncertainty in the reference data and the relatively short data records prevent a statistically significant evaluation, but overall, the DA runs provide a slight improvement of SSM and LAI for both the DA experiments compared to the OL run. As expected, Sentinel-1 γ0 VV DA provides better results in terms of SSM temporal dynamics, while the Sentinel-1 γ0 VH DA shows larger improvements for LAI and ET. These findings confirm that γ0 VV contains more information about SSM (Bauer-Marschallinger et al., 2018; Modanesi et al., 2021; Wagner et al., 2013), whereas γ0 VH seems to be more related to vegetation (LAI) (i.e. Macelloni et al., 2001; Vreugdenhil et al., 2018). Due to the effect of LAI and SSM on plant transpiration, ET is also minimally improved. In terms of irrigation temporal dynamics, the DA experiments slightly deteriorate the temporal dynamics for all the test sites but reduce the bias in the irrigation estimates.
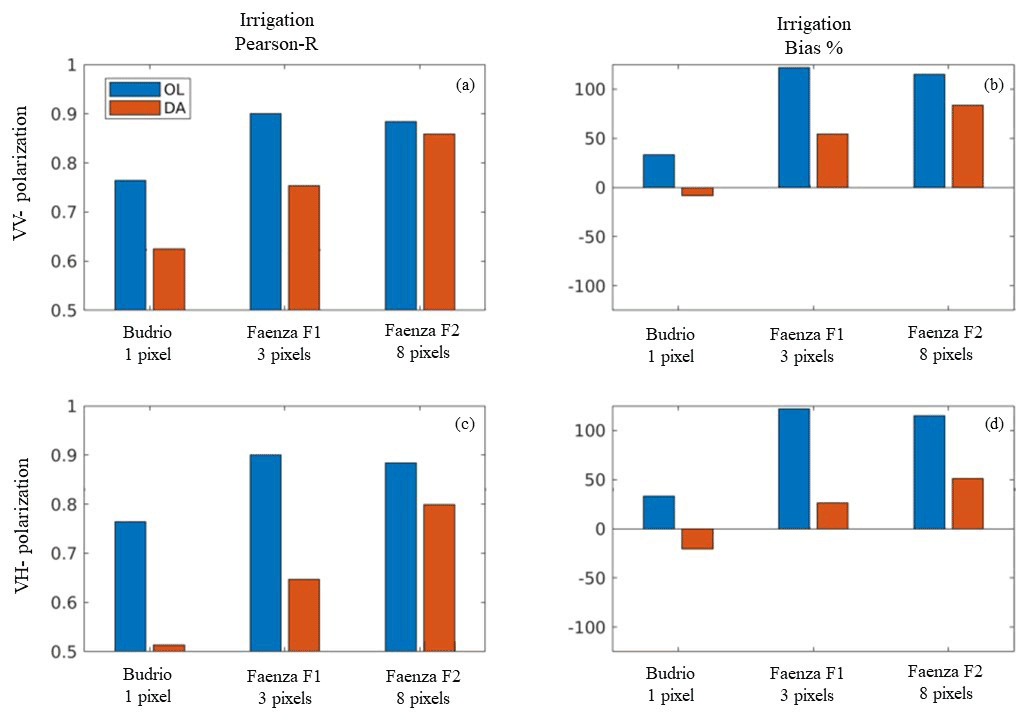
Figure 7Evaluation results in terms of irrigation simulations for the three Italian test sites based on the extent of the fields in terms of LIS pixels. Blue bars refer to the OL run, while orange bars refer to the DA run. The Pearson R values are reported for (a) the Sentinel-1 γ0 VV DA and (c) the Sentinel-1 γ0 VH DA experiments. (b, d) Same as (a) and (c) but for percentage bias.
Figure 7 summarizes the Pearson R and bias scores for the irrigation simulations for all the experiments and for the three Italian test sites. Even though DA always reduces the R values compared to those of the OL, Fig. 7a and c suggest that the R values for the DA experiments increase when moving from the small area of Budrio (1 LIS pixel) to Faenza F2 (8 LIS pixels) and that the skill reduction introduced by DA is only marginal for the largest Faenza F2 field. An explanation could be related to the spatial mismatch between the 1 km Sentinel-1 signal and the small Budrio fields (∼ 2 ha in total) together with the poor model ability to reproduce stakeholders' decisions (i.e. irrigation timing) in areas extended over few hectares, such as in Budrio.
Even though DA deteriorates the irrigation results in terms of R, it improves the results in percentage bias (Fig. 7b and d). In general, the Noah-MP LSM overestimates irrigation over all the test sites in the OL run. Here, the Sentinel-1 γ0 VH DA provides more reliable irrigation quantities. We hypothesize this could be attributed to the ability of the Sentinel-1 γ0 VH to introduce stronger updates in LAI, which is more linked to root-zone soil moisture under well-developed crops than SSM (Modanesi et al., 2021). Results in terms of bias show another important aspect: although many limitations in the simulation of the irrigation dynamics are related to the spatial scale, the quality of the benchmark irrigation data also has an important impact. For a small site such as Budrio, the irrigation benchmark is expected to be more precise, explaining lower biases in terms of irrigation quantities.
3.2.2 Germany
In the Lower Saxony test site, the analysis was conducted over 8 LIS pixels based on the preprocessing described at Sect. 2.7. The evaluation in terms of SSM and LAI using ASCAT SSM and PROBA-V LAI (not shown) does not display substantial differences in terms of Pearson R between the OL and the DA runs (median Pearson R equal to ∼ 0.8 for SSM and ∼ 0.7 for LAI, across 8 pixels). Regarding irrigation estimates, Fig. 8a and b display the Pearson R and percentage bias distributions over the 8 selected irrigated pixels for the OL and the Sentinel-1 γ0 VV DA experiment, while Fig. 8c and d refer to the Sentinel-1 γ0 VH DA. In particular, Fig. 8a and c show improved irrigation estimates for both Sentinel-1 γ0 VV DA (Pearson R increases from 0.47 to 0.61) and Sentinel-1 γ0 VH DA (Pearson R increases from 0.47 to 0.65).
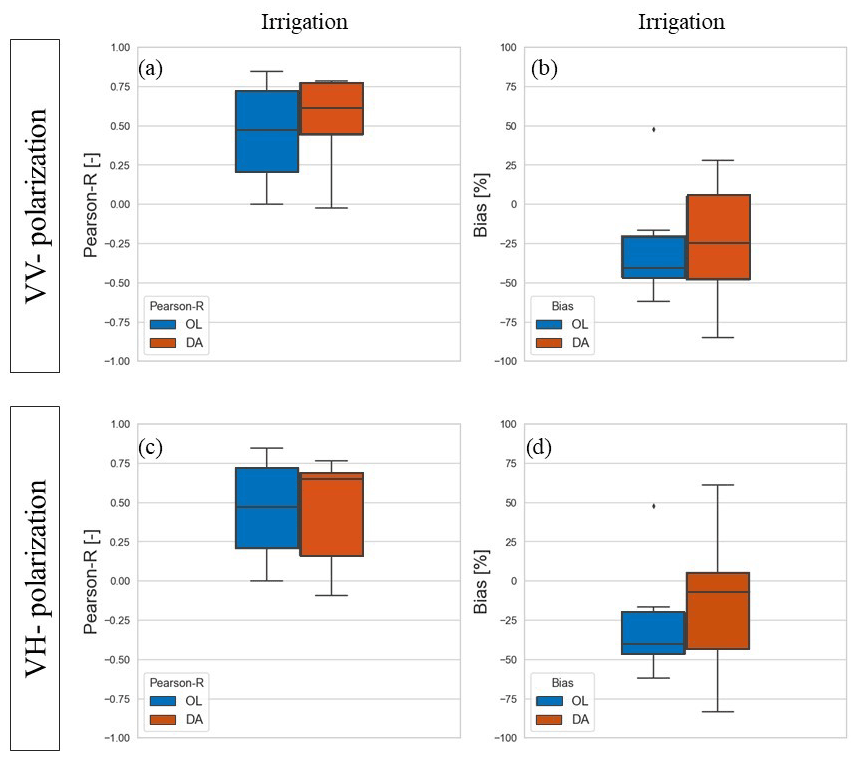
Figure 8Evaluation in terms of (a, c) Pearson R and (b, d) percentage bias of irrigation simulations for the German test sites, containing the 8 irrigated LIS pixels with percentage irrigated area larger than 25 %. Blue boxplots refer to the OL run, while orange boxplots refer to the DA run, with (a–b) the Sentinel-1 γ0 VV DA and (c–d) for the Sentinel-1 γ0 VH DA.
Unlike the Italian site, the Lower Saxony site suffers from an irrigation underestimation by the model, in line with a previous study by Zappa et al. (2021), which used Sentinel-1 SSM retrievals to detect and quantify irrigation at the Lower Saxony test site. Figure 8b shows that the median bias is reduced from a value of −40.8 % for the OL to a value of −24.6 % for Sentinel-1 γ0 VV DA, and Fig. 8d shows a reduction from −40.8 % for OL to −7.6 % for Sentinel-1 γ0 VH DA. Despite the improvement in median values for the bias, the overall distribution of the bias is wider than for the OL. Reasons for that might be related to the specificity of the different fields and the difference in the performance for different spatial scales (see Sect. 3.2.1) when different fields of different size are bulked altogether. Beyond this, also the consistency between simulated backscatter by the coupled Noah-MP-WCM and Sentinel-1 data for some specific pixels might exert a role in spreading the distribution of the bias with respect to the OL. The latter can be caused by both poor model performance (due to the quality of the forcing, model parameters and static maps) and the quality of the Sentinel-1 γ0 data.
4.1 Data assimilation
In this study, we built a DA system for the assimilation of Sentinel-1 γ0 VV or VH data into the Noah-MP LSM in order to test the ability of Sentinel-1 γ0 to improve irrigation quantification through the update of both SSM and LAI. The regional-scale analysis of internal DA diagnostics provided evidence that the DA system was self-consistent and near-optimal. Local deviations from desirable reductions in ensemble spread or from optimal O−F statistics or higher absolute SSM or LAI increments were mainly related to poor input data to the Noah-MP LSM. Confirming what was previously found in Modanesi et al. (2021), soil texture uncertainties play an important role in reducing (or increasing) the effectiveness of the DA system. This is because the soil texture affects the root-zone soil moisture and FC, which contribute to the activation of the irrigation scheme. The silty-loam soil texture generally shows a reduced variability in the soil moisture dynamics compared to more sandy textures, resulting in lower irrigation amounts, especially over wetter climates (i.e. Germany). Assuming that the Sentinel-1 γ0 contains information on soil moisture and vegetation, the DA system should correct the land state to improve the forecasted irrigation, which might be poor when produced by a model only, due to poor input parameterization or errors in MERRA-2 precipitation input as compared to in situ precipitation (which was observed in the evaluation over the Italian test sites). However, this seems to be challenging in our experiments considering that the Sentinel-1 γ0 DA could also have updated soil moisture to a wetter condition to account for the presence of irrigation before the model would have triggered irrigation, which consequently delays or skips a simulation of irrigation in the DA output. Another important factor that influences regional DA diagnostics is the irrigation fraction information. This information was lacking in the GRIPC input for the pilot site in Germany, which forced us to simulate irrigation only over pixels where known irrigated fields were located, notwithstanding that also other cropland pixels could be irrigated, especially during the drier conditions that affected the northern countries during the 2018 summer months in northern European countries (i.e. the 2018 north-western Europe drought; Drouard et al., 2019). The standard deviation of normalized O−F higher than unity in the eastern area of the German pilot site could thus be related to the absence of irrigation simulations over areas which are actually irrigated. The lack of updated irrigation fraction input at global scale is still a strong limitation, although many studies have focused on monitoring irrigated lands worldwide in the last decade (Ambika et al., 2016; Bazzi et al., 2019; Dari et al., 2020; Gao et al., 2018).
In the test site analysis, we focused on three different aspects: (i) the added value of the DA experiments compared to the OL runs and the role of the Sentinel-1 γ0 polarization; (ii) the limitation of the Noah-MP parameterization and, more generally, of the DA system in improving irrigation simulations; and finally, (iii) the spatial-scale difference between the irrigation benchmark and irrigation simulations.
In Italy, we found an improvement due to DA in terms of SSM, LAI and ET, compared against RS retrievals (i.e. ASCAT SSM, PROBA-V LAI and MODIS ET). Sentinel-1 γ0VV DA provided a larger contribution to SSM performances, whereas Sentinel-1 γ0 VH DA improved mostly the vegetation and vegetation-related states (LAI and ET). This could be expected based on previous literature (i.e. Bauer-Marschallinger et al., 2018; Vreugdenhil et al., 2020, 2018) and the previous study by Modanesi et al. (2021) over the Italian test sites. Our findings also showed how the Sentinel-1 γ0 VV DA has a larger impact on the temporal dynamics of irrigation, whereas the VH polarization has a stronger influence in adjusting the bias, and one potential reason could be the high sensitivity of the vegetation to root-zone soil moisture and vice versa (Modanesi et al., 2021). Similar conclusions were obtained by Nie et al. (2022) over Morocco. This recent study showed how the assimilation of MODIS LAI into Noah-MP v.4.0.1, with and without activating irrigation, provides critical information to improve the root-zone soil moisture and more generally water–energy–carbon fluxes.
Following the rationale that weather forecasts would be improved if land surface conditions are better constrained, the hope was to also improve irrigation forecasts with better constrained land surface conditions. However, the latter is only true if the assumption holds that the irrigation model produces the best irrigation estimates for the best estimates of land surface state variables. The latter assumption strongly depends on a good characterization of soil, vegetation and irrigation parameters, which was found to be a limitation for the DA system. For instance, the OL run provided a large overestimation or underestimation of the irrigation quantities (depending on the study area) that can be attributed to limited parameterization of the irrigation scheme like, for instance, detailed information on irrigation fraction input, dynamic crop rotation and rooting depths, as well as a poor description of the crop phenology in Noah-MP. The DA experiments helped in reducing the irrigation overestimation (or underestimation) at some, but not all, sites. This means that if the sprinkler irrigation scheme is not well parameterized, the DA system is not able to strongly correct the OL runs. In the case of biased state variables or flux simulations, it is generally more interesting to study the effect of DA on anomalies from (multi-year) climatological conditions, but such an analysis could not be performed with the limited amount of available benchmark data.
The limited spatial coverage and scale of the benchmark data is another reason of concern in the evaluation of the DA results. The Sentinel-1 DA appears to degrade the temporal dynamics (Pearson R) of the biweekly irrigation estimates relative to the OL, when compared to the small-scale (Budrio) benchmark. This can be explained by the spatial mismatch between the 1 km Sentinel-1 signal (which can include multiple fields irrigated at different times) and the irrigation information related to the small Budrio fields. However, this degradation is not significant or not found, when the simulations at multiple LIS pixels are aggregated (Faenza) or the statistics for multiple sites are lumped (Lower Saxony), respectively. In Germany, the median Pearson R over the irrigated pixels increased, especially for the Sentinel-1 γ0 VV DA experiment, and a reduction of the median bias was found for the Sentinel-1 γ0 VH DA experiment.
4.2 Limitations and shortcomings
The evaluation highlighted many aspects that can be improved for a more reliable irrigation estimation in a DA system which involves the Noah-MP LSM, with an irrigation scheme and innovative Sentinel-1 γ0 observations. Although we obtained good results in terms of average DA diagnostics, it should be noted that the system is influenced by errors from the LSM, the irrigation scheme and the observation operator, which can interact and compensate each other resulting in suboptimal assimilation results. Based on Modanesi et al. (2021), the best unbiased WCM parameters were obtained, but a single parameter set was used for each model grid cell, regardless of the crop-type year variability. In particular, over the Po Valley, agricultural practices are characterized by crop rotation, and the different structural effects of crop types on γ0 observations can lead to an interannual variability that is only partly represented by soil moisture and LAI and that could deteriorate model estimates (i.e. irrigation) in the DA runs. Additionally, the Sentinel-1 γ0 data show slightly different statistics for different orbits, and their combination results in a reduction of the signal-to-noise ratio, impacting time series analysis. We think that the inclusion of dynamic crop information and the assimilation of γ0 data per orbit would improve the results, and this is a future step of this work that we are currently investigating.
In terms of irrigation simulations, we found that absolute irrigation amounts and timing of irrigation estimated by the irrigation scheme strongly depend on soil (e.g. texture), vegetation (e.g. crop type) and irrigation (e.g. “intensity” or area fraction) parameters. These parameters are now based on global datasets that might not be ideal for regional to local applications, not being dynamic and updated. Likewise, irrigation estimates depend on a correct representation of natural forcing input, here reanalysis data, which is unlikely to be accurate at the local scale (where the weather is itself influenced by irrigation).
Furthermore, the irrigation estimates obtained with inclusion of DA do not always outperform the model-only estimates. The main reason is that the irrigation model does not necessarily produce the best irrigation estimates for the best estimates of land surface state variables at the test sites. In addition, if the soil moisture is updated to wetter conditions to include irrigation before the model would forecast it, then the irrigation simulation will be skipped or delayed in the DA results. Thus, in line with the suggestions by Lawston et al. (2017), besides optimizing the DA itself, future research should also focus on improving the irrigation model to optimally use the observational information contained in the Sentinel-1 γ0.
Another important aspect is related to the temporal and spatial variability of irrigation. We found that irrigation results become increasingly uncertain (and depend more on the irrigation parameterization) at shorter, e.g. daily, timescales. Soil moisture and vegetation increments can indeed affect the irrigation dynamics at short-term periods (i.e. daily timescale), and the benchmark data are also not representative of the effective irrigation needs in the short term because of water management policies. It can be expected that the interannual variability in irrigation can be better estimated, as also suggested by Lawston et al. (2017). Furthermore, we found that the agreement between benchmark data and simulations of irrigation quantities increases in an analysis at pixel level or at small-district spatial scale (Italy), showing the limitation of the system in providing information at plot scale, when simulations and RS observations are provided at coarser spatial resolution (i.e. 0.01∘).
Three last aspects need to be highlighted: (i) a robust evaluation analysis of land surface variables is not straightforward considering that RS observations at coarse spatial resolution (i.e. ASCAT) or constrained by reanalysis data (i.e. MODIS ET) do not necessarily provide accurate information on irrigation (Zaussinger et al., 2019); (ii) additionally, evaluating irrigation estimates is also more challenging due to the scarce availability of information on the irrigation management (Massari et al., 2021); and (iii) finally, the disagreement between in situ reference data and irrigation estimates obtained from the model only can be partly explained by the actual in situ irrigation system management, which depends on water availability and policies unknown by the modelling system. In this context, although irrigation data are compared at biweekly timescale, and DA is overall expected to improve the simulation of irrigation temporal dynamics, the temporal resolution of Sentinel-1 (∼ 3 d over the study areas) could imply some irrigation events have been missed, thus affecting the DA results.
To test the goodness of the EnKF assumptions over the study areas, future research could benefit from an experiment using precipitation plus known irrigation as modified input forcing. However, high-quality gridded irrigation products are not yet available, and the difference between the spatial resolution of MERRA-2 forcings and irrigation input will complicate such an experiment. As a final note, future research should also focus on investigating different DA techniques. In particular, the DA analysis could benefit from the use of particle filtering, which has proven useful from a mass-balance perspective, also for irrigation applications (Abolafia-Rosenzweig et al., 2019).
Information on the actual irrigation quantities used for agricultural purposes is still missing, and a correct quantification of irrigation is a challenging topic. The joint use of models and RS observations (which contain irrigation information) can help to fill this gap while also providing irrigation estimates at high temporal scale and medium–high spatial resolution.
In this study we assimilated, in two different experiments, 1 km Sentinel-1 γ0 VV and VH polarization into the Noah-MP LSM, equipped with a sprinkler irrigation scheme, for the joint update of soil moisture and vegetation state variables. The objective was to test if irrigation water amounts, simulated by the irrigation scheme, can be optimally estimated when optimal soil moisture and vegetation estimates are available through DA. Additionally, we aimed at (i) testing the consistency of the DA system; (ii) testing the effects of DA on irrigation and model state predictions with a specific focus on differences due to the assimilation of Sentinel-1 γ0 data in co- or cross-polarization; and, finally, (iii) unveiling the limitations of the system in terms of input parameters, DA shortcomings, spatial-scale analysis and benchmark uncertainties.
The main conclusions drawn from our evaluation highlight shortcomings of the system and can be summarized as follows.
-
The developed DA system is consistent and close to optimality, but it could benefit from enhanced model inputs, such as more reliable soil texture maps or the introduction of dynamic and high-resolution crop maps, which could improve both soil moisture and vegetation simulations (input for the WCM calibration). Additional effort will also be needed in future research to account for different Sentinel-1 orbits, both in the WCM calibration and in the DA system, which will provide a gain of the signal-to-noise ratio, with a general benefit in time series analysis.
-
The Sentinel-1 γ0 observations contain useful information about SSM and LAI over irrigated areas, confirming Modanesi et al. (2021), and the γ0 polarization has a considerable influence on the DA results. For instance, the Sentinel-1 γ0 VV DA mainly improves temporal dynamics of SSM and irrigation, whereas the Sentinel-1 γ0 VH DA seems to have a stronger influence on vegetation and in adjusting temporary biases. We hypothesize that this could be due to the high sensitivity of the vegetation to root-zone soil moisture (and vice versa), but further investigation is needed to understand if the main impact comes from the stronger vegetation updating or the potential stronger updates in root-zone soil moisture.
-
The Noah-MP LSM input and irrigation parameterization affect the OL and DA estimates, providing strong over- or underestimations of irrigation, depending on the study area. These limitations are mainly related to soil texture uncertainties, lack of crop-type inputs and outdated irrigated fractional area information, which affect the results of the reference OL run. In this context, the DA can only correct the estimates of irrigation amounts, if the irrigation simulation is not excessively biased, meaning that future research should focus on improving the irrigation model. Alternatively, even with biased irrigation simulations, the DA should be able to correct for the interannual variability in irrigation estimates, but the record of available benchmark data on irrigation is insufficient at this time to confirm this hypothesis.
-
When comparing irrigation simulations and benchmark data, the spatial and temporal resolution play an important role. Irrigation estimates were here evaluated at a biweekly scale, to limit the influence of short-term analysis increments on the activation of the irrigation scheme and to reduce mismatches with benchmark data due to human choices in the timing of irrigation application. In any case, results in terms of temporal dynamics and bias could also be affected by the temporal resolution of Sentinel-1 observations (∼ 3 d), which could miss strong dry-downs that would trigger an irrigation event. Furthermore, an occasional DA update towards wetter soil moisture due to irrigation before the model would forecast irrigation would possibly cancel an irrigation event in the DA output. Additional improvements could be obtained in DA analysis with higher-temporal-resolution products, as also demonstrated by Azimi et al. (2020). Furthermore, the evaluation in terms of irrigation quantities provides better results when irrigation benchmark data and the model have a similar spatial resolution. The evaluation is generally difficult due to the scant reporting of irrigation, and extra uncertainty can derive from the reliability of in situ irrigation estimates.
This study points out that future efforts will be needed to improve irrigation estimates through the joint use of LSMs and Sentinel-1 observations, to allow for a more realistic description of the hydrological cycle and more reliable irrigation simulations over irrigated areas.
This Appendix has the objective to describe the WCM equation, stated in Sect. 2.4, in more detail. The γ0 is described as the sum of the backscatter from the vegetation () and from the bare soil (), attenuated by a t2 coefficient, representing the two-way attenuation from the vegetation layer:
where
Equations (A2) and (A3) refer to the vegetation-related terms. In particular, V1 and V2 represent two bulk vegetation descriptors, the first one accounting for the direct vegetation γ0 and the second one representing the attenuation. We assume V1 = V2 = LAI following previous studies (Modanesi et al., 2021; Lievens et al., 2017a; Baghdadi et al., 2017). A (–) and B (–) are the two fitting parameters related to direct vegetation and attenuation respectively, while θ represents the incidence angle, here set to zero considering that the γ0 terrain-flattened version does not include this information. Equation (A2), as well as Eq. (A1), is computed in linear scale.
Equation (A4) accounts for the soil-related term, which is described in a simple linear approach, as a function of SSM, following the work by Lievens et al. (2017a). The C and D parameters are fitted in decibels (dB) and decibels per cubic metre per cubic metre (dB m−3 m−3), respectively, but is transformed back to linear scale in Eq. (A1). Those parameters, as well as A (–) and B (–), are calibrated separately for each polarization and for each grid cell.
The ASCAT surface soil moisture products H115 and H116 can be downloaded from https://doi.org/10.15770/EUM_SAF_H_0006 (H SAF, 2020). Sentinel-1A/B data are from the ESA and Copernicus Sentinel satellites project and were processed using the ESA Sentinel Application Platform (SNAP; https://step.esa.int/main/download/snap-download/; last access: 21 September 2022) and including standard processing techniques. Data from PROBA-V are available at https://land.copernicus.vgt.vito.be/PDF/portal/Application.html#Browse;Root=512260;Collection=1000083;Time=NORMAL,NORMAL,-1,,,-1,, (last access: 13 September 2022; Verger et al., 2014). MERRA-2 data are available from MDISC, which is managed by the NASA Goddard Earth Sciences (GES) Data and Information Services Center (DISC; https://disc.gsfc.nasa.gov/datasets?project=MERRA-2, last access: 13 September 2022; Gelaro et al., 2017). The product MOD16A2 Version 6 Evapotranspiration/Latent Heat Flux product is available at the following Earth Engine Data Catalog: https://doi.org/10.5067/MODIS/MOD16A2.006 (Running et al., 2017). The LIS source code and default input parameters are available via https://lis.gsfc.nasa.gov/ (last access: 13 September 2022) and https://github.com/NASA-LIS/LISF (last access: 13 September 2022; Kumar et al., 2006; Peters-Lidard et al., 2007). The Copernicus Global Land Service (CGLS) 100 m global land cover map for the year 2015 is available at https://lcviewer.vito.be/2015 (lLast access: 13 September 2022; Buchorn et al, 2020). In situ data are available under request to the original providers, Canale Emiliano Romagnolo (CER; https://consorziocer.it/it/, last access: 20 September 2022) for the irrigation data over the Po Valley (Italy) and Claas Nendel from the Leibniz Centre for Agricultural Landscape Research (ZALF) for irrigation data over Germany.
The supplement related to this article is available online at: https://doi.org/10.5194/hess-26-4685-2022-supplement.
SM designed and coordinated the study and did the analyses. CM, GJMDL and MB designed and coordinated the study and helped in the data analysis and interpretation. HL, AT, LB and LZ helped in the interpretation of the results and the data processing and collection. All authors contributed to the editing of the manuscript.
The contact author has declared that none of the authors has any competing interests.
Publisher’s note: Copernicus Publications remains neutral with regard to jurisdictional claims in published maps and institutional affiliations.
The authors would like to thank the European Space Agency (ESA) for the funding support as part of the IRRIGATION+ project (contract no. 4000129870/20/I-NB). For details, please visit https://esairrigationplus.org/ (last access: 13 September 2022). We also acknowledge the funding from the Belgian Science Policy Office (BELSPO project SR/00/376 EO-DAHR). Additional acknowledgements go to the Canale Emiliano Romagnolo (CER; Emilia Romagna, Italy) for providing irrigation data over the irrigated test sites in Italy and to Claas Nendel from the Leibniz Centre for Agricultural Landscape Research (ZALF) for providing irrigation data over Germany. The authors want to acknowledge the Vlaams Supercomputer Centrum (VSC) high-performance computing (HPC) for providing the computational resources needed to realize this study (https://www.vscentrum.be/, last access: 13 September 2022). Sara Modanesi would additionally like to acknowledge the Italian National Research Council (CNR) Short Term Mobility (STM) 2020 programme, which funded a month of residence in Leuven to complete this research.
This research has been supported by the European Space Agency (grant no. 4000129870/20/I-NB) and the Belgian Science Policy Office (BELSPO, project SR/00/376 EO-DAHR).
This paper was edited by Narendra Das and reviewed by two anonymous referees.
Abolafiaâ Rosenzweig, R., Livneh, B., Small, E. E., and Kumar, S. V.: Soil Moisture Data Assimilation to Estimate Irrigation Water Use, J. Adv. Model. Earth Syst., 11, 3670–3690, https://doi.org/10.1029/2019MS001797, 2019.
Albergel, C., Munier, S., Bocher, A., Bonan, B., Zheng, Y., Draper, C., Leroux, D. J., and Calvet, J.-C.: LDAS-Monde sequential assimilation of satellite derived observations applied to the contiguous US: An ERA-5 driven reanalysis of the land surface variables, Remote Sens., 10, 1627, https://doi.org/10.3390/rs10101627, 2018.
Alter, R. E., Im, E.-S., and Eltahir, E. A.: Rainfall consistently enhanced around the Gezira Scheme in East Africa due to irrigation, Nat. Geosci., 8, 763–767, https://doi.org/10.1038/ngeo2514, 2015.
Ambika, A. K., Wardlow, B., and Mishra, V.: Remotely sensed high resolution irrigated area mapping in India for 2000 to 2015, Sci. Data, 3, 160118, https://doi.org/10.1038/sdata.2016.118, 2016.
Attema, E. P. W. and Ulaby, F. T.: Vegetation modelled as a water cloud, Radio Sci., 13, 357–364, https://doi.org/10.1029/RS013i002p00357, 1978.
Azimi, S., Dariane, A. B., Modanesi, S., Bauer-Marschallinger, B., Bindlish, R., Wagner, W., and Massari, C.: Assimilation of Sentinel 1 and SMAP–based satellite soil moisture retrievals into SWAT hydrological model: the impact of satellite revisit time and product spatial resolution on flood simulations in small basins, J. Hydrol., 581, 124367, https://doi.org/10.1016/j.jhydrol.2019.124367, 2020.
Baghdadi, N., Hajj, M. E., Zribi, M., and Bousbih, S.: Calibration of the water cloud model at C-band for winter crop fields and grasslands, Remote Sens.-Basel, 9, 969, https://doi.org/10.3390/rs9090969, 2017.
Bauer-Marschallinger, B., Freeman, V., Cao, S., Paulik, C., Schaufler, S., Stachl, T., Modanesi, S., Massari, C., Ciabatta, L., Brocca, L., and Wagner, W.: Toward Global Soil Moisture Monitoring With Sentinel-1: Harnessing Assets and Overcoming Obstacles, IEEE T. Geosci. Remote, 57, 520–539, https://doi.org/10.1109/TGRS.2018.2858004, 2018.
Bazzi, H., Baghdadi, N., Ienco, D., ElHajj, M., Zribi, M., Belhouchette, H., Escorihuela, M. J., and Demarez, V.: Mapping Irrigated Areas Using Sentinel-1 Time Series in Catalonia, Spain, Remote Sens.-Basel, 11, 1836, https://doi.org/10.3390/rs11151836, 2019.
Bechtold, M., De Lannoy, G. J. M., Reichle, R. H., Roose, D., Balliston, N., Burdun, I., Devito, K., Kurbatova, J., Strack, M., and Zarov, E. A.: Improved groundwater table and L-band brightness temperature estimates for Northern Hemisphere peatlands using new model physics and SMOS observations in a global data assimilation framework, Remote Sens. Environ., 246, 111805, https://doi.org/10.1016/j.rse.2020.111805, 2020.
Brocca, L., Tarpanelli, A., Filippucci, P., Dorigo, W., Zaussinger, F., Gruber, A., and Fernández-Prieto, D.: How much water is used for irrigation? A new approach exploiting coarse resolution satellite soil moisture products, Int. J. Appl. Earth Obs., 73, 752–766, https://doi.org/10.1016/j.jag.2018.08.023, 2018.
Brombacher, J., de Oliveira Silva, I. R., Degen, J., and Pelgrum, H.: A novel evapotranspiration based irrigation quantification method using the hydrological similar pixels algorithm, Agr. Water Manage., 267, 107602, https://doi.org/10.1016/j.agwat.2022.107602, 2022.
Buchhorn, M., Lesiv, M., Tsendbazar, N. E., Herold, M., Bertels, L., and Smets, B.: Copernicus global land cover layers – collection 2, Remote Sens., 12, 1044, https://doi.org/10.3390/rs12061044, 2020 (data available at: https://lcviewer.vito.be/2015, last access: 13 September 2022).
Busschaert, L., de Roos, S., Thiery, W., Raes, D., and De Lannoy, G. J. M.: Net irrigation requirement under different climate scenarios using AquaCrop over Europe, Hydrol. Earth Syst. Sci., 26, 3731–3752, https://doi.org/10.5194/hess-26-3731-2022, 2022.
Ceppi, A., Ravazzani, G., Corbari, C., Salerno, R., Meucci, S., and Mancini, M.: Real-time drought forecasting system for irrigation management, Hydrol. Earth Syst. Sci., 18, 3353–3366, https://doi.org/10.5194/hess-18-3353-2014, 2014.
Chen, F. and Dudhia, J.: Coupling an advanced land surface hydrology model with the Penn State-NCAR MM5 modeling system. Part I: Model implementation and sensitivity, Mon. Weather Rev., 129, 569–585, https://doi.org/10.1175/1520-0493(2001)129<0569:CAALSH>2.0.CO;2, 2001.
Chen, F., Mitchell, K., Schaake, J., Xue, Y., Pan, H. L., Koren, V., Duan, Q. Y., Ek, M., and Betts, A.: Modeling of land surface evaporation by four schemes and comparison with fife observations, J. Geophys. Res.-Atmos., 101, 7251–7268, https://doi.org/10.1029/95JD02165, 1996.
Dari, J., Brocca, L., Quintana-Seguí, P., Escorihuela, M. J., Stefan, V., and Morbidelli, R.: Exploiting High-Resolution Remote Sensing Soil Moisture to Estimate Irrigation Water Amounts over a Mediterranean Region, Remote Sens.-Basel, 12, 2593, https://doi.org/10.3390/rs12162593, 2020.
Dari, J., Quintana-Seguí, P., Escorihuela, M.J., Stefan, V., Brocca, L., and Morbidelli, R.: Detecting and mapping irrigated areas in a Mediterranean environment by using remote sensing soil moisture and a land surface model, J. Hydrol., 596, 126129, https://doi.org/10.1016/j.jhydrol.2021.126129, 2021.
Das, N. N., Entekhabi, D., Dunbar, R. S., Chaubell, M. J., Colliander, A., Yueh, S., Jagdhuber, T., Chen, F., Crow, W., O'Neill, P. E., Walker, J. P., Berg, A., Bosch, D. D., Caldwell, T., Cosh, M. H., Collins, C. H., Lopez-Baeza, E., and Thibeault, M.: The SMAP and Copernicus Sentinel 1A/B microwave active-passive high resolution surface soil moisture product, Remote Sens. Environ. 233, 111380, https://doi.org/10.1016/j.rse.2019.111380, 2019.
De Lannoy, G. J. and Reichle, R. H.: Global assimilation of multiangle and multipolarization SMOS brightness temperature observations into the GEOS-5 catchment land surface model for soil moisture estimation, J. Hydrometeorol., 17, 669–691, https://doi.org/10.1175/JHM-D-15-0037.1, 2016a.
De Lannoy, G. J. M. and Reichle, R. H.: Assimilation of SMOS brightness temperatures or soil moisture retrievals into a land surface model, Hydrol. Earth Syst. Sci., 20, 4895–4911, https://doi.org/10.5194/hess-20-4895-2016, 2016b.
De Lannoy, G. J. M., Reichle, R. H., and Vrugt, J. A.: Uncertainty quantification of GEOS-5 L-band radiative transfer model parameters using Bayesian inference and SMOS observations, Remote Sens. Environ., 148, 146–157, https://doi.org/10.1016/j.rse.2014.03.030, 2014.
De Rosnay, P., Polcher, J., Laval, K., and Sabre, M.: Integrated parameterization of irrigation in the land surface model ORCHIDEE. Validation over Indian Peninsula, Geophys. Res. Lett., 30, 1986, https://doi.org/10.1029/2003GL018024, 2003.
De Santis, D., Biondi, D., Crow, W. T., Camici, S., Modanesi, S., Brocca, L., and Massari, C.: Assimilation of Satellite Soil Moisture Products for River Flow Prediction: An Extensive Experiment in Over 700 Catchments Throughout Europe, Water Resour. Res., 57, e2021WR029643, https://doi.org/10.1029/2021WR029643, 2021.
Drouard, M., Kornhuber, K., and Woollings, T.: Disentangling dynamic contributions to summer 2018 anomalous weather over Europe, Geophys. Res. Lett., 46, 12537–12546, https://doi.org/10.1029/2019GL084601, 2019.
Druel, A., Munier, S., Mucia, A., Albergel, C., and Calvet, J.-C.: Implementation and validation of a new irrigation scheme in the ISBA land surface model, Geosci. Model Dev. Discuss. [preprint], https://doi.org/10.5194/gmd-2021-332, in review, 2021.
Evans, J. P. and Zaitchik, B. F.: Modeling the large-scale water balance impact of different irrigation systems, Water Resour. Res., 44, W08448, https://doi.org/10.1029/2007WR006671, 2008.
Evensen, G.: Sequential data assimilation with a nonlinear quasi-geostrophic model using Monte Carlo methods to forecast error statistics, J. Geophys. Res.-Oceans 99, 10143–10162, https://doi.org/10.1029/94JC00572, 1994.
Evensen, G.: The ensemble Kalman filter: Theoretical formulation and practical implementation, Ocean Dynam., 53, 343–367, https://doi.org/10.1007/s10236-003-0036-9, 2003.
Fang, L., Zhan, X., Hain, C. R., and Liu, J.: Impact of using near real-time green vegetation fraction in Noah land surface model of NOAA NCEP on numerical weather predictions, Adv. Meteorol., 2018, 9256396, https://doi.org/10.1155/2018/9256396, 2018.
FAO: How to feed the world in 2050, Food and Agriculture Organisation, Rome, p. 35, https://www.fao.org/fileadmin/templates/wsfs/docs/expert_paper/How_to_Feed_the_World_in_2050.pdf (last access: 23 September 2022), 2009.
Ferrant, S., Selles, A., Le Page, M., AlBitar, A., Mermoz, S., Gascoin, S., Bouvet, A., Ahmed, S., and Kerr, Y.: Sentinel-1&2 for near real time cropping pattern monitoring in drought prone areas. application to irrigation water needs in telangana, South-India, Int. Arch. Photogramm. Remote Sens. Spatial Inf. Sci., XLII-3/W6, 285–292, https://doi.org/10.5194/isprs-archives-XLII-3-W6-285-2019, 2019.
Foley, J. A., Ramankutty, N., Brauman, K. A., Cassidy, E. S., Gerber, J. S., Johnston, M., Mueller, N. D., O'Connell, C., Ray, D. K., West, P. C., Balzer, C., Bennett, E. M., Carpenter, S. R., Hill, J., Monfreda, C., Polasky, S., Rockström, J., Sheehan, J., Siebert, S., Tilman, D., and Zaks, D. P. M.: Solutions for a cultivated planet, Nature, 478, 337–342, https://doi.org/10.1038/nature10452, 2011.
Gao, Q., Zribi, M., Escorihuela, M., Baghdadi, N., and Segui, P.: Irrigation mapping using Sentinel-1 time series at field scale, Remote Sens.-Basel, 10, 1495, https://doi.org/10.3390/rs10091495, 2018.
Gelaro, R., McCarty, W., Suárez, M. J., Todling, R., Molod, A., Takacs, L., Randles, C. A., Darmenov, A., Bosilovich, M. G., Reichle, R., Wargan, K., Coy, L., Cullather, R., Draper, C., Akella, S., Buchard, V., Conaty, A., da Silva, A. M., Gu, W., Kim, G.-K., Koster, R., Lucchesi, R., Merkova, D., Nielsen, J. E., Partyka, G., Pawson, S., Putman, W., Rienecker, M., Schubert, S. D., Sienkiewicz, M., and Zhao, B.: The modern-era retrospective analysis for research and applications, version 2 (MERRA-2), J. Climate, 30, 5419–5454, https://doi.org/10.1175/JCLI-D-16-0758.1, 2017 (data available at: https://disc.gsfc.nasa.gov/datasets?project=MERRA-2, last access: 13 September 2022).
Girotto, M., De Lannoy, G. J., Reichle, R. H., Rodell, M., Draper, C., Bhanja, S. N., and Mukherjee, A.: Benefits and pitfalls of GRACE data assimilation: A case study of terrestrial water storage depletion in India, Geophys. Res. Lett., 44, 4107–4115, https://doi.org/10.1002/2017GL072994, 2017.
Gleick, P. H.: Water use, Annu. Rev. Env. Resour., 28, 275–314, 2003.
Haddeland, I., Heinke, J., Biemans, H., Eisner, S., Flörke, M., Hanasaki, N., Konzmann, M., Ludwig, F., Masaki, Y., and Schewe, J.: Global water resources affected by human interventions and climate change, P. Natl. Acad. Sci. USA, 111, 3251–3256, https://doi.org/10.1073/pnas.1222475110, 2014.
H SAF: ASCAT Surface Soil Moisture Climate Data Record v5 12.5 km sampling – Metop, EUMETSAT SAF on Support to Operational Hydrology and Water Management [data set], https://doi.org/10.15770/EUM_SAF_H_0006, 2020.
Jalilvand, E., Tajrishy, M., Hashemi, S. A. G., and Brocca, L.: Quantification of irrigation water using remote sensing of soil moisture in a semi-arid region, Remote Sens. Environ., 231, 111226, https://doi.org/10.1016/j.rse.2019.111226, 2019.
Jalilvand, E., Abolafia-Rosenzweig, R., Tajrishy, M., and Das, N. N.: Evaluation of SMAP-Sentinel1 High-Resolution Soil Moisture Data to Detect Irrigation over Agricultural Domain. IEEE J. Sel. Top. Appl. Earth Obs. Remote Sens., 14, 10733–10747, https://doi.org/10.1109/JSTARS.2021.3119228, 2021.
Kumar, S. V., Peters-Lidard, C., Tian, Y., Houser, P., Geiger, J., Olden, S., Lighty, L., Eastman, J., Doty, B., and Dirmeyer, P.: Land information system: An interoperable framework for high resolution land surface modeling, Environ. Model. Softw., 21, 1402–1415, https://doi.org/10.1016/j.envsoft.2005.07.004, 2006 (code available at: https://github.com/NASA-LIS/LISF, last access: 13 September 2022).
Kumar, S. V., Reichle, R. H., and Peters-Lidard, C. D.: A land surface data assimilation framework using the land information system: Description and applications, Adv. Water Resour., 31,1419–1432, https://doi.org/10.1016/j.advwatres.2008.01.013, 2008.
Kumar, S. V., Peters-Lidard, C. D., Mocko, D., Reichle, R., Liu, Y., Arsenault, K. R., Xia, Y., Ek, M., Riggs, G., and Livneh, B.: Assimilation of remotely sensed soil moisture and snow depth retrievals for drought estimation, J. Hydrometeorol., 15, 2446–2469, https://doi.org/10.1175/JHM-D-13-0132.1, 2014.
Kumar, S. V., Peters-Lidard, C. D., Santanello, J. A., Reichle, R. H., Draper, C. S., Koster, R. D., Nearing, G., and Jasinski, M. F.: Evaluating the utility of satellite soil moisture retrievals over irrigated areas and the ability of land data assimilation methods to correct for unmodeled processes, Hydrol. Earth Syst. Sci., 19, 4463–4478, https://doi.org/10.5194/hess-19-4463-2015, 2015.
Kumar, S. V., Mocko, D. M., Wang, S., Peters-Lidard, C. D., and Borak, J.: Assimilation of remotely sensed Leaf Area Index into the Noah-MP land surface model: Impacts on water and carbon fluxes and states over the Continental U.S., J. Hydrometeorol., 20, 1359–1377, https://doi.org/10.1175/JHM-D-18-0237.1, 2019.
Kumar, S. V., Holmes, T. R., Bindlish, R., de Jeu, R., and Peters-Lidard, C.: Assimilation of vegetation optical depth retrievals from passive microwave radiometry, Hydrol. Earth Syst. Sci., 24, 3431–3450, https://doi.org/10.5194/hess-24-3431-2020, 2020.
Kustu, M. D., Fan, Y., and Robock, A.: Large-scale water cycle perturbation due to irrigation pumping in the US High Plains: A synthesis of observed streamflow changes, J. Hydrol., 390, 222–244, https://doi.org/10.1016/j.jhydrol.2010.06.045, 2010.
Lawston, P. M., Santanello, J. A., Zaitchik, B. F., and Rodell, M.: Impact of irrigation methods on land surface model spinup and initialization of WRF forecasts, J. Hydrometeorol., 16, 1135–1154, https://doi.org/10.1175/JHM-D-14-0203.1, 2015.
Lawston, P. M., Santanello Jr., J. A., and Kumar, S. V.: Irrigation signals detected from SMAP soil moisture retrievals, Geophys. Res. Lett., 44, 11–860, https://doi.org/10.1002/2017GL075733, 2017.
Lievens, H., Martens, B., Verhoest, N. E. C., Hahn, S., Reichle, R. H., and Miralles, D. G.: Assimilation of global radar backscatter and radiometer brightness temperature observations to improve soil moisture and land evaporation estimates, Remote Sens. Environ., 189, 194–210, https://doi.org/10.1016/j.rse.2016.11.022, 2017a.
Lievens, H., Reichle, R. H., Liu, Q., De Lannoy, G. J. M., Dunbar, R. S., Kim, S. B., Das, N. N., Cosh, M., Walker, J. P., and Wagner, W.: Joint Sentinel-1 and SMAP data assimilation to improve soil moisture estimates, Geophys. Res. Lett., 44, 6145–6153, https://doi.org/10.1002/2017GL073904, 2017b.
Lievens, H., Demuzere, M., Marshall, H.-P., Reichle, R. H., Brucker, L., Brangers, I., de Rosnay, P., Dumont, M., Girotto, M., Immerzeel, W. W., Jonas, T., Kim, E. J., Koch, I., Marty, C., Saloranta, T., Schöber, J., and De Lannoy, G. J. M.: Snow depth variability in the Northern Hemisphere mountains observed from space, Nat. Commun., 10, 4629, https://doi.org/10.1038/s41467-019-12566-y, 2019.
Liu, C. and Shi, J.: Estimation of vegetation parameters of water cloud model for global soil moisture retrieval using time-series L-Band Aquarius observations, IEEE J. Sel. Top. Appl., 9, 5621–5633, https://doi.org/10.1109/JSTARS.2016.2596541, 2016.
Macelloni, G., Paloscia, S., Pampaloni, P., Marliani, F., and Gai, M.: The relationship between the backscattering coefficient and the biomass of narrow and broad leaf crops, IEEE T. Geosci. Remote, 39, 873–884, https://doi.org/10.1109/36.917914, 2001.
Mahrt, L. and Pan, H.-L.: A two-layer model of soil hydrology, Bound.-Lay. Meteorol., 29, 1–20, https://doi.org/10.1007/BF00119116, 1984.
Massari, C., Modanesi, S., Dari, J., Gruber, A., De Lannoy, G. J., Girotto, M., Quintana-Seguí, P., Le Page, M., Jarlan, L., and Zribi, M.: A review of irrigation information retrievals from space and their utility for users, Remote Sens., 13, 4112, https://doi.org/10.3390/rs13204112, 2021.
Matthews, O. P. and Germain, D. S.: Boundaries and transboundary water conflicts, J. Water Res. Pl., 133, 386–396, https://doi.org/10.1061/(ASCE)0733-9496(2007)133:5(386), 2007.
Modanesi, S., Massari, C., Gruber, A., Lievens, H., Tarpanelli, A., Morbidelli, R., and De Lannoy, G. J. M.: Optimizing a backscatter forward operator using Sentinel-1 data over irrigated land, Hydrol. Earth Syst. Sci., 25, 6283–6307, https://doi.org/10.5194/hess-25-6283-2021, 2021.
Monfreda, C., Ramankutty, N., and Foley, J. A.: Farming the planet: 2. Geographic distribution of crop areas, yields, physiological types, and net primary production in the year 2000, Global Biogeochem. Cy., 22, GB1022, https://doi.org/10.1029/2007GB002947, 2008.
Nie, W., Zaitchik, B. F., Rodell, M., Kumar, S. V., Arsenault, K. R., Li, B., and Getirana, A.: Assimilating GRACE into a land surface model in the presence of an irrigation-induced groundwater trend, Water Resour. Res., 55, 11274–11294, https://doi.org/10.1029/2019WR025363, 2019.
Nie, W., Kumar, S. V., Arsenault, K. R., Peters-Lidard, C. D., Mladenova, I. E., Bergaoui, K., Hazra, A., Zaitchik, B. F., Mahanama, S. P., McDonnell, R., Mocko, D. M., and Navari, M.: Towards effective drought monitoring in the Middle East and North Africa (MENA) region: implications from assimilating leaf area index and soil moisture into the Noah-MP land surface model for Morocco, Hydrol. Earth Syst. Sci., 26, 2365–2386, https://doi.org/10.5194/hess-26-2365-2022, 2022.
Niu, G. Y., Yang, Z. L., Mitchell, K. E., Chen, F., Ek, M. B., Barlage, M., Kumar, A., Manning, K., Niyogi, D., Rosero, E., Tewari, M., and Xia, Y.: The community Noah land surface model with multiparameterization options (Noah-MP): 1. Model description and evaluation with local-scale measurements, J. Geophys. Res.-Atmos., 116, 1–19, https://doi.org/10.1029/2010JD015139, 2011.
Norman, J. M., Kustas, W. P., and Humes, K. S.: Source approach for estimating soil and vegetation energy fluxes in observations of directional radiometric surface temperature, Agr. Forest Meteorol., 77, 263–293, https://doi.org/10.1016/0168-1923(95)02265-Y, 1995.
Olivera-Guerra, L., Merlin, O., and Er-Raki, S.: Irrigation retrieval from Landsat optical/thermal data integrated into a crop water balance model: A case study over winter wheat fields in a semi-arid region, Remote Sens. Environ., 239, 111627, https://doi.org/10.1016/j.rse.2019.111627, 2020.
Ozdogan, M. and Gutman, G.: A new methodology to map irrigated areas using multi-temporal MODIS and ancillary data: An application example in the continental US, Remote Sens. Environ., 112, 3520–3537, https://doi.org/10.1016/j.rse.2008.04.010, 2008.
Ozdogan, M., Rodell, M., Beaudoing, H. K., and Toll, D. L.: Simulating the effects of irrigation over the United States in a land surface model based on satellite derived agricultural data, J. Hydrometeorol., 11, 171–184, https://doi.org/10.1175/2009JHM1116.1, 2010a.
Ozdogan, M., Yang, Y., Allez, G., and Cervantes, C.: Remote sensing of irrigated agriculture: Opportunities and challenges, Remote Sens., 2, 2274–2304, https://doi.org/10.3390/rs2092274, 2010b.
Peel, M. C., Finlayson, B. L., and McMahon, T. A.: Updated world map of the Köppen-Geiger climate classification, Hydrol. Earth Syst. Sci., 11, 1633–1644, https://doi.org/10.5194/hess-11-1633-2007, 2007.
Peña-Arancibia, J. L., McVicar, T. R., Paydar, Z., Li, L., Guerschman, J. P., Donohue, R. J., Dutta, D., Podger, G. M., van Dijk, A. I., and Chiew, F. H.: Dynamic identification of summer cropping irrigated areas in a large basin experiencing extreme climatic variability, Remote Sens. Environ., 154, 139–152, https://doi.org/10.1016/j.rse.2014.08.016, 2014.
Peters-Lidard, C. D., Houser, P. R., Tian, Y., Kumar, S. V., Geiger, J., Olden, S., Lighty, L., Doty, B., Dirmeyer, P., Adams, J., Mitchell, K., Wood, E. F., and Sheffield, J: High-performance Earth system modeling with NASA/GSFC's Land Information System, Innov. Syst. Softw. Eng., 3, 157–165, https://doi.org/10.1007/s11334-007-0028-x, 2007.
Pokhrel, Y., Hanasaki, N., Koirala, S., Cho, J., Yeh, P. J.-F., Kim, H., Kanae, S., and Oki, T.: Incorporating anthropogenic water regulation modules into a land surface model, J. Hydrometeorol., 13, 255–269, https://doi.org/10.1175/JHM-D-11-013.1, 2012.
Po River Watershed Authority: Caratteristiche del bacino del fiume Po e primo esame dell'impatto ambientale delle attività umane sulle risorse idriche, http://www.adbpo.it/PBI/Piano_adottato/Relazione_Generale_07_12_2016.pdf (last access: 30 November 2021), 2016.
Reichle, R. H., McLaughlin, D. B., and Entekhabi, D.: Hydrologic data assimilation with the ensemble Kalman filter, Mon. Weather Rev., 130, 103–114, https://doi.org/10.1175/1520-0493(2002)130<0103:HDAWTE>2.0.CO;2, 2002.
Reichle, R. H., De Lannoy, G. J., Liu, Q., Ardizzone, J. V., Colliander, A., Conaty, A., Crow, W., Jackson, T. J., Jones, L. A., and Kimball, J. S.: Assessment of the SMAP level-4 surface and root-zone soil moisture product using in situ measurements, J. Hydrometeorol., 18, 2621–2645, https://doi.org/10.1175/JHM-D-17-0063.1, 2017.
Reichle, R. H., Liu, Q., Koster, R., Crow, W., De Lannoy, G. J. M., Kimball, J., Ardizzone, J., Bosch, D., Colliander, A., Cosh, M., Kolassa, J., Mahanama, S., McNairn, H., Prueger, J., Starks, P., and Walker, J.: Version 4 of the SMAP Level-4 Soil Moisture Algorithm and Data Product, J. Adv. Model. Earth Sy., 11, 3106–3130, https://doi.org/10.1029/2019MS001729, 2019.
Running, S., Mu, Q., and Zhao, M.: MOD16A2 MODIS/Terra Net Evapotranspiration 8-Day L4 Global 500m SIN Grid V006, NASA EOSDIS Land Processes DAAC [data set], https://doi.org/10.5067/MODIS/MOD16A2.006, 2017.
Salmon, J. M., Friedl, M. A., Frolking, S., and Wisser, D.: Global rain-fed, irrigated, and paddy croplands: A new highnresolution map derived from remote sensing, crop inventories and climate data, Int. J. Appl. Earth Obs., 38, 321–334, https://doi.org/10.1016/j.jag.2015.01.014, 2015.
Siebert, S. and Döll, P.: Quantifying blue and green virtual water contents in global crop production as well as potential production losses without irrigation, J. Hydrol., 384, 198–217, https://doi.org/10.1016/j.jhydrol.2009.07.031, 2010.
Strosser, P., Dworak, T., Delvaux, P. A. G., Berglund, M., Schmidt, G., Mysiak, J., Kossida, M., Iacovides, I., and Ashton, V.: Gap analysis of the water scarcity and droughts policy in the EU European Commission, European Commission, Tender ENV.D.1/SER/2010/0049, 206 pp., 2012.
Van Eekelen, M. W., Bastiaanssen, W. G., Jarmain, C., Jackson, B., Ferreira, F., Van der Zaag, P., Okello, A. S., Bosch, J., Dye, P., Boastidas-Obando, E., Dost, R. J. J., and Luxemburg, W. M. J.: A novel approach to estimate direct and indirect water withdrawals from satellite measurements: A case study from the Incomati basin, Agr. Ecosyst. Environ., 200, 126–142, https://doi.org/10.1016/j.agee.2014.10.023, 2015.
Verger, A., Baret, F., and Weiss, M.: Near real-time vegetation monitoring at global scale, IEEE J. Sel. Top. Appl., 7, 3473–3481, https://doi.org/10.1109/JSTARS.2014.2328632, 2014 (data available at: https://land.copernicus.vgt.vito.be/PDF/portal/Application.html#Browse;Root=512260;Collection=1000083;Time=NORMAL,NORMAL,-1,,,-1,, (last access: 13 September 2022).
Vreugdenhil, M., Wagner, W., Bauer-Marschallinger, B., Pfeil, I., Teubner, I., Rüdiger, C., and Strauss, P.: Sensitivity of Sentinel-1 Backscatter to Vegetation Dynamics: An Austrian Case Study, Remote Sens.-Basel, 10, 1396, https://doi.org/10.3390/rs10091396, 2018.
Vreugdenhil, M., Navacchi, C., Bauer-Marschallinger, B., Hahn, S., Steele-Dunne, S., Pfeil, I., Dorigo, W., and Wagner, W.: Sentinel-1 Cross Ratio and Vegetation Optical Depth: A Comparison over Europe, Remote Sens.-Basel, 12, 3404, https://doi.org/10.3390/rs12203404, 2020.
Vrugt, J. A., Ter Braak, C. J., Clark, M. P., Hyman, J. M., and Robinson, B. A.: Treatment of input uncertainty in hydrologic modeling: Doing hydrology backward with Markov chain Monte Carlo simulation, Water Resour. Res., 44, W00B09, https://doi.org/10.1029/2007WR006720, 2008.
Wagner, W., Lemoine, G., and Rott, H.: A method for estimating soil moisture from ERS scatterometer and soil data, Remote Sens. Environ., 70, 191–207, https://doi.org/10.1016/S0034-4257(99)00036-X, 1999.
Wagner, W., Hahn, S., Kidd, R., Melzer, T., Bartalis, Z., Hasenauer, S., Figa-Saldaña, J., de Rosnay, P., Jann, A., Schneider, S., Komma, J., Kubu, G., Brugger, K., Aubrecht, C., Züger, J., Gangkofner, U., Kienberger, S., Brocca, L., Wang, Y., Blöschl, G., Eitzinger, J., and Steinnocher, K.: The ASCAT soil moisture product: A review of its specifications, validation results, and emerging applications, Meteorol. Z., 22, 5–33, https://doi.org/10.1127/0941-2948/2013/0399, 2013.
Zappa, L., Schlaffer, S., Bauer-Marschallinger, B., Nendel, C., Zimmerman, B., and Dorigo, W.: Detection and Quantification of Irrigation Water Amounts at 500 m Using Sentinel-1 Surface Soil Moisture, Remote Sens., 13, 1727, https://doi.org/10.3390/rs13091727, 2021.
Zaussinger, F., Dorigo, W., Gruber, A., Tarpanelli, A., Filippucci, P., and Brocca, L.: Estimating irrigation water use over the contiguous United States by combining satellite and reanalysis soil moisture data, Hydrol. Earth Syst. Sci., 23, 897–923, https://doi.org/10.5194/hess-23-897-2019, 2019.
Zribi, M., Chahbi, A., Shabou, M., Lili-Chabaane, Z., Duchemin, B., Baghdadi, N., Amri, R., and Chehbouni, A.: Soil surface moisture estimation over a semi-arid region using ENVISAT ASAR radar data for soil evaporation evaluation, Hydrol. Earth Syst. Sci., 15, 345–358, https://doi.org/10.5194/hess-15-345-2011, 2011.