the Creative Commons Attribution 4.0 License.
the Creative Commons Attribution 4.0 License.
 | 22 Sep 2022
Spatiotemporal responses of the crop water footprint and its associated benchmarks under different irrigation regimes to climate change scenarios in China
Zhiwei Yue
Xiangxiang Ji
La Zhuo
Wei Wang
Zhibin Li
Pute Wu
Adaptation to future climate change with limited water resources is a major global challenge to sustainable and sufficient crop production. However, the large-scale responses of the crop water footprint and its associated benchmarks under various irrigation regimes to future climate change scenarios remain unclear. The present study quantified the responses of the maize and wheat water footprint (WF) per unit yield (m3 t−1) as well as the corresponding WF benchmarks under two Representative Concentration Pathway (RCP) scenarios, RCP2.6 and RCP8.5, in the 2030s, 2050s, and 2080s at a 5 arcmin grid level in China. The AquaCrop model with the outputs of six global climate models from Phase 5 of the Coupled Model Intercomparison Project (CMIP5) as its input data was used to simulate the WFs of maize and wheat. The differences among rain-fed wheat and maize and furrow-, micro-, and sprinkler-irrigated wheat and maize were identified. Compared with the baseline year (2013), the maize WF will increase under both RCP2.6 and RCP8.5 (by 17 % and 13 %, respectively) until the 2080s. The wheat WF will increase under RCP2.6 (by 12 % until the 2080s) and decrease (by 12 %) under RCP8.5 until the 2080s, with a higher increase in the wheat yield and a decrease in the wheat WF due to the higher CO2 concentration in 2080s under RCP8.5. The WF will increase the most for rain-fed crops. Relative to rain-fed crops, micro-irrigation and sprinkler irrigation result in the smallest increases in the WF for maize and wheat, respectively. These water-saving management techniques will mitigate the negative impact of climate change more effectively. The WF benchmarks for maize and wheat in the humid zone (an approximate overall average of 680 m3 t−1 for maize and 873 m3 t−1 for wheat at the 20th percentile) are 13 %–32 % higher than those in the arid zone (which experiences an overall average of 601 m3 t−1 for maize and 753 m3 t−1 for wheat). The differences in the WF benchmarks among various irrigation regimes are more significant in the arid zone, where they can be as high as 57 % for the 20th percentile: WF benchmarks of 1020 m3 t−1 for sprinkler-irrigated wheat and 648 m3 t−1 for micro-irrigated wheat. Nevertheless, the WF benchmarks will not respond to climate changes as dramatically as the WF in the same area, especially in areas with limited agricultural development. The present study demonstrated that the observed different responses to climate change in terms of crop water consumption, water use efficiency, and WF benchmarks under different irrigation regimes cannot be ignored. It also lays the foundation for future investigations into the influences of irrigation methods, RCPs, and crop types on the WF and its benchmarks in response to climate change in all agricultural regions worldwide.
- Article
(8082 KB) - Full-text XML
-
Supplement
(1804 KB) - BibTeX
- EndNote


The progressive decline in water resource availability is a major impediment to global food production security (Pastor et al., 2019; Trnka et al., 2019; Konapala et al., 2020). Food crops are the main source of human nutrition (Myers et al., 2017; Lobell and Gourdji, 2012). Humans depend on food crops for ∼ 47 % of their daily protein intake (FAO, 2021). However, as a result of human activity, the climate system is changing, and global warming is a significant characteristic of this process (IPCC, 2021). Since the 1980s, each successive decade has been warmer than any preceding decade after 1850 (Kappelle, 2020). Climate change affects water consumption and crop yield by altering precipitation, temperature, carbon dioxide (CO2) concentration, and other factors during crop growth (Hatfield and Dold, 2019). Crop adaptation to future climate change with limited water resources has become a major challenge in sustainable crop production and supply worldwide.
The water footprint (WF) per unit crop (m3 t−1; Hoekstra, 2003) is reported as the amount of water consumed by the crop per unit yield during crop growth within a certain region. It includes the blue WF (surface and groundwater), the green WF (precipitation that will not become runoff), and the gray WF (freshwater that assimilates pollutants from human activities) (Hoekstra et al., 2011). The blue and green WFs are collectively known as the consumptive WF, and the gray WF is also called the degradative WF (Hoekstra, 2013). Unlike traditional crop water productivity and other agricultural water metrics, the WF covers water consumption, sources, and spatiotemporal dimensions during the crop growth period. Therefore, the water consumption intensity and efficiency for the irrigated and rain-fed growing modes may be compared. The WF is an effective indicator of the sustainability of regional water use and optimal water resource allocation (Xu et al., 2019; Mali et al., 2021). The present study focuses exclusively on the consumptive WF, which depends on crop yield and the intensity of water consumption per unit of planted area.
Several studies have been conducted on the responses of the WF to future climate change. Nevertheless, no consensus has been reached. Certain scholars believe that future climate change will weaken food crop production security. Ahmadi et al. (2021) reported that the maize WF in the Qazvin Plain of India will increase by 42 % and 147 % under RCP4.5 and RCP8.5 (where RCP denotes Representative Concentration Pathway), respectively, by 2061–2080. Zheng et al. (2020) found that the rice yield in the Henan and Jiangsu provinces (China) will decrease, whereas the WF will increase under four RCPs at various stages of the 21st century. Other scholars believe that the crop yield may actually benefit from future increases in precipitation and atmospheric CO2 concentration. Jans et al. (2021) considered the combined effects of changes in climatic factors, such as temperature, precipitation, and rising atmospheric CO2 concentration, and predicted that the global cotton yield will increase by > 50 % and that the WF will decrease by 30 % between 2011 and 2099 under RCP8.5. Arunrat et al. (2020) found that the yield of individual and large-scale rice farms in Thailand will increase by 1 %–30 % and 2 %–31 %, respectively, whereas the WF will decrease by 10 %–43 % and 1 %–67 %, respectively, in the present century under RCP4.5. Significant spatiotemporal differences in the WF under various irrigation management techniques have been confirmed at both the site (Chukalla et al., 2015) and regional (Wang et al., 2019) scales. However, current large-scale studies on the responses of the WF to environmental change are usually based on simulations assuming adequate furrow irrigation. These studies exclude comparisons between various irrigation techniques and the differences in their influences on crop WFs. Although Dai et al. (2020) optimized maize and wheat cropping patterns under RCP4.5 and RCP8.5 in the Huaihe River basin in China by 2050 and took various irrigation modes into account, they only considered blue water.
The magnitude and constitution of the crop WF vary widely among regions and areas (Mekonnen and Hoekstra, 2011). To encourage water users to reduce the WF to a reasonable level, Hoekstra (2013, 2014) recommended establishing WF benchmarks for different products because they facilitate prudent water allocation and fair water resource sharing among sectors and users (Hoekstra, 2013). On the large-scale, specific WF benchmarks can be set for crops grown on different farms within the same region (Mekonnen and Hoekstra, 2014). A previous study demonstrated the sensitivity of WF benchmarks to climate zones (Zhuo et al., 2016a). WF benchmarks significantly differ among irrigation regimes, especially in arid zones (Wang et al., 2019); however, little is known about the responses of WF benchmarks under different irrigation regimes to future climate change.
Table 1Inventory of global climate models (GCMs) used in the current study.
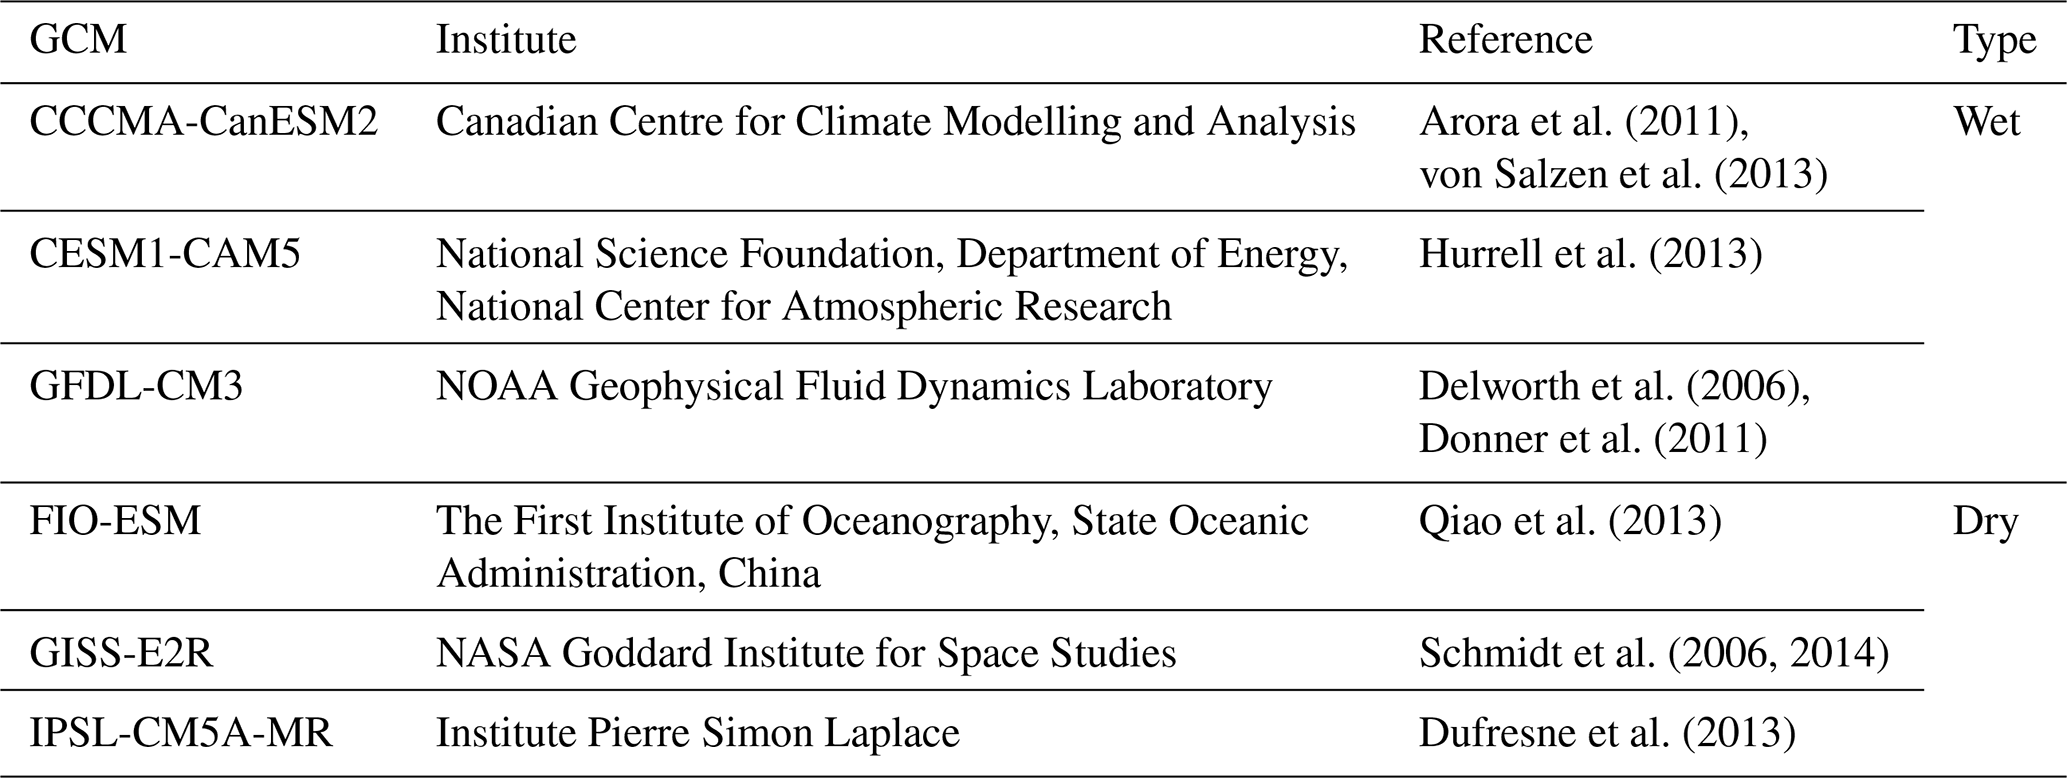
To investigate the influence of future climate change on the large-scale WF and WF benchmarks under diverse irrigation regimes, maize and wheat grown in mainland China were the subjects of this study. We used the outputs of six global climate models (GCMs) – three models each for relatively wet and dry climate outputs (Table 1) – that were included in Phase 5 of the Coupled Model Intercomparison Project (CMIP5). We then used the AquaCrop model to simulate the spatiotemporal responses of the blue and green WFs and the corresponding WF benchmarks for wheat and maize in the 2030s (2020–2049), 2050s (2040–2069), and 2080s (2070–2099) under RCP2.6 and RCP8.5 at a 5 arcmin grid resolution. We distinguished between rain-fed and irrigated growing modes and among furrow-, micro-, and sprinkler-irrigated regimes.
As of 2019, China was the world's second largest maize and largest wheat producer, accounting for 23 % and 17 % of total global production, respectively (FAO, 2021). China's cereal production has helped stabilize global food production and supply. In 2019, the respective planted areas of maize and wheat in China were 41×106 and 24×106 ha, and they accounted for 25 % and 14 % of the national total croplands, respectively (NBSC, 2021). Cereal production consumes substantial volumes of water in China, and these quantities change over time. Zhuo et al. (2019) reported that maize water consumption increased by 49 % between 2000 and 2013 as planted areas and feed demand increased. Conversely, Wang et al. (2019) reported that areas planted with wheat and irrigated areas decreased and water consumption slightly declined (4.4 %) from 2000 to 2014. Other studies have reported that maize and wheat consume relatively more water in the north than in the south of China (Tian et al., 2019; Wang et al., 2019). Developing water-saving irrigation has become an important way to alleviate the prominent contradiction between water resource utilization and grain production in China. According to NBSC (2021), the area of water-saving irrigation projects in China in 2019 was 37×106 ha, including 7×10⁶ ha for micro-irrigation. Therefore, micro-irrigation does apply to food crops in China, despite the limited area under this form of management. For instance, in Xinjiang Province, the area of micro-irrigated maize and wheat was 0.033×10⁶ ha in 2009 (CIDDC, 2022), although wheat dominated, accounting for 0.031×10⁶ ha of the aforementioned area (Wang et al., 2011). Meanwhile, some scholars have conducted research on micro-irrigated maize (Bai and Gao, 2021; Guo et al., 2021) and wheat (Li et al., 2021; Zain et al., 2021) in China, especially in the north. Therefore, the water consumption rates of these staple crops using different irrigation management techniques under future climate change scenarios should be closely monitored to ensure water supply and food crop production security in China and worldwide. Compared to existing literature on the evaluation of crop production WFs under climate change scenarios (e.g., Karandish et al., 2022), the innovations of the current research are embodied in two points. The present study, for the first time, clarifies large-scale spatiotemporal responses of the WF to future climate change scenarios under different irrigation regimes. This analysis is also the first to explore the large-scale future changes in WF benchmarks under different irrigation management techniques.
2.1 Research setup
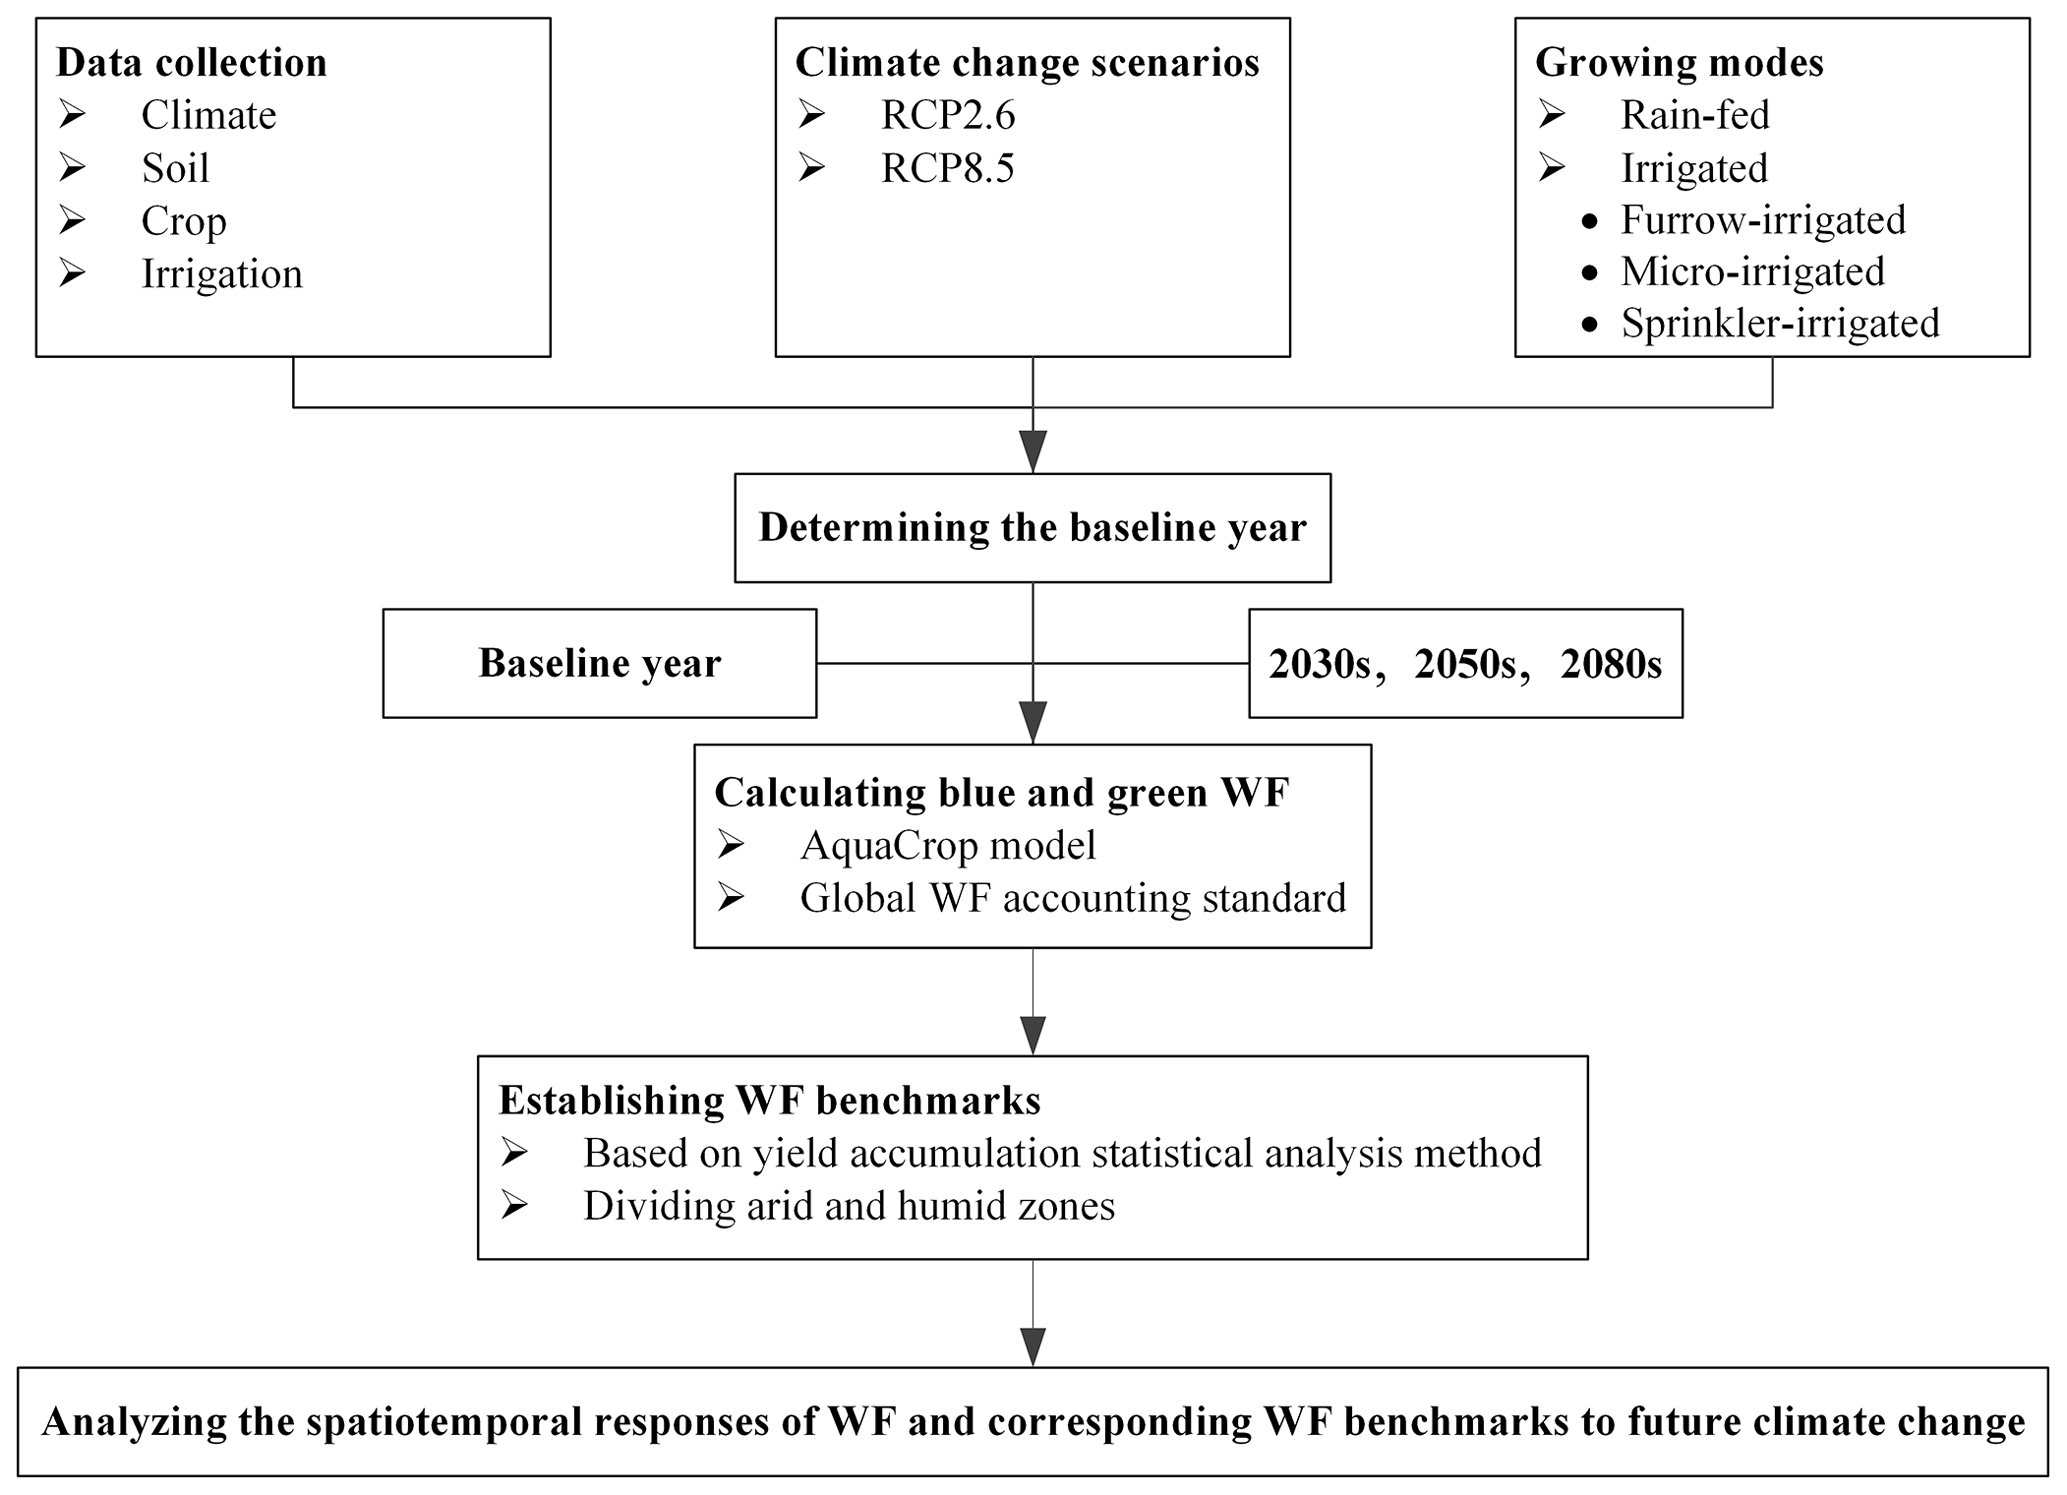
We studied the spatiotemporal responses of the blue and green WFs and the corresponding WF benchmarks for two crops (maize and wheat) to future climate change under two climate change scenarios (RCP2.6 and RCP8.5) using four different growing modes (rain-fed crops and furrow-, micro-, and sprinkler-irrigated crops). First, we determined the baseline year. Second, we considered different growing modes to quantify the WF and the corresponding WF benchmarks of two crops in the baseline year and future year levels under two climate change scenarios. Finally, the spatiotemporal responses of the crop WF and the corresponding WF benchmarks to future climate change were analyzed (Fig. 1).
2.2 Determining the baseline year
The determination of the baseline year is needed for a comparison between future and current conditions. Climate determines the annual variability in the WF (Zhuo et al., 2014), and the baseline year should be determined when there is a relative balance between aridity and moisture. Hence, the aridity index (AI) was used here. The annual reference evapotranspiration (ET0, mm) and precipitation (PR, mm) in China were calculated (Harris et al., 2014). Then, the AI was calculated, and climate change trends from 2000 to 2014 were analyzed. The year 2013 was designated as the baseline because its drought level was nearest the 15-year national average. The AI was calculated according to the method of Middleton and Thomas (1997):
2.3 Water footprint per unit crop calculation
The WF (m3 t−1) comprises the blue WF (WFb, m3 t−1) and the green WF (WFg, m3 t−1):
where WFb and WFg were calculated as the quotient of the blue (CWUb, m3 ha−1) and green (CWUg, m3 ha−1) components of crop water use (CWU, m3 ha−1) and crop yield (Y, t ha−1), respectively. CWUb and CWUg were equivalent to the cumulation of daily evapotranspiration (ET, mm d−1) throughout the whole crop growth period (Hoekstra et al., 2011):
Here, ETb and ETg (mm) refer to the blue and green water evapotranspiration, respectively, and lgp refers to the number of days of the crop growth period. The coefficient, 10, is a unit conversion factor, transforming the water depth of ET (mm) into the water amount per unit land area of CWU (m3 ha−1).
The ET and Y per grid for each crop were simulated by the AquaCrop model based on the dynamic daily soil water balance (Mekonnen and Hoekstra, 2010):
where S[t] and S[t−1] (mm) refer to the water content in soil when the day (t) ends and begins, respectively; PR[t] (mm) is the amount of precipitation on day t; IRR[t] (mm) is the amount of water used for irrigation; CR[t] (mm) is the capillary rise to the crop root zone from the shallow groundwater; RO[t] (mm) is the water lost by surface runoff due to precipitation; and DP[t] (mm) is the water lost by deep percolation caused by excessive precipitation or irrigation. It was assumed that CR[t] = 0, as the ground water depth was > 1 m (Allen et al., 1998). RO[t] was calculated using the Soil Conservation Service curve number (CN) equation (USDA, 1964; Rallison, 1980):
Here, S (mm) is the potential maximum water storage, and Ia (mm) is the initial amount of water loss before the runoff formation.
By tracking the daily flow of water in and out of the crop root zone, we separated the daily blue and green soil water balances (Zhuo et al., 2016b):
Here, Sb[t] and Sb[t−1] (mm) are the blue water content in soil when the day (t) ends and begins, respectively; and Sg[t] and Sg[t−1] (mm) are the green water content in soil when the day (t) ends and begins, respectively. It is assumed that the initial soil water content before the crop growth period is green water.
In AquaCrop, the daily transpiration (Tr[t], mm) calculates the daily shoot biomass production (B, kg) using the normalized crop biomass water productivity (WP∗, kg m−2) (Raes et al., 2017):
where WP∗ is normalized to consider the CO2 concentration, reference evapotranspiration (ET0), and crop classes (C3 or C4) so that it is applicable to various locations and seasons. Water productivity remains constant for specific crops. Y, as the harvestable portion of final B, is calculated by multiplying B by the adjusted reference harvest index (HI0, %):
where fHI is a correction factor for HI0. This considers the water and temperature stresses during the crop growth period. Being consistent with the existing widely used scaling method (Mekonnen and Hoekstra, 2011; Zhuo et al., 2016b, c, 2019; Wang et al., 2019; Mialyk et al., 2022), the simulated Y per grid for each crop in 2013 was validated via scaling model simulation outputs to correspond to the crop yield statistics data at the provincial level (NBSC, 2021). With the consistent scaling factors for the Y simulation and crop parameters including the crop calendar, WP∗, HI0, and the maximum root depth, which represent the existing agricultural production level, climate was the only variable for future scenario simulations.
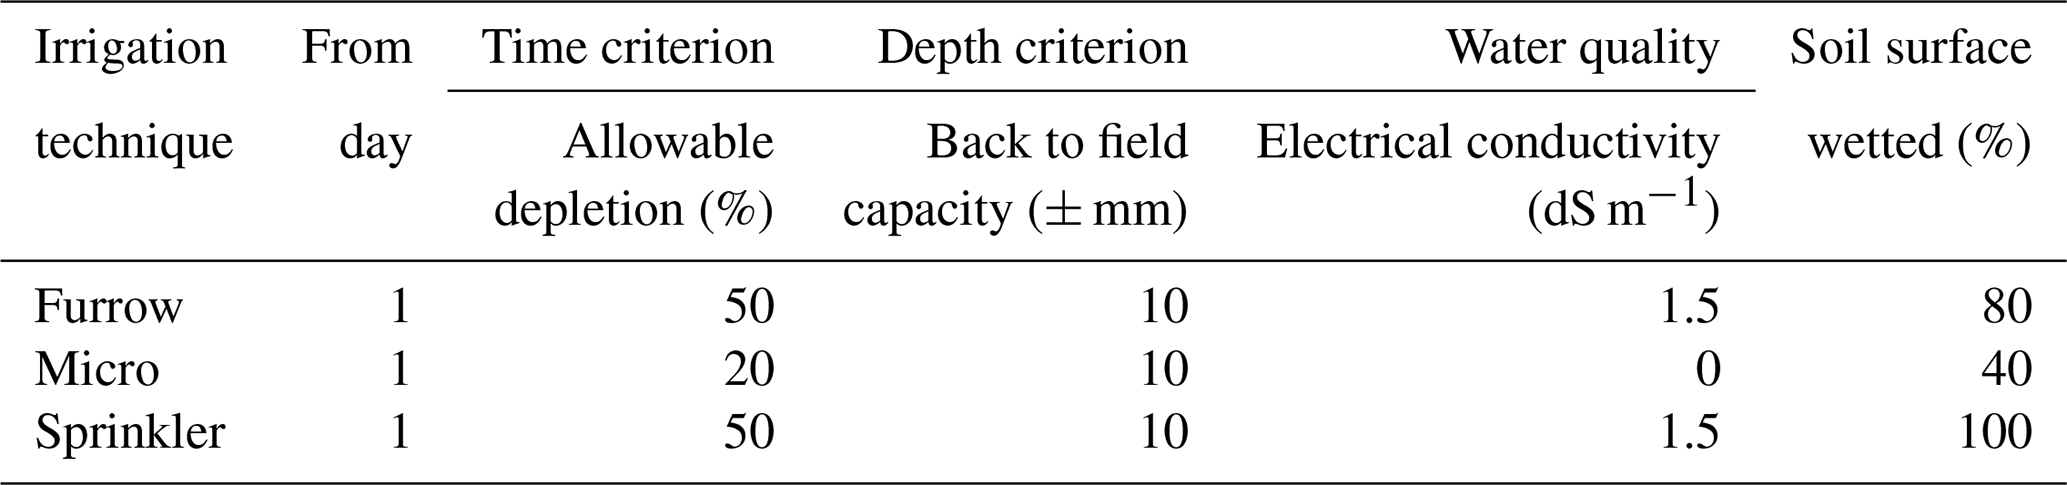
In the simulation, different growing modes, namely rain-fed crops and three different irrigation management techniques (furrow-, micro-, and sprinkler-irrigated regimes), were considered. The irrigation schedule of three irrigation techniques in the model was the “Generation of Irrigation Schedule”, namely the generation of an irrigation schedule by specifying a time and depth criterion for planning or evaluating a potential irrigation strategy. The time criterion we used was allowable depletion (%), namely the percentage of the readily available soil water (RAW) that can be depleted before irrigation water has to be applied. The depth criterion we used was back to field capacity (± mm), which describes the extra water on top of the amount of irrigation water required to bring the root zone back to field capacity. The water quality was expressed by the electrical conductivity (dS m−1) of the irrigation water. The soil surface wetted (%), an indicative value for the fraction of soil surface wetted, was used to select irrigation techniques. Table 2 shows the parameters of three irrigation techniques (Raes et al., 2017). We can adjust the simulated ET and Y according to the performance of the irrigation schedule.
2.4 Benchmarking the consumptive WF in crop production
Based on the work of Mekonnen and Hoekstra (2014), we ranked the grid-level WF for each crop in ascending order of size against the corresponding cumulative percentages of the total crop production. The annual WF of 20 % or 25 % of the producers with the highest water productivity in China was set as the annual WF benchmark. The climate zones should be divided when the WF benchmarks are established (Zhuo et al., 2016a). To this end, the AI partitioned China into arid (< 0.5) and humid (> 0.5) zones based on the annual ET0 and PR from 2000 to 2014 at a 30 arcmin grid resolution (Fig. 2) (Harris et al., 2014).
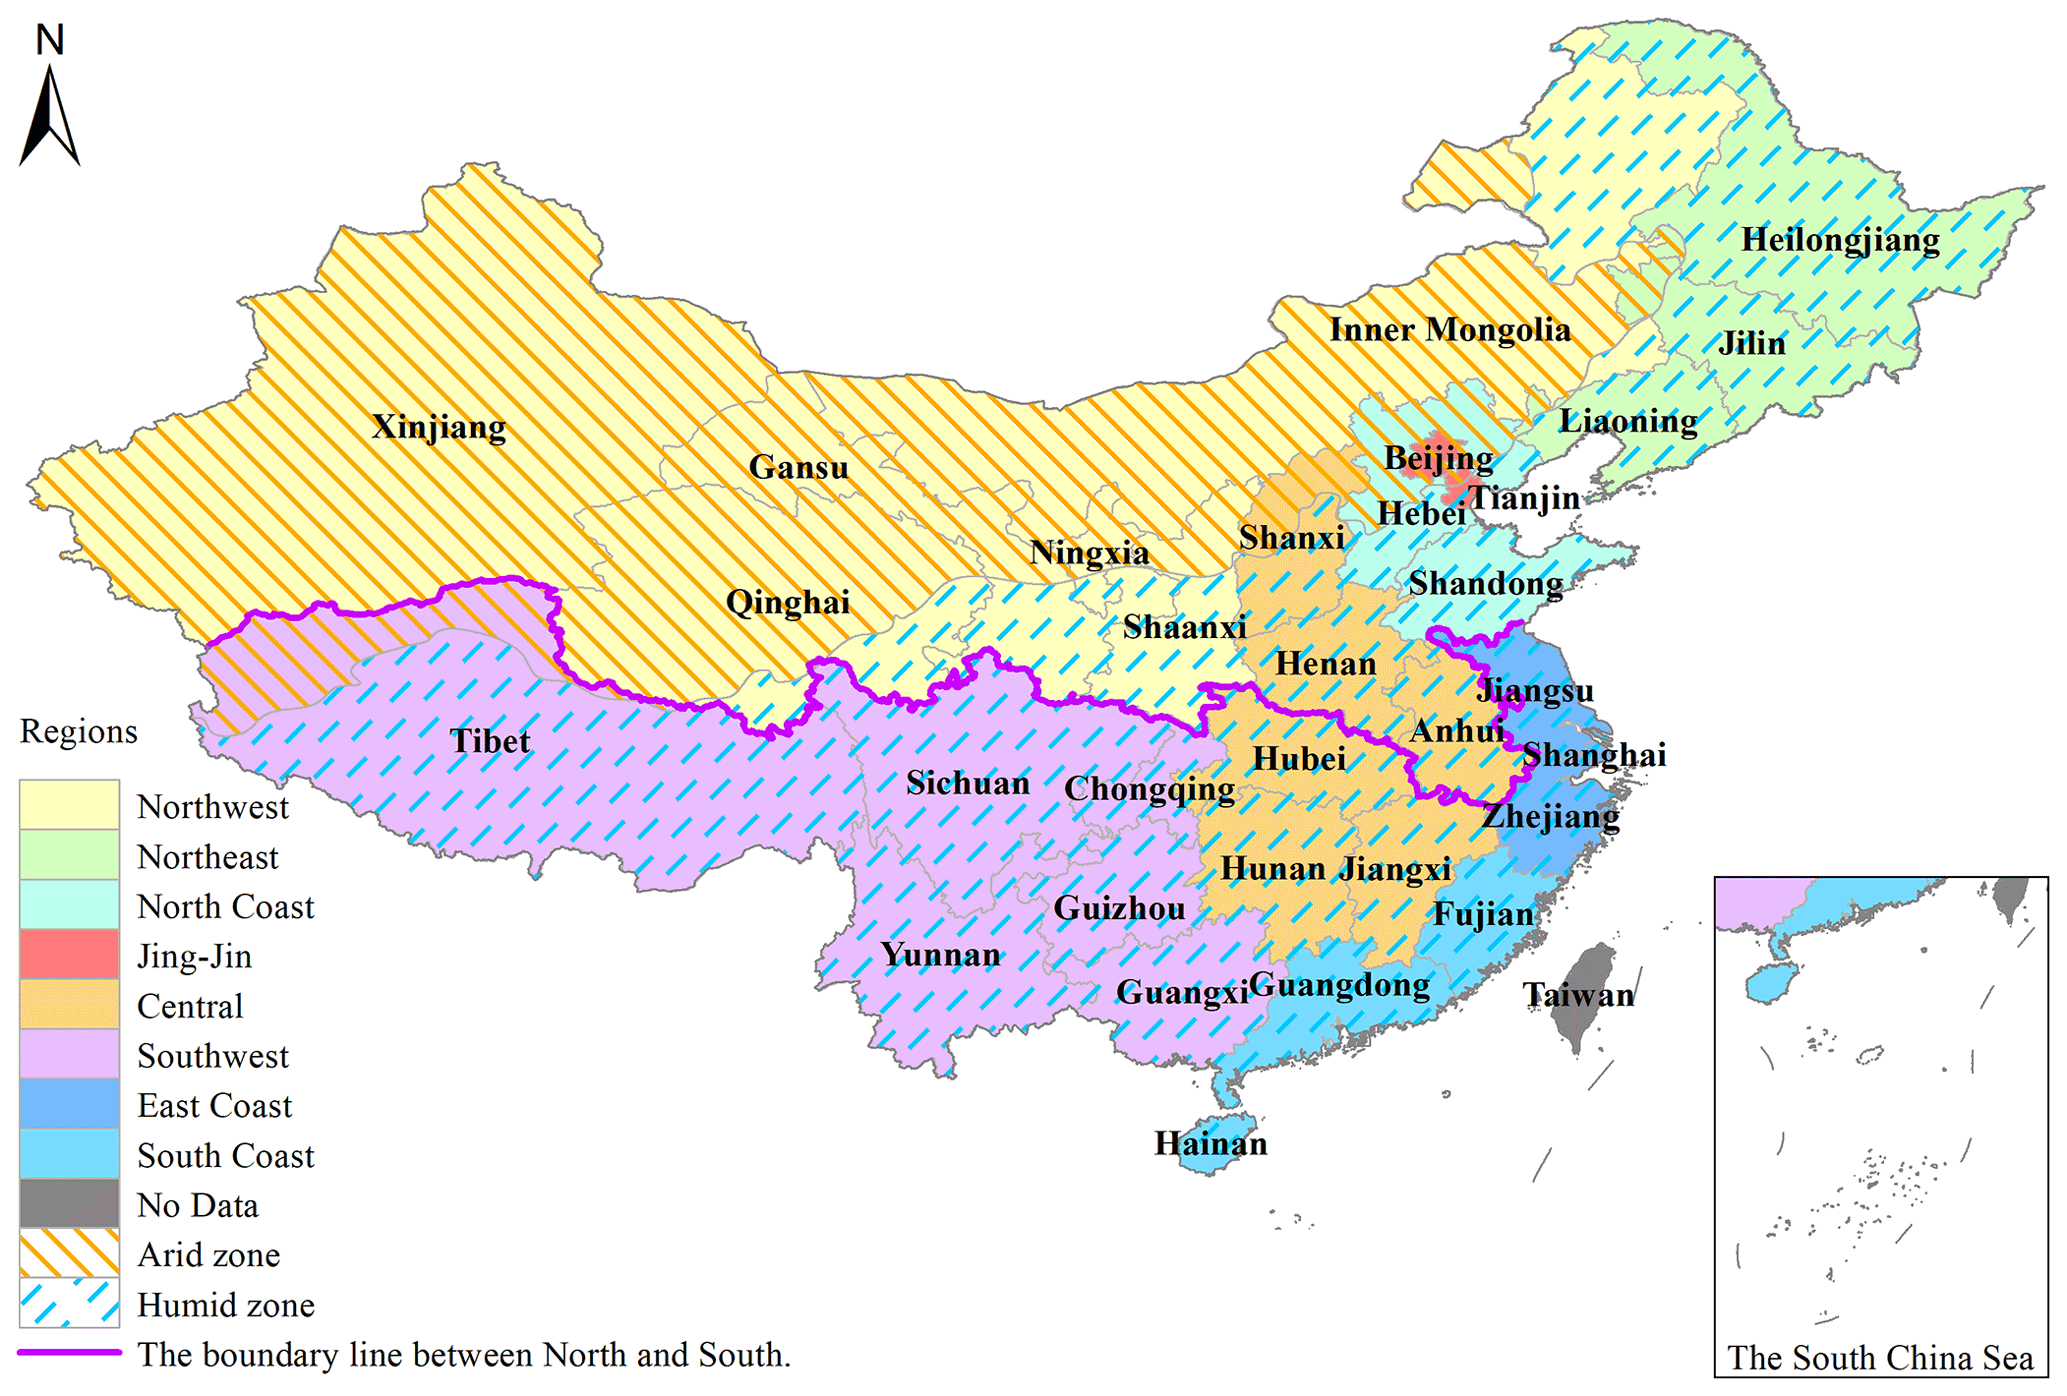
Figure 2Regions and climate zones of mainland China.
2.5 Data sources
Monthly climate data from 2000 to 2014 at a resolution of 30 arcmin, including maximum air temperature (Tx), minimum air temperature (Tn), precipitation (PR), and reference evapotranspiration (ET0), were derived from the Climatic Research Unit gridded Time Series (CRU TS, version 3.24) dataset (Harris et al., 2014; CEDA, 2018). The mean annual atmospheric CO2 concentration (ppm) from 2000 to 2014 was obtained from the Mauna Loa Observatory, Hawaii, USA (NOAA, 2018). The downscaled outputs of six GCMs at a 5 arcmin grid resolution for the 2030s, 2050s, and 2080s were obtained from the Climate Change, Agriculture and Food Security (CCAFS) database (Navarro-Racines et al., 2020; CCAFS, 2015). As the CCAFS database has no ET0 data, we calculated ET0 for each climate scenario using temperature inputs via the Food and Agriculture Organization (FAO) Penman–Monteith method with missing data as described by Allen et al. (1998). The projected CO2 concentrations under RCP2.6 and RCP8.5 were obtained from van Vuuren et al. (2007) and Riahi et al. (2007), respectively. To make the model simulation more cohesive with the actual situation in China, we reset the maximum root depth (Zx) according to the FAO-56 recommendation (Allen et al., 1998). The FAO-56 recommended values provide a clear range of Zx values for each type of crop for typical climatic zones. In addition, we further combined the literature research on maize and wheat in China to reset the HI0 (Zhuo et al., 2016c). The other parameters used in AquaCrop were derived from Raes et al. (2017). Soil texture data and soil water capacity data at a 5 arcmin grid resolution were acquired from the International Soil Reference and Information Centre (ISRIC) Soil and Terrain database (Dijkshoorn et al., 2008) and the ISRIC World Inventory of Soil Emission Potentials (ISRIC-WISE) dataset (Batjes, 2012), respectively. The planted areas for each irrigated or rain-fed crop at a 5 arcmin grid resolution were acquired from the MIRCA2000 dataset (Portmann et al., 2010). We divided these planted areas into different parts subjected to various irrigation techniques using statistical yearbook data (NBSC, 2021). Provincial-level crop yield statistics data were procured from the National Bureau of Statistics of China (NBSC, 2021).
3.1 Future climate change trends in areas planted with maize and wheat
In the baseline year of 2013, the average annual reference evapotranspiration (ET0) and precipitation (PR) in the planted areas of the two crops were 941 and 727 mm, respectively. Compared with this baseline level, the average annual ET0 and PR in the planted areas of the two crops will both increase under the two abovementioned RCPs, and the increase in ET0 will exceed that of PR. ET0 will increase by 17 % and 29 % under RCP2.6 and RCP8.5, respectively, until the 2080s. However, PR will increase by 8 % and 14 %, respectively. Thus, the increases under RCP8.5 (18 %–29 % and 3 %–14 % for ET0 and PR, respectively) will be much higher than those under RCP2.6 (16 %–17 % and 4 %–8 % for ET0 and PR, respectively). Climate change will be relatively more intense under RCP8.5. The increases in ET0 were found to be concentrated from April to August (14–39 mm), while the increases in PR were concentrated between June and August (8–20 and 12–28 mm, respectively). However, PR will decline in May, July, November, and December, and it will decline more in May (≤ 9 mm until the 2030s) (Fig. 3a, b). Water and heat resources were unevenly distributed in the planted areas of the two crops in 2013. ET0 was relatively higher on the east coast and in North China. The PR distribution was comparatively higher in the south and lower in the north (Fig. S4 in the Supplement). Compared with 2013, ET0 and PR for the most heavily planted areas will increase under both scenarios until the 2080s. The areas with a relatively greater increase in ET0 will be mainly distributed in the southwest and northeast (Fig. 3c, e), whereas PR was observed to increase relatively faster in the northwest and Jing-Jin (Fig. 3d, f). ET0 mainly decreased in Xinjiang and Inner Mongolia (Fig. 3c, e), and PR mainly decreased in Xinjiang and Tibet as well as on the northeast and south coasts (Fig. 3d, f). However, the areas in which ET0 was observed to decrease are 86 %–94 % smaller than those in which PR decreased.
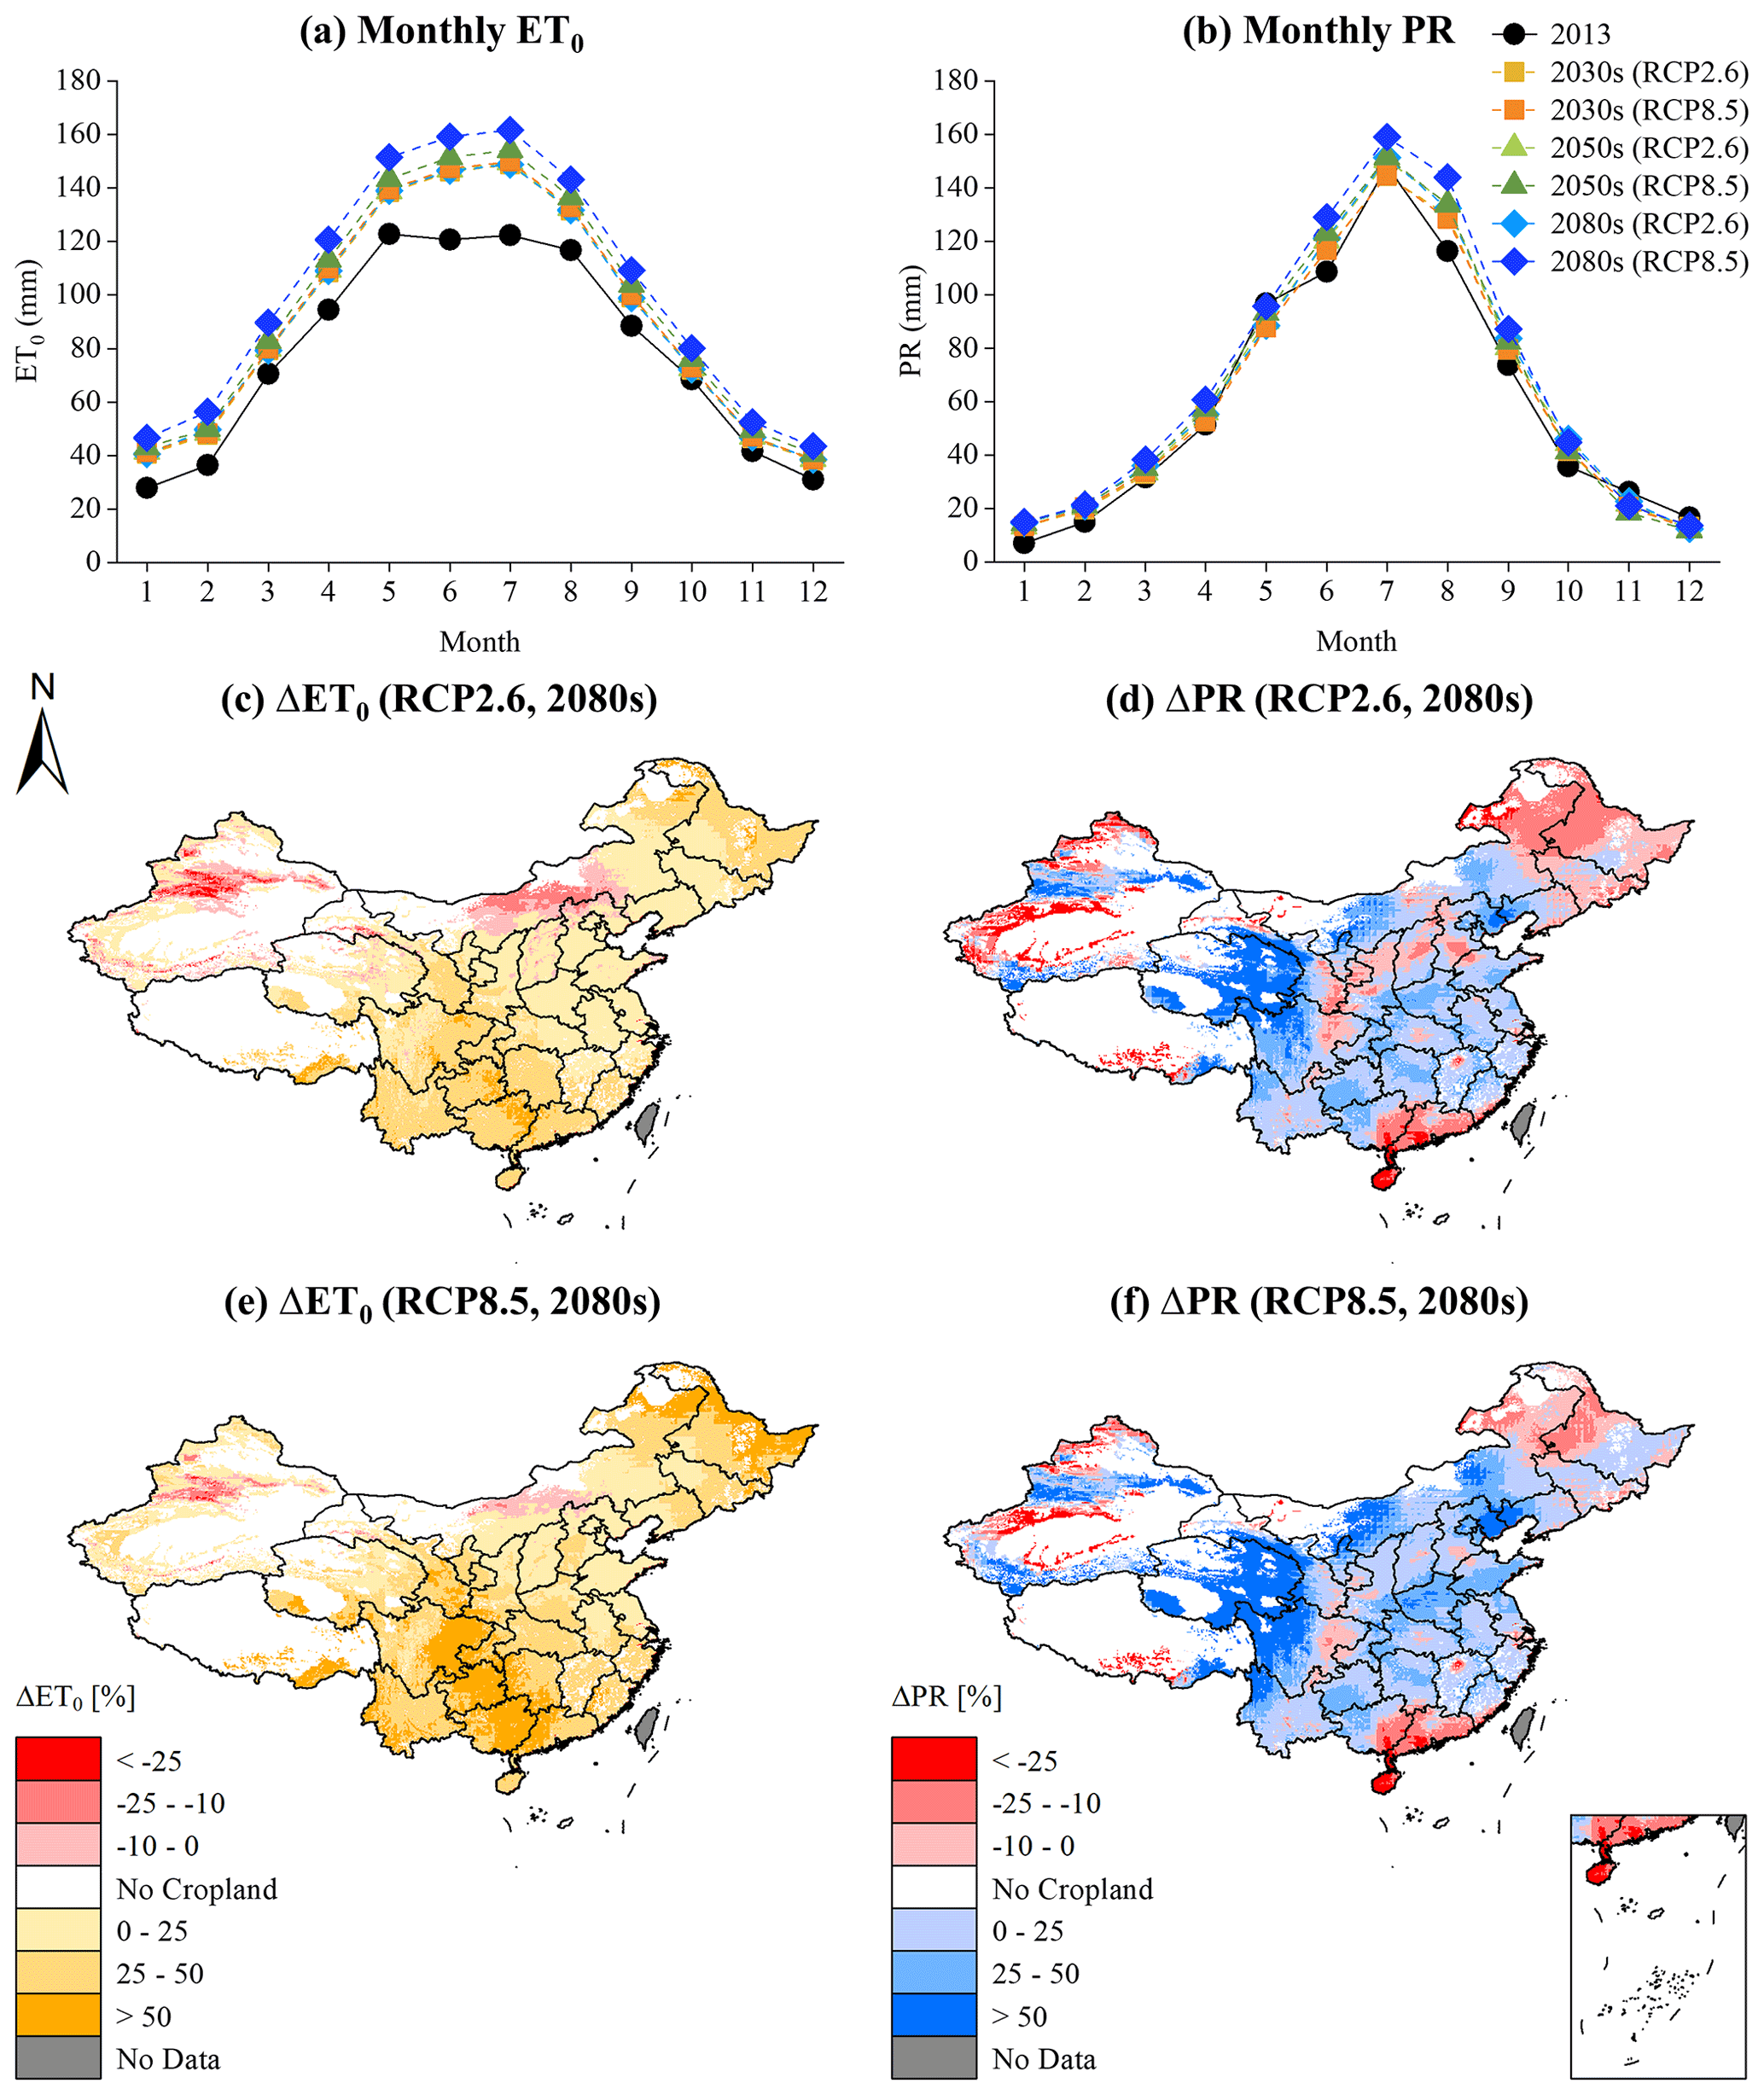
Figure 3Future climate projections for the zones planted with maize and wheat in China.
3.2 The WF distribution in the baseline year 2013
The national average WF for wheat (1008 m3 t−1) was higher than that for maize (813 m3 t−1) in the baseline year of 2013. The corresponding blue WF proportions were 37 % and 20 %, respectively. The reason for this discrepancy is that maize is a C4 crop, whereas wheat is a C3 crop. C4 crops have a relatively higher CO2 fixation efficiency and a faster photosynthetic rate than C3 crops. Hence, maize can accumulate comparatively more yield than wheat under the same water consumption conditions (Wang et al., 2012). Figure 4 shows that the high WFg values were mainly distributed in areas with relatively higher precipitation during crop growth (i.e., abundant green water resources). The main component of the WF is the WFg; therefore, the high maize WF was mainly distributed in the northwest (Fig. 4a), whereas the high wheat WF was mainly distributed in the southwest and on the south coast (Fig. 4b). Elevated ET0 and insufficient precipitation can increase blue water consumption in food production. Thus, the high WFb values were mainly distributed in areas with uneven water and heat resource distributions during crop growth. The high maize WFb values were mainly distributed in northwest and on the east coast (Fig. 4c), whereas the high WFb values of wheat were mainly distributed in North China (Fig. 4d). In all grids, the proportions of the WFb and WFg were up to 68 % (wheat in Xinjiang) (Table S2) and 98 % (maize in Hainan) (Table S1), respectively.
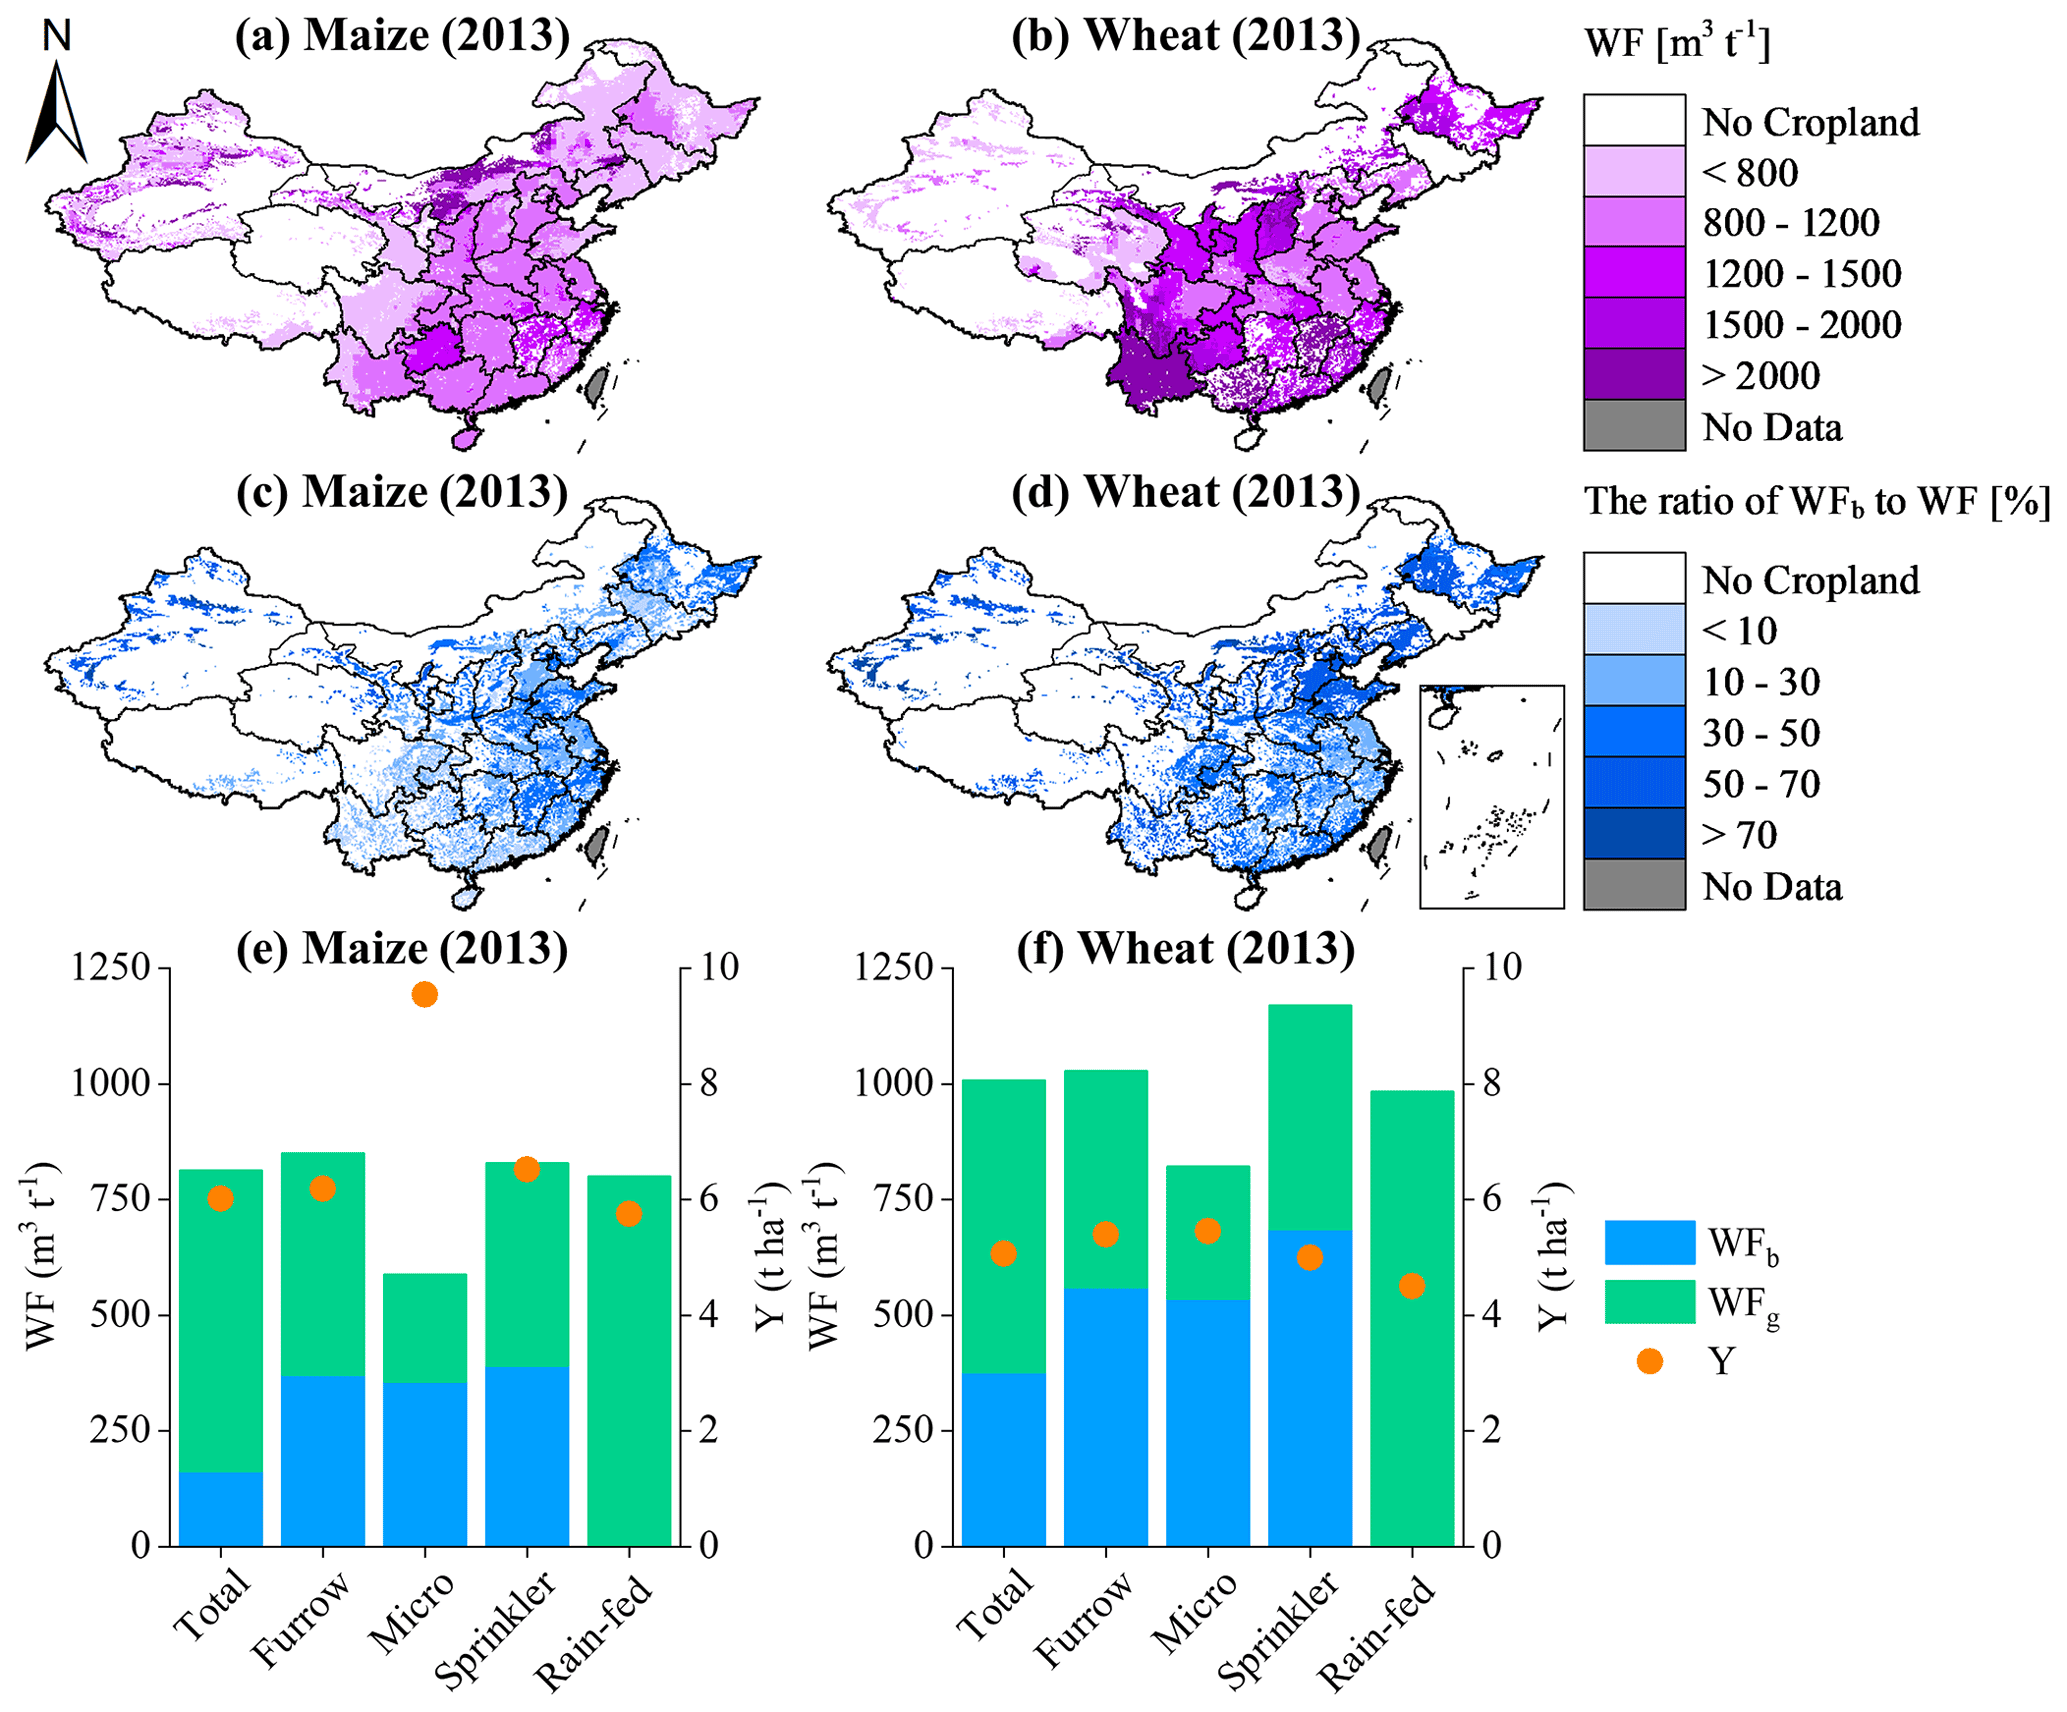
Figure 4The WFs of maize and wheat in China in 2013.
A comparison of rain-fed crops and irrigation techniques demonstrated that the WFs of maize and wheat under furrow and sprinkler irrigation conditions were higher than those under a rain-fed regime in 2013. The WFs of micro-irrigated crops were lower than those of rain-fed crops. The WF of maize (850 m3 t−1) and wheat (1170 m3 t−1) was highest under furrow and sprinkler irrigation regimes, respectively. For wheat, using all three irrigation techniques, WFb was dominant (54 %–65 %). However, WFb for maize was only dominant under micro-irrigation conditions (61 %). Micro-irrigated (9.55 t ha−1 for maize and 5.46 t ha−1 for wheat) and rain-fed (5.76 t ha−1 for maize and 4.51 t ha−1 for wheat) crops had the highest and lowest yield, respectively, in 2013. The response of the maize yield to a rain-fed regime and various irrigation techniques was stronger than that of the wheat yield (Fig. 4e, f).
3.3 Spatiotemporal responses of the WF to future climate change
On national average, compared with the baseline year of 2013, the maize WF will increase by 17 % and 13 % under RCP2.6 and RCP8.5, respectively, until the 2080s. The WF of wheat will increase under RCP2.6 (by 12 % until the 2080s), but it will decrease by 12 % under RCP8.5 until the 2080s (Fig. 5a). The increases in the CO2 concentration and, by extension, yield gain will be lower under RCP2.6 than under RCP8.5. During the same period, the increases in the WF under RCP2.6 will be 1 %–3 % higher for maize and 2 %–10 % higher for wheat than those under RCP8.5. There will be relatively smaller differences in the CO2 concentration between climate scenarios for the 2030s (431 ppm under RCP2.6 and 449 ppm under RCP8.5). Thus, the differences in the WF between the RCPs will be smaller before the 2030s and larger after the 2050s. The WF of irrigated wheat under RCP8.5 will decline by 3 % until the 2050s and by 15 % until the 2080s. The increase in the WF will be highest under a rain-fed regime, and the WF of rain-fed maize and wheat under RCP2.6 will increase by 19 % and 24 %, respectively, until the 2080s. By contrast, the WF of irrigated maize and wheat under RCP2.6 will only increase by 13 % and 7 %, respectively, until the 2080s (Fig. 5a). A comparison of the various irrigation techniques demonstrated that the WFs of wheat and maize respond differently under the same scenario. The increase in the WF amplitude for maize will be highest under furrow-irrigated conditions (14 % and 11 % under RCP2.6 and RCP8.5 until the 2080s, respectively) and lowest under micro-irrigated conditions (5 % and 2 % under RCP2.6 and RCP8.5 until the 2080s, respectively). The WF of sprinkler-irrigated wheat under RCP8.5 will decline by 1 % until the 2030s. The WF of wheat under a micro-irrigated regime had the highest increase (9 % until the 2080s under RCP2.6) and the lowest decrease (14 % until the 2080s under RCP8.5). The WF of wheat under sprinkler-irrigated conditions had the lowest increase (only 2 % until the 2080s under RCP2.6) and the highest decrease (19 % until the 2080s under RCP8.5) (Fig. 5b).

Figure 5The WFs of maize and wheat in 2013 as well as future year levels under various climate change scenarios in China.
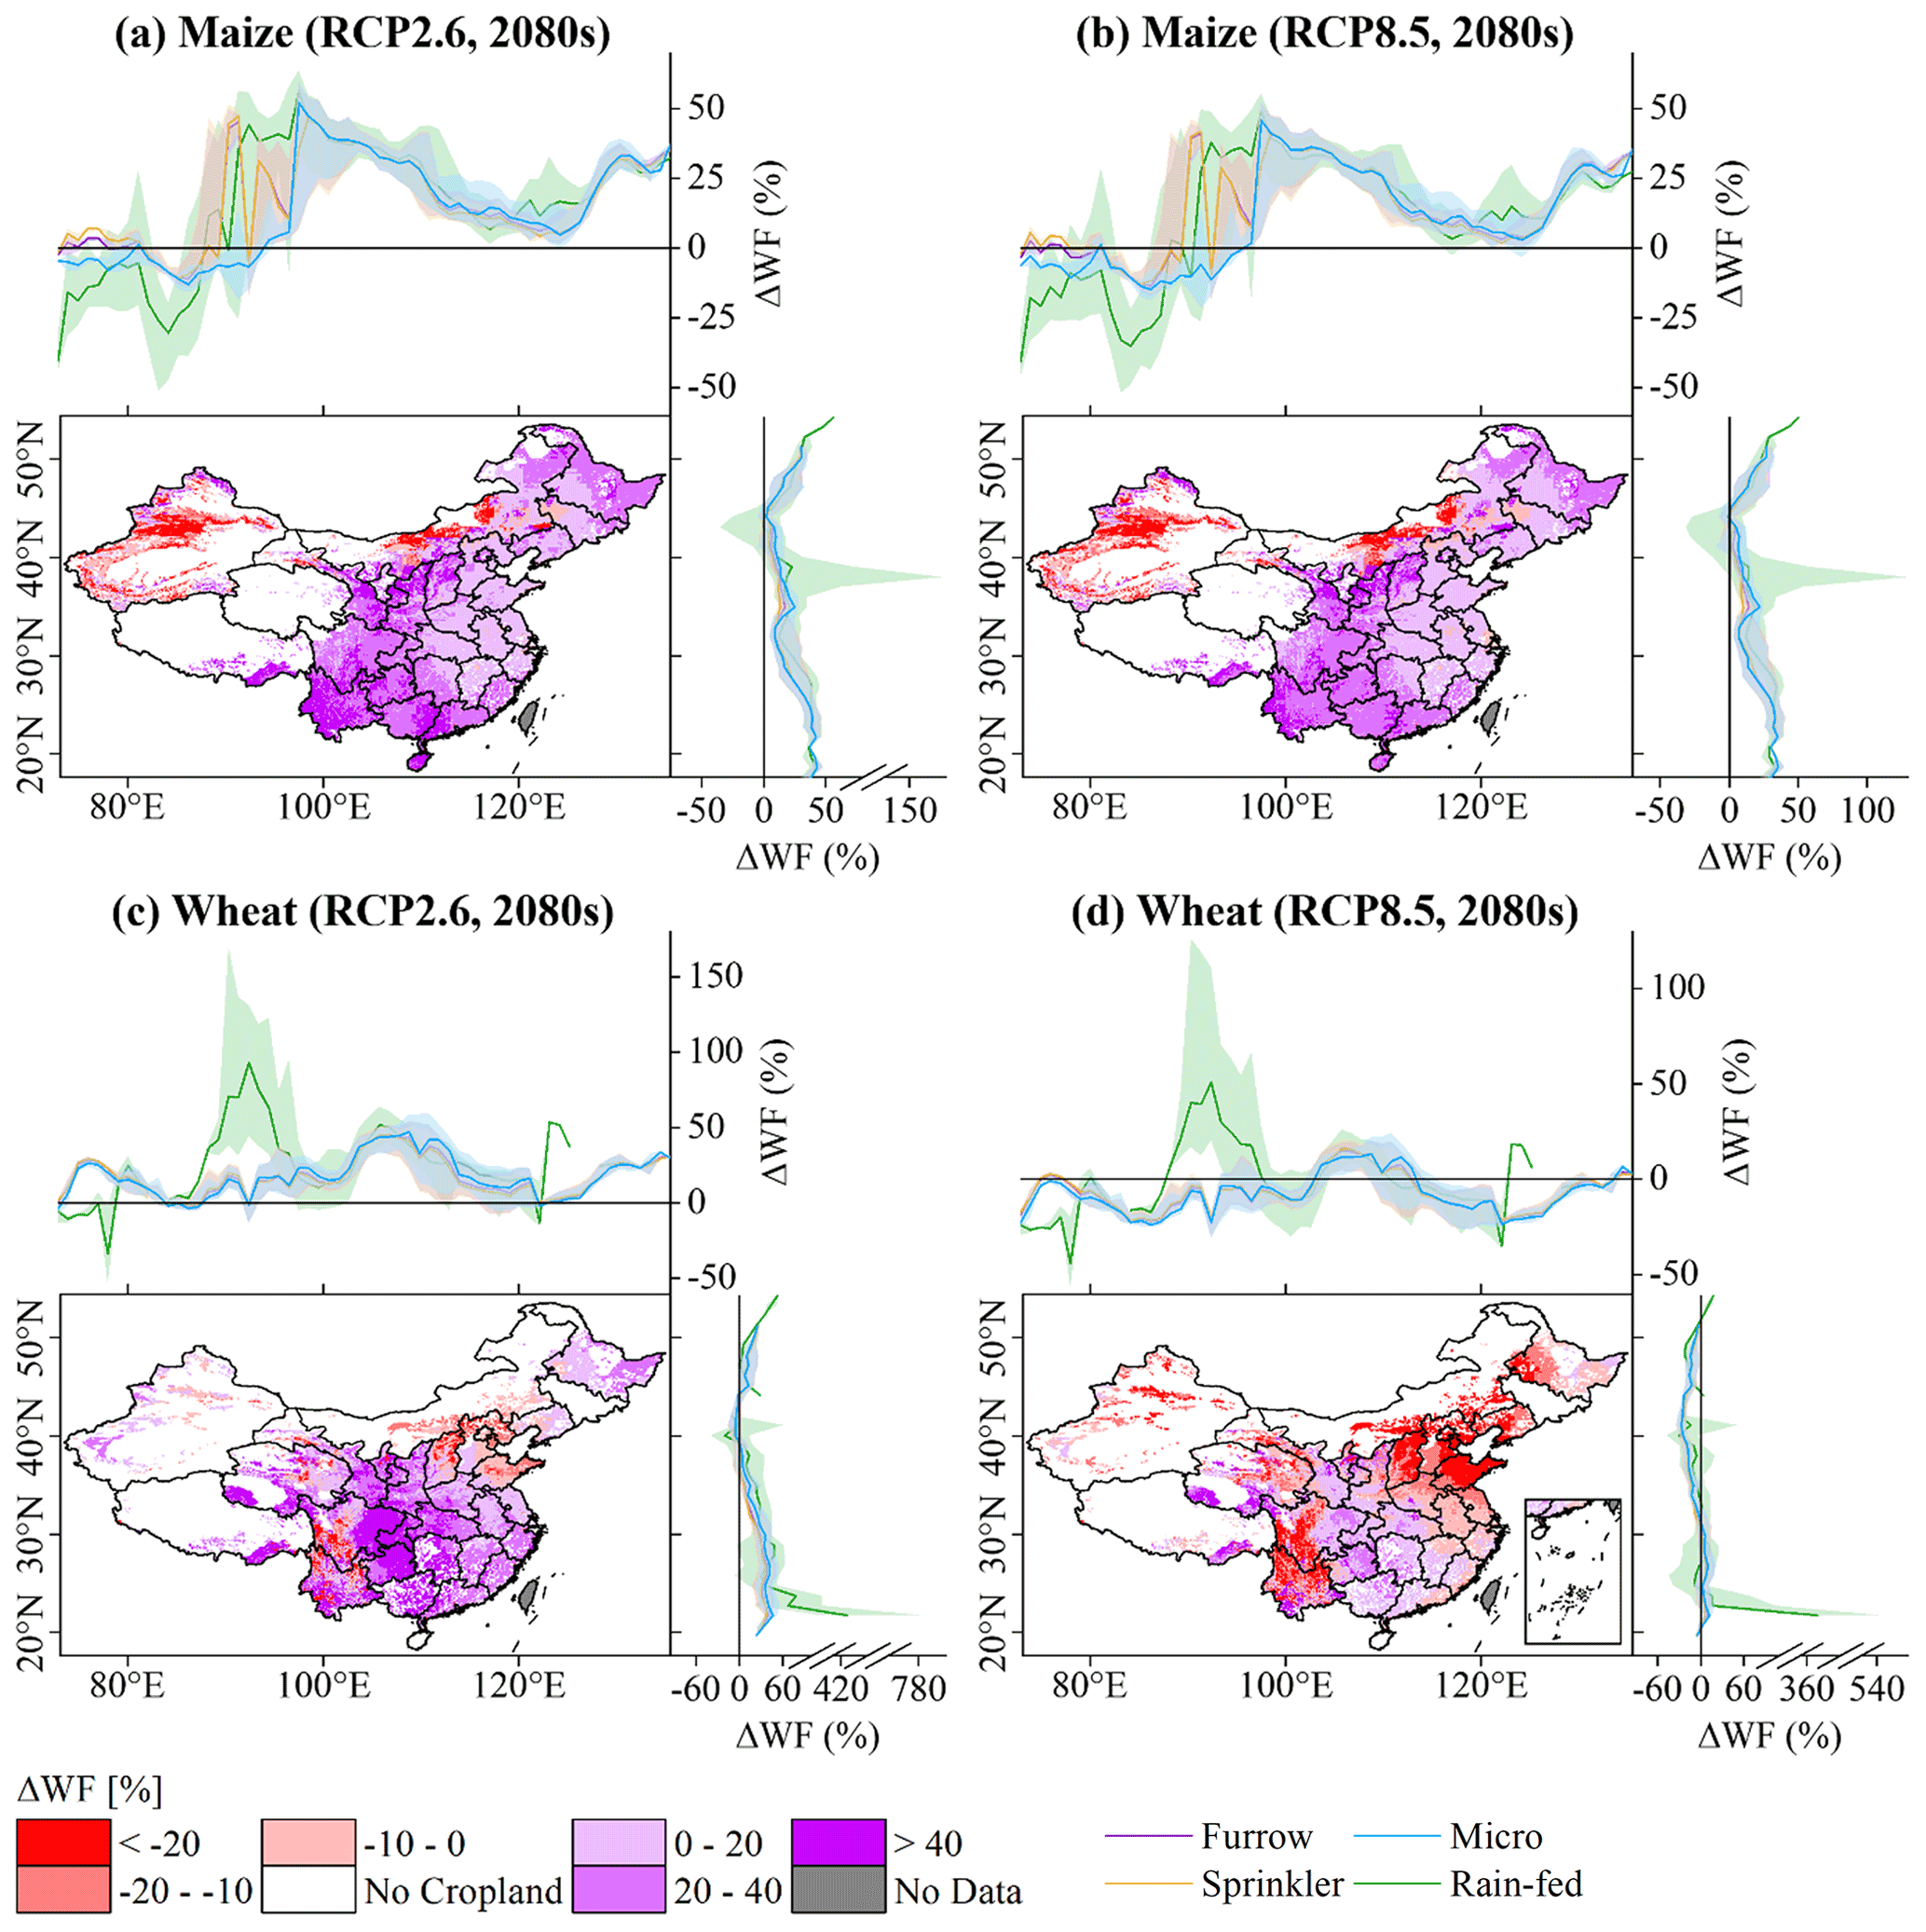
Figure 6Spatial distributions in relative changes Δ (%) in the WF (bottom left of each panel) by longitude (top of each panel) and latitude (right of each panel) under different irrigation regimes applied to both crops (wheat and maize) under two scenarios (RCP2.6 and RCP8.5) from 2013 to the 2080s.
The spatial distribution of the relative changes in the maize and wheat WFs from 2013 to the 2080s showed regional differences. The WF will increase for 90 %–93 % of all areas planted with maize (Fig. 6a, b), and it will increase for 78 % of all areas planted with wheat under RCP2.6 (Fig. 6c) and decrease for 81 % of all areas planted with wheat under RCP8.5 (Fig. 6d). Increases in ET0 lead to increases in the WF, while decreases in PR lead to increases in WFb (Fig. S6). Hence, the regions with relatively greater increases in the WF were mainly distributed where ET0 strongly increased and PR slightly increased or even decreased. In Yunnan, the maize WF increased by 44 % and 38 % under RCP2.6 and RCP8.5, respectively. In Guangxi, the wheat WF increased by 50 % and 16 % under RCP2.6 and RCP8.5, respectively (Table S5). Comparison of rain-fed crops and various irrigation techniques revealed that the WF of each crop responded uniquely to latitudinal and longitudinal climate change under the same scenario. The responses of the maize WF to climate change with latitude were relatively consistent: it increased by 27 %–43 % at 19–26 and ∼ 51∘ N latitude and decreased at ∼ 44∘ N latitude. By contrast, the responses of the WF for rain-fed maize were more sensitive at ∼ 40 and ∼ 52∘ N latitude. The responses of the maize WF vary widely within the 74–100∘ E longitudinal range. The WF of maize under a rain-fed regime and furrow and sprinkler irrigation declined at 74–90∘ E longitude. The increase in the WF for maize under a rain-fed regime at 93–98∘ E longitude was 3 %–51 % higher than the increase in the WF for maize under furrow and sprinkler irrigation. The WF of micro-irrigated maize decreased at 74–95∘ E longitude (Fig. 6a, b). The responses of the wheat WF to climate change with latitude and longitude were relatively consistent. However, in certain areas, there were large differences in the wheat WF between a rain-fed regime and the three irrigation techniques. The WF of wheat under a rain-fed regime decreased at 74–80∘ E longitude (by more than the WF of wheat under the three irrigation techniques within the same longitudinal range). The increases in the WF of wheat under a rain-fed regime at ∼ 93 and ∼ 122∘ E longitude and ∼ 22∘ N latitude were significantly higher than the increases in the WF of wheat under the three irrigation regimes (Fig. 6c, d).
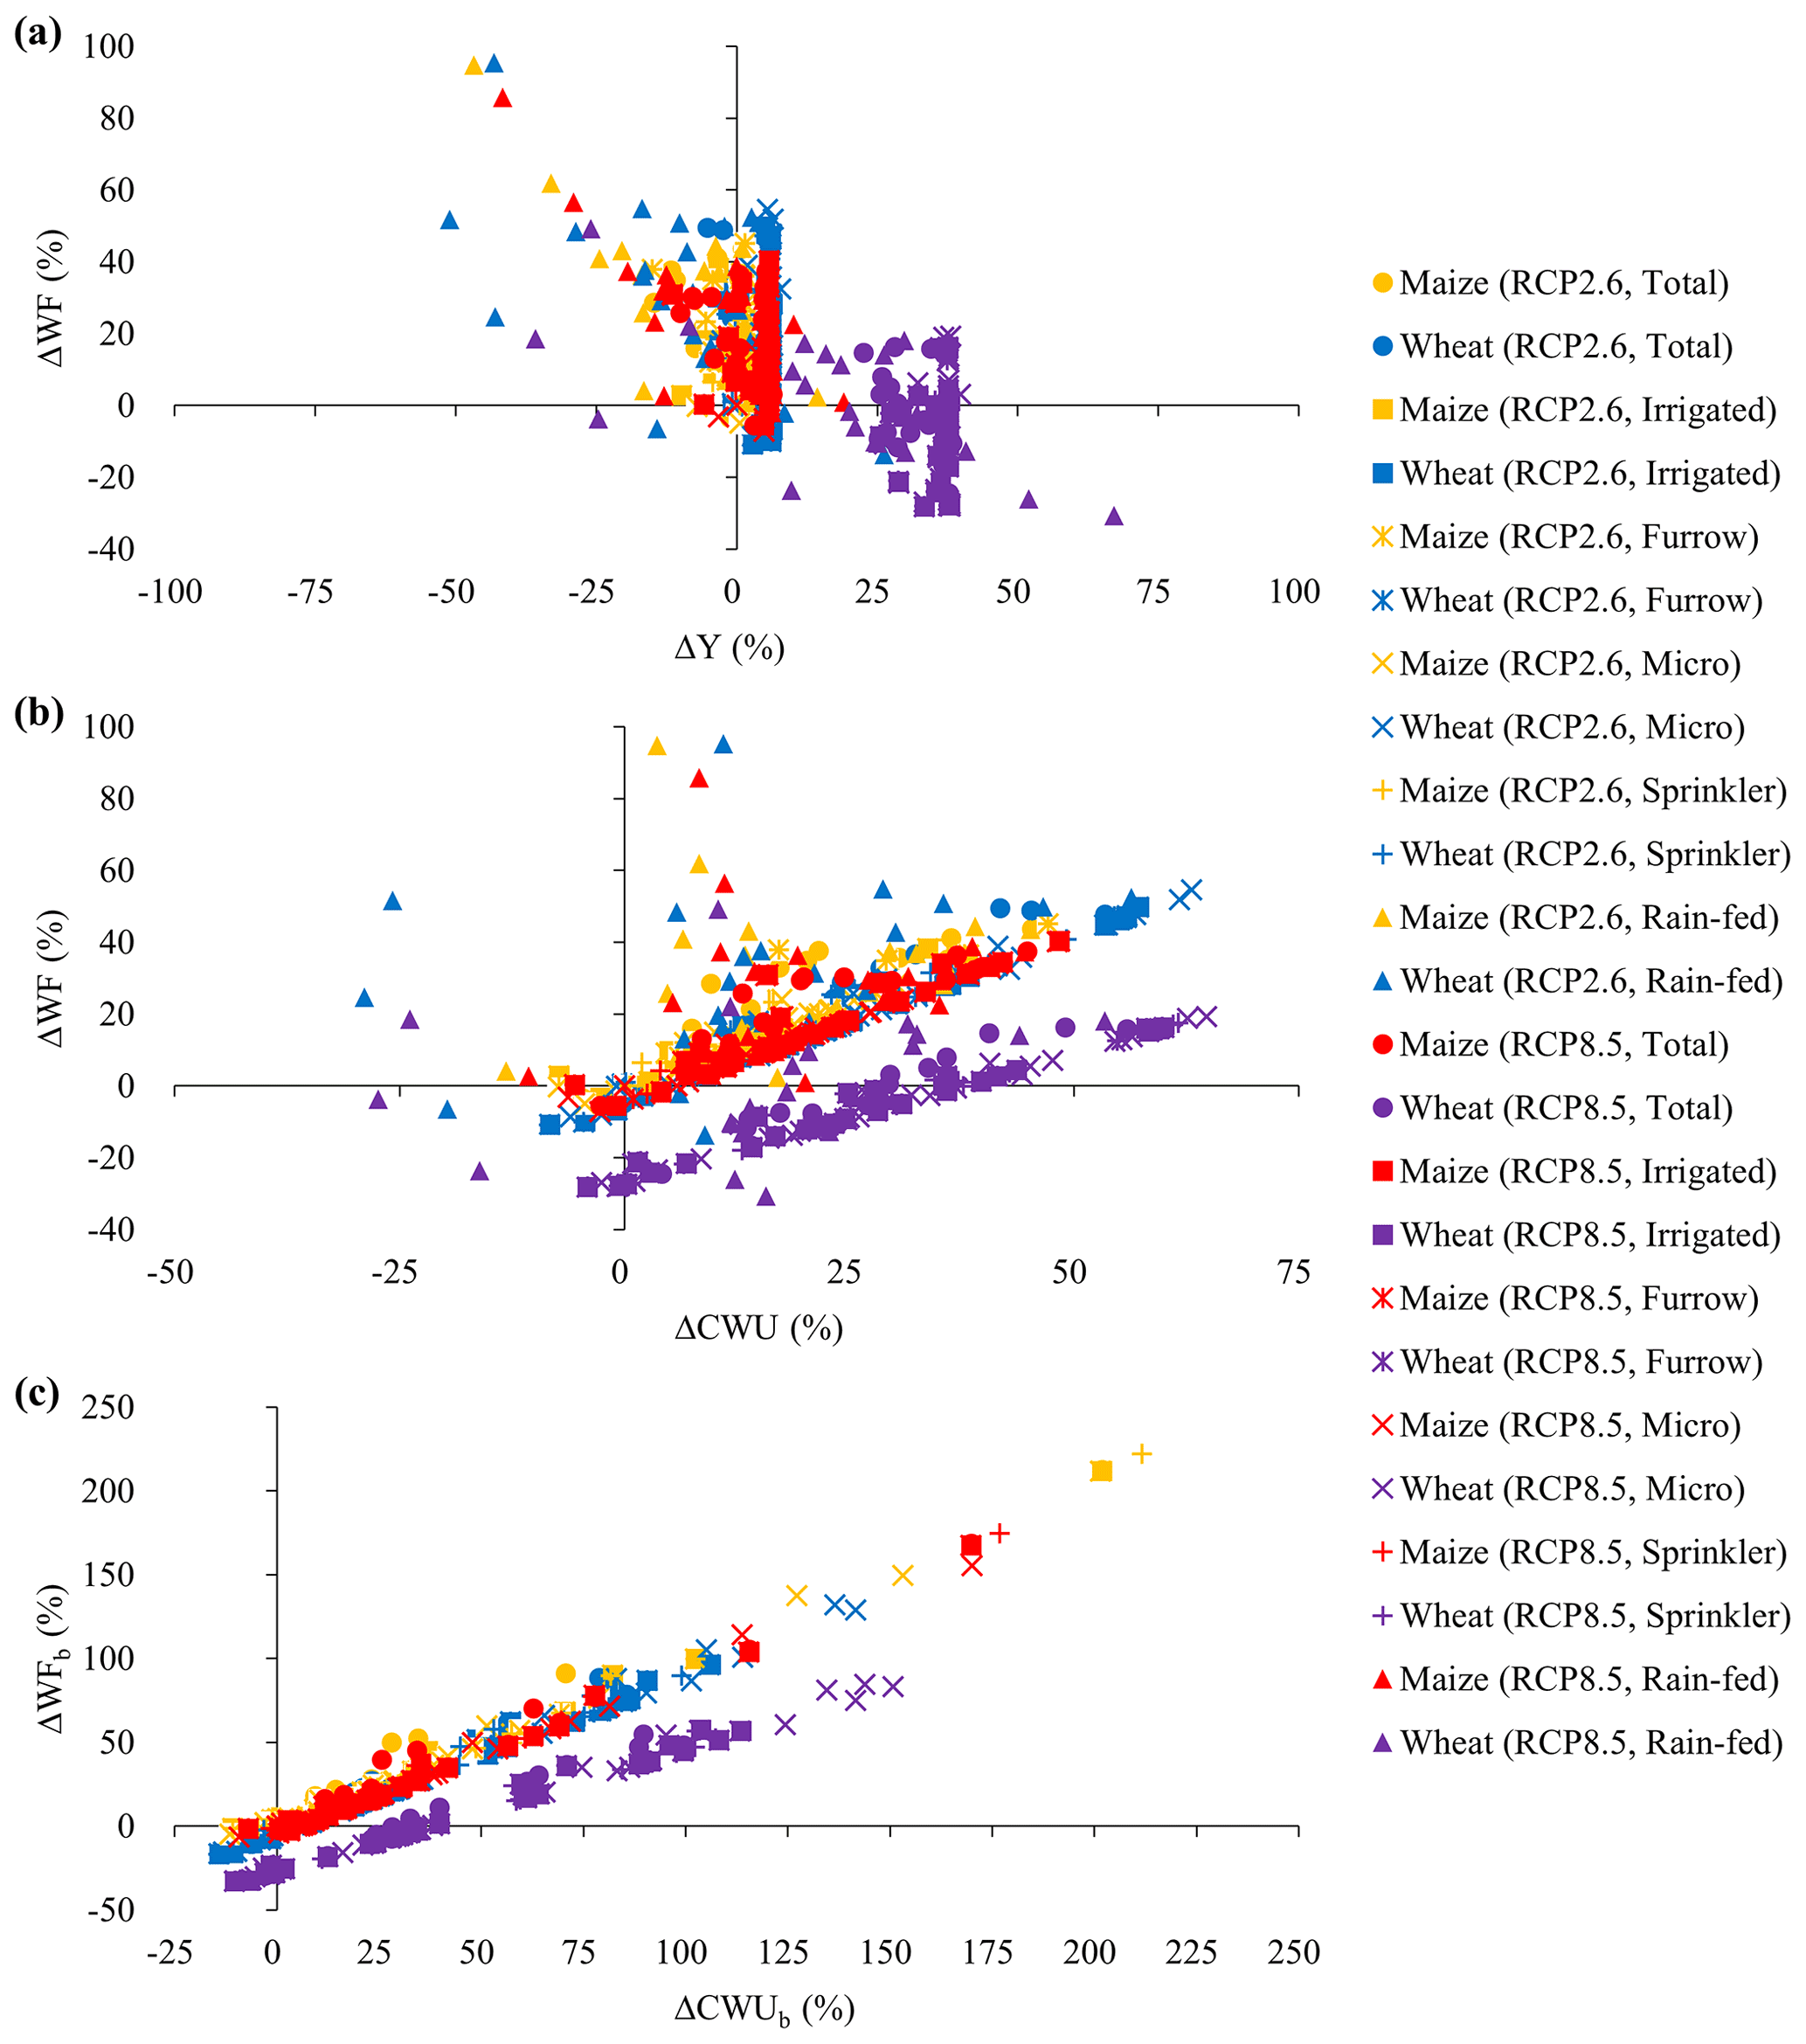
Figure 7Relationships between relative changes Δ (%) in (a) Y and the corresponding WF, (b) CWU and the corresponding WF, and (c) CWUb and the corresponding WFb of two crops under RCP2.6 and RCP8.5 from 2013 to the 2080s.
The WF is determined by both crop yield (Y) and crop water use (CWU). We compared the relationships between the relative changes in the WF (ΔWF) and the corresponding Y (ΔY) and CWU (ΔCWU) (Fig. 7). The ΔWF of maize and wheat under future climate change scenarios was inversely proportional to ΔY and directly proportional to ΔCWU. Nevertheless, ΔWF was relatively more sensitive to ΔY. When ΔY was 25 %, the ΔWF of wheat under RCP2.6 and maize was approximately −25 %, while the ΔWF of wheat under RCP8.5 was approximately −10 %. When the ΔCWU was 25 %, the ΔWF of wheat under RCP2.6 and maize was ∼ 20 %, while the ΔWF of wheat under RCP8.5 was approximately −8 % (Fig. 7a, b). The responses of the ΔWF of maize were more sensitive to ΔY and ΔCWU than those of wheat. The responses of the ΔWF of maize and wheat under RCP2.6 were more sensitive to ΔY and ΔCWU than those under RCP8.5. Comparison of rain-fed regimes and various irrigation techniques revealed that the correlation between the ΔWF and ΔY was stronger for rain-fed crops. For rain-fed maize, R2 can reach 0.55 (Fig. 7a). The ΔWF and ΔCWU were strongly correlated for irrigated crops, and the ΔWF and ΔCWU were especially strongly correlated for crops under micro-irrigated regimes (R2 can reach 0.98 for wheat) (Fig. 7b). We also determined that the relationship between ΔWFb and ΔCWUb was similar but more significant than that between ΔWF and ΔCWU (Fig. 7c).
3.4 Spatiotemporal WF benchmark responses to climate change
Table 3 shows the WF benchmarks of maize and wheat among various irrigation regimes and climate zones in 2013 as well as future year levels. The WF benchmarks of maize and wheat in the humid zone were 13 %–32 % higher than those in the arid zone, which is similar to results obtained by Wang et al. (2019). In the same climate zone, the WF benchmarks of wheat were generally 2 %–35 % higher than those of maize. However, in the humid zone, the WF benchmark for the 25th production percentile of maize was 3 % higher than that of wheat under RCP8.5 in the 2080s. In the arid zone, the WF benchmarks of rain-fed maize were 13 %–34 % higher than those of irrigated maize. In the humid zone of the future, the WF benchmarks of rain-fed wheat were 2 %–7 % higher than those of irrigated wheat. In general, the WF benchmarks of sprinkler-irrigated crops were higher, whereas those of micro-irrigated crops were lower. The differences in the WF benchmarks among various irrigation regimes were more significant in the arid zone. The WF benchmarks of the crops under micro-irrigation regimes were 30 %–38 % lower than those under sprinkler irrigation in the arid zone. The difference in the humid zone was only 8 %–14 %, which is also consistent with the study by Wang et al. (2019). In the humid zone, however, the WF benchmarks of maize under furrow irrigation were 7 %–21 % higher than those under sprinkler irrigation.
Table 3The WF benchmarks (m3 t−1) of maize and wheat for different climate zones (arid and humid) in 2013 as well as future year levels under two climate change scenarios (RCP2.6 and RCP8.5) in China.

∗ The three numbers in parentheses are the values for the 2030s, 2050s and 2080s.
Compared with the baseline year of 2013, the changes in the maize and wheat WF benchmarks under future climate change scenarios are similar to the changes in the WF. However, the WF benchmark for the 20th production percentile of maize will decline by 2 %–6 % in the arid zone. The WF benchmarks of wheat under RCP8.5 will decrease by 2 %–6 % and 13 %–18 % until the 2050s and the 2080s, respectively. The increasing range of the WF benchmark for the 25th production percentile of maize was 7 %–8 % higher in the humid zone than that in the arid zone. The increasing range of the WF benchmark for the 20th production percentile of wheat was 4 %–5 % higher in the humid zone than that in the arid zone. The WF benchmarks of maize and wheat increased to a greater extent under RCP2.6 but decreased to a greater extent under RCP8.5. The WF benchmarks of rain-fed crops increased more than those of irrigated crops in the same climate zone. Nevertheless, the increase in the WF benchmarks was 7 %–11 % lower for rain-fed maize than for irrigated maize in the humid zone. The WF benchmarks of maize and wheat generally increased relatively more under furrow irrigation regimes and comparatively less under sprinkler irrigation. However, under RCP2.6, the growth rate of the WF benchmark for the 20th production percentile of wheat was 5 %–6 % higher under a micro-irrigation regime than that under furrow irrigation in the arid zone. The increase in the WF benchmark for the 20th production percentile of wheat was 0.19 %–2 % higher under sprinkler irrigation than that under micro-irrigation in the humid zone (Table 3).
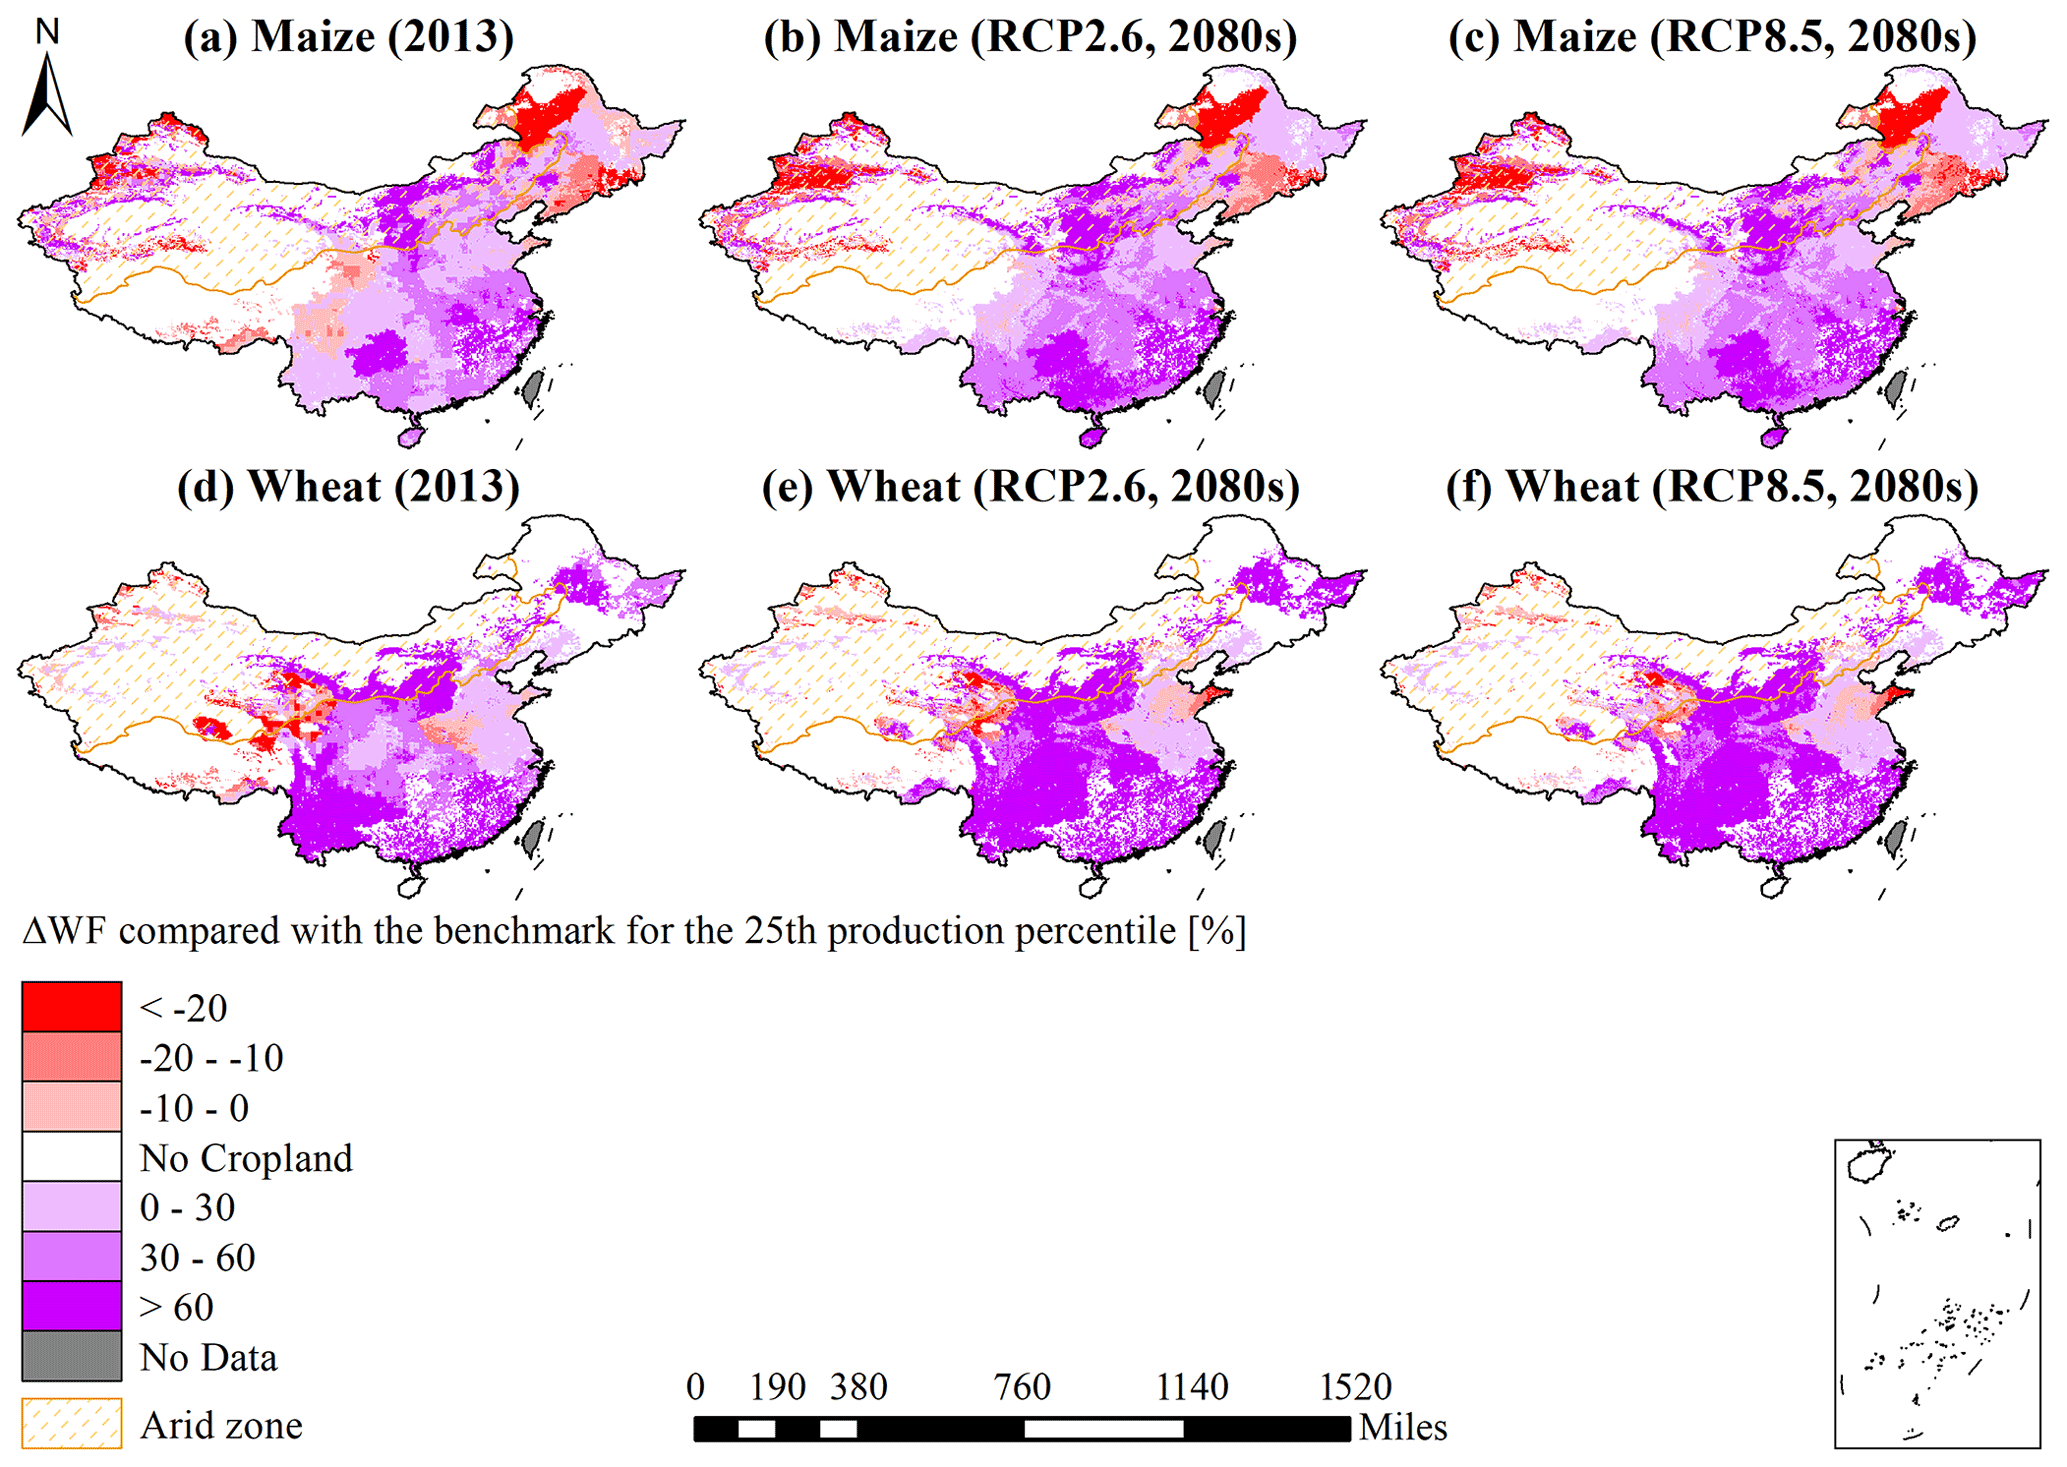
Figure 8Relative changes Δ (%) in the WFs of maize and wheat compared with the benchmark for the 25th production percentile in 2013 and in the 2080s under RCP2.6 and RCP8.5 in different climate zones of China. Please note that 1 mile in the scale bar represents approximately 1.61 km.
Figure 8 shows the spatial distribution of the relative changes in the WFs of maize and wheat compared with the benchmark for the 25th production percentile in 2013 and the 2080s. In 2013, the WF for 81 % and 79 % of the areas planted with maize and wheat, respectively, was higher than its benchmark. The areas planted with maize with a WF below the benchmark were distributed mainly in Xinjiang in the arid zone and in northeastern Inner Mongolia in the humid zone (Fig. 8a). The areas planted with wheat with a WF below the benchmark were distributed mainly in Xinjiang in the arid zone and in Qinghai (Fig. 8d). Under future climate change scenarios, the areas planted with maize and wheat with a WF below the benchmark will slightly decrease in the 2080s. These areas are mainly distributed in Heilongjiang, Tibet, southern Gansu, and Sichuan in the humid zone for maize; for wheat, they are mainly distributed in Henan and Tibet in the humid zone and in Qinghai. This is because the annual ET0 will increase relatively faster in Heilongjiang and Tibet, which will lead to a greater increase in the WFb. The annual PR in other regions will significantly increase, which will result in a greater increase in the WFg. Areas planted with maize and wheat under RCP8.5 with a WF below the benchmark will decrease by 5 % and 4 %, respectively, until the 2080s.
3.5 Discussion
This study analyzed and compared the responses of the WF and WF benchmarks of wheat and maize under a rain-fed regime and various irrigation conditions and forecasted their responses to future climate change scenarios in China. On the background that the annual ET0 and PR will both increase but ET0 will increase faster, the maize WF will increase under both the RCP2.6 and RCP8.5 scenarios. The wheat WF will increase under RCP2.6 but will decrease under RCP8.5 until the 2080s. Rain-fed crops were found to have higher ranges of increasing WF values, which is consistent with Rosa et al. (2020). The increasing ranges of maize and wheat WF values were lowest under micro-irrigated and sprinkler-irrigated conditions, respectively. Therefore, the implementation of water-saving irrigation techniques (micro-irrigation and sprinkler irrigation) may help mitigate the adverse effects of future climate change on agriculture, which is in line with Dai et al. (2020). Under future climate change, the WF benchmarks will be modified in a manner resembling that for the WF. However, the former changes will not be as significant as the latter in the same area.
Table 4Comparison of the results between current and previous studies.
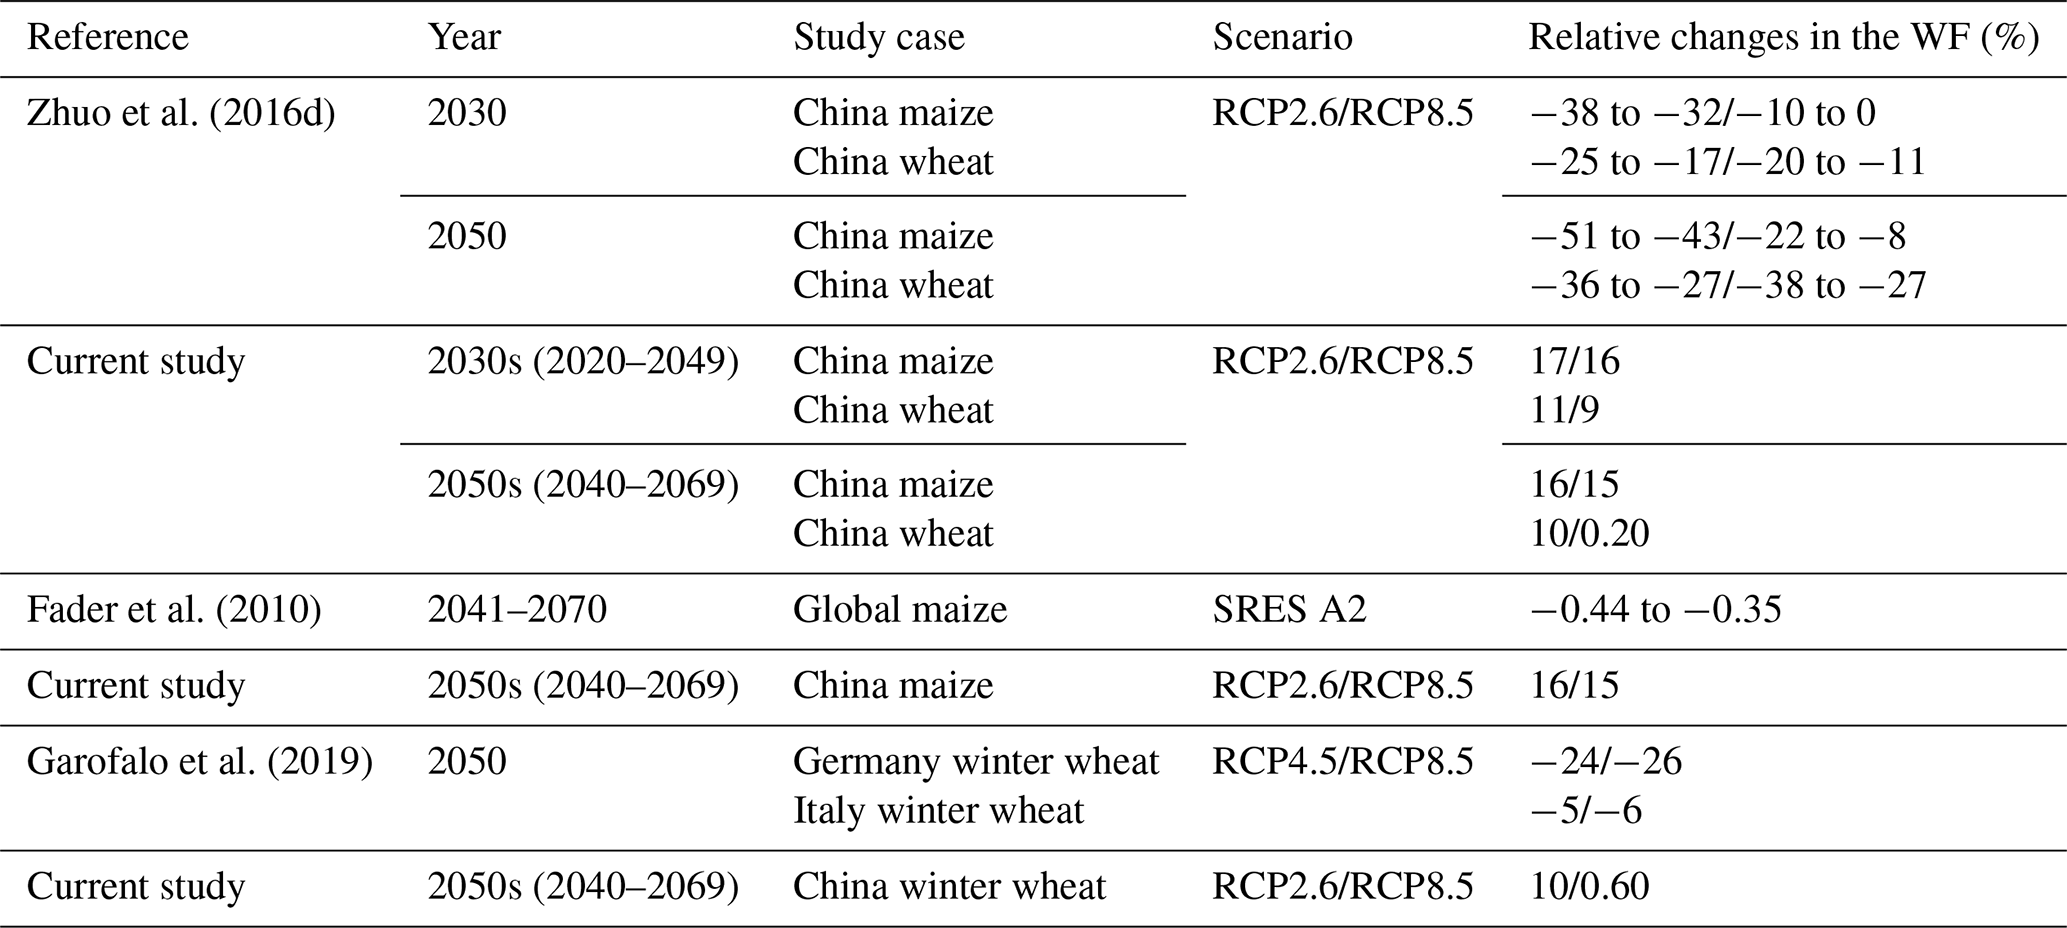
In 2013, the WF of maize was lower than that of wheat. Nevertheless, the maize WF is expected to increase more rapidly than the wheat WF under future climate change scenarios. C4 crops, such as maize, have higher photosynthetic rates than C3 crops, such as wheat. However, C4 crops are less sensitive to elevated atmospheric CO2 than C3 crops (Bowes, 1993). Hence, while the maize yield is higher than the wheat yield, the former increases less than the latter. We compared the current results against those of previous studies in Table 4. The differences that we determined for the relative changes in the maize and wheat WFs between years and RCPs resembled those reported by Zhuo et al. (2016d). However, these authors also considered other factors, such as harvested crop area, technology, diet, and population, that could partially offset the adverse effects of future climate change. Therefore, the maize and wheat WFs will decline in the future according to Zhuo et al. (2016d). Fader et al. (2010) studied relative global-scale changes in the maize WF for 2050. Their analysis was conducted in the opposite direction of that of the present study on China. Moreover, the two studies differed in terms of climate scenario, research area, and crop model. The winter wheat WF in Germany and Italy will decline by 2050 according to Garofalo et al. (2019). Nevertheless, our research showed that the winter wheat WF will increase in China by 2050. The crop water use in Germany and Italy changes less than that in China. However, our observed differences in the relative changes in the WF between RCPs were consistent with those of Garofalo et al. (2019) – namely, under RCP8.5, the WF will either decrease more or increase less.
In the future, the spatial distributions of the maize and wheat WFs will change considerably. By contrast, the spatial distributions of the WF benchmarks will undergo negligible change. This phenomenon is comparatively more pronounced in areas with limited agricultural development. In 2013, Guizhou and Guangxi had the highest maize and wheat WFs (1317 and 3720 m3 t−1, respectively; Tables S1, S2). In the humid zone, the maize WF in Guizhou and the wheat WF in Guangxi will increase by 37 % and 50 %, respectively, under RCP2.6 and by 33 % and 16 %, respectively, under RCP8.5 until the 2080s (Table S5). Nevertheless, the WF benchmarks for the 25th production percentile of maize and wheat in the humid zone will only increase by 12 % and 8 %, respectively, under RCP2.6, whereas they will increase by 9 % and decrease by 14 %, respectively, under RCP8.5. These areas will, nonetheless, have great potential for agricultural water conservation in the future. If the maize and wheat WFs in various regions of China can be reduced to the benchmark for the 25th production percentile, the total CWU can be reduced by 45×109–66×109 m3 (∼ 14 %–17 %). Rain-fed agriculture can save 27×109–40×109 m3 (∼ 18 %–22 %) of water, which is more than that conserved by irrigation. In irrigated agriculture, furrow irrigation has a comparatively high water-saving potential (17×109–22×109 m3; ∼ 11 %–12 %). To optimize the agricultural water-saving potential in China, we must either reduce the WF or prevent it from increasing, either by enhancing crop yield or decreasing CWU. However, this goal can only be realized with the support of relevant policies and management practices. The annual PR is relatively low, and the ET0 is relatively high in North China. The shortage of water for agriculture is a major bottleneck in the development of local agriculture in this region. However, furrow irrigation is mainly applied in these areas (Fig. S3). Hence, irrigation water use efficiency is low and the WFb is high. High-efficiency, water-saving micro-irrigation and sprinkler irrigation could replace furrow irrigation in these areas, thereby decreasing the CWU and WF. The planted areas in the south have abundant precipitation but a limited distribution (Fig. S2) and high WF (Fig. 4a, b). The WF can be mitigated by implementing ground cover techniques (e.g., straw return, mulch) to reduce soil evaporation and by improving farmer skills. The WF can also be reduced by optimizing the structure of crop planting. Crops and varieties best adapted to the local climate conditions and climate change can lower irrigation requirements and reduce the WF.
To make climate models comparable and promote their development, the World Climate Research Program (WCRP) has developed and promoted the CMIP since 1995 (Meehl et al., 1997, 2000). Its current iteration is Phase 6 (CMIP6), which will be used in the forthcoming Sixth Assessment Report (AR6) by the Intergovernmental Panel on Climate Change (IPCC). GCMs and their associated research results based on CMIP5 provided vital support for the IPCC's Fifth Assessment Report (IPCC AR5). CMIP5 proposed four RCP scenarios (RCP2.6, RCP4.5, RCP6.0, and RCP8.5) by considering greenhouse gas (GHG) emissions and concentrations, atmospheric pollutant concentrations, and land use in the 21st century (Moss et al., 2008). However, no specific socioeconomic assumptions were made. The Scenario Model Intercomparison Project (ScenarioMIP), as the primary activity within CMIP6, will provide a series of new climate scenarios that consider social factors related to climate change adaptation and impacts. They will be based on the combined application of Shared Socioeconomic Pathway (SSP) scenarios and RCPs, and they will compensate for the limitations of the RCPs in CMIP5 (O'Neill et al., 2016). The climate models in CMIP5 and CMIP6 can both effectively simulate changes in potential evapotranspiration (Liu et al., 2020) and precipitation (Müller et al., 2021) in most parts of the world. Müller et al. (2021) reported that CMIP5 and CMIP6 simulate increasing trends in temperature in a similar fashion. Nevertheless, the simulation generated by CMIP6 is higher than that generated by CMIP5. Notwithstanding, CMIP5 and CMIP6 are reasonably consistent and similar in terms of their abilities to predict future climate changes. This study focused on the responses of crop production to future climate change. It mainly considered the influences of GHG emission- and concentration-driven climate change and excluded the influences of alterations in socioeconomic development. Therefore, we implemented CMIP5 in our current research.
There are two methods for establishing WF benchmarks (Hoekstra, 2013). Method 1 is based on yield accumulation statistical analysis. Due to the variability in the WFs found across regions and among producers within a region, we can select the WF of 20 % or 25 % of the producers with the highest water productivity as the WF benchmark for each crop (Mekonnen and Hoekstra, 2014). Method 2 is based on the available optimal technique analysis. We can compare the WFs at each location under different agricultural management practices and take the WF associated with optimal practice, which results in the smallest WF, as the WF benchmark (Chukalla et al., 2015). Both methods establish WF benchmarks based on the maximum reasonable water consumption in each step of the product's supply chain (Hoekstra, 2014). Method 1 is suitable for large-scale application. The differences in environmental conditions (such as climate) and development conditions should be comprehensively considered (Mekonnen and Hoekstra, 2014; Zhuo et al., 2016a). The drawback of Method 1 is that no matter what spatial scope one uses to group producers, there will still be variability from place to place within that scope, even if the differences in regional environmental and development conditions are taken into account (Schyns et al., 2022). Method 2 is suitable for smaller scales and overcomes this drawback of Method 1 to some extent. The drawback of Method 2 is that it has the higher requirements with respect to the setting and simulation of different agricultural management practices. We mainly want to explore the response of the large-scale WF to future climate change under specific irrigation regimes – that is, each irrigation technique has its corresponding WF benchmarks. Thus, only one agricultural management practice – irrigation – is considered here. Therefore, we choose Method 1. A combination of methods should be established; hence, if conditions permit, we strongly recommend that Method 1 and Method 2 are combined to establish small-scale WF benchmarks. Different agricultural management practices, such as irrigation, mulching techniques, and so on, can be combined to further determine WF benchmarks.
The sources of uncertainty in research on the responses of crop production to climate change include GCMs, climate scenarios, crop models, and their interactions (Wang et al., 2020). Semenov and Stratonovitch (2010) proposed that the use of multiple GCMs can reduce the uncertainty associated with them. We selected three GCMs each for wet and dry climate outputs to encompass a broad climate prediction scenario. To objectively and comprehensively project the future climate change trends of China, we selected two extreme RCPs, namely RCP2.6 and RCP8.5. Wang et al. (2020) suggested that crop models are the main source of uncertainty in predicting wheat yield in China under future climate change. The application of various crop models and parameter settings inevitably lead to different yield forecasts (Asseng et al., 2013). Hence, the use of AquaCrop alone may introduce uncertainty into WF forecasting.
The present study had certain limitations in terms of the assumptions it made for the simulation. First, we assumed that the crop parameters (such as planting calendar, HI0, and Zx) for each crop were constant on a spatiotemporal scale under identical growing modes (irrigated or a rain-fed regime). Yoon and Choi (2020) proposed that future increases in temperature and precipitation might shorten the crop growth period. Xiao et al. (2020) indicated that the winter wheat and summer maize growing periods will be lengthened and shortened, respectively, under future climate change. However, we did not consider future changes in the crop growth period. Second, we assumed a constant soil surface moisture rate for each grid under the various irrigation techniques. Third, it was assumed that the observed changes in the planted areas in 2013 were based on the 2000 raster database, and we ignored the migration of planted areas. Finally, we assumed that the areas planted with maize and wheat will not change in the future and that they would remain consistent with the baseline year (2013). Thus, we did not consider future development of cultivated lands.
The core content of this study was to quantify the responses of the maize and wheat WFs and WF benchmarks to future climate change under various irrigation regimes. Future research must improve the accuracy of the crop model simulation and reduce the uncertainty of climate prediction associated with using different GCMs. Moreover, this study only considered future climate change scenarios. Future investigations should also consider the influence of changes in technological development, land use, growing modes, and so on.
This study explored the responses of the maize and wheat WFs and WF benchmarks to future climate change in China. The crops were subjected to various irrigation regimes. The year 2013 was the baseline, and the WF and its benchmarks were quantified for each crop under a rain-fed regime and using irrigation (furrow-, micro-, and sprinkler-irrigated) management techniques in the 2030s, 2050s, and 2080s under RCP2.6 and RCP8.5 at a 5 arcmin grid scale. The AquaCrop model with the outputs of six GCMs from CMIP5 as its input data was used to simulate the WFs of maize and wheat. The results show the following:
-
Compared with 2013, the annual ET0 and PR in the areas planted with maize and wheat in China will both increase; however, the former will increase faster than the latter.
-
The maize WF will increase under both RCP2.6 and RCP8.5 (by 17 % and 13 %, respectively) until the 2080s. The wheat WF will increase under RCP2.6 (by 12 % until the 2080s) but decrease (by 12 %) under RCP8.5 until the 2080s. Rain-fed crops were found to be more vulnerable to the adverse impacts of future climate change, and their WF values increased to a greater extent than that of irrigated crops. Micro-irrigation and sprinkler irrigation resulted in the lowest increases in the WF for maize and wheat, respectively. Hence, these water-saving irrigation practices effectively mitigated the negative impact of climate change.
-
Within different climate zones and under various irrigation regimes, there will be significant differences in the responses of the WF benchmarks to future climate change. The changes in the WF and its benchmarks will be similar in response to future climate change. The rate of increase in the WF benchmarks for sprinkler-irrigated crops will generally be lower than those for rain-fed, micro-irrigated, and furrow-irrigated crops within the same climate zone. However, the change in the spatial distribution of the WF benchmarks will not be as significant as that of the WF itself. Moreover, this difference will be more pronounced in regions with low agricultural development. Additionally, this study also demonstrated that the agricultural water in China still has substantial water-saving potential and can be effectively conserved.
The data sources are listed in Sect. 2.5. Data generated in this paper are available upon request from La Zhuo.
The supplement related to this article is available online at: https://doi.org/10.5194/hess-26-4637-2022-supplement.
LZ and PW designed the study. ZY and XJ carried out the study and prepared the manuscript with contributions from all co-authors. WW and ZL validated and analyzed the results.
The contact author has declared that none of the authors has any competing interests.
Publisher’s note: Copernicus Publications remains neutral with regard to jurisdictional claims in published maps and institutional affiliations.
The study has been financially supported by the program for cultivating outstanding agricultural talents, Ministry of Agriculture and Rural Affairs of the People's Republic of China (grant no. 13210321), and the National Natural Science Foundation of China (grant no. 51809215).
This research has been supported by the fund for cultivating outstanding agricultural talents, Ministry of Agriculture and Rural Affairs of the People's Republic of China (grant no. 13210321), and the National Natural Science Foundation of China (grant no. 51809215).
This paper was edited by Monica Riva and reviewed by two anonymous referees.
Ahmadi, M., Etedali, H. R., and Elbeltagi, A.: Evaluation of the effect of climate change on maize water footprint under RCPs scenarios in Qazvin plain, Iran, Agr. Water Manage., 254, 106969, https://doi.org/10.1016/j.agwat.2021.106969, 2021.
Allen, R. G., Pereira, L. S., Raes, D., and Smith, M.: Crop evapotranspiration-Guidelines for computing crop water requirements-FAO Irrigation and drainage paper 56, 300, FAO, Rome, Italy, ISBN 9251042195, 1998.
Arora, V. K., Scinocca, J. F., Boer, G. J., Christian, J. R., Denman, K. L., Flato, G. M., Kharin, V. V., Lee, W. G., and Merryfield, W. J.: Carbon emission limits required to satisfy future representative concentration pathways of greenhouse gases, Geophys. Res. Lett., 38, 387–404, https://doi.org/10.1029/2010GL046270, 2011.
Arunrat, N., Pumijumnong, N., Sereenonchai, S., Chareonwong, U., and Wang, C.: Assessment of climate change impact on rice yield and water footprint of large-scale and individual farming in Thailand, Sci. Total Environ., 726, 137864, https://doi.org/10.1016/j.scitotenv.2020.137864, 2020.
Asseng, S., Ewert, F., Rosenzweig, C., Jones, J. W., Hatfield, J. L., Ruane, A. C., Boote, K. J., Thorburn, P. J., Rötter, R. P., Cammarano, D., Brisson, N., Basso, B., Martre, P., Aggarwal, P. K., Angulo, C., Bertuzzi, P., Biernath, C., Challinor, A. J., Doltra, J., Gayler, S., Goldberg, R., Grant, R., Heng, L., Hooker, J., Hunt, L. A., Ingwersen, J., Izaurralde, R. C., Kersebaum, K. C., Müller, C., Naresh Kumar, C., Nendel, C., O'Leary, G., Olesen, J. E., Osborne, T. M., Palosuo, T., Priesack, E., Ripoche, D., Semenov, M. A., Shcherbak, I., Steduto, P., Stöckle, C., Stratonovitch, P., Streck, T., Supit, I., Tao, F., Travasso, M., Waha, K., Wallach, D., White, J. W., Williams, J. R., and Wolf, J.: Uncertainty in simulating wheat yields under climate change, Nat. Clim. Chang., 3, 827–832, https://doi.org/10.1038/nclimate1916, 2013.
Bai, T. and Gao, J.: Optimization of the nitrogen fertilizer schedule of maize under drip irrigation in Jilin, China, based on DSSAT and GA, Agr. Water Manage., 244, 106555, https://doi.org/10.1016/j.agwat.2020.106555, 2021.
Batjes, N.: ISRIC-WISE Derived Soil Properties on a 5 by 5 Arc-Minutes Global Grid (Ver. 1.2), ISRIC, Wageningen, the Netherlands, https://www.isric.org (last access: 19 August 2022), 2012.
Bowes, G.: Facing the Inevitable: Plants and Increasing Atmospheric CO2, Annu. Rev. Plant Phys. Plant Mol. Biol., 44, 309–332, https://doi.org/10.1146/annurev.pp.44.060193.001521, 1993.
CCAFS: CCAFS-Climate Statistically Downscaled Delta Method data, Climate Change, Agriculture and Food Security, http://www.ccafs-climate.org (last access: 10 August 2022), 2015.
CEDA: Climatic Research Unit (CRU) time-series datasets of variations in climate with variations in other phenomena, NCAS British Atmospheric Data Centre, https://data.ceda.ac.uk/ (last access: 25 June 2022), 2018.
Chukalla, A. D., Krol, M. S., and Hoekstra, A. Y.: Green and blue water footprint reduction in irrigated agriculture: effect of irrigation techniques, irrigation strategies and mulching, Hydrol. Earth Syst. Sci., 19, 4877–4891, https://doi.org/10.5194/hess-19-4877-2015, 2015.
CIDDC: China Irrigation and Drainage Development Center, China, http://www.jsgg.com.cn/temp/Index/Display.asp?NewsID=12313, last access: 14 April 2022.
Dai, C., Qin, X. S., Lu, W. T., and Huang, Y.: Assessing adaptation measures on agricultural water productivity under climate change: A case study of Huai River Basin, China, Sci. Total Environ., 721, 137777, https://doi.org/10.1016/j.scitotenv.2020.137777, 2020.
Delworth, T. L., Broccoli, A. J., Rosati, A., Stouffer, R. J., Balaji, V., Beesley, J. A., Cooke, W. F., Dixon, K. W., Dunne, J., Dunne, K. A., Durachta, J. W., Findell, K. L., Ginoux, P., Gnanadesikan, A., Gordon, C. T., Griffies, S. M., Gudgel, R., Harrison, M. J., Held, I. M., Hemler, R. S., Horowitz, L. W., Klein, S. A., Knutson, T. R., Kushner, P. J., Langenhorst, A. R., Lee, H. C., Lin, S. J., Lu, J., Malyshev, S. L., Milly, P. C. D., Ramaswamy, V., Russell, J., Schwarzkopf, M. D., Shevliakova, E., Sirutis, J. J., Spelman, M. J., Stern, W. F., Winton, M., Wittenberg, A. T., Wyman, B., Zeng, F., and Zhang, R.: GFDL's CM2 Global Coupled Climate Models. Part I: Formulation and Simulation Characteristics, J. Climate, 19, 643–674, https://doi.org/10.1175/JCLI3629.1, 2006.
Dijkshoorn, J. A., Engelen, V. W. P. V., and Huting, J. R. M.: Soil and landform properties for LADA partner countries (Argentina, China, Cuba, Senegal, South Africa and Tunisia), ISRIC–World Soil Information and FAO, Wageningen, the Netherlands, https://doi.org/10.13031/2013.42676, 2008.
Donner, L. J., Wyman, B. L., Hemler, R. S., Horowitz, L. W., Ming, Y., Zhao, M., Golaz, J. C., Ginoux, P., Lin, S. J., Schwarzkopf, M. D., Austin, J., Alaka, G., Cooke, W. F., Delworth, T. L., Freidenreich, S. M., Gordon, C. T., Griffies, S. M., Held, I. M., Hurlin, W. J., Klein, S. A., Knutson, T. R., Langenhorst, A. R., Lee, H. C., Lin, Y., Magi, B. I., Malyshev, S. L., Milly, P. C. D., Naik, V., Nath, M. J., Pincus, R., Ploshay, J. J., Ramaswamy, V., Seman, C. J., Shevliakova, E., Sirutis, J. J., Stern, W. F., Stouffer, R. J., Wilson, R. J., Winton, M., Wittenberg, A. T., and Zeng, F.: The Dynamical Core, Physical Parameterizations, and Basic Simulation Characteristics of the Atmospheric Component AM3 of the GFDL Global Coupled Model CM3, J. Climate, 24, 3484–3519, https://doi.org/10.1175/2011JCLI3955.1, 2011.
Dufresne, J. L., Foujols, M. A., Denvil, S., Caubel, A., Marti, O., Aumont, O., Balkanski, Y., Bekki, S., Bellenger, H., Benshila, R., Bony, S., Bopp, L., Braconnot, P., Brockmann, P., Cadule, P., Cheruy, F., Codron, F., Cozic, A., Cugnet, D., Noblet, N. D., Duvel, J. P., Ethé, C., Fairhead, L., Fichefet, T., Flavoni, S., Friedlingstein, P., Grandpeix, J. Y., Guez, L., Guilyardi, E., Hauglustaine, D., Hourdin, F., Idelkadi, A., Ghattas, J., Joussaume, S., Kageyama, M., Krinner, G., Labetoulle, S., Lahellec, A., Lefebvre, M. P., Lefevre, F., Levy, C., Li, Z. X., Lloyd, J., Lott, F., Madec, G., Mancip, M., Marchand, M., Masson, S., Meurdesoif, Y., Mignot, J., Musat, I., Parouty, S., Polcher, J., Rio, C., Schulz, M., Swingedouw, D., Szopa, S., Talandier, C., Terray, P., Viovy, N., and Vuichard, N.: Climate change projections using the IPSL-CM5 Earth System Model: from CMIP3 to CMIP5, Clim. Dynam., 40, 2123–2165, https://doi.org/10.1007/s00382-012-1636-1, 2013.
Fader, M., Rost, S., Müller, C., Bondeau, A., and Gerten, D.: Virtual water content of temperate cereals and maize: Present and potential future patterns, J. Hydrol., 384, 218–231, https://doi.org/10.1016/j.jhydrol.2009.12.011, 2010.
FAO: FAOSTAT on-line database, Food and Agriculture Organization of the United Nation, Rome, Italy, http://www.fao.org/faostat/en/#data/QC (last access: 1 August 2022), 2021.
Garofalo, P., Ventrella, D., Kersebaum, K. C., Gobin, A., Trnka, M., Giglio, L., Dubrovský, M., and Castellini, M.: Water footprint of winter wheat under climate change: Trends and uncertainties associated to the ensemble of crop models, Sci. Total Environ., 658, 1186–1208, https://doi.org/10.1016/j.scitotenv.2018.12.279, 2019.
Guo, H., Li, S., Wong, F. L., Qin, S., Wang, Y., Yang, D., and Lam, H. M.: Drivers of carbon flux in drip irrigation maize fields in northwest China, Carbon Balance Manag., 16, 12, https://doi.org/10.1186/s13021-021-00176-5, 2021.
Harris, I., Jones, P. D., Osborn, T. J., and Lister, D. H: Updated high-resolution grids of monthly climatic observations – the CRU TS3.10 Dataset, Int. J. Climatol., 34, 623–642, https://doi.org/10.1002/joc.3711, 2014.
Hatfield, J. L. and Dold, C.: Water-Use Efficiency: Advances and Challenges in a Changing Climate, Front. Plant Sci., 10, 103, https://doi.org/10.3389/fpls.2019.00103, 2019.
Hoekstra, A. Y. (Ed.): Virtual water trade: Proceedings of the International Expert Meeting on Virtual Water Trade, 12–13 December 2002, Delft, the Netherlands, Value of Water Research Report Series No. 12, UNESCO-IHE, Delft, the Netherlands, 244 pp., ISSN 02731223, 2003.
Hoekstra, A. Y.: The water footprint of modern consumer society, Routledge, London, UK, 208 pp., ISBN 9781849713030, 2013.
Hoekstra, A. Y.: Sustainable, efficient, and equitable water use: the three pillars under wise freshwater allocation, WIREs Water, 1, 31–40, https://doi.org/10.1002/wat2.1000, 2014.
Hoekstra, A. Y., Chapagain, A. K., Aldaya, M. M., and Mekonnen, M. M.: The Water Footprint Assessment Manual: Setting the Global Standard, Earthscan, London, UK, ISBN 9781849712798, 2011.
Hurrell, J. W., Holland, M. M., Gent, P. R., Ghan, S., Kay, J. E., Kushner, P. J., Lamarque, J. F., Large, W. G., Lawrence, D., Lindsay, K., Lipscomb, W. H., Long, M. C., Mahowald, M., Marsh, D. R., Neale, R. B., Rasch, P., Vavrus, S., Vertenstein, M., Bader, D., Collins, W. D., Hack, J. J., Kiehl, J., and Marshall, S.: The Community Earth System Model: A Framework for Collaborative Research, B. Am. Meteorol. Soc., 94, 1339–1360, https://doi.org/10.1175/BAMS-D-12-00121.1, 2013.
IPCC: Summary for Policymakers, in: Climate Change 2021: The Physical Science Basis. Contribution of Working Group I to the Sixth Assessment Report of the Intergovernmental Panel on Climate Change, edited by: Masson-Delmotte, V., Zhai, P., Pirani, A., Connors, S. L., Péan, C., Berger, S., Caud, N., Chen, Y., Goldfarb, L., Gomis, M. L., Huang, M., Leitzell, K., Lonnoy, E., Matthews, J. B. R., Maycock, T. K., Waterfield, T., Yelekçi, O., Yu, R., and Zhou, B., Cambridge University Press, Cambridge, United Kingdom and New York, NY, USA, 3–32, https://doi.org/10.1017/9781009157896, 2021.
Jans, Y., von Bloh, W., Schaphoff, S., and Müller, C.: Global cotton production under climate change – Implications for yield and water consumption, Hydrol. Earth Syst. Sci., 25, 2027–2044, https://doi.org/10.5194/hess-25-2027-2021, 2021.
Kappelle, M.: WMO Statement on the State of the Global Climate in 2019, World Meteorological Organization, Geneva, Switzerland, ISBN 9789262112485, 2020.
Karandish, F., Nouri, H., and Schyns, J. F.: Agricultural adaptation to reconcile food security and water sustainability under climate change: the case of cereals in Iran, Earths Future, 10, e2021EF002095, https://doi.org/10.1029/2021EF002095, 2022.
Konapala, G., Mishra, A. K., Wada, Y., and Mann, M. E.: Climate change will affect global water availability through compounding changes in seasonal precipitation and evaporation, Nat. Commun., 11, 3044, https://doi.org/10.1038/s41467-020-16757-w, 2020.
Li, H., Mei, X., Nangia, V., Guo, R., Liu, Y., Hao, W., and Wang, J.: Effects of different nitrogen fertilizers on the yield, water- and nitrogen-use efficiencies of drip-fertigated wheat and maize in the North China Plain, Agr. Water Manage., 243, 106474, https://doi.org/10.1016/j.agwat.2020.106474, 2021.
Liu, X., Li, C., Zhao, T., and Han, L.: Future changes of global potential evapotranspiration simulated from CMIP5 to CMIP6 models, Atmos. Ocean. Sci. Lett., 13, 568–575, https://doi.org/10.1080/16742834.2020.1824983, 2020.
Lobell, D. B. and Gourdji, S. M.: The influence of climate change on global crop productivity, Plant Physiol., 160, 1686–1697, https://doi.org/10.1104/pp.112.208298, 2012.
Mali, S. S., Shirsath, P. B., and Islam, A.: A high-resolution assessment of climate change impact on water footprints of cereal production in India, Sci. Rep., 11, 8715, https://doi.org/10.1038/s41598-021-88223-6, 2021.
Meehl, G. A., Boer, G. J., Covey, C., Latif, M., and Stouffer, R. J.: Intercomparison makes for a better climate model, Eos. Trans. Amer. Geophys. Union, 78, 445–451, https://doi.org/10.1029/97EO00276, 1997.
Meehl, G. A., Boer, G. J., Covey, C., Latif, M., and Stouffer, R. J.: The Coupled Model Intercomparison Project (CMIP), B. Am. Meteorol. Soc., 81, 313–318, https://doi.org/10.1175/1520-0477(2000)081<0313:TCMIPC>2.3.CO;2, 2000.
Mekonnen, M. M. and Hoekstra, A. Y.: A global and high-resolution assessment of the green, blue and grey water footprint of wheat, Hydrol. Earth Syst. Sci., 14, 1259–1276, https://doi.org/10.5194/hess-14-1259-2010, 2010.
Mekonnen, M. M. and Hoekstra, A. Y.: The green, blue and grey water footprint of crops and derived crop products, Hydrol. Earth Syst. Sci., 15, 1577–1600, https://doi.org/10.5194/hess-15-1577-2011, 2011.
Mekonnen, M. M. and Hoekstra, A. Y.: Water footprint benchmarks for crop production: A first global assessment, Ecol. Indic., 46, 214–223, https://doi.org/10.1016/j.ecolind.2014.06.013, 2014.
Mialyk, O., Schyns, J. F., Booij, M. J., and Hogeboom, R. J.: Historical simulation of maize water footprints with a new global gridded crop model ACEA, Hydrol. Earth Syst. Sci., 26, 923–940, https://doi.org/10.5194/hess-26-923-2022, 2022.
Middleton, N. and Thomas, D. S. G.: World atlas of desertification, Arnold, London, UK, ISBN 0340691662, 1997.
Moss, R., Babiker, M., Brinkman, S., Calvo, E., Carter, T., Edmonds, J., Elgizouli, I., Emori, S., Erda, L., Hibbard, K., Jones, R., Kainuma, M., Kelleher, J., Lamarque, J. F., Manning, M., Matthews, B., Meehl, J., Meyer, L., Mitchell, J., Nakicenovic, N., O'Neill, B., Pichs, R., Riahi, K., Rose, S., Runci, P., Stouffer, R., van Vuuren, D., Weyant, J., Wilbanks, T., van Ypersele, J. P., and Zurek, M.: Towards New Scenarios for Analysis of Emissions, Climate Change, Impacts, and Response Strategies, IPCC Expert Meeting Report, 19–21 September, 2007, Noordwijkerhout, the Netherlands, Intergovernmental Panel on Climate Change (IPCC), Geneva, Switzerland, 132 pp., 2008.
Müller, C., Franke, J., Jägermeyr, J., Ruane, A. C., Elliott, J., Moyer, E., Heinke, J., Falloon, P. D., Folberth, C., Francois, L., Hank, T., César Izaurralde, R., Jacquemin, I., Liu, W., Olin, S., Pugh, T. A. M., Williams, K., and Zabel, F.: Exploring uncertainties in global crop yield projections in a large ensemble of crop models and CMIP5 and CMIP6 climate scenarios, Environ. Res. Lett., 16, 034040, https://doi.org/10.1088/1748-9326/abd8fc, 2021.
Myers, S. S., Smith, M. R., Guth, S., Golden, C. D., Vaitla, B., Mueller, N. D., Dangour, A. D., and Huybers, P.: Climate Change and Global Food Systems: Potential Impacts on Food Security and Undernutrition, Annu. Rev. Publ. Health, 38, 259–277, https://doi.org/10.1146/annurev-publhealth-031816-044356, 2017.
Navarro-Racines, C., Tarapues, J., Thornton, P., Jarvis, A., and Ramirez-Villegas, J.: High-resolution and bias-corrected CMIP5 projections for climate change impact assessments, Sci. Data, 7, 7, https://doi.org/10.1038/s41597-019-0343-8, 2020.
NBSC: National Data, China, National Bureau of Statistics, Beijing, China, https://data.stats.gov.cn/ (last access: 12 July 2022), 2021.
NOAA: National Oceanic and Atmospheric Administration, U.S., https://www.esrl.noaa.gov (last access: 10 April 2022), 2018.
O'Neill, B. C., Tebaldi, C., van Vuuren, D. P., Eyring, V., Friedlingstein, P., Hurtt, G., Knutti, R., Kriegler, E., Lamarque, J.-F., Lowe, J., Meehl, G. A., Moss, R., Riahi, K., and Sanderson, B. M.: The Scenario Model Intercomparison Project (ScenarioMIP) for CMIP6, Geosci. Model Dev., 9, 3461–3482, https://doi.org/10.5194/gmd-9-3461-2016, 2016.
Pastor, A. V., Palazzo, A., Havlik, P., Biemans, H., Wada, Y., Obersteiner, M., Kabat, P., and Ludwig, F.: The global nexus of food–trade–water sustaining environmental flows by 2050, Nat. Sustain., 2, 499–507, https://doi.org/10.1038/s41893-019-0287-1, 2019.
Portmann, F. T., Siebert, S., and Döll, P.: MIRCA2000-Global monthly irrigated and rainfed crop areas around the year 2000: A new high-resolution data set for agricultural and hydrological modelling, Global Biogeochem. Cy., 24, GB1011, https://doi.org/10.1029/2008gb003435, 2010.
Qiao, F., Song, Z., Bao, Y., Song, Y., Shu, Q., Huang, C., and Zhao, W.: Development and evaluation of an Earth System Model with surface gravity waves, J. Geophys. Res.-Oceans, 118, 4514–4524, https://doi.org/10.1002/jgrc.20327, 2013.
Raes, D., Steduto, P., Hsiao, T. C., and Fereres, E.: Reference manual, Chapter 2, AquaCrop model, Version 6.0, Food and Agriculture Organization of the United Nations, Rome, Italy, 314 pp., https://www.fao.org/aquacrop/resources/referencemanuals/en/ (last access: 20 August 2022), 2017.
Rallison, R. E.: Origin and evolution of the SCS runoff equation, in: Symposium on Watershed Management, 21–23 July 1980, Boise, Idaho, United States, 912–924, ISBN 9780872622500, 1980.
Riahi, K., Gruebler, A., and Nakicenovic, N.: Scenarios of long-term socio-economic and environmental development under climate stabilization, Technol. Forecast. Soc. Chang., 74, 887–935, https://doi.org/10.1016/j.techfore.2006.05.026, 2007.
Rosa, L., Chiarelli, D. D., Sangiorgio, M., Beltran-Peña, A. A., Rulli, M. C., D'Odorico, P., and Fung, I.: Potential for sustainable irrigation expansion in a 3 ∘C warmer climate, P. Natl. Acad. Sci. USA, 117, 29526–29534, https://doi.org/10.1073/pnas.2017796117, 2020.
Schmidt, G. A., Ruedy, R., Hansen, J. E., Aleinov, I., Bell, N., Bauer, M., Bauer, S., Cairns, B., Canuto, V., Cheng, Y., Delgenio, A. D., Faluvegi, G., Friend, A. D., Hall, T. M., Hu, Y., Kelley, M., Kiang, N. Y., Koch, D., Lacis, A. A., Lerner, J., Lo, K. K., Miller, R. L., Nazarenko, L., Oinas, V., Perlwitz, J., Perlwitz, J., Rind, D., Romanou, A., Russell, G. L., Sato, M., Shindell, D. T., Stone, P. H., Sun, S., Tausnev, N., Thresher, D., and Yao, M. S.: Present-Day Atmospheric Simulations Using GISS ModelE: Comparison to In Situ, Satellite, and Reanalysis Data, J. Climate, 19, 153–192, https://doi.org/10.1175/JCLI3612.1, 2006.
Schmidt, G. A., Kelley, M., Nazarenko, L., Ruedy, R., Russell, G. L., Aleinov, I., Bauer, M., Bauer, S. E., Bhat, M. K., Bleck, R., Canuto, V., Chen, Y. H., Cheng, Y., Clune, T. L., Genio, A. D., Fainchtein, R. D., Faluvegi, G., Hansen, J. E., Healy, R. J., Kiang, N. Y., Koch, D., Lacis, A. A., LeGrande, A. N., Lerner, J., Lo, K. K., Matthews, E. E., Menon, S., Miller, R. L., Oinas, V., Oloso, A. O., Perlwitz, J. P., Puma, M. J., Putman, W. M., Rind, D., Romanou, A., Sato, M., Shindell, D. T., Sun, S., Syed, R. A., Tausnev, N., Tsigaridis, K., Unger, N., Voulgarakis, A., Yao, M. S., and Zhang, J.: Configuration and assessment of the GISS ModelE2 contributions to the CMIP5 archive, J. Adv. Model. Earth Syst., 6, 141–184, https://doi.org/10.1002/2013MS000265, 2014.
Schyns, J. F., Hogeboom, R. J., and Krol, M. S.: 4 - Water Footprint Assessment: towards water-wise food systems, in: Food Systems Modelling, edited by: Peters, C. and Thilmany, D., Academic Press, Salt Lake City, USA, 63–88, https://doi.org/10.1016/B978-0-12-822112-9.00006-0, 2022.
Semenov, M. A. and Stratonovitch, P.: Use of multi-model ensembles from global climate models for assessment of climate change impacts, Clim. Res., 41, 1–14, https://doi.org/10.3354/cr00836, 2010.
Tian, Y., Ruth, M., Zhu, D., Ding, J., and Morris, N.: A Sustainability Assessment of Five Major Food Crops' Water Footprints in China from 1978 to 2010, Sustainability, 11, 1–20, https://doi.org/10.3390/su11216179, 2019.
Trnka, M., Feng, S., Semenov, M. A., Olesen, J. E., Kersebaum, K. C., Rötter, R. P., Semerádová, D., Klem, K., Huang, W., Ruiz-Ramos, M., Hlavinka, P., Meitner, J., Balek, J., Havlík, P., and Büntgen, U.: Mitigation efforts will not fully alleviate the increase in water scarcity occurrence probability in wheat-producing areas, Sci. Adv., 5, eaau2406, https://doi.org/10.1126/sciadv.aau2406, 2019.
USDA: Estimation of direct runoff from storm rainfall, Section 4 Hydrology, chap. 4, National Engineering Handbook, Washington DC, USA, 1–24, ISBN 109993057231, 1964.
van Vuuren, D. P., den Elzen, M. G. J., Lucas, P. L., Eickhout, B., Strengers, B. J., van Ruijven, B., Wonink, S., and van Houdt, R.: Stabilizing greenhouse gas concentrations at low levels: an assessment of reduction strategies and costs, Clim. Change, 81, 119–159, https://doi.org/10.1007/s10584-006-9172-9, 2007.
von Salzen, K., Scinocca, J. F., McFarlane, N. A., Li, J., Cole, J. N. S., Plummer, D., Verseghy, D., Reader, M. C., Ma, X., Lazare, M., and Solheim, L.: The Canadian Fourth Generation Atmospheric Global Climate Model (CanAM4). Part I: Representation of Physical Processes, Atmos.-Ocean, 51, 104–125, https://doi.org/10.1080/07055900.2012.755610, 2013.
Wang, B., Feng, P., Liu, D. L., O'Leary, G. J., Macadam, I., Waters, C., Asseng, S., Cowie, A., Jiang, T., Xiao, D., Ruan, H., He, J., and Yu, Q.: Sources of uncertainty for wheat yield projections under future climate are site-specific, Nat. Food., 1, 720–728, https://doi.org/10.1038/s43016-020-00181-w, 2020.
Wang, C., Guo, L., Li, Y., and Wang, Z.: Systematic Comparison of C3 and C4 Plants Based on Metabolic Network Analysis, BMC Syst Biol., 6, S9, https://doi.org/10.1186/1752-0509-6-S2-S9, 2012.
Wang, J., Gao, S., Xu, Y., and Wang, H.: Application and Existing Problems of Drip Irrigation for Wheat in Xinjiang, in: 2011 International Conference on Agricultural and Natural Resources Engineering (ANRE 2011), Intelligent Information Technology Application Association, 3 July 2011, Singapore, 25–29, 2011.
Wang, W., Zhuo, L., Li, M., Liu, Y., and Wu, P.: The Effect of Development in Water-Saving Irrigation Techniques on Spatial-Temporal Variations in Crop Water Footprint and Benchmarking, J. Hydrol., 577, 123916, https://doi.org/10.1016/j.jhydrol.2019.123916, 2019.
Xiao, D., Liu, D. L., Wang, B., Feng, P., Bai, H., and Tang, J.: Climate change impact on yields and water use of wheat and maize in the North China Plain under future climate change scenarios, Agr. Water Manage., 238, 106238, https://doi.org/10.1016/j.agwat.2020.106238, 2020.
Xu, Z., Chen, X., Wu, S. R., Gong, M., Du, Y., Wang, J., Li, Y., and Liu, J.: Spatial-temporal assessment of water footprint, water scarcity and crop water productivity in a major crop production region, J. Clean. Prod., 224, 375–383, https://doi.org/10.1016/j.jclepro.2019.03.108, 2019.
Yoon, P. R. and Choi, J. Y.: Efects of shift in growing season due to climate change on rice yield and crop water requirements, Paddy Water Environ., 18, 291–307, https://doi.org/10.1007/s10333-019-00782-7, 2020.
Zain, M., Si, Z., Chen, J., Mehmood, F., Rahman, S. U., Shah, A. N., Li, S., Gao, Y., and Duan, A.: Suitable nitrogen application mode and lateral spacing for drip-irrigated winter wheat in North China Plain, PLoS One, 16, e0260008, https://doi.org/10.1371/journal.pone.0260008, 2021.
Zheng, J., Wang, W., Ding, Y., Liu, G., Xing, W., Cao, X., and Chen, D.: Assessment of climate change impact on the water footprint in rice production: Historical simulation and future projections at two representative rice cropping sites of China, Sci. Total Environ., 709, 136190, https://doi.org/10.1016/j.scitotenv.2019.136190, 2020.
Zhuo, L., Mekonnen, M. M., and Hoekstra, A. Y.: Sensitivity and uncertainty in crop water footprint accounting: a case study for the Yellow River basin, Hydrol. Earth Syst. Sci., 18, 2219–2234, https://doi.org/10.5194/hess-18-2219-2014, 2014.
Zhuo, L., Mekonnen, M. M., and Hoekstra, A. Y.: Benchmark levels for the consumptive water footprint of crop production for different environmental conditions: a case study for winter wheat in China, Hydrol. Earth Syst. Sci., 20, 4547–4559, https://doi.org/10.5194/hess-20-4547-2016, 2016a.
Zhuo, L., Mekonnen, M. M., Hoekstra, A. Y., and Wada, Y.: Inter- and intra-annual variation of water footprint of crops and blue water scarcity in the Yellow River basin (1961–2009), Adv. Water Resour., 87, 29–41, https://doi.org/10.1016/j.advwatres.2015.11.002, 2016b.
Zhuo, L., Mekonnen, M. M., and Hoekstra, A. Y.: The effect of inter-annual variability of consumption, production, trade and climate on crop-related green and blue water footprints and inter-regional virtual water trade: A study for China (1978–2008), Water Res., 94, 73–85, https://doi.org/10.1016/j.watres.2016.02.037, 2016c.
Zhuo, L., Mekonnen, M. M., and Hoekstra, A. Y.: Consumptive water footprint and virtual water trade scenarios for China — With a focus on crop production, consumption and trade, Environ. Int., 94, 211–223, https://doi.org/10.1016/j.envint.2016.05.019, 2016d.
Zhuo, L., Liu, Y., Yang, H., Hoekstra, A. Y., Liu, W., Cao, X., Wang, M., and Wu, P.: Water for maize for pigs for pork: An analysis of inter-provincial trade in China, Water Res., 166, 115074, https://doi.org/10.1016/j.watres.2019.115074, 2019.