the Creative Commons Attribution 4.0 License.
the Creative Commons Attribution 4.0 License.
 | 10 Aug 2022
Assessing the influence of water sampling strategy on the performance of tracer-aided hydrological modeling in a mountainous basin on the Tibetan Plateau
Zhihua He
Zhongwang Wei
Lide Tian
Tracer-aided hydrological models integrating water isotope modules into the simulation of runoff generation are useful tools to reduce uncertainty of hydrological modeling in cold basins that are featured by complex runoff processes and multiple runoff components. However, there is little guidance on the strategy of field water sampling for isotope analysis to run tracer-aided hydrological models, which is especially important for large mountainous basins on the Tibetan Plateau (TP) where field water sampling work is highly costly. This study conducted a set of numerical experiments based on the THREW-T (Tsinghua Representative Elementary Watershed - Tracer-aided version) model to evaluate the reliance of the tracer-aided modeling performance on the availability of site measurements of water isotope in the Yarlung Tsangpo river (YTR) basin on the TP. Data conditions considered in the numerical experiments included the availability of glacier meltwater isotope measurement, quantity of site measurements of precipitation isotope, and the variable collecting strategies for stream water samples. Our results suggested that (1) in high-mountain basins where glacier meltwater samples for isotope analysis are not available, estimating glacier meltwater isotope by an offset parameter from the precipitation isotope is a feasible way to force the tracer-aided hydrological model. Using a set of glacier meltwater δ18O that were 2 ‰–9 ‰ lower than the mean precipitation δ18O resulted in only small changes in the model performance and the quantifications of contributions of runoff components (CRCs, smaller than 5 %) to streamflow in the YTR basin. (2) The strategy of field sampling for site precipitation to correct the global gridded isotope product of isoGSM (isotope-incorporated global spectral model) for model forcing should be carefully designed. Collecting precipitation samples at sites falling in the same altitude tends to be worse at representing the ground pattern of precipitation δ18O over the basin than collecting precipitation samples from sites in a range of altitudes. (3) Collecting weekly stream water samples at multiple sites in the wet and warm seasons is the optimal strategy for calibrating and evaluating a tracer-aided hydrological model in the YTR basin. It is highly recommended to increase the number of stream water sampling sites rather than spending resources on extensive sampling of stream water at a sole site for multiple years. These results provide important implications for collecting site measurements of water isotopes for running tracer-aided hydrological models to improve quantifications of CRCs in high-mountain basins.
- Article
(4691 KB) - Full-text XML
- BibTeX
- EndNote


Catchments located in mountainous regions generally provide important water resources for downstream regions (Viviroli et al., 2003). As typical mountainous cryosphere, the Tibetan Plateau (TP) is the source region for several large rivers in Asia and has been called a ”water tower” because of its importance for downstream livelihoods and agricultural irrigations (Schaner et al., 2012). Dominant characteristic of mountainous catchments on TP is the multiphase of water sources that generate runoff and the consequently complex hydrological processes, highlighting the importance of accurately quantifying the contributions of runoff components (CRCs) to streamflow for better understandings of the runoff dynamics under changing climate (Li et al., 2019). This task is difficult due to the complex hydrological processes being insufficiently represented by typical hydrological models, leading to large uncertainty of hydrological simulations (He et al., 2018). Due to the strong inter-compensation of runoff processes induced by different water sources and runoff pathways (Duethmann et al., 2015), uncertainties of the modeled CRCs in mountainous basins on the TP are rather high (e.g., Immerzeel et al., 2010; Lutz et al., 2014; Wang et al., 2021). Utilizing more datasets to evaluate the model performance is a feasible way to constrain modeling uncertainty and improve quantifications of CRCs in cold regions (Chen et al., 2017).
Tracer-aided hydrological models integrating environmental tracer (e.g., stable oxygen isotope, 18O) modules into runoff generation processes have proved helpful for parameter calibration, model structure diagnosis, and CRC quantification (Son and Sivapalan, 2007; Birkel et al., 2011; Capell et al., 2012), and are increasingly adopted in cold catchments (e.g., Ala-aho et al., 2017; He et al., 2019; Nan et al., 2021a). Recent studies indicated that estimates of precipitation δ18O from outputs of isotopic general circulation models (iGCMs) perform well on forcing tracer-aided models in large basins with a high cost of water sampling (Delavau et al., 2017; Nan et al., 2021b). Similarly to the tracer-based end-member mixing methods that utilize the different tracer signatures of water sources to separate the hydrograph and quantify CRCs (Klaus and McDonnell, 2013; He et al., 2020), the tracer-aided hydrological models used the differed isotopic compositions of runoff components to regulate the water apportionments in runoff generation. The isotopic compositions of runoff components strongly differ in high-mountain basins resulting from the following two reasons: one is the significantly more depleted δ18O of meltwater compared to that of rain due to the altitude and temperature effects, and the fractionation effect during melting processes (Xi, 2014; Boral and Sen, 2020). Another is the damping and lagging isotopic variability of subsurface runoff pathway, compared to that of surface runoff, as a result of the catchment hydrological functions of storing, mixing, and transporting water (Bowen et al., 2019; Birkel and Soulsby, 2015; McGuire and McDonnell, 2006). Consequently, water isotope signatures show potential to improve the representations of internal hydrological processes in hydrological models if observations of water isotopes were involved in the model calibration and evaluation procedures (McGuire et al., 2007; He et al., 2019).
Although plenty of isotope-based works have been conducted in mountainous catchments on the TP to improve understandings of local hydrological processes (e.g., Li et al., 2020; Kong et al., 2019; Tan et al., 2021), few of them provided guidance on data collection of water isotope for hydrological applications in large mountainous areas. Some water sampling works in large mountainous catchments were conducted in a single field campaign (e.g., Xia et al., 2019; Dong et al., 2018), which is, although helpful to understand the generations of short-term runoff events, not suitable for the calibration of tracer-aided models in a multi-year simulation period (Knapp et al., 2019; Zhang et al., 2019). An exception is Stevenson et al. (2021), who utilized a 7-year dataset of stream water δ18O in a 3.2 km2 catchment to analyze the effects of stream water sampling strategies on the calibration of a tracer-aided hydrological model. Challenges arise when transferring their findings to the application of tracer-aided hydrological models in large high-mountain basins: first, it is questionable whether sampling stream water at one site can adequately represent the isotope signature of stream water over the whole large basin, considering the strong spatial variability of hydrological processes caused by the heterogeneity in meteorological factors and land surface conditions in mountains (Wang et al., 2021; Li et al., 2020). Second, the influences of data collection of precipitation isotope on the performance of tracer-aided hydrological models remain unclear. Results of He et al. (2019) indicated that monthly sampling of precipitation at two sites seems to be able to capture the isotope variations in a 233 km2 catchment. However, the requirement of isotope data quantity to adequately capture the spatial pattern of precipitation isotope signature for forcing tracer-aided models in large basins (∼105 km2) is poorly explored (Nan et al., 2021b). Third, in glacierized mountainous catchments where streamflow was fed by additional water source of glacier melt, the requirement of glacier meltwater samples for the forcing and evaluation of tracer-aided hydrological models is also unclear. Consequently, better understandings of how water sampling strategies influence the value of water isotope data for aiding hydrological modeling are highly helpful for guiding the establishment of monitoring systems of water isotope in large mountainous regions. Considering the high costs of human and financial resources of collecting water samples in the TP area, it is important to take efficient strategies for water sampling that balance the trade-off between fieldwork burden and data adequacy well (Sprenger et al., 2019).
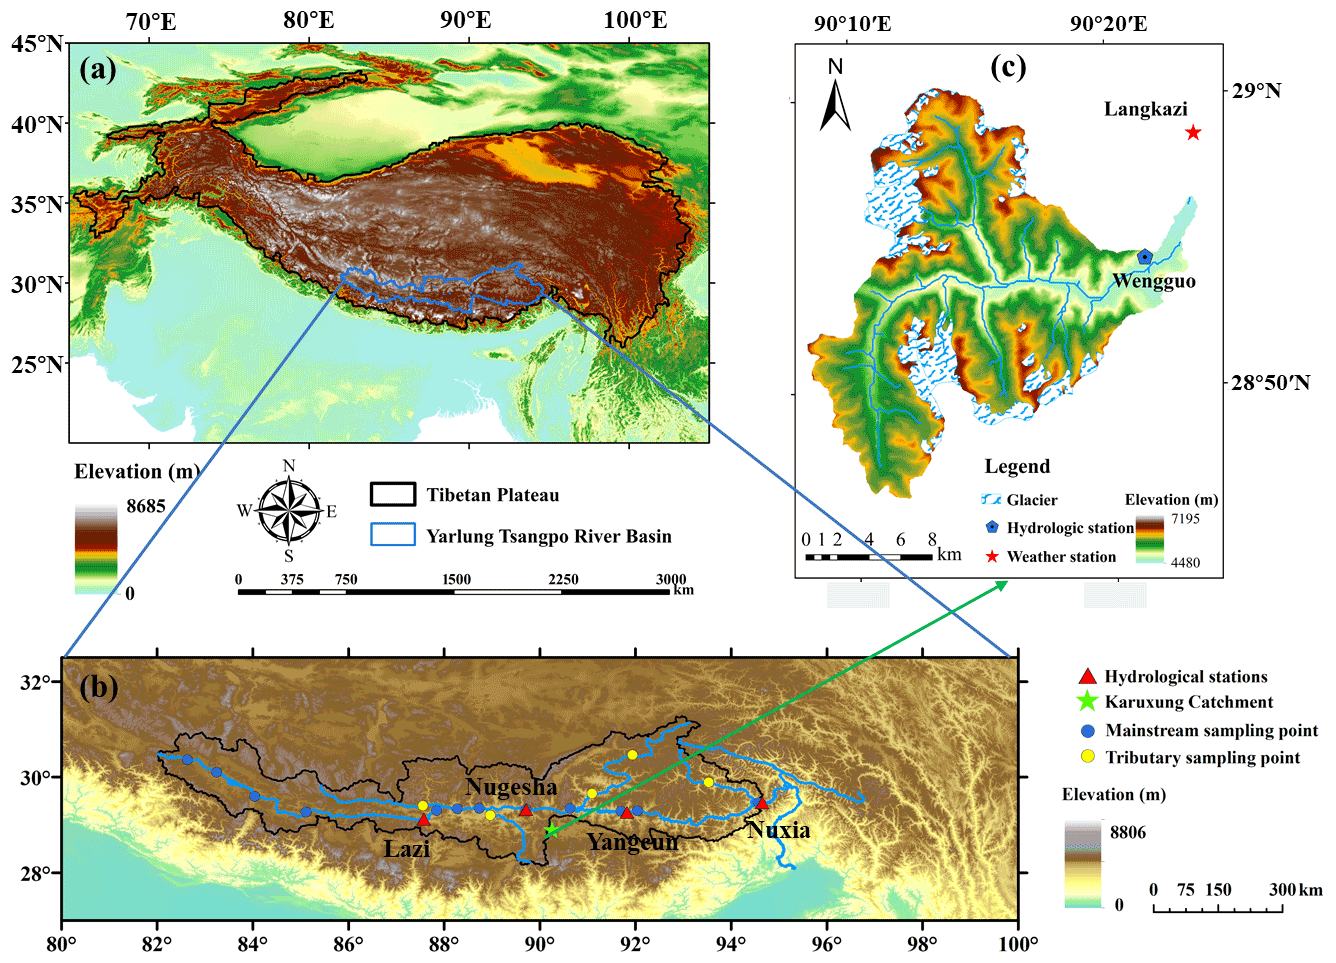
Figure 1Locations and topography of the (a) Tibetan Plateau, (b) Yarlung Tsangpo river basin, and (c) Karuxung catchment. Triangles in (b) refer to hydrometric stations and sampling sites for precipitation and stream water isotope. Dots in (b) refer to assumed stream water sampling locations in RS_YTR scenarios.
Motivated by the mentioned backgrounds, we conducted detailed analysis on the tracer-aided model performance in a large mountainous basin on the TP under different assumed situations, with respect to the collection strategy of site water isotope data, based on a numerical experiment method. We adopted the tracer-aided hydrological model THREW-T developed by Nan et al. (2021a), which was forced by the global gridded isotope outputs of iGCM being merged with measurements of precipitation δ18O, to achieve the research aim. Three specific questions were addressed: (1) how does the estimated isotopic composition of glacier meltwater influence the performance of tracer-aided hydrological modeling when no glacier meltwater samples were available? (2) How does the collection strategy of site precipitation samples for precipitation isotope data merging influence the model performance? (3) Third, how does the sampling strategy of stream water influence the model calibration and evaluation? This study focused on the sampling strategy of precipitation and stream water, while the influence of glacier/snow meltwater isotope data sampling was not within the scope of this study.
2.1 Study area
The Yarlung Tsangpo river (YTR) basin, located in the southern TP (Fig. 1), extends in the ranges of 27–32∘ N and 82–97∘ E with an elevation extent of 2900–6900 m a.s.l. (above sea level), which is one of the largest basins on the TP. The mean annual precipitation in the YTR basin is around 470 mm featured by a distinct wet season from June to September due to the dominance of the South Asian monsoon. Drainage area above the Nuxia hydrological station at the basin outlet is approximately 2×10⁵ km2, and around 2 % of which is covered by glacier.
The Karuxung River (KR) catchment is located in the upper regions of the YTR basin and was chosen as a supplementary experiment catchment because of the long-term fieldwork of water sampling in this catchment. The KR originates from the Lejin Jangsan peak of the Karola mountain (7206 m a.s.l.) and flows into the Yamdrok Lake (4550 m a.s.l.), draining an area of around 286 km2. Streamflow in the KR catchment is strongly influenced by glaciers which cover an area of 58 km2.
2.2 Hydro-meteorological and water isotope data
Elevation of the YTR basin was derived from a digital elevation model (DEM) with a spatial resolution of 30 m from the Geospatial Data Cloud (https://www.gscloud.cn, last access: 1 January 2019). Daily meteorological inputs including precipitation, temperature, and potential evapotranspiration were collected from the China Meteorological Forcing Dataset (CMFD, Yang and He, 2019). The second glacier inventory data set of China (Liu, 2012) and the Tibetan Plateau Snow Cover Extent product (TPSCE, Chen et al., 2018) were used to denote the glacier and snow coverages. Vegetation coverages were extracted from the MODIS satellite products of 8-day leaf area index (LAI) dataset MOD15A2H (Myneni et al., 2015) and monthly normalized difference vegetation index (NDVI) dataset MOD13A3 (Didan, 2015). Soil types and properties in the tested basins were collected from the Harmonized World Soil Database (HWSD, He, 2019). Observations of daily streamflow during 2000–2015 at the Nuxia and those during 2000–2010 at Yangcun and Nugesha stations were used for hydrological model evaluation.
In the KR catchment, daily temperature and precipitation during 2006–2012 were collected at the Langkazi meteorological station. Altitudinal distributions of temperature and precipitation across the KR catchment were estimated based on the lapse rates reported in Zhang et al. (2015). Daily streamflow during 2006–2012 was measured at the Wengguo hydrological station.
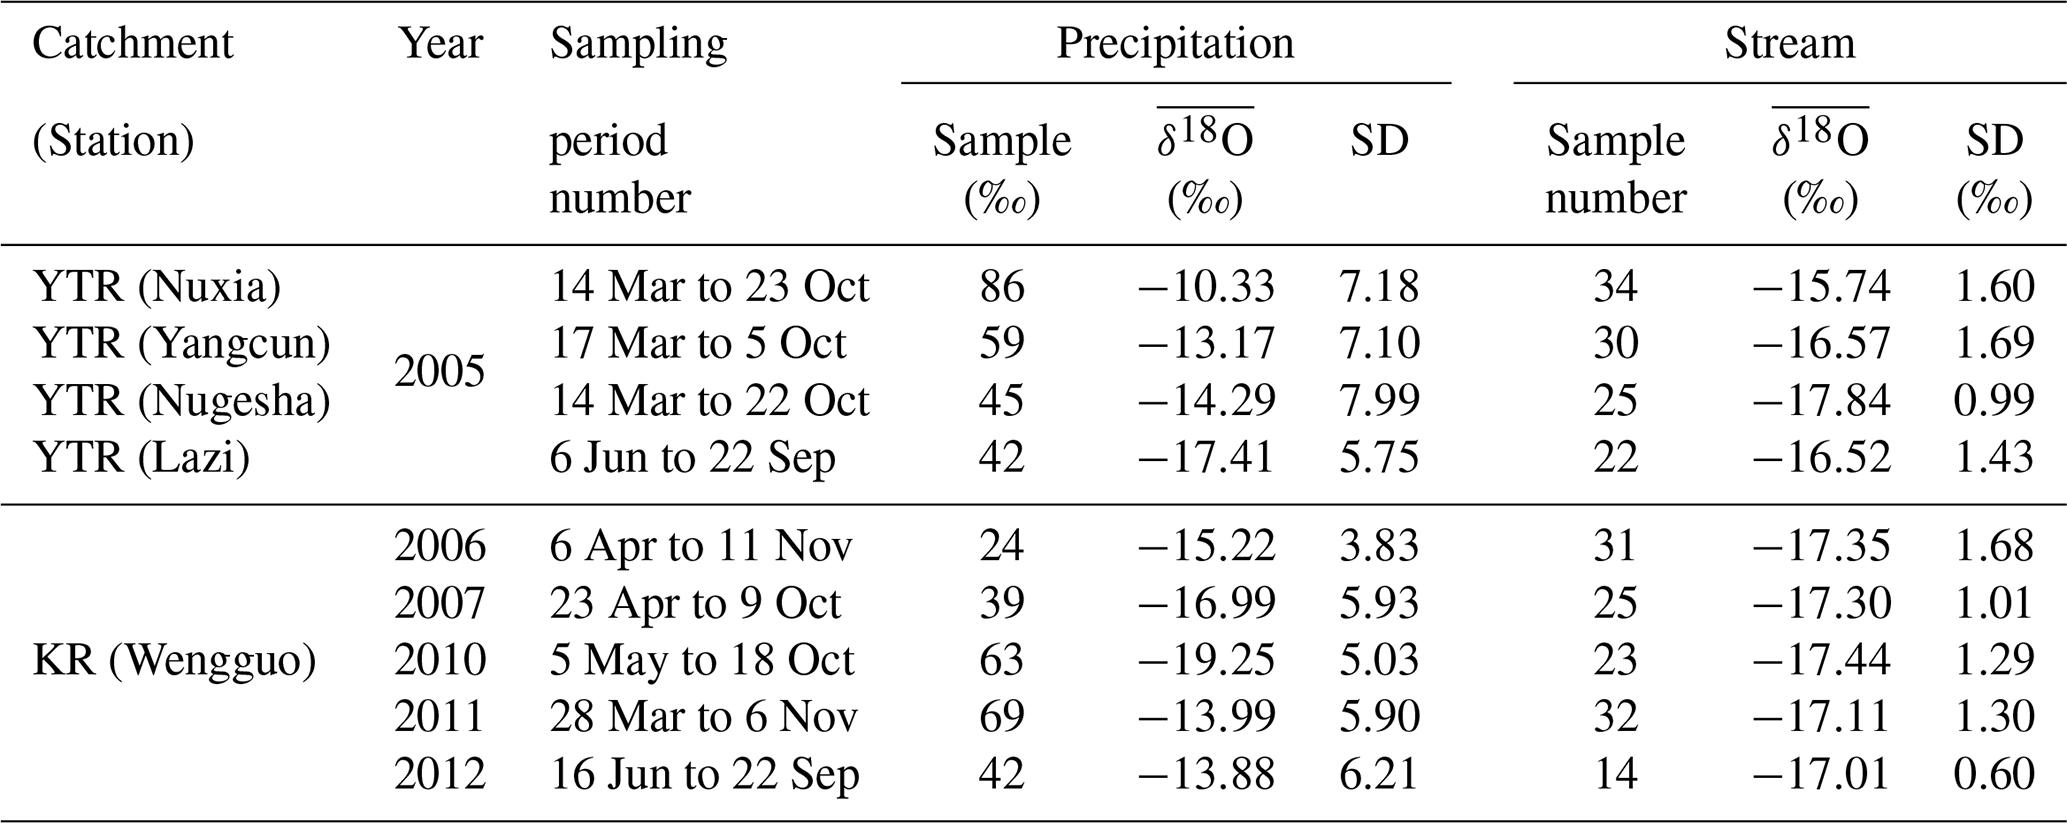
Outputs of the Scripps global spectral model with water isotopes incorporated (isoGSM, Yoshimura et al., 2008) with the spatial and temporal resolutions of and 6 h were extracted to represent the spatio-temporal pattern of the precipitation isotope in the YTR basin. According to a previous evaluation of the isoGSM product (Nan et al., 2021b), while it can effectively capture the seasonal variation of precipitation δ18O, it had two major flaws: it overestimated precipitation δ18O in the YTR basin and performed poorly on accurately capturing the isotope signature of specific precipitation events and time periods. Higher elevation stations typically had a stronger bias. To obtain measurement precipitation δ18O data, grab samples of precipitation were collected in the wet season of 2005 at four stations along the main channel of YTR, i.e., Nuxia (3691 m a.s.l.), Yangcun (4541 m a.s.l.), Nugesha (4715 m a.s.l.), and Lazi (4889 m a.s.l.). The precipitation water samples were collected as soon as possible after the precipitation event in order to avoid the effect of evaporation. Stream water samples were collected weekly during the same period from rivers at the four stations.
The isoGSM isotope products were merged with measurement precipitation isotope data according to Eqs. (1)–(3) to provide input data for model: first, the bias of isoGSM product was assumed to be linearly related to altitude. Relation between the mean bias of isoGSM products and altitude was estimated by a least square method using δ18O measurements of precipitation samples and gridded isoGSM estimates at the four sampling sites (Eqs. 1 and 2). Second, in each hydrological unit, precipitation δ18O was determined by Eq. (3), based on the average altitude and the availability of δ18O measurements from precipitation site samples on the date.
where Bi is the bias of isoGSM at sites i. and are the weighted average of the site measurement and isoGSM estimate over the sampling period at sites i, respectively. H is the altitude of the sampling site. Parameters a and b are the linear regression coefficients, which were estimated as −0.0046 and 14.96 by the least square method in this study. is the precipitation isotope obtained by merging isoGSM and measurement data, and refers to the original isoGSM isotope estimate at the hydrological model unit k on the date j.
Glacier meltwater δ18O was assumed to be constantly lower than the weighted average of precipitation δ18O by an offset parameter (Δδ) during the study period (Eq. 4) because of the unavailability of glacier meltwater samples, which is generally within the range of 2 ‰–9 ‰ in the worldwide mountain regions (Rai et al., 2019; Wang et al., 2016; He et al., 2019; Ohlanders et al., 2013; Jeelani et al., 2017) and is adopted as 5 ‰ from Boral and Sen (2020) in the YTR basin.
In the KR catchment, grab samples of precipitation and stream water were collected at the Wengguo station in 2006–2007 and 2010–2012 for isotope analysis. The spatial distribution of precipitation δ18O was estimated based on an altitudinal lapse of −0.34 ‰ as reported in Liu et al. (2007). Glacier meltwater δ18O was assumed to be constantly as −18.9 ‰ during the study period (as reported by Gao et al., 2009). Details of precipitation and stream water samples in the YTR and KR catchments are summarized in Table 1.
Table 1Summary of precipitation and stream water samples in the YTR and KR catchments.
2.3 Tracer-aided hydrological model
A distributed tracer-aided hydrological model, THREW-T (Tsinghua Representative Elementary Watershed – Tracer-aided version), developed by Tian et al. (2006) and Nan et al. (2021a), was adopted for streamflow and isotope simulations. This model uses the representative elementary watershed (REW) method for spatial discretization of catchments (Reggiani et al., 1999). The study catchment is first divided into REWs based on DEM, and each REW is further divided into two vertical layers (surface and subsurface layers), including eight hydrological subzones based on the land cover and soil properties. In total, 63 and 41 REWs were extracted for the YTR basin and KR catchment, respectively (Tian et al., 2020; Nan et al., 2021a, b). Areal averages of the gridded estimates of meteorological variables, vegetation cover, and soil property were calculated in each REW to drive the model. A module representing glacier melting and snowpack evolution was incorporated into the model for application in cold regions (He et al., 2015; Xu et al., 2019; Tian et al., 2020). Accumulation and melting processes of snowpack were simulated according to temperature and precipitation to update the snow water equivalent (SWE) of each REW. The snow cover area (SCA) was then calculated using the snow cover depletion curve (Fassnacht et al., 2016) and SWE threshold value (Parajka and Blöschl, 2008) for YTR basin and KR catchment, respectively, due to the different catchment scales. For simplification, the evolution of glacier was not simulated in the model. The temperature–index approach was used to calculate the amount of glacier melting, and it was assumed that the glacier melting water would directly contribute to streamflow through surface runoff pathway.
The tracer-aided module was developed by Nan et al. (2021a). The isotope was assumed to mix completely in each hydrological simulation unit within a simulation step. The Rayleigh fractionation method was adopted to simulate the isotope fractionation during water evaporation (similar to He et al., 2019, Hindshaw et al., 2011, Wolfe et al., 2007). No parameters related to isotope modeling were introduced, since the isotope concentration was updated based on the water content of each unit and fluxes among them, which have been calculated in the runoff generation and flow concentration modules of the model. Forced by the inputs of precipitation and glacier meltwater isotopic compositions, the model simulates the isotope evolution in all the water storages in the watershed, including stream water, soil water, and snowpack. The glacier evolution processes were not simulated in the hydrological model; therefore, an assumed constant value was adopted to determine the isotope mass carried by glacier meltwater instead of updating the isotope composition of glacier, like other water storages. The iGCM isotope products properly corrected by δ18O measurements of precipitation samples have proved feasible to force the THREW-T model in large catchments like YTR on the TP (Nan et al., 2021b). More details of hydrological model together with the snowpack evolution and tracer-aided module are given in Tian et al. (2006) and Nan et al. (2021a)
The THREW-T model quantified the contributions of runoff components (CRCs) to streamflow based on two definitions of runoff components as reviewed in He et al. (2021). The first definition is based on the individual water sources in the total water input triggering runoff processes, including rainfall, snowmelt, and glacier melt. The second definition is based on pathways of runoff-generation processes, resulting in surface and subsurface runoff (baseflow).
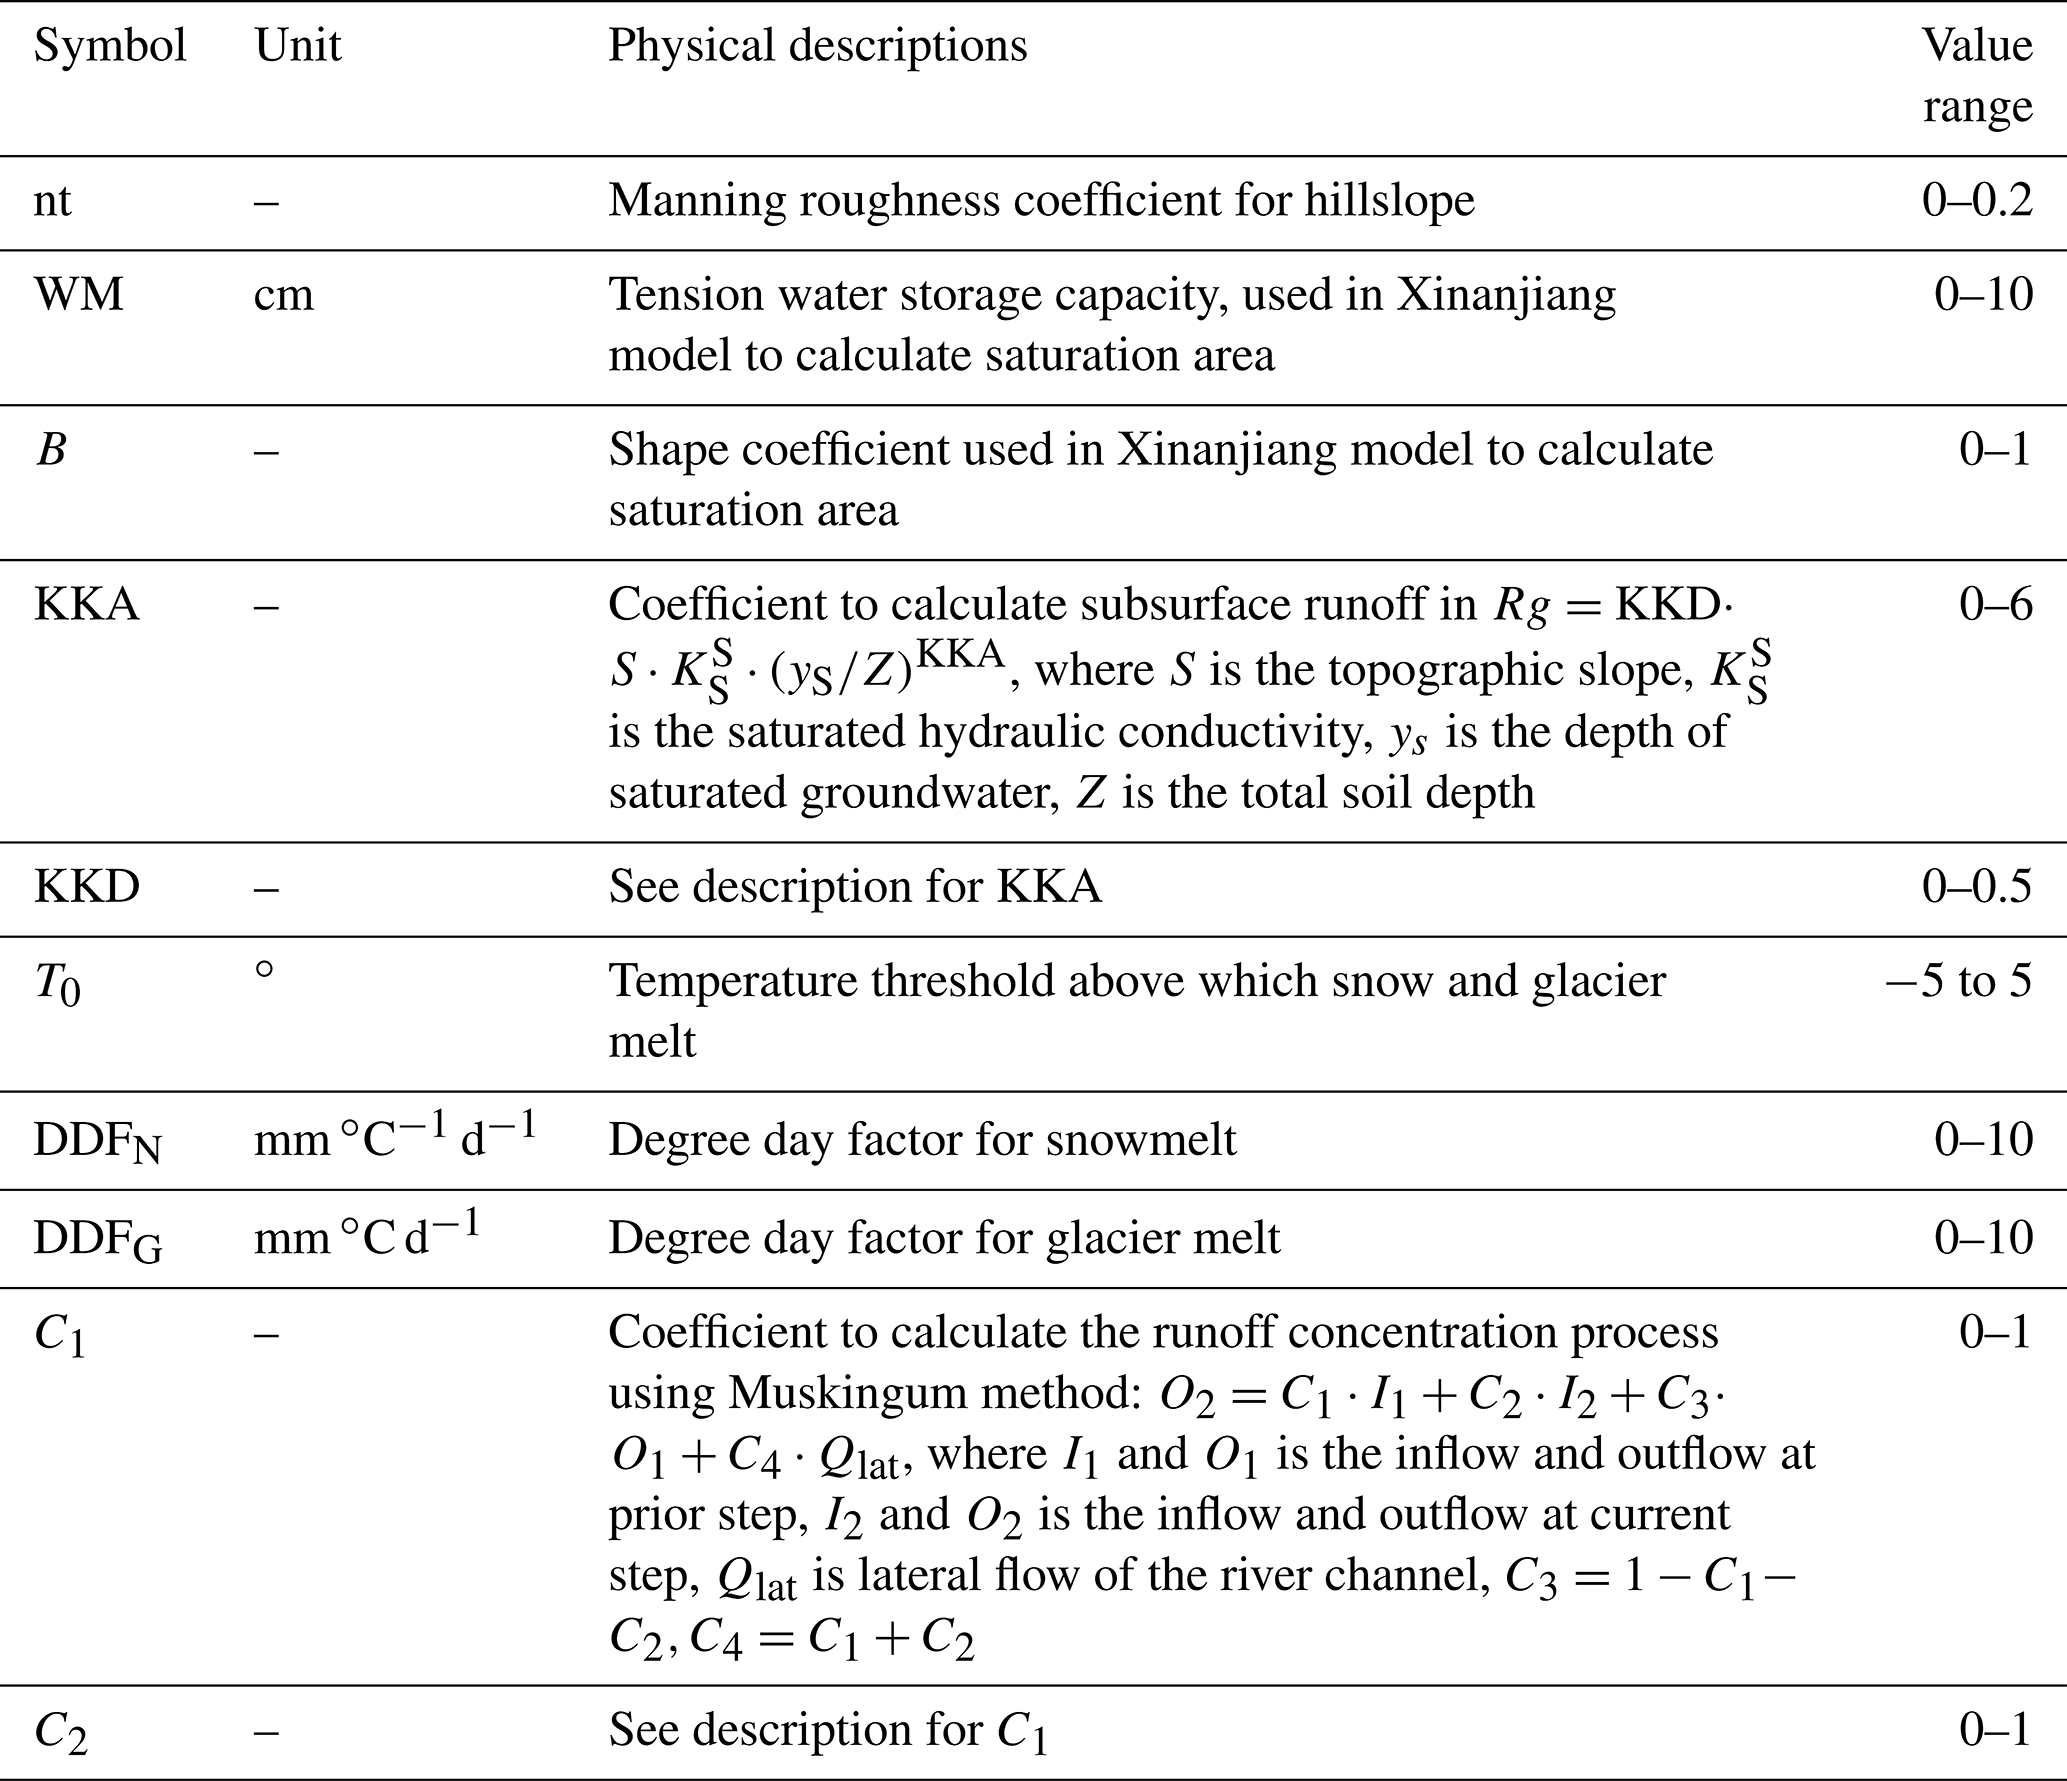
Physical basis and value ranges of the calibrated parameters in the THREW-T model are described in Table 2. The value of parameter was assumed to be universal for all the REWs. Two kinds of calibration approaches were conducted: (1) a bi-objective calibration using discharge and SCA, and (2) a tri-objective calibration using discharge, SCA, and stream water δ18O. Metrics used to evaluate the model performance are listed in Eqs. (5)–(8). The Nash–Sutcliffe efficiency coefficient (NSE) was used to optimize the simulation of discharge and isotope, whereas the root mean square error (RMSE) was used for the evaluation of SCA simulation. The logarithmic Nash–Sutcliffe efficiency coefficient (lnNSE) was used additionally for discharge calibration to assess the simulation of baseflow. The model parameters were calibrated by streamflow and SCA observations during 2001–2010 (at Nuxia station) and 2006–2012 in the YTR and KR basins, respectively. The model performance in YTR basin was validated by the Nuxia streamflow and SCA observations during 2011–2015, and the streamflow observations at Yangcun and Nugesha stations during 2001–2010.
where n is the total number of observations. Subscripts of “o” and “s” refer to observed and simulated variables, respectively.
An automatic algorithm Python Surrogate Optimization Toolbox (pySOT) developed by Eriksson et al. (2017) was adopted for the multiple-objective optimization. The pySOT algorithm used a surrogate model to guide the search for improved solutions, with the advantage of needing few function evaluations to find a good solution. In each pySOT running, the optimization procedure was stopped if a maximum number of allowed function evaluations was reached, which was set as 3000 in this study. For the bi- and tri-objective calibrations, 0.5 ⋅ (NSEdis + NSElndis) − RMSESCA and 0.5 ⋅ (NSEdis + NSElndis) − RMSESCA + NSEiso were chosen as the combined optimization objectives. For each scenario, the pySOT algorithm was repeated 100 times, and behavioral parameter sets were selected among the 100 final results according to the performance metric thresholds; i.e., only the parameter sets producing metrics better than certain threshold values were regarded as behavioral parameter sets. The model uncertainty was evaluated based on the model performance driven by the behavioral parameter sets. The threshold values of evaluation metrics were used as 0.5 ⋅ (NSEdis + NSElndis) > 0.8, RMSESCA<0.08 in the YTR basin, and NSEdis>0.7, RMSESCA<0.15 in the KR catchment. Different values were adopted for the NSEiso threshold among different scenarios, which will be introduced in the Results section.
2.4 Numerical experiments
The influences of isotope data conditions on model performance were evaluated in three aspects as listed in Table 3: the assumed glacier meltwater isotope composition, the site measurement of precipitation isotope for data merging, and the stream water sampling strategy for model calibration.
Table 3Descriptions of water sampling scenarios in the three numerical experiments. δ18OGM is the assumed glacier meltwater isotope signature and refers to the long-term mean isotope signature of precipitation.
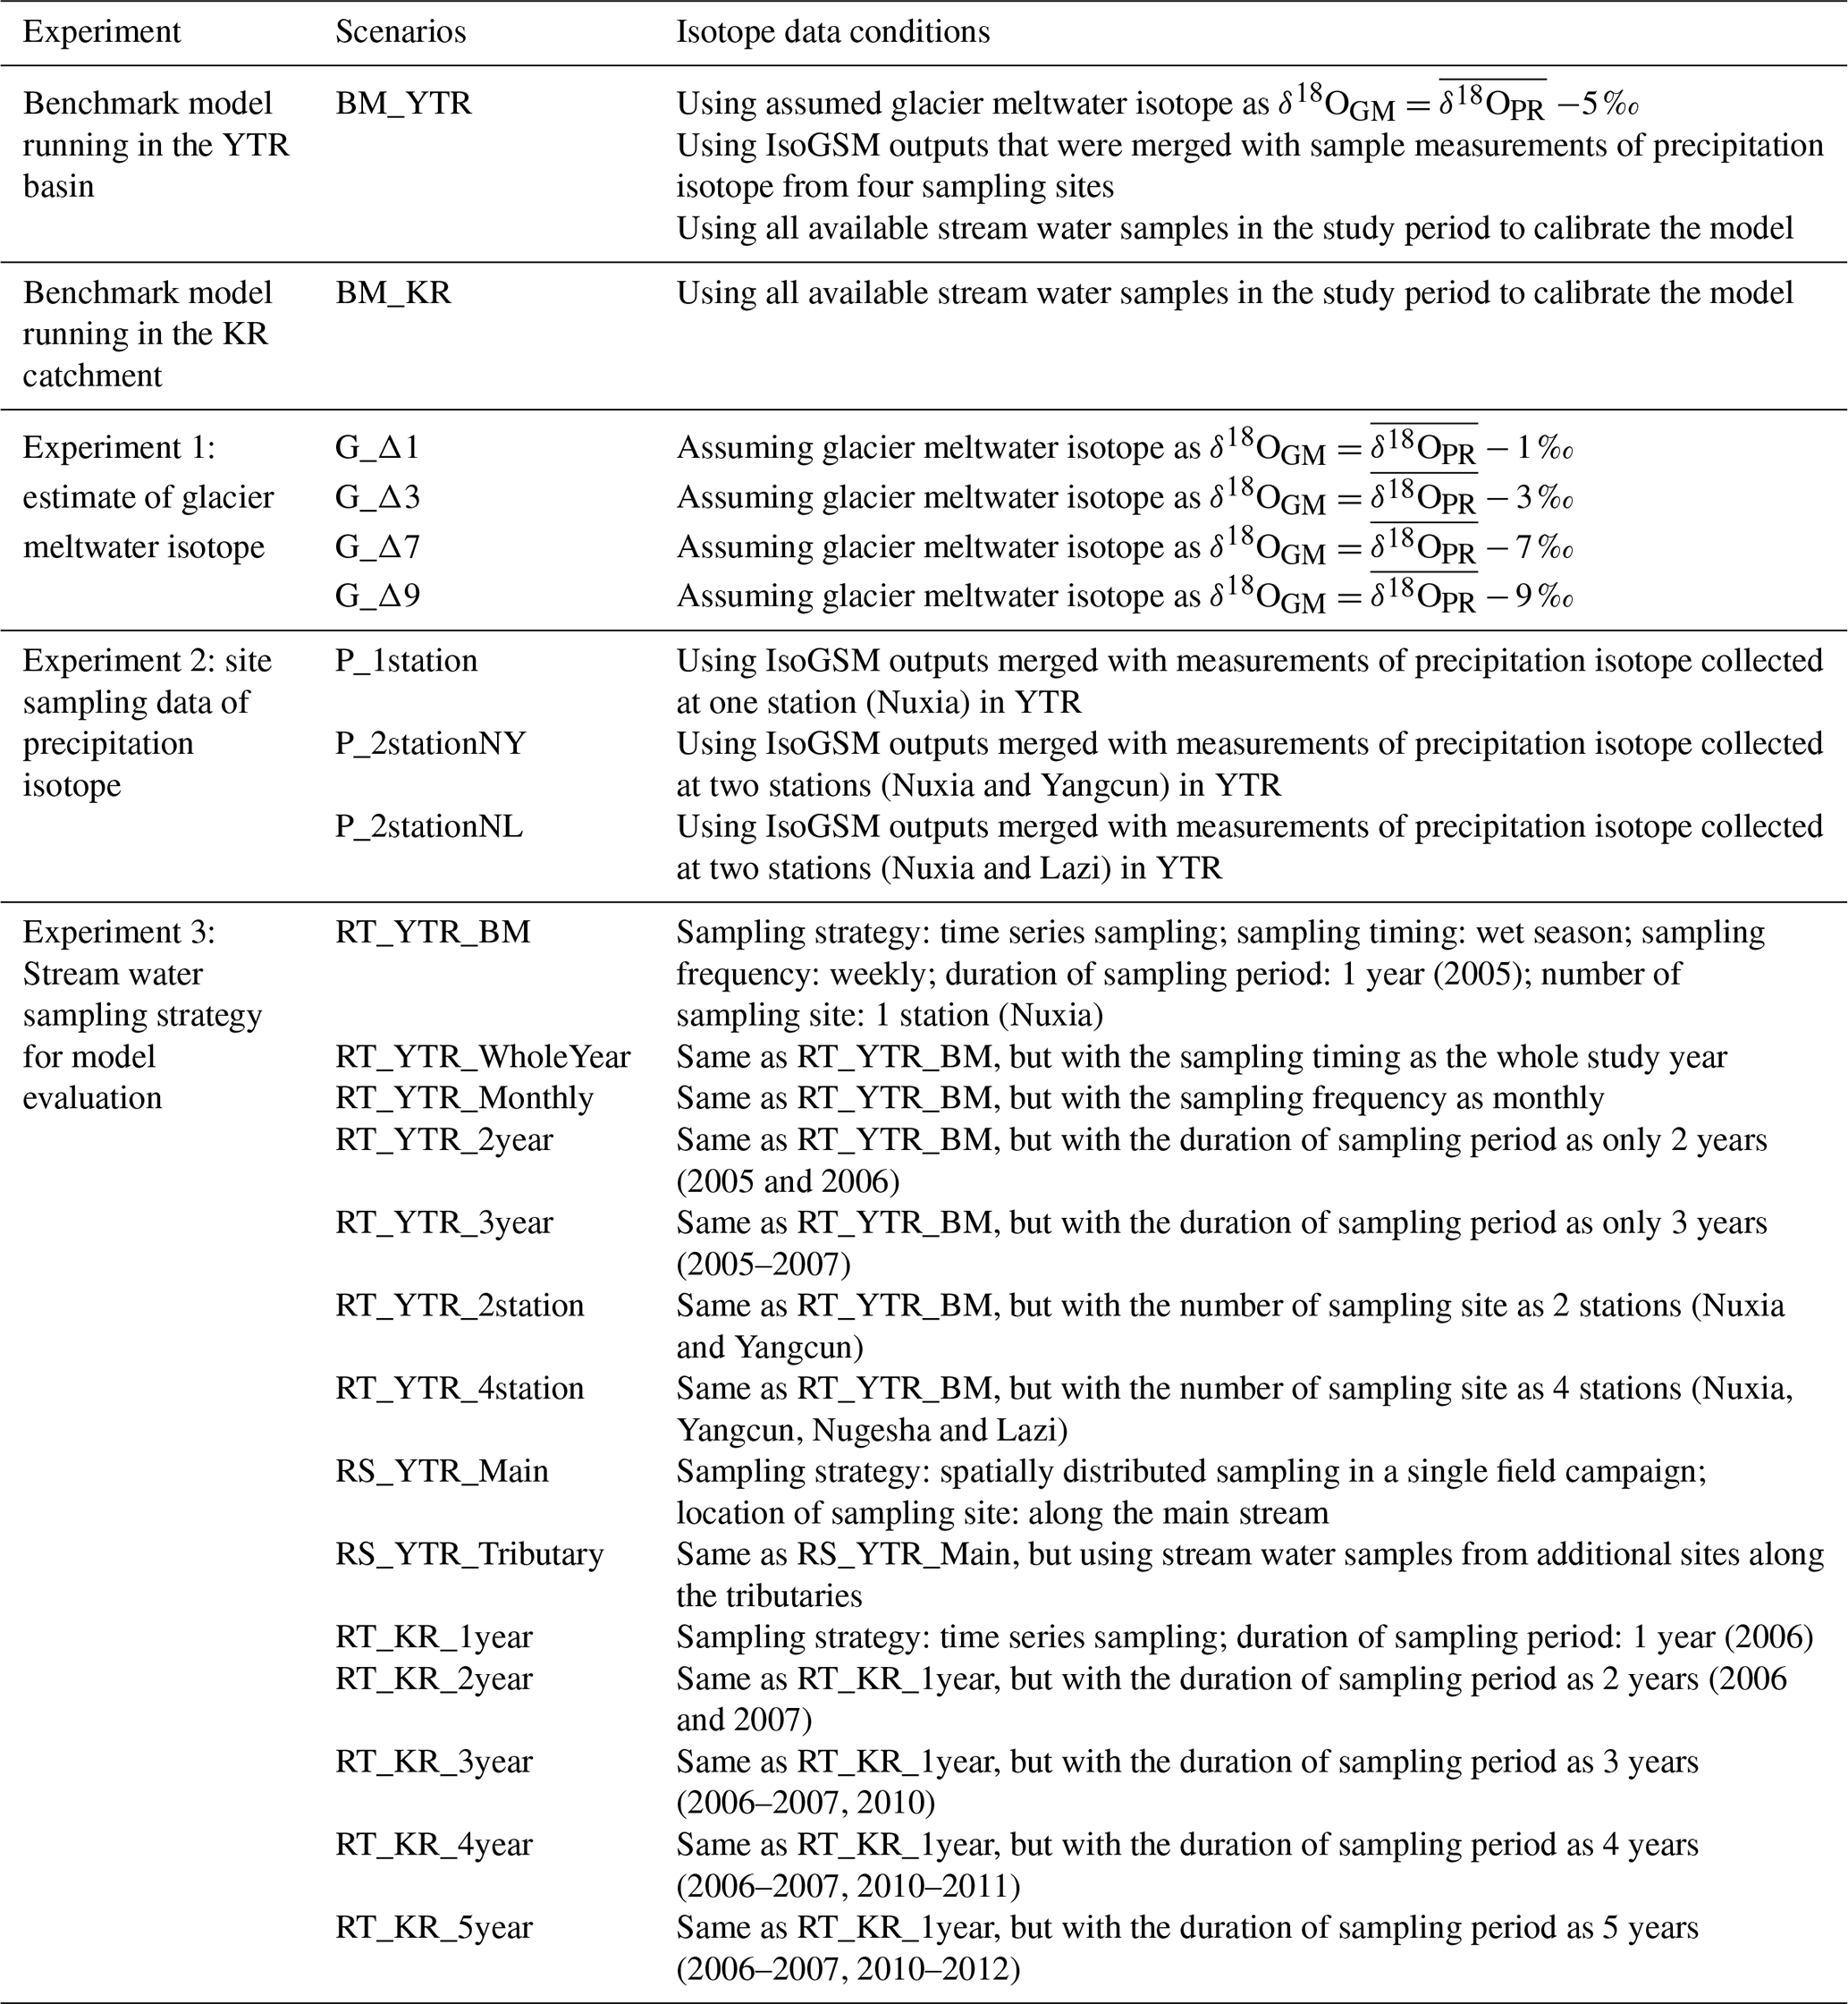
2.4.1 Experiment 1: influence of assumed glacier meltwater isotope
The first experiment was designed to test the reliance of model performance on the assumed glacier meltwater isotope, as glacier melt water samples are typically not available for isotope analysis in high mountain basins on the TP. In this experiment, variable glacier melt isotope signatures were adopted to calculate the isotopic contribution from glacier meltwater to streamflow, assuming the glacier meltwater δ18O is 1 ‰, 3 ‰, 7 ‰, and 9 ‰ (i.e., Δδ values in Table 3) lower than the long-term average δ18O of precipitation. A benchmark model running by the literature-based Δδ value of 5 ‰ was used as a baseline reference to assess the influence of the assumed glacier meltwater isotope on the model performance.
2.4.2 Experiment 2: influence of site measurement of precipitation isotope
The second experiment was designed to test the reliance of the model performance on the availability of measured site precipitation isotope that was merged with the isoGSM product. The benchmark model running was forced by the merging precipitation isotope data based on measurements of precipitation isotope from all the four sampling sites (Fig. 1). Three scenarios regarding the availability of measured precipitation isotope were designed as shown in Table 3. First, we assumed that only precipitation isotope measured at the two downstream sites of Nuxia and Yangcun are available for data merging (i.e., scenario P_2stationNY in Table 3). Second, we assumed that precipitation isotope measurement at the most upstream site Lazi is available in addition to the measurement at the downstream site Nuxia (i.e., scenario P_2stationNL in Table 3). Third, we assumed that only precipitation isotope measurement at the most downstream site Nuxia is available for the data merging (i.e., scenario P_1station in Table 3).
2.4.3 Experiment 3: influence of stream water sampling strategy
The third experiment was conducted to analyze the influence of stream water sampling strategy on the model performance. Two types of stream water sampling strategies were considered, i.e., a time series sampling strategy based on regular and continuous sampling work at a certain point, and a spatially distributed sampling strategy based on one-time field campaigns of sampling work. For the time series sampling strategy, seven scenarios (“RT_YTR_” scenarios in Table 3) were designed to analyze the influences of the sampling frequency, the duration of the sampling period, and the number of sampling sites. For the spatially distributed sampling strategy, two scenarios (Fig. 1b) were designed to represent typical field campaign activities: collecting samples along the mainstream of the basin (RS_YTR_Main, Table 3), and collecting water samples additionally from major tributaries (RS_YTR_Tributary, Table 3). Considering the limited availability of stream water δ18O measurement in the YTR basin (only wet season in 1 year, Table 1), a supplementary experiment was designed to test the influence of sampling period duration on the model performance using the relatively long time-series isotope dataset in the small catchment KR (“RT_KR_” scenarios in Table 3).
To evaluate the influence of isotope data availability on the model performance, we carried out benchmark model simulations forced by full datasets of input isotope and stream water isotope data in the YTR and KR catchments (Table 3). The benchmark model runs were calibrated by a bi-objective calibration using SCA and streamflow observations, and a tri-objective calibration using additional stream water isotope, respectively. It is noted that in the scenarios of Experiment 3 in YTR basin (i.e., “RT_YTR_” and “RS_YTR_” scenarios in Table 3), the assumed data availability was beyond the actual measurement dataset. Consequently, the assumed stream water δ18O measurement data were obtained from a model simulation driven by a benchmark parameter set (rather than a subset of actual measurement stream water δ18O), which was selected from the behavioral parameters of the BM_YTR scenario calibrated by the tri-objective approach. The influence of the availability of stream water δ18O measurement on the tracer-aided model was evaluated by comparing the estimated CRCs and corresponding uncertainties with the assumed true values that were derived from the tri-objective calibrated benchmark running. Mean absolute error (MAE) and standard deviation (SD) were used to quantify the accuracy and uncertainty of CRC, which was calculated in Eqs. (9) and (10).
where n is the number of behavioral parameter sets, and superscript k indicates the runoff component (one of rainfall, snowmelt, glacier melt, and baseflow). Subscript s and o indicate the simulated and observed value (observed value is the CRC produced by the tri-objective calibrated benchmark running). CRC is the contribution of runoff component k simulated by the parameter set i. is the average CRC simulated by all the behavioral parameter sets.
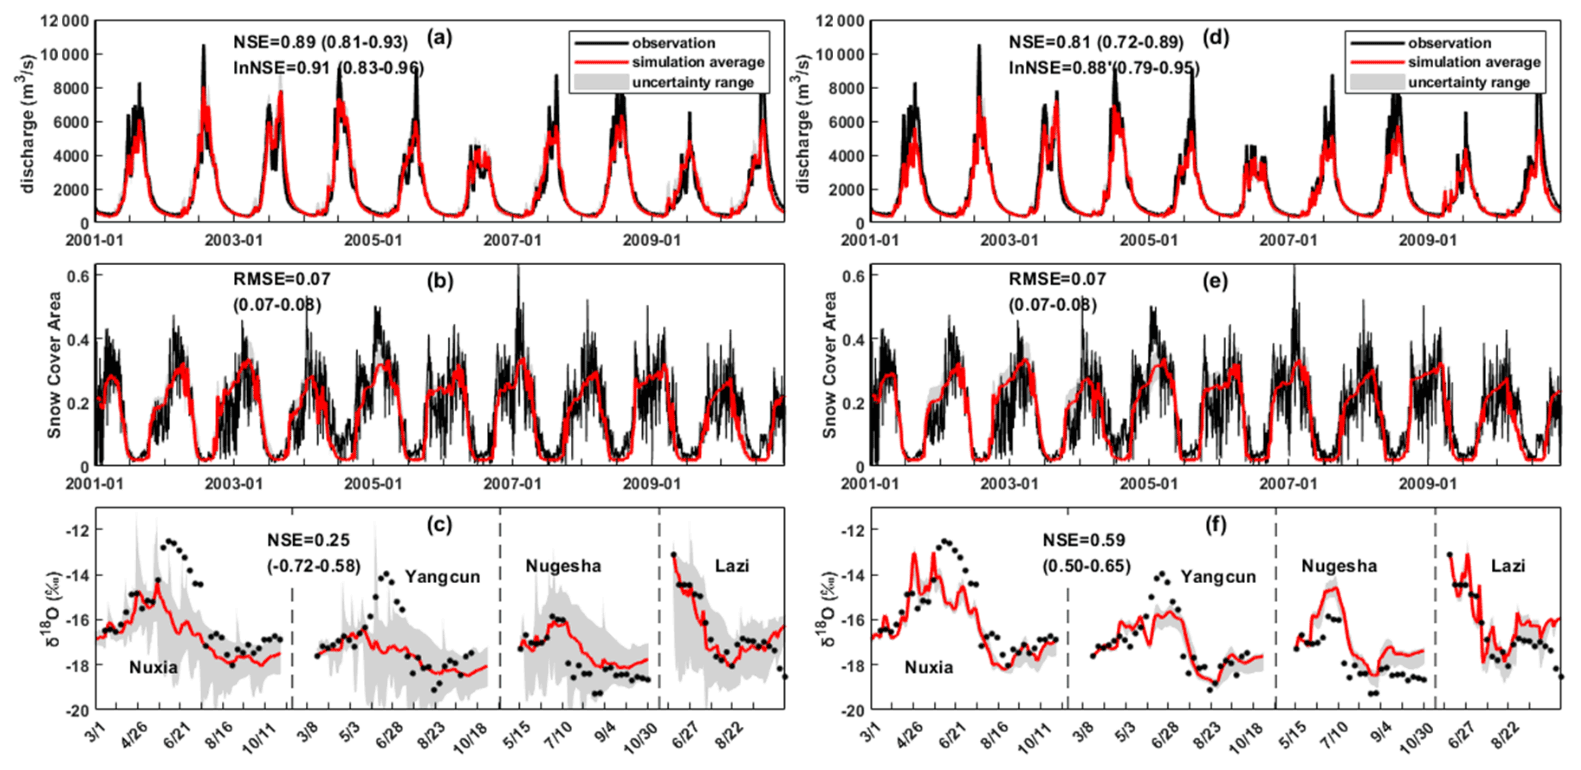
Figure 2Uncertainty ranges and metrics values of the simulated discharge (Nuxia station), SCA, and stream δ18O (at four stations during 2005) in the YTR basin, that were produced by the behavioral parameter sets of a bi-objective calibration (a–c) and a tri-objective (d–f) calibration in the benchmark model running.
In the scenarios of Experiments 1 and 2, the model was calibrated towards the complete stream water δ18O measurement dataset (Table 1), and the influence of isotope data availability on model performance was quantified by changes in model performance in the validation period and internally validated hydrological stations, and the uncertainty of CRC estimated by Eq. (10). In the scenarios of Experiment 3 in the KR catchment (i.e., “RT_KR_” scenarios in Table 3), subsets of stream water δ18O measurement dataset (Table 1) with different length were picked out for model calibration.
3.1 Performance of the tracer-aided hydrological model
Figure 2 shows performance of the benchmark model running (i.e., BM_YTR scenario in Table 3) forced and calibrated by the full available isotope dataset. The NSEiso threshold by which behavioral parameter sets were selected in tri-objective calibration was set as 0.5. Seasonal variations in discharge and SCA were reproduced well by the bi-objective calibration (Fig. 2a and b), indicated by the high values of NSEdis (>0.8) and lnNSEdis (>0.8), and a low RMSESCA (<0.08). The peak flows were less well reproduced by the model in comparison to the simulation of baseflow processes, partly due to the inaccurate precipitation input data at the high altitudes. The model showed extremely poor performance for the simulation of stream water isotope when looking at the large uncertainty range (Fig. 2c) and low NSEiso (−0.72). The tri-objective calibration significantly improved the isotope simulation (Fig. 2f) without bringing much sacrifice to the performance in simulating discharge and SCA (considering the minimum values of NSEdis and lnNSEdis are around 0.7 in Fig. 2d and e). Moreover, the tri-objective calibration slightly reduced uncertainty for simulation of the rising hydrograph in 2009 spring (Fig. 2d). The seasonal variations in stream water δ18O were captured well at all the four stations by simulations from the tri-objective calibration. The mean contributions of rainfall and snowmelt to annual streamflow estimated by the bi-objective calibration were 62.8 % and 10.8 %, which were around 1 %–7 % smaller than those estimated by the tri-objective calibration (Table 4). In contrast, the contribution of glacier melt estimated by the tri-objective calibration (17.1 %) was lower than that estimated by the bi-objective calibration (26.4 %). Surface runoff which was mainly fed by glacier melt in the YTR showed a larger proportion in the total streamflow simulated by a bi-objective calibration (52.1 %) than that in the simulation of a tri-objective calibration (44.7 %), while baseflow contribution quantified by the bi-objective calibration is smaller. Standard deviation values of the quantified CRCs indicated that the tri-objective calibration estimated smaller uncertainties for the quantifications of runoff components.
Table 4Contributions (%) of runoff components in the YTR basin and KR catchment estimated by different calibration variants in the benchmark scenario.
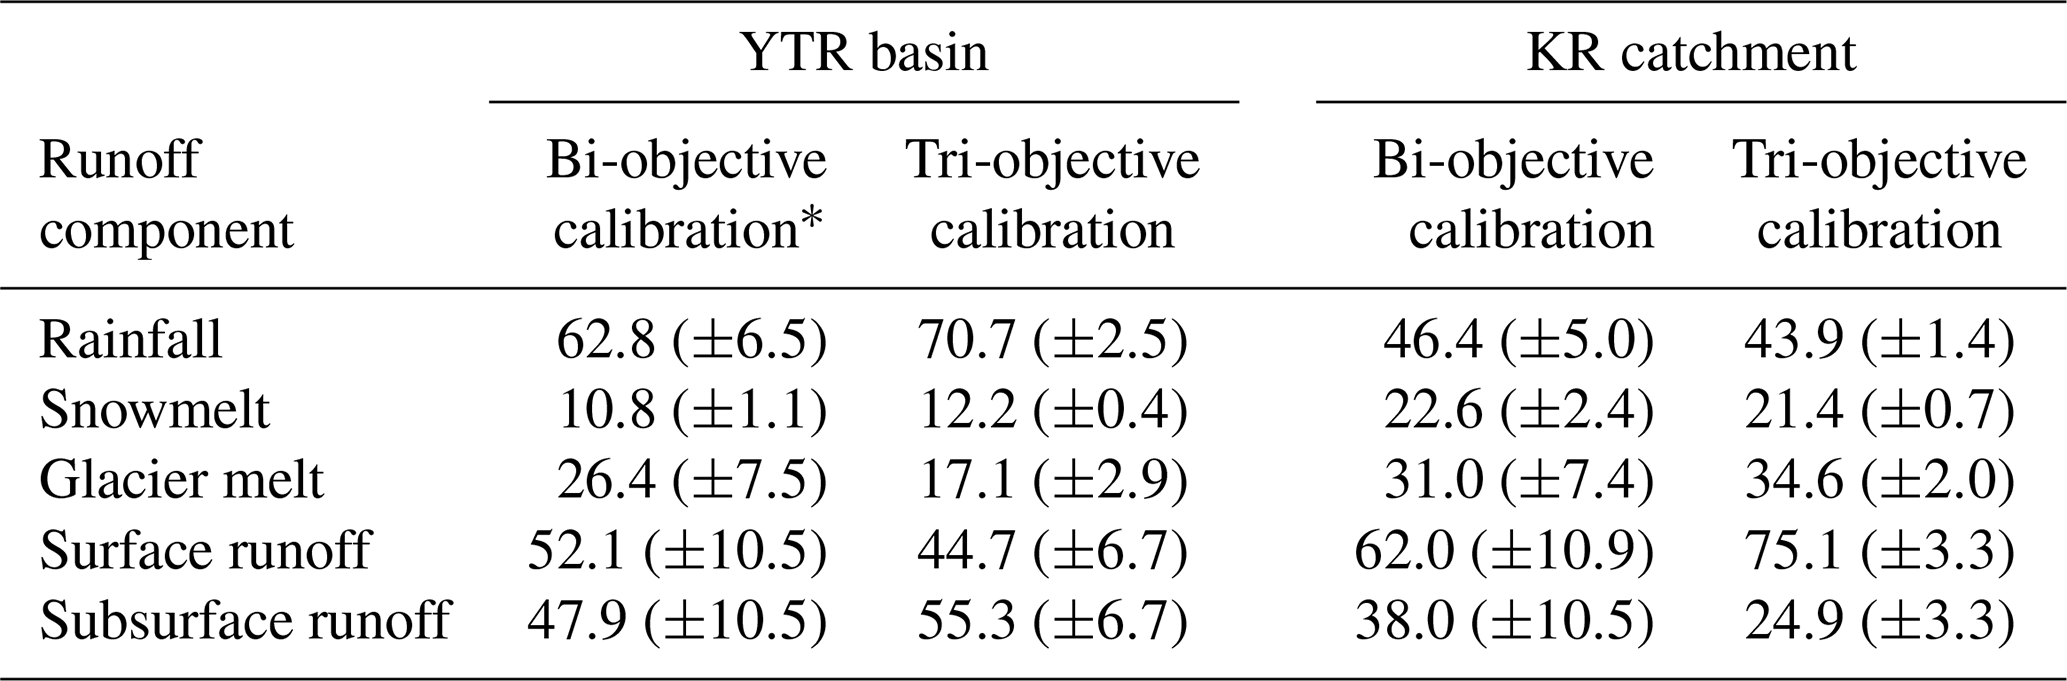
* Values in brackets refer to the standard deviation of the contribution of runoff component produced by the behavioral parameter sets.
The uncertainties of behavioral parameter set obtained by bi- and tri-objective calibration are shown in Fig. 3. Apart from the hillslope roughness coefficient (nt), the uncertainties of all the parameters were reduced by tri-objective calibration, especially the parameters related to melting (DDFN and To) and flow concentration processes (C1 and C2). The higher melting temperature threshold (T0) obtained by tri-objective calibration was consistent with the lower contribution of melting water. The lower water storage capacity (WM) and higher shape coefficient (B) of tri-objective calibration should result in higher saturation area and, consequently, higher contribution of surface runoff. This was, however, not in agreement with the estimated CRC, indicating the important contribution of glacier melt in surface runoff. A benchmark parameter set that performed well on multiple objectives was selected among the behavioral parameters of BM_YTR calibrated by the tri-objective method (as shown in Table 5), to produce stream water δ18O for model calibration in Experiment 3 in the YTR basin. It is noted that this benchmark parameter set was only used to produce stream water δ18O data for model calibration in Experiment 3 in the YTR basin, not an optimal parameter set representing the true hydrological processes.
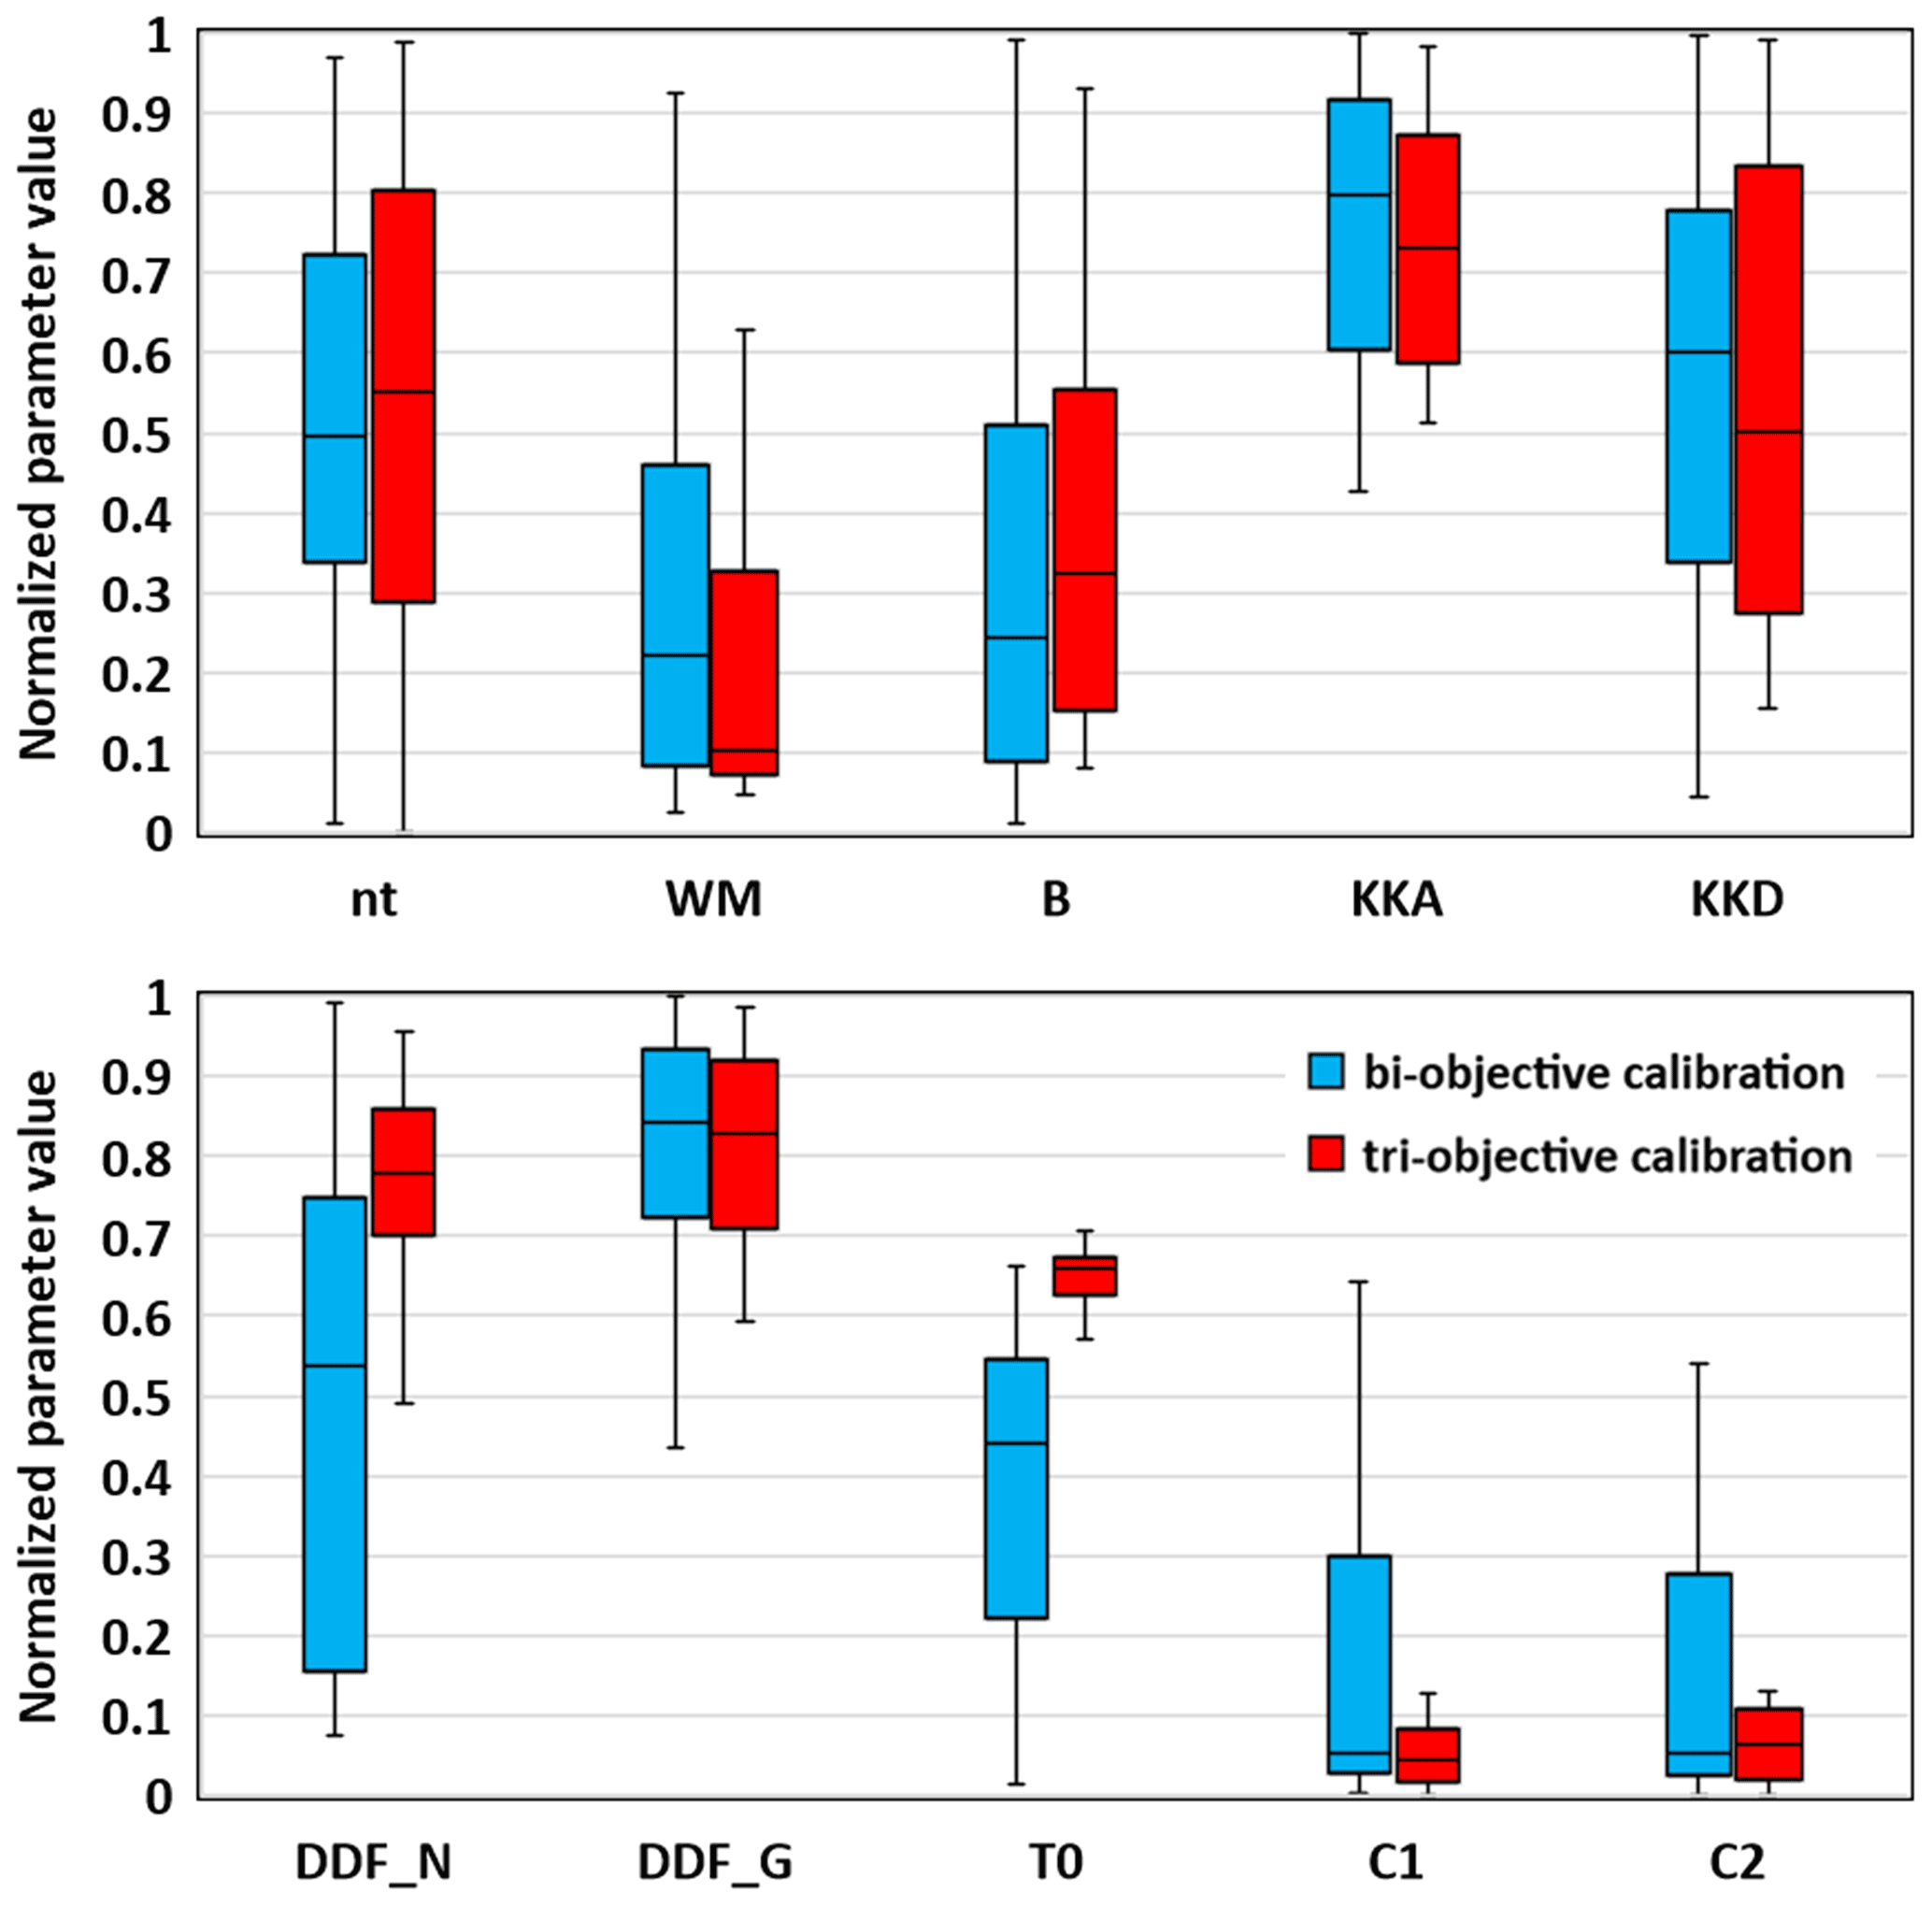
Figure 3Uncertainties of the behavioral parameter set obtained by bi- and tri-objective calibration methods for BM_YTR scenario in the YTR basin.

Figure 4Uncertainty ranges and metrics values of the simulated discharge, SCA, and stream δ18O in the KR catchment produced by the behavioral parameter sets of a bi-objective calibration (a–c) and a tri-objective (d–f) calibration in the benchmark model running.
Table 5Benchmark parameter set and corresponding model behavior that are used to produce stream water δ18O data for model calibration in Experiment 3 in the YTR basin.
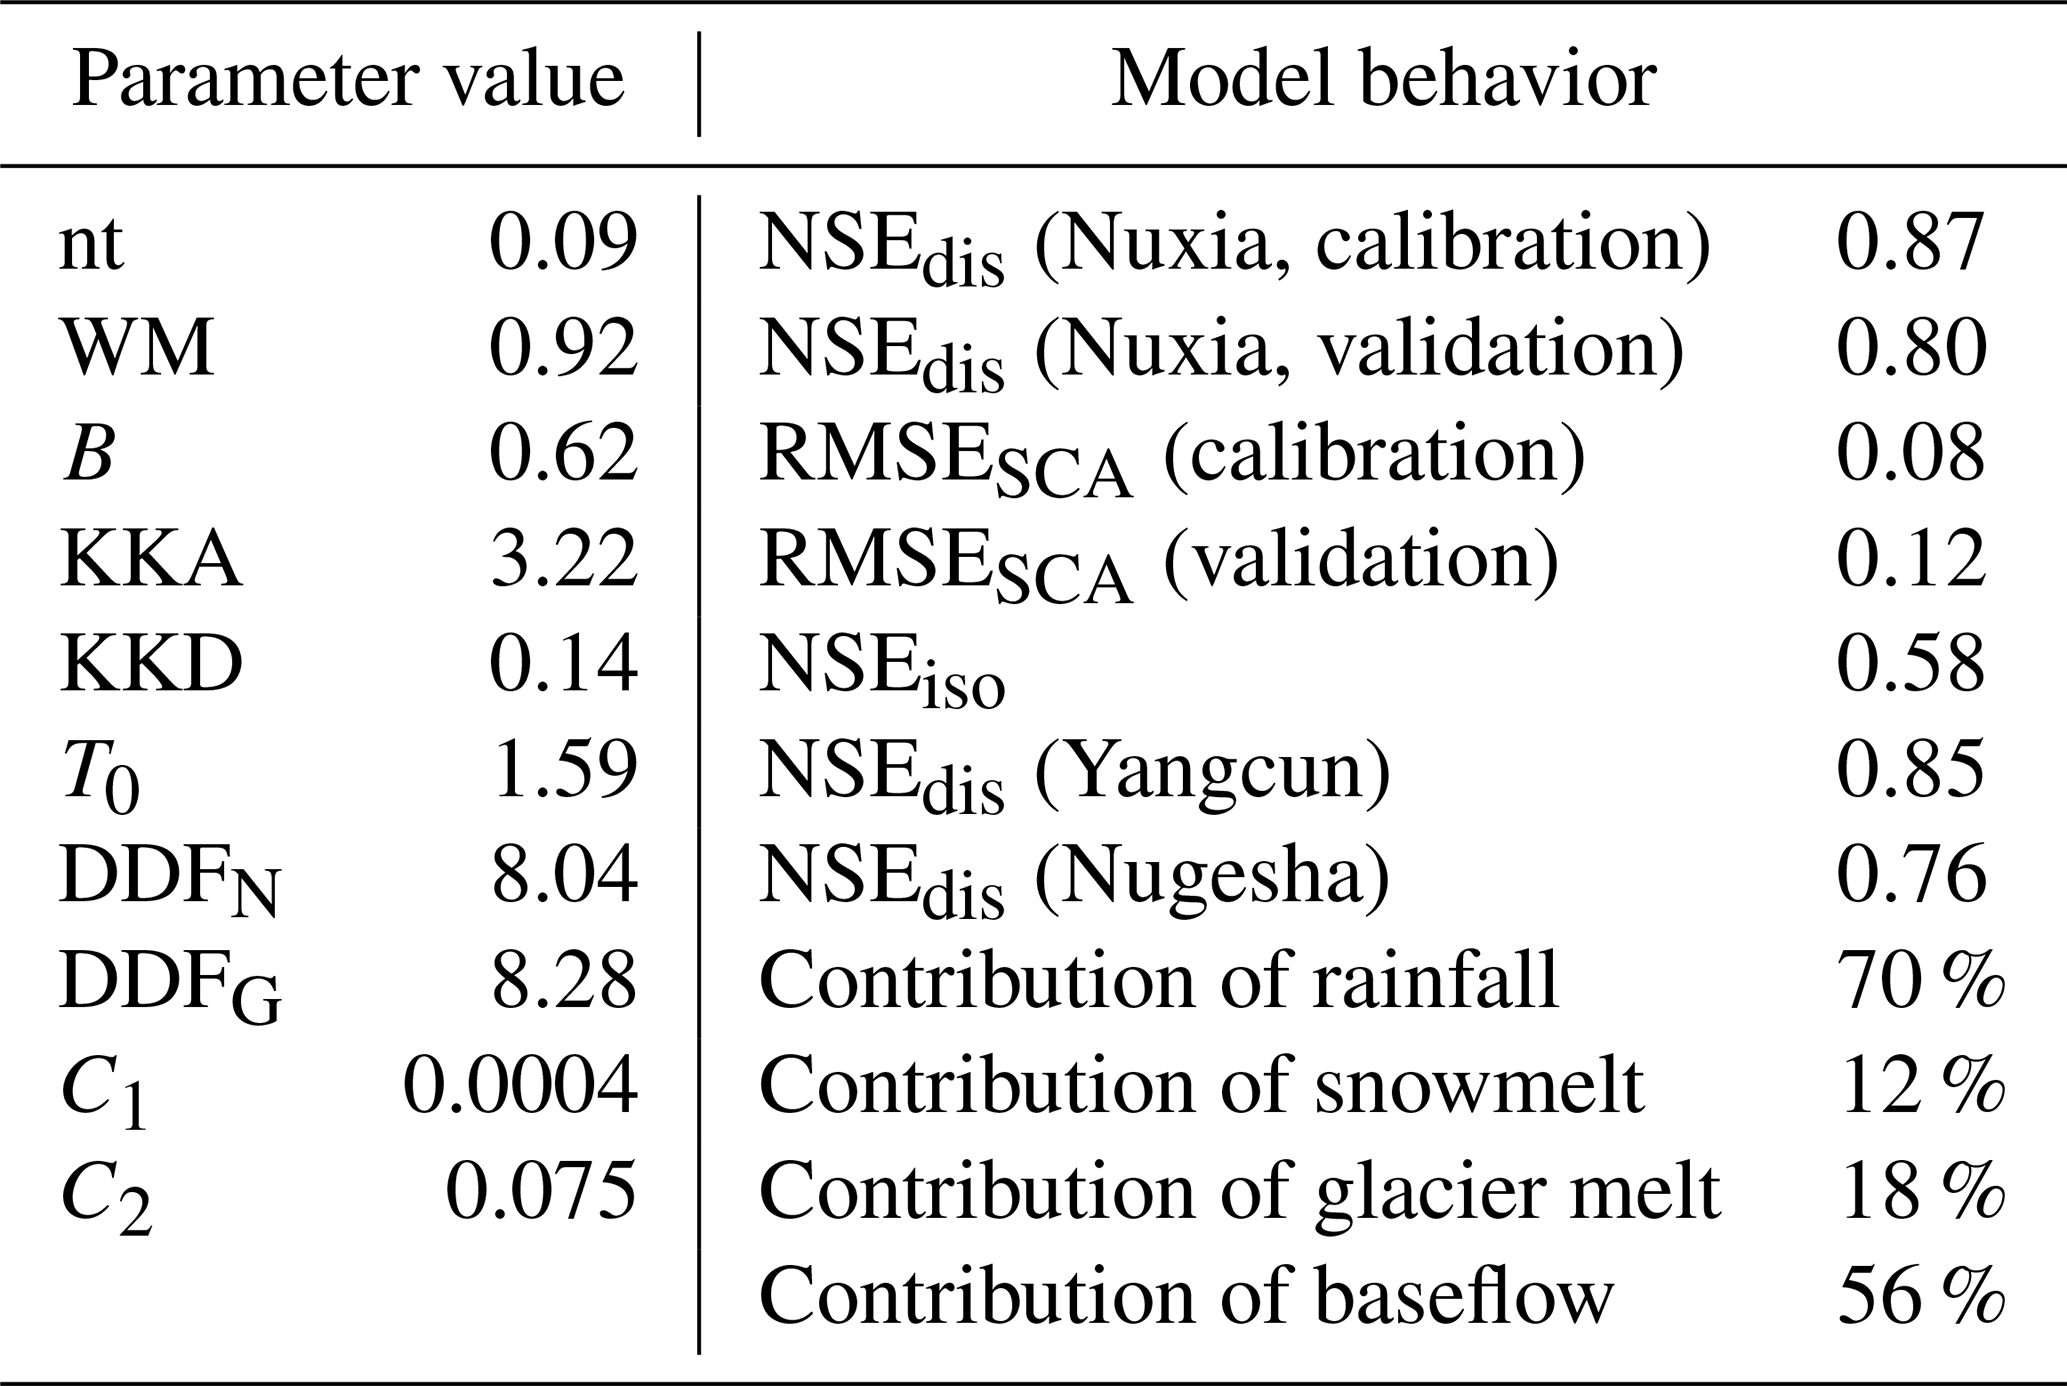
Figure 4 shows model performances in the KR catchment. The parameter sets producing positive NSEiso were selected as behavioral for tri-objective calibration. Variations of discharge and SCA were reproduced comparably well by the bi- and tri-objective calibrations, indicated by the similar metric values. However, the bi-objective calibration produced extremely poor performance for the isotope simulation with low NSEiso, and a large simulation error of ∼5 ‰ (Fig. 4c). The tri-objective calibration captured the seasonal variations in stream water δ18O during the study period well. Similarly to YTR, the tri-objective calibration resulted in lower uncertainty in the simulated hydrograph (e.g., early 2010, 2006, and 2008), benefiting from involving isotope for the model calibration to reject parameter sets that produced good performance for discharge and SCA simulations but poor performance for isotope simulation. Regarding the CRCs to total streamflow, the bi-objective and tri-objective calibrations estimated similar results with differences of up to 3 %. The mean contributions of rainfall, snowmelt, and glacier melt to annual streamflow in the KR catchment were around 45 %, 22 %, and 33 %, respectively. The contribution of surface runoff estimated by the bi-objective calibration, however, was 13 % lower than that estimated by the tri-objective calibration. In contrast, baseflow is more important in the total streamflow simulated by the bi-objective calibration (accounting for 38 %) in comparison to the simulation of the tri-objective calibration (accounting for 25 %). Again in the KR catchment, uncertainties of CRCs quantified by the tri-objective calibration are much smaller than those estimated by the bi-objective calibration (Table 4).
3.2 Changes in model simulations forced by different assumed glacier meltwater isotopes
Behavioral parameter sets of Experiment 1 were selected based on the same NSEiso threshold (0.5) with the benchmark running. Model simulations forced by assumed glacier meltwater δ18O that are 5 ‰ (scenario BM_YTR, Δδ=5 ‰) and 7 ‰ (scenario G_Δ7, Δδ=7 ‰) lower than the long-term average precipitation δ18O showed the best discharge simulations in the validation period (2011–2015) and stations (Yangcun and Nugesha), indicated by the high average metric values (Fig. 5a–d). It is noted that simulations of all the glacier meltwater isotope input scenarios in Experiment 1, except G_Δ1, performed better than the bi-objective calibration in which isotope data were not involved for parameter identification. Discharge simulation in the scenario of G_Δ1 estimated higher performance in the validation period than the bi-objective calibration (Fig. 5a), but lower performance at internal stations (Fig. 5b and c).
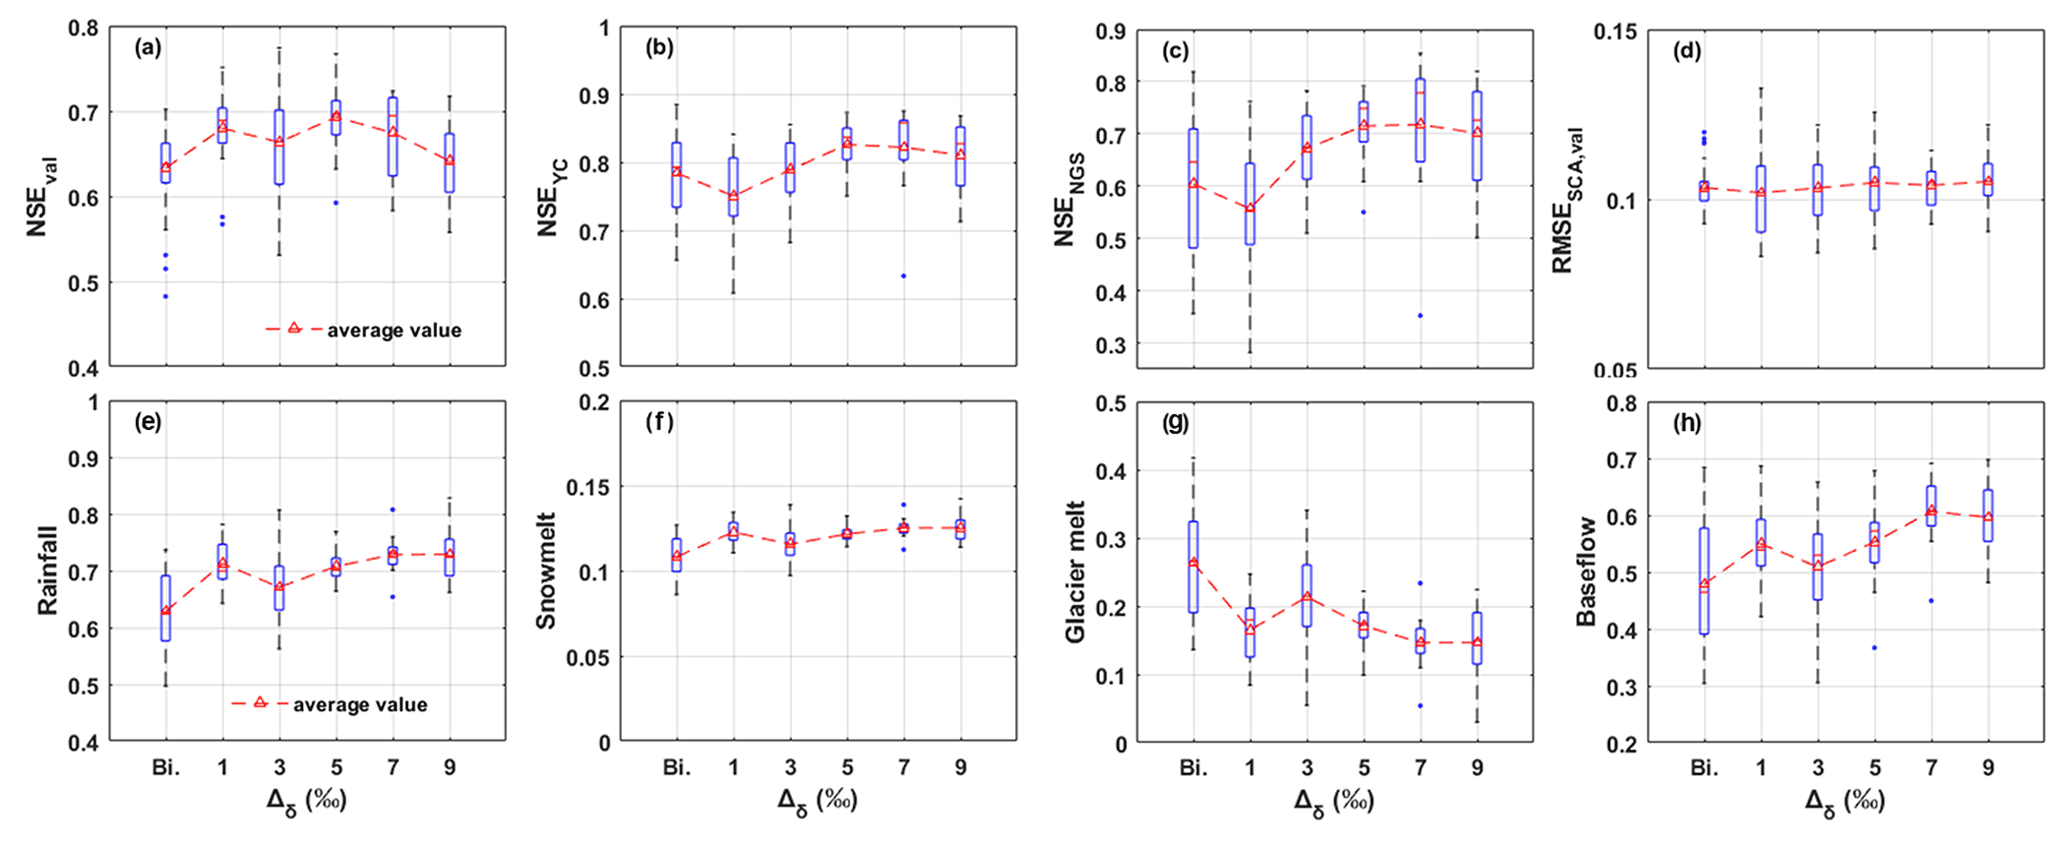
Figure 5Model performances (a–d) and runoff component contributions (e–h) in the YTR basin in different scenarios using different glacier isotope input (Experiment 1). Subplot (a) and (d) are the performances for Nuxia streamflow and SCA simulation in the validation period, respectively. Subplot (b) and (c) are the performances for streamflow simulation at internal stations Yangcun and Nugesha, respectively. Subplots (e)–(g) are the contribution of runoff components based on water source definition. Subplot (h) is the contribution of baseflow based on the runoff pathway definition.
Figure 5e–h shows the average CRCs and corresponding uncertainties estimated by the different glacier melt isotope inputs. Scenarios with larger Δδ values (i.e., glacier meltwater isotope is much lower than precipitation isotope) tended to result in higher contributions of precipitation and lower contributions of glacier melt. This can be expected as stream water δ18O is a mixture mainly from δ18O of precipitation and glacier meltwater in the YTR basin, and precipitation δ18O is fixed in all the scenarios. Results of scenario G_Δ1, however, estimated a smaller contribution of glacier melt than the scenario G_Δ3. This was likely due to that the behavioral parameter sets were selected based on the performance of both discharge and isotope simulations. Parameter sets that estimated higher glacier melt contribution with good performance in isotope simulation but performed poorly on discharge simulation were excluded from the behavioral set in the G_Δ1 scenario.
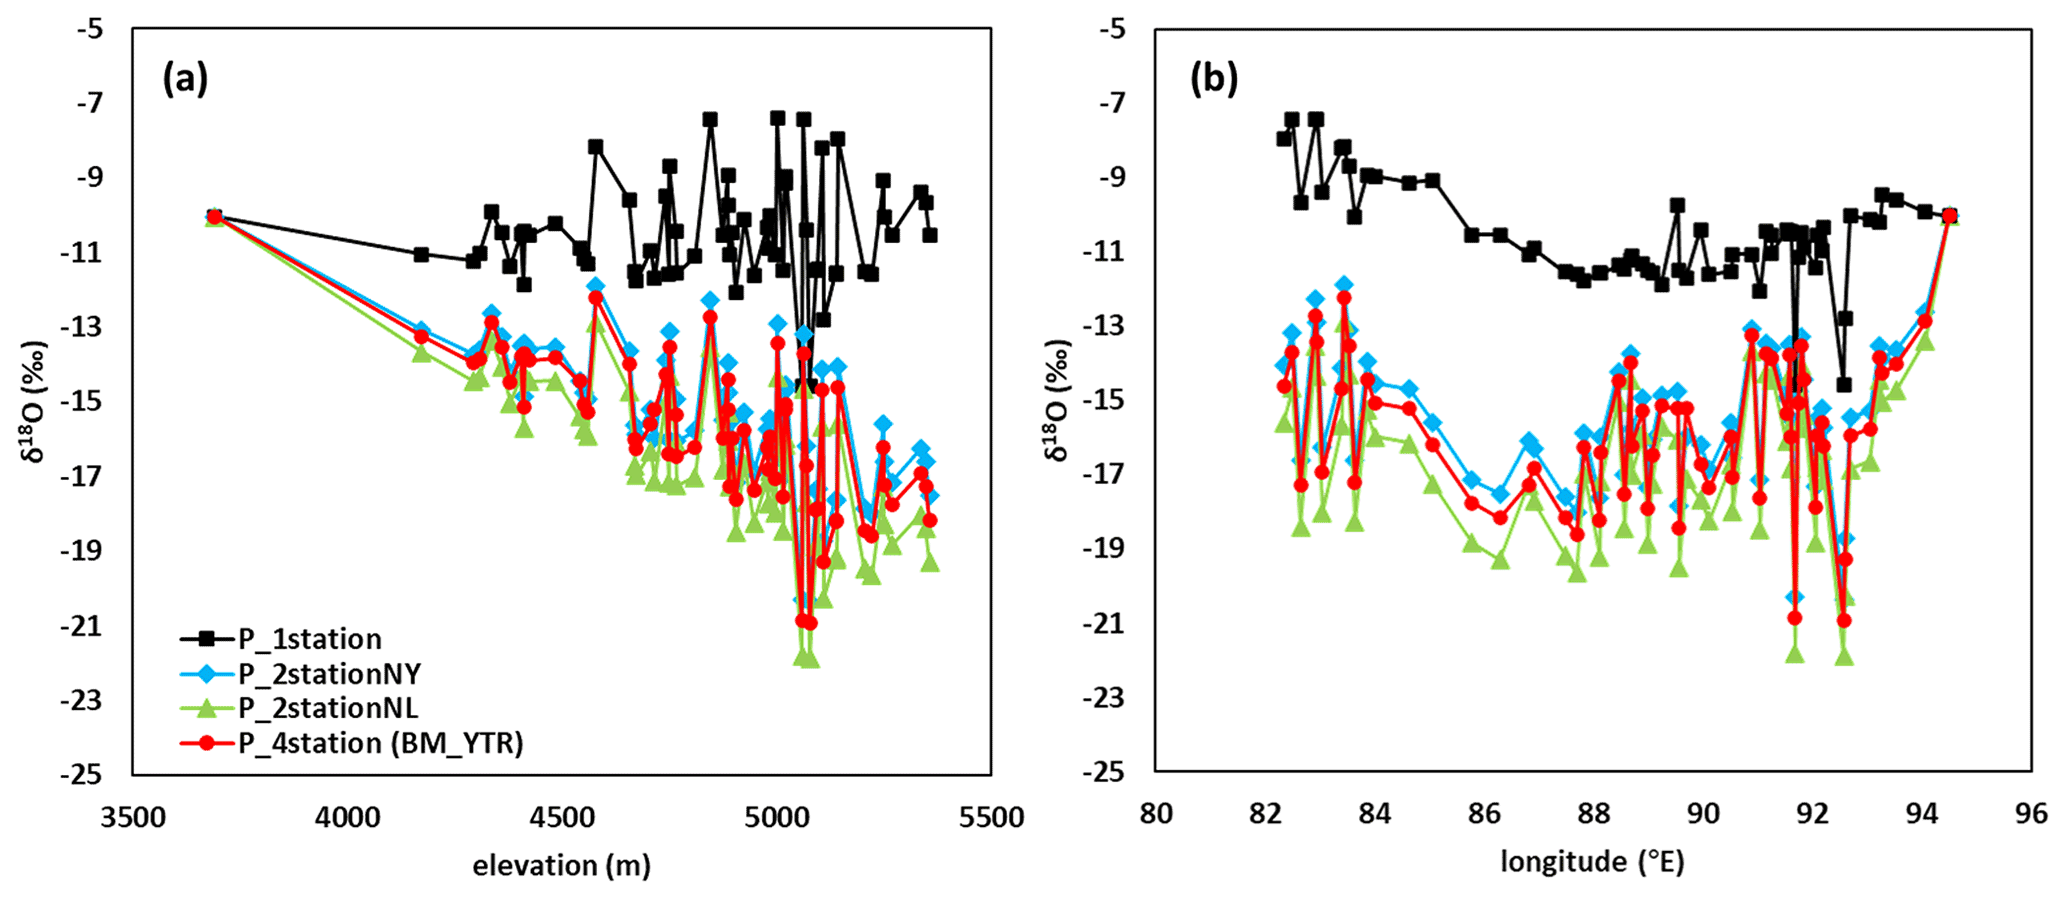
Figure 6Comparisons of weighted averages of precipitation δ18O on 63 REWs in the YTR by elevation (a), and longitude (b) in each scenario of Experiment 2.
3.3 Changes in model performance forced by isoGSM product merged with different site measurements of precipitation isotope
Figure 6 shows the relationship between REW-scale weighted averages of precipitation δ18O and the longitude/elevation of corresponding REW for the scenarios in Experiment 2. The precipitation δ18O showed similar a spatial pattern in the scenarios merging isoGSM with measurement data at more than one site. In scenario P_1station that isoGSM was merged with measurement data only at the most downstream station, Nuxia, however, the spatial pattern was different, showing significantly higher precipitation δ18O than other scenarios. The different precipitation δ18O pattern was mainly a result of different altitudinal lapse rates of the isoGSM bias (i.e., parameter a in Eq. 2). Representing the bias characteristic in the whole basin solely by the data measured at the most downstream station resulted in significantly smaller isoGSM bias and, consequently, overestimated precipitation δ18O.
Different precipitation δ18O input data inevitably resulted in different simulations of stream water δ18O, as shown in Fig. 7. The NSEiso threshold was set as 0.5, except for scenario P_1station, which produced extremely poor δ18O simulation due to the high bias in precipitation δ18O input data (Fig. 7d). The other three scenarios all performed well in stream δ18O simulation (Fig. 7a–c), among which, scenario P_2stationNL produced the highest behavior, followed by P_4station and P_2stationNY.
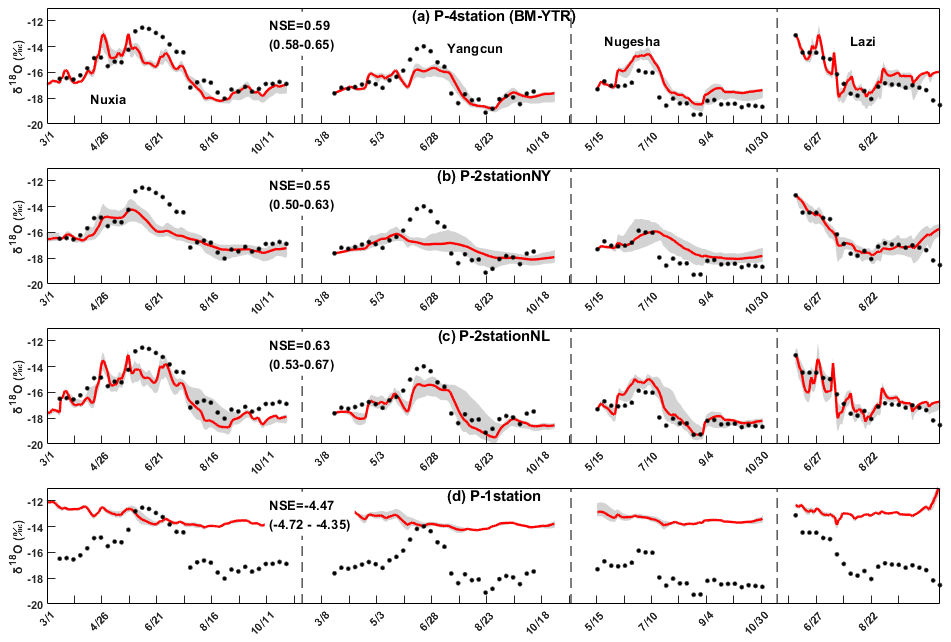
Figure 7Uncertainty ranges of stream water δ18O simulations at four stations in 2005 produced by the behavioral parameter sets of each scenario in Experiment 2.
Different precipitation isotope input data also led to different performance in hydrological modeling (Fig. 8a–d). While different scenarios produced similar SCA simulations in the validation period (Fig. 8d), the performance of discharge simulation significantly differed among the precipitation isotope input scenarios. In scenarios BM_YTR and P_2stationNL, the model performed better than the bi-objective calibration in the validation period (Fig. 8a) and stations (Fig. 8b and c), showing higher average values and smaller ranges of NSEdis, which indicated that the model benefitted from involving isotope data for calibration. The model performance forced by scenario P_2stationNY was close to that of the bi-objective calibration with poorer discharge simulation at internal stations (Fig. 8b and c). Using precipitation isotope input from the scenario P_1station, however, the model performance was significantly worse than that of the bi-objective calibration. Reasons for the variable model performance forced by the precipitation isotope input scenarios could be: site measurements of precipitation isotope used in scenarios BM_YTR (using data at four sampling stations) and P_2stationNL (using data at the most downstream sampling station and the most upstream sampling station) tended to provide more informative spatial distribution of precipitation δ18O in the basin, and were the most valuable data for the precipitation isotope data merging; in the scenario of P_1station, on the contrary, the bias of isoGSM product was inadequately corrected by site precipitation isotope measured only at the most downstream station Nuxia, resulting in many errors in the isoGSM product at high altitudes. Although precipitation isotope input data did not influence the simulation of hydrological processes, the calibration process that attempted to match simulated stream δ18O with measurement influenced the parameter and, consequently, affected the internal hydrological processes.
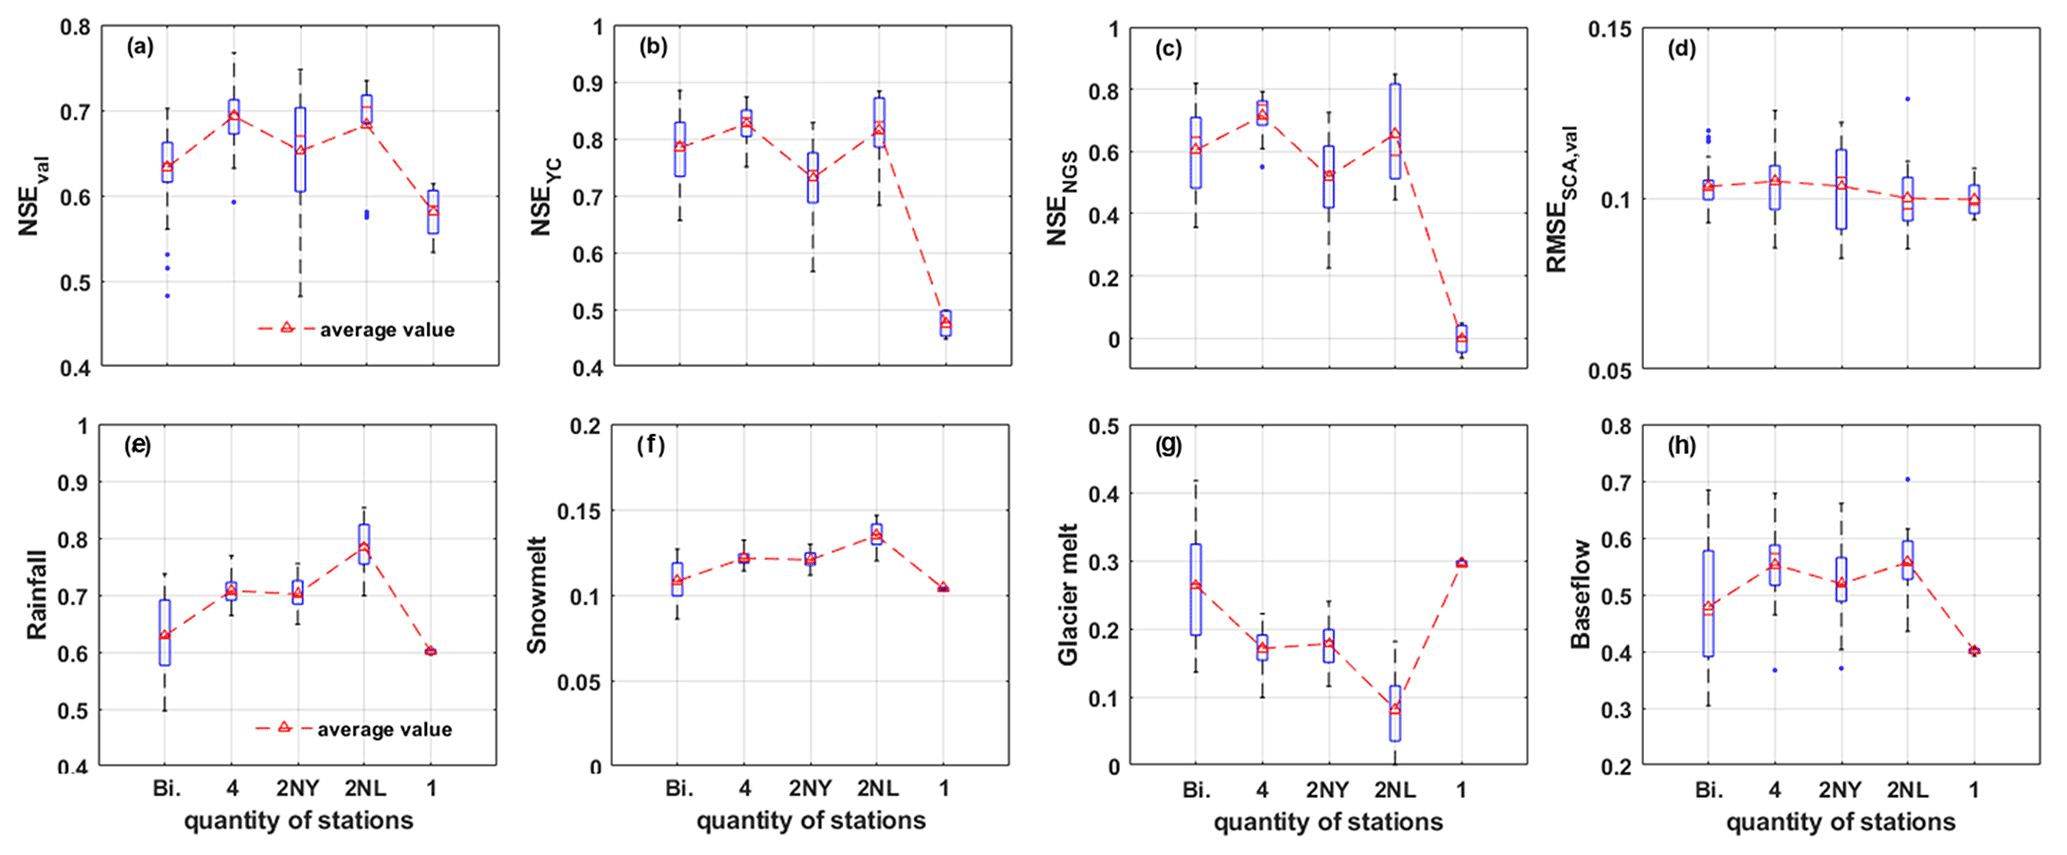
Figure 8Model performances (a–d) and runoff component contributions (e–h) in the YTR basin in different scenarios using precipitation isotope measurements from different sampling sites (Experiment 2). Subplot (a) and (d) are the performances for Nuxia streamflow and SCA simulation in the validation period, respectively. Subplot (b) and (c) are the performances for streamflow simulation at internal stations Yangcun and Nugesha, respectively. Subplot (e)–(g) are the contribution of runoff components based on water source definition. Subplot (h) is the contribution of baseflow based on the runoff pathway definition.
Figure 8e–h shows the average CRCs and corresponding uncertainties estimated by the different precipitation isotope input scenarios. All scenarios produced lower uncertainties than the bi-objective calibration, which can be expected as they were calibrated by a tri-objective approach. The variable precipitation input scenarios resulted in contribution differences of around 10 % in runoff components of rainfall, glacier melt, and baseflow. The sort of estimated contribution of rainfall (P_2stationNL > BM_YTR > P_2stationNY > P_1station) was opposite to that of average precipitation δ18O shown in Fig. 6, which was consistent with the estimation based on the end-member mixing method.
Among the evaluation metrics, discharge simulation at Nugesha station showed the largest sensitivity to precipitation isotope inputs. As shown in Fig. 9, scenarios P_2stationNY and P_1station estimated higher contribution of meltwater, earlier discharge onset timing, and higher peak flow. The discharge began to rise especially early (around February) in scenario P_1station because of the low calibrated value for the melting temperature threshold T0 (−4.5∘), resulting in extremely poor discharge simulation (average NSE is around 0, Fig. 9d).
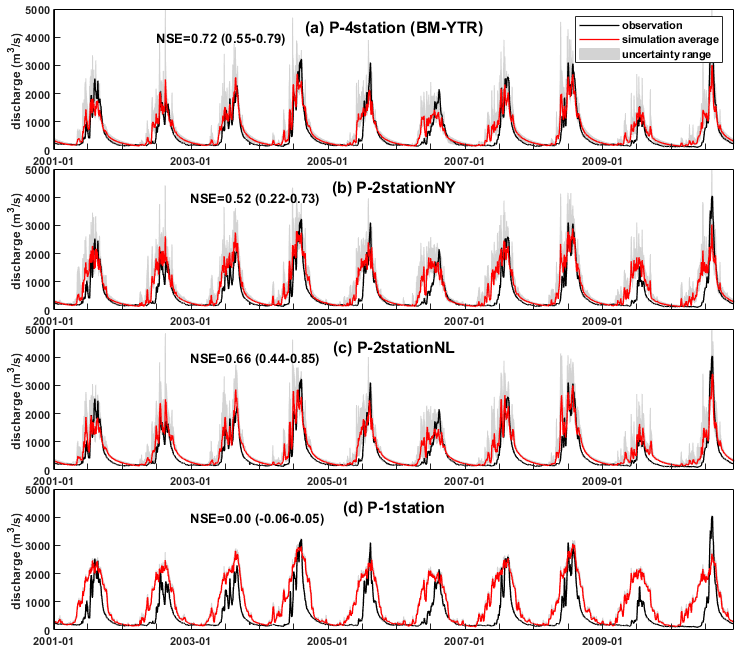
Figure 9Uncertainty range and metrics values of simulated discharge at Nugesha station produced by the behavioral parameter sets of each scenario in Experiment 2.
3.4 Model performance constrained by different stream water sampling strategies
Figure 10 shows the accuracy and uncertainty metrics of CRCs produced by Experiment 3 in the YTR basin. The NSEiso threshold was set as 0.8 because the stream isotope data for model calibration were generated by a benchmark parameter set, towards which good simulation was rather easy to produce. In comparison to the baseline scenario of RT_TYR_BM, collecting stream isotope data in the dry season (i.e., from November to next February in scenario RT_YTR_WholeYear) brought little benefits to the estimation of water sources proportions, but significantly improved the quantifications of runoff generation pathways indicated by the lower MAE and SD in Fig. 10b. The stream water in the dry season was fed mainly by groundwater. Stream water isotope data collected in this period reflect the release of groundwater storage, thus helping to constrain the partition between surface and subsurface runoff pathway. On the other hand, reducing the frequency of stream isotope data from weekly to monthly (i.e., scenario RT_YTR_Monthly) led to significantly higher MAE and SD for both the partitions of water sources and runoff pathways, which indicated that stream water isotope data collected by a monthly sampling strategy could provide less constrains to model calibration. Extending the duration of stream isotope sampling period by 1 or 2 years (i.e., scenarios RT_YTR_2year and RT_YTR_3year) did not bring many benefits to the quantifications of CRCs regarding the similar metric values. Using stream water isotope data from 3 years' sampling (RT_YTR_3year) even led to higher MAE and SD than that using stream water isotope data from a 2 years' sampling (RT_YTR_2year), which might be an occasional result obtained by the random calibration procedure (100 pySOT runs). In comparison to simulations constrained by stream water isotope data from multiple sampling years, results constrained by stream water isotope data from multiple sampling sits (i.e., scenarios of RT_YTR_2station and RT_YTR_4station) yielded lower MAE and SD for the quantified CRCs.
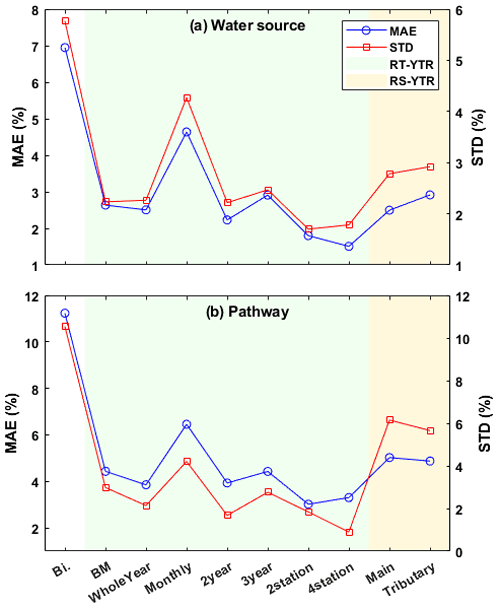
Figure 10Accuracy and uncertainty metrics of estimated CRCs in the YTR basin derived from the different stream water sampling strategies (Experiment 3). (a) For CRCs quantified under the definition of water source and (b) for CRCs quantified under the definition of runoff pathway.
Model simulations calibrated by spatially distributed stream δ18O data collected in a one-time field campaign reduced the CRC uncertainty compared to the bi-objective calibration (Fig. 10). However, its MAE and SD for the quantifications of CRCs were higher than that estimated by the model when calibrated by weekly sampled time series of stream δ18O. Additionally using stream isotope data from four major tributaries (i.e., scenario RS_YTR_Tributary) brought less benefits to the model performance than using isotope data from the main stream solely (RS_YTR_Main), partly due to the fact that signatures of stream water isotope from tributaries were already reflected by water samples collected at confluences on the main river channel.
In the KR catchment, stream isotope data were collected over 5 continuous years, providing a better data basis for the evaluation of the influence of sampling period duration. The NSEiso threshold was set as 0, the same with the benchmark scenario in KR catchment. Figure 11 compares the CRC estimations and their uncertainty metric SD of variable scenarios. For the estimate of water sources, the model produced rather large uncertainty ranges of ∼20 % and ∼40 % for the contributions of rainfall and glacier melt when calibrating the model using discharge and SCA. Using 1 year's stream water isotope data for model calibration, the uncertainty ranges were reduced by rejecting some outliers, as shown in Fig. 11a–c, but the SD was still large (Fig. 11e). The SD can be reduced by increasing the number of calibration isotope data at a rate of ∼1 % yr−1. Using isotope data collected over 5 years, however, did not result in further decrease in the CRC uncertainties compared to the result calibrated by isotope data collected in a 4-year sampling period. The situation, however, was quite different for the estimates of runoff pathways. The bi-objective calibration produced a large uncertainty of ∼40 % and a SD of ∼10 % (Fig. 11d) for the contribution of baseflow. Using 1 year's data for model calibration, the uncertainty range was significantly reduced by about half of that modeled by the bi-objective calibration (from ∼10 % to ∼5 %). However, further increase in the duration of sampling period did not bring much improvements on constraining the uncertainties in quantifications of runoff pathways, with SD fluctuating around only 4 %. It is indicated that model calibration upon more stream isotope data was useful to better constrain the uncertainties of the model simulations and modeled CRCs, but the benefit would disappear after a certain duration of stream water sampling period has been reached.
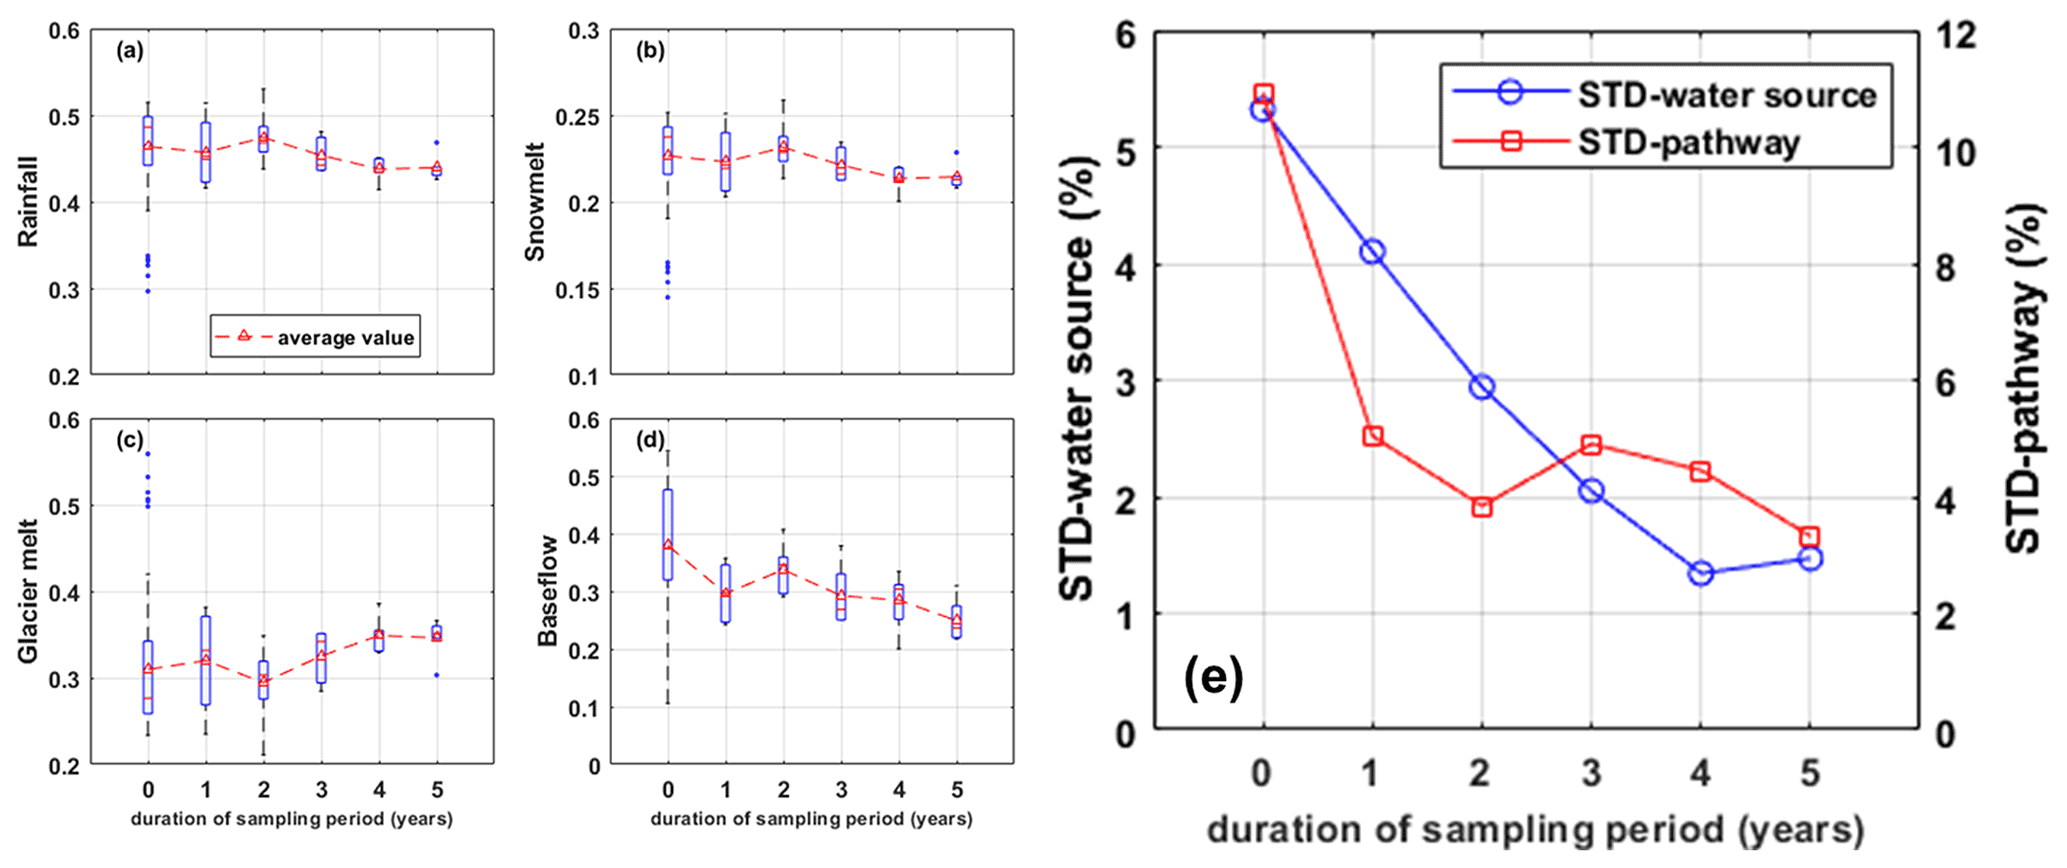
Figure 11Uncertainties of the contributions of (a) rainfall, (b) snowmelt, (c) glacier melt, and (d) baseflow in the KR catchment, estimated by scenarios with different durations of sampling period (Experiment 3). The uncertainties of CRCs based on two different definitions are summarized in subplot (e).
4.1 Implications for water sampling for isotope analysis in high mountains of TP
This study tested the reliance of the benefits of using a tracer-aided hydrological model on isotope data availability in two mountainous catchments YTR and KR on the TP. Our findings consistently showed that the model robustness, with respect to performance in the validation period and internal stations, and the quantifications of CRCs, can be significantly improved by involving isotope data for parameter calibration, similar to previous tracer-aided modeling studies (e.g., He et al., 2019; Ala-aho et al., 2017; Birkel et al., 2010). It can be expected that more data help to provide more constrains on identification of model parameters. Nonetheless, water sampling in high mountains on the TP is restricted by environment accessibility, and financial and human costs (Stevenson et al., 2021, Li et al., 2020). It is therefore highly needed to find optimal strategies of collecting water samples that balance well between data adequacy for model running and affordable sampling costs (Sprenger et al., 2019).
As an important water source in mountainous catchment on the TP, sampling of glacier meltwater was expected to be favorable for the determination of glacier meltwater isotopic composition and its contribution to total streamflow (He et al., 2019). Field campaign for sampling of glacier melt water is strongly challenging in the YTR basin in this study, due to the harsh accessibility of very high altitudes where glaciers lie. We thus assumed that glacier meltwater δ18O was lower than the average local precipitation δ18O by an offset parameter (Δδ). This simple assumption turned out to work well on driving the tracer-aided hydrological model, and produced better performance than the bi-objective calibration in both validation periods and internal stations. Experiments by using different Δδ values indicated that the prior assumed isotopic compositions of glacier melt have small influence on the estimated glacier meltwater contribution in the YTR basin. It should be noted that this was different from the results of some hydrograph separation works (e.g., Pu et al., 2020; Lone et al., 2021), which indicated the important influence of meltwater isotope composition in estimating the CRC. Those works were based on the end-member mixing approach, which was applied in a short time scale, and was more dependent on the isotope composition of each runoff component. However, this study applied the tracer-aided hydrological model in a longer time scale, where the temporal variability of isotope composition played a more important role than its absolute value on the parameter calibration. Consequently, when the temporal variabilities of isotope composition of each water source were reproduced properly, the glacier melt δ18O value in a reasonable range would have little influence on the model performance. The Δδ values ranging from 2 ‰–9 ‰ led to only ∼5 % difference in the estimated contributions of glacier melt. Using a Δδ to estimate glacier meltwater, δ18O could serve as an option to force the tracer-aided hydrological models in high-mountain catchments where collecting glacier meltwater samples is highly challenging.
Results of Experiment 2 indicated that the original isoGSM precipitation δ18O data showed large bias in the high mountain basins on TP, and must be corrected by or merged with measurement data before using to force the tracer-aided hydrological model. Our experiments showed that the measurement of precipitation isotope at only two sampling sites (scenario P_2stationNL) in the large YTR basin of 2×10⁵ km2 can be highly valuable for isotope data merging. Forced by isoGSM data that were merged with precipitation δ18O measurements from two sampling sites, the model performed better than the bi-objective calibration in simulating discharge in the validation period and internal stations, and performed comparably to the simulations of a benchmark running which used precipitation δ18O measurements from four stations for the data merging. This benefitted from the large altitudinal range covered by the two sampling sites (a most downstream site Nuxia and a most upstream site Lazi) to represent the spatial pattern of isoGSM bias. Likewise, using measurement data at two sites in the scenario P_2stationNY, model performance deteriorated visibly, as the sampling sites (Nuxia and Yangchun) were both located in the downstream regions, being worse at representing the spatial pattern of precipitation δ18O over the basin. Consequently, the strategy of collecting precipitation samples for isotope data merging should be carefully designed; spending high costs on collecting precipitation samples within a small region might be not worth it at improving the performance of the tracer-aided hydrological model.
Measurements of stream water δ18O are essential for the calibration and evaluation of tracer-aided hydrological models. Three kinds of sampling strategies in the YTR basin were evaluated in Experiment 3: one-time campaign field sampling, continuous sampling at a fixed location for a long period, and continuous sampling at multiple fixed locations during a short period. It is indicated that continuously sampled stream water δ18O at a fixed location is more valuable for aiding a hydrological model than that collected by one-time field sampling campaigns at distributed sites. Seasonality of stream water δ18O referring to the processes of water storage, mixture, and transport in the basin can be better captured by continuous time series measurements of δ18O data (McGuire and McDonnell, 2006). Spatially sampled stream water δ18O data by one-time field sampling campaigns possibly miss seasonal δ18O signatures of stream water that were caused by seasonal runoff generation processes (Kendall and Coplen, 2001; Nan et al., 2019), and provide less constrains for the model calibration. Sampling of stream water during the dry season (scenario RT_YTR_WholeYear) brought little improvements to the modeling of water source proportions, which is consistent with the findings in Stevenson et al. (2021). Highly frequent, like weekly sampling of stream water in the dry season, makes little sense on improving the stream δ18O data quality, as stream δ18O in this season has little variations due to small precipitation-triggered runoff inputs. Monthly sampling of stream water (RT_YTR_Monthly) turned out to be insufficient to capture the strong hydrological variations in the wet season (Birkel and Soulsby, 2015). For large basins like YTR, increasing the number of sampling sites for stream water δ18O is more useful than extending the years of the sampling period at fixed sites, as the seasonality of δ18O signatures of water sources should be similar among years in a short study period. Consequently, continuous sampling at multiple locations in a short period like 1 or 2 years seems to be the optimal stream sampling strategy for running a tracer-aided hydrological model in mountainous basins like YTR on the TP. The value of extending the sampling period was more significant in a smaller catchment KR. The uncertainty of CRC estimation kept decreasing until the data series length reached 4 years and 2 years, for the aspects of water source and runoff pathway, respectively. This was consistent with the finding by Stevenson et al. (2021) that the benefits from isotope plateaued after a certain year number, which was 5 for that study.
4.2 Uncertainties and limitations
This study used simulated stream δ18O of a benchmark model running to represent the fully available dataset of stream δ18O for water sampling in the YTR basin, due to the limited stream water samples. This procedure likely caused the inherent correlation of the stream δ18O dataset, which made the model easily reproduce the assumed measurements of stream δ18O, and may underestimate the value of stream δ18O data collected in extended sampling years and sampling sites. Results in this study serve to provide preliminary understandings of the influences of stream water sampling strategy on the model performance. More solid evaluations, however, can be further benefited from using more real field measurements of stream δ18O in the mountain basins.
Our study tried to look for optimal water sampling strategies to provide isotope input and calibration data for the tracer-aided hydrological model in the YTR basin and KR catchment on the TP. The transferability of our findings to other basins can be partly expected. For example, we can expect that in catchments where precipitation δ18O and runoff processes show small spatial heterogeneity, collecting water samples at multiple stations would bring few additional benefits for the modeling work than collecting water samples at a sole station. The influence of assumed glacier meltwater would differ with the glacier-covered area fraction in the basins. However, situations in catchments with different geographical and climatic characteristics were not evaluated in this study, which is restricted by the fact that high-quality water isotope data in a set of mountain basins on the TP were hardly available currently (Birkel and Soulsby, 2015). The authors suggest that tracer-aided modeling researchers publish their water isotope data to improve the evaluation of the reliance of tracer-aided modeling performance on water sampling strategy (similarly to He et al., 2021; Niinikoski et al., 2016; Yde et al., 2016; Laudon et al., 2013).
The model performances were evaluated based on the behavioral parameter sets which were selected by the threshold values of evaluation metrics. The threshold values were determined by looking at the graph comparing simulation and observation values, and artificially judging whether good fitness has been achieved. This process was rather subjective and had inevitable influence on the evaluation result. However, this was a widely used method (e.g., Birkel et al., 2011; Delavau et al., 2017; He et al., 2019), and the threshold values were set at levels achieved by the studies conducted in the same region (e.g., Zhang et al., 2015; Chen et al., 2017).
The value of water isotope data for aiding hydrological modeling in large mountainous catchments was tested by a set of numerical experiments in the YTR basin. Reliance of the tracer-aided model performance on the availability of input isotope data and evaluation stream water isotope data was extensively investigated in the numerical experiments. Results could provide important guidance for collecting water samples and establishing a tracer-aided hydrological model in mountainous regions on the TP. Our main findings are as follows:
-
In high-mountain basins where glacier meltwater samples for isotope analysis are not available, estimating isotopic composition of glacier meltwater by an offset parameter from precipitation isotope is a feasible way to force the tracer-aided hydrological model. Our test indicated that using a set of glacier meltwater δ18O that are 2 ‰–9 ‰ lower than the mean precipitation δ18O resulted in small changes in the model performance and the quantifications of CRCs (smaller than 5 %) in the YTR basin. This influence, however, is expected to change with the glacier area coverages in other mountain basins.
-
A strategy of field sampling for precipitation to collect measurement precipitation δ18O merged with isoGSM product should be carefully designed. Collecting precipitation samples at sites from the same altitude tends to be worse at representing the spatial pattern of precipitation δ18O over the basin than collecting precipitation samples from sites covering a range of altitudes. Measurements of precipitation isotope at only two sampling sites covering an elevation range of 2900–6900 m in the large YTR basin of 2×10⁵ km2 can be highly valuable for precipitation isotope data merging.
-
Collecting weekly stream water samples at multiple sites in the wet and warm seasons is the optimal strategy to capture more hydrological process variability for calibrating and evaluating a tracer-aided hydrological model in the YTR basin. It is highly recommended to increase the number of stream water sampling sites in the high-mountain basins rather than extending the duration of sampling period at a sole site. Benefits from extending the duration of sampling period is more visible in a small catchment but smaller in large basins, and tend to disappear when a certain duration of the sampling period has been reached.
The isotope data and the code of THREW-T model used in this study are available from the corresponding author (tianfq@tsinghua.edu.cn). Other data sets and the calibration program pySOT are publicly available as follows: DEM (http://www.gscloud.cn/sources/details/310?pid=302, Geospatial Data Cloud Site, 2019), CMFD (https://doi.org/10.11888/AtmosphericPhysics.tpe.249369.file, Yang and He, 2019), glacier data (https://doi.org/10.3972/glacier.001.2013.db, Liu, 2012), NDVI (https://doi.org/10.5067/MODIS/MOD13A3.006, Didan, 2015), LAI (https://doi.org/10.5067/MODIS/MOD15A2H.006, Myneni et al., 2015), HWSD (https://data.tpdc.ac.cn/zh-hans/data/3519536a-d1e7-4ba1-8481-6a0b56637baf/?q=HWSD, He, 2019) and the pySOT program (https://doi.org/10.5281/zenodo.569554, Eriksson et al., 2017). These data sets and programs are also referred to in the main text (Chen et al., 2018).
YN, ZH, and FT conceived the idea. ZW provided the isoGSM data. LT provided the measurement isotope data. YN, ZH, and FT conducted analysis. ZW and LT provided comments on the analysis; all the authors contributed to writing and revisions.
At least one of the (co-)authors is a member of the editorial board of Hydrology and Earth System Sciences. The peer-review process was guided by an independent editor, and the authors also have no other competing interests to declare.
Publisher's note: Copernicus Publications remains neutral with regard to jurisdictional claims in published maps and institutional affiliations.
This article is part of the special issue “Hydrological response to climatic and cryospheric changes in high-mountain regions”. It is not associated with a conference.
This study has been supported by the National Natural Science Foundation of China (grant nos. 92047301 and 51879136) and the Shuimu Tsinghua Scholar Program.
This paper was edited by Giulia Zuecco and reviewed by Yanlong Kong, Christian Birkel, and one anonymous referee.
Ala-aho, P., Tetzlaff, D., McNamara, J. P., Laudon, H., and Soulsby, C.: Using isotopes to constrain water flux and age estimates in snow-influenced catchments using the STARR (Spatially distributed Tracer-Aided Rainfall–Runoff) model, Hydrol. Earth Syst. Sci., 21, 5089–5110, https://doi.org/10.5194/hess-21-5089-2017, 2017.
Birkel, C. and Soulsby, C.: Advancing tracer-aided rainfall-runoff modelling: a review of progress, problems andnrealizedd potential, Hydrol. Process., 29, 5227–5240, https://doi.org/10.1002/hyp.10594, 2015.
Birkel, C., Dunn, S. M., Tetzlaff, D., and Soulsby, C.: Assessing the value of high-resolution isotope tracer data in the stepwise development of a lumped conceptual rainfall-runoff model, Hydrol. Process., 24, 2335–2348, https://doi.org/10.1002/hyp.7763, 2010.
Birkel, C., Tetzlaff, D., Dunn, S. M., and Soulsby, C.: Using time domain and geographic source tracers to conceptualize streamflow generation processes in lumped rainfall-runoff models, Water Resour. Res., 47, W02515, https://doi.org/10.1029/2010wr009547, 2011.
Boral, S. and Sen, I. S.: Tracing `Third Pole' ice meltwater contribution to the Himalayan rivers using oxygen and hydrogen isotopes, Geochem. Perspect. Lett., 13, 48–53, https://doi.org/10.7185/geochemlet.2013, 2020.
Bowen, G. J., Cai, Z., Fiorella, R. P., and Putman, A. L.: Isotopes in the Water Cycle: Regional- to Global-Scale Patterns and Applications, Annu. Rev. Earth Planet. Sci., 47, 453–479, https://doi.org/10.1146/annurev-earth-053018-060220, 2019.
Capell, R., Tetzlaff, D., and Soulsby, C.: Can time domain and source area tracers reduce uncertainty in rainfall-runoff models in larger heterogeneous catchments?, Water Resour. Res., 48, W09544, https://doi.org/10.1029/2011wr011543, 2012.
Chen, X., Long, D., Hong, Y., Zeng, C., and Yan, D.: Improved modeling of snow and glacier melting by a progressive two-stage calibration strategy with GRACE and multisource data: How snow and glacier meltwater contributes to the runoff of the Upper Brahmaputra River basin?, Water Resources Research, 53, 2431-2466, 10.1002/2016wr019656, 2017.
Chen, X., Long, D., Liang, S., He, L., Zeng, C., Hao, X., and Hong, Y.: Developing a composite daily snow cover extent record over the Tibetan Plateau from 1981 to 2016 using multisource data, Remote Sens. Environ., 215, 284–299, https://doi.org/10.1016/j.rse.2018.06.021, 2018.
Delavau, C. J., Stadnyk, T., and Holmes, T.: Examining the impacts of precipitation isotope input on distributed, tracer-aided hydrological modelling, Hydrol. Earth Syst. Sci., 21, 2595–2614, https://doi.org/10.5194/hess-21-2595-2017, 2017.
Didan, K.: MOD13A3 MODIS/Terra vegetation Indices Monthly L3 Global 1 km SIN Grid V006, NASA EOSDIS Land Processes DAAC [data set], https://doi.org/10.5067/MODIS/MOD13A3.006, 2015.
Dong, G., Weng, B., Chen, J., Yan, D., and Wang, H.: Variation characteristics of stable isotopes in water along main stream of Naqu River in source area of Nujiang River, Water Resour. Hydropow. Eng., 49, 108–114, 2018.
Duethmann, D., Bolch, T., Farinotti, D., Kriegel, D., Vorogushyn, S., Merz, B., Pieczonka, T., Jiang, T., Su, B., and Guentner, A.: Attribution of streamflow trends in snow and glacier melt-dominated catchments of the Tarim River, Central Asia, Water Resour. Res., 51, 4727–4750, https://doi.org/10.1002/2014wr016716, 2015.
Eriksson, D., Bindel, D., and Shoemaker, C.: Dme65/Pysot: V0.1.35, Zenodo [code], https://doi.org/10.5281/zenodo.569554, 2017.
Fassnacht, S. R., Sexstone, G. A., Kashipazha, A. H., Ignacio Lopez-Moreno, J., Jasinski, M. F., Kampf, S. K., and Von Thaden, B. C.: Deriving snow-cover depletion curves for different spatial scales from remote sensing and snow telemetry data, Hydrol. Process., 30, 1708–1717, https://doi.org/10.1002/hyp.10730, 2016.
Gao, J., Tian, L., and Liu, Y.: Oxygen isotope variation in the water cycle of the Yamzho Lake Basin in southern Tibetan Plateau, Chinese Sci. Bull., 54, 2758–2765, 2009.
Geospatial Data Cloud Site: ASTER GDEM 30M, Geospatial Data Cloud Site [data set], http://www.gscloud.cn/sources/details/310?pid=302, last access: 1 January 2019.
He, Y.: Pan-TPE soil map based on Harmonized World Soil Database (V1.2), National Tibetan Plateau Data Center [data set], https://data.tpdc.ac.cn/zh-hans/data/3519536a-d1e7-4ba1-8481-6a0b56637baf/?q=HWSD, last access: 1 January 2019.
He, Z., Vorogushyn, S., Unger-Shayesteh, K., Gafurov, A., Kalashnikova, O., Omorova, E., and Merz, B.: The Value of Hydrograph Partitioning Curves for Calibrating Hydrological Models in Glacierized Basins, Water Resour. Res., 54, 2336–2361, https://doi.org/10.1002/2017wr021966, 2018.
He, Z., Unger-Shayesteh, K., Vorogushyn, S., Weise, S. M., Kalashnikova, O., Gafurov, A., Duethmann, D., Barandun, M., and Merz, B.: Constraining hydrological model parameters using water isotopic compositions in a glacierized basin, Central Asia, J. Hydrol., 571, 332–348, https://doi.org/10.1016/j.jhydrol.2019.01.048, 2019.
He, Z., Unger-Shayesteh, K., Vorogushyn, S., Weise, S. M., Duethmann, D., Kalashnikova, O., Gafurov, A., and Merz, B.: Comparing Bayesian and traditional end-member mixing approaches for hydrograph separation in a glacierized basin, Hydrol. Earth Syst. Sci., 24, 3289–3309, https://doi.org/10.5194/hess-24-3289-2020, 2020.
He, Z., Duethmann, D., and Tian, F.: A meta-analysis based review of quantifying the contributions of runoff components to streamflow in glacierized basins, J. Hydrol., 603, 126890, https://doi.org/10.1016/j.jhydrol.2021.126890, 2021.
He, Z. H., Tian, F. Q., Gupta, H. V., Hu, H. C., and Hu, H. P.: Diagnostic calibration of a hydrological model in a mountain area by hydrograph partitioning, Hydrol. Earth Syst. Sci., 19, 1807–1826, https://doi.org/10.5194/hess-19-1807-2015, 2015.
Hindshaw, R. S., Tipper, E. T., Reynolds, B. C., Lemarchand, E., Wiederhold, J. G., Magnusson, J., Bernasconi, S. M., Kretzschmar, R., and Bourdon, B.: Hydrological control of stream water chemistry in a glacial catchment (Damma Glacier, Switzerland), Chem. Geol., 285, 215–230, https://doi.org/10.1016/j.chemgeo.2011.04.012, 2011.
Immerzeel, W. W., van Beek, L. P. H., and Bierkens, M. F. P.: Climate Change Will Affect the Asian Water Towers, Science, 328, 1382–1385, https://doi.org/10.1126/science.1183188, 2010.
Jeelani, G., Shah, R. A., Jacob, N., and Deshpande, R. D.: Estimation of snow and glacier melt contribution to Liddar stream in a mountainous catchment, western Himalaya: an isotopic approach, Isotop. Environ. Health Stud., 53, 18–35, https://doi.org/10.1080/10256016.2016.1186671, 2017.
Kendall, C. and Coplen, T. B.: Distribution of oxygen-18 and deuterium in river waters across the United States, Hydrol. Process., 15, 1363–1393, https://doi.org/10.1002/hyp.217, 2001.
Klaus, J. and McDonnell, J. J.: Hydrograph separation using stable isotopes: Review and evaluation, J. Hydrol., 505, 47–64, https://doi.org/10.1016/j.jhydrol.2013.09.006, 2013.
Knapp, J. L. A., Neal, C., Schlumpf, A., Neal, M., and Kirchner, J. W.: New water fractions and transit time distributions at Plynlimon, Wales, estimated from stable water isotopes in precipitation and streamflow, Hydrol. Earth Syst. Sci., 23, 4367–4388, https://doi.org/10.5194/hess-23-4367-2019, 2019.
Kong, Y., Wang, K., Pu, T., and Shi, X.: Nonmonsoon Precipitation Dominates Groundwater Recharge Beneath a Monsoon-Affected Glacier in Tibetan Plateau, J. Geophys. Res.-Atmos., 124, 10913–10930, https://doi.org/10.1029/2019jd030492, 2019.
Laudon, H., Taberman, I., Ågren, A., Futter, M., Ottosson-Löfvenius, M., and Bishop, K.: The Krycklan Catchment Study-A flagship infrastructure for hydrology, biogeochemistry, and climate research in the boreal landscape, Water Resour. Res., 49, 7154–7158, https://doi.org/10.1002/wrcr.20520, 2013.
Li, Z., Feng, Q., Li, Z., Yuan, R., Gui, J., and Lv, Y.: Climate background, fact and hydrological effect of multiphase water transformation in cold regions of the western china: a review, Earth.-Sci. Rev., 190, 33–57, https://doi.org/10.1016/j.earscirev.2018.12.004, 2019.
Li, Z.-J., Li, Z.-X., Song, L.-L., Gui, J., Xue, J., Zhang, B. J., and Gao, W. D.: Hydrological and runoff formation processes based on isotope tracing during ablation period in the source regions of Yangtze River, Hydrol. Earth Syst. Sci., 24, 4169–4187, https://doi.org/10.5194/hess-24-4169-2020, 2020.
Liu, S.: The second glacier inventory dataset of China (version 1.0) (2006–2011), National Tibetan Plateau Data Center [data set], https://doi.org/10.3972/glacier.001.2013.db, 2012.
Liu, Z., Tian, L., Yao, T., Gong, T., Yin, C., and Yu, W.: Temporal and spatial variations of delta O-18 in precipitation of the Yarlung Zangbo River Basin, J. Geogr. Sci., 17, 317–326, https://doi.org/10.1007/s11442-007-0317-1, 2007.
Lone, A., Jeelani, G., Deshpande, R. D., and Padhya, V.: Estimating the sources of stream water in snow dominated catchments of western Himalayas, Adv. Water Resour., 155, 103995, https://doi.org/10.1016/j.advwatres.2021.103995, 2021.
Lutz, A. F., Immerzeel, W. W., Shrestha, A. B., and Bierkens, M. F. P.: Consistent increase in High Asia's runoff due to increasing glacier melt and precipitation, Nat. Clim. Change, 4, 587–592, https://doi.org/10.1038/nclimate2237, 2014.
McGuire, K. J. and McDonnell, J. J.: A review and evaluation of catchment transit time modeling, J. Hydrol., 330, 543–563, https://doi.org/10.1016/j.jhydrol.2006.04.020, 2006.
McGuire, K. J., Weiler, M., and McDonnell, J. J.: Integrating tracer experiments with modeling to assess runoff processes and water transit times, Adv. Water Resour., 30, 824–837, https://doi.org/10.1016/j.advwatres.2006.07.004, 2007.
Myneni, R., Knyazikhin, Y., and Park, T.: MOD15A2H MODIS/Terra Leaf Area Index/FPAR 8-Day L4 Global 500 m SIN Grid V006, NASA EOSDIS Land Processes DAAC [data set], https://doi.org/10.5067/MODIS/MOD15A2H.006, 2015.
Nan, Y., Tian, F., Hu, H., Wang, L., and Zhao, S.: Stable Isotope Composition of River Waters across the World, Water, 11, 1760, https://doi.org/10.3390/w11091760, 2019.
Nan, Y., Tian, L., He, Z., Tian, F., and Shao, L.: The value of water isotope data on improving process understanding in a glacierized catchment on the Tibetan Plateau, Hydrol. Earth Syst. Sci., 25, 3653–3673, https://doi.org/10.5194/hess-25-3653-2021, 2021a.
Nan, Y., He, Z., Tian, F., Wei, Z., and Tian, L.: Can we use precipitation isotope outputs of isotopic general circulation models to improve hydrological modeling in large mountainous catchments on the Tibetan Plateau?, Hydrol. Earth Syst. Sci., 25, 6151–6172, https://doi.org/10.5194/hess-25-6151-2021, 2021b.
Niinikoski, P. I. A., Hendriksson, N. M., and Karhu, J. A.: Using stable isotopes to resolve transit times and travel routes of river water: a case study from southern Finland, Isotop. Environ. Health Stud., 52, 380–392, https://doi.org/10.1080/10256016.2015.1107553, 2016.
Ohlanders, N., Rodriguez, M., and McPhee, J.: Stable water isotope variation in a Central Andean watershed dominated by glacier and snowmelt, Hydrol. Earth Syst. Sci., 17, 1035–1050, https://doi.org/10.5194/hess-17-1035-2013, 2013.
Parajka, J. and Blöschl, G.: The value of modis snow cover data in validating and calibrating conceptual hydrologic models, J. Hydrol., 358, 240–258, https://doi.org/10.1016/j.jhydrol.2008.06.006, 2008.
Pu, T., Wang, K., Kong, Y., Shi, X., Kang, S., Huang, Y., He, Y., Wang, S., Lee, J., and Cuntz, M.: Observing and Modeling the Isotopic Evolution of Snow Meltwater on the Southeastern Tibetan Plateau, Water Resour. Res., 56, e2019WR026423, https://doi.org/10.1029/2019wr026423, 2020.
Rai, S. P., Singh, D., Jacob, N., Rawat, Y. S., Arora, M., and BhishmKumar: Identifying contribution of snowmelt and glacier melt to the Bhagirathi River (Upper Ganga) near snout of the Gangotri Glacier using environmental isotopes, Catena, 173, 339–351, https://doi.org/10.1016/j.catena.2018.10.031, 2019.
Reggiani, P., Hassanizadeh, S. M., Sivapalan, M., and Gray, W. G.: A unifying framework for watershed thermodynamics: constitutive relationships, Adv. Water Resour., 23, 15–39, https://doi.org/10.1016/s0309-1708(99)00005-6, 1999.
Schaner, N., Voisin, N., Nijssen, B., and Lettenmaier, D. P.: The contribution of glacier melt to streamflow, Environ. Res. Lett., 7, 034029, https://doi.org/10.1088/1748-9326/7/3/034029, 2012.
Son, K. and Sivapalan, M.: Improving model structure and reducing parameter uncertainty in conceptual water balance models through the use of auxiliary data, Water Resour. Res., 43, W01415, https://doi.org/10.1029/2006wr005032, 2007.
Sprenger, M., Stumpp, C., Weiler, M., Aeschbach, W., Allen, S. T., Benettin, P., Dubbert, M., Hartmann, A., Hrachowitz, M., Kirchner, J. W., McDonnell, J. J., Orlowski, N., Penna, D., Pfahl, S., Rinderer, M., Rodriguez, N., Schmidt, M., and Werner, C.: The Demographics of Water: A Review of Water Ages in the Critical Zone, Rev. Geophys., 57, 800–834, https://doi.org/10.1029/2018rg000633, 2019.
Stevenson, J. L., Birkel, C., Neill, A. J., Tetzlaff, D., and Soulsby, C.: Effects of streamflow isotope sampling strategies on the calibration of a tracer-aided rainfall-runoff model, Hydrol. Process., 35, e14223, https://doi.org/10.1002/hyp.14223, 2021.
Tan, H., Chen, X., Shi, D., Rao, W., Liu, J., Liu, J., Eastoe, C. J., and Wang, J.: Base flow in the Yarlungzangbo River, Tibet, maintained by the isotopically-depleted precipitation and groundwater discharge, Sci. Total Environ., 759, 143510, https://doi.org/10.1016/j.scitotenv.2020.143510, 2021.
Tian, F., Hu, H., Lei, Z., and Sivapalan, M.: Extension of the Representative Elementary Watershed approach for cold regions via explicit treatment of energy related processes, Hydrol. Earth Syst. Sci., 10, 619–644, https://doi.org/10.5194/hess-10-619-2006, 2006.
Tian, F., Xu, R., Nan, Y., Li, K., and He, Z.: Quantification of runoff components in the Yarlung Tsangpo River using a distributed hydrological model, Adv. Water Sci., 31, 324–336, 2020.
Viviroli, D., Weingartner, R., and Messerli, B.: Assessing the hydrological significance of the world's mountains, Mount. Res. Dev., 23, 32–40, https://doi.org/10.1659/0276-4741(2003)023[0032:athsot]2.0.co;2, 2003.
Wang, C., Dong, Z., Qin, X., Zhang, J., Du, W., and Wu, J.: Glacier meltwater runoff process analysis using δD and δ18O isotope and chemistry at the remote Laohugou glacier basin in western Qilian Mountains, China, J. Geogr. Sci., 26, 722–734, https://doi.org/10.1007/s11442-016-1295-y, 2016.
Wang, Y., Wang, L., Zhou, J., Yao, T., Yang, W., Zhong, X., Liu, R., Hu, Z., Luo, L., Ye, Q., Chen, N., and Ding, H.: Vanishing Glaciers at Southeast Tibetan Plateau Have Not Offset the Declining Runoff at Yarlung Zangbo, Geophys. Res. Lett., 48, e2021GL094651, https://doi.org/10.1029/2021gl094651, 2021.
Wolfe, B. B., Karst-Riddoch, T. L., Hall, R. I., Edwards, T. W. D., English, M. C., Palmini, R., McGowan, S., Leavitt, P. R., and Vardy, S. R.: Classification of hydrological regimes of northern floodplain basins (Peace–Athabasca Delta, Canada) from analysis of stable isotopes (δ18O, δ2H) and water chemistry, Hydrol. Process., 21, 151–168, https://doi.org/10.1002/hyp.6229, 2007.
Xi, X.: A Review of Water Isotopes in Atmospheric General Circulation Models: Recent Advances and Future Prospects, Int. J. Atmos. Sci., 2014, 1–16, https://doi.org/10.1155/2014/250920, 2014.
Xia, X., Li, S., Wang, F., Zhang, S., Fang, Y., Li, J., Michalski, G., and Zhang, L.: Triple oxygen isotopic evidence for atmospheric nitrate and its application in source identification for river systems in the Qinghai-Tibetan Plateau, Sci. Total Environ., 688, 270–280, https://doi.org/10.1016/j.scitotenv.2019.06.204, 2019.
Xu, R., Hu, H., Tian, F., Li, C., and Khan, M. Y. A.: Projected climate change impacts on future streamflow of the Yarlung Tsangpo-Brahmaputra River, Global Planet. Change, 175, 144–159, https://doi.org/10.1016/j.gloplacha.2019.01.012, 2019.
Yang, K. and He, J.: China meteorological forcing dataset (1979–2018), National Tibetan Plateau Data Center [data set], https://doi.org/10.11888/AtmosphericPhysics.tpe.249369.file, 2019.
Yde, J. C., Knudsen, N. T., Steffensen, J. P., Carrivick, J. L., Hasholt, B., Ingeman-Nielsen, T., Kronborg, C., Larsen, N. K., Mernild, S. H., Oerter, H., Roberts, D. H., and Russell, A. J.: Stable oxygen isotope variability in two contrasting glacier river catchments in Greenland, Hydrol. Earth Syst. Sci., 20, 1197–1210, https://doi.org/10.5194/hess-20-1197-2016, 2016.
Yoshimura, K., Kanamitsu, M., Noone, D., and Oki, T.: Historical isotope simulation using Reanalysis atmospheric data, J. Geophys. Res., 113, D19108, https://doi.org/10.1029/2008jd010074, 2008.
Zhang, F., Zhang, H. B., Hagen, S. C., Ye, M., Wang, D. B., Gui, D. W., Zeng, C., Tian, L. D., and Liu, J. S.: Snow cover and runoff modelling in a high mountain catchment with scarce data: effects of temperature and precipitation parameters, Hydrol. Process., 29, 52–65, https://doi.org/10.1002/hyp.10125, 2015.
Zhang, Z., Chen, X., Cheng, Q., and Soulsby, C.: Storage dynamics, hydrological connectivity and flux ages in a karst catchment: conceptual modelling using stable isotopes, Hydrol. Earth Syst. Sci., 23, 51–71, https://doi.org/10.5194/hess-23-51-2019, 2019.