the Creative Commons Attribution 4.0 License.
the Creative Commons Attribution 4.0 License.
 | 02 Aug 2022
A system dynamic model to quantify the impacts of water resources allocation on water–energy–food–society (WEFS) nexus
Yujie Zeng
Dedi Liu
Shenglian Guo
Lihua Xiong
Jiabo Yin
Zhenhui Wu
Sustainable management of the water–energy–food (WEF) nexus remains an urgent challenge, as interactions between WEF and human sensitivity and reservoir operation in the water system are typically neglected. This study proposes a new approach for modeling the WEF nexus by incorporating human sensitivity and reservoir operation into the system. The co-evolution behaviors of the nexus across water, energy, food, and society (WEFS) were simulated using the system dynamic model. Reservoir operation was simulated to determine the water supply for energy and food systems by the Interactive River–Aquifer Simulation water resources allocation model. Shortage rates for water, energy, and food resulting from the simulations were used to qualify their impacts on the WEFS nexus through environmental awareness in society. Human sensitivity indicated by environmental awareness can then adjust the co-evolution behaviors of the WEFS nexus through feedback loops. The proposed approach was applied to the mid–lower reaches of the Hanjiang River basin in China as a case study. Results indicate that environmental awareness shows the potential to capture human sensitivity to shortages from water, energy, and food systems. Parameters related to boundary conditions and critical values can dominate environmental awareness feedback to regulate socioeconomic expansion to maintain the integrated system from constant resource shortages. The annual average energy shortage rate thereby decreased from 17.16 % to 5.80 % by taking environmental awareness feedback, which contributes to the sustainability of the WEFS nexus. Rational water resources allocation can ensure water supply through reservoir operation. The annual average water shortage rate decreased from 15.89 % to 7.20 % as water resources allocation was considered. Threats from water shortage on the concordant development of the WEFS nexus are significantly alleviated, particularly for the area with a limited regulating capacity for the water project. Therefore, this study contributes to the understanding of interactions across the WEFS systems and helps in improving the efficiency of resource management.
- Article
(7644 KB) - Full-text XML
-
Supplement
(1220 KB) - BibTeX
- EndNote


Water, energy, and food are indispensable resources for the sustainable development of society. With the growing population, urbanization, globalization, and economic development, the expected global demands for water, food, and energy in 2030 will increase by 40 %, 50 %, and 50 %, respectively, compared to 2010 levels (Alexandratos and Bruinsma, 2012; McKinsey & Company, 2009; International Energy Agency, 2012). Resource scarcity will be exacerbated by the single-sector strategy in traditional water, energy, and food management (El Gafy et al., 2017). To increase resource use efficiency and benefits in production and consumption, taking the inextricable interactions among sectors across water, energy, and food into rational resource management has become an important strategy (Hsiao et al., 2007; Vörösmarty et al., 2000). Considering these interactions, the water–energy–food (WEF) nexus concept was first presented at the Bonn Conference in 2011 as an approach to determine synergies and tradeoffs between WEF sectors to support sustainable development goals (Hoff, 2011).
Various methods have been proposed for integrated systems to quantify the interactions in the WEF nexus. There are the following three main types of methods: system of systems model (Eusgeld et al., 2011; Housh et al., 2015), agent-based model (Bonabeau, 2002; Dawson et al., 2011), and system dynamic model (El Gafy, 2014; Swanson, 2002). The system of systems model comprises several subsystems as a holistic system to address the nexus by optimizing system behavior. The agent-based model simulates the interactions between agents and environments and different agents based on predefined rules obtained from long-term observations. These two methods have been established to be capable of simulating the behaviors of an integrated system. However, neither of them has emphasized feedback within the integrated systems, which is considered an important driving force for the nexus system (Chiang et al., 2004; Kleinmuntz, 1993; Makindeodusola and Marino, 1989). The results of these two methods for WEF security remain at risk. The system dynamic model explicitly focuses on feedback connections between key elements in a model to determine the co-evolution process and long-term characteristics of integrated systems (Liu, 2019; Simonovic, 2002). Therefore, the system dynamic model was adopted in this study to simulate the co-evolution process of the nexus system.
The system dynamic model has been widely used to analyze the WEF nexus worldwide at different spatial scales, such as global (Davies and Simonovic, 2010; Susnik, 2018), national (Laspidou et al., 2020; Linderhof et al., 2020), and basin scales (Purwanto et al., 2021; Ravar et al., 2020). Most of these models perform the accounting and analysis of the WEF nexus, focusing only on the physical process, while rarely highlighting the social process that indicates human responses to the WEF nexus (Elshafei et al., 2014). As the connection between the WEF nexus and society is intensified under rapid socioeconomic development, both physical and social processes should be considered for the sustainability of the integrated system in the future (Di Baldassarre et al., 2015, 2019).
To simultaneously capture the physical and social processes of the integrated system, human sensitivity was considered as a conceptual social state variable to identify environmental deterioration (Elshafei et al., 2014; Van Emmerik et al., 2014). Van Emmerik et al. (2014) developed a socio-hydrologic model to understand the competition for water resources between agricultural development and environmental health in the Murrumbidgee River basin (Australia). Li et al. (2019) developed an urban socio-hydrologic model to investigate future water sustainability from a holistic and dynamic perspective in Beijing (China). Feng et al. (2016) used environmental awareness to indicate a community's attitude to influencing the co-evolution behaviors of the water–power–environment nexus in the Hehuang region (China). These studies have contributed to effective resource management by incorporating both physical and social processes. However, potential threats to WEF security exist, as few of the current studies have simultaneously considered the impacts of reservoir operation in water system on the integrated system.
Reservoirs can adjust the uneven temporal and spatial distribution of available water resources and can ensure water supply to reduce water shortage (Khare et al., 2007; Liu et al., 2019; Zeng et al., 2021; He et al., 2022). However, the available water resources are typically adopted under historical natural water flow scenarios, while reservoirs are seldom considered, or their operational rules are significantly simplified in the WEF nexus. The assessment of water supply security based on the WEF nexus should be improved. Thus, additional details regarding the reservoir operation should be incorporated into the simulation of the WEF nexus.
The water resources allocation model can simultaneously incorporate reservoir operation and water acquisition, and it has become an effective tool to quantitatively assess the impacts of reservoir operation on water supply security and WEF security (Si et al., 2019; Zhou et al., 2019). Our study aims to establish a system dynamic model for the water–energy–food–society (WEFS) nexus and assess the impacts of reservoir operation on the WEFS nexus by integrating the water resources allocation model into the integrated system. The reminder of this paper is organized as follows: Sect. 2 introduces the framework for modeling the WEFS nexus and assessing the impacts of water resources allocation on the WEFS nexus. Section 3 describes the methodologies applied in the mid–lower reaches of the Hanjiang River basin in China, which is the study area. Section 4 presents the results of the co-evolution process and the sensitivity analysis of the WEFS nexus. The impacts of water resources allocation on the WEFS nexus have also been discussed. The conclusions of this study are presented in Sect. 5.
System dynamic modeling (SDM) simulates the dynamics among different systems using nonlinear ordinary differential equations and dynamic feedback loops (Wolstenholme and Coyle, 1983; Swanson, 2002). SDM has become an efficient approach to facilitate the integrated analysis of sectors, processes, and interrelations among different system variables (Di Baldassarre et al., 2015; Simonovic, 2002). The SDM for assessing the WEFS nexus comprises the following four modules (shown in Fig. 1): water system module, energy system module, food system module, and society system module.

In the water system module, socioeconomic water demand (i.e., municipal, rural, industrial, and agricultural water demand) and in-stream water demand are projected using the quota method and Tennant method (Tennant, 1976), respectively. The water demands and available water resources are further inputted into the water resources allocation model to determine the water supply and water shortage for every water use sector in each operational zone. The water supply for socioeconomic water use sectors and agricultural water shortage rates as outputs from the water system module are taken as the inputs of the energy system module and food system module to determine the energy consumption and food production, respectively. Considering the outputs of the energy and food system modules, the energy and food shortages can be estimated by comparing the planning energy availability and target food production, respectively. The function of the society module is to capture human sensitivity to degradation in the WEF nexus (Elshafei et al., 2014). Environmental awareness is considered as the conceptual social state variable to indicate human sensitivity (Van Emmerik et al., 2014). Environmental awareness is composed of water shortage awareness, energy shortage awareness, and food shortage awareness that are determined by shortages of water, energy, and food, respectively. As environmental awareness accumulates over its critical value, negative feedback on socioeconomic sectors (i.e., population, gross domestic product (GDP), and crop area) will be triggered to constrain the increases in water demand, together with further energy consumption, and food production to sustain the WEFS nexus.
2.1 Water system module
2.1.1 Water demand projection
A water user comprises a socioeconomic (also called off-stream) user and an in-stream user. Socioeconomic water users can be classified into municipal, rural, industrial, and agricultural sectors. The quota method has been considered an efficient approach to project the annual socioeconomic water demand (Brekke et al., 2002). The amount of water demand for the socioeconomic users can be estimated using Eq. (1).
where WD is the amount of water demand for the jth user in the ith operational zone in the tth year, WQ denotes the water use quota unit of a water user, is the amount of water units of a water user, and represents the utilization rate of a water user. The water quota units represent the amount of water consumption per capita for municipal and rural users, the amount of water consumption per 10 000 Yuan for industrial users, and the amount of net irrigation water per unit area for agricultural users, respectively. The number of water units represents the projected population for municipal and rural users, projected GDP for industrial users, and projected irrigated area for agricultural users.
As population, GDP, crop area, and water use quota are prerequisites for water demand projection, the dynamic equations for these socioeconomic variables should be predetermined. There are two types of methods which are popular in socioeconomic projection, i.e., the Malthusian (Bertalanffy, 1976; Malthus, 1798) and Logistic models (Law et al., 2003), which are adopted for the socioeconomic projection. The growth rate in the original Malthusian model is constant (Malthus, 1798), which is not consistent with the findings of previous studies that showed that the socioeconomic expansion in the future would slow down (He et al., 2017; Lin et al., 2016). Therefore, we used exponential terms to simulate the evolution of socioeconomic variables, which increases with a decreasing rate. And feedback functions and environmental carrying capacities (indicating the maximum socioeconomic size that can be carried by the system) of socioeconomic variables are adopted to constrain the evolution of these socioeconomic variables through Eqs. (2)–(4) (Feng et al., 2016; Hritonenko and Yatsenko, 1999). Socioeconomic factors in the original Logistic model (Law et al., 2003) are prone to approaching to their environmental carrying capacities, while the constraints among subsystems in WEFS nexus are typically neglected, which will lead to an oversized socioeconomic projection. Therefore, feedback functions taken as constraints from subsystems are adopted in Eqs. (5)–(7) (Li et al., 2019; Wu et al., 2022).
where Nt, Gt, and CAt are the population, GDP, and crop area in the tth year, respectively. Ncap, Gcap, and CAcap denote the environmental carrying capacities of population, GDP, and crop area, respectively. rP,0, rG,0, and rCA,0 represent the growth rates of population, GDP, and crop area from historical observed data, respectively. rP,t, rG,t, and rCA,t are the growth rates of population, GDP, and crop area in the tth year, respectively. , , and are used to depict the impacts of social development on the evolution of population, GDP, and crop area, respectively. E is environmental awareness, FA is food shortage awareness, and f1, f2, and f3 represent the feedback functions. The equations for E, FA, and the feedback functions are described in detail in Sect. 2.4 and 2.5.
Water use quotas are also assumed to decrease with the social development, owing to the expansion economy (Blanke et al., 2007; Hsiao et al., 2007). As the difficulties in saving water by technological advancement are increasing, the changing rate of the water use quota is decreasing in Eq. (8) (Feng et al., 2019).
where WQ denotes the water use quota of the jth water user in the ith operational zone in the tth year. rqwu,0 and rqwu,t are the growth rates of water use quotas from historical observed data and tth year, respectively. WQ is the minimum value of water use quotas, and is used to depict the water-saving effect of social development on the evolution of water use quota.
2.1.2 Water resources allocation
Based on water availability and projected water demand, available water resources can be deployed to every water use sector and in-stream water flows using a water resources allocation model. The Interactive River–Aquifer Simulation (IRAS) model is a rule-based water system simulation model developed by Cornell University (Loucks, 2002; Zeng et al., 2021; Matrosov et al., 2011). The year is divided into user-defined time steps, and each time step is broken into user-defined sub-time steps, based on which water resources allocation is being conducted. The IRAS model was adopted for water resources allocation owing to its flexibility and accuracy in water system simulations.
As the water system comprises water transfer, consumption, and loss components, it is typically delineated by a node network topology for the application of the water resources allocation model. Reservoir nodes and demand nodes are the most important elements in the node network topology, as they directly correspond to the processes of water supply, acquisition, and consumption. The water shortage at the demand node should first be determined based on its water demand and total water supply. The total water supply comprises natural water inflow (i.e., local water availability) and water supply from reservoir. In each sub-time step (except the first), the average natural water inflow in the previous sts-1 (sts is the current sub-time step) sub-time steps is estimated as the projected natural water inflow in the remaining sub-time steps using Eq. (9). The water shortage can then be determined by deducting the demand reduction, total real-time water inflow, and projected natural water inflow from water demand using Eq. (10). The total water shortage rate can then be determined using Eq. (11).
where ts is the current time step, Tsts denotes the total number of the sub-time steps, sts is the current sub-time step, WE represents the projected natural water inflow for the jth water use sector in the ith operational zone, WTSup is the total water supply, WRSup is the water supply from reservoir, WD is the water demand, fred is the demand reduction factor, WS is the water shortage, WS and WD are the total water shortage and water demand in the tth year, respectively, and WSRt is the total water shortage rate.
The water shortage at the demand node requires water release from the corresponding reservoir nodes according to their hydrological connections. The amount of water released from the reservoir depends on the water availability for demand-driven reservoirs and operational rules for supply-driven reservoirs, respectively. The water release for the supply-driven reservoir is linearly interpolated based on Fig. 2 and Eqs. (12)–(18). Additional details on the IRAS model can be found in Matrosov et al. (2011).
where t, t1, and t2 are the current time, initial time, and end time in the period, respectively. Pt denotes the ratio of the current time length to the period length. , , , , , and represent the maximum and minimum storages at the current time and beginning and ending of the period, respectively. , , , , , and denote the maximum and minimum releases, respectively. Pv is the ratio of current storage, and qt is the current release.

2.2 Energy system module
The energy system module focuses on the energy consumption during the water supply process for socioeconomic water users to further investigate the energy co-benefits of water resources allocation schemes (Zhao et al., 2020; Smith et al., 2016). Energy consumption for water heating and water end-use was not included in this study. Energy consumption is determined by the energy use quota and amount of water supply for the water use sectors (Smith et al., 2016). As energy use efficiency will be gradually improved with social development, the energy use quota is assumed to decrease with a decreasing rate. The trajectory of the energy use is formulated in Eq. (19). The water supply for water use sectors, derived from the water system module, is used to estimate energy consumption using Eq. (20). The energy shortage rate will be further determined with planning energy availability using Eq. (21).
where EQ is the energy use quotas of the jth water user in the ith operational zone in the tth year. re,0 and re,t denote the growth rates of energy use quotas from historical observed data and the tth year, respectively. EQ is the minimum value of energy use quotas. depicts the energy-saving effect of social development. ECt is the total energy consumption. WTSup is the total water supply of the jth water user in the ith operational zone, ESt and ESRt are the energy shortage and energy shortage rate, respectively, and PEAt is the planning energy availability.
2.3 Food system module
The food system module focuses on estimating the amount of food production. As water is a crucial determinant for crop yield, the agricultural water shortage rate can constrain the potential crop yield (French and Schultz, 1984; Lobell et al., 2009). Owing to the technological advancements in irrigation, the amount of potential crop yield is assumed to increase with a decreasing rate, as indicated by Eq. (22). With the target food production, which has considered the local and export food demands of the basin, the food shortage rate can then be estimated using Eqs. (23) and (24).
where CY is the potential crop yield of the jth crop in the ith operational zone in the tth year. rpro,0 and rpro,t are the growth rates of crop yields from historical observed data and the tth year, respectively. depicts the impacts of social development on the evolution of crop yield. FPt denotes the total food production, CA is the crop area, and WSR represents the water shortage rate of agriculture sector. FSt and FSRt are the food shortage and food shortage rate, respectively, and TFPt is the target food production.
2.4 Society system module
The society system module is deployed to simulate the social process of the integrated system. Environmental awareness and community sensitivity are two primary terms of social state variables in socio-hydrologic modeling that indicate the perceived level of threat to a community's quality of life (Roobavannan et al., 2018). Environmental awareness describes the societal perceptions of environmental degradation within the prevailing value systems (Feng et al., 2016, 2019; Roobavannan et al., 2018; Van Emmerik et al., 2014). Community sensitivity indicates people's attitudes towards not only the environmental control but also the environmental restoration (Chen et al., 2016; Elshafei et al., 2014; Roobavannan et al., 2018). As this study focuses on societal perceptions of environmental degradation, environmental awareness, based on the concept described in Van Emmerik et al. (2014), was adopted as the social state variable. As water, energy, and food systems are considered to be part of the environment in this study, environmental awareness is assumed to be determined by the shortage rates of water, energy, and food. Environmental awareness accumulates when the shortage rates of water, energy, and food exceed the given critical values but decreases otherwise. The dynamics of environmental awareness can be described by Eqs. (25)–(28).
where E, WA, EA, and FA are environmental awareness, water shortage awareness, energy shortage awareness, and food shortage awareness, respectively. WSR, ESR, and FSR denote the shortage rates of water, energy, and food, respectively, and WSRcrit, ESRcrit, and FSRcrit represent the corresponding critical values of shortage rates, above which environmental deterioration can be perceived. ηW, ηE and ηF are the perception factors describing the community's ability to identify threats of degradation, θW, θE, and θF are the auxiliary factors for environmental awareness accumulation, and ωW, ωE, and ωF denote the lapse factors that represent the decreasing rate of the shortage awareness of water, energy, and food, respectively.
2.5 Response links
Response links are used to link society and water system modules through feedback. Response links are driven by environmental awareness and food shortage awareness. The terms of feedback functions are based on the studies of Feng et al. (2019) and Van Emmerik et al. (2014), which have been established to have good performance and suitability, as they have been successfully applied to simulate the human response to environmental degradation in the Murrumbidgee River basin (Australia) and Hehuang region (China).
Environmental awareness increases with constant shortages in water, energy, and food. As environmental awareness accumulates above its critical value, negative feedback on socioeconomic factors is triggered (Fig. 1). The growth of population, GDP, and crop area will be constrained to alleviate the stress on the integrated system. Notably, positive feedback on the expansion of the crop area will be triggered to fill the food shortage as the food shortage awareness exceeds its critical value (Fig. 1). Although food shortage awareness is part of environmental awareness, the negative feedback driven by environmental awareness on crop area can only be triggered with the prerequisite that food shortage awareness is below its threshold value, as food production should first be assured. The response links deployed by assuming feedback functions are expressed in Eqs. (29)–(31).
where Ecrit and FAcrit are the critical values for environmental awareness and food shortage awareness, respectively. , , and denote the factors describing feedback capability from environmental awareness. is the factor describing the feedback capability from food shortage awareness, ζ1, ζ2, and represent the auxiliary factors for feedback functions driven by environmental awareness, and is the auxiliary factor for feedback functions driven by food shortage awareness.
3.1 Study area
The Hanjiang River is the longest tributary of the Yangtze River. The total area of the Hanjiang River basin is 159 000 km2, divided into upper and mid–lower reaches covering 95 200 and 63 800 km2, respectively (shown in Fig. 3). The Danjiangkou Reservoir is located at the upper boundary of the mid–lower reaches of the Hanjiang River basin (MLHRB) and serves as the water source for the middle route of the South–North water transfer project in China. Thus, the water availability in the MLHRB is remarkably affected by the reservoir operation. In terms of energy, as the population is large and the industry is developed in the MLHRB, the energy consumption for urban water supply is high. For agriculture, as the land is flat and fertile, the MLHRB is considered an important grain-producing area, occupying one of the nine major commodity grain bases in China (i.e., Jianghan Plain; Xu et al., 2019).
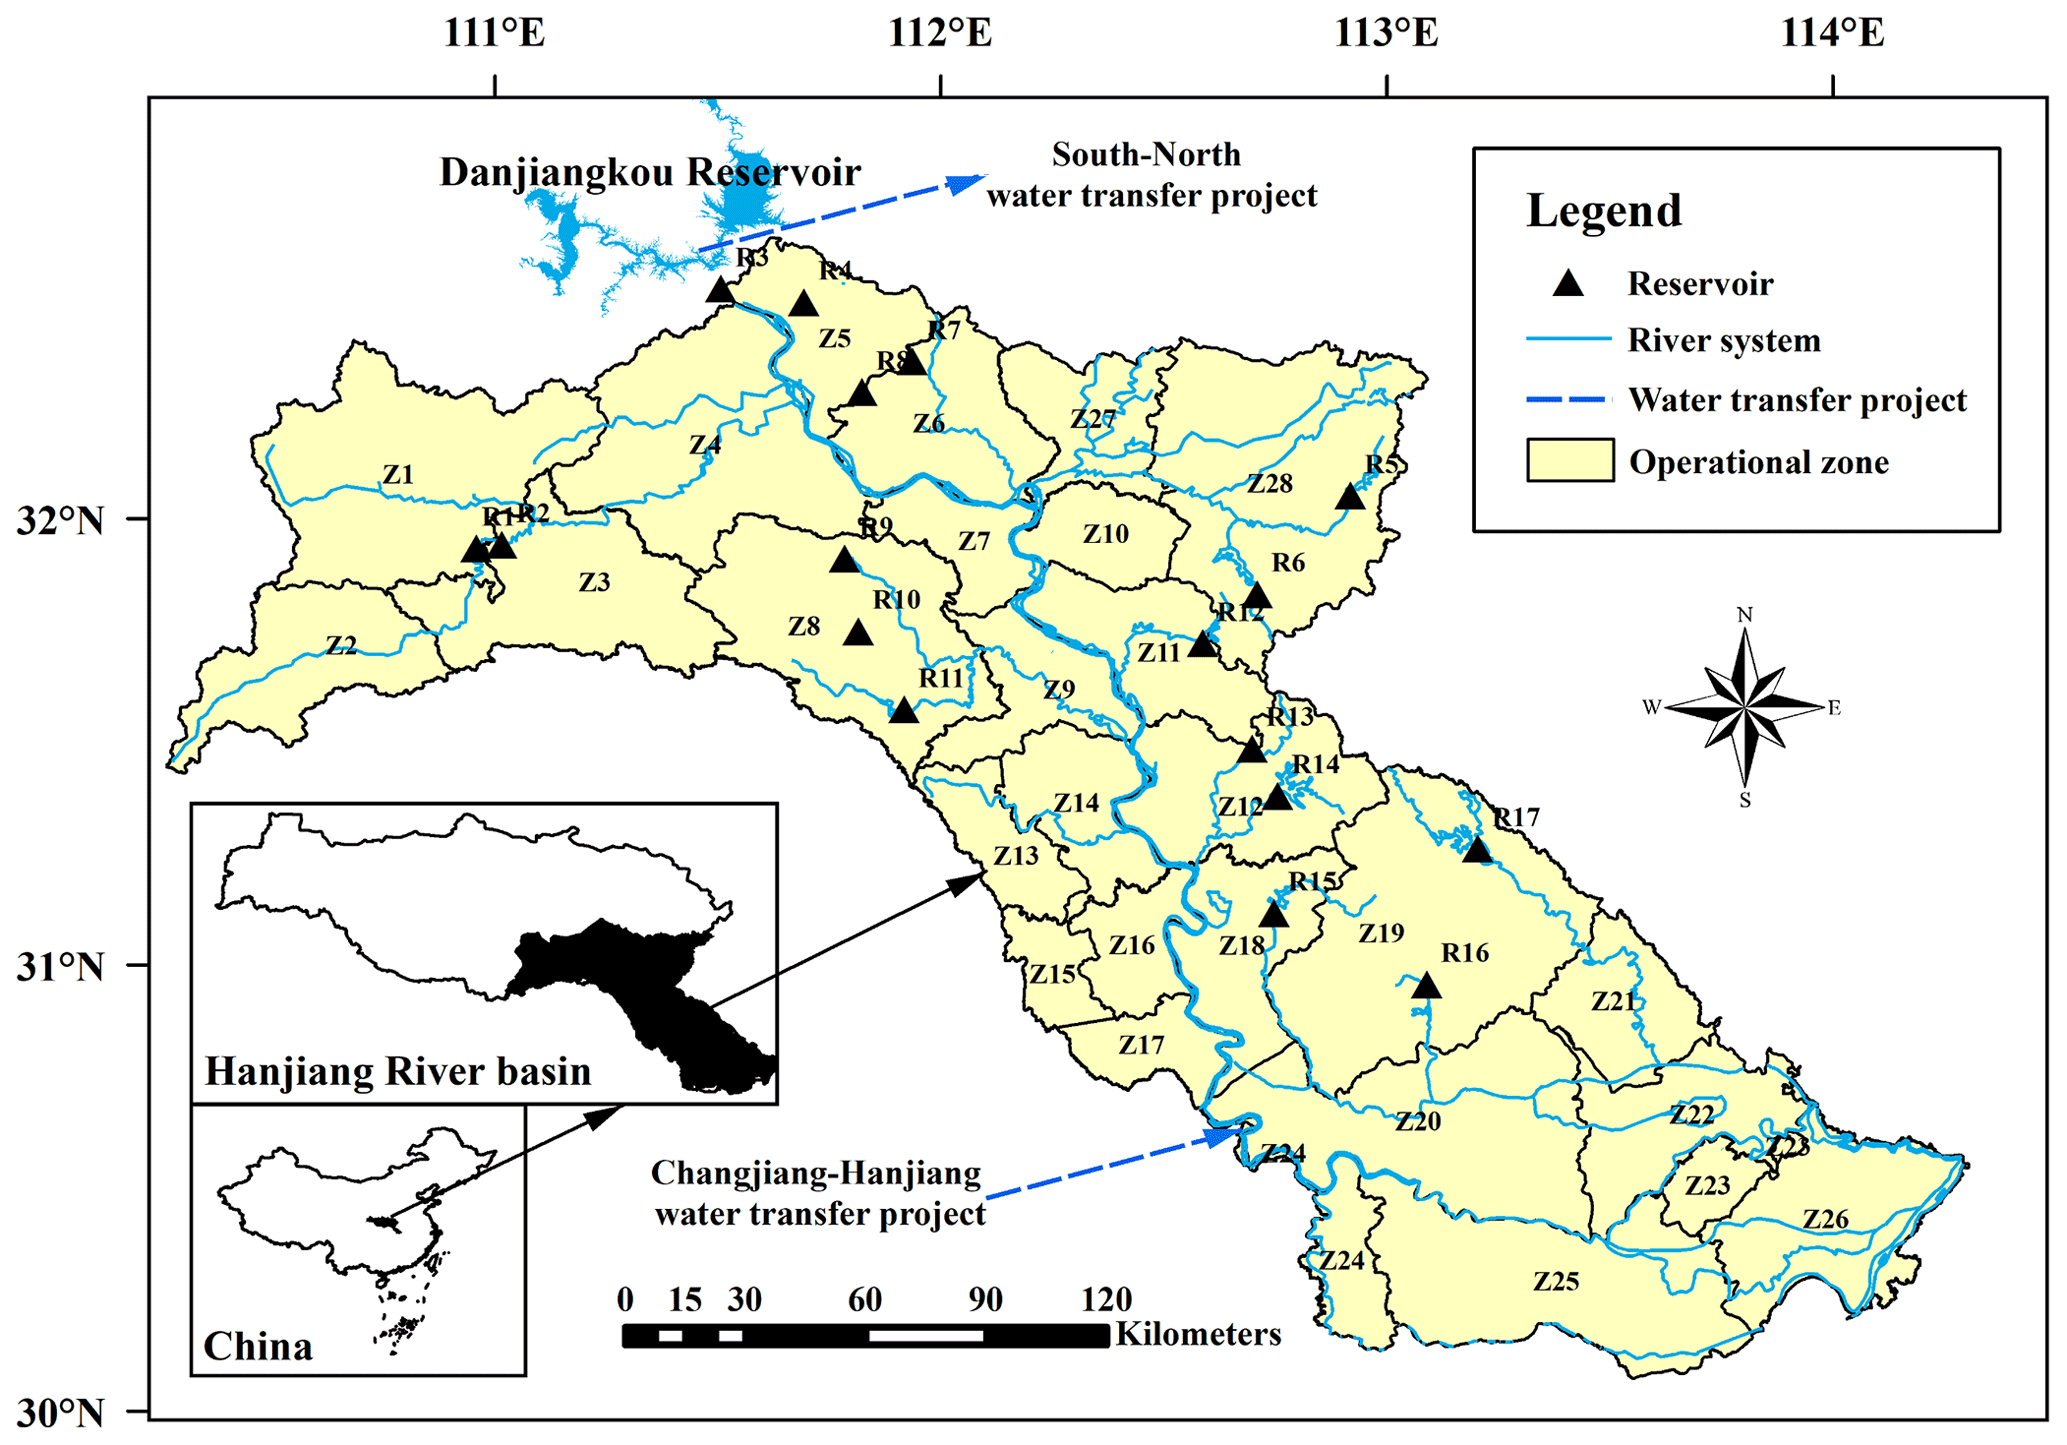
Figure 3Location of mid–lower reaches of the Hanjiang River basin.
However, owing to population expansion, rapid urbanization, and economic development, the local demand for water, energy, and food is increasing enormously (Zeng et al., 2021; Zhang et al., 2018). The competition between the increasing demand and limited resources will be intensified. Therefore, improving use efficiencies for water, energy, and food in MLHRB is urgent (Zhang et al., 2018; Liu et al., 2019). The strictest water resources control system for the water resources management policy, the total quantity control of the water consumed policy, and the energy-saving and emission reduction policy in China are implemented in the MLHRB to promote the expansion of resource-saving technology and further improve the resource use efficiencies in water, energy, and food systems. Therefore, the impacts of human activities on the WEF nexus should be assessed to sustain the collaborative development of the integrated system.
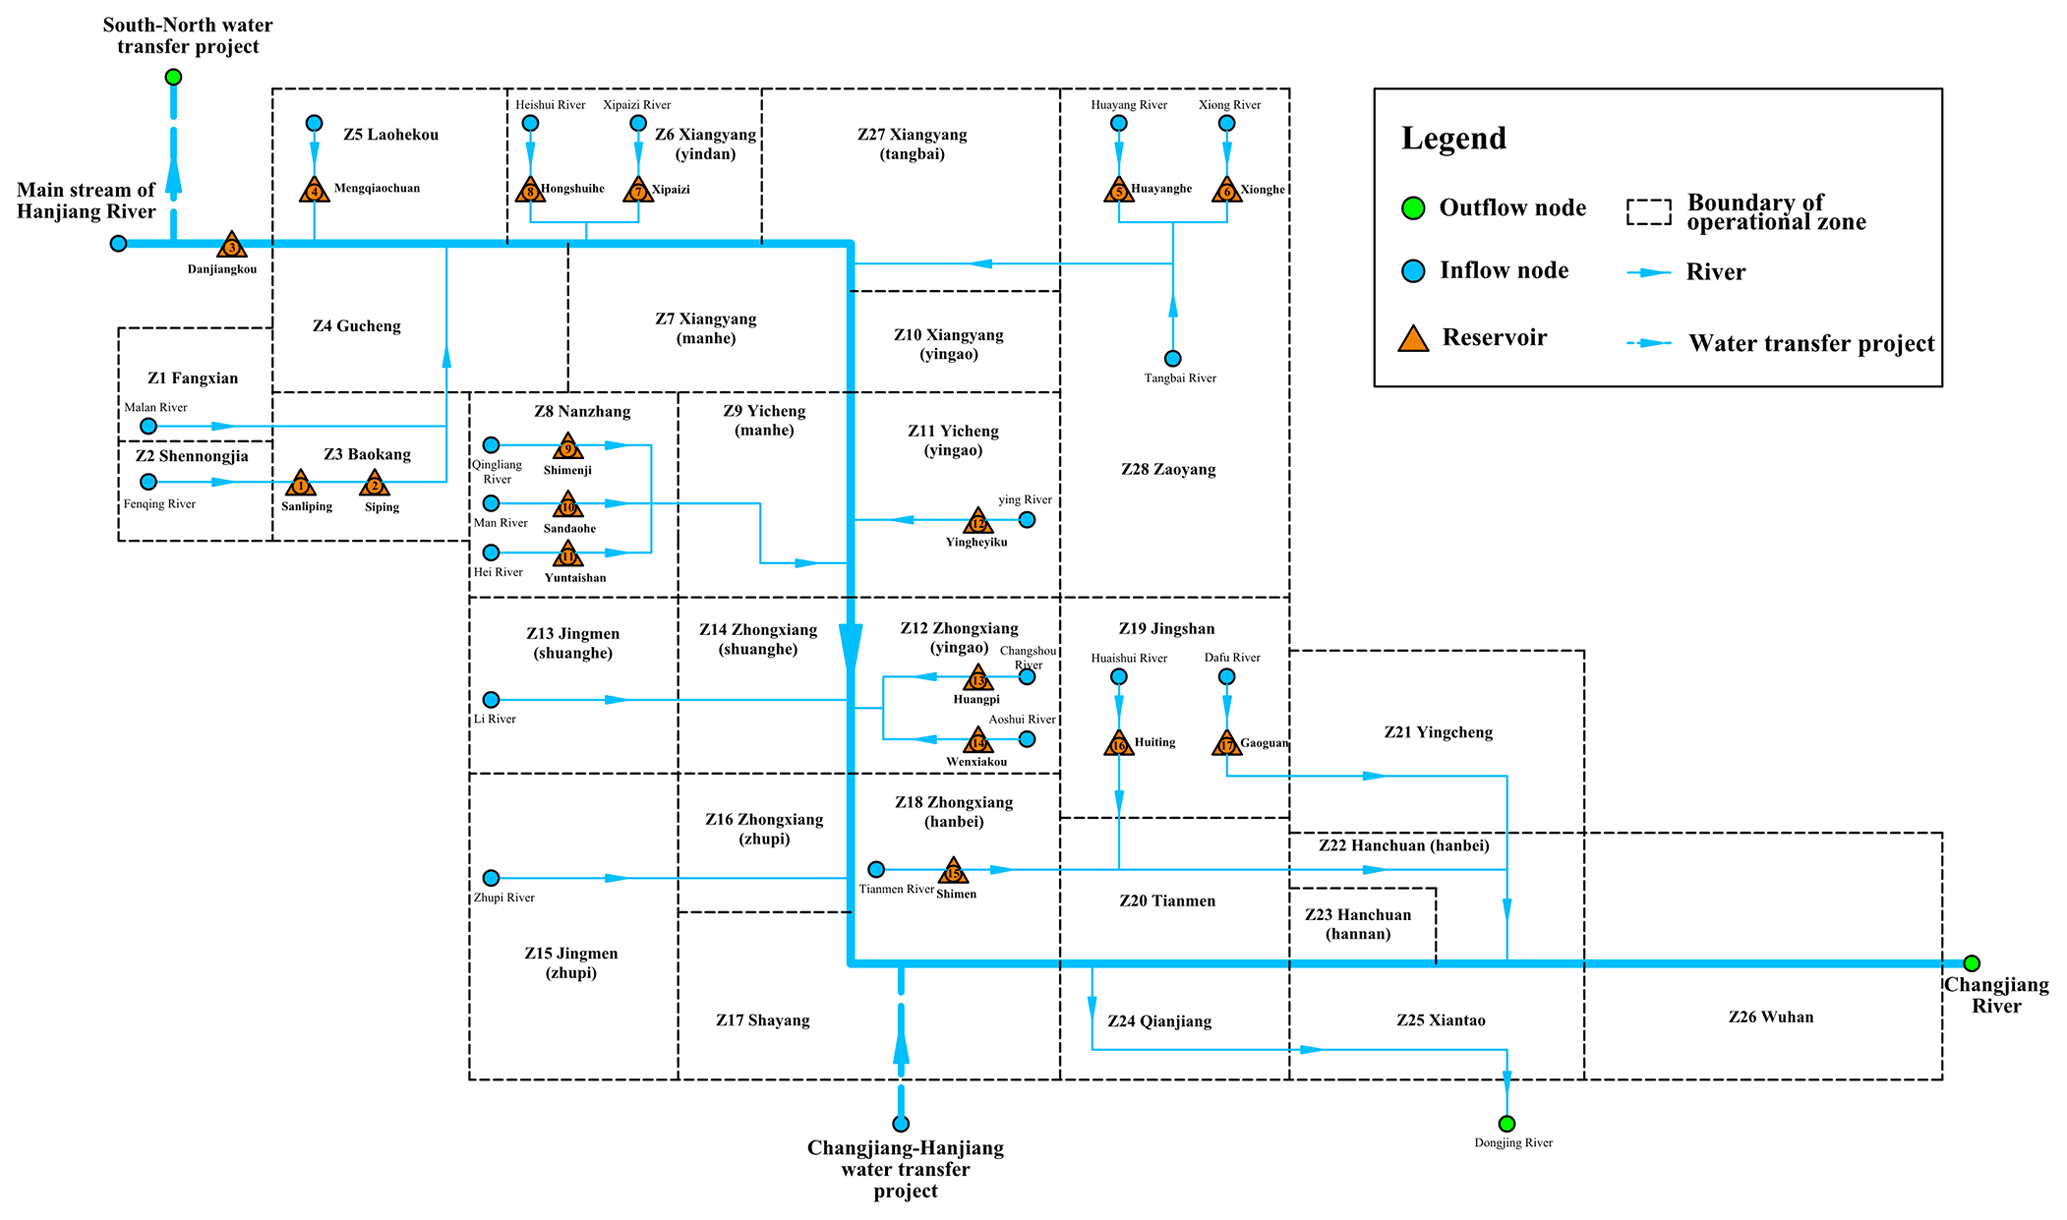
The socioeconomic data (i.e., population, GDP, and crop area) for water demand projection were collected based on administrative units, whereas the hydrological data were typically collected based on river basins. To ensure that the socioeconomic and hydrological data are consistent in operational zones, the study area was divided into 28 operational zones based on the superimposition of administrative units and sub-basins. A total of 17 existing medium or large size reservoirs (the total storage volume is 37.3 billion m3) were considered to regulate water flows. Based on the water connections between operational zones and river systems, the study area is shown in Fig. 4, including 2 water transfer projects (the South–North and Changjiang–Hanjiang water transfer projects), 17 reservoirs, and 28 operational zones.
3.2 Data sources
There are two main types of data, i.e., hydrological and socioeconomic data. The monthly historical discharge series of each operational zone and inflow of reservoirs from 1956 to 2016 were provided by the Changjiang Water Resources Commission (CWRC, 2016). The characteristics and operational rules of the 17 reservoirs listed in Table S1 in the Supplement were retrieved from the Hubei Provincial Department of Water Resources (HPDWR 2014). Socioeconomic data, including population, GDP, crop area, water use quota, energy use quota, and crop yield, during 2010–2019 were collected from the yearbooks of Hubei province, which can be obtained from the Statistical Database of China's Economic and Social Development (http://data.cnki.net/, last access: 1 August 2021). Notably, the agricultural water use quota was related to the annual effective precipitation frequency. Based on the precipitation frequency series during 1956–2016, four typical exceedance frequencies (i.e., P=50 %, 75 %, 90 %, and 95 %, which are related to the wet, normal, dry, extremely dry years) were adopted to simplify the agricultural water demand series. These historical data were further used to predict the future trajectories of the WEFS nexus.
Table 1Model initial condition setup.

a ECC indicates the environmental carrying capacity. b As the primary source of water supply for agricultural use in the study area is surface water, rather than groundwater, the energy consumption in the water supply process for agricultural water use is negligible, and the energy use quota for agricultural water use is set as 0.
The SDM was applied to the MLHRB. Specifically, water availability from 1956 to 2016 was adopted as the future water availability, while dynamic water demand was projected in water system module, both of which were inputted into water resources allocation model. As the water resources allocation model in the water system module took a monthly time step in the study (and the sub-time step was the default value of 1 d), the annual water supply and water shortage were first determined before being outputted to the energy system and food system modules, respectively. The annual shortage rates of water, energy, and food were then used to determine environmental awareness and extend the feedback. Table 1 lists the initial settings of the external variables for the integrated system. The co-evolutionary behaviors of the WEFS nexus were analyzed as follows: (1) the system dynamic model was calibrated using observed data, (2) co-evolution of the WEFS nexus was then interpreted and analyzed, (3) the impacts of environmental awareness feedback and water resources allocation on the WEFS nexus were discussed, and (4) sensitivity analysis for WEFS nexus was tested.
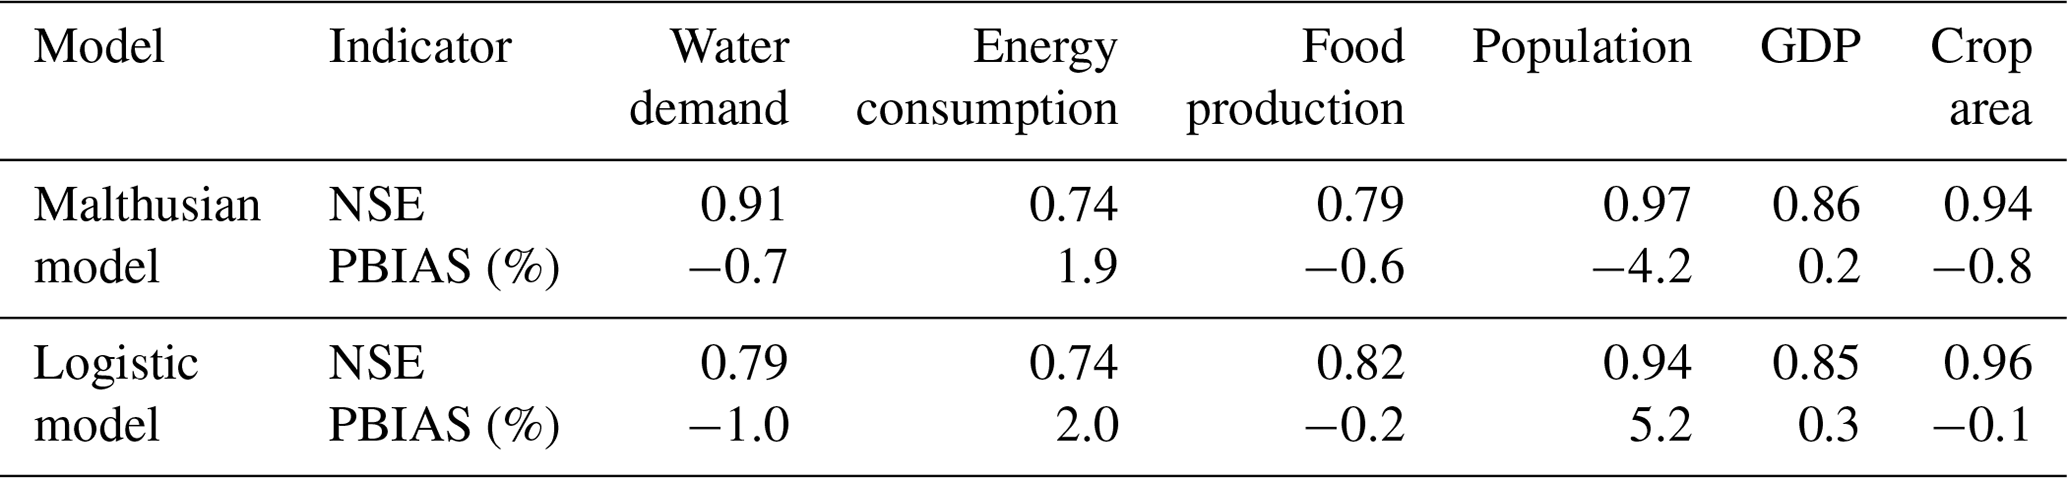
Table 2Nash–Sutcliffe efficiency (NSE) and percentage bias (PBIAS) of state variables.
4.1 Model calibration
As some parameters are adopted as auxiliary parameters which are not equipped with exactly physical definitions, there is no independent empirical data to calibrate them. Therefore, by reviewing previous studies (Feng et al., 2016, 2019; Van Emmerik et al., 2014) and expert knowledge, we evaluated the orders of magnitude and rational boundaries for these parameters. An initial parameter sensitivity analysis was then adopted to screen out the insensitive parameter, which provided 13 insensitive and 21 sensitive distinguishing parameters. As the insensitive parameters are not able to remarkably alter the system, the empirical values in previous studies (Feng et al., 2016, 2019) were adopted. The sensitivity parameters in the model were then calibrated based on the observed data, and the calibrated values are presented in Table S2. The Nash–Sutcliffe efficiency (NSE) coefficient and percentage bias (PBIAS; Krause et al., 2005; Nash and Sutcliffe, 1970) were used to calibrate the model. When the NSE was >0.7 and the absolute value of PBIAS was <15 %, the modeling performance was considered reliable. The simulated state variables, including annual water demand, energy consumption, food production, population, GDP, and crop area, were compared with their observed values during 2010–2019. As shown in Table 2, the NSEs range from 0.74 to 0.97, and the corresponding PBIASs are from −4.2 % to 5.2 %, indicating that both Malthusian and Logistic models can effectively fit the observed data of WEFS nexus.
It is worth noting that the observed data can only cover the initial phase of the WEFS nexus co-evolution. The environmental awareness stays at a low level, and the feedback is not triggered, which indicates that feedback driven by high-level environmental awareness has not been calibrated yet. However, as environmental awareness is a subjective variable, there are no empirical data to calibrate it, which requires more evidence to show the adaptive human response to environmental awareness. Hepburn et al. (2010) have reviewed studies on environmentally related human behavioral economics. Substantial studies indicate that environmental awareness is considered to be an important factor in modeling socioeconomic decisions and policies for water, energy, and food systems (Li et al., 2019, 2021; Lian et al., 2018; Rockson et al., 2013; Xiong et al., 2016). For instance, Xiong et al. (2016) investigated the evolution newspaper coverage of water issues in China based on water-related articles in a major national newspaper, People's Daily. They found that economic development was the primary target of China before 2000. With the conflict between water demand and supply being intensified, concerns about water security have arisen in the newspaper since 2000, which indicated that environmental awareness towards water shortage had emerged. Related policies (e.g., the strictest water resources control system for the water resources management policy in China) were thereby implemented to constrain the explosion in socioeconomic expansion and further ensure water security. Therefore, the established model still has the potential to simulate the co-evolution of the WEFS nexus.
4.2 Co-evolution of WEFS nexus
The calibrated system dynamic model was used to examine the properties of the integrated system by simulating the co-evolution of state variables in the WEFS nexus. Figure 5 shows the trajectories of population, GDP, crop area, water demand, energy consumption, food production, shortage rates for water, energy, and food, awareness of water shortage, energy shortage, and food shortage, and environmental awareness during 2010–2070.
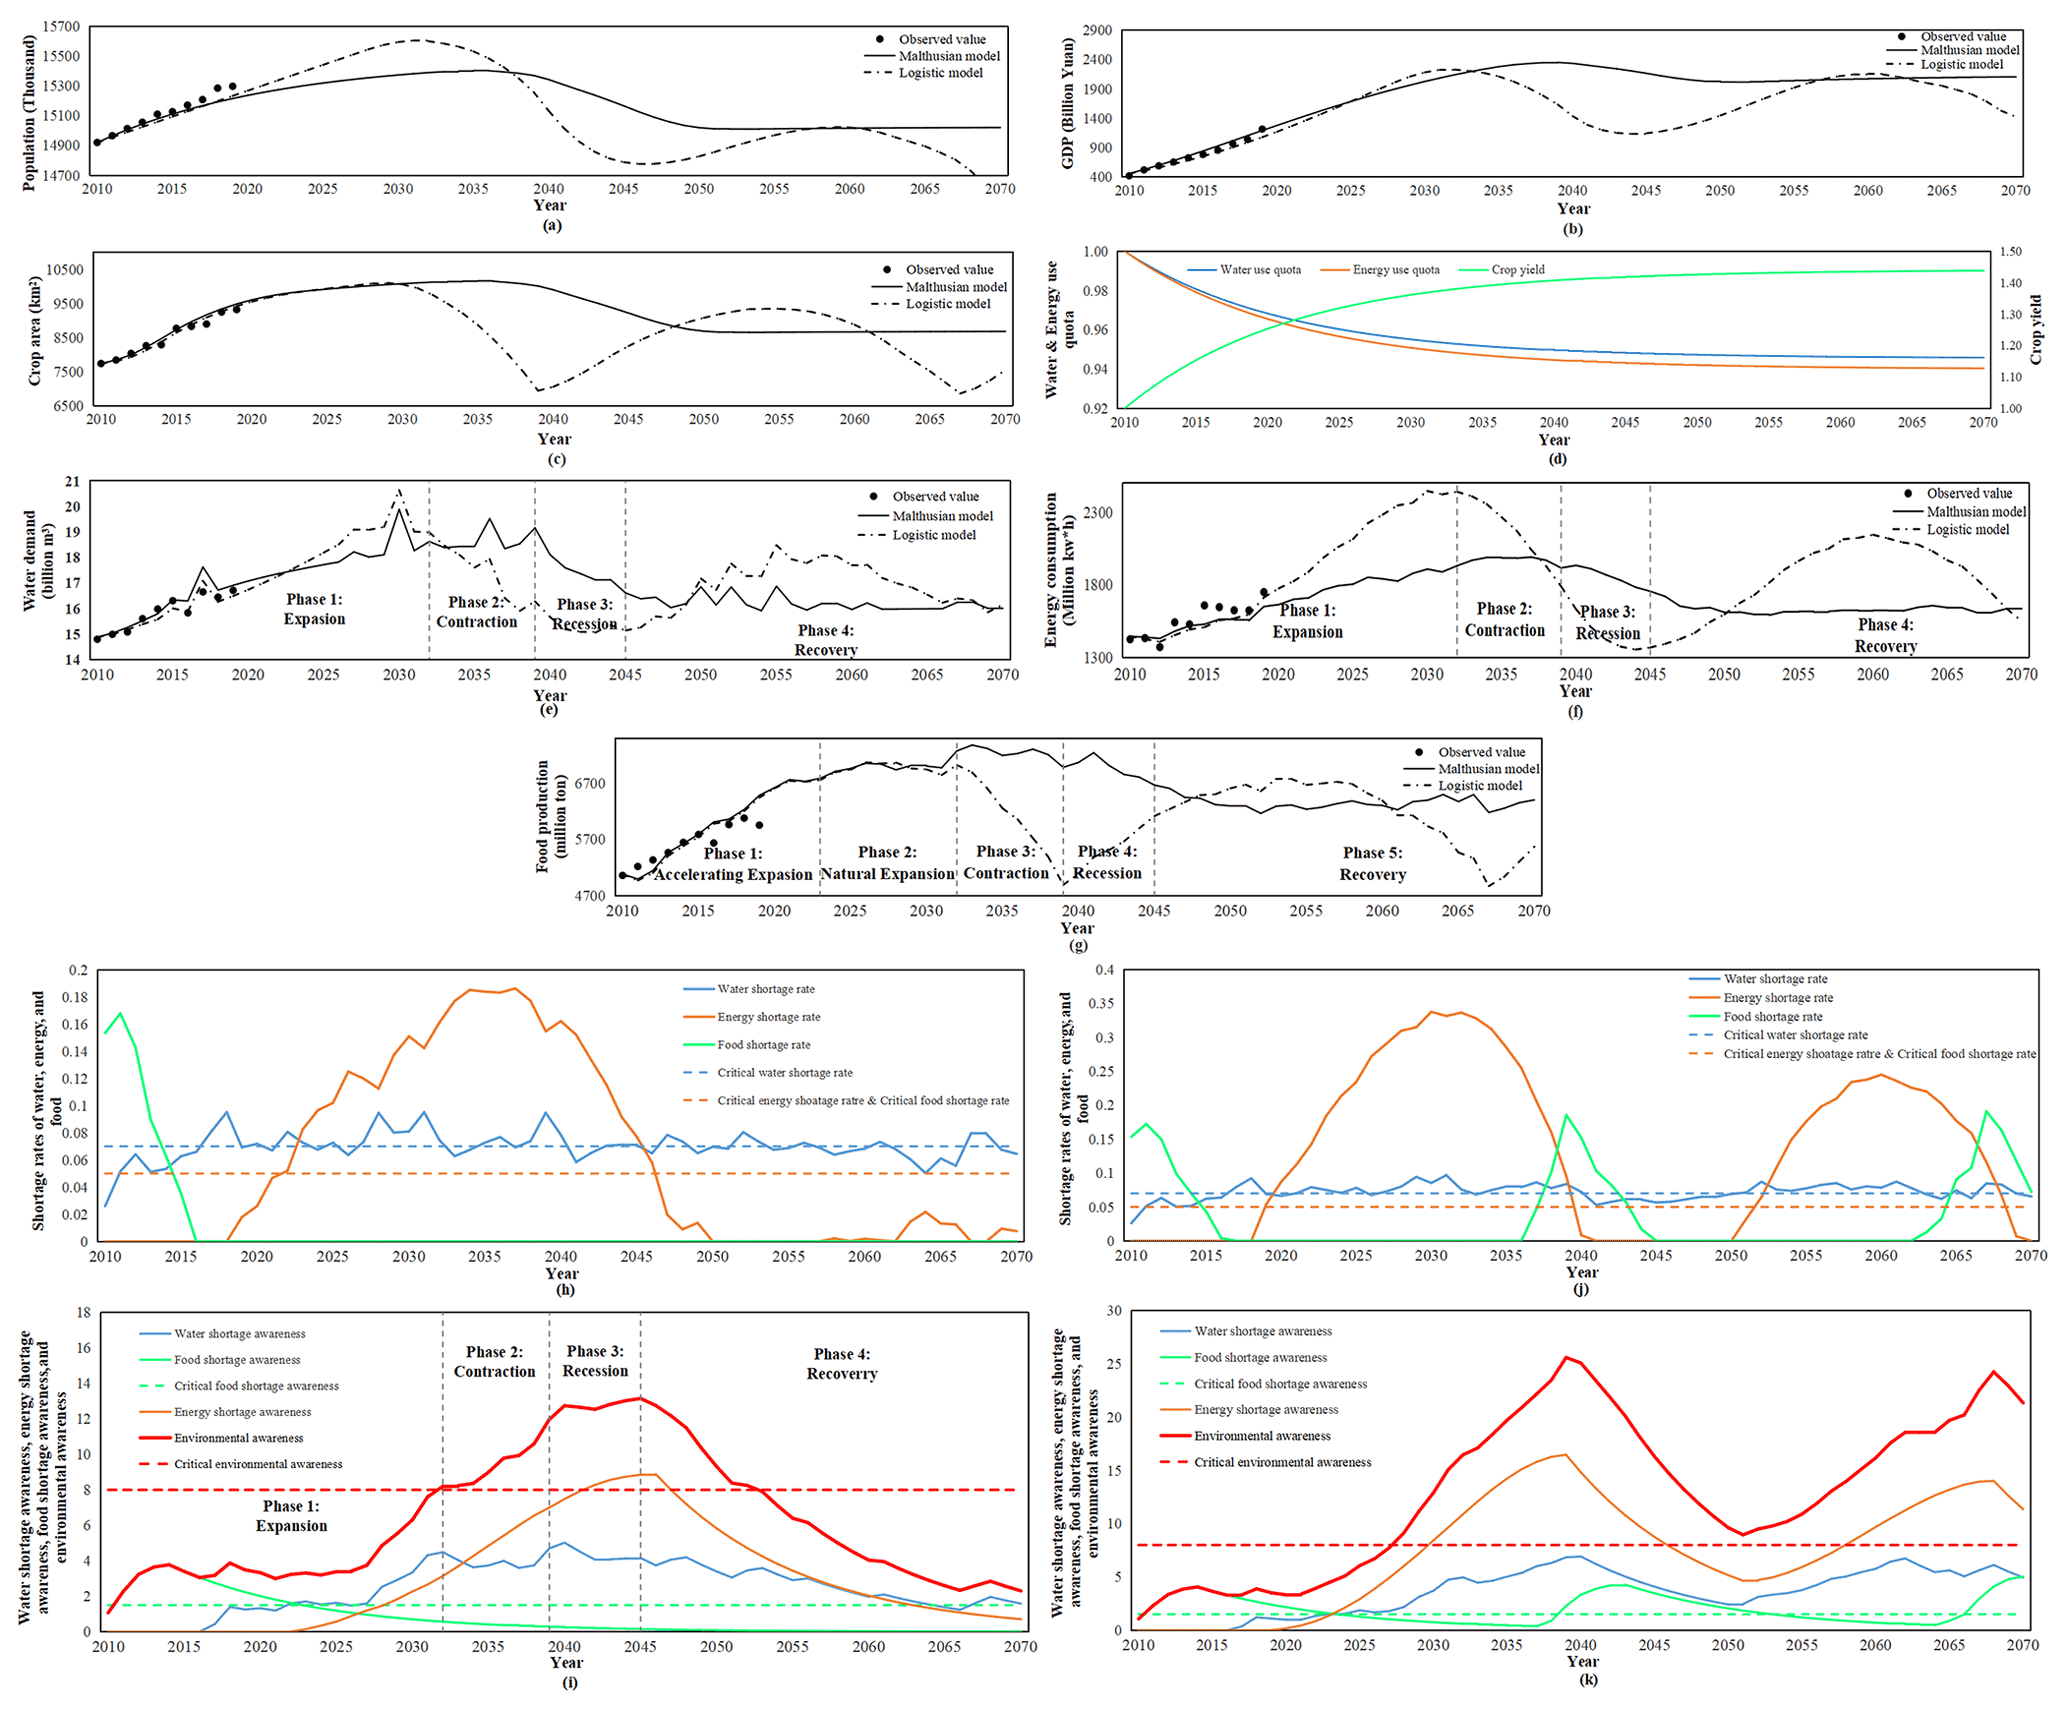
Figure 5Trajectories of state variables in WEFS nexus. (a) Population. (b) GDP. (c) Crop area. (d) Percentage variations (compared with initial values) of water use quota, energy use quota, and crop yield. (e) Water demand. (f) Energy consumption. (g) Food production. (h) Shortage rates of water, energy, and food in the Malthusian model. (i) Water shortage awareness, energy shortage awareness, food shortage awareness, and environmental awareness in the Malthusian model. (j) Shortage rates of water, energy, and food in the Logistic model. (k) Water shortage awareness, energy shortage awareness, food shortage awareness, and environmental awareness in the Logistic model.
Based on the trajectory of environmental awareness, the co-evolution processes of water demand and energy consumption in the Malthusian model were divided into four phases, namely expansion, contraction, recession, and recovery,which was consistent with the results in Feng et al. (2016) and Elshafei et al. (2014). Food production was divided into five phases based on the trajectory of food shortage awareness, i.e., accelerating expansion, natural expansion, contraction, recession, and recovery. The four phases in the co-evolution process for water demand and energy consumption can be interpreted as follows.
With environmental awareness below its critical value, the negative feedback on socioeconomic sectors is not triggered, and water demand – and energy consumption – increases rapidly, which is defined as the expansion phase (2010–2032). In the beginning of co-evolution, the water and energy demands can be satisfied by water and energy availability. The shortage rates of water and energy were typically below their critical values (Fig. 5h), and thus, shortage awareness of water and energy remained at a low level, as shown in Fig. 5i. Despite food shortages in the system in the beginning, the shortage rate of which was 0.153 and more than its critical value 0.05, the environmental awareness led by food shortage awareness was still within its critical value 8.0. Therefore, environmental awareness feedback was not triggered to constrain socioeconomic sectors, and water demand – and energy consumption – thereby keeps increasing.
As environmental awareness exceeds its critical value, negative feedback on socioeconomic sectors is triggered, and water demand and energy consumption is constrained, which is defined as the contraction phase (2033–2039). Although quotas for water use and energy use decreased (Fig. 5d) with technological advancement, water demand and energy consumption kept slowly increasing owing to the continuous socioeconomic expansion (Fig. 5a–c). Shortage rates of water and energy remained over their critical values (Fig. 5h and i), leading the increases in water shortage awareness and energy shortage awareness and further environmental awareness. Consequently, environmental awareness exceeded its critical value in 2033 and continued to increase. Negative feedback on socioeconomic sectors was triggered and strengthened. Water demand and energy consumption gradually increased with a decreasing rate and reached their maximum values of 19.2×10⁹ m3 and 1916×106 kw h, respectively, at the end of the contraction phase.
As environmental awareness accumulates to the maximum value, water demand, and energy consumption decrease significantly, which is defined as the recession phase (2040–2045). Environmental awareness feedback indeed constrained water demand and energy consumption, which decreased but still exceeded local water and energy carrying capacities. Therefore, as the shortage rates of water and energy continued to exceed their critical values (Fig. 5h), environmental awareness continued to accumulate and reached the maximum value of 13.2 at the end of the recession phase, thereby decreasing water demand and energy consumption.
As environmental awareness gradually decreases below its critical value, water demand and energy consumption decrease slightly and then tend to stabilize, which is defined as the recovery phase (2046–2070). With the continuous decline of socioeconomic sectors, water demand and energy consumption gradually decreased within their carrying capacities. The shortage rates of water and energy have then decreased to below their critical values since 2047, resulting in the decreases in water shortage awareness and energy shortage awareness (Fig. 5h and i). As the environmental awareness decreased below its critical value, negative feedback was removed, and the integrated system tended to stabilize.
The co-evolution process of food production can be interpreted in a similar way. It is worth noting that the accelerating expansion phase (2010–2022) is unique for food production. As the food production cannot satisfy the target value at the beginning of co-evolution, food shortages emerged and led to the increase in food shortage awareness (Fig. 5h and i). With food shortage awareness increasing over its critical value, positive feedback on crop area was triggered and further accelerated the increase of food production.
For the Logistic model, socioeconomic sectors kept increasing in the initial phase. The rapid socioeconomic expansion slowed down until the negative feedback driven by environmental awareness was triggered. With the increasing environmental awareness, a socioeconomic recession followed. Since the decreasing socioeconomic sectors were much lower than their environmental capacities, and feedback driven by environmental awareness was weakening, the variables began to increase again to approach to their environmental capacities, and they rolled in cycles.
One of the major differences between results of Malthusian model and Logistic model is that state variable evolution in Logistic model fluctuates remarkably and performs periodically. However, it is worth noting that the socioeconomic expansion in the future will slow down and tend to stabilize (He et al., 2017; Lin et al., 2016), the growth rate of which will thereby decrease as time goes. Moreover, the economic development in the study area is also expected to gradually grow and then remain stable according to the Integrated Water Resources Planning of Hanjiang River Basin (CWRC, 2016). As the periodic fluctuation for the WEFS nexus evolution through the Logistic model is not consistent with the slowed socioeconomic expansion in foreseeable future and cannot satisfy the planning in the study area, the Logistic model is not adopted. The Malthusian model can meet the demand mentioned above, which is thereby applied for further analysis of the WEFS nexus in our study.
4.3 Impacts of environmental awareness feedback and water resources allocation on the WEFS nexus
To determine the potential impacts of environmental awareness feedback and water resources allocation on the WEFS nexus, four scenarios were set, the description of which is provided in Table 3. The Ecrit and FAcrit under scenario II were set as 10 000 to ensure that the feedback cannot be triggered in the study, and the WSRcrit in scenarios III and IV were set as 0.15 to avoid the explosion of water shortage awareness. The other parameters in scenarios II, III, and IV were consistent with the calibrated values of scenario I, as listed in Table S2. Scenarios I and II and scenarios III and IV were used to investigate the impacts of environmental awareness feedback and water resources allocation on the WEFS nexus, respectively. The average annual values of water demand, energy consumption, food production, and shortage rates for water, energy, and food are listed in Table 4. Figure 6 shows the trajectories of key state variables of the integrated system, including water demand, energy consumption, food production, shortage rates for water, energy, and food, awareness of water, energy, and food shortages, and environmental awareness.
Table 3Scenario description for assessing the impacts of environmental awareness feedback and water resources allocation on the WEFS nexus.
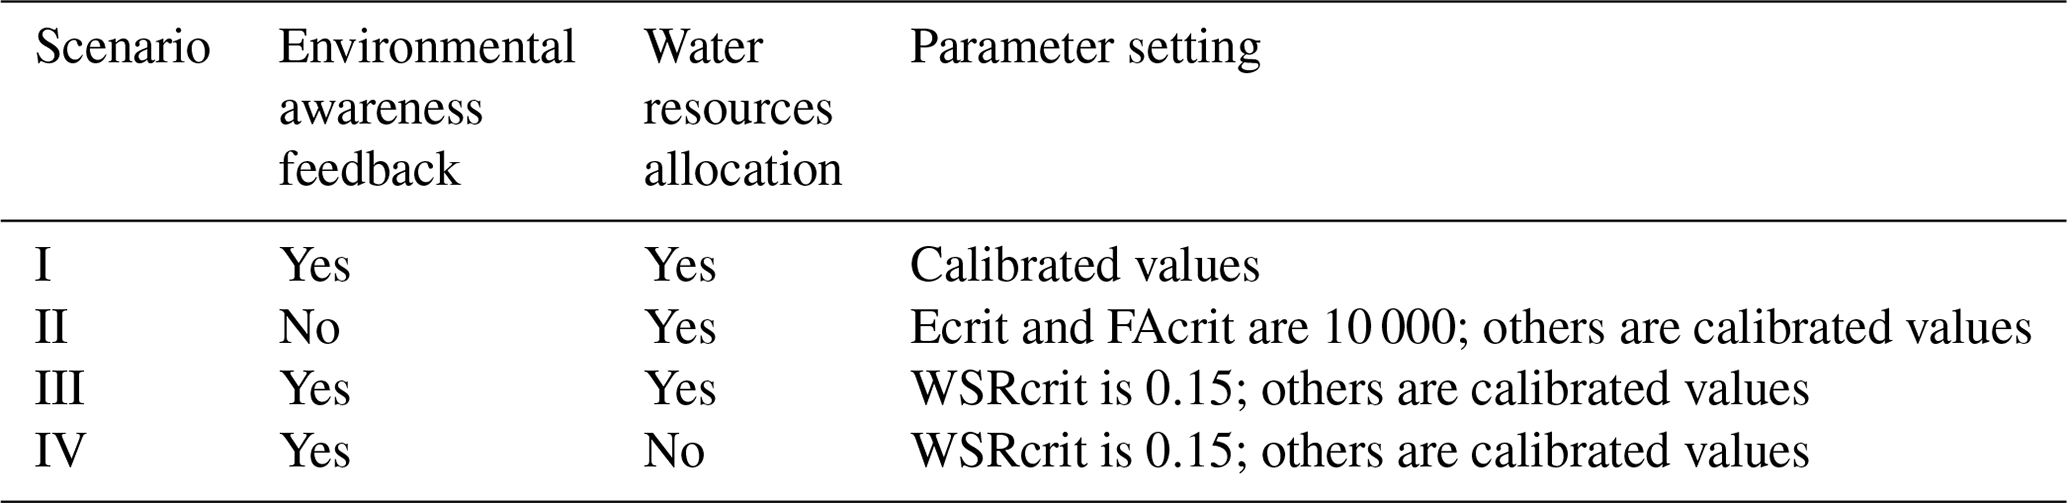
Table 4Average annual values for the state variables in the WEFS nexus.
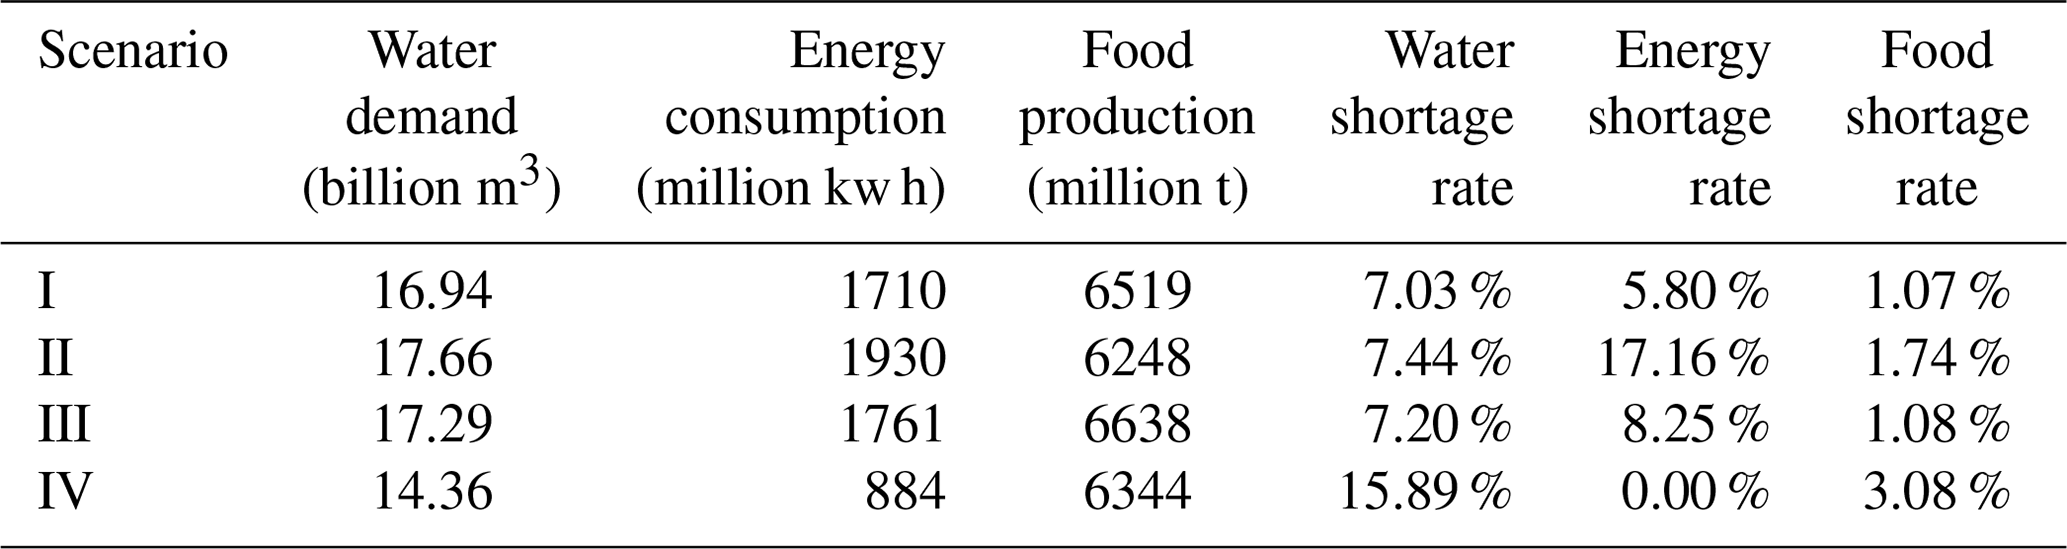
Table 5Water resources allocation results under scenarios III and IV (per million m3).
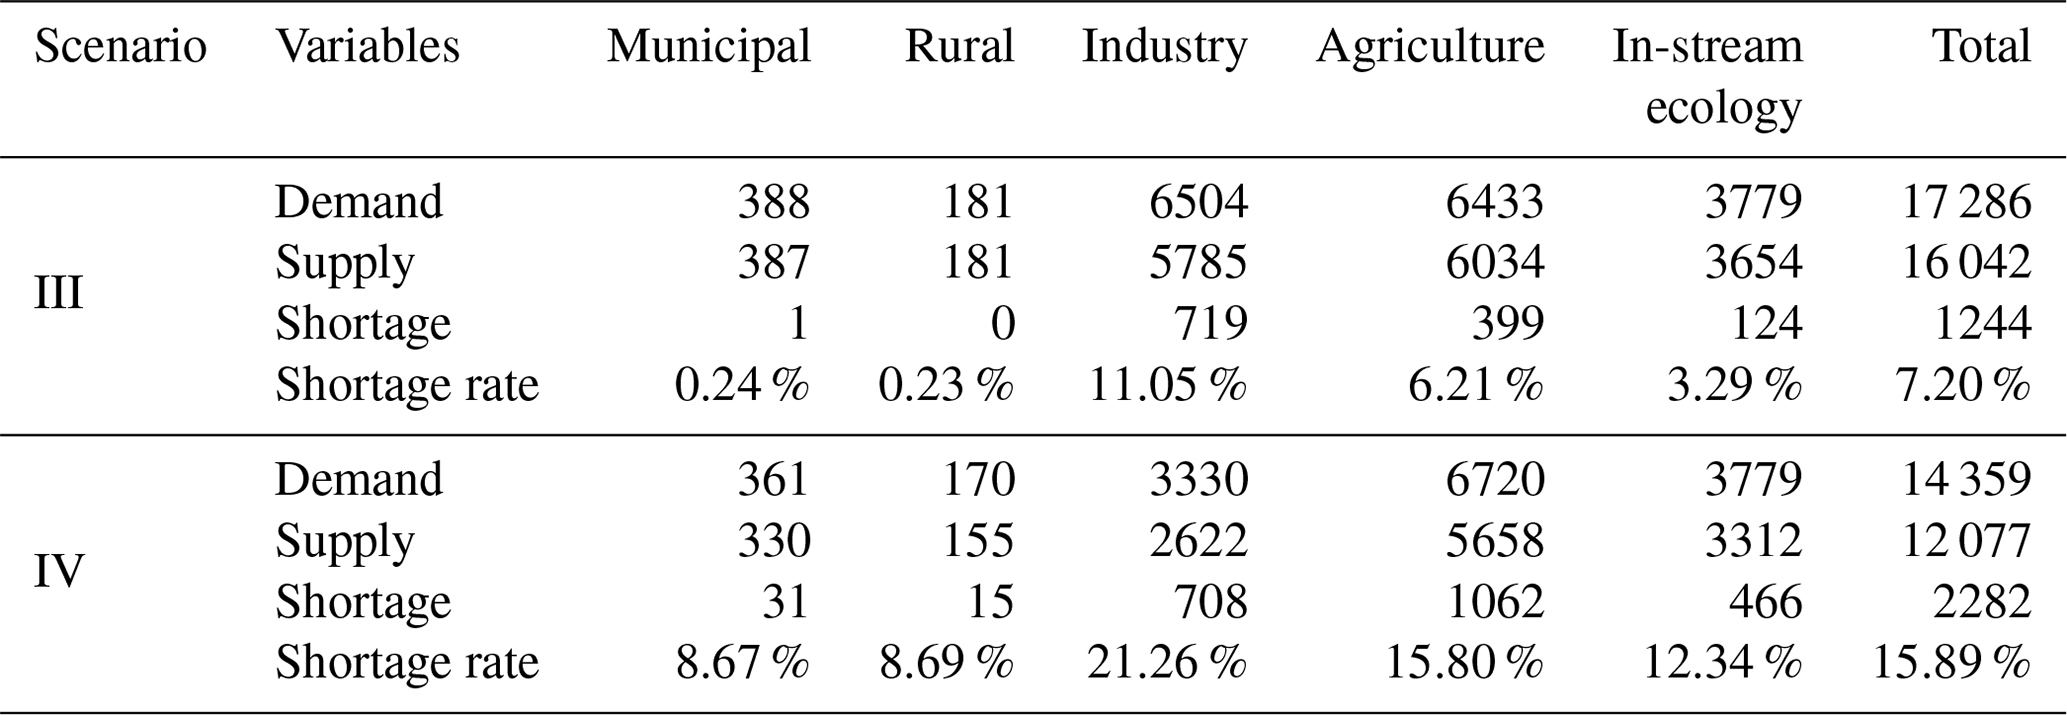
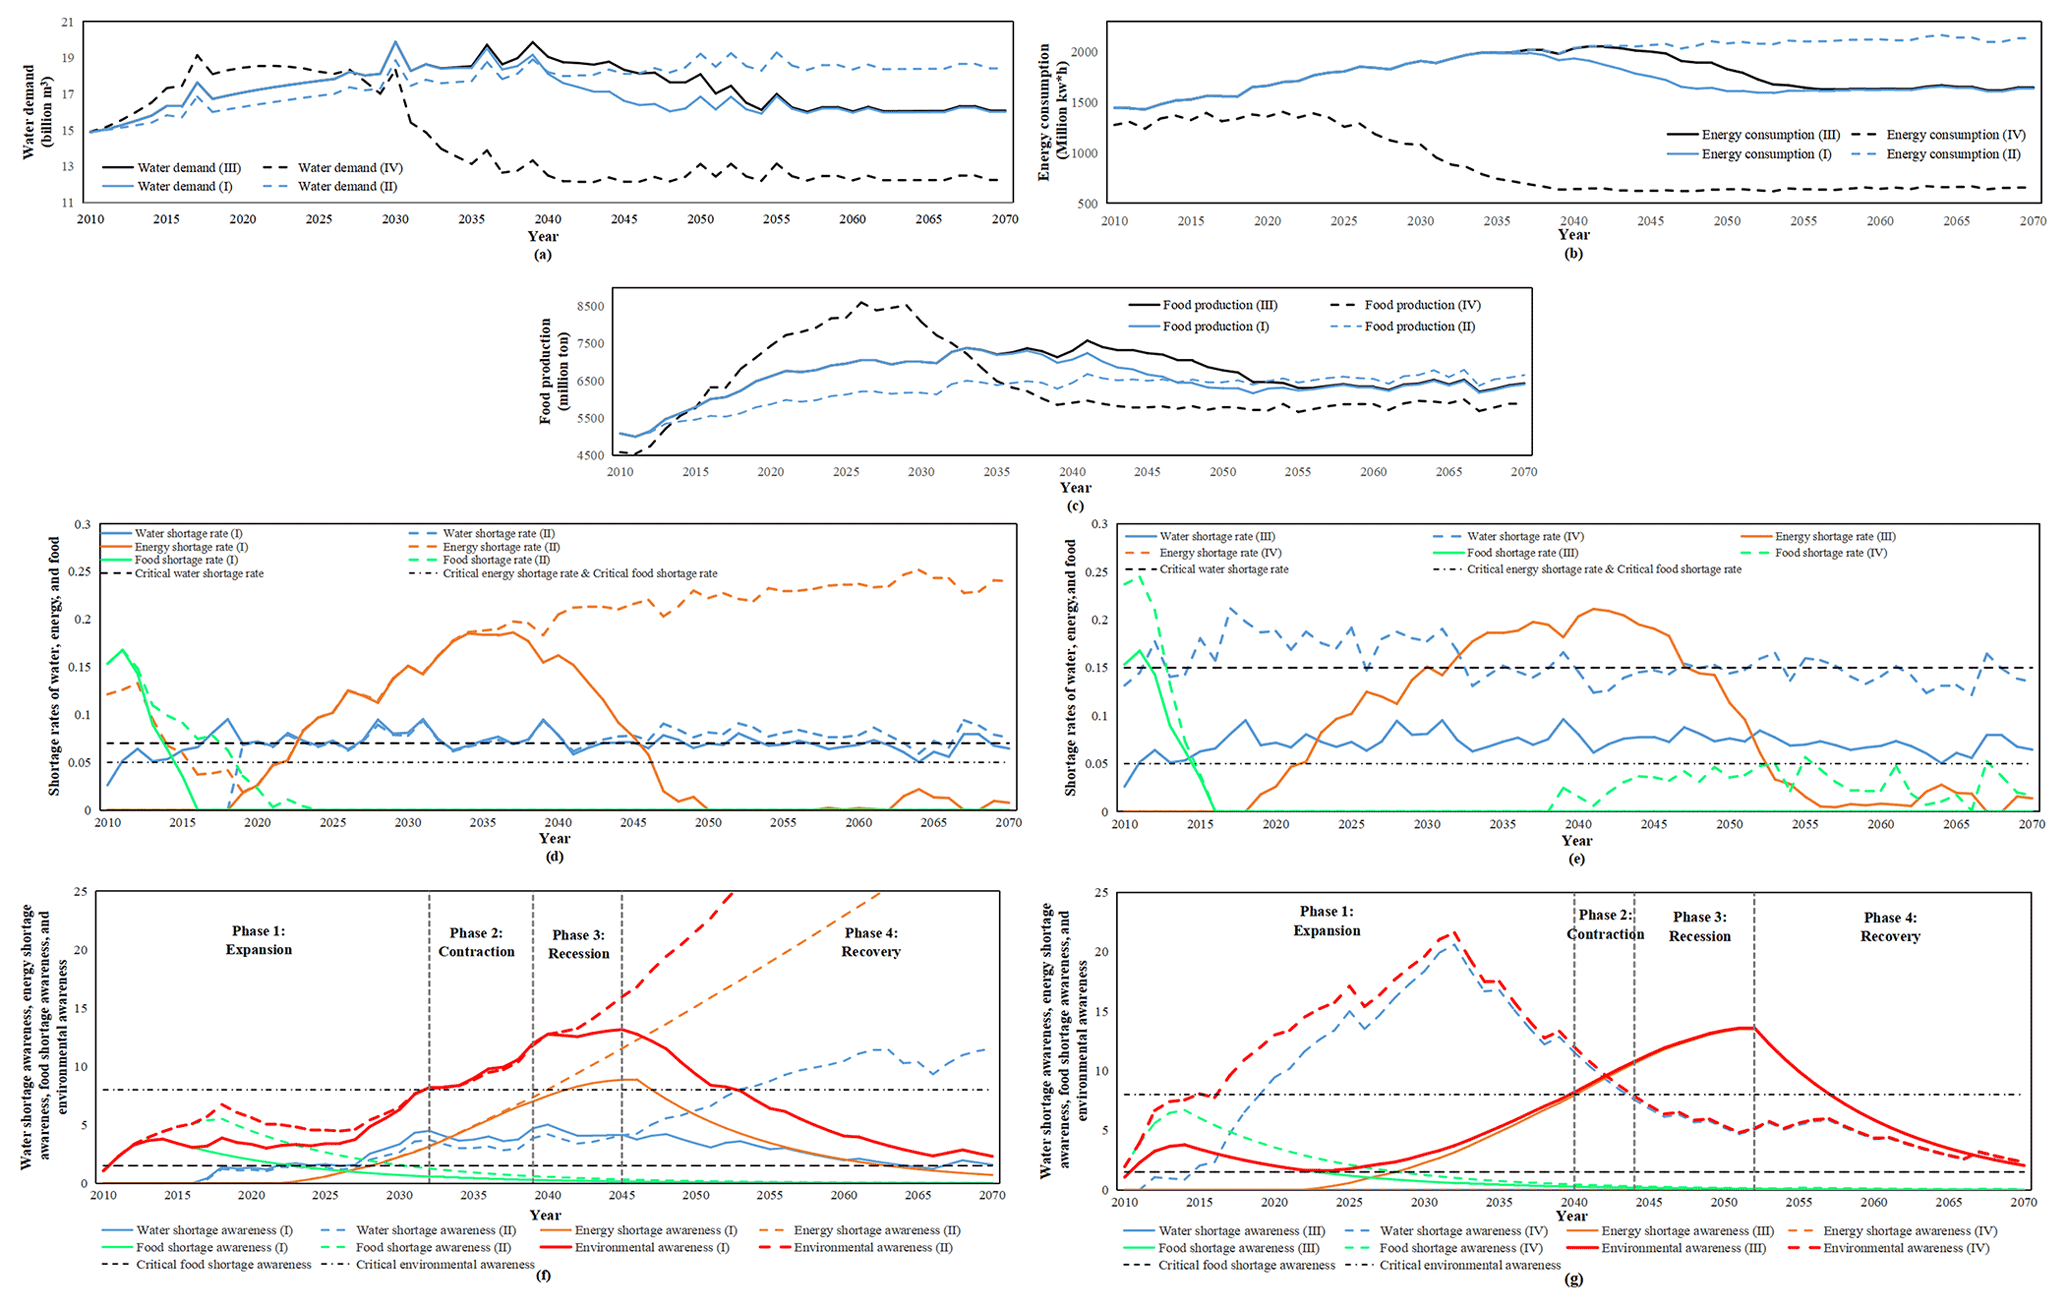
Figure 6Trajectories of state variables in WEFS nexus under scenarios I, II, III, and IV. (a) Water demand. (b) Energy consumption. (c) Food production. Panels (d) and (e) show the shortage rates of water, energy, and food. Panels (f) and (g) show water shortage awareness, energy shortage awareness, food shortage awareness, and environmental awareness.
4.3.1 WEFS nexus response to environmental awareness feedback
Environmental awareness indicates societal perceptions of resource shortages and is the driving factor of feedback on socioeconomic sectors. Both the average annual water demand and energy consumption increased from 16.94×10⁹ m3 and 1710×106 t under scenario II to 17.66×10⁹ m3 and 1930×106 t under scenario II, respectively, as environmental awareness feedback was removed, whereas the food production decreased slightly, from 6519 to 6248×106 t. Specifically, owing to high food shortages in the accelerating expansion phase of food production, the positive feedback on crop areas was triggered by food shortage awareness to accelerate the increase in crop area. Food production was thus evidently larger when feedback was considered in Fig. 6c. Food shortage was then alleviated, and the average shortage rate decreased from 1.74 % to 1.07 %. The increasing crop area, meanwhile, led to an increase in agricultural water demand (Fig. 6a). However, as the increasing water demand remained within the carrying capacity, little difference in the water shortage rate existed between scenarios I and II (i.e., 7.03 % and 7.44 %, respectively). As the water supply was efficiently ensured, the impacts on urban water supply and the corresponding energy consumption were negligible. As water demand and energy consumption increased rapidly in the expansion phase, environmental awareness increased remarkably owing to the constant water and energy shortages, as shown in Fig. 6d and f. Negative feedback was triggered to constrain the socioeconomic expansion. Compared with scenario II, water demand and energy consumption decreased remarkably under scenario I. The stress on water and energy supplies was thus relieved, particularly for the energy system, the shortage rate of which decreased from 17.16 % to 5.80 %. Therefore, environmental awareness can efficiently capture resource shortages and regulate the pace of socioeconomic expansion through feedback, which can maintain the integrated system from constant resource shortages to sustain the concordant development of the WEFS nexus.
4.3.2 WEFS nexus response to water resources allocation
Water is considered the major driving factor for the WEFS nexus. Rational water resources management plays an important role in the sustainable development of the WEFS nexus. Water resources allocation can regulate the water flow by reservoir operation, which is considered one of the most effective tools for water resources management. Based on the Integrated Water Resources Planning of Hanjiang River Basin (CWRC, 2016), domesticity and ecology water uses should be ensured first. The priorities for water use from high to low are municipal and rural domesticity, in-stream ecology, and industrial and agricultural sectors, respectively. The average annual water demand, supply, and shortage under scenarios III and IV are listed in Table 5.
Despite the increase in water demand from 14 359 to 17 286×106 m3 under scenario III, the water supply also increased from 12 077 to 16 042×106 m3. The total water shortage rate decreased from 15.89 % to 7.20 % owing to rational water resources allocation. As more available water resources can be stored in the flood season and then released in the dry season through reservoir operation, the uneven temporal and spatial distributions of available water resources were remarkably relieved, thereby increasing the water supply insurance. For water use sectors, water shortages were primarily found in industrial and agricultural sectors (719 and 399×106 m3, respectively), and other sectors can be satisfied under scenario III. Water shortages became more serious under scenario IV, as the water shortage rates of these five sectors increased significantly in Table 5, from 0.24 %, 0.23 %, 11.05 %, 6.21 %, and 3.29 % to 8.67 %, 8.69 %, 21.26 %, 15.80 %, and 12.34 %, respectively. To analyze the spatial distribution of water shortage rates, Fig. 7 shows the water shortage rate in each operational zone under scenarios III and IV. The water shortage rates of the study area under scenario IV than those under scenario III, were evidently higher particularly for the operational zones located at the basin boundaries (e.g., operational zones Z1, Z2, Z8, Z12, Z13, Z21, and so on). As the boundary zones are far away from the mainstream of the Hanjiang River, and their local water availability is unevenly distributed, the regulating capacity of the water system is limited and is not sufficiently strong to ensure the water supply.
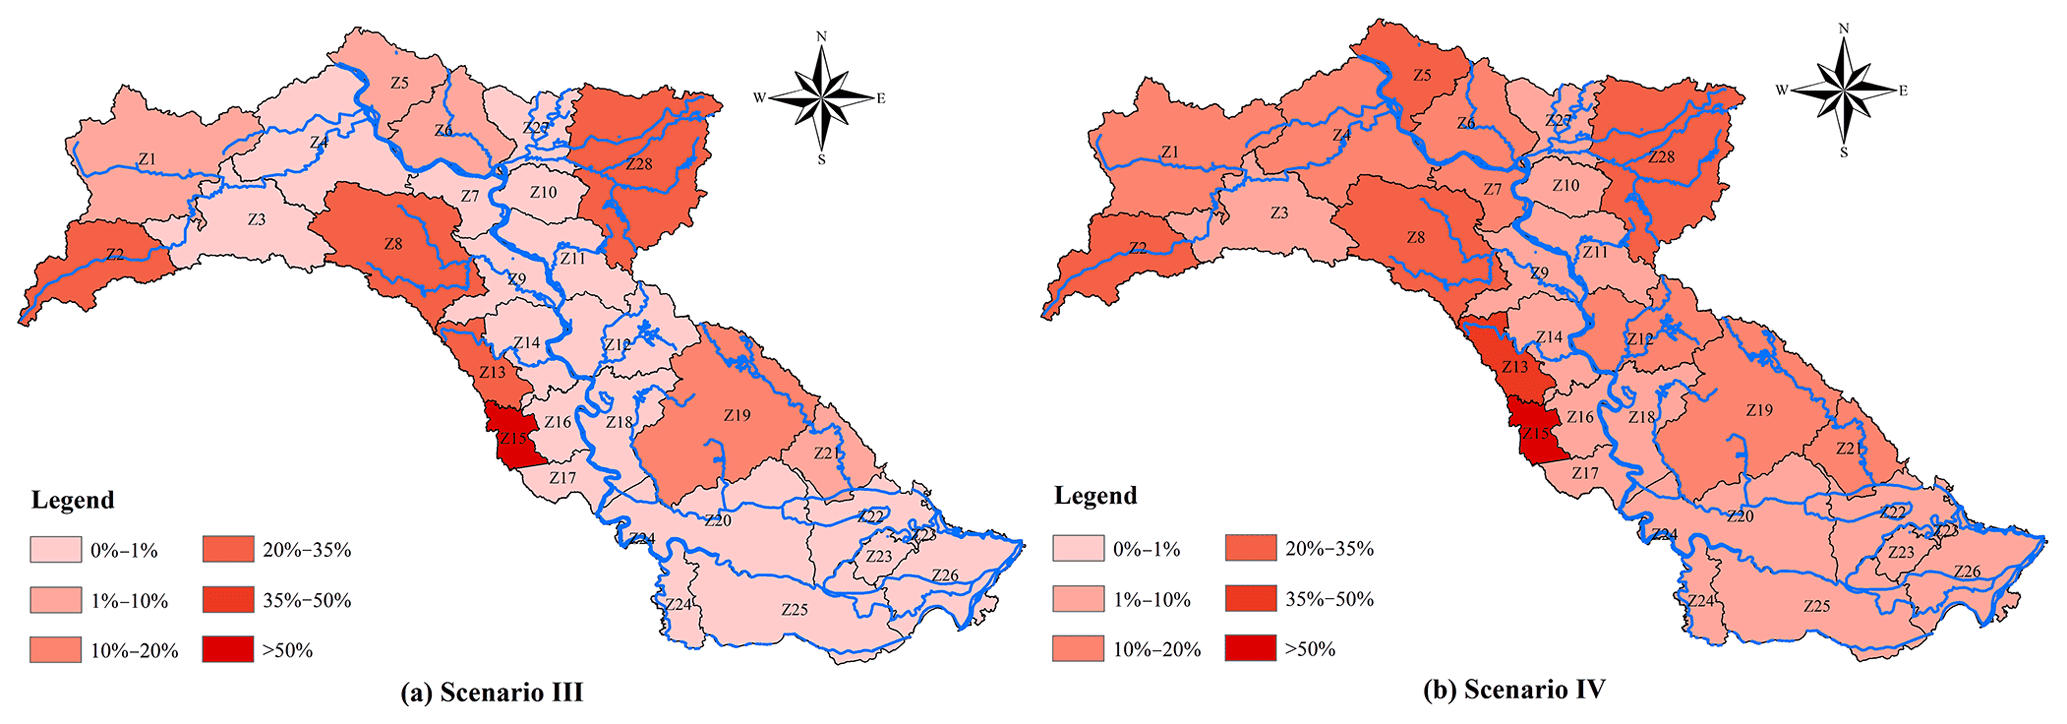
Figure 7Distribution of water shortage rates.
For the co-evolution of WEFS nexus, a remarkable decrease in the average annual water demand and energy consumption was observed as the water resources allocation was removed from 17.29×10⁹ m3 and 1761×106 t under scenario III to 14.36×10⁹ m3 and 884×106 t under scenario IV, while the food production also decreased slightly from 6638 to 6344×106 t. Under scenario IV, without considering the water resources allocation, the average water shortage rate was 15.89 %, exceeding the critical value. Water shortage awareness continued to accumulate (Fig. 6g). As the water supply could not be effectively ensured and remained at a low level, the energy consumption for urban water supply was small and always within its planning value. No energy shortage awareness was accumulated at the beginning of the co-evolution shown in Fig. 6g. Meanwhile, as the agricultural water demand cannot be ensured, food production was also lowered (Fig. 6c). Higher food shortages then led to higher food shortage awareness (Fig. 6e and g). Thus, positive feedback to increase the crop area was strengthened. As observed in Fig. 6a and c, the water demand increased slightly and food production increased rapidly. As environmental awareness accumulated over its critical value in 2015 and continued to increase, negative feedback to constrain the socioeconomic expansion was triggered and continued to strengthen. The energy consumption thereby continued to decrease in Fig. 6b, accounting for the significant decrease in the energy shortage rate (i.e., from 8.25 % to 0). Environmental awareness increased and reached the maximum value of 21.6 in 2032, owing to the constant water shortage. With the strong negative feedback, the water demand and food production decreased remarkably and remained at a low level, as shown in Fig. 6a and c, which accounts for the increasing food shortage rate (i.e., from 1.08 % to 3.08 %).
With water resources allocation taken into account, water shortage was significantly alleviated under scenario IV, as discussed in the water resources allocation results (from 15.89 % in scenario IV to 7.20 % under scenario III). The water shortage rate remained below its critical value in the entire co-evolution process (Fig. 6e). Thus, there was no accumulation of water shortage awareness shown in Fig. 6g. Energy consumption continued to increase as the water supply was ensured. Environmental awareness accumulation was primarily due to energy shortage.
Overall, water resources allocation can effectively alleviate water shortage to decrease water shortage awareness by increasing the water supply. The increase in environmental awareness is primarily due to the constant high-level energy shortage rate. Therefore, planning energy availability is the primary boundary condition for sustainable development of the WEFS nexus when water resources allocation is considered. Under the scenario without considering water resources allocation, the risk of water shortage is high. Water shortage awareness continues to accumulate and remains at a high level under scenario IV, which further contributes to high-level environmental awareness. The energy consumption and food production will be decreased by negative feedback. Water availability becomes the vital resource constraining the concordant development of the WEFS nexus.
4.4 Sensitivity analysis for WEFS nexus
As discussed above, both the environmental awareness feedback and water resources allocation are of great significance to WEFS nexus, the sensitivity analysis of which is conducted to help managers to identify the important parameters and rational water resources allocation schemes for the integrated system.
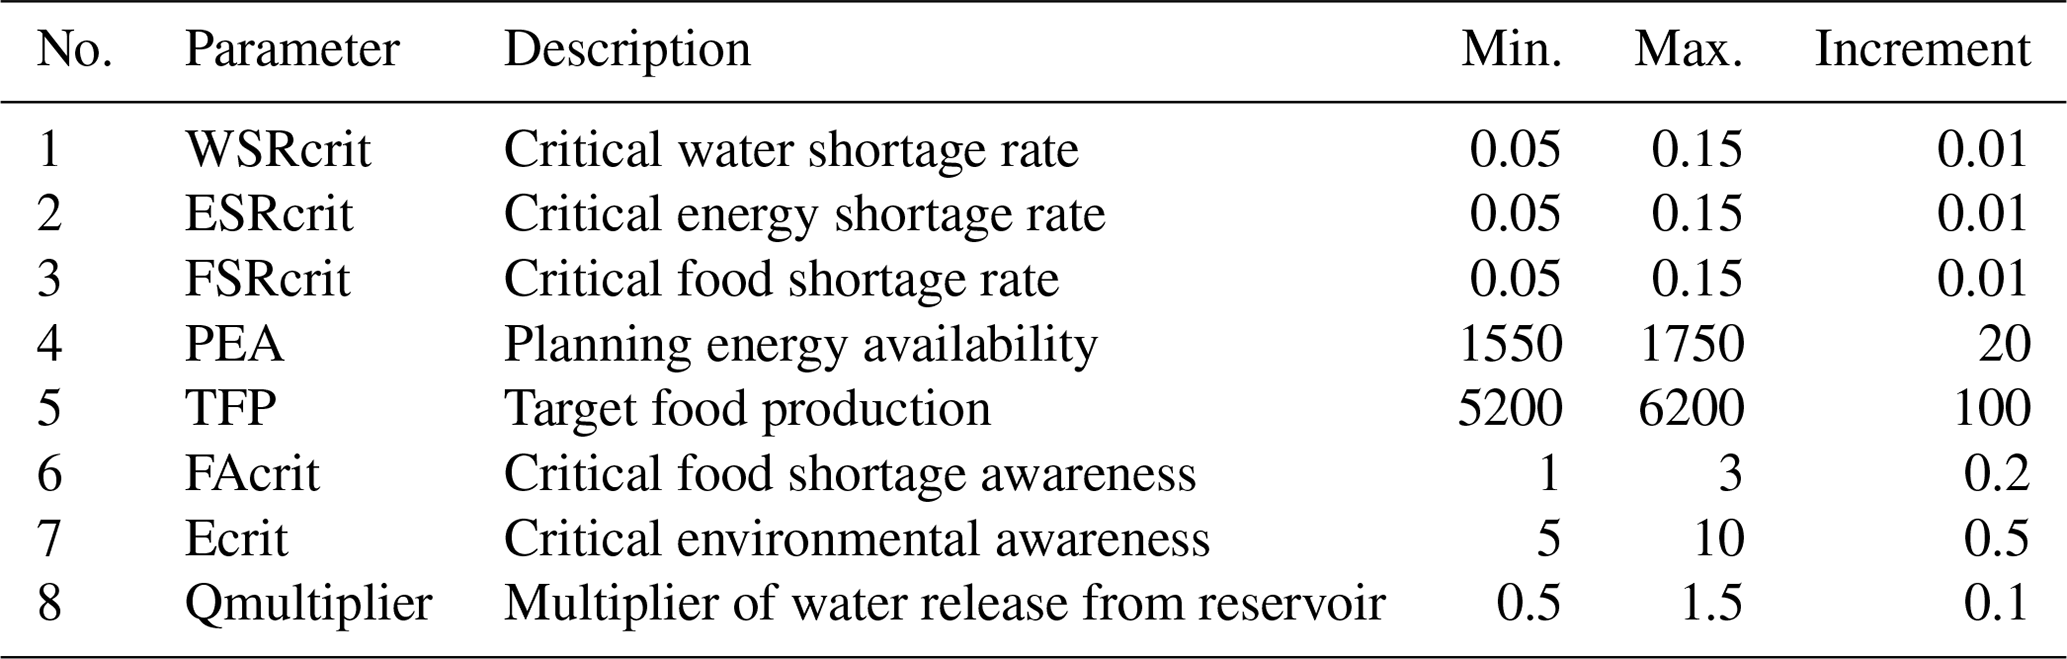
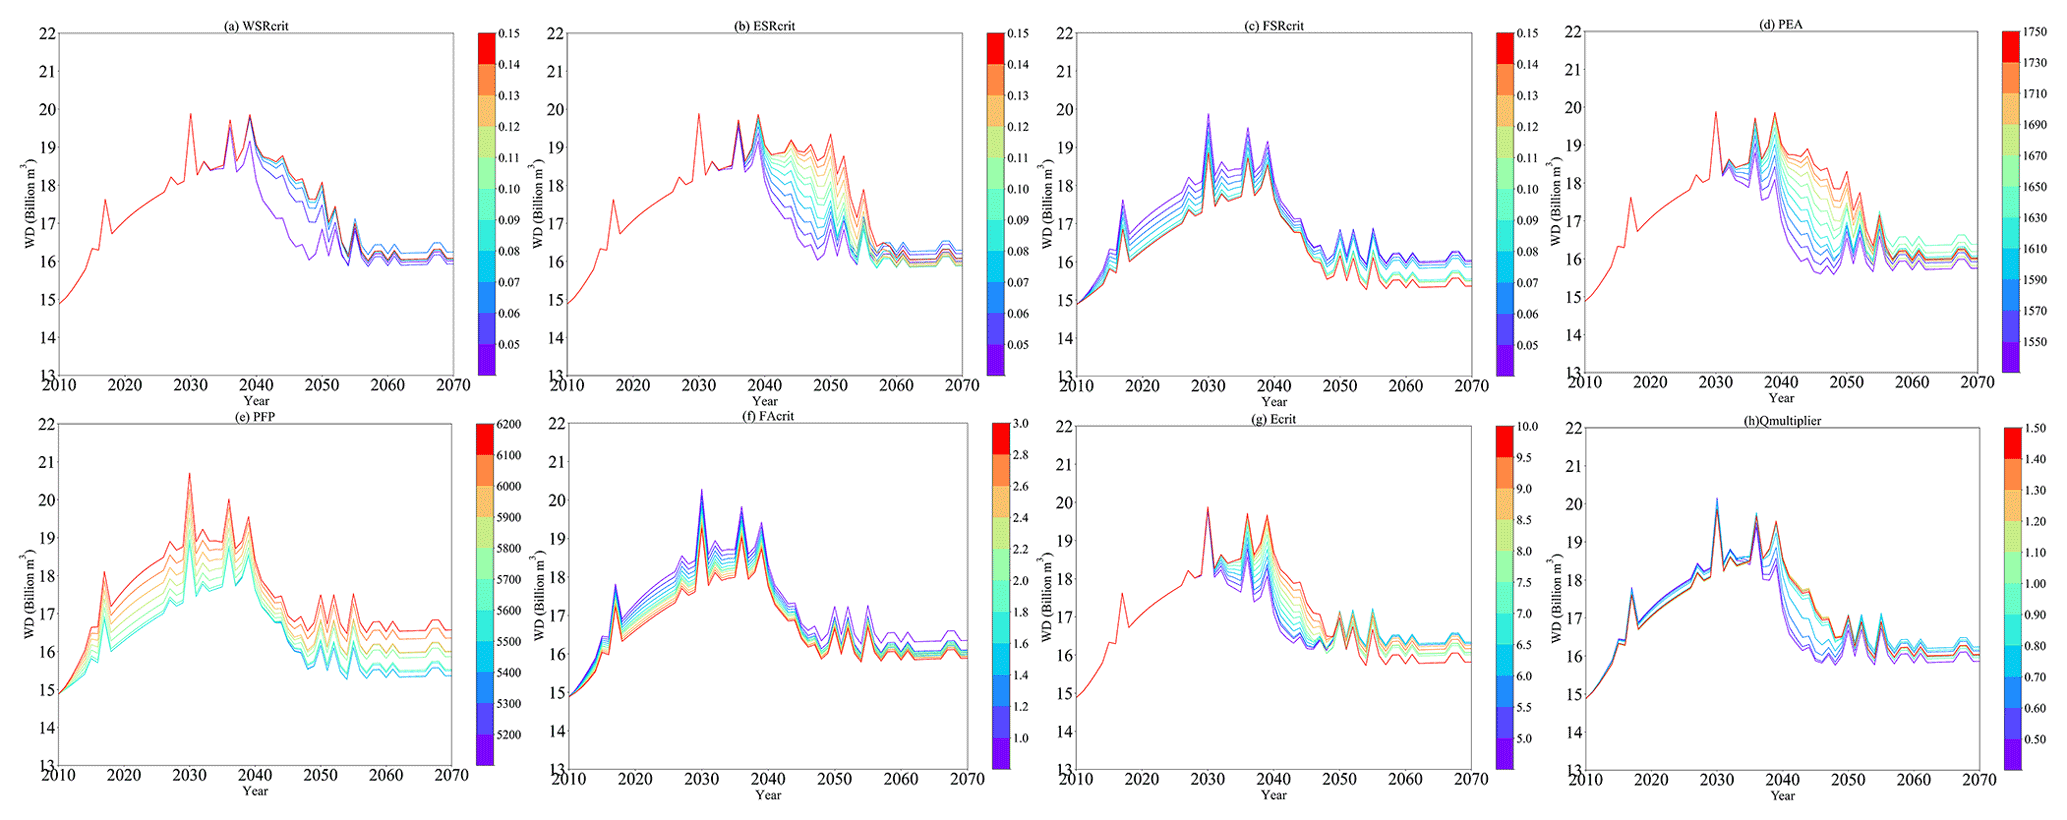
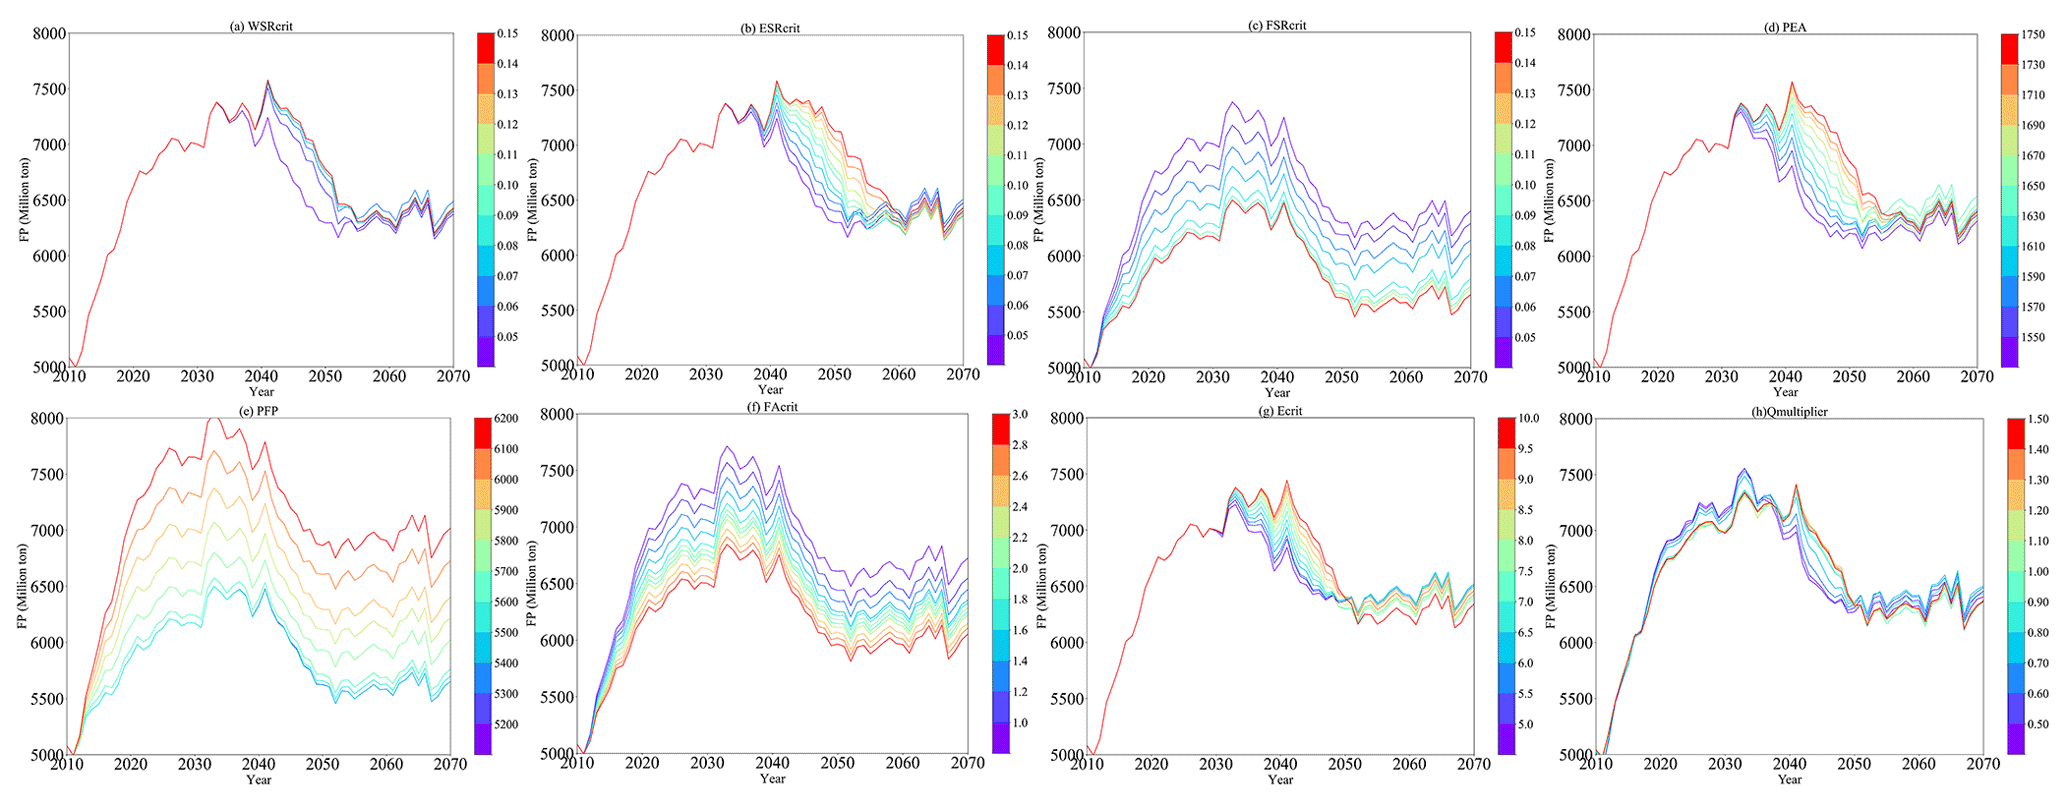
As environmental awareness feedback is dominated by the critical values and boundary conditions of the WEFS nexus, seven parameters were selected for a sensitivity analysis (i.e., parameter 1–7 in Table 6). For water resources allocation, different reservoir operation schemes were adopted by adjusting the water release from the reservoir. Specifically, a multiplier for water release was added as a parameter to demonstrate the ratio of water release in scenario I (i.e., parameter 8 in Table 6). Each parameter was varied by the given increment, with the other parameters remaining unchanged. The maximum and minimum values, and the increments for the seven parameters, are listed in Table 6. Parameter sensitivity analysis was then conducted by analyzing the trajectories of environmental awareness, water demand, energy consumption, and food production, as shown in Figs. 8–11.
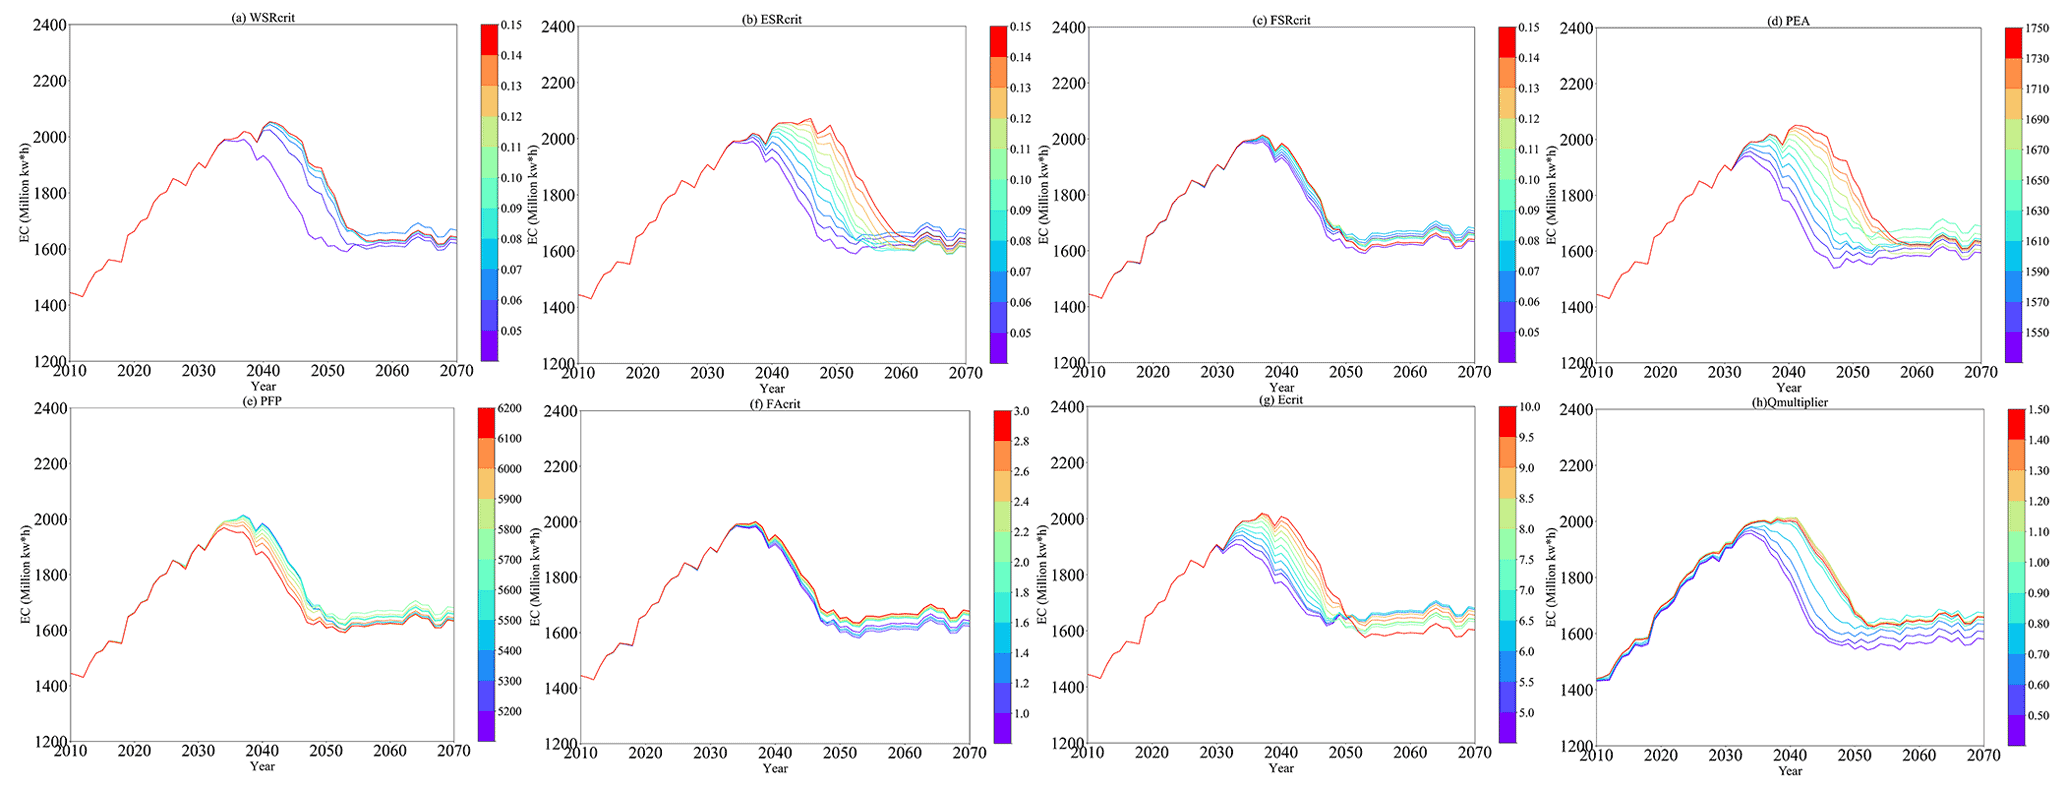
4.4.1 Sensitivity analysis of environmental awareness feedback on the WEFS nexus
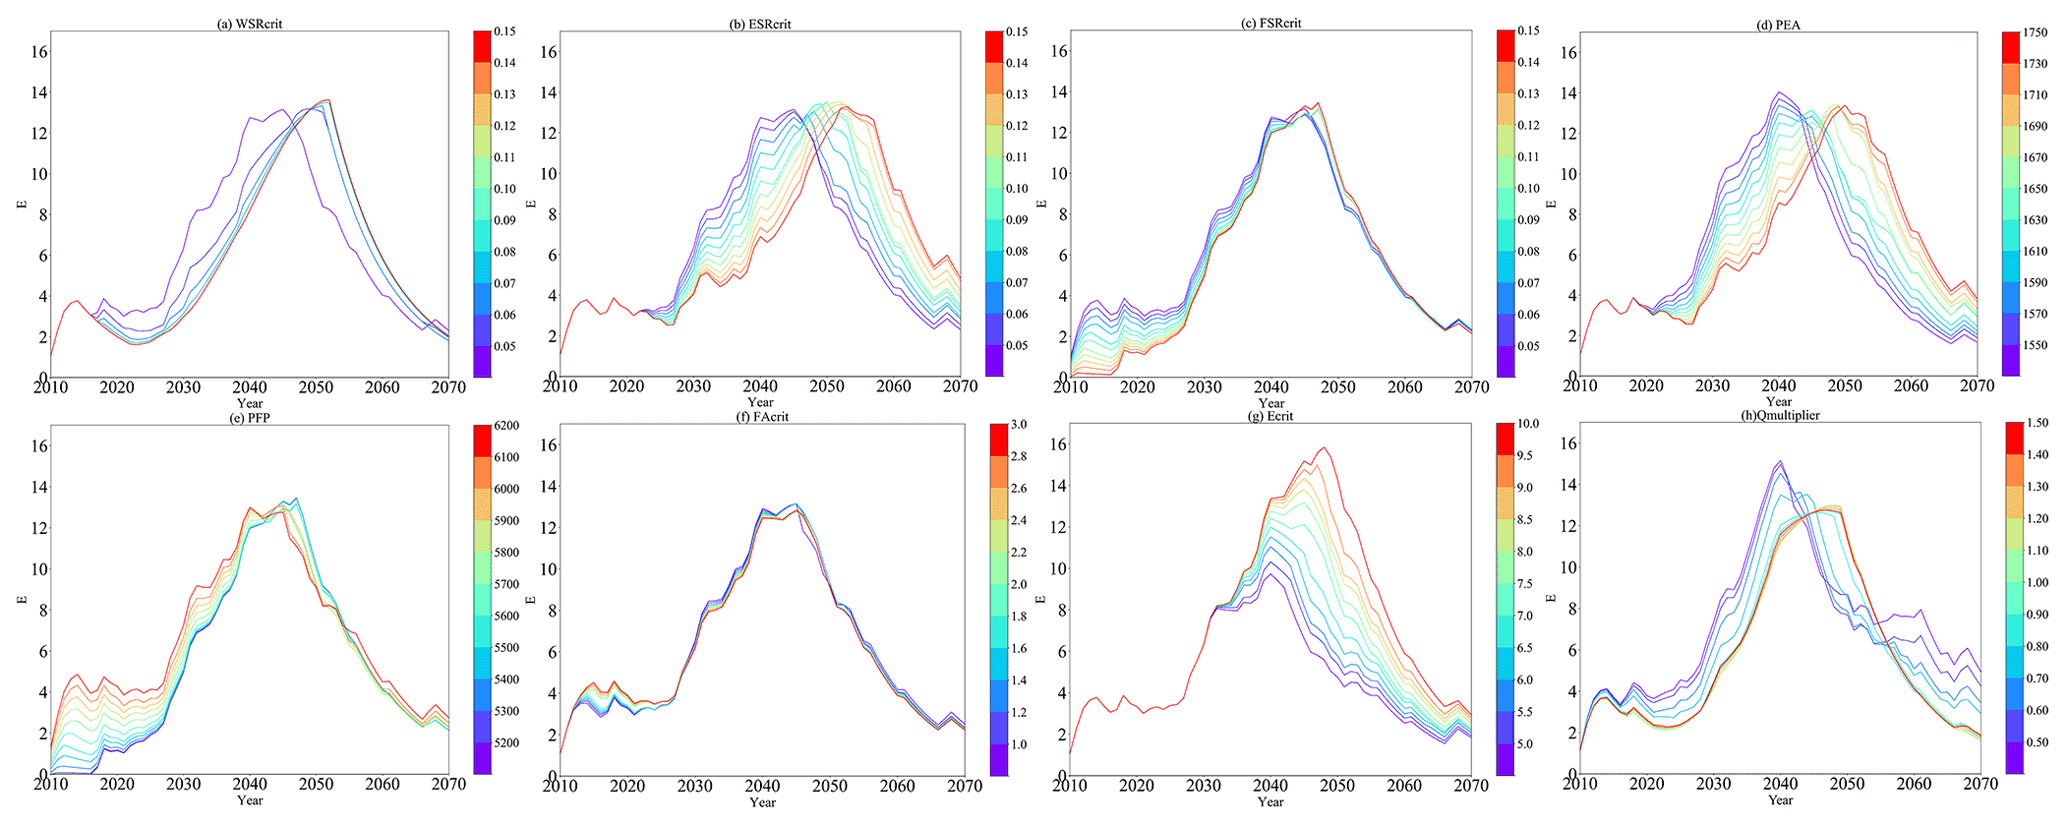
The variations in the parameters 1–7 can evidently change the trajectory of environmental awareness shown in Fig. 8. The socioeconomic sectors, including water demand, energy consumption, and food production were then changed by the feedback driven by environmental awareness (Figs. 9–11), indicating that WEFS nexus is sensitive to the seven parameters.
Specifically, the sensitive responses to parameters WSRcrit, ESRcrit, PEA, and Ecrit primarily occurred in the contraction and recession phases of the co-evolution process for the WEFS nexus. As demands from water and energy systems can always be ensured by abundant resource availability in the expansion phase, limited water and energy shortages were observed. Environmental awareness accumulated primarily from food shortage awareness but remained below its critical value (Fig. 5i). As the feedback due to environmental awareness was not sufficiently strong, the impacts on the co-evolution of WEFS nexus were negligible and were considered as the insensitivity. However, with social development, water demand and energy consumption continued to grow and increase over the local carrying capability, leading an increase in environmental awareness. Negative feedback on socioeconomic sectors was then triggered. WSRcrit and ESRcrit are the critical values that determine the accumulation of the awareness of water and energy shortages, and PEA indicates the amount of planning energy availability, which directly determines the energy shortage. The environmental awareness accumulation can thereby be accelerated by constraining WSRcrit, ESRcrit, and PEA (Fig. 8a, b and d). Ecrit is the threshold for the negative feedback triggering driven by environmental awareness. A lower Ecrit means the community is more sensitive to resource shortages, and feedback is easier to trigger (Fig. 8g). Therefore, environmental awareness feedback to constrain socioeconomic expansion can be advanced and strengthened by lowering WSRcrit, ESRcrit, PEA, and Ecrit, accounting for the sensitive response of WEFS nexus in contraction and recession phases.
FSRcrit, TFP, and FAcrit performed with sensitivity during the entire co-evolution process for WEFS nexus. As food shortages were considerable in the accelerating expansion phase, food shortage awareness increased rapidly, driving the feedback to increase the crop area. TFP can directly determine food shortage, and FSRcrit and FAcrit determine thresholds for food shortage awareness accumulation and feedback triggering by food shortage awareness, respectively. Positive feedback on crop area to increase food production can thus be advanced and strengthened by constraining FSRcrit, TFP, and FAcrit (Fig. 8c, e, and f). The crop area then continued to increase until the environmental awareness feedback was triggered, resulting in the increases in food production (Fig. 11c, e, and f) and water demand from agricultural sector (Fig. 9c, e, and f). As the agricultural water use was directly drawn from the river system, the energy use quota during the water supply was small and negligible. Energy consumption was thus not sensitive to FSRcrit, FAcrit, and TFP, as shown in Fig. 10. Therefore, constraining FSRcrit, FAcrit, and TFP is an effective way to increase food production by advancing and strengthening the feedback driven by food shortage awareness, which accounts for the sensitive responses of environmental awareness, water demand, and food production in expansion phase.
Simultaneously, it is worth noting that, although constraining WSRcrit, ESRcrit, PEA, and Ecrit can maintain the integrated system from constant water shortage and energy shortage, the over-constrained condition can also sharply increase environmental awareness (Fig. 8a, b, d, and e). Environmental awareness feedback was remarkably advanced, which shortened the expansion phase and led to a violent degradation of socioeconomic sectors (indicated by drastic decreases in water demand, energy consumption, and food production in Figs. 9–11, respectively). The sustainability of the WEFS nexus was seriously challenged. Similarly, despite the fact that food production can be effectively increased by constraining FSRcrit, FAcrit, and TFP, the over-constrained condition will cause a considerable increase in water demand, as shown in Fig. 9c, e, and f, which will put further stress on the water supply. Moreover, the regulating capacity of the local system should also be considered during parameter selection. For example, there was an abrupt decrease when WSRcrit was set to 0.05, as shown in Figs. 9a, 10a, and 11a. Violent socioeconomic degradation dominated by environmental awareness feedback was triggered to decrease environmental awareness, indicating that the WSRcrit was over-constrained and exceeded the regulating capacity of the local water system. Therefore, a rational parameter setting should be based on the sustainability of long-term co-evolution for socioeconomic sectors and the regulating capacity of the local system, which is of great significance for sustaining the stability of the WEFS nexus.
As each shortage is experienced by different users with different connections to basin development dynamics (e.g., shortages from water, energy, and food are aggregated into environmental awareness, despite the fact that food which is planned to be exported is also considered in target food production), it is necessary to discuss the contributions to environmental awareness from water, energy, and food systems. Therefore, three weight factors were assigned to shortage awareness of water, energy, and food in Eq. (32) to adjust the overestimated or underestimated environmental awareness due to discordant scales. For instance, considering the target food production comprises local food demand and exported food, so the environmental awareness within the basin is overestimated, and the weight factor for food shortage awareness can be set to be lower than 1.0 as a reduction factor to decrease current food shortage awareness. A sensitivity analysis was then conducted. Each weight factor was varied by a given increment, while the other two weight factors were set to 1.0 as a reference. The results are presented in Figs. S1–S4 in the Supplement.
where wf1, wf2, and wf3 are the weight factors for water, energy, and food shortage awareness, respectively.
The WEFS nexus is sensitive to shortage awareness weight factors. Specifically, weight factors for water and energy shortage awareness can remarkably impact the recession phases of water demand, energy consumption, and food production. A lower weight factor can delay environmental awareness accumulation and thus extend the contraction phase. However, more violent socioeconomic deterioration was also accompanied in the later recession phase, which consequently led to the slightly smaller socioeconomic size in recovery phase. The weight factor for food shortage awareness can effectively dominate the whole evolution of water demand and energy consumption. A lower weight factor indicated that a smaller food shortage awareness can be accumulated. The feedback to increase the crop area was thereby weakened. Both agriculture water demand and food production were decreased. As the energy use quota for agricultural water supply is negligible, only a small response of energy consumption can be found.
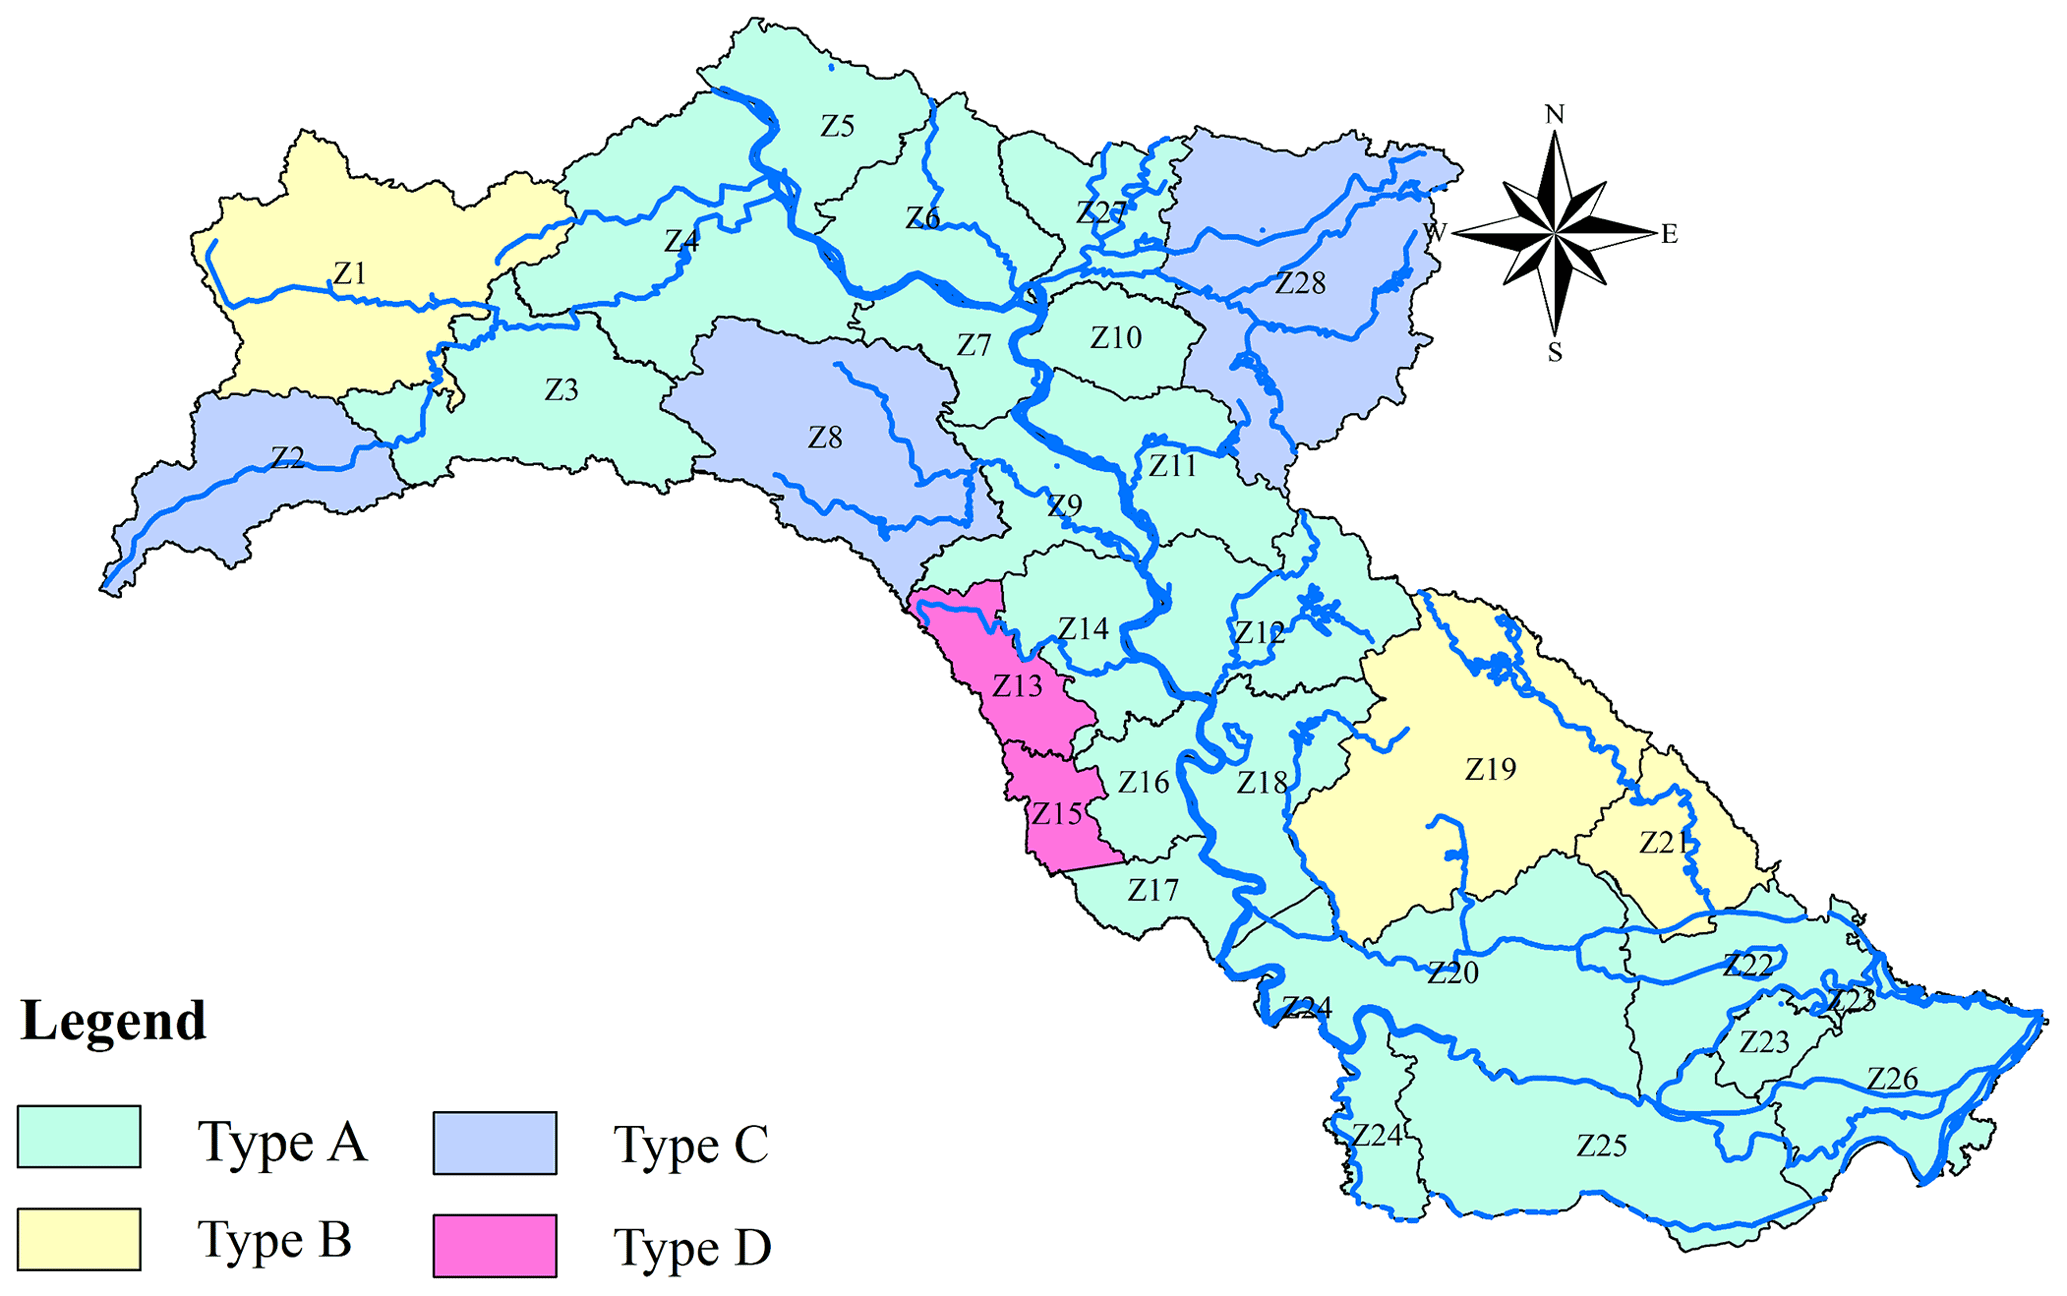
Figure 12Spatial distribution of A, B, C, and D types of operational zones.
4.4.2 Sensitivity analysis of water resources allocation schemes on the WEFS nexus
The WEFS nexus in the study area was evidently constrained under water resources allocation schemes with smaller water release from reservoir. The decreasing water supply directly increased the water shortage, the average annual shortage rate of which increased from 6.41 % to 8.01 %. The rapid increase in water shortage awareness then accelerated the environmental awareness accumulation and, furthermore, the feedback shown in Fig. 8h. As the negative feedback on socioeconomic sectors was strengthened, water demand decreased rapidly in the recession phase (Fig. 9h). Water supply was thereby decreased with decreasing water demand, which accounts for the decreasing energy consumption during the water supply process shown in Fig. 10h. For the food system, a decreasing water release notably altered the stability of the food production evolution (Fig. 11h). A higher water shortage rate led to lower food production and, furthermore, greater food shortage awareness. Feedback driven by food shortage awareness was strengthened to increase the crop area. Food production thereby increased in the expansion phase. However, increasing crop area was accompanied by increasing the agricultural water demand, which brought increases in water shortage and environmental awareness. With stronger environmental awareness feedback, food production in recession phase thereby decreased rapidly.
To assess the impacts of water resources allocation schemes in different operational zones, the spatial distributions of water shortage and socioeconomic variables, including water demand, energy consumption, and food production were considered. Operational zones were classified into four types, as shown in Fig. 12. The zone with lower water shortage, the water shortage rate and socioeconomic variables of which perform with insensitivity, is defined as type A. If water shortage can be almost removed, and socioeconomic variables are sensitive, then the zone is defined as type B. If the water shortage can be partly alleviated, and socioeconomic variables are sensitive, then the zone is defined as type C. The zone with considerable water shortage, the water shortage rate and socioeconomic variables of which perform with insensitivity, is defined as type D. The four representative zones, including Z9 (Yichengmanhe) in type A, Z1 (Fangxian) in type B, Z8 (Nanzhang) in type C, and Z13 (Jingmenzhupi) in type D were selected to study the responses to different water resources allocation schemes. The water shortages and socioeconomic variables are presented in Fig. 13.
As environmental awareness feedback on population, GDP, and crop area was conducted in the entire study area, the water demand variations in Z1, Z8, Z9, and Z13 were similar, and all of them were small (Fig. 13a), which indicated that water supply was the primary factor affecting the integrated system.
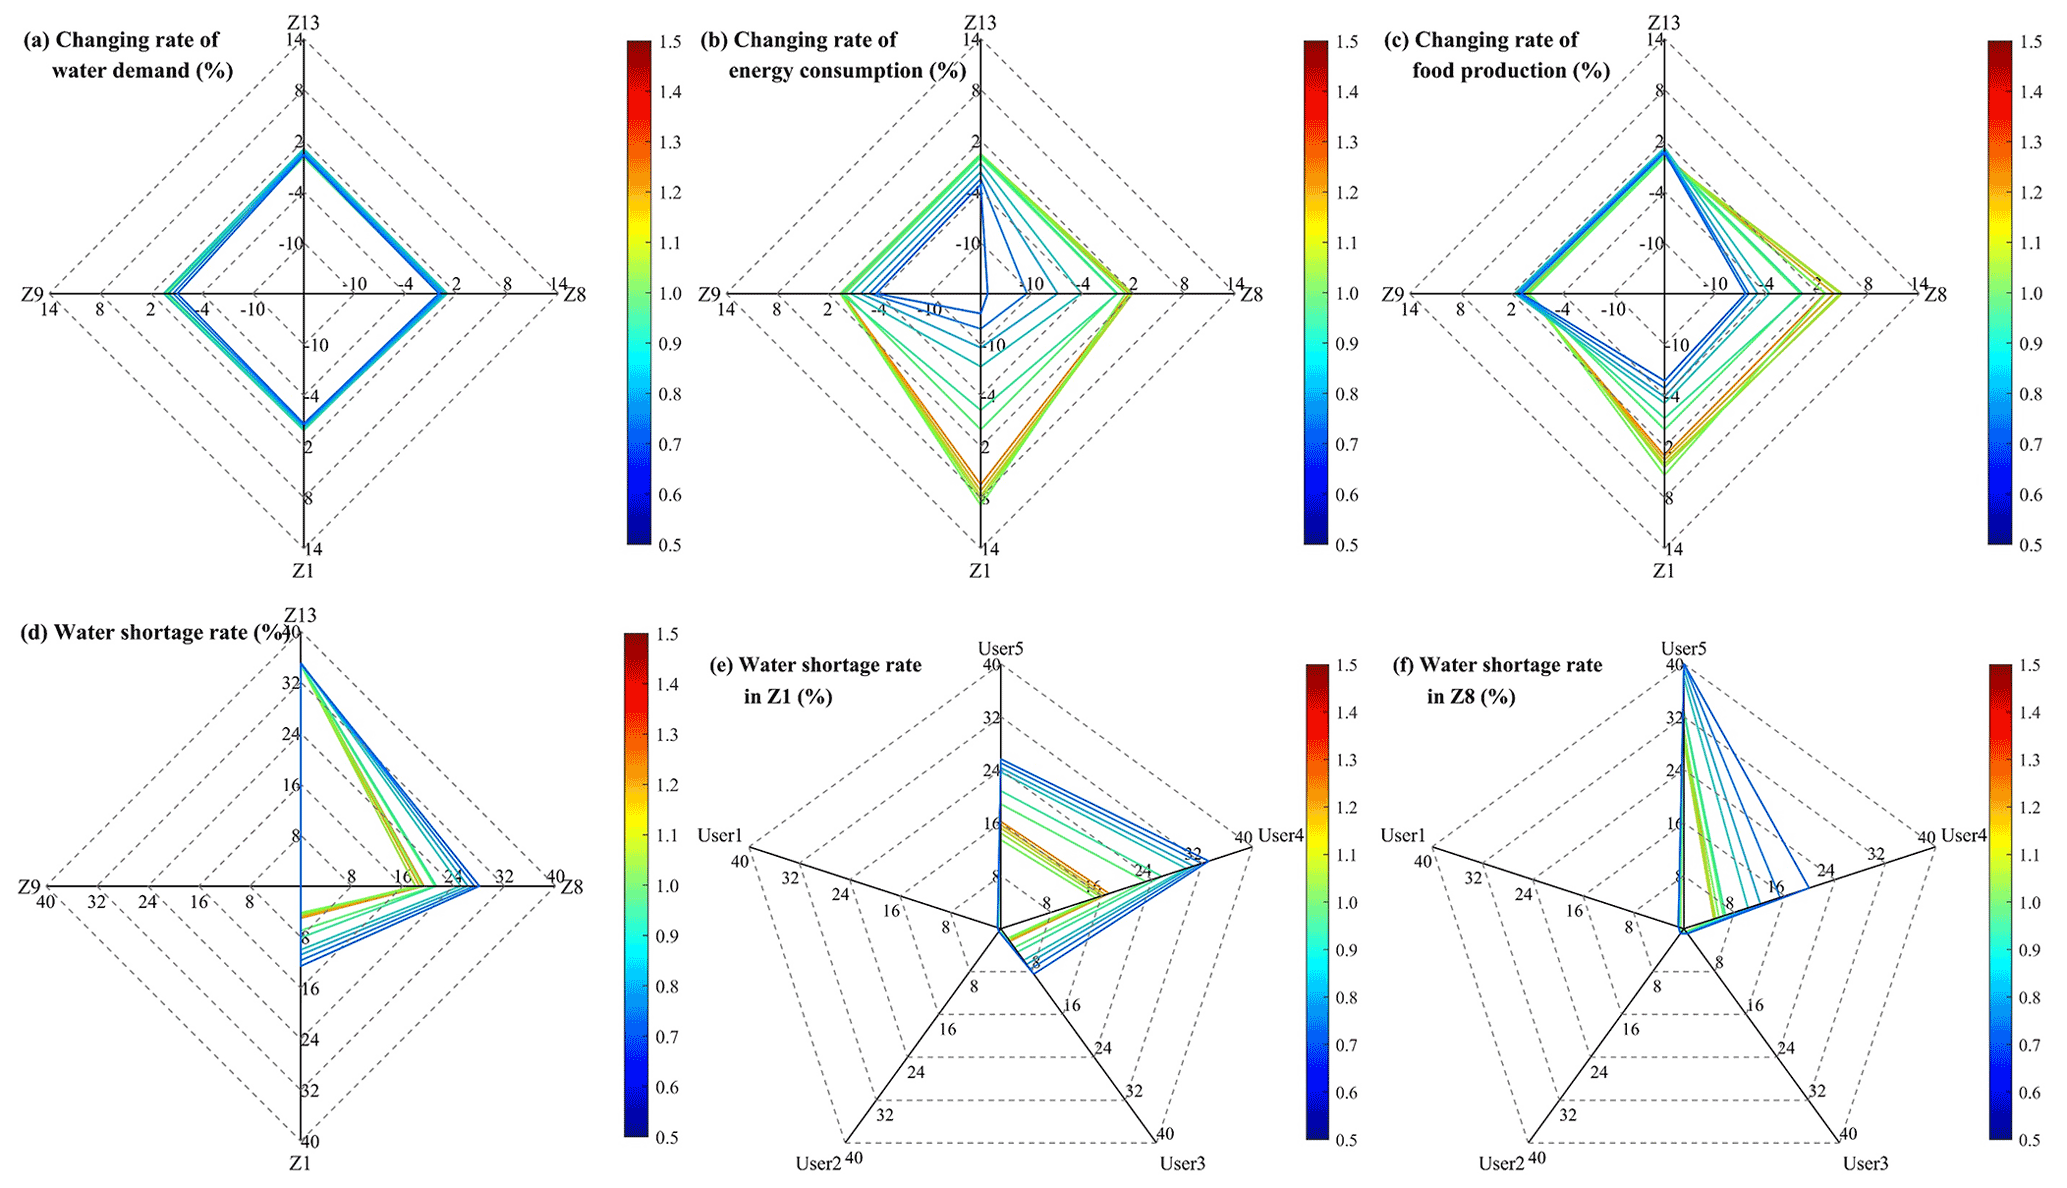
Figure 13Socioeconomic variables with varied reservoir release multiplier in Z9, Z1, Z8, and Z13. (a) Changing rates of water demand. (b) Changing rates of energy consumption. (c) Changing rate of food production. (d) Water shortage rates. (e) Water shortage rates of water users in Z1 (user 1, 2, 3, 4, and 5 are related to municipal, rural, in-stream ecology, industrial, and agricultural users). (f) Water shortage rates of water users in Z8.
No water shortage was observed in Z9 under different water resources allocation schemes (Fig. 13d), and the energy consumption and food production also exhibited insensitivity, as shown in Fig. 13b and c. As Z9 is located along the main stream of Hanjiang River, the regulating capacity of the water project was strong due to Danjiangkou Reservoir (whose total storage is 33 910 ×106 m3). Despite the reduction in water release, the water demand can always be ensured, and the energy consumption and food production thus remained stable. The water shortage rate in Z1 decreased evidently with the increase in water release (Fig. 13d), and the energy consumption and food production further increased remarkably, as shown in Fig. 13b and c. Z1 is located at the boundary of study area, the water supply of which mainly depended on the Sanliping reservoir (shown in Fig. 3). The regulating capacity of the water project was strong enough to cover most of the water demand. Therefore, the increasing water release remarkably relieved the water shortage (the water shortage rate decreased from 12.56 % to 4.20 %), particularly for industrial and agricultural users, as shown in Fig. 13e. Energy consumption during the water supply process thus increased, and food production also increased owing to the decreasing agricultural water shortage rate. The response of Z8 to the water resources allocation schemes was similar to Z1. The difference was that local reservoirs in Z8 can provide a limited regulating capacity which can only cover part of the water demand. The water shortage was effectively alleviated but still considerable (water shortage rates were always more than 18 %, as shown in Fig. 13d). Z13 was far away from the main stream, and there was no local reservoir. The regulating capacity of water project was so weak that no response to the water resources allocation schemes was observed. Water was always the key resource constraining the development of Z13 (Fig. 13d).
It is worth noting that it does not mean that more water release from a reservoir can always promote the development of the integrated system. As shown in Fig. 13e and f, remarkable decreases in the water shortage were no longer observed since reservoir release multiplier was more than 1.2. As excessive water release may decrease the reservoir storage in the dry season, even more water shortages were found, as shown in Fig. 13e and f, which further constrained socioeconomic expansion (Fig. 13b and c). Therefore, the regulating capacity of a water project is an important factor to ensure the stability of the water system to sustain the WEFS nexus. In the area equipped with a strong regulating capacity of a water project, the water demand can always be covered, and the integrated system is not sensitive to a varied water release from the reservoir. While areas with a certain regulating capacity of water project can (but cannot totally) cover the water demand, regulating the water release from the reservoir by rational water resources allocation schemes can effectively ensure water supply and thereby contribute to the sustainable development of the integrated system.
The sustainable management of the WEF nexus remains an urgent challenge, as human sensitivity and reservoir operation have seldom been considered in recent studies. This study used environmental awareness to capture human sensitivity and simultaneously incorporated reservoir operation in the form of a water resources allocation model (i.e., IRAS model) into a water system to develop a system dynamic model for the WEFS nexus. The proposed approach was applied to the MLHRB in China. The conclusions drawn from the study are as follows.
The proposed approach provides a valid analytical tool for exploring the long-term co-evolution of the nexus across the water, energy, food, and society systems. Environmental awareness in the society system shows the potential to capture human sensitivity to shortages from water, energy, and food systems. The feedback driven by environmental awareness can regulate the pace of socioeconomic expansion to maintain the integrated system from constant resource shortages, which contribute to the sustainability of the WEFS nexus. The co-evolution of water demand, energy consumption, and food production can be divided into expansion (accelerating and natural expansion for food production), contraction, recession, and recovery phases based on environmental awareness. Rational parameter setting of boundary conditions and critical values can effectively control environmental awareness feedback to help managers to keep the socioeconomic sectors from violent expansion and deterioration in contraction and recession phases. Water resources allocation can effectively relieve water shortage by increasing water supply. As high-level environmental awareness led by water shortage is remarkably alleviated, environmental awareness feedback is weakened, and the socioeconomic sectors develop rapidly. Threats from water shortages on the concordant development of WEFS nexus are significantly alleviated. The regulating capacity of the water project is an important factor in water resources allocation to ensure the stability of water system to sustain WEFS nexus. In particular, the area with certain regulating capacities for the water project can (but cannot totally) cover the water demand, thus regulating the water release from the reservoir by rational water resources allocation schemes can further ensure the water supply and is of great significance for the sustainable development of the WEFS nexus.
We acknowledge that environmental awareness feedback functionality remains to be further improved. Indeed, environmental awareness also has the potential to contribute to socioeconomic expansion by promoting resource-saving technology. It is the function of the level and duration of environmental awareness and the sizes of socioeconomic factors, which will become the focus of our further study. The model calibration is also challenging, as the data series is not sufficiently long, and the forms and parameters of the feedback function are not prescribed. We consider that sufficient case studies will gradually emerge over time, which could gradually cover a range of scenarios and slowly provide reliability in the WEFS nexus modeling. Moreover, as the primary input of the proposed WEFS nexus model, water availability was adopted based on the historical scenario in this study. Future climate change has not been considered for the sake of simplicity. The considerable uncertainties in water availability can be brought into the water system in the WEFS nexus due to climate change (Chen et al., 2011). The propagation of the uncertainties can also be complicated, with interactions among water, energy, food, and society systems during the co-evolution process. Therefore, more attention should be paid to the uncertainty analysis on the WEFS nexus under climate change. However, the proposed framework and our research results not only provide useful guidelines for local sustainable development but also demonstrate the potential for effective application in other basins.
The code that supports the findings of this study is available from the corresponding author upon reasonable request. The socioeconomic data used in producing this paper are available at http://data.cnki.net/ (Hubei Provincial Bureau of Statistics, 2021).
The supplement related to this article is available online at: https://doi.org/10.5194/hess-26-3965-2022-supplement.
DL and YZ conceptualized the paper. YZ developed the methodology and software and curated the data with ZW and LD. YZ and DL did the formal analysis, while YZ and LD wrote the draft. SG, LX, PL, JY, and DL reviewed and edited the paper, and DL also acquired the funding.
The contact author has declared that none of the authors has any competing interests.
Publisher's note: Copernicus Publications remains neutral with regard to jurisdictional claims in published maps and institutional affiliations.
This article is part of the special issue “Socio-hydrology and transboundary rivers”. It is not associated with a conference.
We gratefully acknowledge the financial support from the National Natural Science Foundation of China (grant nos. 51879194, 91647106, and 51579183), the Ministry of Foreign Affairs of Denmark (grant no. 18-M01-DTU), and the Open Innovation Project of Changjiang Survey Planning Design and Research Co., Ltd. (grant no. CX2020K03). We would also like to thank the four anonymous reviewers, for their comments and suggestions which substantially improved this paper.
This research has been supported by the National Natural Science Foundation of China (grant nos. 51879194, 91647106, and 51579183), the Ministry of Foreign Affairs of Denmark (grant no. 18-M01-DTU), and the Open Innovation Project of Changjiang Survey Planning Design and Research Co., Ltd. (grant no. CX2020K03).
This paper was edited by Murugesu Sivapalan and reviewed by four anonymous referees.
Alexandratos, N. and Bruinsma, J.: World agriculture towards 2030/2050, FAO, http://water2return.eu/wp-content/uploads/2017/11/FAO_world-agriculture-towards-2030-2050.pdf (last access: 1 August 2021), 2012.
Bertalanffy, L. V.: General System Theory: Foundations, Development, Applications, 3, George Braziller, New York, USA, https://doi.org/10.1109/TSMC.1974.4309376, 1976.
Blanke, A., Rozelle, S., Lohmar, B., Wang, J., and Huang, J.: Water saving technology and saving water in China, Agr. Water Manage., 87, 139–150, https://doi.org/10.1016/j.agwat.2006.06.025, 2007.
Bonabeau, E.: Agent-based modeling: Methods and techniques for simulating human systems, P. Natl. Acad. Sci. USA, 99, 7280–7287, https://doi.org/10.1073/pnas.082080899, 2002.
Brekke, L., Larsen, M. D., Ausburn, M., and Takaichi, L.: Suburban water demand modeling using stepwise regression, J. Am. Water Works Assoc., 94, 65–75, 2002.
Chen, J., Brissette, F. P., and Leconte, R.: Uncertainty of downscaling method in quantifying the impact of climate change on hydrology, J. Hydrol., 401, 190–202, https://doi.org/10.1016/j.jhydrol.2011.02.020, 2011.
Chen, X., Wang, D., Tian, F., and Sivapalan, M.: From channelization to restoration: Sociohydrologic modeling with changing community preferences in the Kissimmee River Basin, Florida, Water Resour. Res., 52, 1227–1244, https://doi.org/10.1002/2015wr018194, 2016.
Chiang, Y. M., Chang, L. C., and Chang, F. J.: Comparison of static-feedforward and dynamic-feedback neural networks for rainfall-runoff modeling, J. Hydrol., 290, 297–311, https://doi.org/10.1016/j.jhydrol.2003.12.033, 2004.
CWRC – Changjiang Water Resources Commission: Integrated Water Resources Planning of Hanjiang River Basin, Wuhan, China, 2016.
Davies, E. G. R. and Simonovic, S. P.: ANEMI: a new model for integrated assessment of global change, Interdisciplin. Environ. Rev., 11, 127–161, https://doi.org/10.1504/ier.2010.037903, 2010.
Dawson, R. J., Peppe, R., and Wang, M.: An agent-based model for risk-based flood incident management, Nat, Hazards, 59, 167–189, https://doi.org/10.1007/s11069-011-9745-4, 2011.
Di Baldassarre, G., Viglione, A., Carr, G., Kuil, L., Yan, K., Brandimarte, L., and Bloeschl, G.: DebatesPerspectives on socio-hydrology: Capturing feedbacks between physical and social processes, Water Resour. Res., 51, 4770–4781, https://doi.org/10.1002/2014wr016416, 2015.
Di Baldassarre, G., Sivapalan, M., Rusca, M., Cudennec, C., Garcia, M., Kreibich, H., Konar, M., Mondino, E., Mard, J., Pande, S., Sanderson, M. R., Tian, F., Viglione, A., Wei, J., Wei, Y., Yu, D. J., Srinivasan, V., and Bloeschl, G.: Sociohydrology: Scientific Challenges in Addressing the Sustainable Development Goals, Water Resour. Res., 55, 6327–6355, https://doi.org/10.1029/2018wr023901, 2019.
El Gafy, I., Grigg, N., and Reagan, W.: Dynamic Behaviour of the Water-Food-Energy Nexus: Focus on Crop Production and Consumption, Irrig. Drain., 66, 19–33, https://doi.org/10.1002/ird.2060, 2017.
El Gafy, I. K.: System Dynamic Model for Crop Production, Water Footprint, and Virtual Water Nexus, Water Resour. Manage., 28, 4467–4490, https://doi.org/10.1007/s11269-014-0667-2, 2014.
Elshafei, Y., Sivapalan, M., Tonts, M., and Hipsey, M. R.: A prototype framework for models of socio-hydrology: identification of key feedback loops and parameterisation approach, Hydrol. Earth Syst. Sci., 18, 2141–2166, https://doi.org/10.5194/hess-18-2141-2014, 2014.
Eusgeld, I., Nan, C., and Dietz, S.: “System-of-systems” approach for interdependent critical infrastructures, Reliabil. Eng. Syst. Safe., 96, 679–686, https://doi.org/10.1016/j.ress.2010.12.010, 2011.
Feng, M., Liu, P., Li, Z., Zhang, J., Liu, D., and Xiong, L.: Modeling the nexus across water supply, power generation and environment systems using the system dynamics approach: Hehuang Region, China, J. Hydrol., 543, 344–359, https://doi.org/10.1016/j.jhydrol.2016.10.011, 2016.
Feng, M., Liu, P., Guo, S., Yu, D. J., Cheng, L., Yang, G., and Xie, A.: Adapting reservoir operations to the nexus across water supply, power generation, and environment systems: An explanatory tool for policy makers, J. Hydrol., 574, 257–275, https://doi.org/10.1016/j.jhydrol.2019.04.048, 2019.
French, R. J. and Schultz, J. E.: Water-use efficiency of wheat in a mediterranean-type environment. 1. The relation between yield, water-use and climate, Aust. J. Agric. Res., 35, 743–764, https://doi.org/10.1071/ar9840743, 1984.
He, S., Guo, S., Yin, J., Liao, Z., Li, H., and Liu, Z.: A novel impoundment framework for a mega reservoir system in the upper Yangtze River basin, Appl. Energy, 305, 117792, https://doi.org/10.1016/j.apenergy.2021.117792, 2022.
He, S. Y., Lee, J., Zhou, T., and Wu, D.: Shrinking cities and resource-based economy: The economic restructuring in China's mining cities, Cities, 60, 75–83, https://doi.org/10.1016/j.cities.2016.07.009, 2017.
Hepburn, C., Duncan, S., and Papachristodoulou, A.: Behavioural Economics, Hyperbolic Discounting and Environmental Policy, Environ. Resour. Econ., 46, 189–206, https://doi.org/10.1007/s10640-010-9354-9, 2010.
Hoff, H.: Understanding the nexus, in: Background Paper for the Bonn 2011 Conference, The Water, Energy and Food Security Nexus, Stockholm Environment Institute, Stockholm, https://mediamanager.sei.org/documents/Publications/SEI-Paper-Hoff-UnderstandingTheNexus-2011.pdf (last access: 1 August 2021), 2011.
Housh, M., Cai, X., Ng, T. L., McIsaac, G. F., Ouyang, Y., Khanna, M., Sivapalan, M., Jain, A. K., Eckhoff, S., Gasteyer, S., Al-Qadi, I., Bai, Y., Yaeger, M. A., Ma, S., and Song, Y.: System of Systems Model for Analysis of Biofuel Development, J. Infrastruct. Syst., 21, 04014050, https://doi.org/10.1061/(asce)is.1943-555x.0000238, 2015.
HPDWR – Hubei Provincial Department of Water Resources: Dispatching schedules of Hubei provincial large reservoirs, Wuhan, China, 2014.
Hritonenko, N. and Yatsenko, Y.: Mathematical Modeling in Economics, Ecology and the Environment, Kluwer Academic Publishers, Dordrecht, Boston, London, https://doi.org/10.1007/978-1-4614-9311-2, 1999.
Hsiao, T. C., Steduto, P., and Fereres, E.: A systematic and quantitative approach to improve water use efficiency in agriculture, Irrig. Sci., 25, 209–231, https://doi.org/10.1007/s00271-007-0063-2, 2007.
Hubei Provincial Bureau of Statistics: Hubei Statistical Yearbook, http://data.cnki.net/, last access: 1 August 2021.
International Energy Agency: World Energy Outlook 2012, International Energy Agency, Paris, France, https://iea.blob.core.windows.net/assets/4ed140c1-c3f3-4fd9-acae-789a4e14a23c/WorldEnergyOutlook2021.pdf (last access: 1 August 2021), 2012.
Khare, D., Jat, M. K., and Sunder, J. D.: Assessment of water resources allocation options: Conjunctive use planning in a link canal command, Resour. Conserv. Recycl., 51, 487–506, https://doi.org/10.1016/j.resconrec.2006.09.011, 2007.
Kleinmuntz, D. N.: Information-processing and misperceptions of the implications of feedback in dynamic decision-making, Syst. Dynam. Rev., 9, 223–237, https://doi.org/10.1002/sdr.4260090302, 1993.
Krause, P., Boyle, D. P., and Bäse, F.: Comparison of different efficiency criteria for hydrological model assessment, Adv. Geosci., 5, 89–97, https://doi.org/10.5194/adgeo-5-89-2005, 2005.
Laspidou, C. S., Mellios, N. K., Spyropoulou, A. E., Kofinas, D. T., and Papadopoulou, M. P.: Systems thinking on the resource nexus: Modeling and visualisation tools to identify critical interlinkages for resilient and sustainable societies and institutions, Sci. Total Environ., 717, 137264, https://doi.org/10.1016/j.scitotenv.2020.137264, 2020.
Law, R., Murrell, D. J., and Dieckmann, U.: Population growth in space and time: spatial logistic equations (vol 84, pg 252, 2003), Ecology, 84, 535–535, 2003.
Li, B., Sivapalan, M., and Xu, X.: An Urban Sociohydrologic Model for Exploration of Beijing's Water Sustainability Challenges and Solution Spaces, Water Resour. Res., 55, 5918–5940, https://doi.org/10.1029/2018wr023816, 2019.
Li, X. Y., Zhang, D. Y., Zhang, T., Ji, Q., and Lucey, B.: Awareness, energy consumption and pro-environmental choices of Chinese households, J. Clean. Product., 279, 123734, https://doi.org/10.1016/j.jclepro.2020.123734, 2021.
Lian, X. B., Gong, Q., and Wang, L. F. S.: Consumer awareness and ex-ante versus ex-post environmental policies revisited, Int. Rev. Econ. Financ., 55, 68–77, https://doi.org/10.1016/j.iref.2018.01.014, 2018.
Lin, J. Y., Wan, G., and Morgan, P. J.: Prospects for a re-acceleration of economic growth in the PRC, J. Comp. Econ., 44, 842–853, https://doi.org/10.1016/j.jce.2016.08.006, 2016.
Linderhof, V., Dekkers, K., and Polman, N.: The Role of Mitigation Options for Achieving a Low-Carbon Economy in the Netherlands in 2050 Using a System Dynamics Modelling Approach, Climate, 8, 132, https://doi.org/10.3390/cli8110132, 2020.
Liu, D.: Evaluating the dynamic resilience process of a regional water resource system through the nexus approach and resilience routing analysis, J. Hydrol., 578, 124028, https://doi.org/10.1016/j.jhydrol.2019.124028, 2019.
Liu, D., Guo, S., Liu, P., Xiong, L., Zou, H., Tian, J., Zeng, Y., Shen, Y., and Zhang, J.: Optimisation of water-energy nexus based on its diagram in cascade reservoir system, J. Hydrol., 569, 347–358, https://doi.org/10.1016/j.jhydrol.2018.12.010, 2019.
Lobell, D. B., Cassman, K. G., and Field, C. B.: Crop Yield Gaps: Their Importance, Magnitudes, and Causes, Annu. Rev. Environ. Resour., 34, 179–204, https://doi.org/10.1146/annurev.environ.041008.093740, 2009.
Loucks, D. P.: Interactive River-Aquifer Simulation and Stochastic Analyses for Predicting and Evaluating the Ecologic Impacts of Alternative Land and Water Management Policies, Kluwer Academic Publishers, Dordrecht, the Netherlands, ISBN 9781402009112, 2002.
Makindeodusola, B. A. and Marino, M. A.: Optimal-control of groundwater by the feedback method of control, Water Resour. Res., 25, 1341–1352, https://doi.org/10.1029/WR025i006p01341, 1989.
Malthus, T.: An Essay on the Principle of Population, Penguin, Harmondsworth, UK, ISBN 9781351291521, 1798.
Matrosov, E. S., Harou, J. J., and Loucks, D. P.: A computationally efficient open-source water resource system simulator – Application to London and the Thames Basin, Environ. Model. Softw., 26, 1599–1610, https://doi.org/10.1016/j.envsoft.2011.07.013, 2011.
McKinsey & Company: Charting our water future: economic frameworks to inform decision-making, 2030 Water Resources Group, http://www.indiaenvironmentportal.org.in/files/Charting_Our_Water_Future_Full_Report_001.pdf (last access: 1 August 2021), 2009.
Nash, J. E. and Sutcliffe, J. V.: River flow forecasting through conceptual models part I – A discussion of principles, J. Hydrol., 10, 282–290, https://doi.org/10.1016/0022-1694(70)90255-6, 1970.
Purwanto, A., Susnik, J., Suryadi, F. X., and de Fraiture, C.: Quantitative simulation of the water-energy-food (WEF) security nexus in a local planning context in indonesia, Sustain. Product. Consump., 25, 198–216, https://doi.org/10.1016/j.spc.2020.08.009, 2021.
Ravar, Z., Zahraie, B., Sharifinejad, A., Gozini, H., and Jafari, S.: System dynamics modeling for assessment of water-food-energy resources security and nexus in Gavkhuni basin in Iran, Ecol. Indic., 108, 105682, https://doi.org/10.1016/j.ecolind.2019.105682, 2020.
Rockson, G., Bennett, R., and Groenendijk, L.: Land administration for food security: A research synthesis, Land Use Policy, 32, 337–342, https://doi.org/10.1016/j.landusepol.2012.11.005, 2013.
Roobavannan, M., van Emmerik, T. H. M., Elshafei, Y., Kandasamy, J., Sanderson, M. R., Vigneswaran, S., Pande, S., and Sivapalan, M.: Norms and values in sociohydrological models, Hydrol. Earth Syst. Sci., 22, 1337–1349, https://doi.org/10.5194/hess-22-1337-2018, 2018.
Si, Y., Li, X., Yin, D., Li, T., Cai, X., Wei, J., and Wang, G.: Revealing the water-energy-food nexus in the Upper Yellow River Basin through multi-objective optimization for reservoir system, Sci. Total Environ., 682, 1–18, https://doi.org/10.1016/j.scitotenv.2019.04.427, 2019.
Simonovic, S. P.: World water dynamics: global modeling of water resources, J. Environ. Manage., 66, 249–267, https://doi.org/10.1006/jema.2002.0585, 2002.
Smith, K., Liu, S., Liu, Y., Savic, D., Olsson, G., Chang, T., and Wu, X.: Impact of urban water supply on energy use in China: a provincial and national comparison, Mitig. Adapt. Strat. Global Change, 21, 1213–1233, https://doi.org/10.1007/s11027-015-9648-x, 2016.
Susnik, J.: Data-driven quantification of the global water-energy-food system, Resour. Conserv. Recycl., 133, 179–190, https://doi.org/10.1016/j.resconrec.2018.02.023, 2018.
Swanson, J.: Business dynamics – Systems thinking and modeling for a complex world, J. Oper. Res. Soc., 53, 472–473, https://doi.org/10.1057/palgrave.jors.2601336, 2002.
Tennant, D. L.: Instream flow regimens for fish, wildlife, recreation and related environmental resources, Fisheries, 1, 6–10, https://doi.org/10.1577/1548-8446(1976)001<0006:ifrffw>2.0.co;2, 1976.
Van Emmerik, T. H. M., Li, Z., Sivapalan, M., Pande, S., Kandasamy, J., Savenije, H. H. G., Chanan, A., and Vigneswaran, S.: Socio-hydrologic modeling to understand and mediate the competition for water between agriculture development and environmental health: Murrumbidgee River basin, Australia, Hydrol. Earth Syst. Sci., 18, 4239–4259, https://doi.org/10.5194/hess-18-4239-2014, 2014.
Vörösmarty, C. J., Green, P., Salisbury, J., and Lammers, R. B.: Global water resources: Vulnerability from climate change and population growth, Science, 289, 284–288, https://doi.org/10.1126/science.289.5477.284, 2000.
Wolstenholme, E. F. and Coyle, R. G.: The development of system dynamics as a methodology for system description and qualitative analysis, J. Oper. Res. Soc., 34, 569–581, https://doi.org/10.1057/jors.1983.137, 1983.
Wu, Z., Liu, D., Mei, Y., Guo, S., Xiong, L., Liu, P., Yin, J., and Zeng, Y.: Delayed feedback between adaptive reservoir operation and environmental awareness within water supply-hydropower generation-environment nexus, J. Clean. Product., 345, 131181, https://doi.org/10.1016/j.jclepro.2022.131181, 2022.
Xiong, Y. L., Wei, Y. P., Zhang, Z. Q., and Wei, J.: Evolution of China's water issues as framed in Chinese mainstream newspaper, Ambio, 45, 241–253, https://doi.org/10.1007/s13280-015-0716-y, 2016.
Xu, X. B., Hu, H. Z., Tan, Y., Yang, G. S., Zhu, P., and Jiang, B.: Quantifying the impacts of climate variability and human interventions on crop production and food security in the Yangtze River Basin, China, 1990–2015, Sci. Total Environ., 665, 379–389, https://doi.org/10.1016/j.scitotenv.2019.02.118, 2019.
Zeng, Y., Liu, D., Guo, S., Xiong, L., Liu, P., Yin, J., Tian, J., Deng, L., and Zhang, J.: Impacts of Water Resources Allocation on Water Environmental Capacity under Climate Change, Water, 13, 1187, https://doi.org/10.3390/w13091187, 2021.
Zhang, P., Zhang, Y. Y., Ren, S. C., Chen, B., Luo, D., Shao, J. A., Zhang, S. H., and Li, J. S.: Trade reshapes the regional energy related mercury emissions: A case study on Hubei Province based on a multi-scale input-output analysis, J. Clean. Product., 185, 75–85, https://doi.org/10.1016/j.jclepro.2018.03.013, 2018.
Zhao, S., Liu, Y., Liang, S., Wang, C., Smith, K., Jia, N., and Arora, M.: Effects of urban forms on energy consumption of water supply in China, J. Clean. Product., 253, 119960, https://doi.org/10.1016/j.jclepro.2020.119960, 2020.
Zhou, Y., Chang, L., Uen, T., Guo, S., Xu, C., and Chang, F.: Prospect for small-hydropower installation settled upon optimal water allocation: An action to stimulate synergies of water-food-energy nexus, Appl. Energy, 238, 668–682, https://doi.org/10.1016/j.apenergy.2019.01.069, 2019.