the Creative Commons Attribution 4.0 License.
the Creative Commons Attribution 4.0 License.
 | 19 Jul 2022
Evaporation, infiltration and storage of soil water in different vegetation zones in the Qilian Mountains: a stable isotope perspective
Leilei Yong
Xi Zhao
Yuwei Liu
Zhuanxia Zhang
Yuanxiao Xu
Zhigang Sun
Liyuan Sang
Lei Wang
The processes of water storage have not been fully understood in different vegetation zones of mountainous areas, which is the main obstacle to further understanding hydrological processes and improving water resource assessments. To further understand the process of soil water movement in different vegetation zones (alpine meadow (AM), coniferous forest (CF), mountain grassland (MG) and deciduous forest (DF)) of mountainous areas, this study monitored the temporal and spatial dynamics of hydrogen- and oxygen-stable isotopes in the precipitation and soil water of the Xiying River basin. The results show that the order of soil water evaporation intensities in the four vegetation zones was MG (SWLslop: 3.4) > DF (SWLslop: 4.1) > CF (SWLslop: 4.7) > AM (SWLslop: 6.4). The soil water in the AM and CF evaporated from only the topsoil, and the rainfall input was fully mixed with each layer of soil. The evaporation signals of the MG and DF could penetrate deep into the middle and lower layers of the soil as precipitation quickly flowed into the deep soil through the soil matrix. Each vegetation zone's water storage capacity of the 0–40 cm soil layer followed the order of AM (46.9 mm) > DF (33.0 mm) > CF (32.1 mm) > MG (20.3 mm). In addition, the 0–10 cm soil layer has the smallest soil water storage capacity (AM: 43.0 mm; CF: 28.0 mm; MG: 17.5 mm; DF: 29.1 mm). This work will provide a new reference for understanding soil hydrology in arid headwater areas.
- Article
(3902 KB) - Full-text XML
- BibTeX
- EndNote


In arid inland river basins, climate and vegetation changes will affect the hydrological cycle (Sharma et al., 2021; Tetzlaff et al., 2013). As an essential part of the water cycle, soil water in the unsaturated zone can be converted from precipitation into the stream or groundwater recharge. Determining soil water evaporation, infiltration and storage properties are critical to understand the regional hydrological cycle and water balance under climate and vegetation changes (Brooks et al., 2010; Dubbert and Werner, 2019; Grant and Dietrich, 2017).
As “fingerprints” of water, isotopes have been used to track ecohydrological characteristics, such as evaporation (Barnes and Allison, 1988; Zhu et al., 2021b), groundwater recharge (Koeniger et al., 2016), infiltration paths (Duvert et al., 2016; Tang and Feng, 2001; Zhu et al., 2021a), evapotranspiration distribution (Gibson et al., 2021; Xiao et al., 2018), and the water absorption by plants (Rothfuss and Javaux, 2017).
Water seepage in the unsaturated soil zone and water evaporation at the air–soil interface are the primary forms of soil water transport. The dynamic water process reflected by the displacement of the isotope signal on the soil profile is called the “memory effect”. Understanding the “memory effect” will help us to trace the dynamic changes in climate and soil hydrology (Kleine et al., 2020). The change of stable isotopes in near-surface soil water may reflect the precipitation variation, but these variations decrease with depth unless there is preferential flow (Peralta-Tapia et al., 2015; Sprenger et al., 2016, 2017). Evaporation mainly occurred in the near-surface part of the soils (0–10 cm), and the light isotope molecules (1H and 16O) evaporated preferentially, resulting in the enrichment of heavy isotopes (2H and 18O) on the soil surface (Ferretti et al., 2003). Dansgaard (1964) proposed the concept of deuterium excess, d-excess (d-excess = δ2H-8δ18O), to illustrate the intensity of evaporation fractionation. Assuming that evaporation occurs in the atmosphere with a humidity of 75 %, it shows that the d-excess value of atmospheric moisture accounts for the d-excess value of 10 ‰ in the atmospheric moisture, which conforms to the worldwide average isotopic labeling of meteoric waters. Landwehr and Coplen (2006) defined line-conditioned excess (lc-excess) as the difference between the δ2H value of the water sample and the δ18O linear transform value of the same sample, where the linear transformation reflects the relevant referenced meteoric water relationship. Compared with d-excess, lc-excess can explain the evaporative fractionation process better. The main reason is that lc-excess of precipitation and soil water changes smoothly and has relatively small seasonal changes (Landwehr et al., 2014). The dynamic changes of isotopes record the signal of soil water evaporation. This enrichment of this dynamic fractionation exists in soil water isotopes in different climatic regions. Compared with temperate regions, the evaporation signals in arid and Mediterranean environments penetrate deeper into the soil (Sprenger et al., 2016). After evaporation and seepage, some water is stored in the soil. The water storage capacity in humid areas is higher than that in arid areas, that in forest is higher than that in grassland, and that in the surface soil layer is lower than that in deep soil layers with high clay content (Kleine et al., 2020; Milly, 1994; Snelgrove et al., 2021; Sprenger et al., 2019).
In alpine mountains, climate warming has accelerated the melting of glaciers and frozen soil, and the dynamic interaction between water bodies stored in different media has become the main influencing factor of the water cycle (Penna et al., 2018). Interactions between precipitation and the soil–plant–atmosphere system determine the distribution of water in various storage reservoirs and the subsequent release of water vapor to the atmosphere. These interactions mainly include interception, throughfall, canopy drip, snow accumulation and ablation, infiltration, surface and subsurface runoff, soil moisture and the partitioning of evapotranspiration between canopy evaporation, transpiration and soil evaporation. As the main links of the hydrological cycle, these processes have a profound impact on regional water balance and distribution.
In the past, studies on the evaporation, infiltration and storage of soil water mostly focused on vegetation types in the same climatic region or different climatic regions. Understanding the climatic and hydrological conditions of different vertical vegetation zones, and clarifying the regulating role of vegetation in the water cycle, can help to better adapt to climate change's influences on the hydrological cycle in source areas. In this study, we monitored the stable isotope composition of precipitation and soil water and the spatiotemporal dynamics of soil water storage in four vegetation zones (alpine meadow (AM), coniferous forest (CF), mountain grassland (MG) and deciduous forest (DF)) at different temperatures and humidities in the Xiying River basin. To explore the differences in soil water evaporation, infiltration, and storage processes in these four different climates, vegetation types and terrain types, the following research objectives were proposed: (1) to explore the evolution of isotope evaporation signals and the “memory effects” of precipitation input, mixing and rewetting; (2) to understand the soil water storage capacity and influencing factors of four vegetation areas in mountainous areas. We hope this study can further improve the understanding of the water cycle process and provide a scientific theoretical reference for water resource utilization and ecological restoration in fragile environments. More importantly, it can provide paradigms for research at different spatial scales (latitude zone, longitude zone, watershed, etc.) based on the knowledge of soil moisture evaporation, infiltration, and water storage in mountain vegetation zones.
The Xiying River originates from Lenglongling and Kawazhang in the eastern Qilian Mountains (101∘40′47′′–102∘ 23′5′′ E, 37∘28′22′′–38∘1′42′′ N) (Fig. 1). As the largest tributary of the Shiyang River, it is formed by the Shuiguan River, Ningchang River, Xiangshui River, and Tatu River converging from southwest to northeast and ultimately flowing into the Xiying Reservoir. The average annual runoff of the Xiying River is 388 million m3, which is mainly replenished by mountain precipitation and melting water of ice and snow. The runoff is mainly concentrated in summer. The basin elevation is between 2000 and 5000 m, corresponding to a temperate semi-arid climate with strong solar radiation, a long sunshine time, and a large temperature difference between day and night. The average annual temperature of the basin is 6 ∘C, the annual average evaporation is 1133 mm, the annual average precipitation is 400 mm, and the precipitation from June to September accounts for 69 % of the annual precipitation. Precipitation increases with elevation, while temperature decreases with elevation in this area (Table 1) (Ma et al., 2018). The zonal differentiation of vegetation in the basin is dominated by DF, MG, cold temperate CF and AM. The soils mainly include lime, chestnut, alpine shrub meadow and desert soil (Fig. 1).
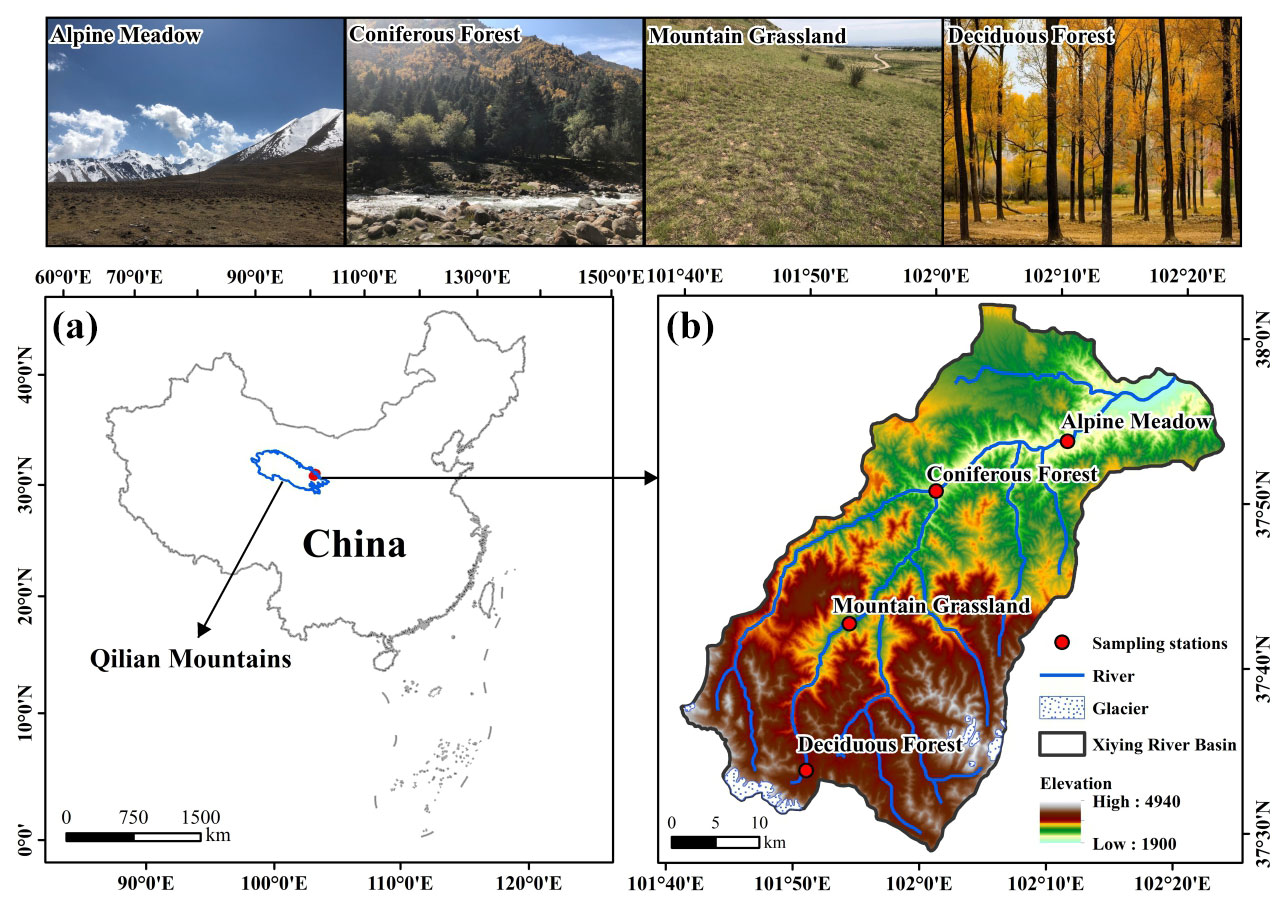
Figure 1Study area and location of sampling points. (a) The location of the Xiying River basin in China. (b) The terrain and sampling points of the Xiying River basin.
3.1 Sample collection
In this study, soil water and precipitation samples were collected from four vegetation zones in the Xiying River basin from April to October in 2017 (plant growing season). In 2017, the precipitation in AM, CF, MG and DF were 595.1, 431.9, 363.5 and 262.5 mm, respectively. The average daily temperature in AM, CF, MG and DF were −0.19, 3.34, 6.6 and 7.9∘, respectively (Table 1).
-
Collection of soil samples. Soil samples were collected once a month at depths of 0–10, 10–20, 20–30, 30–40, 40–50, 50–60, 60–70, 70–80, 80–90 and 90–100 cm from the soil layers in the four vegetation zones. Three duplicate samples were collected for each soil layer. We placed the collected soil sample into a 50 mL glass bottle, sealed the bottle mouth with Parafilm and marked the sampling date. We froze the sample for storage until experimental analysis. Each sample was collected separately in an aluminum box.
-
Collection of precipitation samples. The precipitation samples were collected by a plastic funnel bottle device. After each precipitation event, the collected precipitation samples were immediately transferred to an 80 mL high-density polyethylene bottle, and the bottle mouth of the samples was sealed with Parafilm; these samples were also frozen and stored until experimental analysis.
-
Meteorological data. During the sampling period, the local meteorological data were obtained and recorded by automatic weather stations (Watchdog 2000 series weather stations) set up near the sample plot.
Table 1Basic data of each vegetation zone from April to October 2017 (Longitude (Long), latitude (Lat), altitude (Alt), air temperature (T, daily mean temperature), precipitation (P, total precipitation during the observation period), relative humidity (h, daily mean relative humidity)).

3.2 Sample determination
The analysis of δ2H and δ18O values of all the above water samples was completed using a liquid-water isotope analyzer (DLT-100, Los Gatos Research, USA) in the stable isotope laboratory of Northwest Normal University. Before analyzing the isotope values of soil water, the soil water was extracted from the collected soil samples by a low-temperature vacuum condensation system (LI-2100, LICA United Technology Limited, China). Both the water and isotope standard samples were injected six times during the analysis. To avoid the “memory effect” of isotope analysis, we discarded the first two injection values and used the average value of the last four injections as the final result (Penna et al., 2012; Qu et al., 2020). The analysis results were relative to the Vienna Standard Mean Ocean Water (VSMOW):
where Rsample is the ratio of 18O 16O or 2H 1H in the sample and Rstandard is the ratio of 18O 16O or 2H 1H in VSMOW. The test error of the δ2H value does not exceed ±0.6 ‰, and the test error of the δ18O value does not exceed ±0.2 ‰.
3.3 Analysis method
3.3.1 Lc-excess
The linear relationship between δ2H and δ18O in precipitation and soil water is defined as the local meteoric water line(LMWL) and soil water line (SWL), respectively, which are of great significance for studying the evaporative fractionation of stable isotopes during the water cycle. We further calculated the lc-excess for each soil water and precipitation sample. The lc-excess in different water bodies can characterize the evaporation index of different water bodies relative to the local precipitation (Landwehr and Coplen, 2006):
where a and b are the slope and intercept of LMWL, respectively, and δ2H and δ18O are the isotopic values of hydrogen and oxygen in the sample. The physical meaning of lc-excess is expressed as the degree of deviation of the isotope value in the sample from LMWL, indicating the nonequilibrium dynamic fractionation process caused by evaporation. Generally, the change in lc-excess in local precipitation is mainly affected by different water vapor sources, and the annual average is 0. Since the stable isotopes in soil water are enriched by evaporation, the average lc-excess is usually negative (Landwehr et al., 2014; Sprenger et al., 2017).
3.3.2 Potential evapotranspiration
The potential evapotranspiration (PET) was calculated based on the Penman–Monteith equation (Allen, 1998):
where PET is the daily potential evapotranspiration (mm d−1), Rn is the net radiation (MJ m2 d−1), G is the soil heat flux density (MJ m2 d−1), γ is the psychrometric constant (kPa, u2 is the wind speed at 2 m height (m s−1), T is the mean daily air temperature at 2 m height (∘), Δ is the slope of the vapor pressure curve (kPa, ea is the actual vapor pressure (kPa) and es is the saturated vapor pressure (kPa). These data come from nearby weather stations.
3.3.3 Soil water storage
Soil water storage is the thickness of the water layer formed by all the water in a certain soil layer (Milly, 1994) and is expressed by the following formula:
where S is the soil water storage in a certain thickness layer (mm), R is the soil bulk density (g cm−3) and H is the soil thickness (cm). The gravimetric water content, W, is expressed by the following formula:
where M1 is the gravimetric value of wet soil (g) and M2 is the gravimetric value of dry soil (g).
4.1 Hydrological climate
The PET and runoff are important indicators that reflect the dry–wet conditions of river basins. During the study period (April–October 2017), in the Xiying River basin, PET was 872.8 mm. The daily evapotranspiration ranged from 7.5 mm (14 July) to 0.9 mm (9 October), showing a fluctuating trend around July, and the PET value in April–July was higher than that in August–October. The input of summer precipitation and ice/snow meltwater increased runoff, resulting in a trend similar to PET. During the observation period, the total runoff was 3.1×10⁹ m, accounting for 89 % of the annual runoff. The variation range of the daily runoff was 286 848 m3 (17 April) to 6 125 760 m3 (13 July). The basin before July was drier than that after July (Fig. 2).

To explore the differences in the natural environment in different vegetation zones, air temperature, atmospheric humidity and precipitation were used to indicate each research site's temperature and moisture conditions. The hilltop is a typical AM zone, with a daily average temperature of 6.1 ∘C, ranging from −9.7 ∘C (5 April) to 16.8 ∘C (27 July). The daily average humidity was 68.2 %, with little difference in different periods. During the observation period, there were 72 precipitation events in the AM zone, and the total precipitation was 534.3 mm, which was relatively evenly distributed each month. In the CF zone, the daily average temperature during the study period was 10.9 ∘C, ranging from −5.4 ∘C (5 April) to 22.0 ∘C (27 July). The daily average humidity was 62.5 %, and the precipitation was 400.6 mm, mainly concentrated from early August to late September. Close to the foothills is the MG zone, with a daily average temperature of 14.9 ∘C, ranging from −0.7 ∘C (5 April) to 25.3 ∘C (27 July). The average daily humidity was 51.1 %, and the precipitation of the vegetation zone during the observation period was 327.2 mm, mainly from late July to mid-August. During the observation period, the daily average temperature in the DF zone was 15.8 ∘C, ranging from −1.2 ∘C (6 April) to 26.3 ∘C (27 July). The daily average humidity was 54.7 %, and the total precipitation was 250.6 mm, which was concentrated in the month from late July to late August. The temperature of the studied regions were ordered as follows: AM < CF < MG < DF. The humidities of the studied regions were ordered as follows: AM > CF > MG > DF (Fig. 2).
4.2 Temporal variation in water stable isotopes in different vegetation zones
Influenced by different water sources and complex weather conditions in the precipitation process, the isotopic compositions of precipitation in the four vegetation zones were different during the study period. The mean values of δ2H and δ18O in the AM zone (number of samples: 72) were (−163.9 ‰–13.7 ‰) and ‰ (−23.1 ‰ to −1.3 ‰), respectively. The average δ2H and δ18O values of the CF zone (number of samples: 42) were ‰ (−117.8 ‰–13.0 ‰) and (−17.4 ‰ to −0.1 ‰), respectively. The average δ2H and δ18O values of the MG zone (number of samples: 37) were ‰ (−103.1 ‰–4.2 ‰) and (−15.1 ‰ to −0.9 ‰), respectively. The average δ2H and δ18O values of the DF zone (number of samples: 40) were ‰ (−110.2 ‰–23.2 ‰) and (−15.2 ‰–3.2 ‰), respectively (Table 2). The maximum isotopic values of the four vegetation zones appeared on 4 August (AM: 13.7 ‰, δ2H; −1.3 ‰, δ18O), 10 August (CF: 13.0 ‰, δ2H; −0.1 ‰, δ18O), 7 August (MG: 4.2 ‰, δ2H; −0.9 ‰, δ18O) and 13 August (DF: 23.2 ‰, δ2H; 3.2 ‰, δ18O). The highest temperature in each vegetation zone appeared on 27 July. The high temperature caused the precipitation to undergo strong below-cloud evaporation during the fall, leading to the enrichment of isotopes. In addition, the atmospheric precipitation isotopes of the four vegetation zones had similar temporal variations: from April to August, the fluctuations in δ2H and δ18O increased, reached the maximum in mid-August, and then gradually decreased (Fig. 3).
Table 2General characteristics of precipitation δ2H and δ18O in different vegetation areas from April to October 2017.
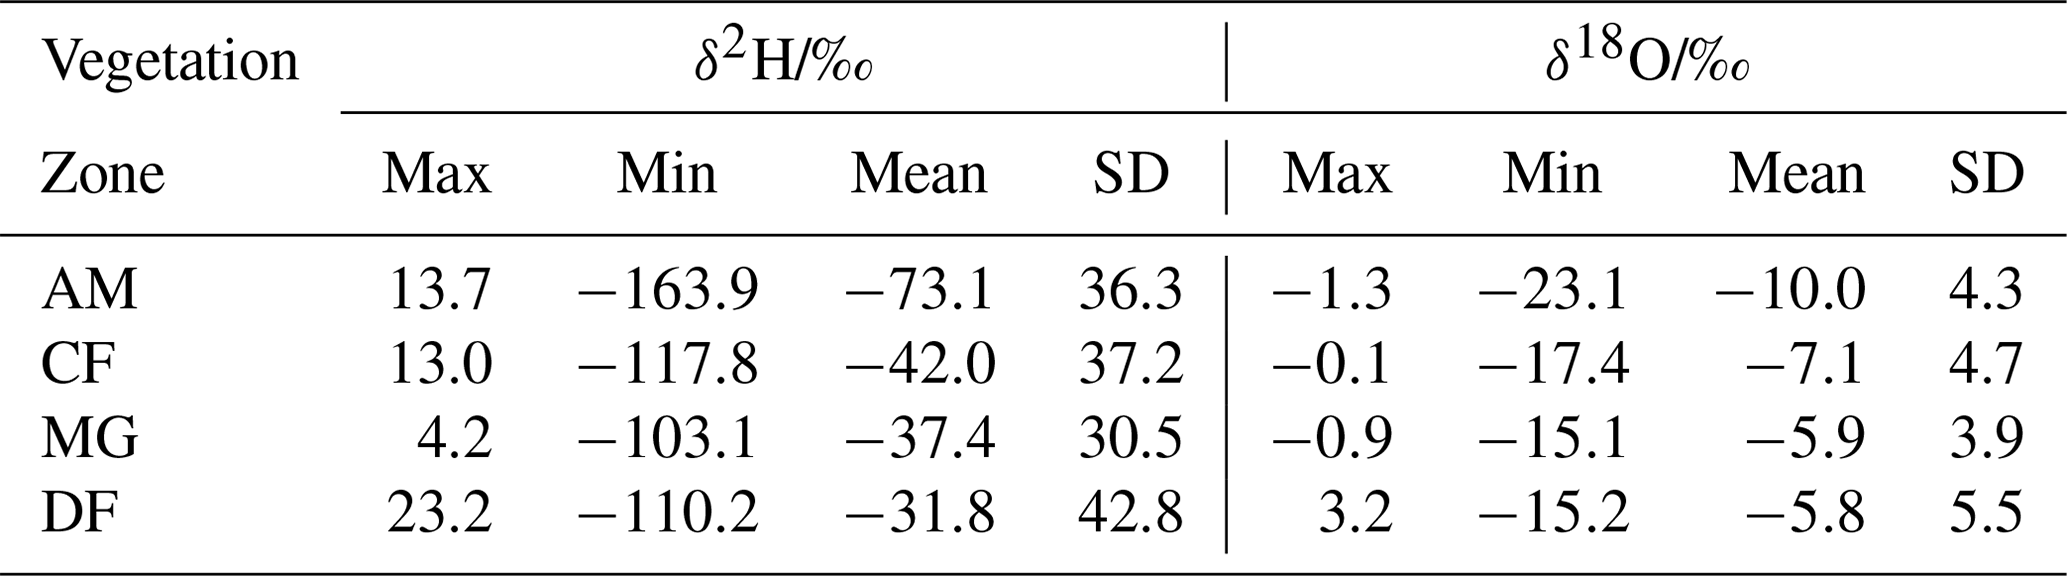
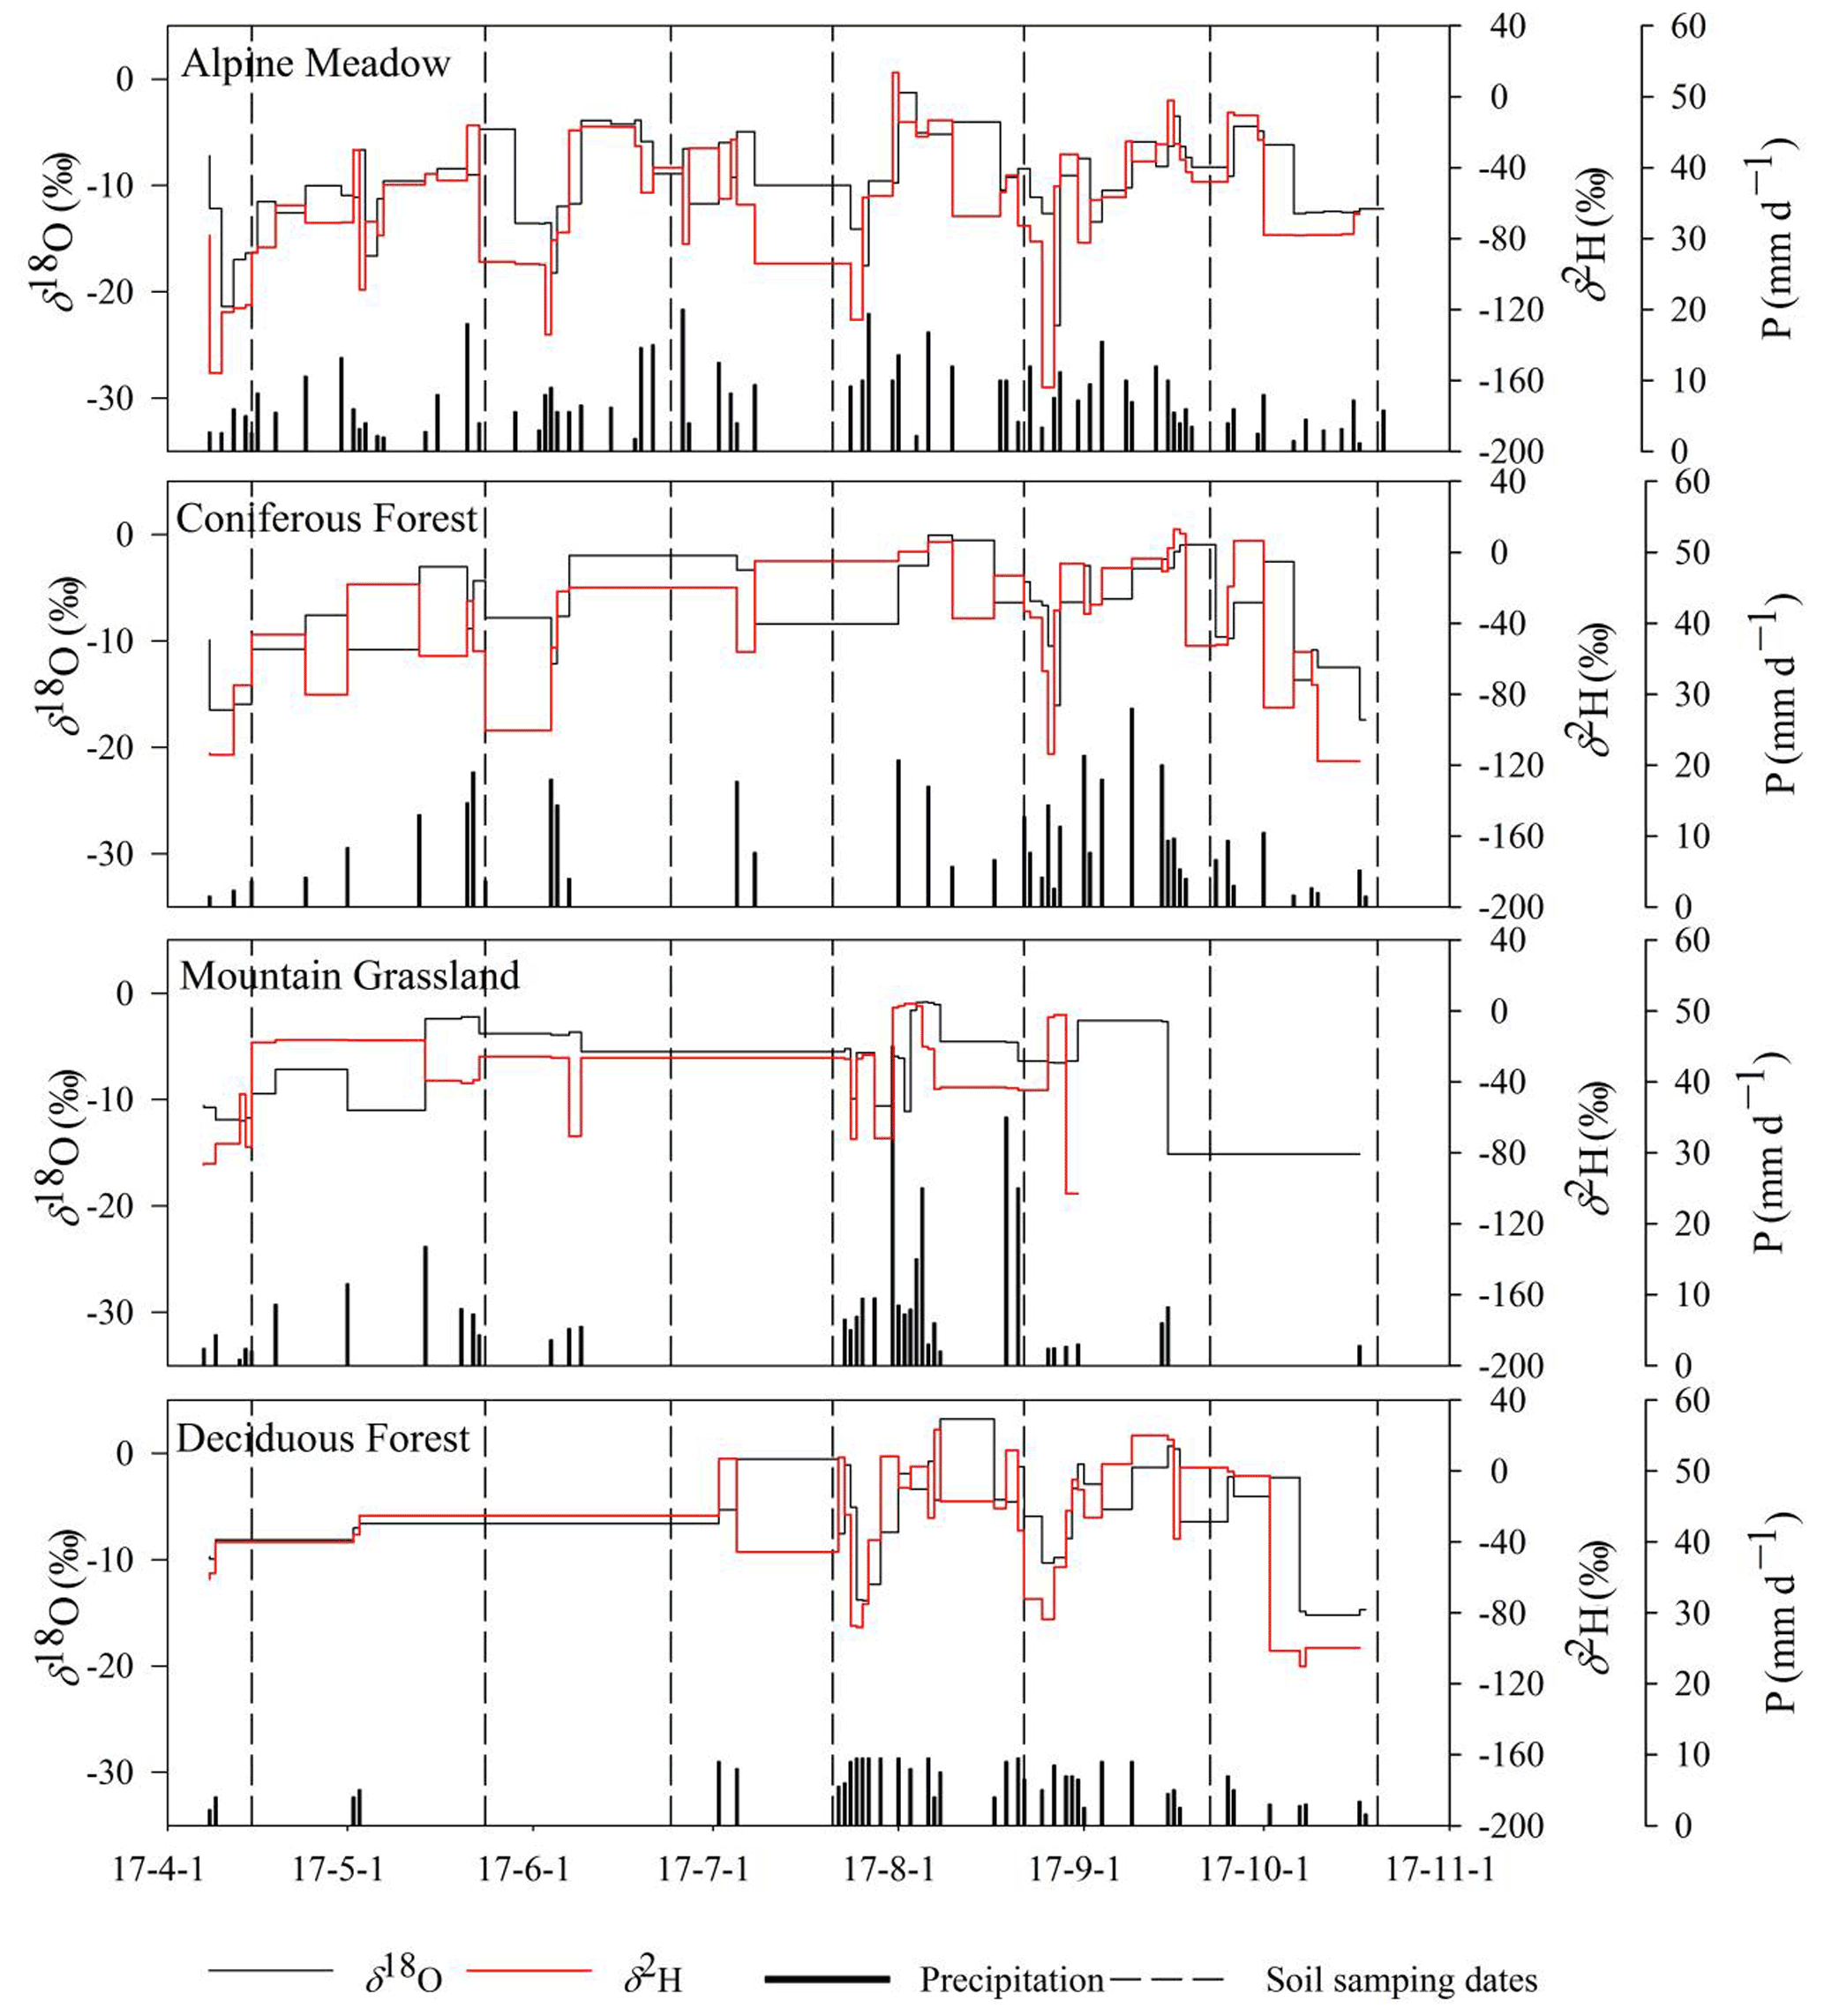
Figure 3Time series of rainfall and isotope characteristics in different vegetation zones of the Xiying River basin, with dotted lines indicating the date of soil water sampling.
The monthly variation in soil water isotopes records the signal of precipitation input and evaporation. The low-temperature environment and abundant precipitation events in AM make the monthly average δ2H and δ18O of soil water more depleted than in other vegetation zones (−69.4 ‰ to −51.6 ‰, δ2H; −7.5 ‰ to −10.3 ‰, δ18O). Despite this, the SWlc-excess of most samples at this station was still negative, and there were different degrees of evaporation in the process of precipitation penetrating the soil and mixing with original pore water, among which evaporation fractionation was stronger in July (−11.9 ‰ lc-excess) and October (−14.5 ‰ lc-excess). The soil water isotopes of CF gradually changed seasonally. From April to July, precipitation was scarce, the temperature rose, and the isotopes of soil water were gradually enriched on the surface (−52.7 ‰ to −29.5 ‰, δ2H; −7.0 ‰ to −2.1 ‰, δ18O), reaching the peak value of the observation period in July (−29.5 ‰, δ2H; −2.1 ‰, δ18O), and continuous rainfall input from late July to mid-August resulted in soil water isotope depletion (−57.0 ‰, δ2H; −8.1 ‰, δ18O). The SWlc-excess was an obvious fractionation signal in contrast to the trend of the isotope change, reaching the lowest value (−26.3 ‰) during the sampling period in July, and the change in air temperature and precipitation controlled the evaporation intensity. From April to July, the isotopic value of surface soil water in MG was higher (δ18O was greater than zero), and SWlc-excess was lower than −30 ‰. During this period, the evaporation and fractionation of shallow soil water were intense. As in CF, the input of heavy precipitation from late July to mid-August led to the depletion of soil water isotopes in MG. There was only sporadic rainfall in DF from April to July, and the soil water isotopes were gradually enriched on the surface (−46.1 ‰ to −18.2 ‰, δ2H; −4.7 ‰–0.2 ‰, δ18O), reached a peak in June when there was no rainfall event (−18.2 ‰, δ2H; 0.2 ‰, δ18O), and then became depleted (−53.2 ‰, δ2H; −5.2 ‰, δ18O). In addition, due to the influence of the Xiying Reservoir and vegetation coverage, the isotopic enrichment degree of soil water in this vegetation zone was lower than that in MG. As the most intuitive form of water change, the gravimetric water content was always at a low value in July (AM: 21.0 %; CF: 14.8 %; MG: 11.9 %; DF: 14.9 %), when the evaporation was the strongest, and it was most obvious in shallow soil (Table 3) (Fig. 4).
Table 3General characteristics of soil water δ2H, δ18O, lc-excess and gravimetric water content (GWC) in different vegetation areas from April to October 2017.
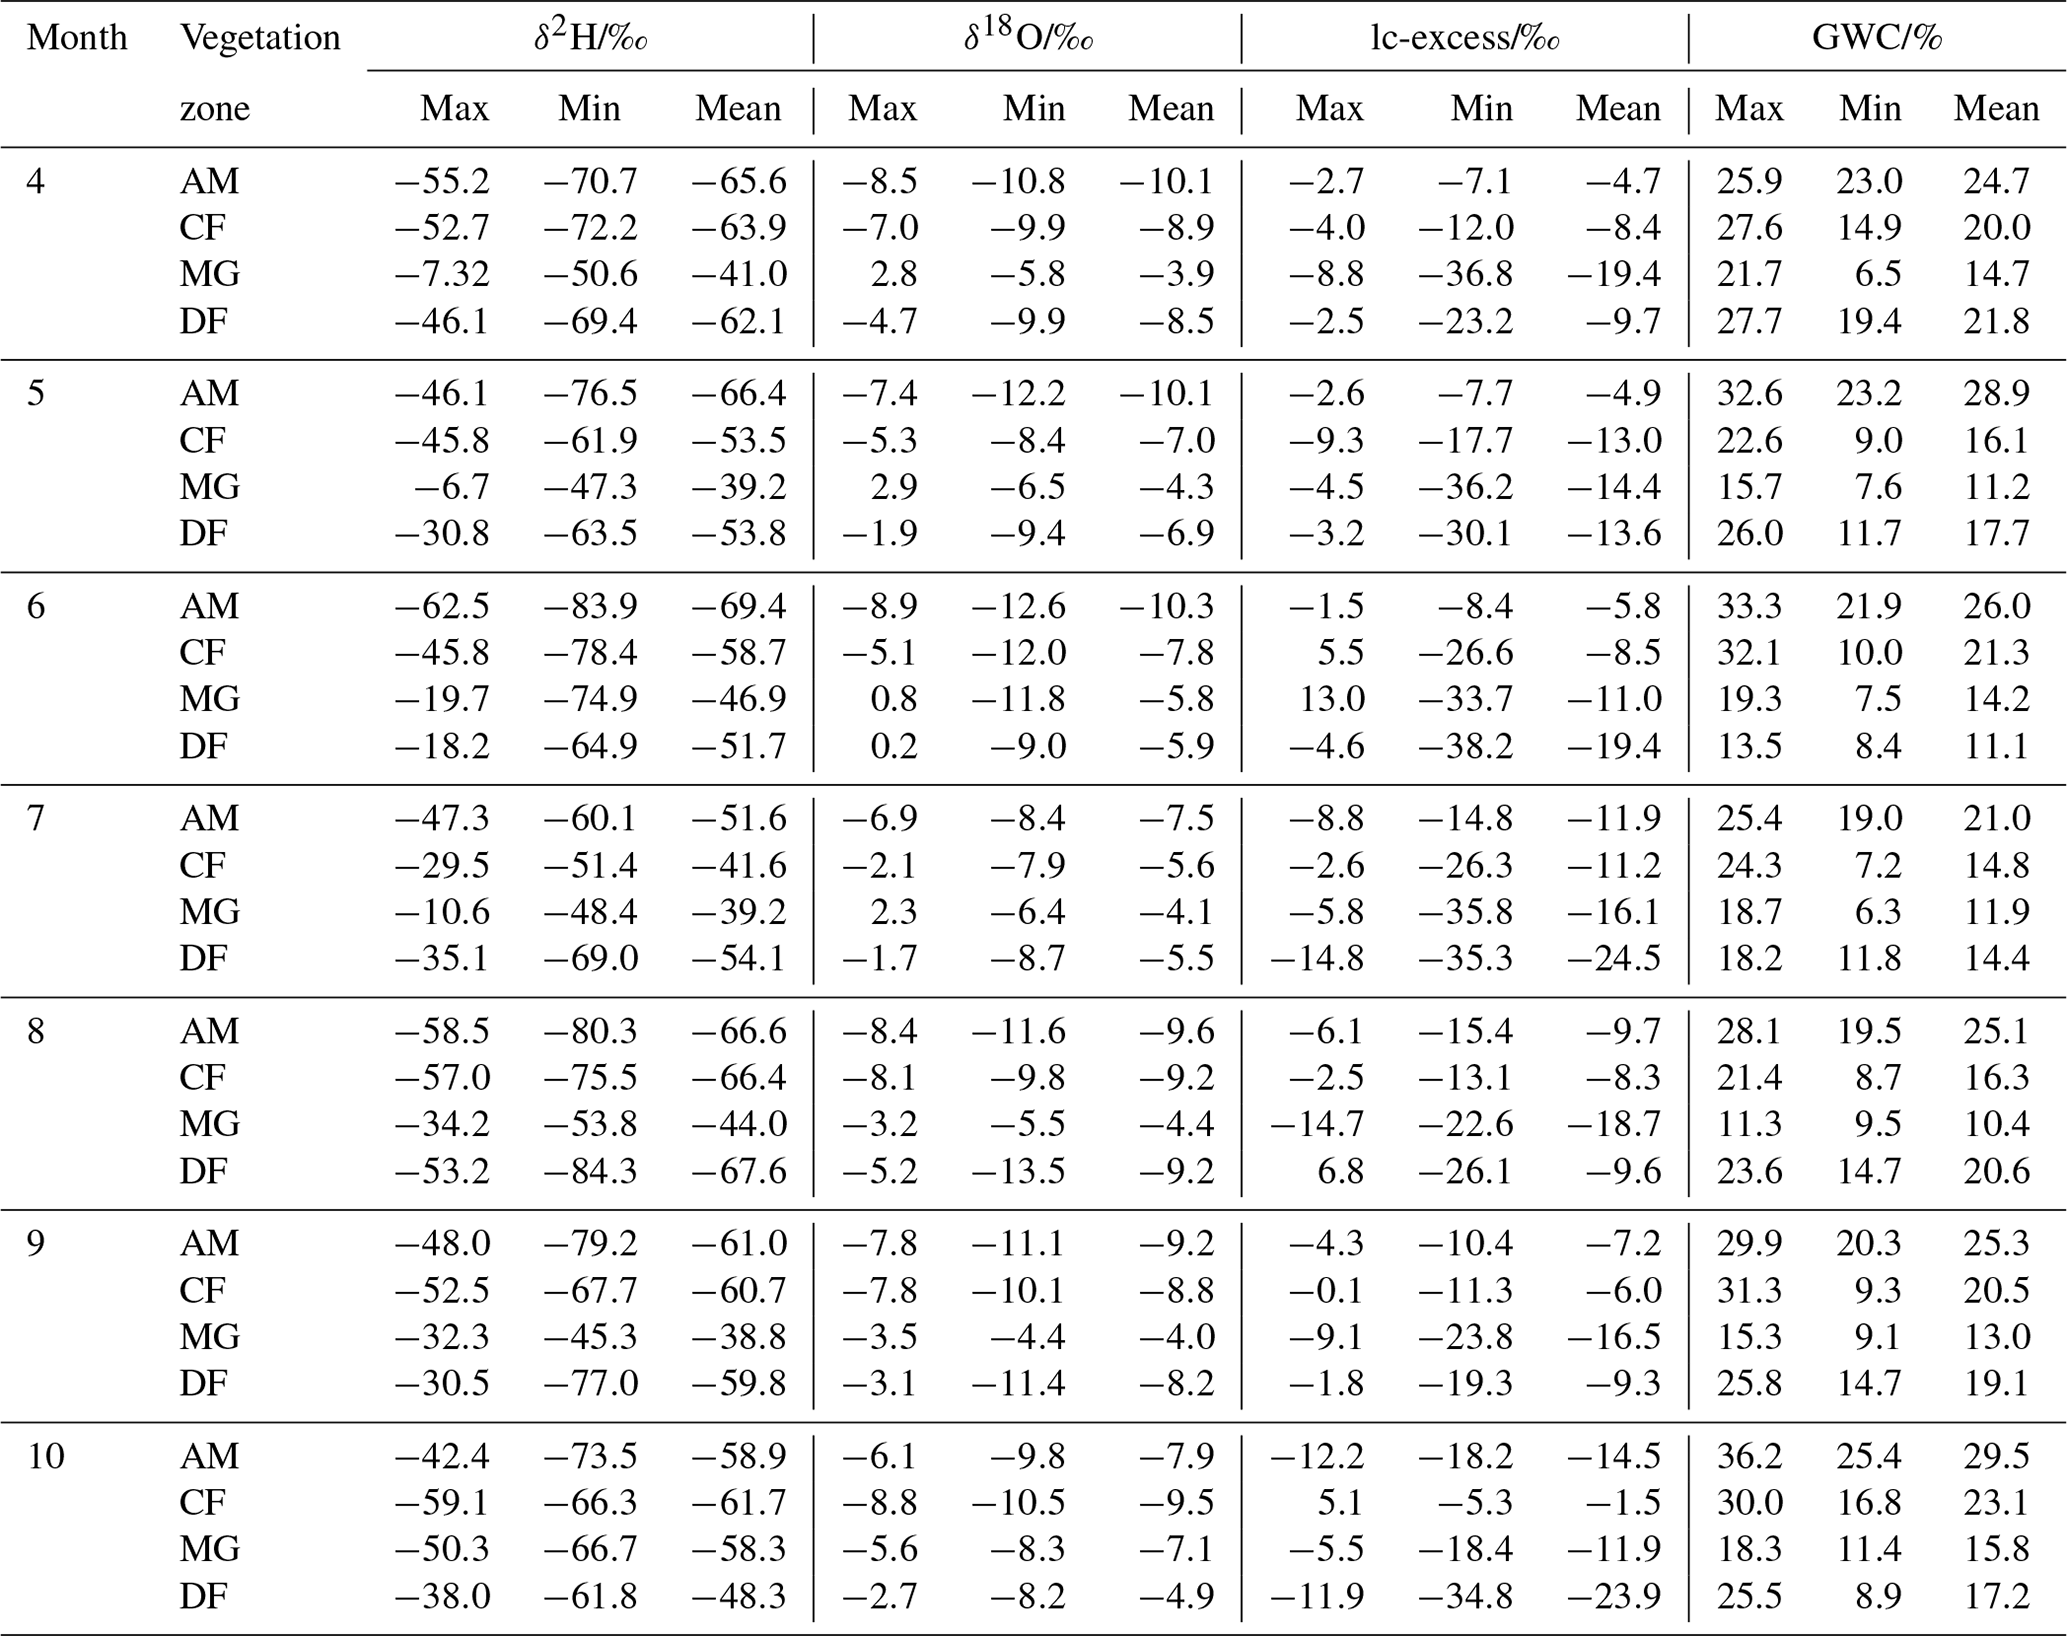

Figure 4Heat map of the soil depth profile of δ2H, δ18O, lc-excess and GWC in different vegetation zones, and the layer lacking measurement is indicated by the gray color.
4.3 Spatial variation in water stable isotopes in different vegetation zones
Isotope data of precipitation and soil water obtained from different vegetation zones are shown in the dual-isotope space in Fig. 5. At the AM observation station, the slope (8.4) and intercept (23) of the LMWL were higher than those of the global meteoric water line (GMWL). The slope of LMWL in the other three vegetation zones was lower than that of GMWL and gradually decreased with decreasing altitude. With the decrease in altitude, the slope of SWL decreased in all vegetation zones except for DF (AM: 6.4; CF: 4.7; MG: 3.4; DF: 4.1), indicating that the evaporation of soil moisture increased. On the one hand, the vegetation coverage of the DF site was higher. On the other hand, the Xiying Reservoir enhanced the regional air humidity and decreased the local water vapor circulation driving force.
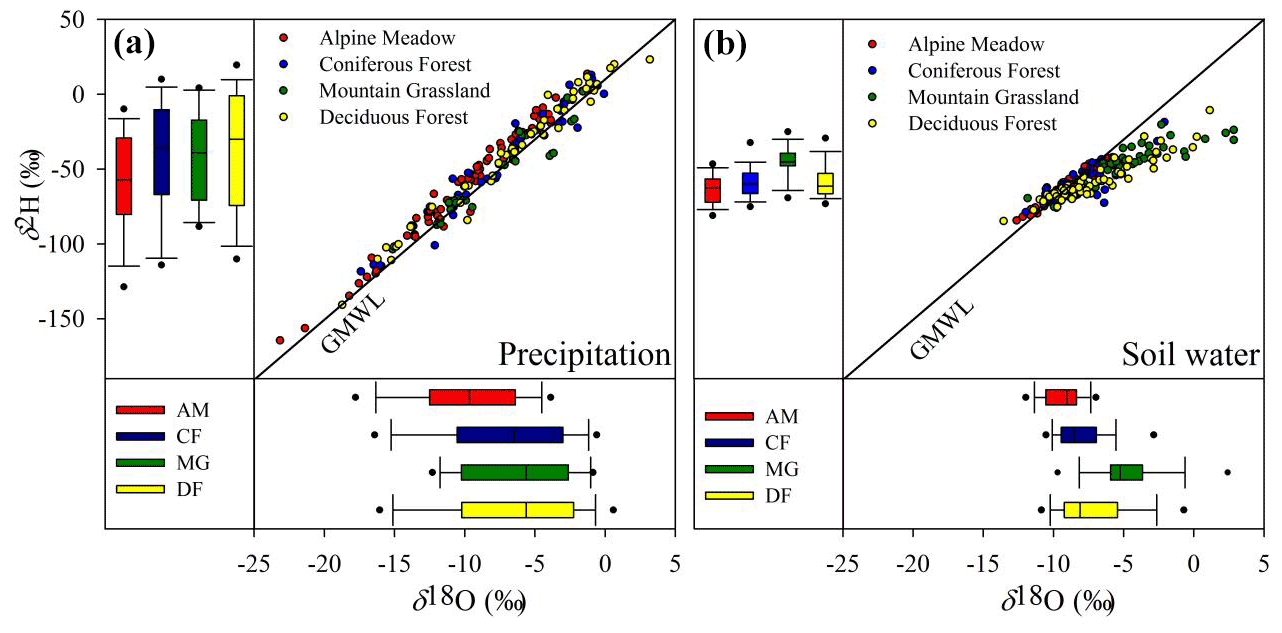
Figure 5Dual-isotope space of precipitation (a) and soil water (b) in isotope data of four vegetation zones. In the box plots, the box represents the 25th–75th percentile, the line in the box represents the median (50th percentile), the required line indicates 90th and 10th percentile, and the point indicates the 95th and 5th percentile.
During the study period, compared with that in other vegetation belts, the surface isotopic value of the soil water in MG was relatively enriched (−24.3 ‰, δ2H; −0.8 ‰, δ18O), the lc-excess was smaller and deeper into the middle and lower soil layers (−25.8 ‰), and the gravimetric water content was relatively low (8.4 %). Due to the difference in vegetation types and the influence of reservoirs, this change did not have an obvious elevation effect. Although the elevation was low, the soil water of DF had more depleted isotopic characteristics and higher soil moisture than those of MG in most samples. Soil profiles obtained from different vegetation zones can reflect the evaporation signals of water. The low-temperature natural environment made AM soil less affected by evaporation (lc-excess > −20 ‰), and the gravimetric water content was high (gravimetric water content >20 %) during the whole study period. The surface soil water of CF was easily affected by climate and had a higher isotopic composition (−29.5 ‰, δ2H; −2.1 ‰, δ18O) and lower lc-excess (−26.3 ‰). Due to evaporation, soil water isotopes in the MG and DF areas were enriched in the surface soil layer. In particular, in MG, the average values of δ2H and δ18O in the 0–10 cm soil layer were as high as −24.4 ‰ and −1.2 ‰, respectively, and SWlc-excess was lower than −25 ‰, even close to −40 ‰ in some samples. In this case, the evaporation signals can easily penetrate the deep soil, making the gravimetric water content values at all the sampling sites lower than 20 % (Figs. 4, 6).
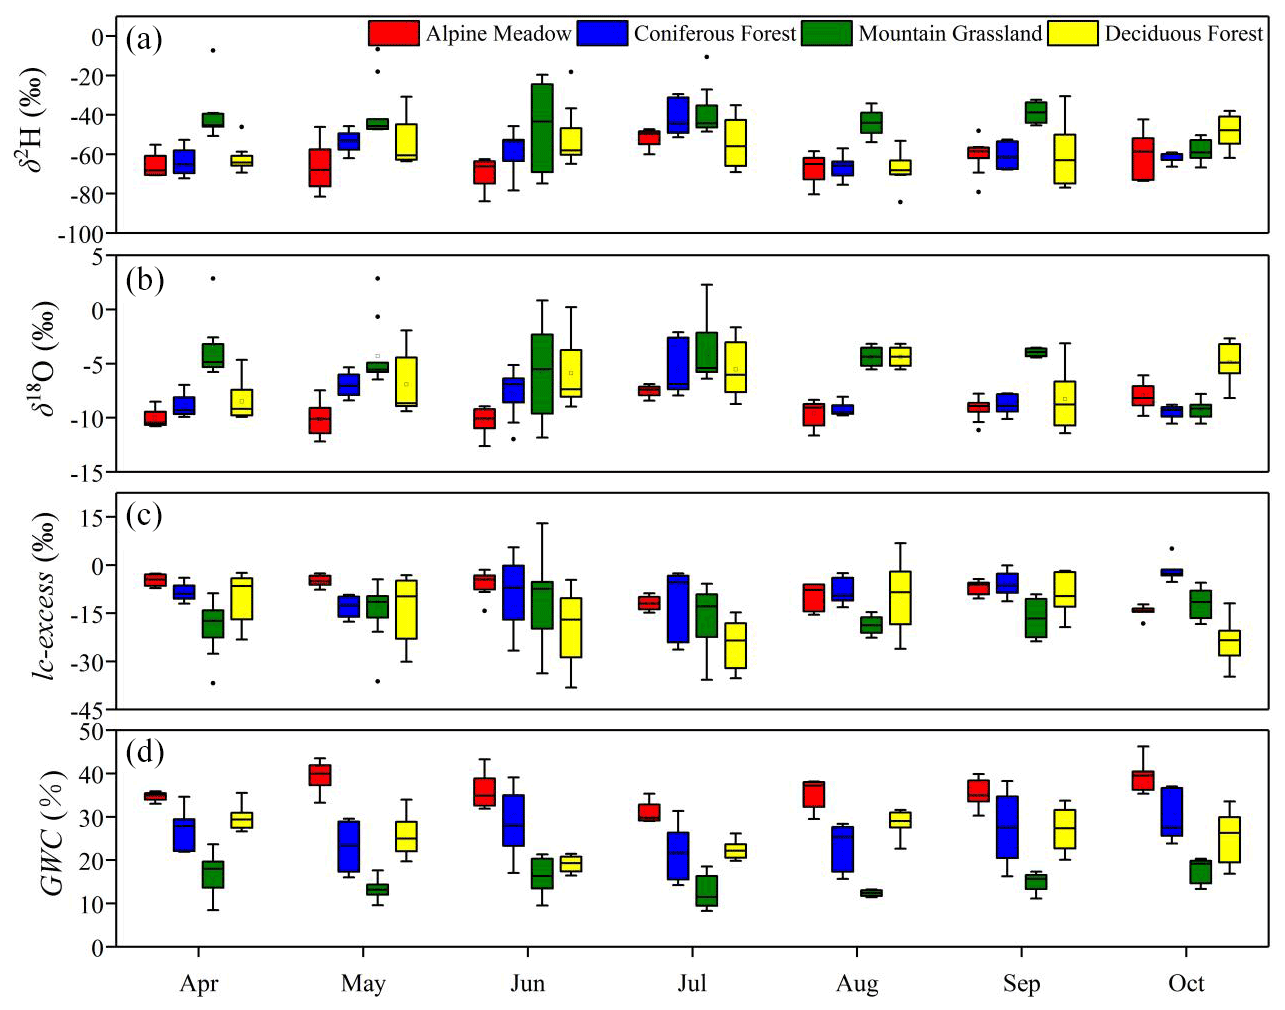
Figure 6The variation of δ2H, δ18O, lc-excess and GWC in different vegetation zones in each sampling.
4.4 Variations in the water storage capacity of the 0–40 cm soil layer in different vegetation areas
This study used soil water to calculate the water storage of the 0–40 cm soil layer in the four vegetation zones during the observation period (Fig. 7). The water storage capacity of AM gradually decreased from April to July (209.7–167.2 mm), and increased after July (167.2–201.8 mm). The monthly average water storage capacity was lowest at 0–10 cm (43.0 mm) and highest at 30–40 cm (51.7 mm). The water storage capacity of CF gradually decreased from April to July (150.1–101.2 mm), and increased after July (101.2–160.0 mm). The monthly average water storage capacity was lowest at 0–10 cm (28.0 mm) and highest at 30–40 cm (40.0 mm). The water storage capacity of MG gradually decreased from April to July (80.3–64.0 mm), and increased after July (64.0–104.6 mm). The monthly average water storage capacity was lowest at 0–10 cm (17.5 mm) and highest at 20–30 cm (22.0 mm). The water storage capacity of DF gradually decreased from April to June (159.3–104.0 mm), increased from June to August (104.0–154.0 mm), and there was a decrease from August to October (154.0–111.8 mm). The monthly average water storage capacity was lowest at 0–10 cm (29.1 mm) and highest at 20–30 cm (35.0 mm). In general, the soil water storage capacity of the 0–10 cm soil layer was less than that of the other soil layers. The order of the water storage capacity of the 0–40 cm soil layer in the four vegetation zones is AM (46.9 mm) > DF (33.0 mm) > CF (32.1 mm) > MG (20.3 mm).
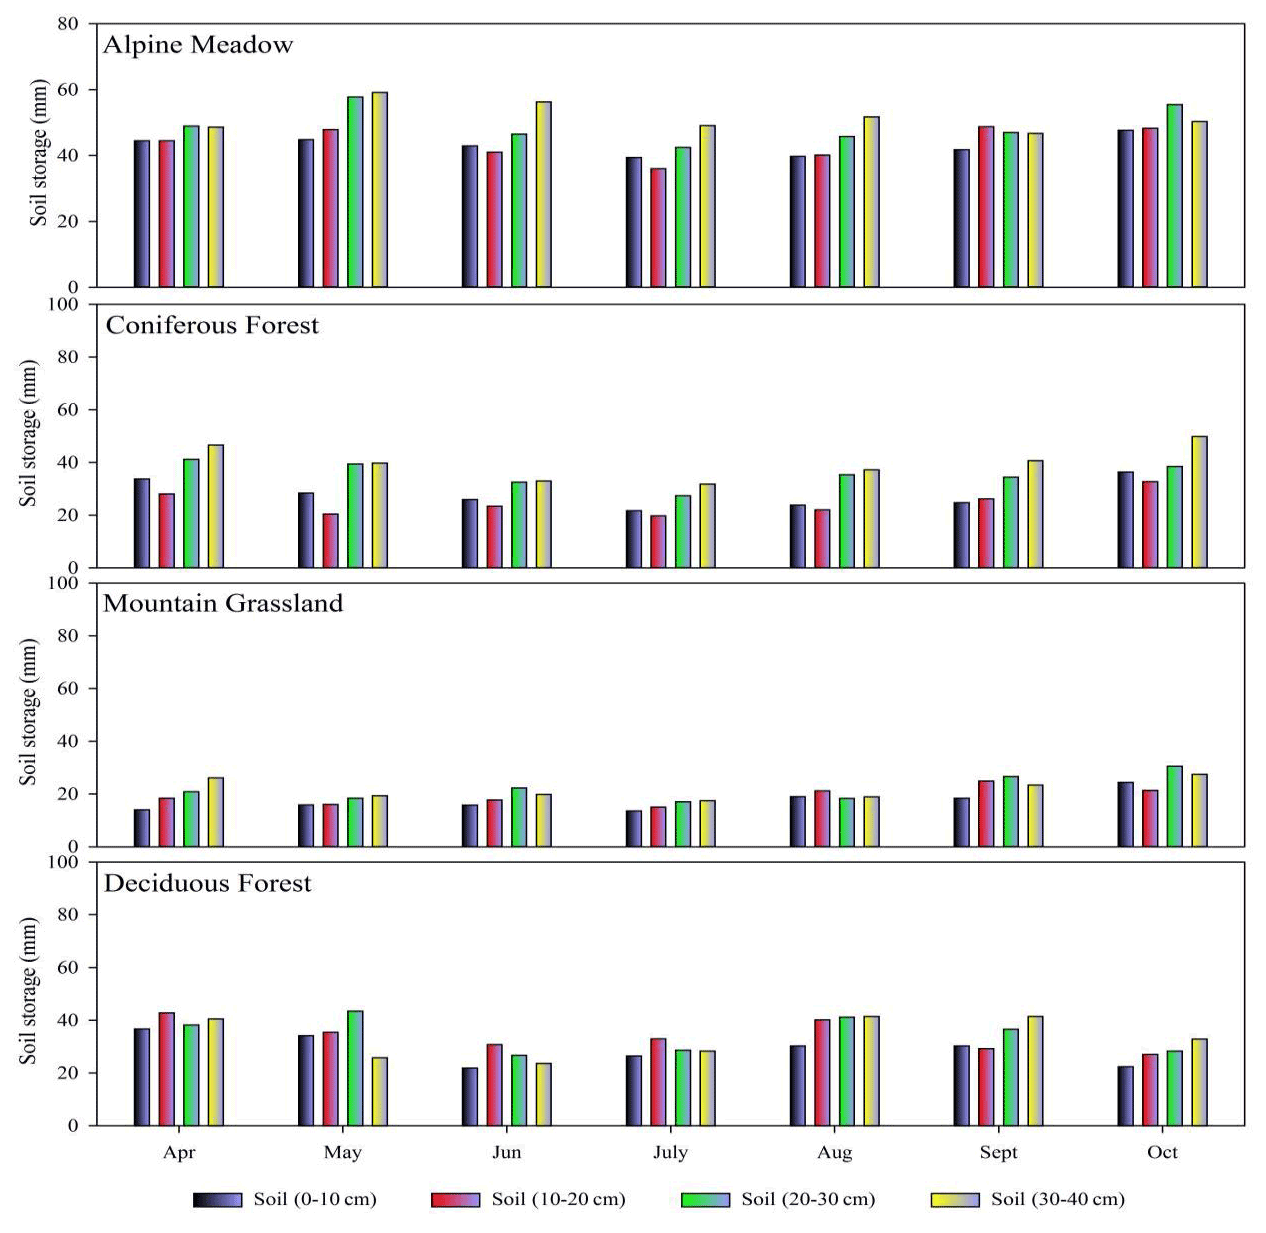
Figure 7Monthly variation of soil water storage in 0–40 cm soil layer of different vegetation zones.
5.1 Evaporation of soil moisture in different vegetation zones
In the arid river source area, the replenishment of soil moisture mainly comes from precipitation. The slope of the regional atmospheric precipitation line can reflect the strength of local evaporation. Due to a low atmospheric temperature, low cloud base height, and low air-saturated water vapor loss, the AM zone was weakly affected by secondary evaporation during precipitation. There, the slope of LMWL (8.4) was even higher than that of the GMWL (Hughes and Crawford, 2012). As the altitude decreased, the secondary evaporation under clouds strengthened, and the LMWL slope of each vegetation zone decreased (Pang et al., 2011). The slope of SWL can indicate the strength of soil moisture evaporation in each vegetation zone. The evaporation intensity results of the four vegetation zones followed the order of MG (SWLslop: 3.4) > DF (SWLslop: 4.1) > CF (SWLslop: 4.7) > AM (SWLslop: 6.4) (Fig. 5). The dynamic changes in lc-excess of soil profiles in different vegetation areas reflect the process of soil water evaporation caused by drought during the study period. The monthly average value of SWlc-excess in the AM zone was less than 0, and the minimum value was −11.9 ‰ (July). Although the vegetation belt was subject to different degrees of evaporation each month, it was less affected by drought, and it was difficult for evaporation to penetrate into the middle and lower soil layers. The SWlc-excess of the CF belt was greater than that of AM from April to June. The evaporation was the strongest in July (−11.2 ‰ lc-excess). As in AM, the evaporation mainly occurred in the topsoil of the CF belt. The vegetation coverage of the MG zone was low, and the arid environment made the isotopes of the surface soil produce strong evaporation signals (lc-excess was close to −40 ‰). In most samples, the SWlc-excess of the 60–80 cm soil layer was negative. The evaporation signal shifted to the lower layer of the soil (Barnes and Allison, 1988; Zimmermann et al., 1966). Similar evaporation signals have been found in the Mediterranean and arid climate regions (McCutcheon et al., 2017; Sprenger et al., 2016). Evaporation signals exist in only the surface soil of humid areas, and there is no difference between lc-excess and 0 in the soil layer below 20 cm (Sprenger et al., 2017). The monthly surface soil evaporation of DF was less than that of MG from April to June, and it was greater than that of MG after July, mainly due to the influence of the vegetation and reservoirs. There were commonalities in the soil moisture changes in different vegetation zones characterized by more enriched isotopes, stronger evaporation signals, and lower moisture content in the shallow soil. With increasing soil depth, the isotope gradually became depleted, and the evaporation signal was gradually weakened until it disappeared. The evolution of the investigated isotopes, lc-excess, and gravimetric water content in the unsaturated soil showed differences among different vegetation zones. From a high altitude to a low altitude, the isotopic value of the surface gradually increased, and the evaporation signal increased (Figs. 4, 6).
5.2 Memory effects of precipitation input, mixing and rewetting
The changes in soil water isotopes and soil moisture can evaluate the input, mixing and rewetting precipitation process in different vegetation areas. The main methods of precipitation input are plug flow and preferential flow. Plug flow is the complete mixing of water through the soil matrix with shallow free water. Under the action of plug flow, precipitation infiltrates along the hydraulic gradient, pushing the original soil water downward. Preferential flow means that precipitation uses soil macropores to quickly penetrate shallow soil to form deep leakage (Tang and Feng, 2001). After precipitation, the variability of isotope signals at a certain soil depth can identify the seepage method of water (Peralta-Tapia et al., 2015). During the study period, the soils of the AM and CF areas were seasonally frozen and thawed year-round, and the difference in the soil isotope profile was small. The soil moisture profile showed a trend of water increasing from top to bottom, indicating the influence of the previous precipitation. The soil was humid, so the replenishment of soil water by precipitation had the characteristics of top-down piston replenishment. Preferential infiltration showed high variability in isotopic signals (Brodersen et al., 2000), and the rainwater in MG and DF flowed into the deep soil rapidly through the soil matrix via exposed soil fissures and roots. This resulted in the sudden depletion of soil isotopes at a depth of 60–100 cm. This may be due to the more recent depleted precipitation that quickly reached this depth and the preferential infiltration into the soil. Water movement and mixing in the unsaturated zone can be observed in the spatiotemporal variation in isotopes within 1 m of the soil profile, and the AM and CF zones underwent considerable rainfall. After a short period of weak evaporation, the soil was rewetted by the next rainfall. In AM, the soil moisture remained above 20 % each month. The MG and DF zones had only sporadic precipitation from mid-May to late July, and the soil moisture evaporated rapidly. With the decrease in air temperature and the occurrence of continuous precipitation after July, the soil was rewetted after 2 months of drought, and both vegetation zones showed the replacement and mixing of soil water isotopes and precipitation. The results showed that the soil water storage capacity of the mountain grassland (MG) was seriously insufficient, reflecting the incomplete rewetting of the soil by precipitation at the end of the study. In addition, low soil water storage capacity will enrich the remaining soil water isotopes (Barnes and Allison, 1988; Zimmermann et al., 1966). We observed the “memory effect” of soil rewetting caused by precipitation input and the mixing of different vegetation areas during the entire study period. The changes in soil moisture in each vegetation area reflect different climatic and hydrological characteristics (Figs. 4, 6).
5.3 Influencing factors of soil water storage capacity in arid headwater areas
As the temperature decreased rapidly with increasing height, precipitation and humidity increased to a certain extent, and the vegetation showed a strip-like alternation approximately parallel to the contour line, forming zonal vegetation with obvious differentiation (Yin et al., 2020). The dry–wet conditions of different vegetation zones restricted the soil water storage capacity in the basin. In the process of low-altitude vegetation zone replacement, the precipitation decreased, the temperature rose, the groundwater level dropped, and the soil water storage capacity was weak (Coussement et al., 2018; Kleine et al., 2020). The soil water storage capacity of the AM zone with low temperature and rainy weather was higher than that of other vegetation zones (results of the 0–40 cm soil layers from April to October: AM: 187.8 mm; CF: 128.4 mm; MG: 81.2 mm; DF: 132.1 mm). During the study period, the soil water storage capacity (0–40 cm) exceeded 165 mm each month. With the decrease in altitude, the monthly difference in dry–wet conditions in each vegetation zone gradually became obvious. With the increase in temperature during summer, the environment became dry, and the soil water storage capacity weakened (Sprenger et al., 2017). The soil water storage capacity of the CF zone began to decrease in April, and the water storage capacity of the 0–40 cm layer reached the minimum value (101.2 mm) in July. The variation in temperature and precipitation was the main reason for the monthly difference (Dubber and Werner, 2019). Although there was a certain water storage capacity in CF with some transpiration loss, the soil water storage capacity in this vegetation zone was not strong. The water storage capacity of MG soil was lower than that of the other vegetation zones. The continuous dry and warm weather in spring and summer led to the water storage capacity of 0–40 cm soil being lower than that of 100 mm every month. In particular, drought stress leads to insufficient soil moisture, making it difficult to maintain plant demand, resulting in sparse vegetation and large-scale exposed surface soil, which further accelerates surface water loss. The continuous precipitation from the end of July prevented further drought development, and the water input gradually restored the soil water storage capacity (Kleine et al., 2020). The DF had hydrothermal conditions similar to those of MG, but the soil porosity of the forest zone was obviously larger than that of the barren land, and its permeability was higher than that of the barren land. Precipitation infiltrated the ground through roots and turned into groundwater. The forest acted as a reservoir due to its strong water storage and soil conservation capacity (Sprenger et al., 2019). The water storage capacity of the 0–40 cm soil layer in DF was higher than 100 mm at each sampling time. In addition, the water content of the 0–40 cm soil layer in each vegetation zone increased with the deepening of the soil layer, and the water storage capacity of the surface soil was weak. The difference in soil properties also led to more water storage in the middle and lower soil layers with higher clay contents (Milly, 1994) (Fig. 7). Climate warming and the spatiotemporal imbalance of water resources have disturbed the ecological water balance of different vegetation zones in inland river source areas (Liu et al., 2015). Plant growth mainly depends on the water stored in shallow soil layers (Amin et al., 2020). Drought reduces soil water storage and inhibits plant growth (Li et al., 2020). To effectively improve and manage water resources in arid water source areas, exploring the heterogeneity of hydrological processes among different vegetation zones is necessary. This will provide a reference for the formulation of ecological policies.
This work provides further insights into the movement and mixing of soil water in different vegetation zones in arid source regions. During the study period, the dynamic changes in lc-excess in the soil profiles of different vegetation zones reflected the evaporation signals caused by drought. Soil water evaporation in spring and summer, and insufficient precipitation during the drought period, were the main driving forces of isotopic enrichment in the surface soil. The soil water evaporation intensity of the four vegetation zones followed the order of MG (SWLslop: 3.4) > DF (SWLslop: 4.1) > CF (SWLslop: 4.7) > AM (SWLslop: 6.4). In the MG and DF zones, drought caused the evaporation signal to penetrate deep into the middle and lower soil layers. The SWlc-excess below 70 cm of the ground surface remained negative. Soil water isotopes and gravimetric water content record the process of soil rewetting caused by precipitation input and mixing. The AM and CF zones have many precipitation events. After a short period of weak evaporation, the soil was rewetted by the next precipitation event. There was only sporadic precipitation in the MG and DF belts from mid-May to late July. After July, the temperature dropped, and continuous precipitation wet the soil again after 2 months of drought. The MG and DF zones had only sporadic precipitation from mid-May to late July. With the decrease in air temperature and continuous precipitation after July, the soil was rewetted after 2 months of drought. Moisture and temperature conditions were the key factors that restricted the soil water storage capacity in the different vegetation zones. The water storage capacity of the 0–40 cm soil layer results followed the order of AM (46.9 mm) > DF (33.0 mm) > CF (32.1 mm) > MG (20.3 mm). The water storage capacity of the surface soil in each vegetation zone was weak, and more water was stored in the middle and lower soil layers with higher clay contents. The research results can be applied to arid and semi-arid alpine regions and can be valuable for latitude and longitude differentiation. This study mainly emphasized the spatiotemporal heterogeneity of soil water evaporation, infiltration, and water storage in different vegetation zones. These results are important for understanding regional hydrological processes and ecological restoration services in environmentally fragile areas.
The ET0 calculator can be downloaded here: https://www.fao.org/fileadmin/user_upload/faowater/Applications/EToCalculator64Bit.zip (Allen, 1998).
The data sets that have been analyzed in this paper are available from the authors upon request.
GZ and LY conceived the idea of the study; YX and QW analyzed the data; ZS and LY were responsible for field sampling; ZZ participated in the experiment; LW participated in the drawing; LY wrote the paper; LS, XZ and YL checked and edited language. All authors discussed the results and revised the manuscript.
The contact author has declared that none of the authors has any competing interests.
Publisher's note: Copernicus Publications remains neutral with regard to jurisdictional claims in published maps and institutional affiliations.
This article is part of the special issue “Experiments in Hydrology and Hydraulics”. It is not associated with a conference.
This research was financially supported by the National Natural Science Foundation of China (41661005, 41867030, 41971036). The authors much thank the colleagues in the Northwest Normal University for their help in fieldwork, laboratory analysis and data processing.
This research has been supported by the National Natural Science Foundation of China (grant nos. 41661005, 41867030, 41971036).
This paper was edited by Jorge Isidoro and reviewed by three anonymous referees.
Allen, R. G.: Crop evapotranspiration: guidelines for computing crop water requirements, FAO irrigation and drainage paper, edited, Food and Agriculture Organization of the United Nations, Rome, 300 pp., https://www.fao.org/fileadmin/user_upload/faowater/Applications/EToCalculator64Bit.zip (last access: 18 July 2022), 1998.
Amin, A., Zuecco, G., Geris, J., Schwendenmann, L., McDonnell, J. J., Borga, M., and Penna, D.: Depth distribution of soil water sourced by plants at the global scale: A new direct inference approach, Ecohydrology, 13, e2177, https://doi.org/10.1002/eco.2177, 2020.
Barnes, C. J. and Allison, G. B.: Tracing of water movement in the unsaturated zone using stable isotopes of hydrogen and oxygen, J. Hydrol., 100, 143–176, https://doi.org/10.1016/0022-1694(88)90184-9, 1988.
Brodersen, C., Pohl, S., Lindenlaub, M., Leibundgut, C., and Wilpert, K. V.: Influence of vegetation structure on isotope content of throughfall and soil water, Hydrol. Process., 14, 1439–1448, 2000.
Brooks, R. J., Barnard, H. R., Coulombe, R., and McDonnell, J. J.: Ecohydrologic separation of water between trees and streams in a Mediterranean climate, Nat. Geosci., 3, 100–104, https://doi.org/10.1038/ngeo722, 2010.
Coussement, T., Maloteau, S., Pardon, P., Artru, S., Ridley, S., Javaux, M., and Garré, S.: A tree-bordered field as a surrogate for agroforestry in temperate regions: Where does the water go?, Agr. Water Manage., 210, 198–207, https://doi.org/10.1016/j.agwat.2018.06.033, 2018.
Dansgaard, W.: Stable isotopes in precipitation, Tellus, 16, 436–468, https://doi.org/10.3402/tellusa.v16i4.8993, 1964.
Dubbert, M. and Werner, C.: Water fluxes mediated by vegetation: emerging isotopic insights at the soil and atmosphere interfaces, New Phytol., 221, 1754–1763, https://doi.org/10.1111/nph.15547, 2019.
Duvert, C., Stewart, M. K., Cendón, D. I., and Raiber, M.: Time series of tritium, stable isotopes and chloride reveal short-term variations in groundwater contribution to a stream, Hydrol. Earth Syst. Sci., 20, 257–277, https://doi.org/10.5194/hess-20-257-2016, 2016.
Ferretti, D. F., Pendall, E., Morgan, J. A., Nelson, J. A., LeCain, D., and Mosier, A. R.: Partitioning evapotranspiration fluxes from a Colorado grassland using stable isotopes: Seasonal variations and ecosystem implications of elevated atmospheric CO2, Plant Soil, 254, 291–303, https://doi.org/10.1023/A:1025511618571, 2003.
Gibson, J. J., Holmes, T., Stadnyk, T. A., Birks, S. J., Eby, P., and Pietroniro, A.: Isotopic constraints on water balance and evapotranspiration partitioning in gauged watersheds across Canada, J. Hydrol., 37, 100878, https://doi.org/10.1016/j.ejrh.2021.100878, 2021.
Grant, G. E. and Dietrich, W. E.: The frontier beneath our feet, Water Resour. Res., 53, 2605–2609, https://doi.org/10.1002/2017WR020835, 2017.
Hughes, C. E. and Crawford, J.: A new precipitation weighted method for determining the meteoric water line for hydrological applications demonstrated using Australian and global GNIP data, J. Hydrol., 464, 344–351, https://doi.org/10.1016/j.jhydrol.2012.07.029, 2012.
Kleine, L., Tetzlaff, D., Smith, A., Wang, H., and Soulsby, C.: Using water stable isotopes to understand evaporation, moisture stress, and re-wetting in catchment forest and grassland soils of the summer drought of 2018, Hydrol. Earth Syst. Sci., 24, 3737–3752, https://doi.org/10.5194/hess-24-3737-2020, 2020.
Koeniger, P., Gaj, M., Beyer, M., and Himmelsbach, T.: Review on soil water isotope-based groundwater recharge estimations, Hydrol. Process., 30, 2817–2834, https://doi.org/10.1002/hyp.10775, 2016.
Landwehr, J. M. and Coplen, T. B.: Line-conditioned excess: a new method for characterizing stable hydrogen and oxygen isotope ratios in hydrologic systems, in: International conference on isotopes in environmental studies, IAEA, Vienna, 132–135, 2006.
Landwehr, J. M., Coplen, T. B., and Stewart, D. W.: Spatial, seasonal, and source variability in the stable oxygen and hydrogen isotopic composition of tap waters throughout the USA, Hydrol. Process., 28, 5382–5422, https://doi.org/10.1002/hyp.10004, 2014.
Li, X., Piao, S., Wang, K., Wang, X., Wang, T., Ciais, P., Chen, A., Lian, X., Peng, S., and Peñuelas, J.: Temporal trade-off between gymnosperm resistance and resilience increases forest sensitivity to extreme drought, Nat. Ecol. Evol., 4, 1075–1083, https://doi.org/10.1038/s41559-020-1217-3, 2020.
Liu, Y., Liu, F., Xu, Z., Zhang, J., Wang, L., and An, S.: Variations of soil water isotopes and effective contribution times of precipitation and throughfall to alpine soil water, in Wolong Nature Reserve, China, Catena, 126, 201–208, https://doi.org/10.1016/j.catena.2014.11.008, 2015.
Ma, X., Jia, W., Zhu, G., Ding, D., Pan, H., Xu, X., Guo, H., Zhang, Y., and Yuan, R.: Stable isotope composition of precipitation at different elevations in the monsoon marginal zone, Quat. Int., 493, 86–95, https://doi.org/10.1016/j.quaint.2018.06.038, 2018.
McCutcheon, R. J., McNamara, J. P., Kohn, M. J., and Evans, S. L.: An evaluation of the ecohydrological separation hypothesis in a semiarid catchment, Hydrol. Process., 31, 783–799, https://doi.org/10.1002/hyp.11052, 2017.
Milly, P. C. D.: Climate, soil water storage, and the average annual water balance, Water Resour. Res., 30, 2143–2156, https://doi.org/10.1029/94WR00586, 1994.
Pang, Z., Kong, Y., Froehlich, K., Huang, T., Yuan, L., Li, Z., and Wang, F.: Processes affecting isotopes in precipitation of an arid region, Tellus B, 63, 352–359, https://doi.org/10.1111/j.1600-0889.2011.00532.x, 2011.
Penna, D., Stenni, B., Šanda, M., Wrede, S., Bogaard, T. A., Michelini, M., Fischer, B. M. C., Gobbi, A., Mantese, N., Zuecco, G., Borga, M., Bonazza, M., Sobotková, M., Čejková, B., and Wassenaar, L. I.: Technical Note: Evaluation of between-sample memory effects in the analysis of δ2H and δ18O of water samples measured by laser spectroscopes, Hydrol. Earth Syst. Sci., 16, 3925–3933, https://doi.org/10.5194/hess-16-3925-2012, 2012.
Penna, D., Hopp, L., Scandellari, F., Allen, S. T., Benettin, P., Beyer, M., Geris, J., Klaus, J., Marshall, J. D., Schwendenmann, L., Volkmann, T. H. M., von Freyberg, J., Amin, A., Ceperley, N., Engel, M., Frentress, J., Giambastiani, Y., McDonnell, J. J., Zuecco, G., Llorens, P., Siegwolf, R. T. W., Dawson, T. E., and Kirchner, J. W.: Ideas and perspectives: Tracing terrestrial ecosystem water fluxes using hydrogen and oxygen stable isotopes – challenges and opportunities from an interdisciplinary perspective, Biogeosciences, 15, 6399–6415, https://doi.org/10.5194/bg-15-6399-2018, 2018.
Peralta-Tapia, A., Sponseller, R. A., Tetzlaff, D., Soulsby, C., and Laudon, H.: Connecting precipitation inputs and soil flow pathways to stream water in contrasting boreal catchments, Hydrol. Process., 29, 3546–3555, https://doi.org/10.1002/hyp.10300, 2015.
Qu, D., Tian, L., Zhao, H., Yao, P., Xu, B., and Cui, J.: Demonstration of a memory calibration method in water isotope measurement by laser spectroscopy, Rapid Commun. Mass Sp., 34, e8689, https://doi.org/10.1002/rcm.8689, 2020.
Rothfuss, Y. and Javaux, M.: Reviews and syntheses: Isotopic approaches to quantify root water uptake: a review and comparison of methods, Biogeosciences, 14, 2199–2224, https://doi.org/10.5194/bg-14-2199-2017, 2017.
Sharma, H., Ehlers, T. A., Glotzbach, C., Schmid, M., and Tielbörger, K.: Effect of rock uplift and Milankovitch timescale variations in precipitation and vegetation cover on catchment erosion rates, Earth Surf. Dynam., 9, 1045–1072, https://doi.org/10.5194/esurf-9-1045-2021, 2021.
Snelgrove, J. R., Buttle, J. M., Kohn, M. J., and Tetzlaff, D.: Co-evolution of xylem water and soil water stable isotopic composition in a northern mixed forest biome, Hydrol. Earth Syst. Sci., 25, 2169–2186, https://doi.org/10.5194/hess-25-2169-2021, 2021.
Sprenger, M., Leistert, H., Gimbel, K., and Weiler, M.: Illuminating hydrological processes at the soil-vegetation-atmosphere interface with water stable isotopes, Rev. Geophys., 54, 674–704, https://doi.org/10.1002/2015RG000515, 2016.
Sprenger, M., Tetzlaff, D., and Soulsby, C.: Soil water stable isotopes reveal evaporation dynamics at the soil–plant–atmosphere interface of the critical zone, Hydrol. Earth Syst. Sci., 21, 3839–3858, https://doi.org/10.5194/hess-21-3839-2017, 2017.
Sprenger, M., Llorens, P., Cayuela, C., Gallart, F., and Latron, J.: Mechanisms of consistently disjunct soil water pools over (pore) space and time, Hydrol. Earth Syst. Sci., 23, 2751–2762, https://doi.org/10.5194/hess-23-2751-2019, 2019.
Tang, K. and Feng, X.: The effect of soil hydrology on the oxygen and hydrogen isotopic compositions of plants' source water, Earth Planet. Sc. Lett., 185, 355–367, https://doi.org/10.1016/S0012-821X(00)00385-X, 2001.
Tetzlaff, D., Soulsby, C., Buttle, J., Capell, R., Carey, S. K., Laudon, H., McDonnell, J., McGuire, K., Seibert, J., and Shanley, J.: Catchments on the cusp?, Structural and functional change in northern ecohydrology, Hydrol. Process., 27, 766–774, https://doi.org/10.1002/hyp.9700, 2013.
Xiao, W., Wei, Z., and Wen, X.: Evapotranspiration partitioning at the ecosystem scale using the stable isotope method – A review, Agr. Forest Meteorol., 263, 346–361, https://doi.org/10.1016/j.agrformet.2018.09.005, 2018.
Yin, L., Dai, E., Zheng, D., Wang, Y., Ma, L., and Tong, M.: What drives the vegetation dynamics in the Hengduan Mountain region, southwest China: Climate change or human activity?, Ecol. Indic., 112, 106013, https://doi.org/10.1016/j.ecolind.2019.106013, 2020.
Zhu, G., Yong, L., Zhang, Z., Sun, Z., Sang, L., Liu, Y., Wang, L., and Guo, H.: Infiltration process of irrigation water in oasis farmland and its enlightenment to optimization of irrigation mode: Based on stable isotope data, Agr. Water Manage., 258, 107173, https://doi.org/10.1016/j.agwat.2021.107173, 2021a.
Zhu, G., Yong, L., Zhang, Z., Sun, Z., Wan, Q., Xu, Y., Ma, H., Sang, L., Liu, Y., Wang, L., Zhao, K., and Guo, H.: Effects of plastic mulch on soil water migration in arid oasis farmland: Evidence of stable isotopes, Catena, 207, 105580, https://doi.org/10.1016/j.catena.2021.105580, 2021b.
Zimmermann, U., Münnich, K. O., Roether, W., Kreutz, W., Schubach, K., and Siegel, O.: Tracers Determine Movement of Soil Moisture and Evapotranspiration, Science, 152, 346–347, https://doi.org/10.1126/science.152.3720.346, 1966.