the Creative Commons Attribution 4.0 License.
the Creative Commons Attribution 4.0 License.
 | 18 Jul 2022
A conceptual-model-based sediment connectivity assessment for patchy agricultural catchments
Pedro V. G. Batista
Peter Fiener
Simon Scheper
Christine Alewell
The accelerated sediment supply from agricultural soils to riverine and lacustrine environments leads to negative off-site consequences. In particular, the sediment connectivity from agricultural land to surface waters is strongly affected by landscape patchiness and the linear structures that separate field parcels (e.g. roads, tracks, hedges, and grass buffer strips). Understanding the interactions between these structures and sediment transfer is therefore crucial for minimising off-site erosion impacts. Although soil erosion models can be used to understand lateral sediment transport patterns, model-based connectivity assessments are hindered by the uncertainty in model structures and input data. Specifically, the representation of linear landscape features in numerical soil redistribution models is often compromised by the spatial resolution of the input data and the quality of the process descriptions. Here we adapted the Water and Tillage Erosion Model and Sediment Delivery Model (WaTEM/SEDEM) using high-resolution spatial data (2 m × 2 m) to analyse the sediment connectivity in a very patchy mesoscale catchment (73 km2) of the Swiss Plateau. We used a global sensitivity analysis to explore model structural assumptions about how linear landscape features (dis)connect the sediment cascade, which allowed us to investigate the uncertainty in the model structure. Furthermore, we compared model simulations of hillslope sediment yields from five subcatchments to tributary sediment loads, which were calculated with long-term water discharge and suspended sediment measurements. The sensitivity analysis revealed that the assumptions about how the road network (dis)connects the sediment transfer from field blocks to water courses had a much higher impact on modelled sediment yields than the uncertainty in model parameters. Moreover, model simulations showed a higher agreement with tributary sediment loads when the road network was assumed to directly connect sediments from hillslopes to water courses. Our results ultimately illustrate how a high-density road network combined with an effective drainage system increases sediment connectivity from hillslopes to surface waters in agricultural landscapes. This further highlights the importance of considering linear landscape features and model structural uncertainty in soil erosion and sediment connectivity research.
- Article
(8926 KB) - Full-text XML
-
Supplement
(562 KB) - BibTeX
- EndNote


Rainfall events on sloped surfaces continuously displace soil particles, which are transported downslope as sediments. These sediments are then stored and remobilised several times before conceivably reaching surface waters. Accordingly, the sediment cascade is a natural and potentially long geomorphological process (Fryirs, 2013). However, the accelerated sediment supply from agricultural soils to riverine and lacustrine environments leads to negative off-site consequences. Specifically, phosphorus-rich and pollutant-bound particulate matter from arable land is associated with the eutrophication and contamination of water courses (Krasa et al., 2019; Laceby et al., 2021). Extreme erosion events in agricultural fields are also linked to the occurrence of muddy floods (Boardman, 2020) and to damages to downstream infrastructure (Bauer et al., 2019). Therefore, understanding how and when sediment is transferred from agricultural fields to different landscape compartments is imperative to reduce off-site erosion impacts.
The degree to which a system facilitates sediment transfer within its internal compartments is defined by Heckmann et al. (2018) as sediment connectivity. This concept can be further distinguished into a structural component, associated to the semi-static spatial configuration of the landscape, and a functional one, which emerges as a dynamic property of the hydro-sedimentological system (Wainwright et al., 2011). Connectivity theory therefore provides a framework to rethink the sediment delivery problem (Fryirs, 2013; Parsons et al., 2009) and to understand the complex spatiotemporal processes that regulate sediment transport.
In agricultural landscapes, sediment connectivity is strongly affected by the patchiness of the land use configuration and the presence of linear features between field parcels (e.g. hedges, grass buffer strips, and roads; Alder et al., 2015; Bakker et al., 2008; Chartin et al., 2013; Fiener et al., 2011; Remund et al., 2021; Van Oost et al., 2000). The importance of landscape patchiness in regulating sediment transfer is specifically relevant in areas where a large number of small fields, separated by linear structures, create a complex hydrological system. However, the experimental analysis of sediment connectivity at catchment scale is challenging, as it involves measuring both internal soil redistribution processes and cascading sediment transport rates. The interaction between landscape patchiness, linear structures, and sediment connectivity is therefore not addressed by the typical set-up of experimental erosion studies, which either focus on small erosion plots or catchment sediment yields (Fiener et al., 2019).
Due to the difficulties in measuring the processes that affect sediment movement at catchment and landscape scale, it is common practice to analyse connectivity with modelling approaches (Nunes et al., 2018). These usually rely on high-resolution process-based models, assuming they are able to represent connectivity dynamics (Baartman et al., 2020), semi-qualitative indices (Borselli et al., 2008; Cavalli et al., 2013), or, more recently, the coupling of conceptual models with probability theory (Mahoney et al., 2020a, b). To be specific, the use of process-based soil erosion and sediment transport models might be an important pathway to improve our understanding of sediment connectivity (Nunes et al., 2018). However, erosion models in general, and process-based models in particular, face the following two fundamental problems for representing sediment connectivity: (i) the input data requirements are large and uncertain, and the model application is often restricted to small catchments with a maximum size of a few square kilometres (e.g. Baartman et al., 2020; Starkloff and Stolte, 2014; Wilken et al., 2017), and (ii) the implemented process descriptions, especially along linear landscape features and field boundaries, are weakly defined due to the aforementioned unavailability of experimental data. Borrelli et al. (2018) demonstrated how parcel-specific high-resolution land cover and management data can improve soil erosion/sediment delivery models in patchy agricultural catchments.
Here, we aimed (i) to adapt a conceptual soil erosion and sediment delivery model with high spatial resolution data (2 m × 2 m) within a Monte Carlo framework, (ii) to analyse the sediment connectivity in a very patchy mesoscale catchment (73 km2) in Switzerland, and (iii) to perform a sensitivity analysis of model parameters and structural assumptions regarding how linear features (dis)connect the sediment cascade. Hence, we demonstrate how models can be used to understand the interaction between linear features, landscape patchiness, and sediment connectivity. This will contribute to increasing our comprehension of relevant connectivity processes and our ability to develop appropriate measures for reducing off-site erosion impacts.
2.1 Study catchment
The study catchment consists of the contributing area of the Lake Baldegg, in the central Swiss Plateau (Fig. 1). The lake has been extensively studied due to its hypertrophic waters, which have been artificially oxygenated since 1983 (e.g. Lavrieux et al., 2019; Müller et al., 2014; Teranes and Bernasconi, 2005). The eutrophication of the lake has mostly been linked to excessive phosphorus loads during the 20th century (Wehrli et al., 1997). Although water quality in the lake is currently improving (BAFU, 2016), the supply of phosphorus-rich sediment is still a concern for local authorities (von Arb et al., 2021; Stoll et al., 2019). The major advantage of the Baldegg catchment for this study is that a comprehensive hydrological data set is available based on an ongoing, long-term monitoring by the Department of Environment and Energy of the Canton of Lucerne.
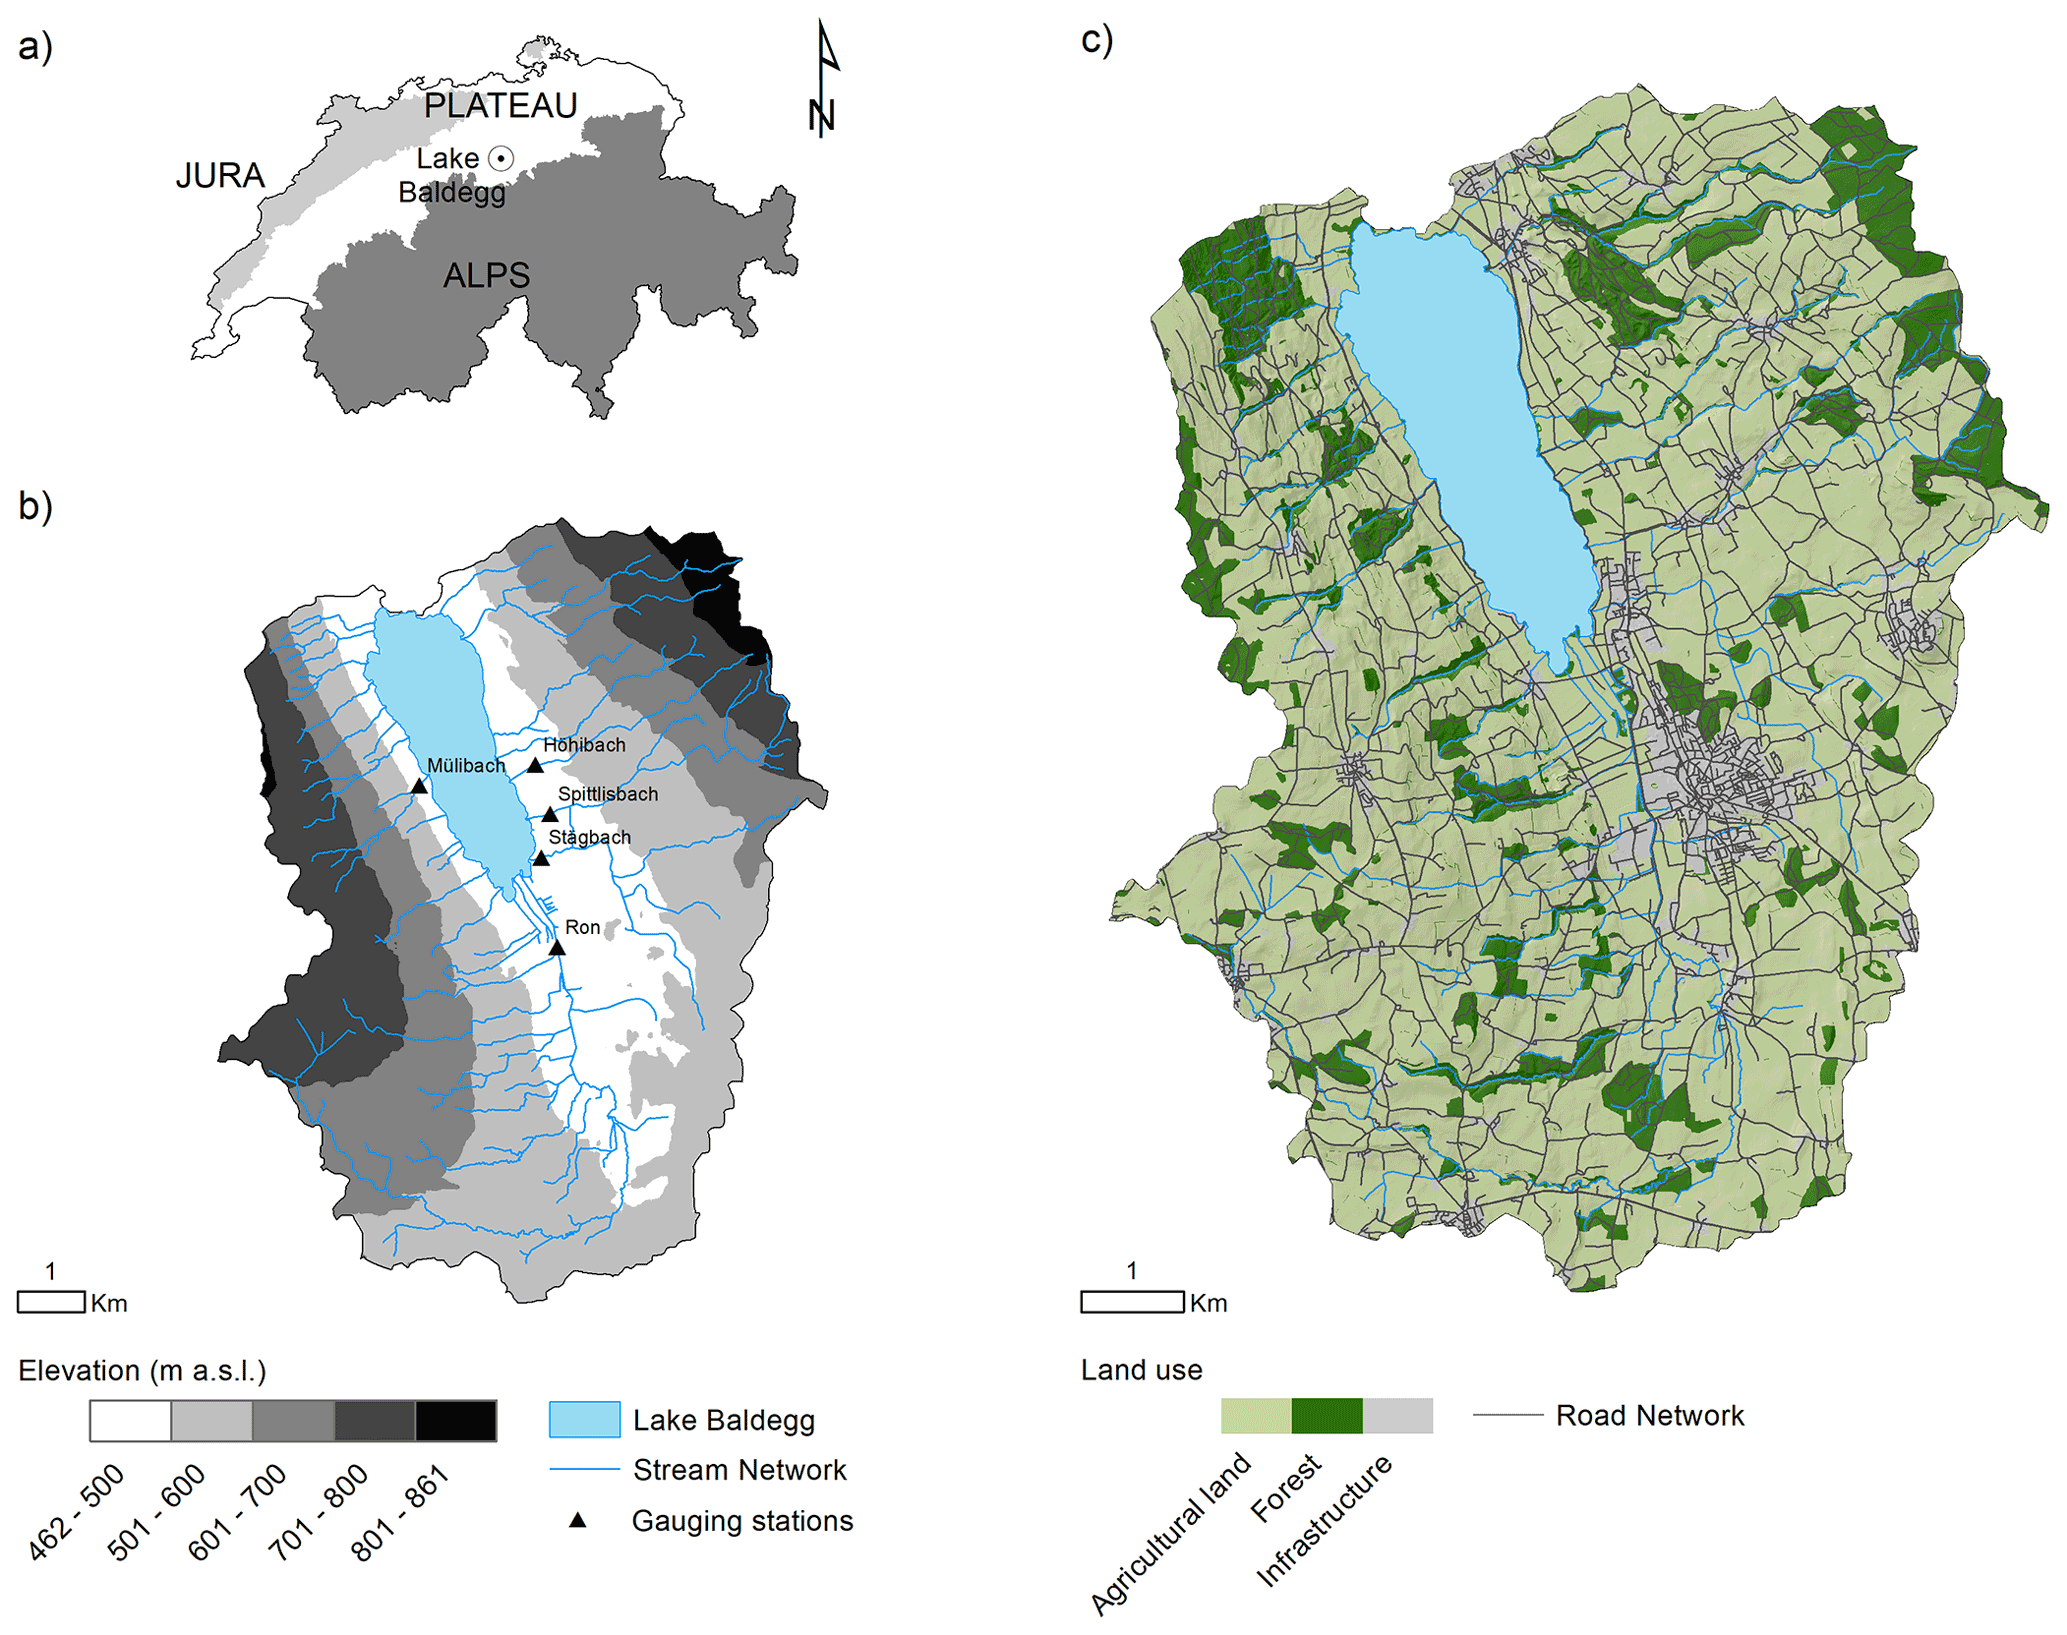
Figure 1(a) Location of the Baldegg catchment. (b) Elevation, stream network, and location of hydrological gauging stations. (c) Land use. Data source: Swisstopo (2018, 2020). Subcatchment areas are Höhibach (2.3 km2), Mülibach (1.6 km2), Stägbach (9.3 km2), Spittlisbach (3.8 km2), and Ron (27.7 km2).
The Baldegg catchment has a total area of 73.2 km2, of which 5.2 km2 are covered by the lake. The remaining area is occupied by agricultural land (74 %), forests (16 %), and infrastructure (e.g. settlements, developed areas, and roads, making up 10 %; Swisstopo, 2020; Fig. 1c). The agriculture consists of intensively managed pastures and/or meadows, cereal production under crop rotation, permanent grasslands, fruit orchards, and small vineyards (Lavrieux et al., 2019; Stoll et al., 2019). The majority of the meadows are composed of a mixture of grasses and clover, which are harvested for silage, hay, or barn feeding up to 6 times per year (von Arb et al., 2021). Agricultural field blocks, here delimited by external boundaries (e.g. roads, water courses, and forests; Bircher et al., 2019), have a median size of 4.4 ha. However, smaller patches separated by hedges, tree lines, and grass buffer strips are generally found within the blocks (Fig. 2).
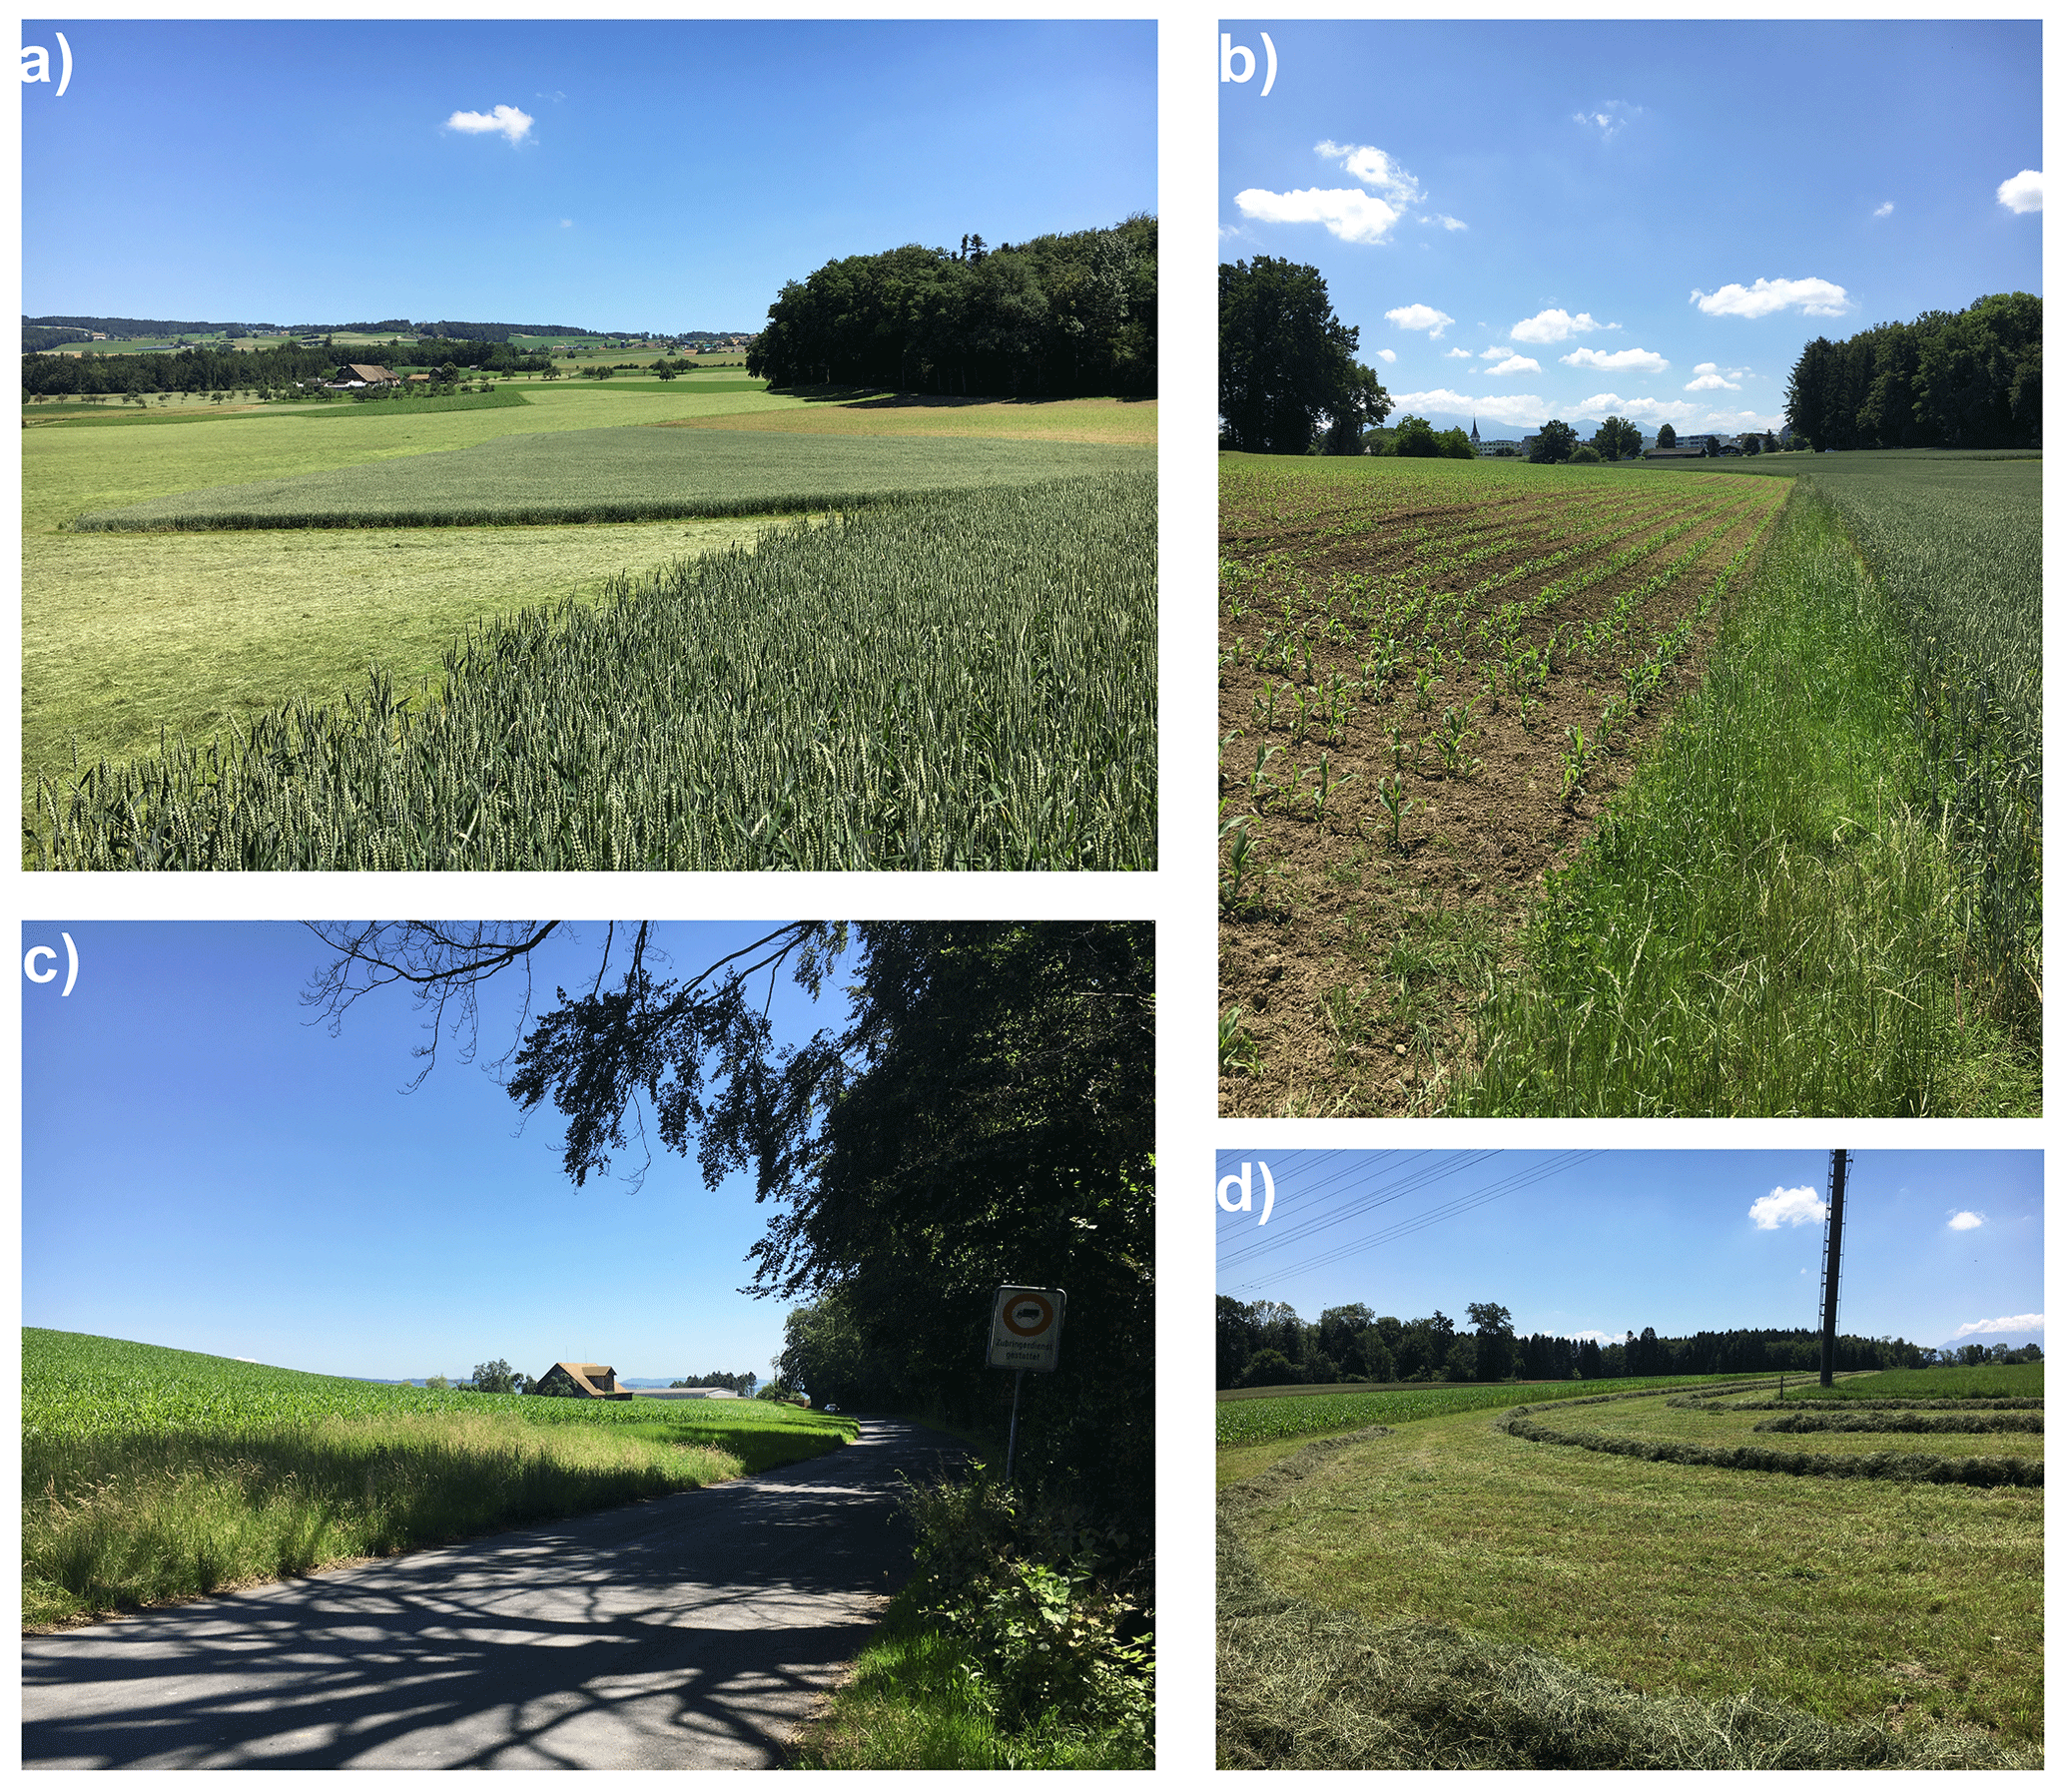
Figure 2Typical agricultural landscapes from the Baldegg catchment. (a) Small arable and grassland patches within larger field blocks. (b) Grass buffer strip between maize and wheat fields. (c) Wide grass buffer strip between maize field and a vicinal road. (d) Freshly cut hay from a pasture between maize fields.
The road network density in the Baldegg catchment is 6.0 km km−2, which is approximately 3 times higher than the stream density (1.9 km km−2). Streams in the upper catchment are often incised, with visible, yet not prominent, signs of bank erosion. A total of 22 channels flow into the Lake Baldegg, of which five streams are monitored for water and sediment discharge by cantonal authorities, as described in Sect. 2.2.
The elevation in the Baldegg catchment ranges from 462 to 861 m a.s.l. (above seal level). Steeper slopes (average values above 10∘) and higher altitudes are found on the eastern and western sides of the catchment (Fig. 1b), a typical glacial landscape of the Swiss Plateau, which is in this case formed by the retreat of the Reuss Glacier in the south to north direction (∼18 kyr BP; Keller, 2021; Pfiffner, 2021). As a result, calcaric Cambisols (IUSS Working Group WRB, 2006) developed upon Tertiary and Quaternary deposits are the main soil class in the catchment. Rainfall is well distributed throughout the year, although greater precipitation is observed from May to August. The average annual rainfall (2010–2019) at the closest gauging station is ∼1000 mm yr−1 (at Mosen, 454 m a.s.l., ∼3.5 km north of the Lake Baldegg, as acquired from MeteoSwiss, 2021) and mean rainfall erosivity in the catchment is ∼1150 MJ mm ha−1 h−1 yr−1 (Schmidt et al., 2016).
2.2 Tributary suspended sediment loads
Suspended sediment concentrations from five tributaries to Lake Baldegg are monitored by the Department of Environment and Energy of the Canton of Lucerne. Here, we used the data measured from January 2010 to December 2019. On average, 274 grab samples were taken from each tributary, which corresponds to one sample every 22 d, in addition to the samples collected during high-flow events (10–13 per year; Fig. 3). Suspended sediments were measured at the same location where water discharge was monitored by automatic gauging stations (Fig. 1b). A summary of the measured rainfall, water discharge, and sediment concentration from 2010 to 2019 is displayed in Fig. 3.
Table 1Covariates used for fitting the sediment-rating curves, as in Vigiak and Bende-Michl (2013).

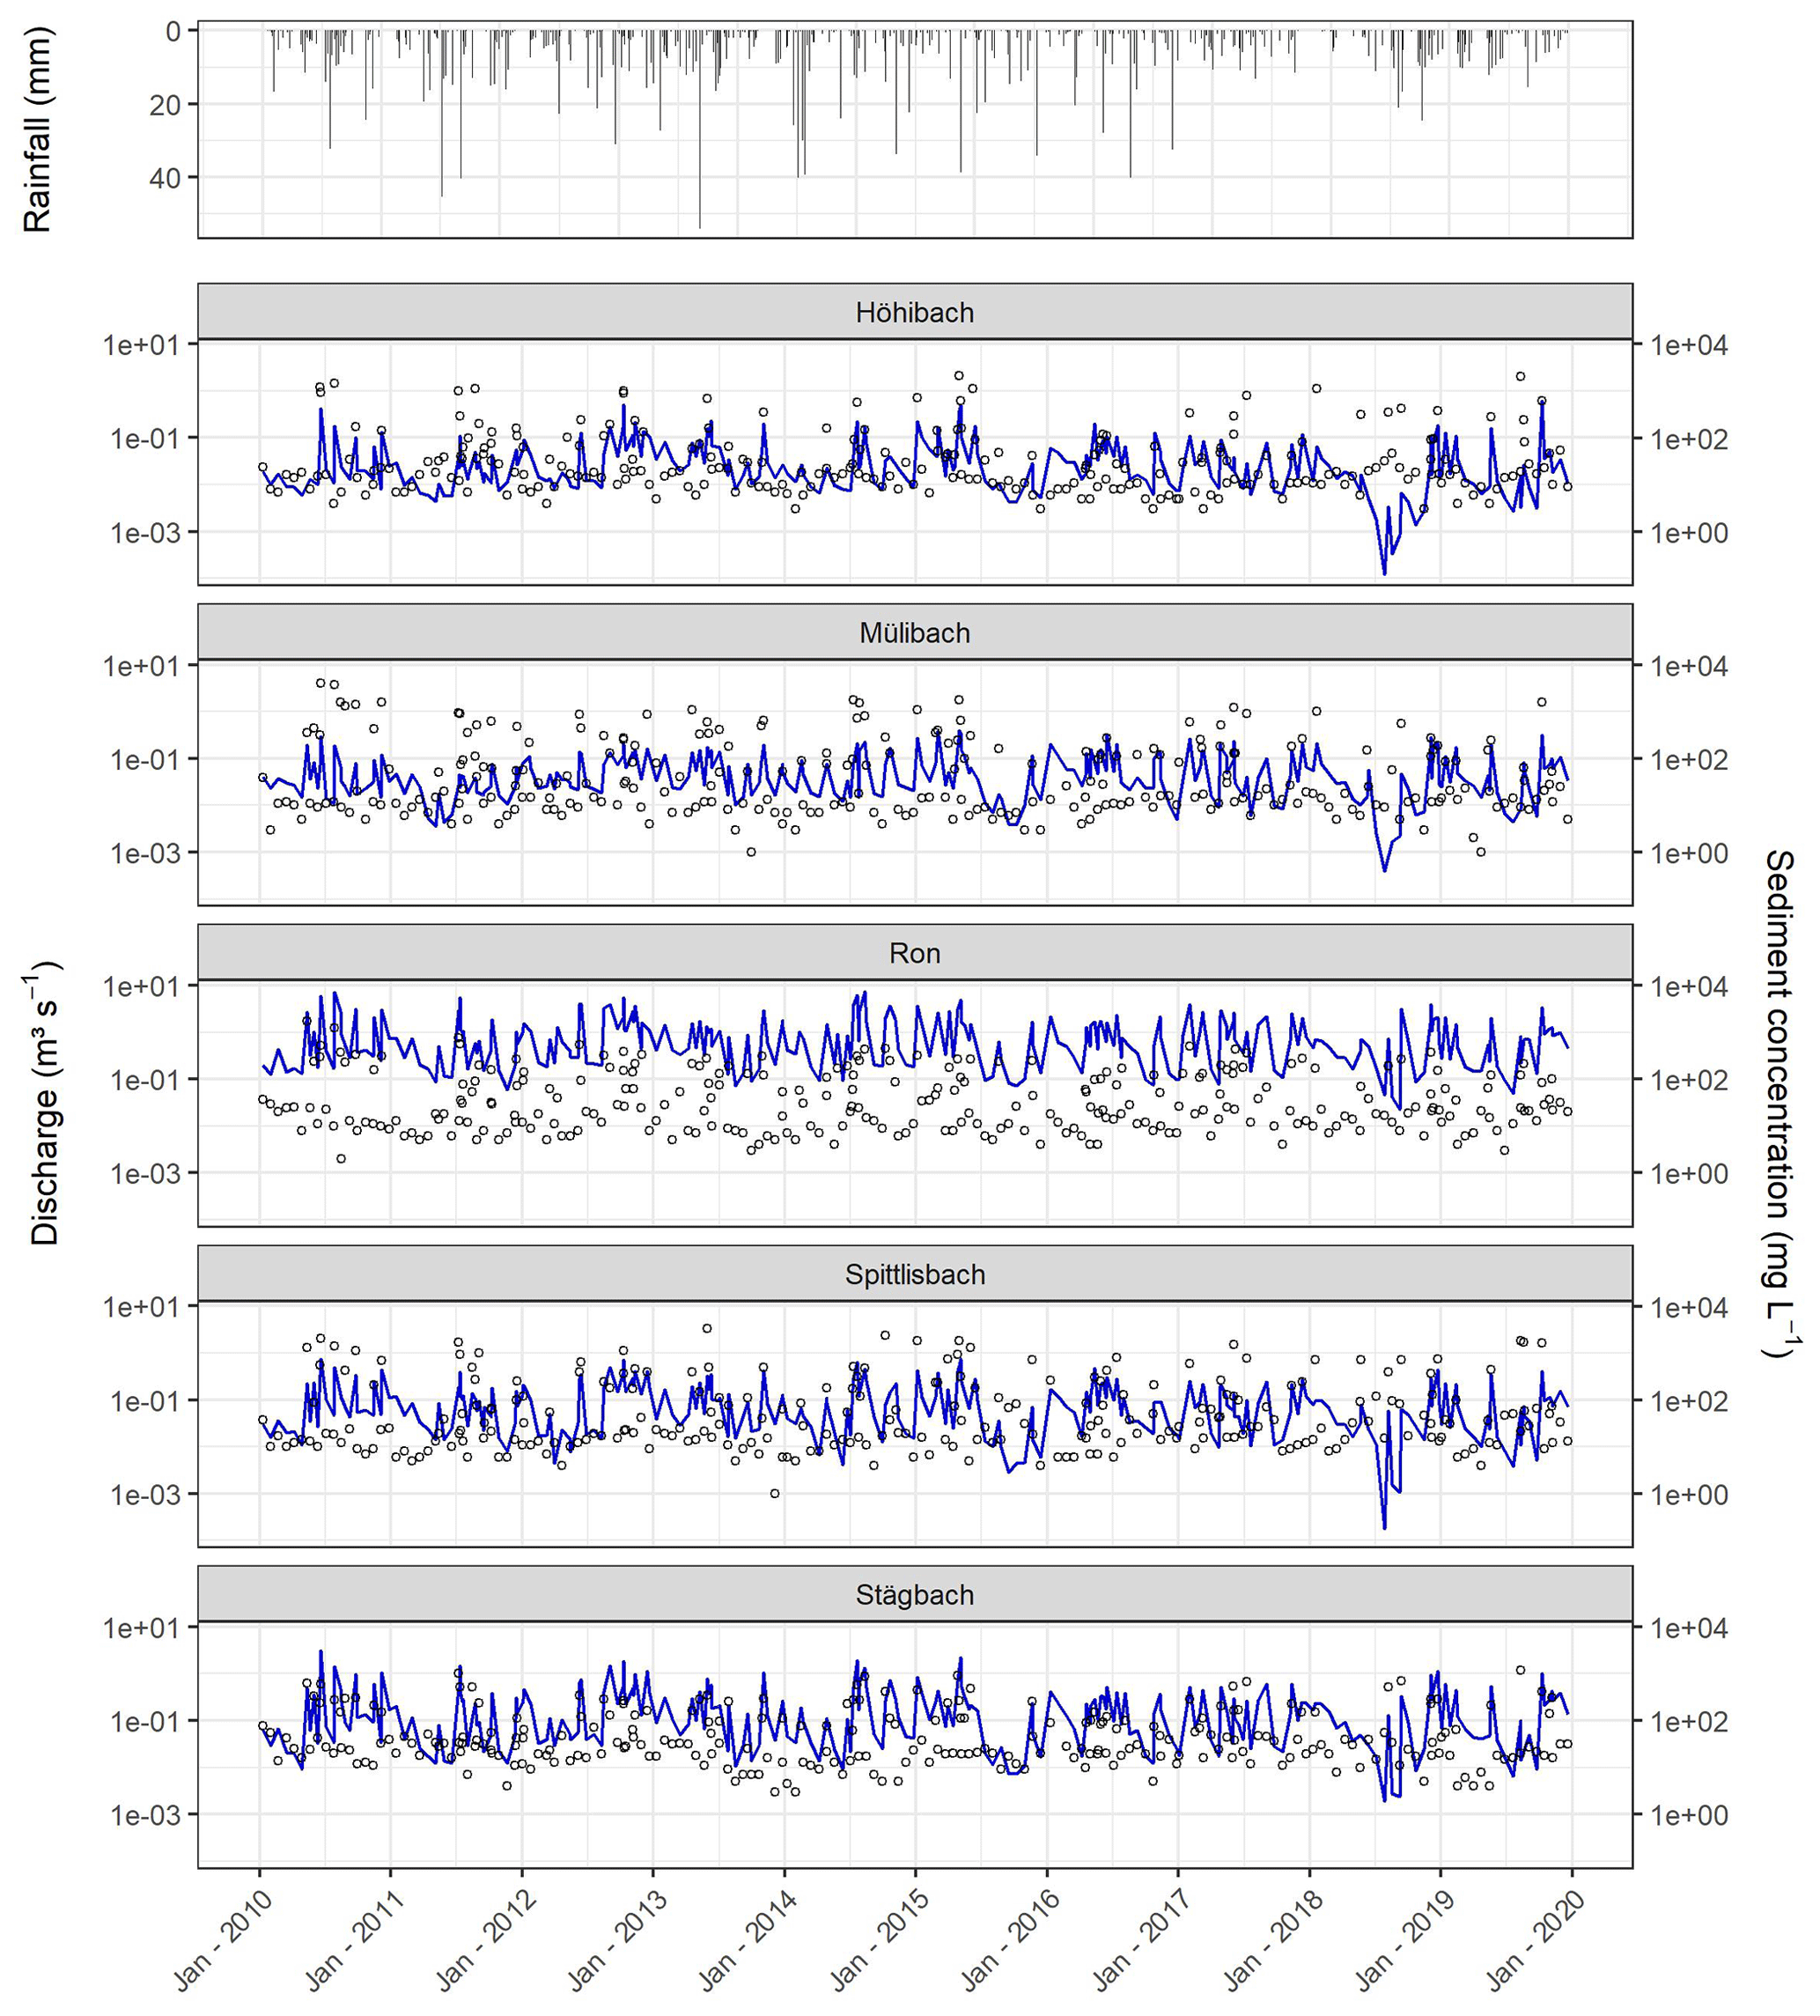
Figure 3Daily rainfall at Mosen station, mean daily discharge (blue line), and sediment concentration (circles) at the monitored tributaries of the Lake Baldegg (2010–2019). Data source: MeteoSwiss (2021).
In order to estimate continuous daily sediment concentration values, later used to produce average yearly sediment loads for each tributary, we used a rating curve approach (Eq. 1), combining the roughly triweekly sediment concentration measurements with continuous discharge measurements. The rating curve partially accounts for hysteresis and seasonality (Table 1), which can have a significant impact on sediment export patterns and reflect the catchment land use, hydrological connectivity, and internal sediment source dynamics (Sherriff et al., 2016). To derive the coefficients in Eq. (1), we used a parsimonious multivariate regression which does not require separate calibration for different seasons (Cohn et al., 1992; Vigiak and Bende-Michl, 2013).
where c is sediment concentration (mg L−1) for day i, β0 is the intercept, βk are fitted coefficients, xk,i are covariates (Table 1) accounting for discharge, hysteresis, and seasonality, k is the covariate identification, and εi is the residual error.
To analyse the uncertainty in the regressions, we simulated posterior distributions of the model coefficients (β0, βk) with an informal Bayesian function of the R package “arm” (Gelman and Hill, 2007), as in Batista et al. (2021). This function produces realisations of model coefficients based on the residual standard error of the regression, which means that models with poorer fits will yield broader posterior distributions of regression coefficients. The posterior distributions were used to simulate 1000 sediment concentration values for each day i. These were transformed into daily distributions of sediment loads (Mg), considering the mean daily discharge measurements from the gauging stations. Sediment loads were ultimately aggregated into average annual values (Mg yr−1) with uncertainty bands, which should allow for a general comparison with the different sediment connectivity scenarios simulated by the Water and Tillage Erosion Model and Sediment Delivery Model (WaTEM/SEDEM).
2.3 Model description
A modified version of the spatially distributed erosion and sediment transport WaTEM/SEDEM (Van Oost et al., 2000; Van Rompaey et al., 2001; Verstraeten et al., 2010) was used in this study. WaTEM/SEDEM provide a framework for modelling sediment connectivity from hillslope to water courses by use of a steady-state transport capacity equation and a pixel-based sediment routing component. That is, the model assumes that soil particles displaced by water erosion at a given grid cell are transferred downstream for as long as the runoff transport capacity is greater than the sediment supply – or until the flow path reaches a definite sink. Although the model is able to simulate both tillage and water erosion, here we focus on the latter, which is calculated with an adaptation of the RUSLE (Revised Universal Soil Loss Equation; Renard et al., 1997; Eq. 2). We chose to focus on soil erosion by water because in WaTEM/SEDEM the sediment supply/routing is not affected by tillage erosion. However, tillage erosion is likely to be an important within-field soil redistribution process in the catchment (please see Sect. 4 below). The model is, by default, executed in an average yearly time step, as is typical in RUSLE applications which predict long-term (∼20 years) average annual soil losses as follows:
where A is average annual soil loss (kg m−2 yr−1), R is rainfall erosivity (MJ mm m−2 h−1 yr−1), K is soil erodibility (kg h MJ−1 mm−1), LS2d is a topographic factor calculated by the Desmet and Govers (1996) procedure (dimensionless), C is a cover management factor (dimensionless), and P is a support practice factor (dimensionless).
Transport capacity (kg m−1 yr−1) per unit width of the grid cells is assumed to be proportional to the potential to rill erosion, which is described by a power function of slope length and gradient, as follows (Van Rompaey et al., 2001):
where KTC is a land-use-dependent transport capacity coefficient (m) which requires calibration, R is rainfall erosivity (MJ mm h−1 yr−1), K is soil erodibility (t h MJ−1 mm−1), LS2d is a topographic factor calculated by the Desmet and Govers (1996) procedure (dimensionless), and Sg is slope gradient (m m−1).
WaTEM/SEDEM partially incorporates the influence of the landscape structure on sediment transfer by the use of a parcel connectivity parameter PCon, which represents the proportion of sediment that is stopped at field borders. The model also simulates runoff connectivity by means of a parcel trapping efficiency PTEf parameter, which corresponds to the proportion of the flow accumulation that is routed downstream. Finally, the model is able to estimate the total amount of sediment transferred from hillslopes to water courses, which can be interpreted as the hillslope component of a catchment sediment budget. Since WaTEM/SEDEM neither represents gully and bank erosion nor in-stream erosion and deposition processes, any comparison between modelled sediment yields and catchment–outlet sediment loads must be interpreted with caution. However, in catchments where rill and interrill are the main overland erosion processes, and assuming a state of long term fluvial quasi equilibrium, the outlet sediment loads should be at least comparable to the model outputs – even if not fully commensurable. For further information on the model, we refer to Notebaert et al. (2006), Van Oost et al. (2000), Van Rompaey et al. (2001), and Verstraeten et al. (2010).
2.4 Model implementation, input data, and sensitivity analysis
WaTEM/SEDEM is implemented as a user-friendly GUI (graphical user interface) developed at KU Leuven (Notebaert et al., 2006). Although the software facilitates model application, it does not allow for more complex operations such as sensitivity or uncertainty analysis. Moreover, some model components might not be fully comprehensible without access to the source code, and WaTEM/SEDEM is frequently used as a black box. Hence, in order to perform a sensitivity analysis of model parameters and underlying structural model assumptions, we implemented a WaTEM/SEDEM version using the free open-source software R (R Core Team, 2021) and SAGA GIS (System for Automated Geoscientific Analyses geographic information system; Conrad et al., 2015). The main adaptations are described in the following, and our code is available in Batista et al. (2022).
Our model application consists of a global all-at-a-time sensitivity analysis, as described by Pianosi et al. (2016). That is, we performed a Monte Carlo simulation to explore the variability in the whole parameter space, and all input factors were sampled simultaneously for each model realisation (n=1200). The framework is similar to an uncertainty analysis, except in this case we did not focus on locating the parameter space which produced behavioural model realisations. Instead, we concentrated on apportioning sources of uncertainty to different model input factors, aiming to rank their contribution to the variability in the response surface (see Pianosi et al., 2016, for a review on sensitivity analysis). This should allow us to identify parameters and model assumptions that have a greater impact on the manner with which WaTEM/SEDEM describes sediment connectivity in the Baldegg catchment. In particular, the analysis of different assumptions about the structure of the model should provide a connectivity assessment based on the quantification of the structural uncertainty within the simulations. To the best of our knowledge, this is the first time the analysis of model structural error has been incorporated to sediment connectivity research.
Table 2Minimum and maximum parameter values sampled during the Monte Carlo simulation.
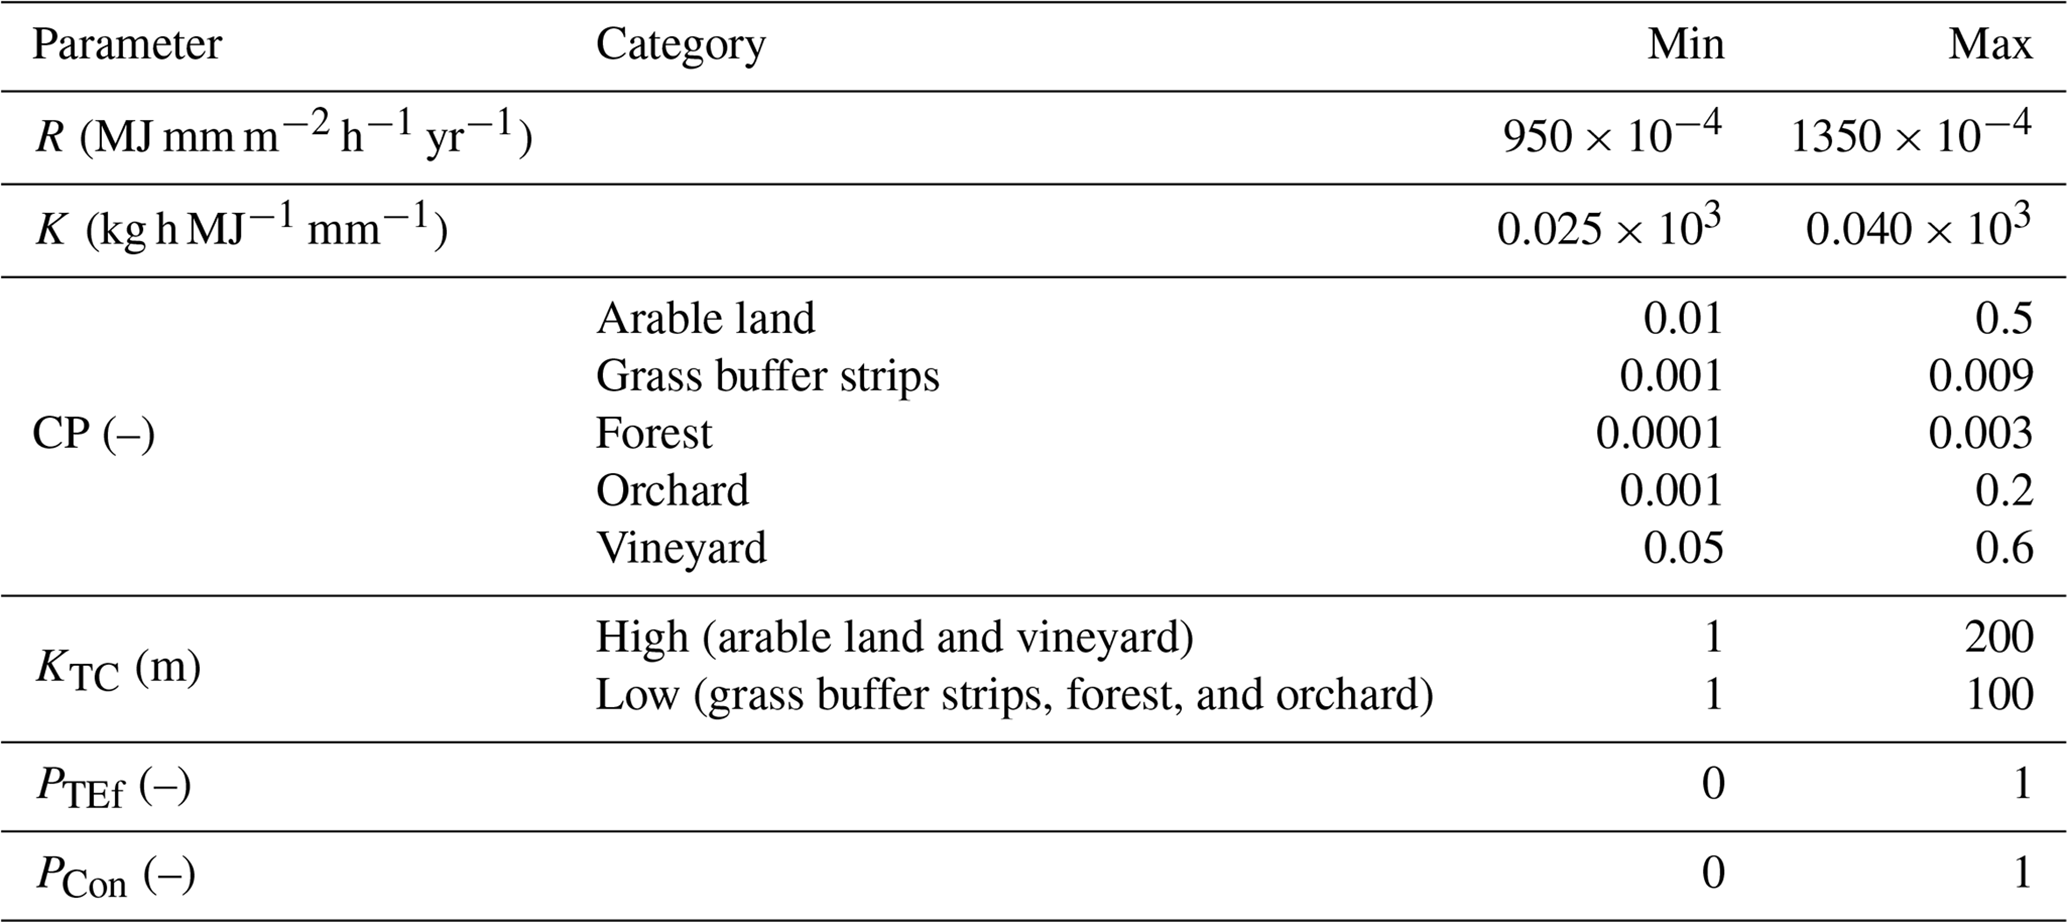
For each iteration of the Monte Carlo simulation, RUSLE input variables were sampled from uniform distributions (Table 2). Minimum and maximum R factor values were retrieved from the Swiss national map (Schmidt et al., 2016), and a single lumped value for the whole catchment was sampled for each iteration. The same approach was used for the K factor (Schmidt et al., 2018a). We used lumped catchment values for these factors due to their low spatial variability within the study area, according to the national maps (coefficient of variations are 1 % and 7 % for the K and R factor, respectively). For the C and P factors, here combined into a single CP parameter, uniform distributions were created for each land use class in the catchment, based on commonly used values from the literature and a land cover map (1:25 000; Swiss Map Vector 25 BETA; Swisstopo, 2018), which we rasterised to the model resolution (2 m × 2 m). Due to the difficulties involved in accurately representing long-term average agricultural land use patterns and farming management practices per field parcel, pastures and cropland were considered as a single arable land category, using only the information available from the land cover map (Table 2; Swiss Map Vector 25 BETA; Swisstopo, 2018). In this case, minimum and maximum values were relaxed to represent a wide possible combination of crops and support practices. Such combinations were assessed with the CP-Tool (Kupferschmied, 2019), which allows for the calculation of CP values that consider common crop rotation systems in Switzerland. The minimum CP values were particularly reduced to include typical values for permanent grasslands in Switzerland (∼0.01; Schmidt et al., 2018b). This simplified approach should be appropriate, considering (i) our focus on connectivity scenarios and linear landscape structures and (ii) the use of the Monte Carlo simulation with the sampling of a wide parameter space that accounts for the uncertainty in the land use classification. Finally, the LS2d factor was calculated with a slope (rad) and an upslope contributing area (m2) grid, which were obtained by processing a 2 × 2 m resolution digital elevation model (DEM) from swissALTI3D (Swisstopo, 2014a). In this case, the error in the LS2d factor was not incorporated into the Monte Carlo simulation due to the use of the high-resolution DEM, which should considerably reduce the uncertainty associated to the parameter estimation.
Similarly, all WaTEM/SEDEM-specific model parameters were sampled from uniform distributions (Table 2). Land use classes with a CP factor above 0.01 received higher transport capacity coefficients (KTC high). The remaining land use classes, namely forests and grass strips, received lower coefficients (KTC low). The KTC reference values were taken from Van Rompaey et al. (2001) and extended in order to explore a larger parameter space. The sampled parcel trapping efficiency (PTEf) values were assigned to forests and grass buffer strips in the rasterised land cover map, as we explain below. The resulting PTEf grid was used as a weight for calculating the aforementioned upslope contributing area. Hence, only a proportion of the grid cell area from forests and grass strips contributed to the downstream flow accumulation, as runoff amounts are assumed not to increase (or to increase slowly) with slope length under natural vegetation (Govers, 2011). Parcel connectivity (PCon) values were assigned to the forest and grass buffer strips cells that bordered agricultural fields, representing the extent to which water and sediment transport is reduced at parcel borders (Notebaert et al., 2006). The transport capacity (Eq. 2) at these cells was reduced by a fraction inversely proportional to the sampled PCon value.
For each sampled combination of parameters values, the models were applied with and without the presence of grass buffer strips between agricultural field blocks and adjacent roads and forests. Although grass buffer strips are generally present at field borders in the Baldegg catchment (Fig. 2), these features were not distinguishable in the land cover map. Hence, we manually inserted 2 m wide grass buffer strips at the aforementioned borders. The extent of the buffer strips in reality is quite variable, and generally wider at forest and river vicinities (3–6 m), as required by law in Switzerland (Alder et al., 2015). For simplicity, we used a single value that should allow us to test the sensitivity of the model to the presence of the strips. The 2 m width was selected based on the spatial resolution of the model input data. Hedges and tree lines within field blocks were already classified in the large-scale topographic landscape model of Switzerland (swissTLM3D; Swisstopo, 2020) and required no additional processing apart from being merged with the land cover map (Swiss Map Vector 25 BETA; Swisstopo, 2018). These two land surface models were combined since they contain differently assigned and complementary land cover object classes.
Furthermore, three road connectivity assumptions were assessed for each model iteration. As such, we first converted the roads from polylines (as available in the swissTLM3D) to polygons, using a buffer distance based on the road widths. Next, these polygons were rasterised and incorporated into the land cover grid used for modelling. In a first scenario, roads were treated as an ultimate sink, with zero transport capacity (i.e. roads as sinks). Hence, sediments reaching roads or infrastructure were subsequently removed from the system and did not reach surface waters. This represents a scenario in which roadside ditches and the road drainage system trap most sediments and partly diverge runoff to wastewater treatment plants. A second scenario assumed that all sediments reaching the road network were directly connected to the stream network. This represents a situation in which the road drainage system acts as a hydraulic shortcut, transferring sediments from fields into surface waters (i.e. roads as shortcuts; see Schönenberger and Stamm, 2021). As in the original model formulations (see Notebaert et al., 2006), the third scenario assigned very high transport capacity to roads and infrastructure, so that no deposition would take place (i.e. roads as patch connectors). In this case, runoff and sediment might flow along or across the road network – which is expected to happen during extreme rainfall events when the drainage system is clogged. For this scenario, deposition will never occur on road cells; however, sediments can still be deposited on lower patches before reaching the stream network. Hence, sediment transfer will be entirely dependent on the flow direction calculated from the DEM. Here we employed a multiple flow direction algorithm, which was used for calculating the upslope contributing area and routing sediments along the flow path. The sediment routing component was implemented with a capacity accumulation function from SAGA GIS (Conrad et al., 2015), and all geo-processing tools were applied with the “RSAGA” package (Brenning et al., 2018).
The sensitivity of WaTEM/SEDEM to the uncertainty in model parameters, the presence of grass buffer strips, and assumptions about road connectivity (i.e. model structural uncertainty) was assessed by evaluating modelled hillslope sediment yields (i.e. the amount of sediment delivered from hillslopes to surface waters) for the entire Baldegg catchment. A qualitative analysis was performed with a visual inspection of scatterplots by comparing the univariate parameter space with the model response surface. Additionally, we used a random forest analysis (RFA) to rank the importance of input factors to the uncertainty in model outputs (Antoniadis et al., 2021). That is, a random forest was used to predict the WaTEM/SEDEM-modelled sediment yields, based on the sampled parameter values for each iteration of the Monte Carlo simulation. The importance of the input factors, including model parameters, the presence of grass strips, and the road connectivity scenarios, was ranked based on their relative contribution to the RFA predictive error, following an out-of-bag estimate (Breiman, 2001). We chose the RFA due to its ability to rank both qualitative and quantitative input factors. The analysis was performed with the “randomForest” (Liaw and Wiener, 2002) R package.
Finally, we compared the resulting WaTEM/SEDEM simulations of subcatchment hillslope sediment yields to the suspended sediment loads from the monitored tributaries. Of note is that, with this comparison, we only aim to provide a general picture of the plausibility of the model realisations. Suspended sediment loads are a product of a complex interaction of hillslope and channel remobilisation processes, which are not fully represented by WaTEM/SEDEM. In addition, since the model is RUSLE based, the soil redistribution rates represent long-term average annual values, which hamper a straightforward comparison with annual sediment transport rates. Hence, modelled hillslope yields and suspended loads are not entirely commensurable, and we did not focus on a rejectionist framework for model testing. This research is exploratory and investigates the importance of linear features and landscape patchiness on sediment connectivity.
3.1 Sensitivity analysis
The road connectivity assumptions were by far the most sensitive input factor for WaTEM/SEDEM in the Baldegg catchment. This is illustrated in Fig. 4, which presents scatterplots comparing sampled parameter values and the model response surface. The uniformly scattered points denote the low sensitivity of the modelled hillslope sediment yields to most input factors, with some evident exceptions, namely CP for arable land, KTC high, and KTC low. On the other hand, all plots demonstrate that higher sediment yields were calculated when we assumed that roads behaved as hydraulic shortcuts that directly connect agricultural patches to the stream network.
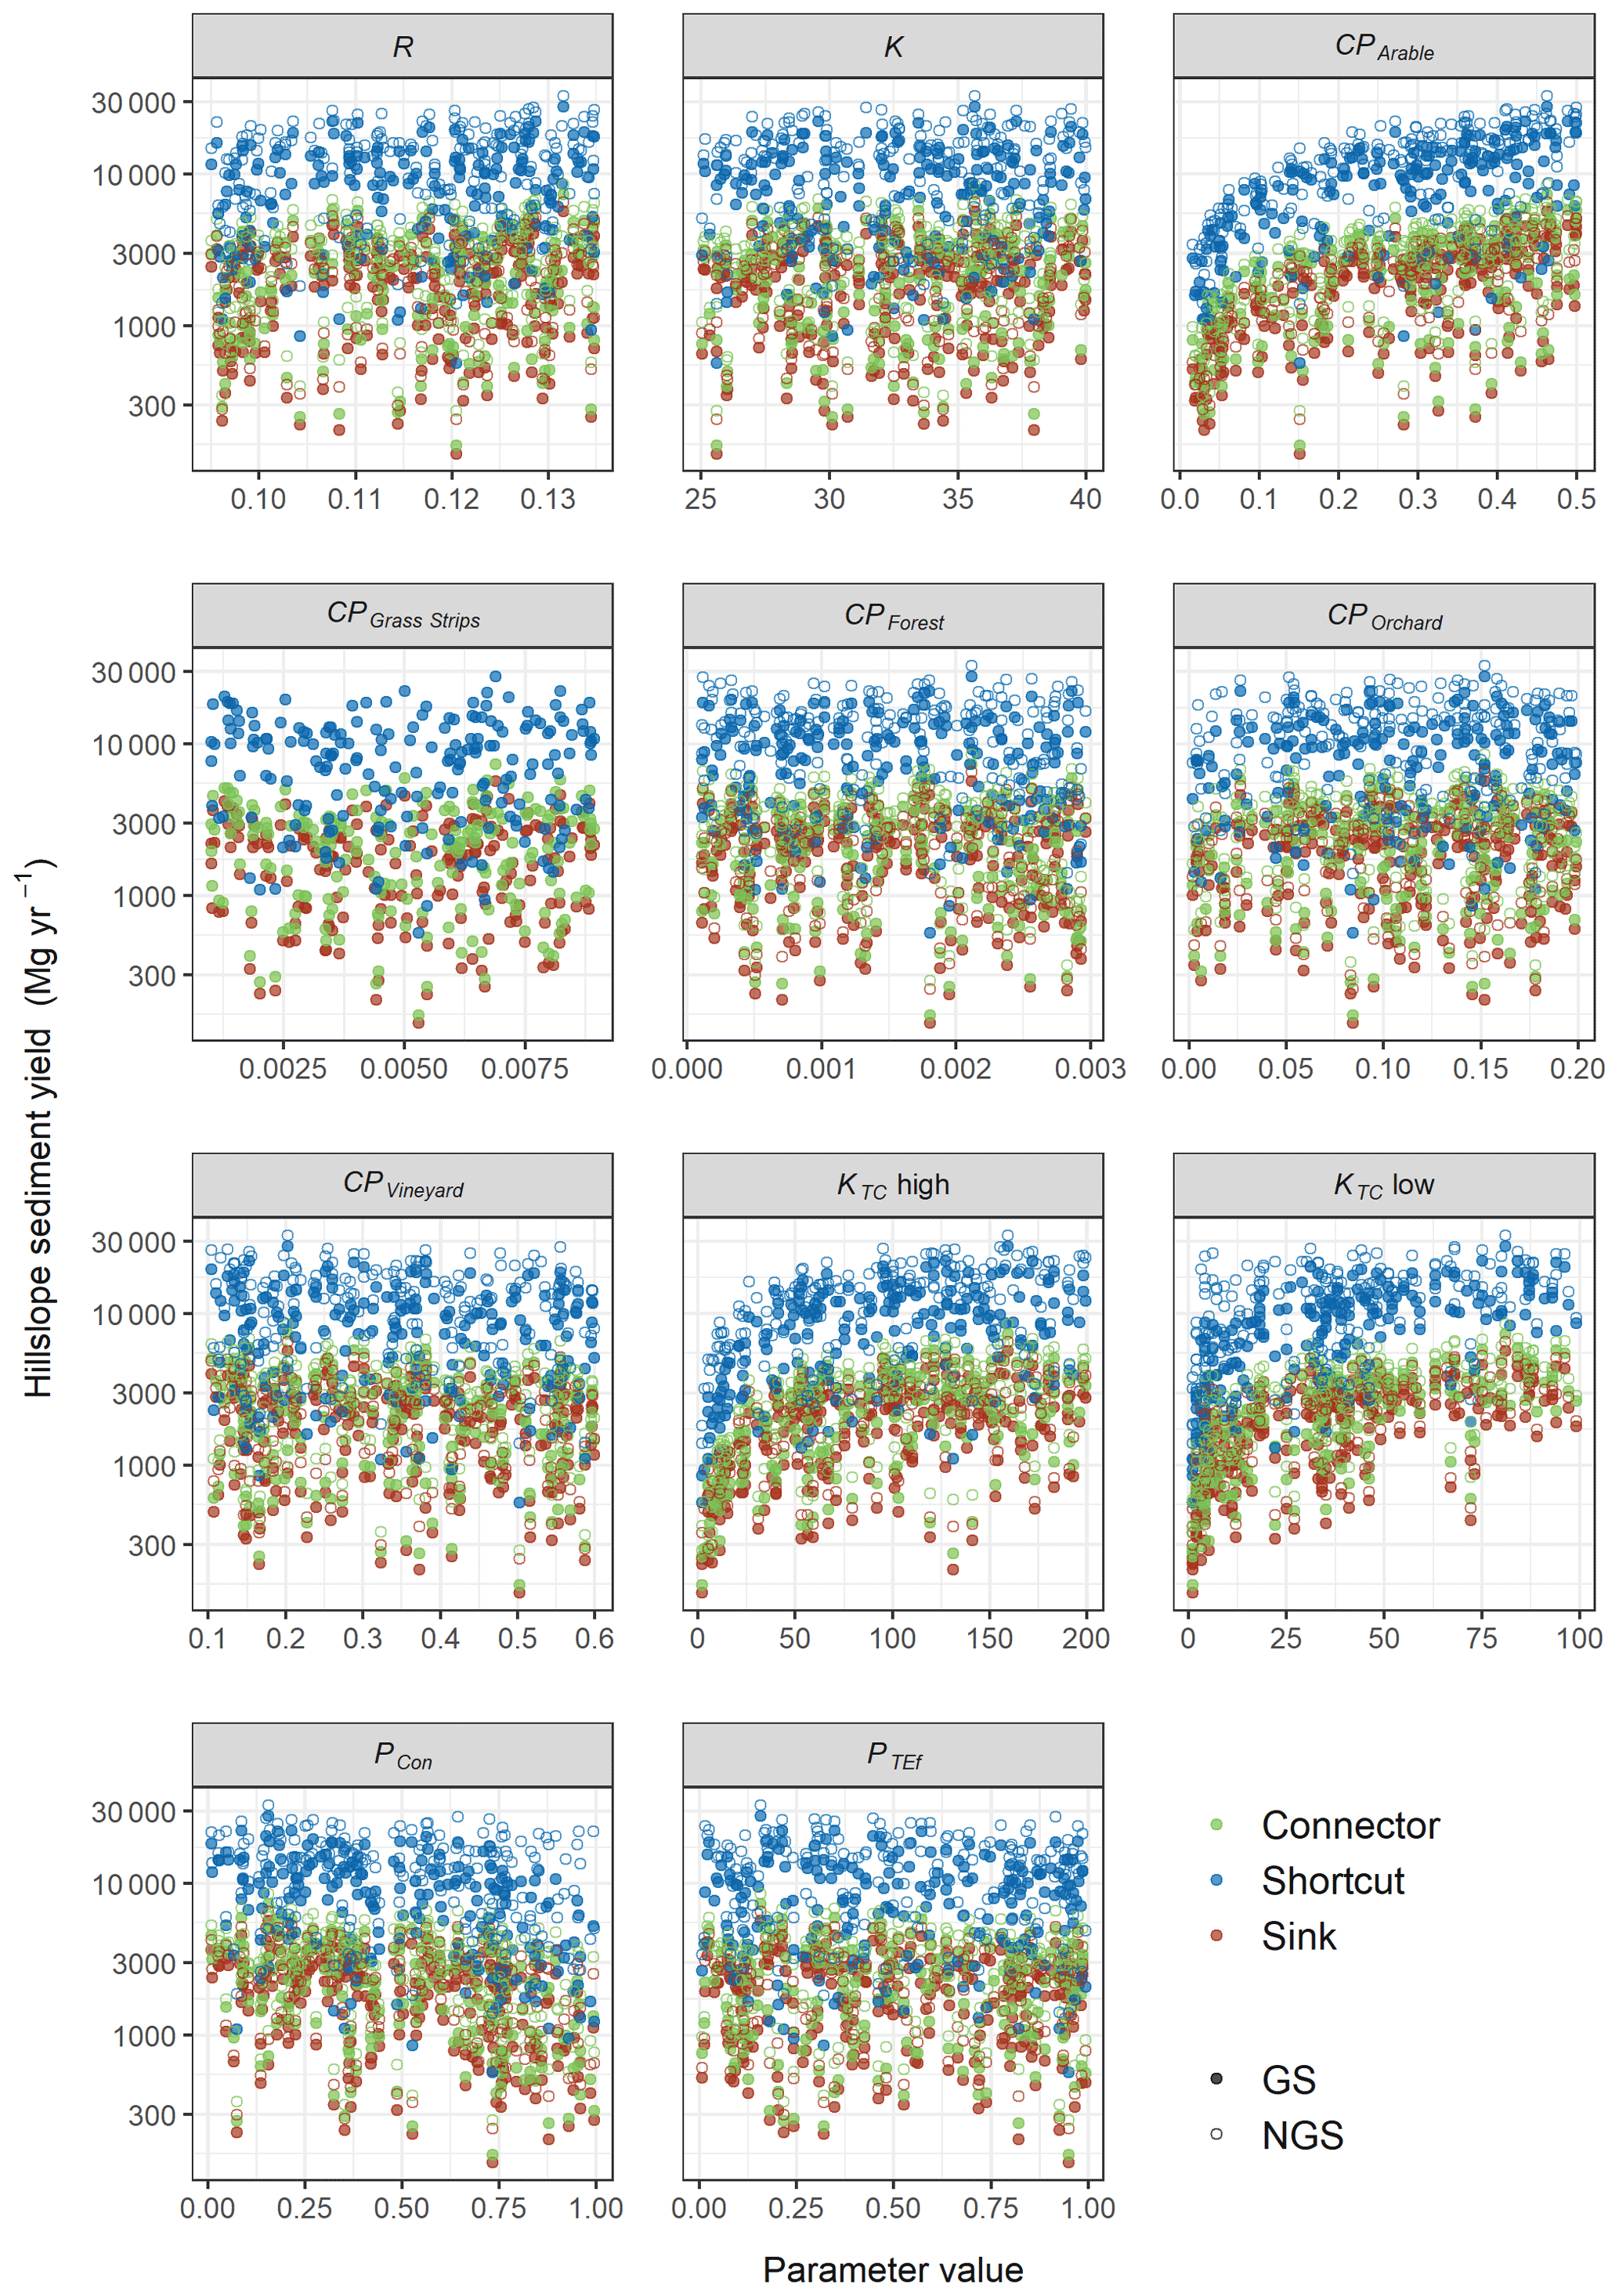
Figure 4Univariate scatterplots of sampled parameter values. Full circles represent model realisations with the presence of grass buffer strips (GS), and open circles represent the ones without strips (NGS). Colours represent the road connectivity assumptions (i.e. roads as patch connectors, roads as hydraulic shortcuts, and roads as sinks). See Sect. 2.4 for a description of road connectivity scenarios.
Similarly, the results from the RFA demonstrate that road connectivity was the most important input factor for predicting the WaTEM/SEDEM outputs (Fig. 5). That is, if road connectivity was not considered, the predictive mean squared error (MSE) of the RFA increased by 265 %. The MSE increases associated to CP for arable land (96 %), KTC low (51 %), KTC high (45 %), and the presence of grass buffer strips (33 %), indicate that the model was also sensitive these input factors. However, if we considered each road connectivity scenario individually, the results from the random forest were shifted, as the model seemed to be more sensitive to the presence of grass buffer strips for the road as shortcuts scenario (MSE increase = 55 %).
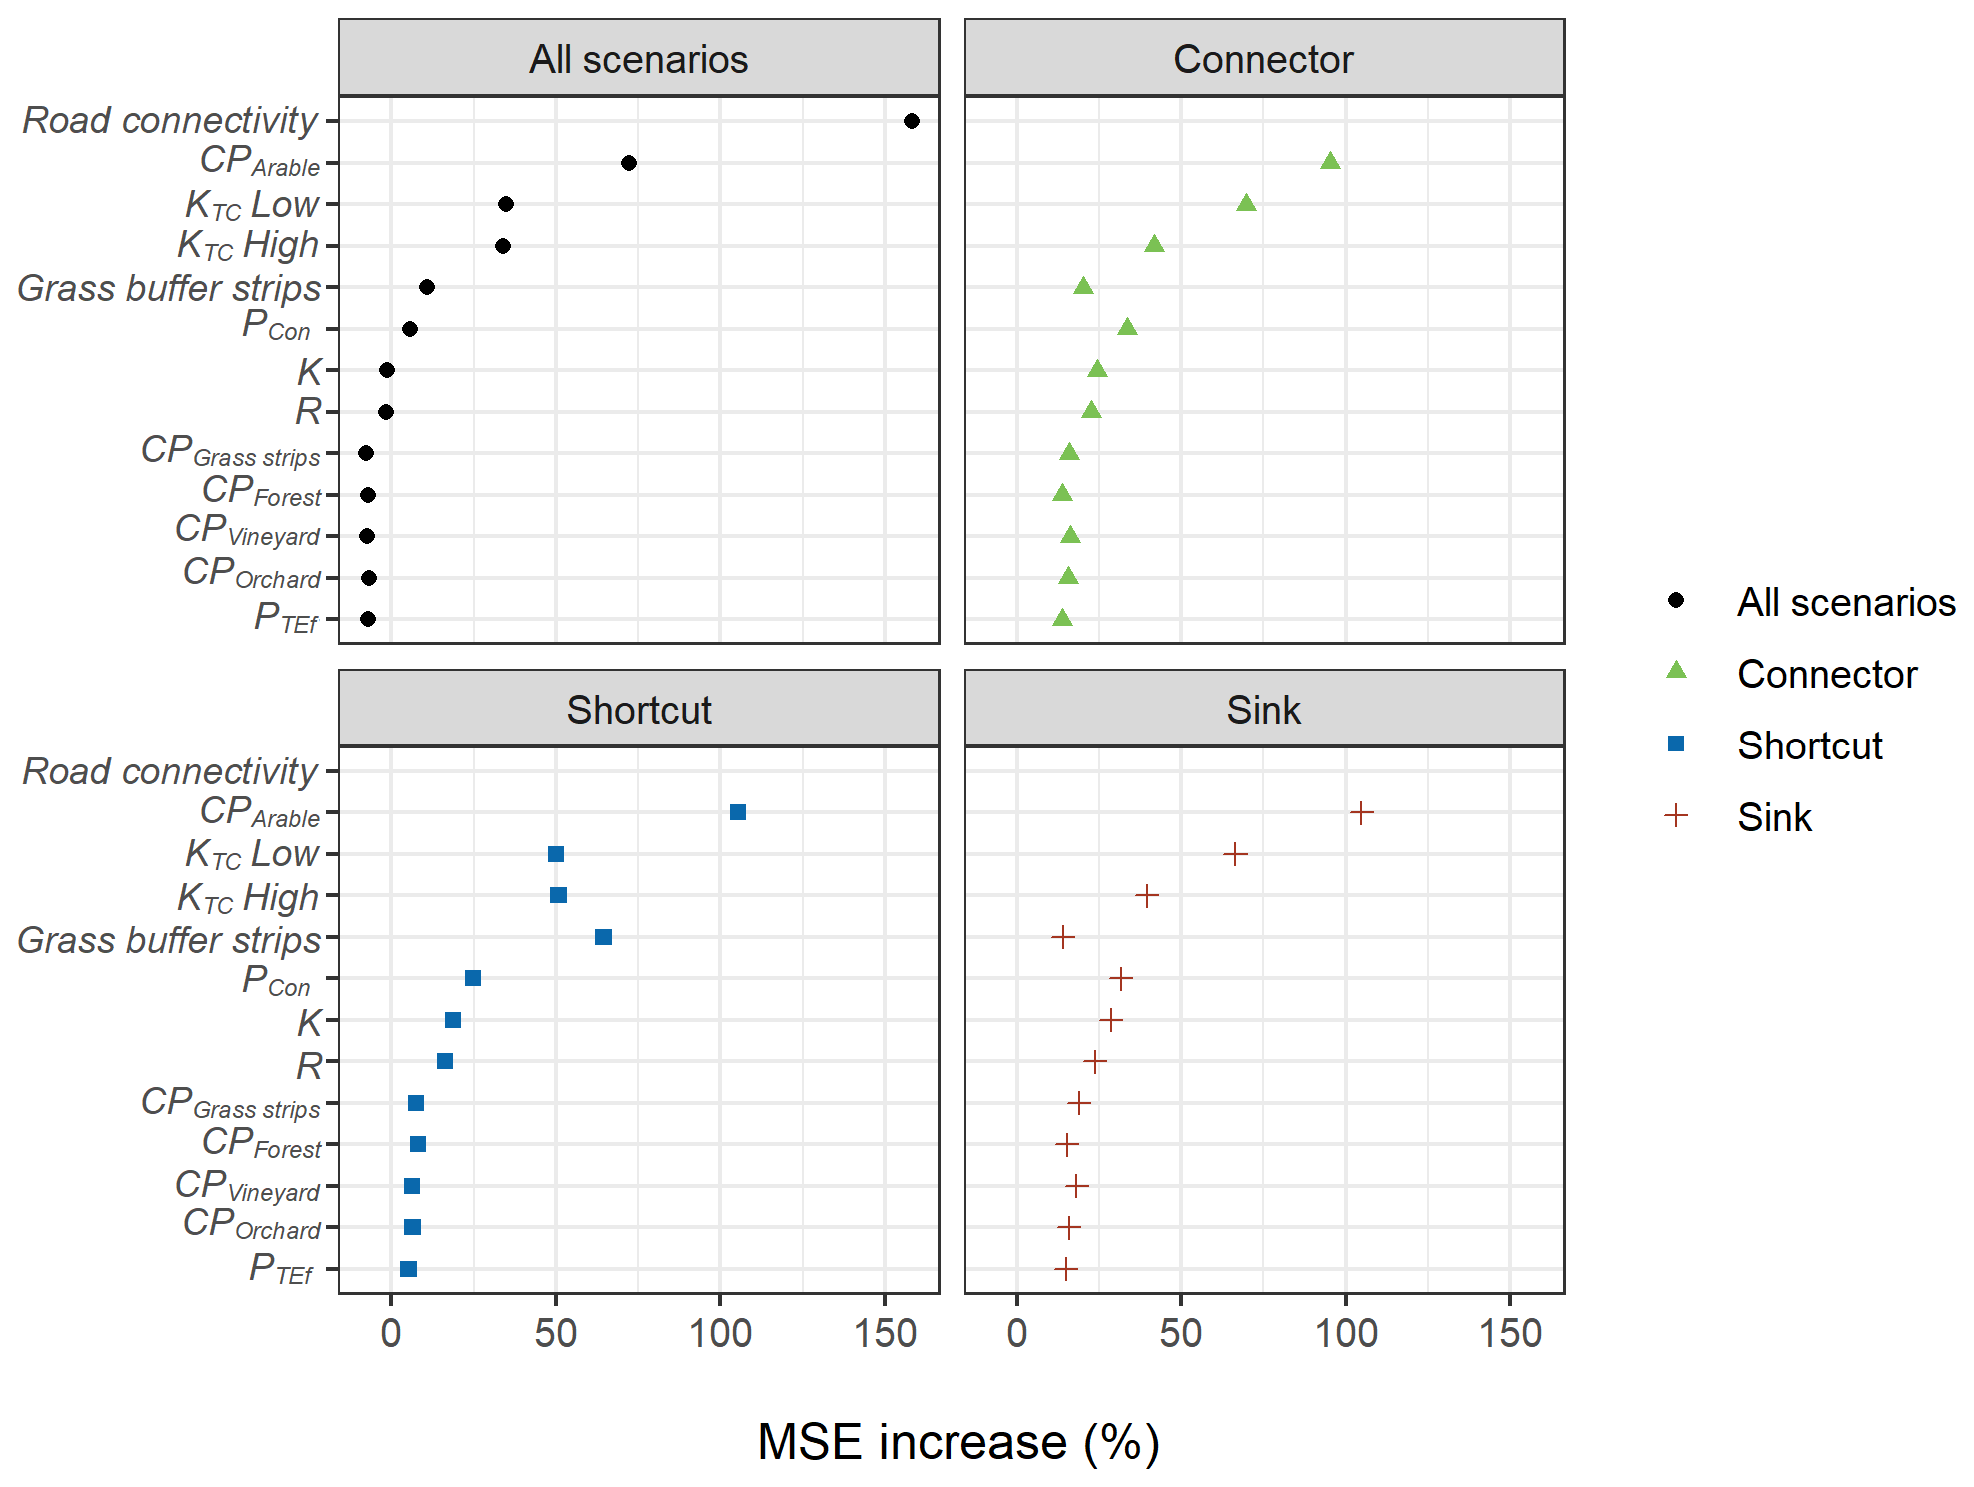
Figure 5Mean squared error (MSE) increase associated to model input factors for the random forest analysis (RFA). Larger relative errors indicate the input factors were more important for estimating model outputs.
3.2 Spatial patterns
The spatial patterns of soil redistribution rates were also highly influenced by linear features, landscape patchiness, and connectivity assumptions. Sediment deposition on field blocks downslope from roads was more frequently observed for the roads as connectors scenario than for the other road connectivity assumptions. Specifically, when sediments were not diverged or trapped by the road network, there was a greater proportion of sediment deposition on foot slope field borders and other potential sinks (Fig. 6b; Table 3).
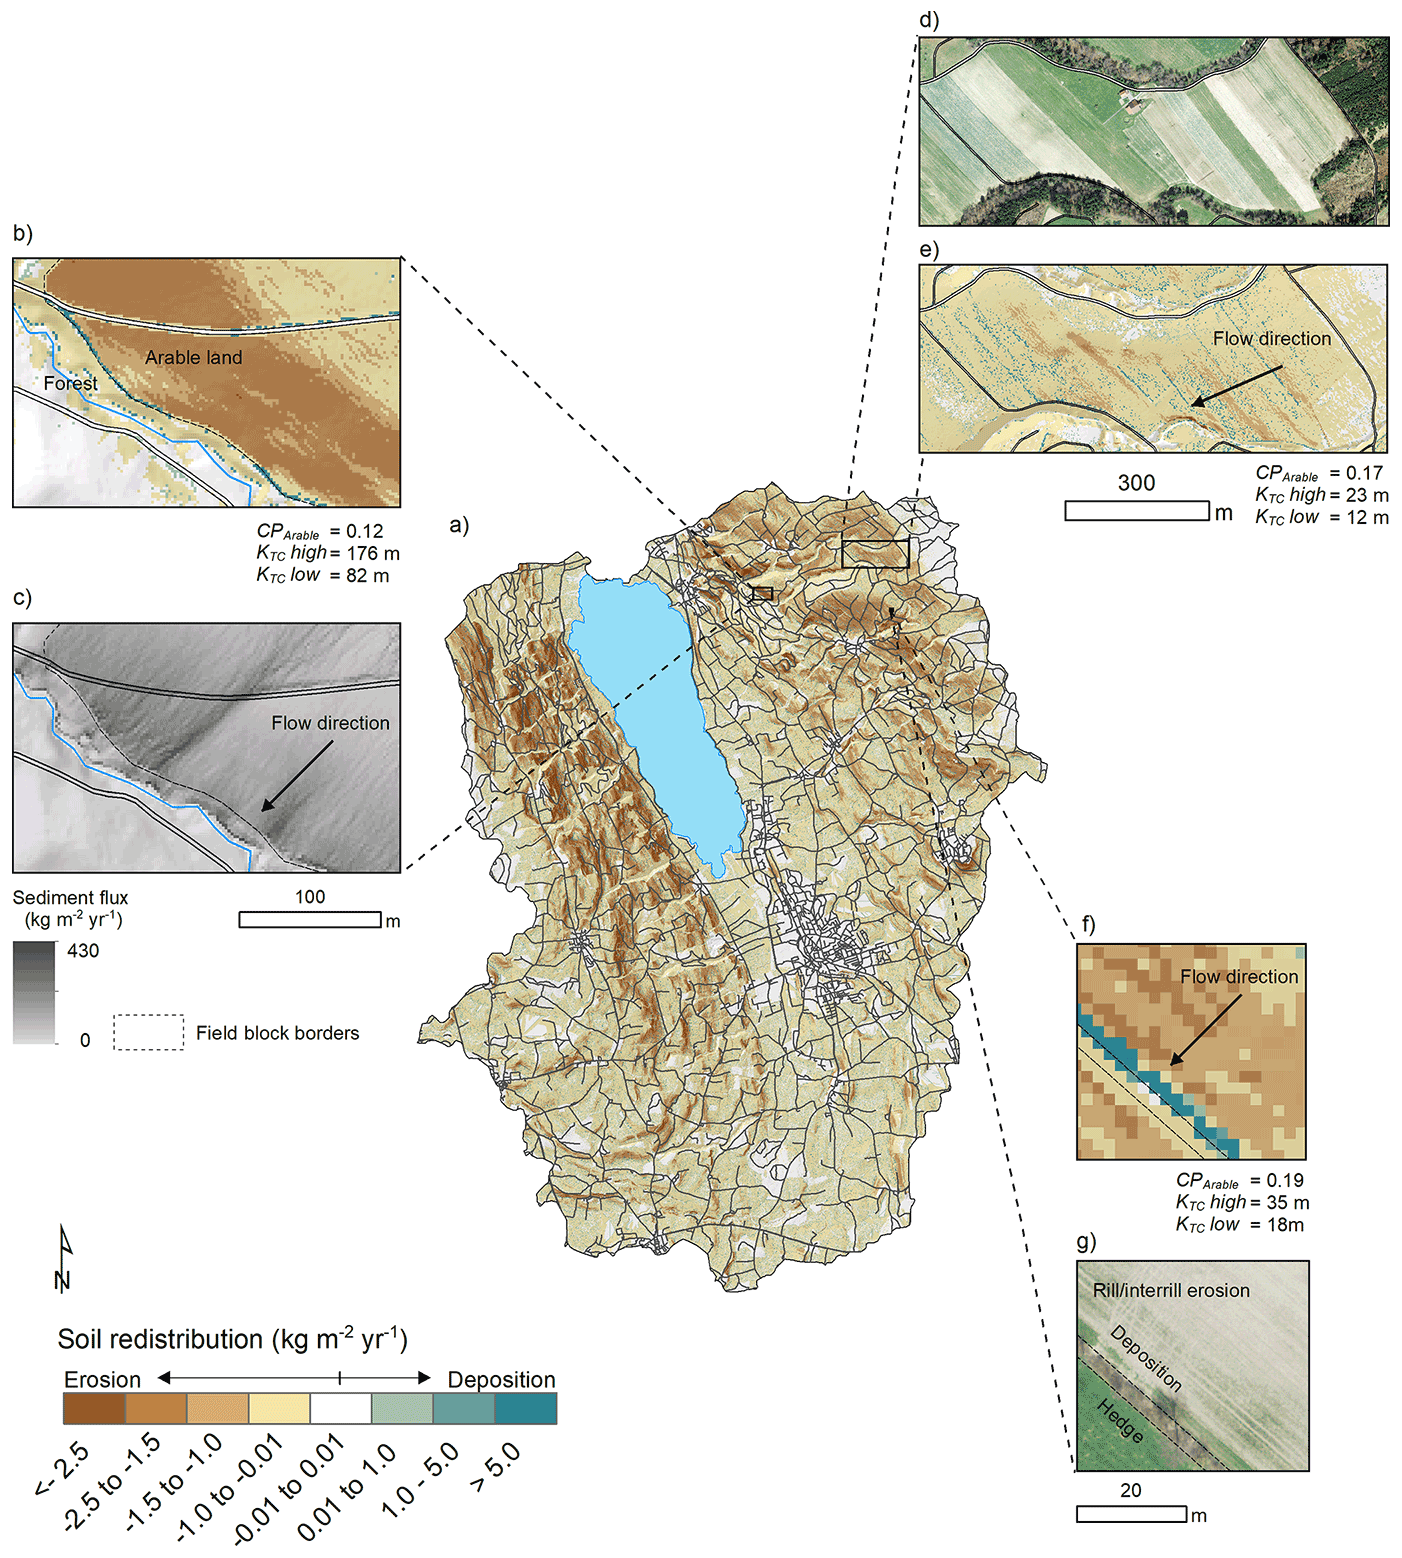
Figure 6(a) Catchment patterns of soil redistribution for a model realisation with the presence of grass buffer strips. (b) Detail the of sediment deposition on field borders for the road as patch connectors scenario. (c) Detail of the sediment fluxes across the road network for the road as patch connectors scenario. (d) Detail of the aerial image of multiple parcels within a field block (Swisstopo, 2014b). (e) Soil redistribution rates for the field block. (f) Detail of the sediment deposition at a grass buffer strip at a field border. (g) Aerial image of the field (Swisstopo, 2014b).
Table 3Summary statistics of soil redistribution rates and hillslope sediment yields calculated by the WaTEM/SEDEM simulations.
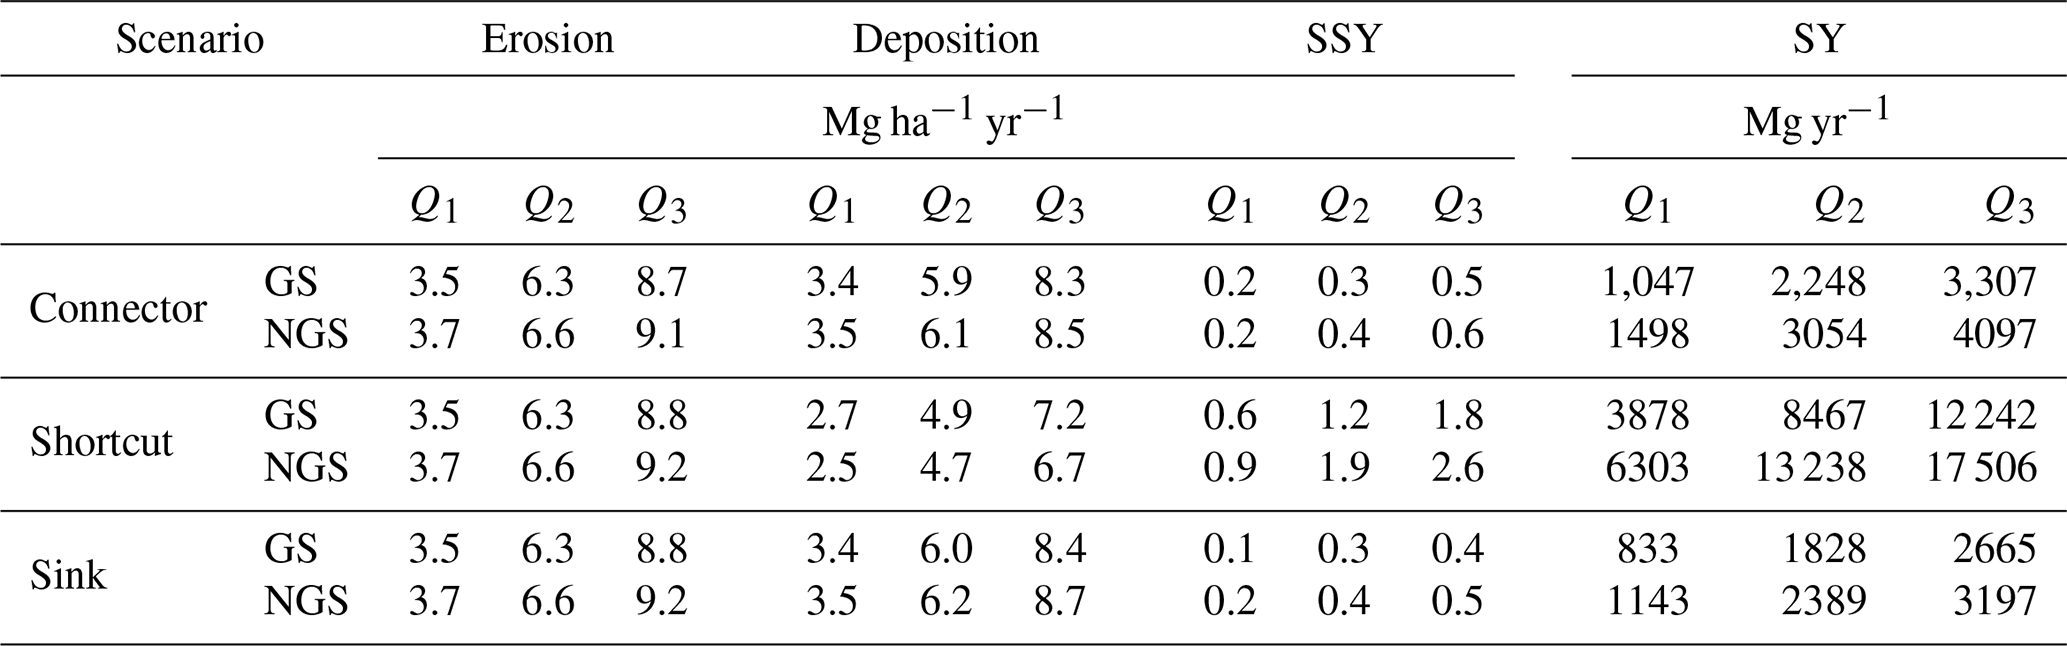
Note: SSY is the area-specific hillslope sediment yield, and SY is the hillslope sediment yield. Deposition rates include hillslope and road deposition. GS is the grass buffer strip, NGS is the no grass buffer strip, Q1 is the first quartile or the 25th percentile, Q2 is the second quartile or the median, and Q3 is the third quartile or the 75th percentile.
The sediment flux from agricultural fields was generally interrupted when entering forest patches, and further deposition was modelled at forested valley floors, near the stream channels, for all scenarios (Fig. 6b and c). Importantly, sediment deposition along grass buffer strips, hedges, and tree lines reduced sediment fluxes in between field blocks, forming a patchy connectivity pattern. This was again visible for all simulated connectivity assumptions, albeit particularly pronounced when the presence of grass buffer strips was considered (Fig. 6a and f).
Unexpectedly, the soil redistribution patterns revealed that WaTEM/SEDEM simulated linear deposition areas at the borders of small cropland patches (Fig. 6d and e). This occurred even in the absence of grass buffer strips or hedges and, hence, without PCon parameterisation, which was only applied to field block borders. These depositional patterns were particularly evident within field blocks oriented across the slope direction and apparently stem from small-scale changes in the slope gradient, which were represented by the high-resolution DEM and which potentially results from long-term tillage erosion.
3.3 Soil redistribution rates, hillslope sediment yields, and suspended sediment loads
Soil redistribution rates for eroding grid cells in the Baldegg catchment were almost identical among the simulated road connectivity assumptions (Table 3). Higher absolute deposition rates were calculated for the simulations without grass strips for both the connector and sink scenarios, which is a result of increased erosion rates calculated without the presence of the strips. On the other hand, lower sediment yields were calculated with the presence of grass buffer strips when the connectivity scenarios were analysed individually. Among these scenarios, deposition rates were lower if roads were considered to behave as hydraulic shortcuts. Contrarily, deposition rates for the roads as connectors and roads as sinks scenarios were very similar, although road deposition was only modelled in the second case. Therefore, deposition rates within fields, patch borders, colluviums, and valley floors for the connector scenario were ∼30 % higher than for the other simulations. As the sediments not diverged by the road network were ultimately deposited within the catchment, the sink and connector scenarios displayed very similar hillslope sediment yields. Contrarily, sediment yields for the shortcut scenario were, in general, ∼4.5 times higher than for the remaining road connectivity simulations.
The comparison between WaTEM/SEDEM simulations and the tributary sediment loads revealed a larger overlap between the latter and the results from the road as shortcuts scenario (Fig. 7). The overlap became particularly clear when we compared the prediction intervals of the calculations (Fig. 7). That is, a smaller proportion of the road as connectors and the road as sinks model realisations encompassed the tributary sediment loads, except for Höhibach, which showed the opposite pattern. This behaviour was particularly evident for the scenario with the presence of grass buffer strips.

Figure 7Box plots of hillslope sediment loads simulated by WaTEM/SEDEM for the road connectivity scenarios for each tributary subcatchment. Dashed lines represent the median (in black) and the 95 % interval (in grey) of the measurement-based estimates of sediment loads for each tributary, calculated from the error propagation of the sediment-rating curve. GS is the grass buffer strip, and NGS is the no grass buffer strips. Simulations for the shortcut scenario generally shows a higher overlap with calculated sediment loads, in particular when grass buffer strips are considered.
It is important to note that the median daily sediment concentrations calculated from the 1000 realisations of the rating curves (Eq. 1) underestimated the high sediment concentration measurements for all tributaries. This resulted in the positive mean error of the median estimates (Table 4). Moreover, the Nash–Sutcliffe model efficiency coefficient for the median calculations was unsatisfactory, considering the usual thresholds for model performance (e.g. Moriasi et al., 2015). However, the 95 % prediction interval of the rating curves encompassed a large proportion of the sediment concentration observations for the tributaries with poorer fits and wider uncertainty bands (i.e. Höhibach, Mülibach, and Spittlisbach; Table 4 and Fig. S1 in the Supplement). The sediment rating curves for the tributaries which displayed a better fit (i.e. the Ron and Stägbach) encompassed a much lesser proportion of the observed sediment concentration values (Table 4; Fig. S1). That is, the regressions with the lowest residual standard errors had narrower uncertainty bands, despite producing more accurate median predictions, led to a greater proportion of out-of-bound observations from the 95 % prediction interval. In any case, the largest errors were associated to underestimates of extreme events, and therefore, it is likely that actual sediment loads from the tributaries are contained within the long right side of the skewed distributions resulting from the error propagation of the rating curves (Fig. 7), which would increase the overlap with the shortcut scenario.
Table 4Evaluation metrics of the sediment rating curve, considering the measured sediment concentrations and median of the simulations.
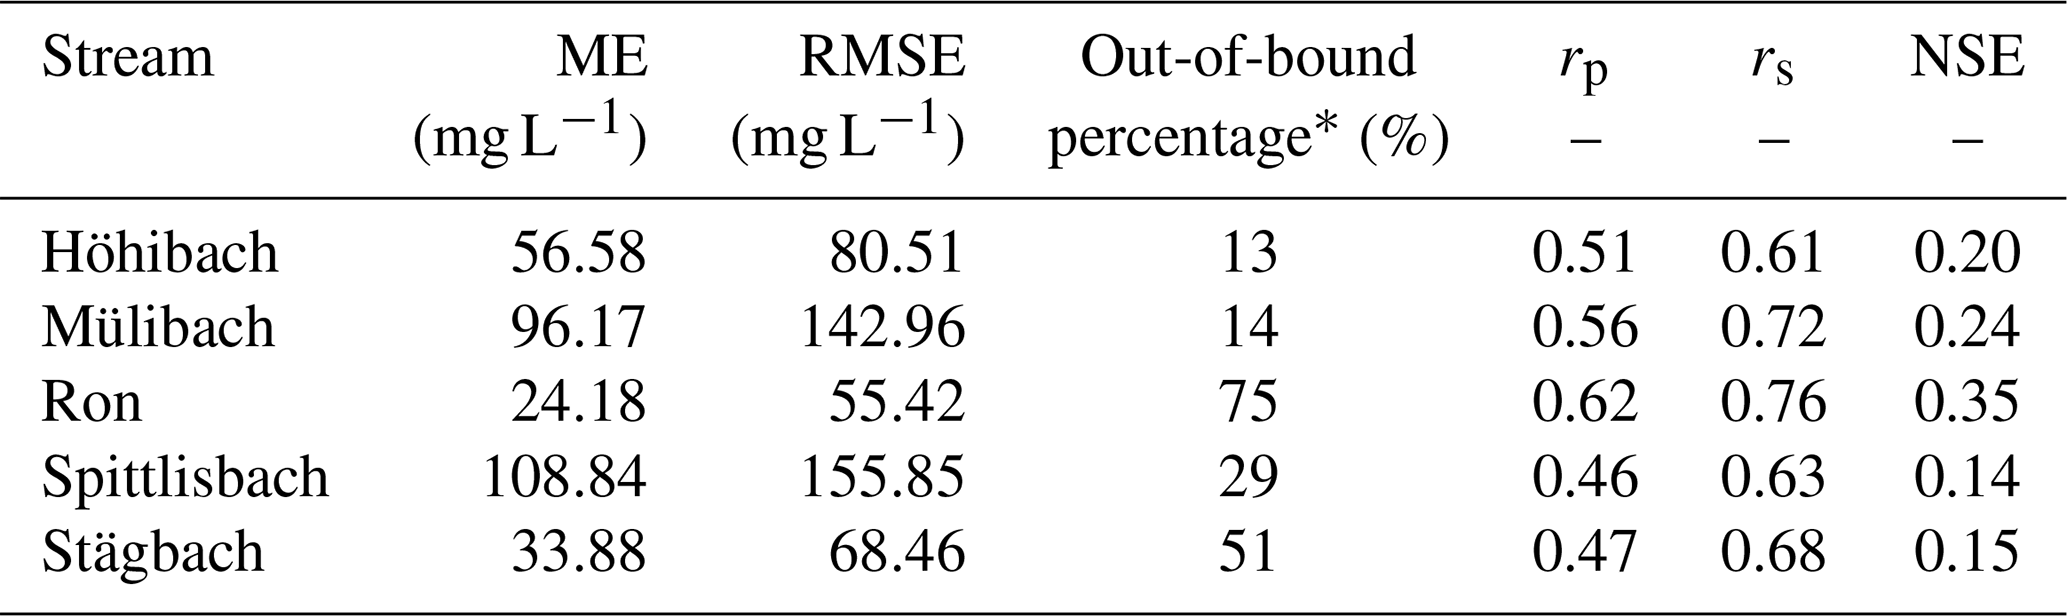
* Percentage of observations out of the 95 % prediction interval. Note: ME – mean error; RMSE – root mean square error; rp – Pearson's correlation coefficient; rs – Spearman's correlation coefficient; NSE – Nash–Sutcliffe model efficiency coefficient.
Here we assessed the interaction between landscape patchiness, linear structures, and sediment connectivity. Our quantitative model-based approach highlighted the importance of roads in (dis)connecting sediment fluxes between landscape compartments and surface waters in patchy agricultural catchments. These findings are in line with long-term field observations and qualitative model assessments for similar areas in Switzerland.
For instance, Ledermann et al. (2010) monitored off-site erosion in multiple fields from different regions of the Swiss midlands and found that linear features in general and roads in particular had a large influence on runoff concentration, soil erosion rates, and off-site damage. These authors also estimated that >50 % of eroded soil was deposited in adjacent fields and infrastructure, while up to 20 % reached surface waters, mainly through indirect inflow via the road and drainage network. Such figures are proportionate to WaTEM/SEDEM simulations for the Baldegg catchment, specifically for the shortcut scenario with the presence of grass buffer strips (Table 3). Another interesting similarity between our outputs and the field assessments from Ledermann et al. (2010) was that both approaches identified field border structures as being critical regulators of soil erosion and sediment transport (see Figs. 5 and 6). According to the field assessments, border furrows are specifically important for both triggering erosion and promoting diffuse sediment deposition. Such features, combined with long-term tillage erosion, might be responsible for creating the topographic pattern displayed in Fig. 6d.
Moreover, the capacity of roads to connect runoff and sediments from arable land to surface waters in Switzerland was extensively described by Alder et al. (2015) and Schönenberger and Stamm (2021). Both studies used a similar semi-qualitative modelling approach for identifying agricultural fields that were directly or indirectly (i.e. via the road and drainage networks) connected to surface waters. In particular, Schönenberger and Stamm (2021) mapped the location of drainage inlets in multiple small catchments of the Swiss Plateau. Accordingly, these authors identified the road drainage system as the main hydraulic shortcut connecting fields to water courses, as most drainage inlets discharge into surface waters (87 %), and only a small proportion of them flow into wastewater treatment plants or depositional areas. Hence, the fact that the WaTEM/SEDEM road as shortcuts scenario displayed a greater agreement with the sediment rating curves for the Baldegg tributaries (Fig. 7) is coherent with the current understanding of runoff dynamics in the Swiss Plateau. Of note is that the contrasting results for the Höhibach sediment loads (Fig. 7), which are much closer to the sink and patch connector simulations, do not seem to be explained by any physiographical characteristic of the subcatchment (Table S1 in the Supplement). Hence, we speculate that this different pattern could be caused by a lower inlet drainage density or specific farming practices within the Höhibach contributing area.
In addition, our simulations of edge-of-field grass buffer strips indicated that these structures might be particularly relevant for the road as shortcuts scenario. In this case, the model estimated that grass trips could reduce, up to 30 %, the sediment connectivity from hillslopes to surface waters in the Baldegg catchment (Table 4). However, we assumed 2 m wide strips at field block borders, irrespective of the adjacent structures or land use. As previously mentioned, the extent of these features is in fact quite variable, and legislation only requires 0.5 m filters between fields and roads, as reported by Alder et al. (2015). These authors further emphasised that although edge-of-field strips are an important complementary management practice, their effectiveness is often reduced in the case of large drainage areas, where very wide buffers would be necessary to stop sediment fluxes. Hence, Alder et al. (2015) recommended that minimising on-site erosion rates was ultimately the most effective way to decrease sediment input from arable land to water courses in Switzerland. Our results support this management proposition. However, our simulations also indicate that the disproportional sediment connectivity afforded by the dense road network translates into an excessive sediment supply to water courses, even when simulated erosion rates were small. As on-site erosion rates in Switzerland are already reasonably low (see Prasuhn, 2020), it might be important to consider solutions that address the sediment transport through the underground drainage system, particularly in environmentally sensitive areas such as the Baldegg catchment.
In a wider context, our study has demonstrated how structural sediment connectivity patterns can be investigated with a conceptual model such as WaTEM/SEDEM, provided that the model spatial resolution is sufficiently fine to represent relevant features and processes. In agricultural catchments of the Swiss Plateau and likely in other patchy landscapes, soil redistribution rates and patterns are intrinsically linked to linear features (see Alder et al., 2015; Ledermann et al., 2010; Prasuhn, 2020; Remund et al., 2021). Hence, in order to provide relevant system descriptions, soil erosion models applied under similar conditions must be able to represent linear features and landscape patchiness. Although our results might seem case specific, similar findings have been reported around the world. For instance, the effects of roads and farm tracks in both coupling and decoupling runoff and sediments has been described in Australia (Croke et al., 2005), Brazil (Bispo et al., 2020), Kenya (Stenfert Kroese et al., 2020), Italy (Persichillo et al., 2018), Spain (Calsamiglia et al., 2018a), and the USA (Mahoney et al., 2018). Moreover, the influence of linear features such as field borders, hedges, terraces, and tractor tram lines on soil redistribution rates have been well documented in Europe (Calsamiglia et al., 2018b; Evrard et al., 2009; Fiener and Auerswald, 2005; Lacoste et al., 2014; Saggau et al., 2019), as has the importance of landscape structure in regulating sediment connectivity (Baartman et al., 2020; Chartin et al., 2013; Fiener et al., 2011).
Another generalisable finding from our research was that WaTEM/SEDEM can be as sensitive to RUSLE parameters as to the model-specific transport capacity coefficients. Therefore, when performing uncertainty analyses of WaTEM/SEDEM, it is important to consider sources of error associated to the RUSLE parameterisation. So far, uncertainty estimation methods applied to WaTEM/SEDEM have focused on the KTC parameterisation and therefore have underestimated the uncertainty in model predictions. We anticipate that our open-source WaTEM/SEDEM script will facilitate stochastic implementations of the model and ultimately promote uncertainty and sensitivity analysis of soil erosion models. In particular, the open-source code will allow model users to explore structural uncertainties, which can contribute to increase our understanding of sediment connectivity processes. As recent studies have again demonstrated, investigating the uncertainty in model structures, parameter estimation, and observational testing data is crucial for advancing soil erosion modelling research (Benaud et al., 2021; Eekhout et al., 2021; Schürz et al., 2020).
Importantly, while we demonstrated how conceptual models such as WaTEM/SEDEM can be useful for understanding structural connectivity patterns, more dynamic and process-oriented models are necessary for identifying so-called hot spots and hot moments of sediment connectivity (Owens, 2020; Turnbull and Wainwright, 2019). In addition, WaTEM/SEDEM representations of sediment transfer could be improved by incorporating the (dis)connectivity caused by linear features other than parcel borders and grass buffer strips. This might entail assimilating the PCon parameter to features such as roadside ditches or terraces. Finally, mapping the location of hydraulic shortcuts within the road network, and the extent to which these shortcuts increase the connectivity from hillslopes to water courses (e.g. Schönenberger and Stamm, 2021), should further improve sediment connectivity simulations in areas such as the Baldegg catchment.
Here we employed a global sensitivity analysis of the WaTEM/SEDEM model to investigate the influence of linear structures and landscape patchiness on sediment connectivity in the Baldegg catchment. In particular, this novel application of WaTEM/SEDEM was implemented with the free programming language R, and our code is available in Batista et al. (2022).
Our results demonstrated that assumptions about road connectivity were by far the most important factor for modelling sediment transfer in the Baldegg catchment. Moreover, the comparison between extensive model simulations and sediment rating curve calculations indicated that roads and hydraulic shortcuts are likely to behave as conduits for sediment transport in the catchment. Hence, representing road connectivity is crucial for modelling sediment transfer from hillslope to water courses in this agricultural catchment of the Swiss Plateau and potentially in other areas with a dense road drainage system. Moreover, our results further highlighted the effects of linear structures and landscape patchiness on sediment connectivity. These findings were made possible by the use of a model that was specifically tailored to explore the particularities of our study area by effectively exploring model assumptions and the parameter space and by the use of high-resolution spatial data.
Overall, we found that WaTEM/SEDEM was useful for investigating sediment connectivity in the Baldegg catchment, as it allowed us to unravel some of the processes and structures regulating hillslope sediment transport in the area. In the case where the model is used for prediction and decision-making, we recommend employing a fit-for-purpose rejectionist model testing framework, with multiple sources of data, in order to evaluate the model's numerical accuracy and the quality of its spatial predictions.
The code for the model simulations, sediment rating curves, and random forest analysis is available at https://doi.org/10.5281/zenodo.6560226 (Batista et al., 2022).
The input data for the model simulations, the raw sediment concentration and discharge data, and model results are available at https://doi.org/10.5281/zenodo.6560226 (Batista et al., 2022).
The supplement related to this article is available online at: https://doi.org/10.5194/hess-26-3753-2022-supplement.
PVGB and PF developed the model code, and PVGB performed the simulations and analysed the data. SS prepared model input data. PVGB prepared the paper, with contributions from all authors. CA was part of discussing ideas and revising the paper.
The contact author has declared that none of the authors has any competing interests.
Publisher's note: Copernicus Publications remains neutral with regard to jurisdictional claims in published maps and institutional affiliations.
The authors would like to thank Robert Lovas, from the Department of Environment and Energy of the Canton of Lucerne, for supplying the sediment concentration and water discharge monitoring data and commenting on an earlier draft of this work. We also appreciate the help from Axel Birkholz in acquiring the data. Pedro V. G. Batista would like to thank Franz Conen and Claudia Mignani, for their multiple and valuable inputs regarding the conceptualisation and preparation of this work. We are thankful to the comments from two anonymous reviewers, which greatly improved the quality of this paper.
This paper was edited by Genevieve Ali and reviewed by two anonymous referees.
Alder, S., Prasuhn, V., Liniger, H., Herweg, K., Hurni, H., Candinas, A., and Gujer, H. U.: A high-resolution map of direct and indirect connectivity of erosion risk areas to surface waters in Switzerland-A risk assessment tool for planning and policy-making, Land Use Policy, 48, 236–249, https://doi.org/10.1016/j.landusepol.2015.06.001, 2015.
Antoniadis, A., Lambert-Lacroix, S., and Poggi, J. M.: Random forests for global sensitivity analysis: A selective review, Reliab. Eng. Syst. Safe., 206, 107312, https://doi.org/10.1016/j.ress.2020.107312, 2021.
Baartman, J. E. M., Nunes, J. P., Masselink, R., Darboux, F., Bielders, C., Degré, A., Cantreul, V., Cerdan, O., Grangeon, T., Fiener, P., Wilken, F., Schindewolf, M., and Wainwright, J.: What do models tell us about water and sediment connectivity?, Geomorphology, 367, 107300, https://doi.org/10.1016/j.geomorph.2020.107300, 2020.
BAFU: Faktenblatt: Der Greifensee, Zustand bezüglich Wasserqualität, 1–8, http://www.bafu.admin.ch (last access” 14 February 2021), 2016.
Bakker, M. M., Govers, G., van Doorn, A., Quetier, F., Chouvardas, D., and Rounsevell, M.: The response of soil erosion and sediment export to land-use change in four areas of Europe: The importance of landscape pattern, Geomorphology, 98, 213–226, https://doi.org/10.1016/j.geomorph.2006.12.027, 2008.
Batista, P. V. G., Fiener, P., Scheper, S., and Alewell, C.: Data and code for: A conceptual model-based sediment connectivity assessment for patchy agricultural catchments, Zenodo [data set], https://doi.org/10.5281/zenodo.6560226, 2022.
Batista, P. V. G., Laceby, J. P., Davies, J., Carvalho, T. S., Tassinari, D., Silva, M. L. N., Curi, N., and Quinton, J. N.: A framework for testing large-scale distributed soil erosion and sediment delivery models: Dealing with uncertainty in models and the observational data, Environ. Model. Softw., 137, 104961, https://doi.org/10.1016/j.envsoft.2021.104961, 2021.
Bauer, M., Dostal, T., Krasa, J., Jachymova, B., David, V., Devaty, J., Strouhal, L., and Rosendorf, P.: Risk to residents, infrastructure, and water bodies from flash floods and sediment transport, Environ. Monit. Assess., 191, 1–19, https://doi.org/10.1007/s10661-019-7216-7, 2019.
Benaud, P., Anderson, K., Evans, M., Farrow, L., Glendell, M., James, M. R., Quine, T. A., Quinton, J. N., Rickson, R. J., and Brazier, R. E.: Reproducibility, open science and progression in soil erosion research. A reply to “Response to `National-scale geodata describe widespread accelerated soil erosion' Benaud et al. (2020) Geoderma 271, 114378” by Evans and Boardman (2021), Geoderma, 402, 115181, https://doi.org/10.1016/j.geoderma.2021.115181, 2021.
Bircher, P., Liniger, H., and Prasuhn, V.: Aktualisierung und Optimierung der Erosionsrisikokarte (ERK2) Die neue ERK2 (2019) für das Ackerland der Schweiz, https://www.blw.admin.ch/dam/blw/de/dokumente/Nachhaltige Produktion/Umwelt/Boden/Bericht zur Erosionsrisikokarte.pdf.download.pdf/Erosionsrisikokarte 2019.pdf (last access: 20 January 2021), 2019.
Bispo, D. F. A., Batista, P. V. G., Guimarães, D. V., Silva, M. L. N., Curi, N., and Quinton, J. N.: Monitoring land use impacts on sediment production: a case study of the pilot catchment from the Brazilian program of payment for environmental services, Rev. Bras. Ciência do Solo, 44, e0190167, https://doi.org/10.36783/18069657rbcs20190167, 2020.
Boardman, J.: A 38-year record of muddy flooding at Breaky Bottom: Learning from a detailed case study, Catena, 189, 104493, https://doi.org/10.1016/j.catena.2020.104493, 2020.
Borrelli, P., Meusburger, K., Ballabio, C., Panagos, P., and Alewell, C.: Object-oriented soil erosion modelling: A possible paradigm shift from potential to actual risk assessments in agricultural environments, Land. Degrad. Dev., 29, 1270–1281, https://doi.org/10.1002/ldr.2898, 2018.
Borselli, L., Cassi, P., and Torri, D.: Prolegomena to sediment and flow connectivity in the landscape: A GIS and field numerical assessment, Catena, 75, 268–277, https://doi.org/10.1016/j.catena.2008.07.006, 2008.
Breiman, L.: Random forests, Mach. Learn., 45, 5–32, 2001.
Brenning, A., Bangs, D., and Becker, M.: RSAGA: SAGA geoprocessing and terrain analysis, R package version 1.3.0, https://cran.r-project.org/web/packages/RSAGA/index.html (last access: 20 January 2021), 2018.
Calsamiglia, A., García-Comendador, J., Fortesa, J., López-Tarazón, J. A., Crema, S., Cavalli, M., Calvo-Cases, A., and Estrany, J.: Effects of agricultural drainage systems on sediment connectivity in a small Mediterranean lowland catchment, Geomorphology, 318, 162–171, https://doi.org/10.1016/j.geomorph.2018.06.011, 2018a.
Calsamiglia, A., Fortesa, J., García-Comendador, J., Lucas-Borja, M. E., Calvo-Cases, A., and Estrany, J.: Spatial patterns of sediment connectivity in terraced lands: Anthropogenic controls of catchment sensitivity, Land. Degrad. Dev., 29, 1198–1210, https://doi.org/10.1002/ldr.2840, 2018b.
Cavalli, M., Trevisani, S., Comiti, F., and Marchi, L.: Geomorphometric assessment of spatial sediment connectivity in small Alpine catchments, Geomorphology, 188, 31–41, https://doi.org/10.1016/j.geomorph.2012.05.007, 2013.
Chartin, C., Evrard, O., Salvador-Blanes, S., Hinschberger, F., Van Oost, K., Lefèvre, I., Daroussin, J., and Macaire, J. J.: Quantifying and modelling the impact of land consolidation and field borders on soil redistribution in agricultural landscapes (1954–2009), Catena, 110, 184–195, https://doi.org/10.1016/j.catena.2013.06.006, 2013.
Cohn, T. A., Caulder, D. L., Gilroy, J., Zynjuk, L. D., and Summers, R. M.: The Validity of a Simple Statistical Model for Estimating, Water Resour. Res., 28, 2353–2363, 1992.
Conrad, O., Bechtel, B., Bock, M., Dietrich, H., Fischer, E., Gerlitz, L., Wehberg, J., Wichmann, V., and Böhner, J.: System for Automated Geoscientific Analyses (SAGA) v. 2.1.4, Geosci. Model Dev., 8, 1991–2007, https://doi.org/10.5194/gmd-8-1991-2015, 2015.
Croke, J., Mockler, S., Fogarty, P., and Takken, I.: Sediment concentration changes in runoff pathways from a forest road network and the resultant spatial pattern of catchment connectivity, Geomorphology, 68, 257–268, https://doi.org/10.1016/j.geomorph.2004.11.020, 2005.
Desmet, P. and Govers, G.: A GIS procedure for automatically calculating the USLE LS factor on topographically complex landscape units, J. Soil Water Conserv., 51, 427–433, 1996.
Eekhout, J. P. C., Millares-Valenzuela, A., Martínez-Salvador, A., García-Lorenzo, R., Pérez-Cutillas, P., Conesa-García, C., and de Vente, J.: A process-based soil erosion model ensemble to assess model uncertainty in climate-change impact assessments, Land. Degrad. Dev., 32, 2409–2422, https://doi.org/10.1002/ldr.3920, 2021.
Evrard, O., Cerdan, O., van Wesemael, B., Chauvet, M., Le Bissonnais, Y., Raclot, D., Vandaele, K., Andrieux, P., and Bielders, C.: Reliability of an expert-based runoff and erosion model: Application of STREAM to different environments, Catena, 78, 129–141, https://doi.org/10.1016/j.catena.2009.03.009, 2009.
Fiener, P. and Auerswald, K.: Measurement and modeling of concentrated runoff in grassed waterways, J. Hydrol., 301, 198–215, https://doi.org/10.1016/j.jhydrol.2004.06.030, 2005.
Fiener, P., Auerswald, K., and Van Oost, K.: Spatio-temporal patterns in land use and management affecting surface runoff response of agricultural catchments – A review, Earth-Sci. Rev., 106, 92–104, https://doi.org/10.1016/j.earscirev.2011.01.004, 2011.
Fiener, P., Wilken, F., and Auerswald, K.: Filling the gap between plot and landscape scale – eight years of soil erosion monitoring in 14 adjacent watersheds under soil conservation at Scheyern, Southern Germany, Adv. Geosci., 48, 31–48, https://doi.org/10.5194/adgeo-48-31-2019, 2019.
Fryirs, K.: (Dis)Connectivity in catchment sediment cascades: A fresh look at the sediment delivery problem, Earth Surf. Proc. Land., 38, 30–46, https://doi.org/10.1002/esp.3242, 2013.
Gelman, A. and Hill, J.: Data Analysis Using Regression and Multilevel/Hierarchical Models, R package version 1.12.2, Cambridge Univeristy Press, New York, ISBN 9780511268786, 2007.
Govers, G.: Misapplications and misconceptions of erosion models, in: Handbook of erosion modelling, edited by: Morgan, R. P. C. and Nearing, M. A., Blackwell Publishing Ltd., Chichester, UK, 117–134, ISBN 9781405190107, 2011.
Heckmann, T., Cavalli, M., Cerdan, O., Foerster, S., Javaux, M., Lode, E., Smetanová, A., Vericat, D., and Brardinoni, F.: Indices of sediment connectivity: opportunities, challenges and limitations, Earth-Sci. Rev., 187, 77–108, https://doi.org/10.1016/j.earscirev.2018.08.004, 2018.
IUSS Working Group WRB: World Reference Base for Soil Resources, IUSS Working Group WRB, Wageningen, the Netherlands, 1–128, https://www.fao.org/3/i3794en/I3794en.pdf (last access: 14 February 2021), 2006.
Keller, B.: Lake Lucerne and its spectacular landscape, in: Landscapes and landforms of Switzerland, edited by: Reynard, E., Springer Nature, Cham, Switzerland, 305–324, ISBN 9783030432034, 2021.
Krasa, J., Dostal, T., Jachymova, B., Bauer, M., and Devaty, J.: Soil erosion as a source of sediment and phosphorus in rivers and reservoirs – Watershed analyses using WaTEM/SEDEM, Environ. Res., 171, 470–483, https://doi.org/10.1016/j.envres.2019.01.044, 2019.
Kupferschmied, P.: CP-Tool: Ein Programm zur Berechnung des Fruchtfolge- und Bewirtschaftungsfaktors (CP-Faktor) der Allgemeinen Bodenabtragsgleichung (ABAG), https://www.agroscope.admin.ch/dam/agroscope/de/dokumente (last access: 14 February 2021), 2019.
Laceby, J. P., Batista, P. V. G., Taube, N., Kruk, M. K., Chung, C., Evrard, O., and Orwin, J. F.: Tracing total and dissolved material in a western Canadian basin using quality control samples to guide the selection of fingerprinting parameters for modelling, Catena, 200, 105095, https://doi.org/10.1016/j.catena.2020.105095, 2021.
Lacoste, M., Michot, D., Viaud, V., Evrard, O., and Walter, C.: Combining 137Cs measurements and a spatially distributed erosion model to assess soil redistribution in a hedgerow landscape in northwestern France (1960–2010), Catena, 119, 78–89, https://doi.org/10.1016/j.catena.2014.03.004, 2014.
Lavrieux, M., Birkholz, A., Meusburger, K., Wiesenberg, G. L. B., Gilli, A., Stamm, C., and Alewell, C.: Plants or bacteria? 130 years of mixed imprints in Lake Baldegg sediments (Switzerland), as revealed by compound-specific isotope analysis (CSIA) and biomarker analysis, Biogeosciences, 16, 2131–2146, https://doi.org/10.5194/bg-16-2131-2019, 2019.
Ledermann, T., Herweg, K., Liniger, H. P., Schneider, F., Hurni, H., and Prasuhn, V.: Applying erosion damage mapping to assess and quantify off-site effects of soil erosion in Switzerland, Land. Degrad. Dev., 21, 353–366, 2010.
Liaw, A. and Wiener, M.: Classification and regression by randomForest, R package version 4.7.1, R News, 2, 18–22, 2002.
Mahoney, D. T., Fox, J. F., and Al-Aamery, N.: Watershed erosion modeling using the probability of sediment connectivity in a gently rolling system, J. Hydrol., 561, 862–883, https://doi.org/10.1016/j.jhydrol.2018.04.034, 2018.
Mahoney, D. T., Fox, J., Al-Aamery, N., and Clare, E.: Integrating connectivity theory within watershed modelling part I: Model formulation and investigating the timing of sediment connectivity, Sci. Total Environ., 740, 140385, https://doi.org/10.1016/j.scitotenv.2020.140385, 2020a.
Mahoney, D. T., Fox, J., Al-Aamery, N., and Clare, E.: Integrating connectivity theory within watershed modelling part II: Application and evaluating structural and functional connectivity, Sci. Total Environ., 740, 140386, https://doi.org/10.1016/j.scitotenv.2020.140386, 2020b.
MeteoSwiss: SwissMetNet Surface Weather Stations, Mosen MOA, 2010–2019, Switzerland, https://www.meteoswiss.admin.ch/home/measurement-values.html?param=messnetz-automatisch&station=MOA&chart=hour (last access: 13 July 2022), 2021.
Moriasi, D. N., Gitau, M. W., Pai, N., and Daggupati, P.: Hydrologic and water quality models: Performance measures and evaluation criteria, T. ASABE, 58, 1763–1785, https://doi.org/10.13031/trans.58.10715, 2015.
Müller, B., Gächter, R., and Wüest, A.: Accelerated water quality improvement during oligotrophication in peri-alpine lakes, Environ. Sci. Technol., 48, 6671–6677, https://doi.org/10.1021/es4040304, 2014.
Notebaert, B., Vaes, B., Govers, G., Van Oost, K., Van Rompaey, A., and Verstraeten, G.: WaTEM/SEDEM version 2006 Manual, https://ees.kuleuven.be/eng/geography/modelling/watemsedem2006/manual_watemsedem_122011.pdf (last access: 1 March 2021), 2006.
Nunes, J. P., Wainwright, J., Bielders, C. L., Darboux, F., Fiener, P., Finger, D., and Turnbull, L.: Better models are more effectively connected models, Earth Surf. Proc. Land., 43(, 1355–1360, https://doi.org/10.1002/esp.4323, 2018.
Owens, P. N.: Soil erosion and sediment dynamics in the Anthropocene: a review of human impacts during a period of rapid global environmental change, J. Soils Sediments, 20, 4115–4143, https://doi.org/10.1007/s11368-020-02815-9, 2020.
Parsons, A. J., Wainwright, J., Brazier, R. E., and Powell, D. M.: Is sediment delivery a fallacy? Reply, Earth Surf. Proc. Land., 34, 155–161, https://doi.org/10.1002/esp.1395, 2009.
Persichillo, M. G., Bordoni, M., Cavalli, M., Crema, S., and Meisina, C.: The role of human activities on sediment connectivity of shallow landslides, Catena, 160, 261–274, https://doi.org/10.1016/j.catena.2017.09.025, 2018.
Pfiffner, O. A.: The structural landscapes of Central Switzerland, in: Landscapes and landforms of Switzerland, edited by: Reynard, E., Springer Nature Switzerland, Cham, Switzerland, 159–172, ISBN 9783030432034, 2021.
Pianosi, F., Beven, K., Freer, J., Hall, J. W., Rougier, J., Stephenson, D. B., and Wagener, T.: Sensitivity analysis of environmental models: A systematic review with practical workflow, Environ. Model. Softw., 79, 214–232, https://doi.org/10.1016/j.envsoft.2016.02.008, 2016.
Prasuhn, V.: Twenty years of soil erosion on-farm measurement: annual variation, spatial distribution and the impact of conservation programmes for soil loss rates in Switzerland, Earth Surf. Proc. Land., 45, 1539–1554, https://doi.org/10.1002/esp.4829, 2020.
R Core Team: R: A language for statistical computing, R Foundation for Statistical Computing, Vienna, Austria, https://www.R-project.org (last access: 13 July 2022), 2021.
Remund, D., Liebisch, F., Liniger, H. P., Heinimann, A., and Prasuhn, V.: The origin of sediment and particulate phosphorus inputs into water bodies in the Swiss Midlands – A twenty-year field study of soil erosion, Catena, 203, 105290, https://doi.org/10.1016/j.catena.2021.105290, 2021.
Renard, K., Foster, G. R., Weesies, G. A., McCool, D. K., and Yoder, D. C.: Predicting Soil Erosion by Water: A Guide to Conservation Planning With the Revised Universal Soil Loss Equation (RUSLE), U.S: Government Printing Office, Washington, ISBN 9780160489389, 1997.
Saggau, P., Kuhwald, M., and Duttmann, R.: Integrating soil compaction impacts of tramlines into soil erosion modelling: A field-scale approach, Soil Syst., 3, 1–28, https://doi.org/10.3390/soilsystems3030051, 2019.
Schmidt, S., Alewell, C., Panagos, P., and Meusburger, K.: Regionalization of monthly rainfall erosivity patternsin Switzerland, Hydrol. Earth Syst. Sci., 20, 4359–4373, https://doi.org/10.5194/hess-20-4359-2016, 2016.
Schmidt, S., Ballabio, C., Alewell, C., Panagos, P., and Meusburger, K.: Filling the European blank spot – Swiss soil erodibility assessment with topsoil samples, J. Plant Nutr. Soil Sci., 181, 737–748, https://doi.org/10.1002/jpln.201800128, 2018a.
Schmidt, S., Alewell, C., and Meusburger, K.: Mapping spatio-temporal dynamics of the cover and management factor (C-factor) for grasslands in Switzerland, Remote Sens. Environ., 211, 89–104, https://doi.org/10.1016/j.rse.2018.04.008, 2018b.
Schönenberger, U. and Stamm, C.: Hydraulic shortcuts increase the connectivity of arable land areas to surface waters, Hydrol. Earth Syst. Sci., 25, 1727–1746, https://doi.org/10.5194/hess-25-1727-2021, 2021.
Schürz, C., Mehdi, B., Kiesel, J., Schulz, K., and Herrnegger, M.: A systematic assessment of uncertainties in large-scale soil loss estimation from different representations of USLE input factors – a case study for Kenya and Uganda, Hydrol. Earth Syst. Sci., 24, 4463–4489, https://doi.org/10.5194/hess-24-4463-2020, 2020.
Sherriff, S. C., Rowan, J. S., Fenton, O., Jordan, P., Melland, A. R., Mellander, P. E., and Huallacháin, D.: Storm Event Suspended Sediment-Discharge Hysteresis and Controls in Agricultural Watersheds: Implications for Watershed Scale Sediment Management, Environ. Sci. Technol., 50, 1769–1778, https://doi.org/10.1021/acs.est.5b04573, 2016.
Starkloff, T. and Stolte, J.: Applied comparison of the erosion risk models EROSION 3D and LISEM for a small catchment in Norway, Catena, 118, 154–167, https://doi.org/10.1016/j.catena.2014.02.004, 2014.
Stenfert Kroese, J., Batista, P. V. G., Jacobs, S. R., Breuer, L., Quinton, J. N., and Rufino, M. C.: Agricultural land is the main source of stream sediments after conversion of an African montane forest, Sci. Rep., 10, 1–15, https://doi.org/10.1038/s41598-020-71924-9, 2020.
Stoll, S., von Arb, C., Jorg, C., Kopp, S., and Prasuhn, V.: Evaluation der stark zur Phosphor-Belastung des Baldeggersees beitragenden Flächen, https://www.agroscope.admin.ch/agroscope/fr/home/a-propos/collaborateurs/_jcr_content/par/externalcontent (last access: 14 February 2021), 2019.
Swisstopo: SwissALTI3D, Das hoch aufgelöste Terrainmodell der Schweiz, https://www.swisstopo.admin.ch/de/geodata/height/alti3d.html (last access: 26 November 2020), 2014a.
Swisstopo: Swissimage, Das digitale Farborthophotomosaik der Schweiz, https://www.swisstopo.admin.ch/de/geodata/images/ortho/swissimage10.html (last access: 26 November 2020), 2014b.
Swisstopo: Swiss Map Vector 25 Beta, Das digitale Landschaftsmodell der Schweiz, https://www.swisstopo.admin.ch/de/geodata/maps/smv/smv25.html (last access: 26 November 2020), 2018.
Swisstopo: SwissTLM3D, Das grossmassstäbliche Topografische Landschaftsmodell der Schweiz, https://www.swisstopo.admin.ch/de/geodata/landscape/tlm3d.html (last access: 26 November 2020), 2020.
Teranes, J. L. and Bernasconi, S. M.: Factors controlling δ13C values of sedimentary carbon in hypertrophic Baldeggersee, Switzerland, and implications for interpreting isotope excursions in lake sedimentary records, Limnol. Oceanogr., 50, 914–922, https://doi.org/10.4319/lo.2005.50.3.0914, 2005.
Turnbull, L. and Wainwright, J.: From structure to function: Understanding shrub encroachment in drylands using hydrological and sediment connectivity, Ecol. Indic., 98, 608–618, https://doi.org/10.1016/j.ecolind.2018.11.039, 2019.
Van Oost, K., Govers, G., and Desmet, P. J. J.: Evaluating the effects of changes in landscape structure on soil erosion by water and tillage, Landsc. Ecol., 15, 577–589, https://doi.org/10.1023/A:1008198215674, 2000.
Van Rompaey, A., Verstraeten, G., Van Oost, K., Govers, G., and Poesen, J.: Modelling mean annual sediment yield using a distributed approach, Earth Surf. Proc. Land., 26, 1221–1236, https://doi.org/10.1002/esp.275, 2001.
Verstraeten, G., Van Oost, K., Van Rompaey, A. J. J., Poesen, J., and Govers, G.: Evaluating an integrated approach to catchment management to reduce soil loss and sediment pollution through modelling, Soil Use Manage., 18, 386–394, https://doi.org/10.1111/j.1475-2743.2002.tb00257.x, 2010.
Vigiak, O. and Bende-Michl, U.: Estimating bootstrap and Bayesian prediction intervals for constituent load rating curves, Water Resour. Res., 49, 8565–8578, https://doi.org/10.1002/2013WR013559, 2013.
von Arb, C., Stoll, S., Frossard, E., Stamm, C., and Prasuhn, V.: The time it takes to reduce soil legacy phosphorus to a tolerable level for surface waters: What we learn from a case study in the catchment of Lake Baldegg, Switzerland, Geoderma, 403, 115257, https://doi.org/10.1016/j.geoderma.2021.115257, 2021.
Wainwright, J., Turnbull, L., Ibrahim, T. G., Lexartza-Artza, I., Thornton, S. F., and Brazier, R. E.: Linking environmental regimes, space and time: Interpretations of structural and functional connectivity, Geomorphology, 126, 387–404, https://doi.org/10.1016/j.geomorph.2010.07.027, 2011.
Wehrli, B., Lotter, A. F., Schaller, T., and Sturm, M.: High-resolution varve studies in Baldeggersee (Switzerland): Project overview and limnological background data, Aquat. Sci., 59, 285–294, https://doi.org/10.1007/BF02522359, 1997.
Wilken, F., Fiener, P., and Van Oost, K.: Modelling a century of soil redistribution processes and carbon delivery from small watersheds using a multi-class sediment transport model, Earth Surf. Dynam., 5, 113–124, https://doi.org/10.5194/esurf-5-113-2017, 2017.