the Creative Commons Attribution 4.0 License.
the Creative Commons Attribution 4.0 License.
 | 05 Jul 2022
Experimental study of non-Darcy flow characteristics in permeable stones
Zhongxia Li
Junwei Wan
Tao Xiong
Hongbin Zhan
Linqing He
Kun Huang
This study provides experimental evidence of Forchheimer flow and the transition between different flow regimes from the perspective of the pore size of permeable stone. We first carry out seepage experiments on four kinds of permeable stones with mesh sizes of 24, 46, 60 and 80, corresponding to mean particle sizes (50 % by weight) of 0.71, 0.36, 0.25 and 0.18 mm, respectively. The seepage experiments show that an obvious deviation from Darcy flow regime is visible. In addition, the critical specific discharge corresponding to the transition between flow regimes (from pre-Darcy to post-Darcy) increases with increasing particle size. When the “pseudo” hydraulic conductivity (K, which is computed as the ratio of the specific discharge q and the hydraulic gradient) increases with increasing q, the flow regime is denoted pre-Darcy flow. After q increases to a certain value, the pseudo hydraulic conductivity begins to decrease; this regime is called post-Darcy flow. In addition, we use the mercury injection technique to measure the pore size distributions of four permeable stones with different particle sizes. The mercury injection curve is divided into three stages. The beginning and end segments of the mercury injection curve are very gentle, with relatively small slopes, while the intermediate mercury injection curve is steep, indicating that the pore size in permeable stones is relatively uniform. The porosity decreases as the mean particle sizes increases. The mean pore faithfully reflects the influences of the particle diameter, sorting degree and arrangement mode of the porous medium on seepage parameters. This study shows that the size of pores is an essential factor for determining the flow regime. In addition, the Forchheimer coefficients are discussed. The coefficient A (which is related to the linear term of the Forchheimer equation) is linearly related to : . The coefficient B (which is related to the quadratic term of the Forchheimer equation) is a quadratic function of : . The porosity (n) can be used to reveal the effects of the sorting degree and arrangement on the seepage coefficients. A larger porosity leads to smaller coefficients A and B for the same particle size.
- Article
(4420 KB) - Full-text XML
- BibTeX
- EndNote


Darcy (1857) conducted a steady-state flow experiment in porous media and concluded that the specific discharge was proportional to the hydraulic gradient, which is Darcy's law:
where q is the specific discharge, J is the hydraulic gradient and K is the hydraulic conductivity. However, when the specific discharge increases above a certain threshold, a deviation from Darcy's law is evident, and the flow regime changes from the Darcy flow regime to the so-called non-Darcy flow regime (Bear, 1975). This was first observed by Forchheimer (1901), who proposed a widely used non-Darcy flow equation, the Forchheimer equation:
where A and B are constants related to the fluid properties and pore structure. The first and second terms on the right side of Eq. (2) more or less reflect the contributions of viscous and inertial forces (or resistance to flow), respectively.
From the Forchheimer equation, we can see that when the specific discharge is sufficiently small, the inertial force can be ignored, and the equation transforms into the form of Darcy's law. On the other hand, when the specific discharge is sufficiently large, the viscous force can be ignored, and the equation transforms into fully developed turbulent flow.
In addition to a polynomial function such as the Forchheimer equation, several power-law functions have also been proposed to describe non-Darcy flow. One of the most commonly used power-law equations is the Izbash equation (Izbash, 1931), which is written as
where a and b are empirical parameters that depend on the flow and material properties. The coefficient b is usually between 1 and 2.
Because of its applicability for a wide range of velocity spectra and its sound physics, many scholars have adopted the Forchheimer equation (among many different types of equations) to explore non-Darcy flow. The theoretical background of the Forchheimer equation has also been discussed in detail (Panfilov and Fourar, 2006). Numerous experimental data have confirmed the validity of the Forchheimer equation for a variety of nonlinear flow phenomena (Geertsma, 1974; Scheidegger, 1958; Wright, 1968). The quadratic Forchheimer law has also been revealed as a result of numerical modeling in which the Navier–Stokes flow in corrugated channels was simulated (Koch and Ladd, 1996; Skjetne et al., 1999; Souto and Moyne, 1997). Thus, the Forchheimer equation will be selected as the representative equation to describe non-Darcy flow in this study.
Since the transition between Darcy flow and non-Darcy flow is important and difficult to quantify, different scholars have carried out experiments using a wide range of porous media, including homogeneous and heterogeneous porous media. Most of the experimental studies have focused on the influence of the mean particle size on the flow state transition when using homogeneous porous media. In fact, in earlier studies, it was believed that the nonlinear (or non-Darcy) flow behavior in porous media was due to the turbulent effect of the flow, and the Reynolds number (Re) was widely used to quantify the initiation of non-Darcy flow. (Bear (1975) concluded that the critical Re (denoted as Rec) of flow states (or the Re value at which flow starts to change from the Darcy flow regime to the non-Darcy flow regime) is between 1 and 10. This finding was based on experimental data collected from packed sand beds (Ergun, 1952; Fancher and Lewis, 1933; Lindquist, 1933; Scheidegger, 1960). Schneebeli (1955) and Wright (1968) experimentally measured the value of Re at the beginning of turbulence and concluded that at very high velocities, the deviation from Darcy's law is due to inertial effects followed by turbulent effects. In addition, Dudgeon (1966) confirmed that Rec is about 60–150 for media consisting of relatively coarse particles, including river gravels, crushed rock particles and glass marbles with grain sizes ranging from 16 to 152 mm. Dudgeon (1966) indicated that the deviation from Darcy's law was not entirely due to turbulence, but to a large extent due to inertial forces. Also, Geertsma (1974) determined an empirical relationship between the inertial coefficient, permeability and porosity by conducting non-Darcy flow experiments in unconsolidated and consolidated sands. Laser anemometry and flow visualization studies of fluid flow in porous structures were used by Dybbs and Edwards (1984), who observed nonlinear behavior at Reynolds numbers of around 150. Latifi et al. (1989) found that the transition from unsteady-state laminar flow to non-Darcy flow in packed beds of spheres occurred between Re values of 110 and 370. Seguin et al. (1998) characterized flow regimes in various porous media with electrochemical techniques and found that the end of the Darcy flow regime in packed beds of particles appeared at an Re of about 180. Also, Bu et al. (2014) observed that the Darcy flow in packed beds ends at an Re of around 100 using electrochemical techniques. Sedghi-Asl et al. (2014) found that Darcy's law was usually not valid for rounded particle sizes of greater than 2.8 mm, according to experimental results for flow in rounded aggregates of different sizes. Our previous experimental research (Li et al., 2017) indicated that when the particle size was smaller than 2.8 mm, the flow state gradually changed from pre-Darcy flow to post-Darcy flow as the specific discharge increased. When the medium particle size is even larger, such as 4.5, 6.39, 12.84 and 16 mm (Moutsopoulos et al., 2009), only post-Darcy flow exists. Based on the above analysis, we can see that many previous experiments have been carried out on homogeneous porous media, and that the non-Darcy flow characteristics vary significantly depending on the particle size of the porous medium.
It is evident that most of the numerous experimental studies reviewed above on the transition from Darcy flow to non-Darcy flow focused on the effect of the mean particle size rather than the particle size distribution. Recently, a few investigators have recognized the importance of particle size heterogeneity in understanding the transition between flow regimes, and have carried out a series of experiments to address the issue. For instance, Van Lopik et al. (2017) provided new experimental data on nonlinear flow behavior in 20 samples of various uniformly graded granular materials ranging from medium sands (d50 > 0.39 mm) to gravel (d50 > 6.34 mm). In addition, they investigated the nonlinear flow behavior through packed beds of five different types of natural sand and gravel from unconsolidated aquifers as well as 13 different composite mixtures of uniformly graded filter sands with different grain size distributions and porosity values (Van Lopik et al., 2019). We have also discussed the effect of particle size distribution on Forchheimer flow and the transition between flow regimes in a previous study (Z. Li et al., 2019). Our previous study showed that, as well as the mean particle size, the uniformity coefficient (a term used to describe the pore size distribution) of the porous medium is a critical factor for determining the flow regime. Yang et al. (2019) investigated the effects of the particle size distribution on the seepage behavior of a sand particle mixture and evaluated the validity of empirical formulas for the permeability and inertia factor used in engineering practice. Shi et al. (2020) discussed the non-Darcy flow behavior of granular limestone with a wide range of porosities (from 0.242 to 0.449). Based on the experimental data, Shi et al. (2020) proposed an empirical hydraulic conductivity–porosity relation as well as an expression for the inertial coefficient. Regardless of whether the media investigated are homogeneous or heterogeneous, the main influence on the water passing capacity of a porous medium is the pore size. Thus, exploring the distributions of pores in porous media is the basis for studying the flow dynamics of Darcy and non-Darcy flows.
The purpose of this study is to provide a quantitative analysis of the effects of pore size on the transition of flow regimes between Darcy and non-Darcy flows, based on a series of laboratory experiments. To meet the objectives, we first carry out seepage experiments on permeable stones with four different particle sizes. After that, we conduct mercury injection experiments on permeable stones with four different particle sizes, obtaining the pore size distributions for different particle sizes. Finally, the effects of pore size on the transition between flow regimes and the Forchheimer coefficients are discussed, based on the experimental results.
2.1 Experimental setup and methods
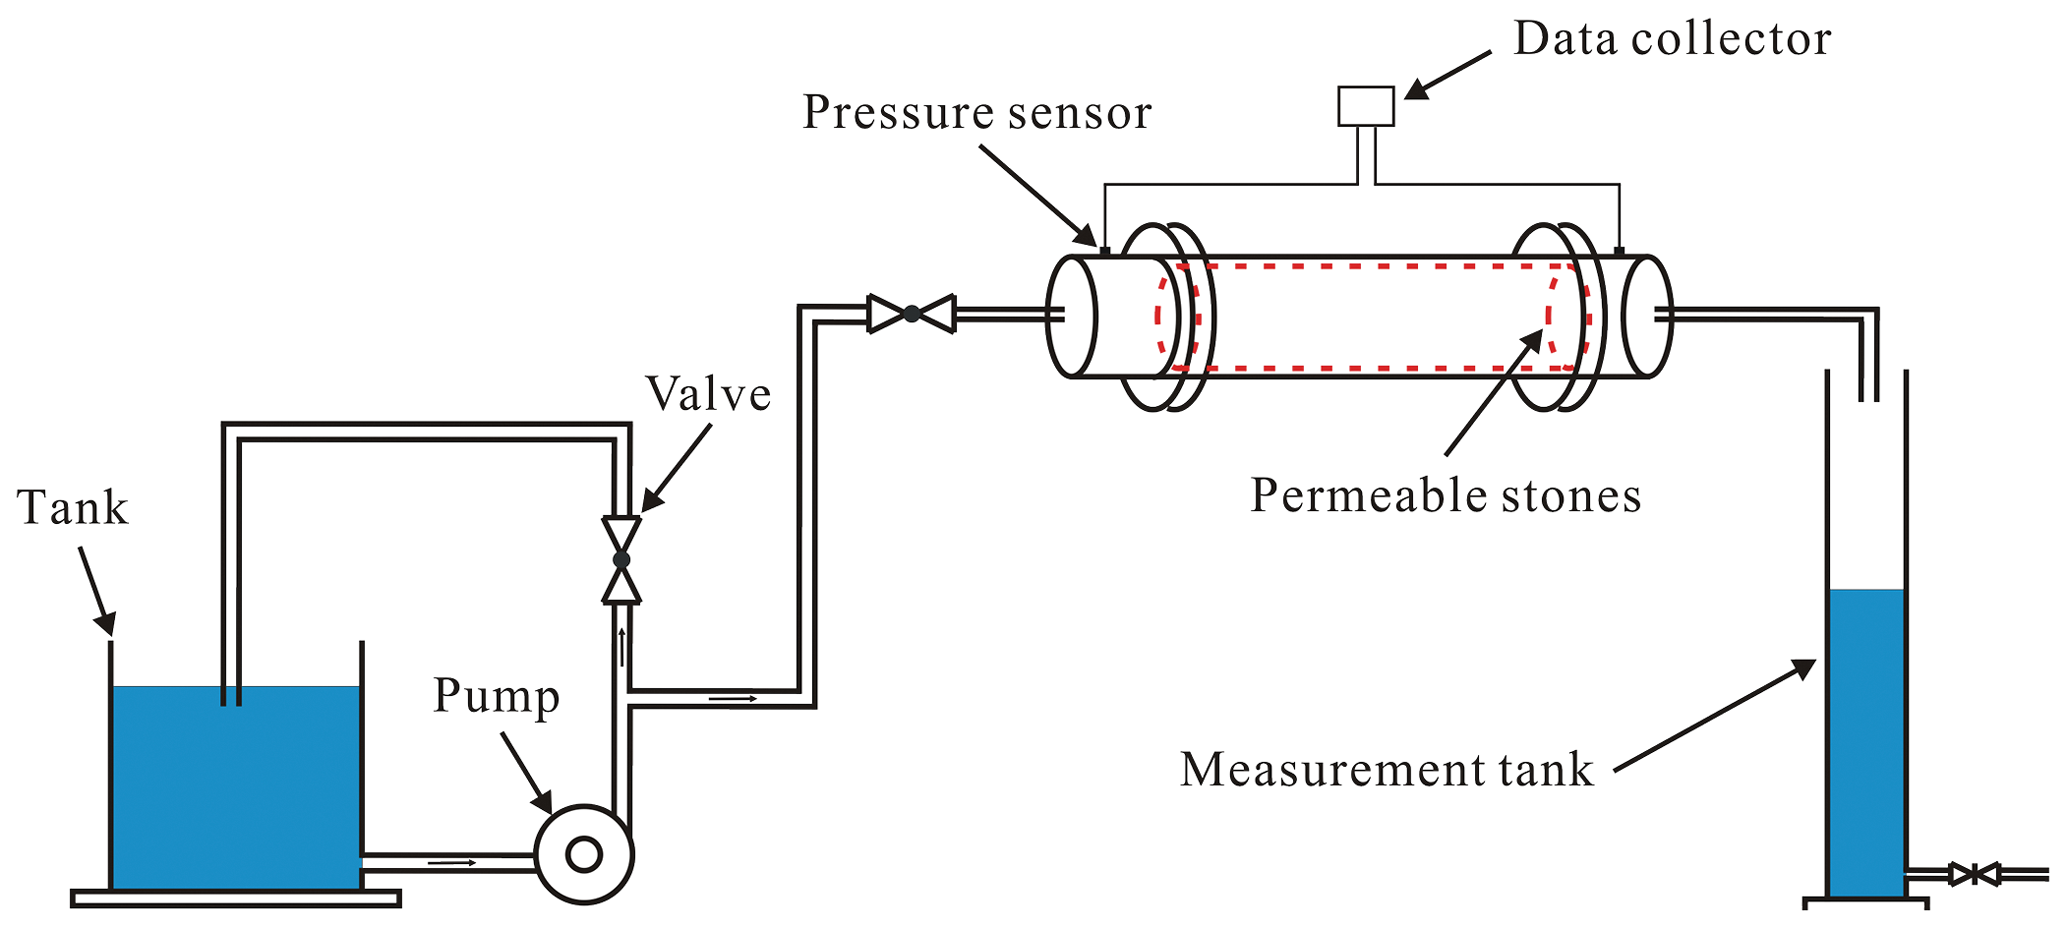
The experimental device is mainly composed of three parts: a water supply device, a seepage experimental device and a measuring device. A schematic diagram of the experimental apparatus is shown in Fig. 1. The water supply device consists of a tank, a centrifugal pump and a flow-regulating valve. The seepage experimental device consists of a permeable stone and a plexiglass column. The measurement device monitors the real-time water temperature and pressure. The water temperature is measured using a thermometer with a precision of measurement of 0.1 ∘C. The water-level fluctuation is measured by a pressure transducer (CY201, Chengdu test LLC, China) in the range of 0–20 kPa with ±0.1 % accuracy to calculate the flow rate. The measuring device consists of a cylindrical tank and a pressure transducer. The sample of permeable stone is 60 mm in length with a circular cross section 51.3 mm in diameter. Two pressure transducers are set at the entrance and exit of the column to measure the pressure drop. To minimize boundary effects, the pressure transducer is placed 30 mm away from either end of the column. This method of pressure measurement is consistent with that used in our previous studies (Z. Li et al., 2017, 2019).
2.2 Experimental materials and procedures
Four different particle sizes of permeable stones are selected to carry out the seepage experiment in this study. It is necessary to provide a brief overview of the preparation process of permeable stone, which is a type of artificially made tight porous medium formed by sand grains and a cementing compound. In the process of preparing permeable stones, sand of a certain particle size and the cementing compound are put in a mold, which is consolidated at room temperature. Permeable stone is widely used in daily life. At present, the most commonly used permeable base materials in urban road construction, “sponge” city construction and ecological restoration research are large-pore cement-stabilized gravel, a large-diameter permeable asphalt mixture, and so on (Guan et al., 2021; Q. Li et al., 2019; Suo et al., 2021; Yu et al., 2021). The discharge capacities of various permeable stones differ. However, increasing the pore space will lead to decreased pavement performance and mechanical strength (Han et al., 2016; Wang et al., 2021). Therefore, many scholars have carried out a lot of research on controlling the proper pore space of permeable stone (Alvarez et al., 2010; Prowell et al., 2002; Xie and Watson, 2004).
We carry out seepage experiments on four kinds of permeable stones with different mesh sizes of 24, 46, 60 and 80, where the mesh size is defined as the number of mesh elements (all with square shapes) in a 1 inch by 1 inch square, which means that a greater mesh size implies a smaller particle size. For instance, we can convert the above four different mesh sizes of permeable stones into corresponding particle sizes of 0.71, 0.36, 0.25 and 0.18 mm, respectively. In respect to pore composition, the pore distribution is concentrated over a narrow pore size range; the proportion of large pores and small pores is very small. The average particle size can reflect the overall permeability of the porous medium. The pore structure of permeable rock will not change during the process performed in the seepage experiment under room temperature. The photographs of the four kinds of permeable stones with different particle sizes are shown in Figs. 2 and 3.
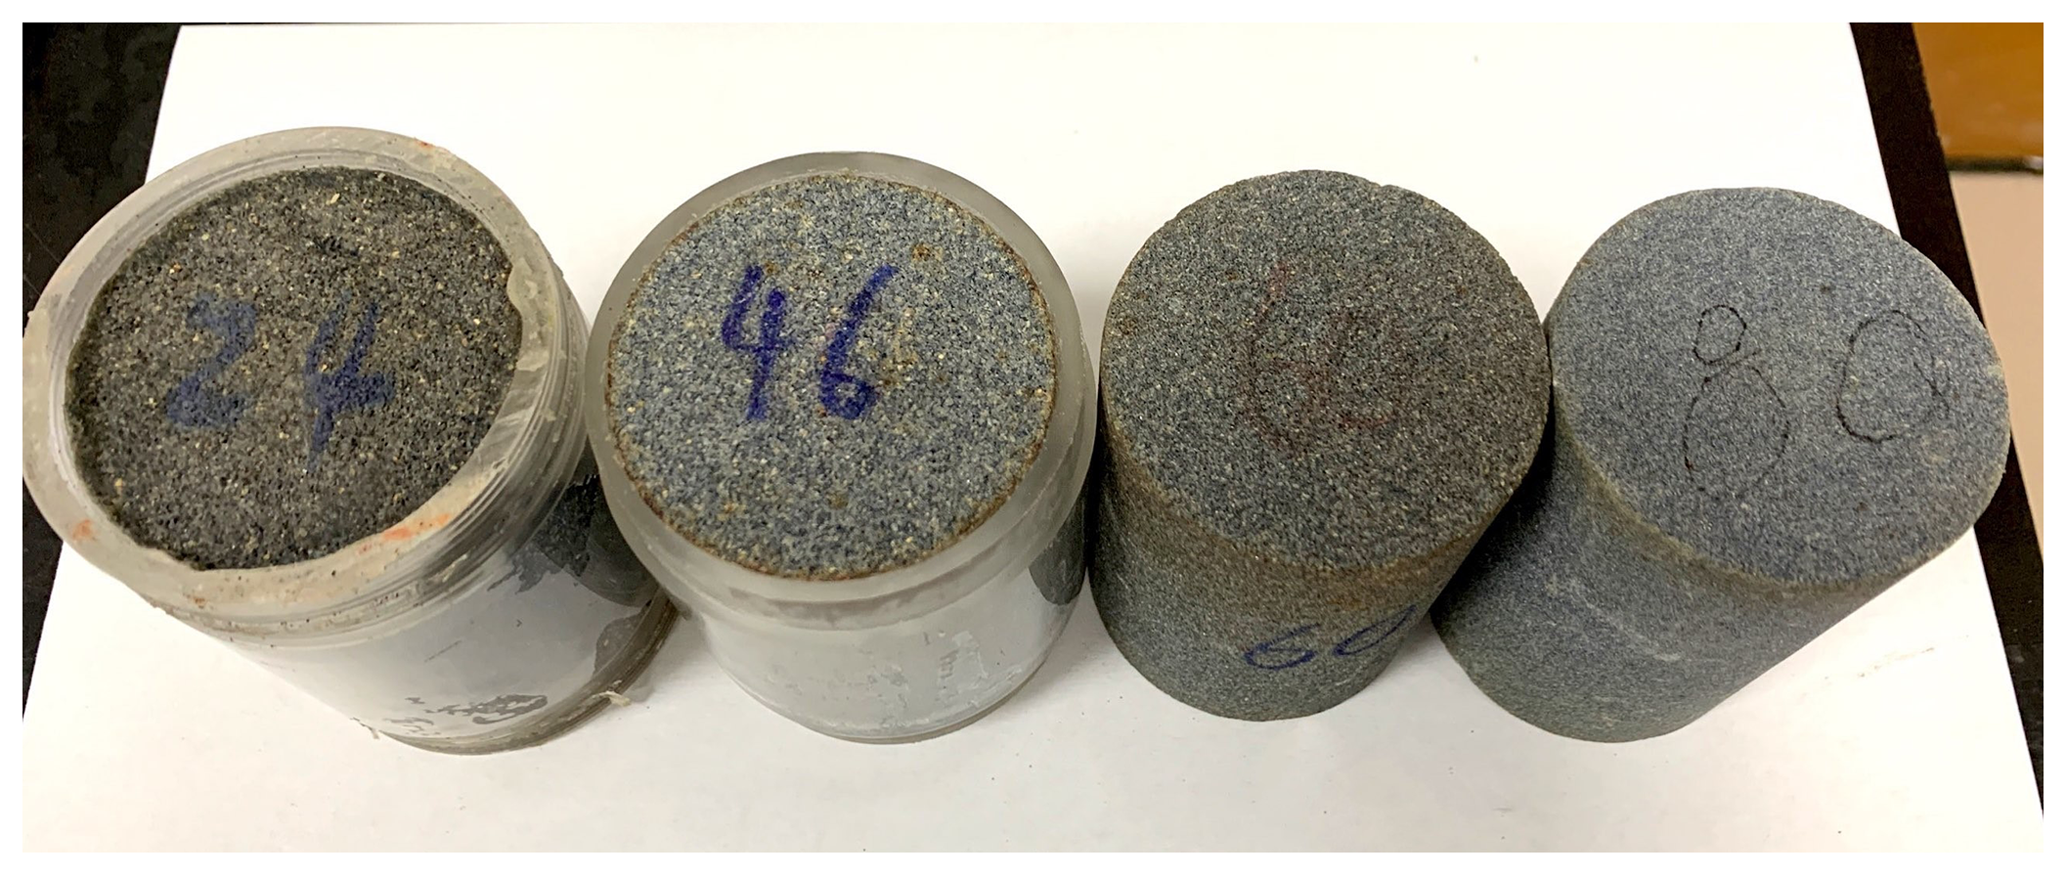
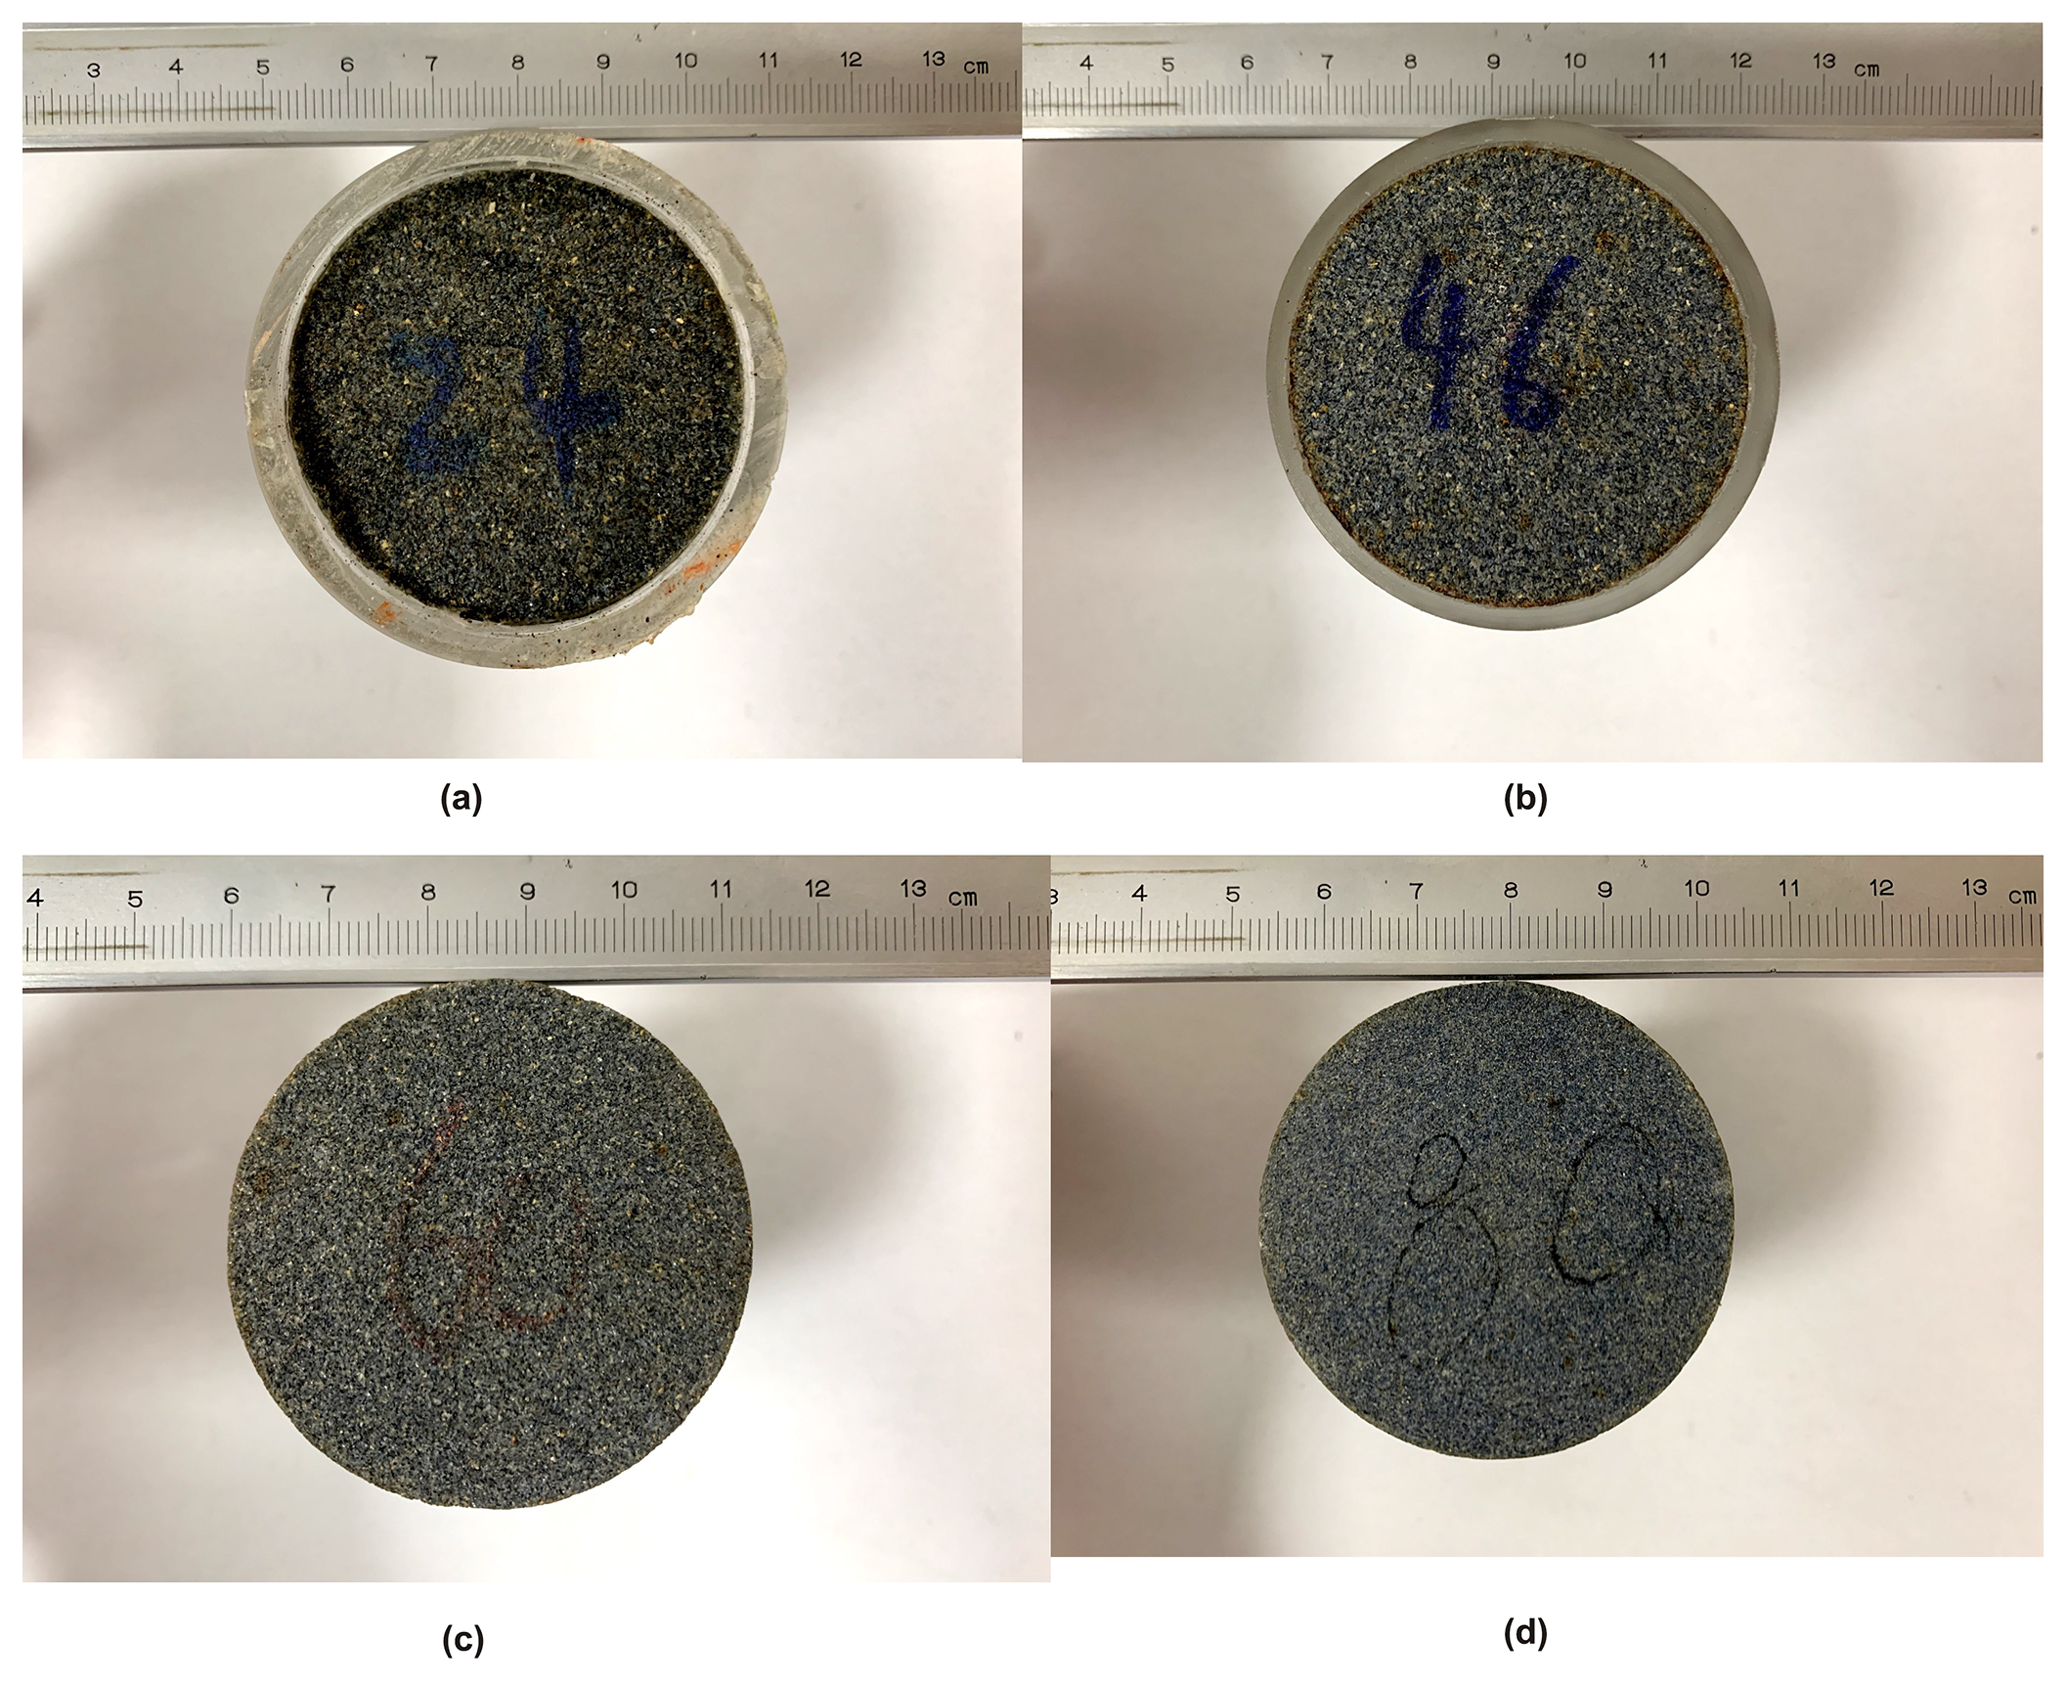
Figure 3Permeable stones with different particle sizes: (a) 24 mesh size or 0.71 mm, (b) 46 mesh size or 0.36 mm, (c) 60 mesh size or 0.25 mm and (d) 80 mesh size or 0.18 mm.
It is worth mentioning that the contact surface between the sample and the plexiglass column is sealed to prevent any preferential flow through the wall of the plexiglass column. After the permeable stone has been inserted into the plexiglass column, both ends are sealed with silicone glue. Water passing through the permeable stone is then collected by a cylindrical tank. Moreover, the ratio of the internal diameter of the column to the particle size of permeable stone is greater than 12, which, according to Beavers et al. (1972), can eliminate any possible wall effect on the seepage. When carrying out the experiment, it usually takes about 2 h to saturate the permeable stone. For each packed sample, more than 25 tests with different constant inlet pressures were conducted under steady-state flow conditions. In addition, for each group of permeable stones, repeated tests under the same experimental conditions were carried out 3–4 times to ensure the accuracy of the results.
3.1 Permeable stone seepage experiment
In this study, the mean particle size corresponds to 50 % by weight. Such a definition of mean particle size may be different from those used in some other studies, such as Fetter (2001), which used 10 % by weight as the mean particle size. The relationship between the specific discharge (q) and the hydraulic gradient (J) of permeable stones is plotted in Fig. 4. The units of specific discharge mentioned in this study are all converted to meters per day (m d−1). Therefore, the best-fitting exercise yields Forchheimer numbers with orders of magnitude of about −4. In addition, the critical Forchheimer numbers proposed by Zeng and Grigg (2006) and Javadi et al. (2014) are empirical. In fact, the transition between Darcy and non-Darcy is successional over a certain range of Forchheimer numbers. The non-Darcy flow criterion applicable to different pore media was established by conducting seepage resistance experiments in homogeneous and heterogeneous porous media in our previous study (Z. Li et al., 2017, 2019), and is consistent with the results of Zeng and Grigg (2006). Generally speaking, q−J and q−K curves are the most commonly used methods of analyzing the flow regime when conducting seepage resistance experiments in porous media. However, the nonlinear characteristics of the q−J curve are not obvious due to the relatively small velocity range used in the experiments. The traditional hydraulic conductivity is the ratio of the specific discharge to the hydraulic gradient (); this is a constant if Darcy's law is applicable, in which case it is denoted as KD (Z. Li et al., 2019). In fact, the ratio is no longer a constant for the problems discussed in this study. In a word, the q−K curve can be used to observe the transition of the flow state more intuitively.
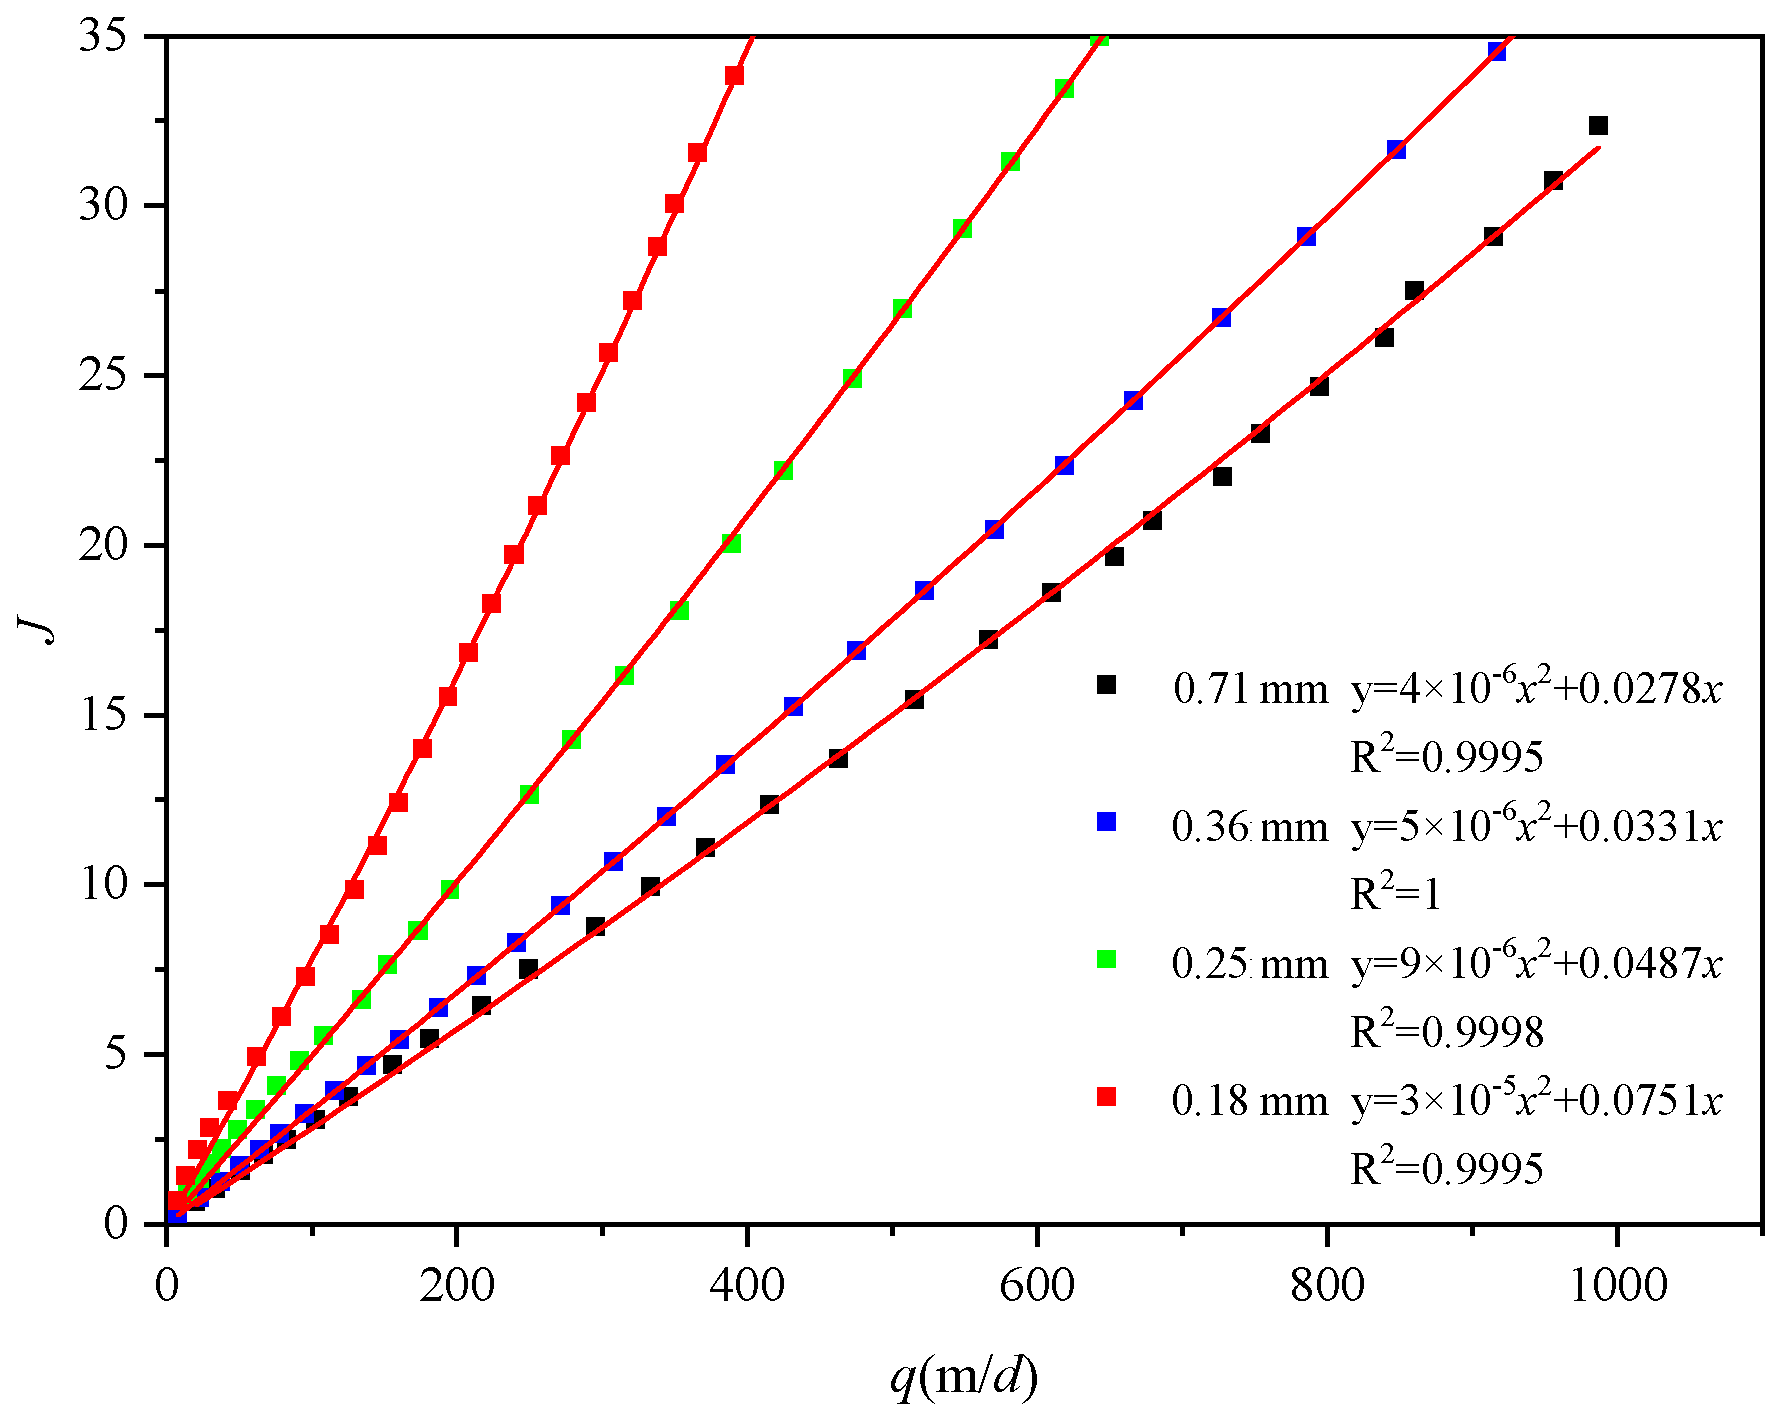
Figure 4 shows that when q is relatively constant, a larger mesh size (which means a smaller particle size) will lead to a larger J. These results are consistent with our previous studies (Huang et al., 2013; Z. Li et al., 2017, 2019). However, the nonlinear characteristics of the q−J curve are not obvious due to the relatively small velocity range used in the experiments. Nevertheless, the best-fitting results obtained using the Forchheimer equation are satisfactory. To analyze the influence of pore size on the seepage flow regimes, we obtain the relationship between q and the “pseudo” hydraulic conductivity (K, which is computed using ) for the four permeable stones with different particle sizes, as shown in Fig. 5. We should point out that the pseudo hydraulic conductivity term discussed here for non-Darcy flow is usually not a constant, so it is different from the hydraulic conductivity term used in Darcy's law, which is a constant. It is obvious that the hydraulic conductivity is not a constant with increasing specific discharge, which is why it is called the “pseudo” hydraulic conductivity (Z. Li et al., 2019).
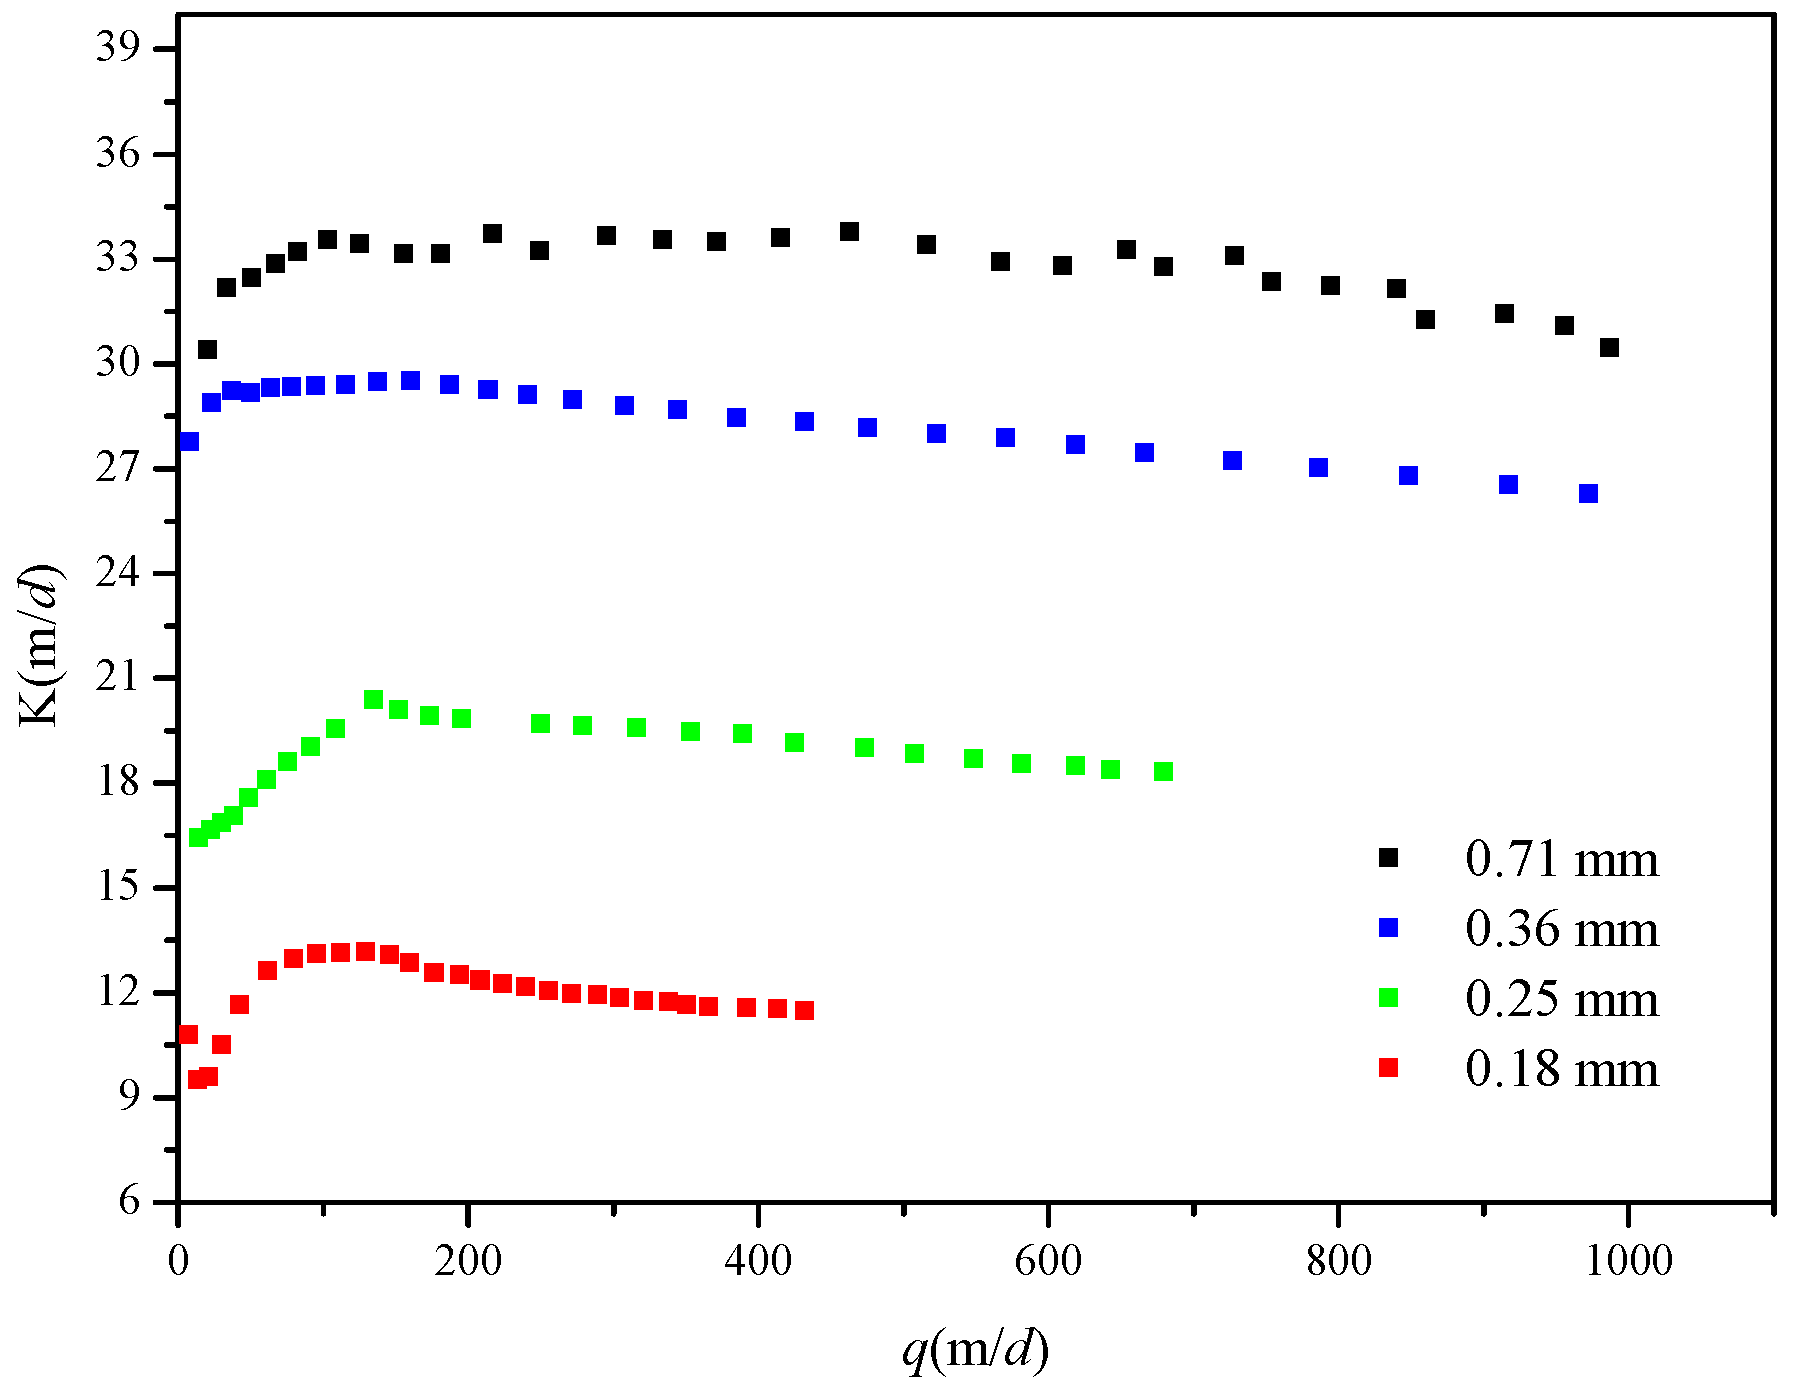
We can divide the q−K curve into two segments. For the first segment, K increases with increasing q, which is denoted pre-Darcy flow. For the second segment, after q increases to a certain value, K begins to decrease with q, which is called post-Darcy flow. In fact, Izbash (1931) presented the equation as , where M and m are coefficients determined by the fluid flow and properties of the porous medium. When m=1, the Izbash equation reduces to the Darcy law; when m > 1, the Izbash equation corresponds to pre-Darcy flow; and when m < 1, the Izbash equation refers to post-Darcy flow (Dejam et al., 2017; Soni et al., 1978). Also, Dejam et al. (2017) carried out a more detailed study of issues related to the pre-Darcy and post-Darcy flows. The influence of pre-Darcy flow on the pressure diffusion for homogeneous porous media was studied in terms of the nonlinear exponent and the threshold pressure gradient. When the hydraulic gradient is small (and q is small as well), a great portion of the water is bound to (or becomes immobile on) the surfaces of solids due to the solid–liquid interfacial force. Only a small fraction of the water is mobile and free to flow through the pores. In addition, another justification for pre-Darcy behavior may an effect of a stream potential that generates small countercurrents along pore walls in a direction against the main flow (Bear, 1975; Scheidegger, 1958). Swartzendruber (1962b) stated that surface forces arise at the solid–fluid interface due to strong negative charges on clay particle surfaces, and the dipolar nature of water molecules causes the pressure gradient response to be nonlinear, leading to pre-Darcy flow (Swartzendruber, 1962a). As the hydraulic gradient increases (and q increases as well), the initial threshold for mobilizing the previously immobile water near the solid–liquid surface is overcome and more water participates in the flow. For this reason, the pseudo hydraulic conductivity increases with increasing hydraulic gradient and the specific discharge in the first segment. When the specific discharge increases to the critical specific discharge (qc), the pseudo hydraulic conductivity is maximized. According to , based on Eq. (2), we find that the pseudo hydraulic conductivity begins to decrease as the specific discharge continues to increase. Besides, the critical specific discharge corresponding to the transition of flow regime (from pre-Darcy to post-Darcy) increases with increasing particle size (or decreasing mesh size).
3.2 Mercury injection experiment
The particle size, grain size distribution and degree of sorting are the main factors that determine the size and shape of pores. The shape of the pores determines the tortuosity and distribution of flow paths, which are related to the viscous and inertial flow resistances. It was generally accepted in previous studies that the pore sizes of porous media have an impact on the seepage law (Maalal et al., 2021; Zhou et al., 2019). However, the structures of natural porous media are very complex, and it is difficult to quantify the effects of the arrangement of the particles on the seepage law. The characteristics of the pore size distribution contain critical information for quantifying the flow regimes. Mercury intrusion porosimetry and the nitrogen adsorption isotherm are two commonly used methods to characterize the pore sizes and their distribution (Rijfkogel et al., 2019). Other techniques can also be used to derive the pore size distribution, such as small-angle neutron and X-ray scattering measurements, CT images and nuclear magnetic resonance (Anovitz and Cole, 2015; Hall et al., 1986; Kate and Gokhale, 2006; Lindquist et al., 2000). In this study, we will use the mercury injection technique to measure the pore size distributions of the four permeable stones with different particle sizes and then use this information to describe the flow regimes.
To quantitatively study the pore size and pore throat distribution, we need to envisage a physically based conceptual model to describe the pore structures of permeable stones. The most commonly used model is the so-called capillary model (Pittman, 1992; Rezaee et al., 2012; Schmitt et al., 2013), which approximates the connected pores as many parallel capillaries. Capillary forces are generated at the phase interface due to the surface tension between the solid and liquid phases when liquid flows in a capillary. The capillary force is directed toward the concave liquid level. It was shown by Washburn (1921) that
where Pc is the capillary force, σ is the solid–liquid interfacial tension, θ is the wet angle between the liquid and the solid surface, and r is the radius of curvature in the capillary.
Since mercury is a nonwetting phase to solids, to get mercury into the pores of the permeable stone, an external force (or displacement pressure) must be applied to overcome the capillary force. When a greater pressure is applied, the mercury can enter smaller pores. When a certain pressure is applied, the injection pressure is equivalent to the capillary pressure in the corresponding pore. Therefore, we can calculate the corresponding capillary radius according to Eq. (4), where the volume of mercury injected is the pore volume.
By continuously increasing the injection pressure, one can obtain the curve of injection pressure versus the volume of injected mercury, from which one can also obtain the pore-throat distribution curve and the capillary pressure curve. Based on the amount of mercury injected at different injection pressures, the relation between the injection pressure and the injection saturation can be derived, and is shown in Fig. 6.
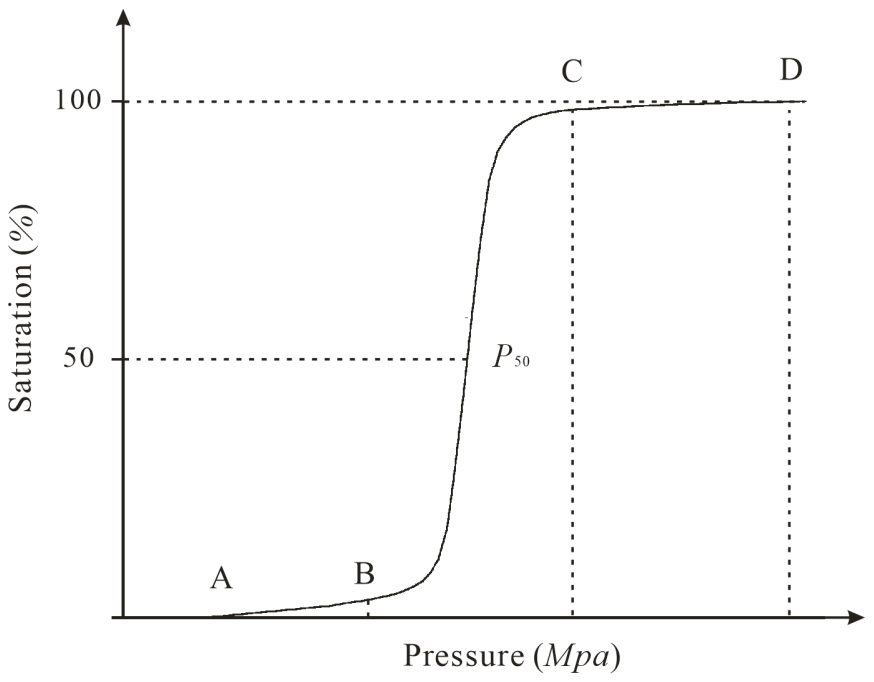
Figure 6Schematic diagram of the change in pressure with the saturation: the initial stage (A–B), the intermediate mercury entry stage (B–C) and the end stage (C–D) are shown.
Figure 6 shows that the mercury injection curve can be divided into three stages. Firstly, during the initial stage (A–B), which has a very mild slope, the intake pressure is very small and the intake saturation is also very low. With increasing injection pressure, the intake saturation slowly increases. Secondly, during the intermediate mercury entry stage (B–C), which has a steep slope, a small pressure change will lead to a significant saturation change. This means that the pores are relatively uniform and the differences in pore size are small. It is well known that for mercury injection experiments, as the injection pressure increases, the injection saturation will gradually increase, and eventually all the pores will be filled with mercury. As can be seen from Fig. 7, with the continuous injection of mercury, the pressures in permeable stones with different particle sizes vary with the saturation, which is reflected in the different pressures PB and PC observed at different stages. However, the reason that different pressures are observed is the different pore size distributions of the permeable stones. Therefore, the pressure ratio of B to C () can be used as one of the criteria to characterize the pore-size heterogeneity in porous media. Also, when the saturation reaches 50 %, the corresponding pressure value (P50) reflects the characteristics of the mean pore size; a larger P50 leads to a larger mean pore size. Finally, during the end stage (C–D), which has a very mild slope as well, the amount of mercury does not increase considerably when the injection pressure increases. This indicates that nearly all the pores are essentially filled with mercury, so the mercury injection experiment is complete. After completing the mercury injection experiments, we obtain the mercury injection curves of the four permeable stones with different particle sizes, as shown in Fig. 7.
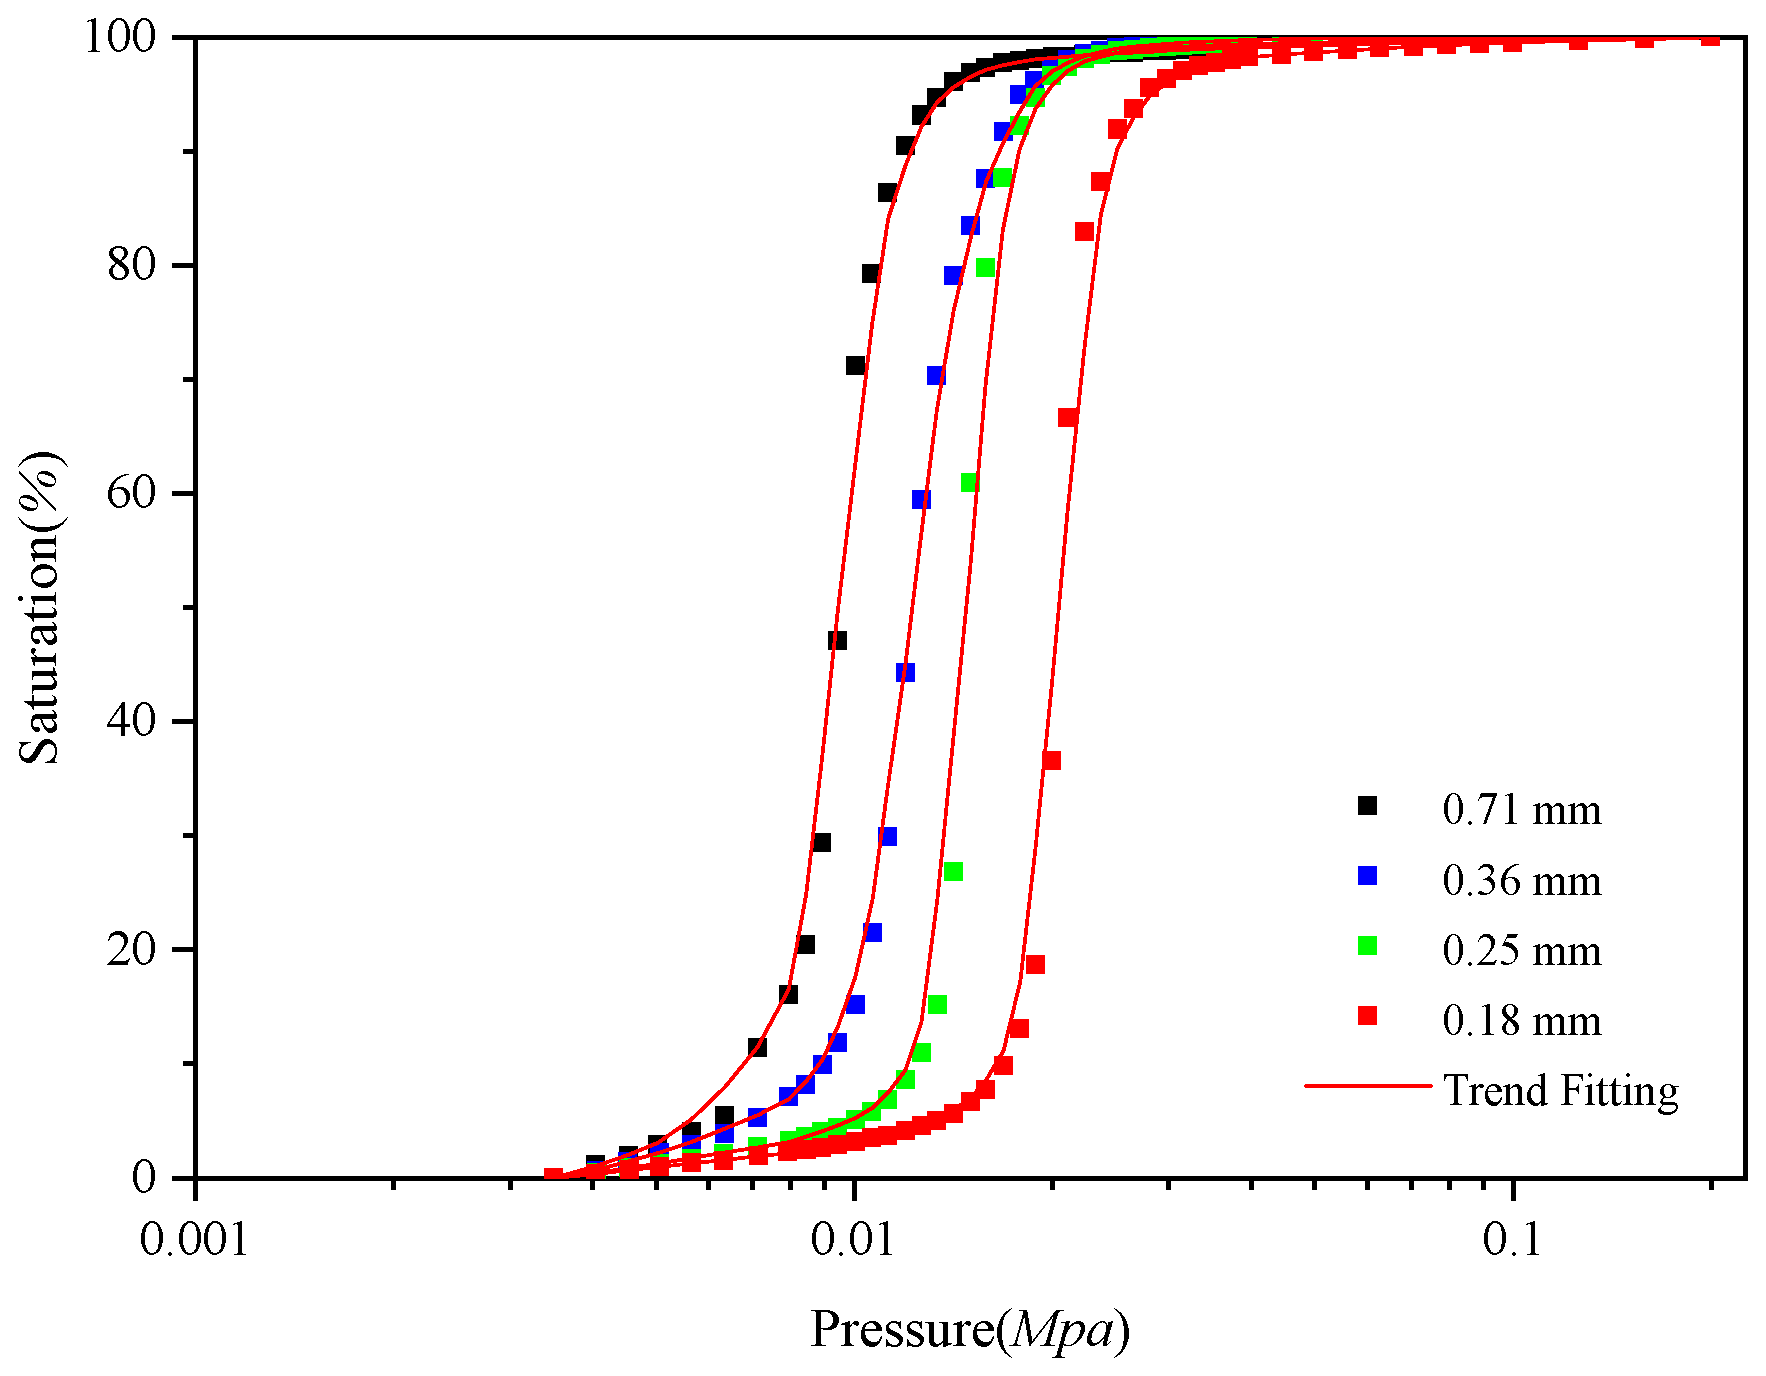
Figure 7Variation of the pressure with the saturation for four permeable stones with different particle sizes.
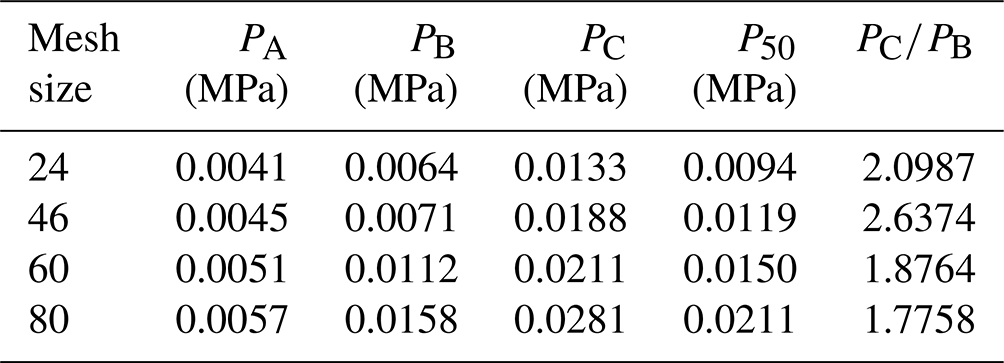
We can make a number of interesting observations based on Fig. 7. Firstly, the pressure at the starting point (when the saturation begins to increase), denoted as PA, increases as the mean particle size decreases. This means that the maximum pore size in permeable stone decreases with a decrease in the mean particle size. Secondly, the mercury injection curves of the four permeable stones all include steep intermediate stages, indicating that their pore size distributions are all relatively uniform. The corresponding pressure values at points B and C increase as the mean particle size decreases. Moreover, the pressure ratio corresponding to points B and C () also decreases with a decrease in particle size, suggesting that the pore size distribution becomes even more uniform with decreasing particle size. Thirdly, the intermediate mercury entry stage gradually shifts to the right with decreasing particle size. When the saturation reaches 50 %, the corresponding pressure (the median pressure) decreases with an increase in the mean particle size. Fourthly, the mercury injection curves of these four permeable stones with different particle sizes all approach 100 % saturation with very mild slopes, indicating that there are few small pores in the permeable stones. We have extracted the key pressure characteristic values from the mercury injection experiment of Fig. 7, and the results are listed in Table 1.
Table 1Pressure characteristic values of four permeable stones with different particle sizes.
To observe the pore size distributions of the four permeable stones with different particle sizes in more detail, we can calculate the percentages of pores with particular sizes in the permeable stones according to the mercury injection curves, as shown in Figs. 8–11.
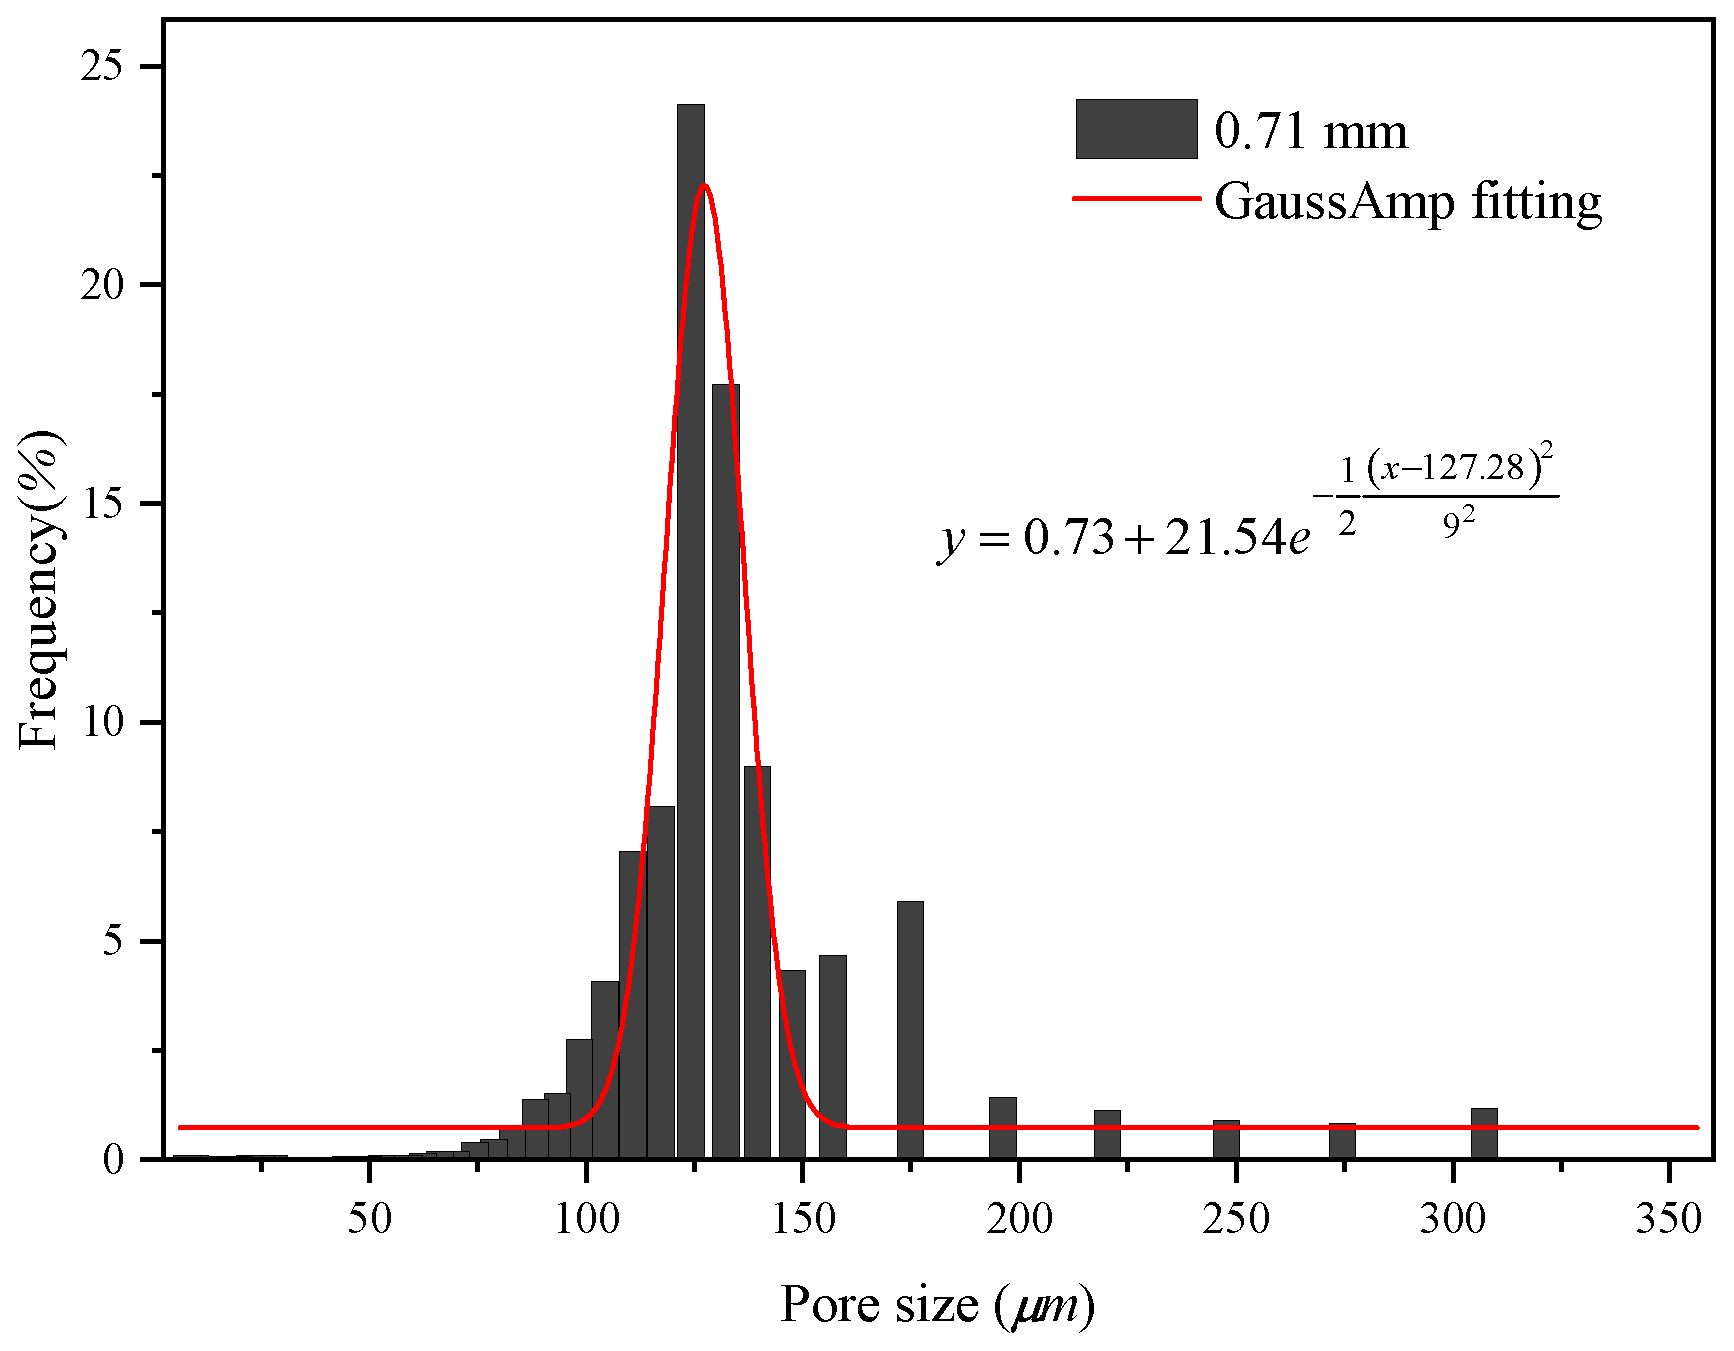
Figure 8Histogram of the pore size distribution of the permeable stone with a particle diameter of 0.71 mm.

Figure 9Histogram of the pore size distribution of the permeable stone with a particle diameter of 0.36 mm.
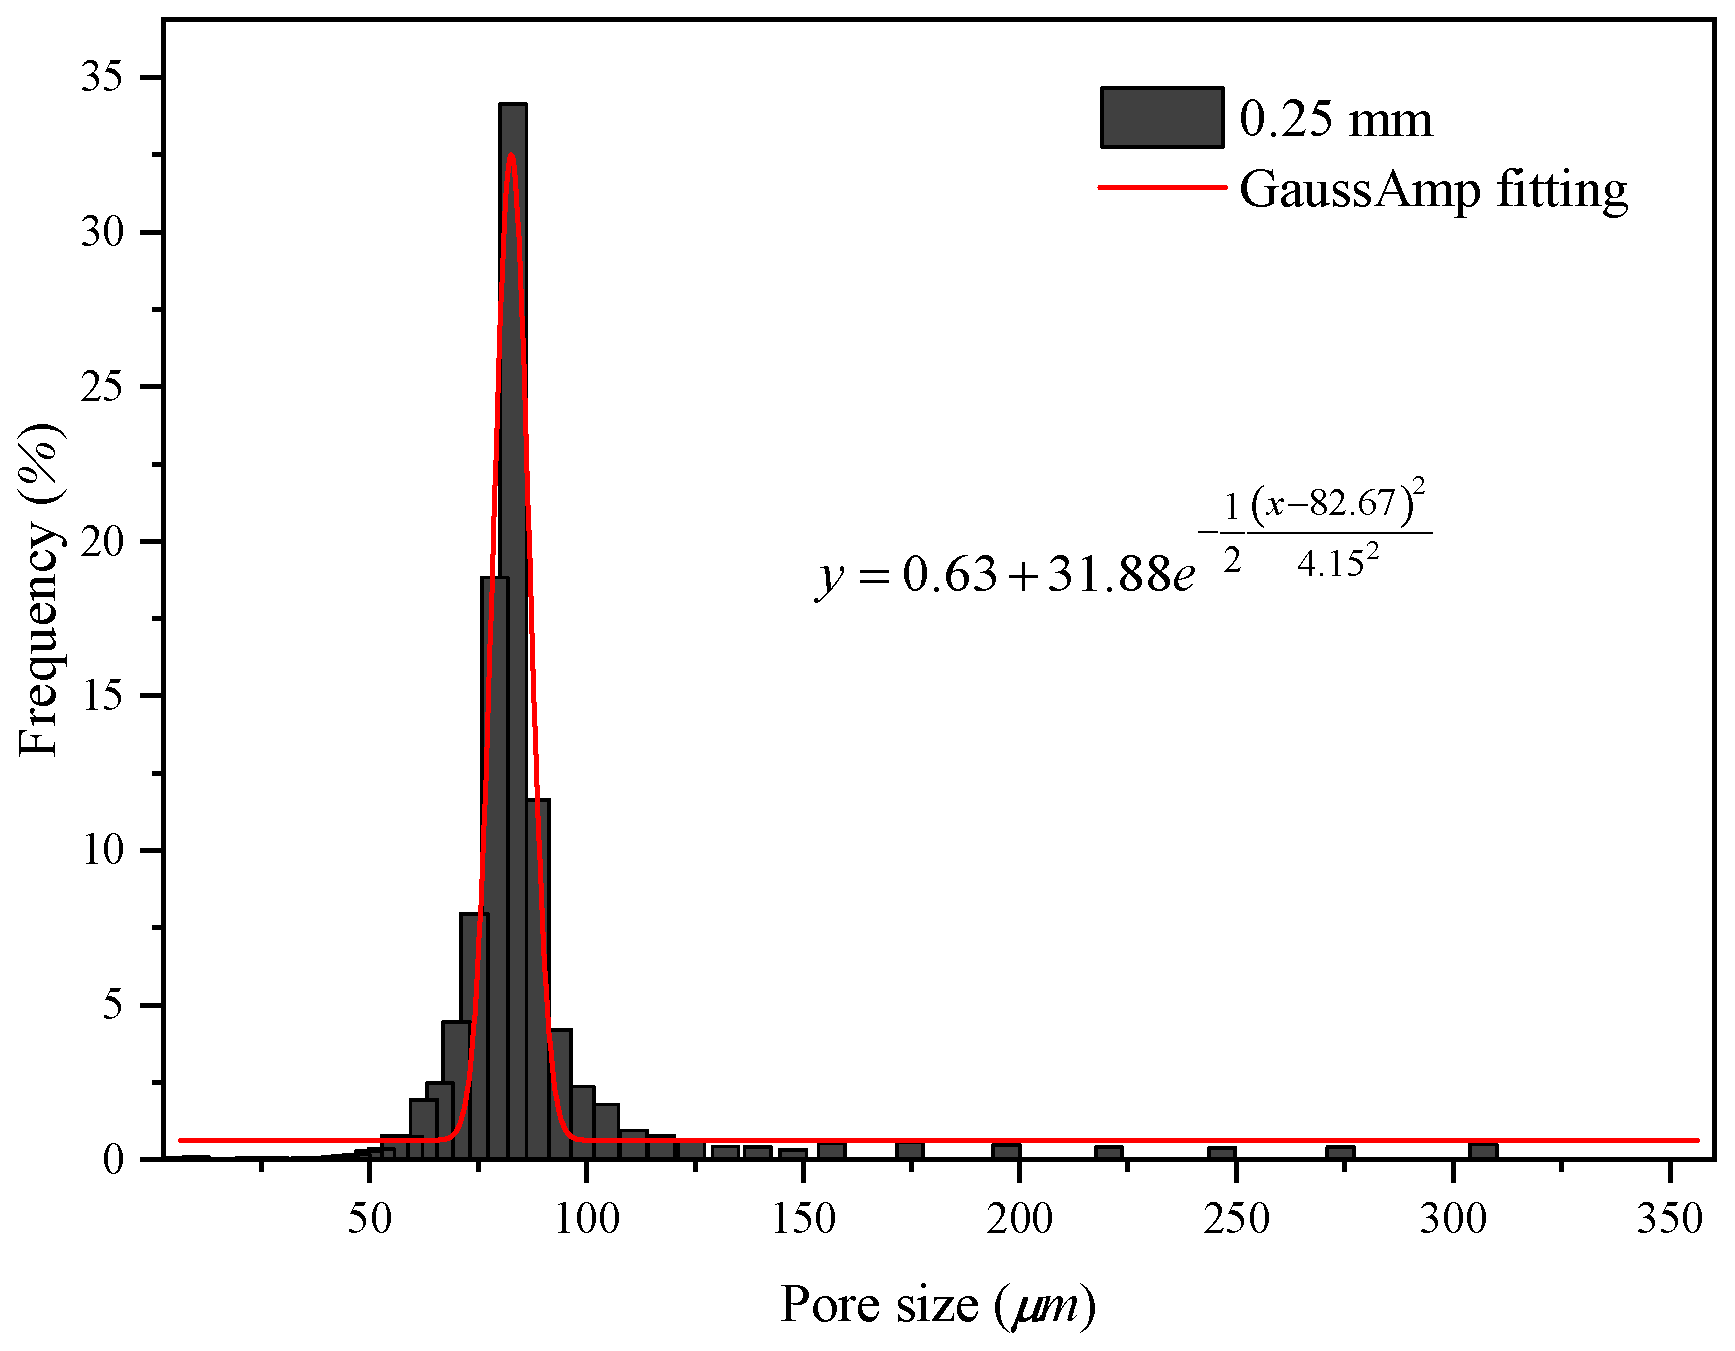
Figure 10Histogram of the pore size distribution of the permeable stone with a particle diameter of 0.25 mm.

Figure 11Histogram of the pore size distribution of the permeable stone with a particle diameter of 0.18 mm.
From Figs. 8 to 11, we find that the pore sizes of the four permeable stones are uniform and fall within narrow ranges. The pore size distributions for the four different particle sizes show a skewed normal distribution. Also, the most common pore size (the peaks of the curves, see Figs. 8–11) of permeable stones with different particle sizes are different: 124, 99, 83 and 59 µm, respectively. The Gaussian function is widely used to characterize the pore system and classify petrophysical rock (Harlan et al., 1995; Jeon et al., 2014; Xu and Torres-Verdín, 2013). The general form of the Gaussian function is shown below:
where H is the height of the peak of the mercury injection curve, xc is the abscissa value corresponding to the peak of the curve (the pore size) and w is the standard variance, which represents the width of the curve. To characterize the pore structure distributions of the four different permeable stones, we best fit the Gaussian curves of the pore distributions of the four permeable stones with different particle sizes. The best-fit parameters are shown in Table 2. We can make several interesting observations about Table 2. Firstly, the expected value (xc) decreases with decreasing particle size of the permeable stone. Secondly, the standard variance (w) for the 0.18 mm permeable stone is the smallest, indicating that the pore size distribution is more concentrated (or relatively homogeneous). For comparison, the pore size distribution of the 0.36 mm permeable stone is the widest, with the greatest variance. Finally, different values of H represent different pore size proportions, among which the highest proportion is 34.04 %. It is desirable to establish a correlation between the parameters used in the pore size distribution of Eq. (5) and the two Forchheimer coefficients A and B. This objective may be achieved using high-resolution pore-scale fluid mechanics simulations, which are beyond the scope of this study. Further research is needed to address this issue in the future.
Table 2Gaussian function characteristic values for four permeable stones with different particle sizes.

The pore size distribution falls within an ever-narrower range as the mesh size becomes larger. Moreover, the cumulative percentage frequency curves of the pore size distributions with different particle sizes are exhibited in Fig. 12, and the results are shown in Table 3.
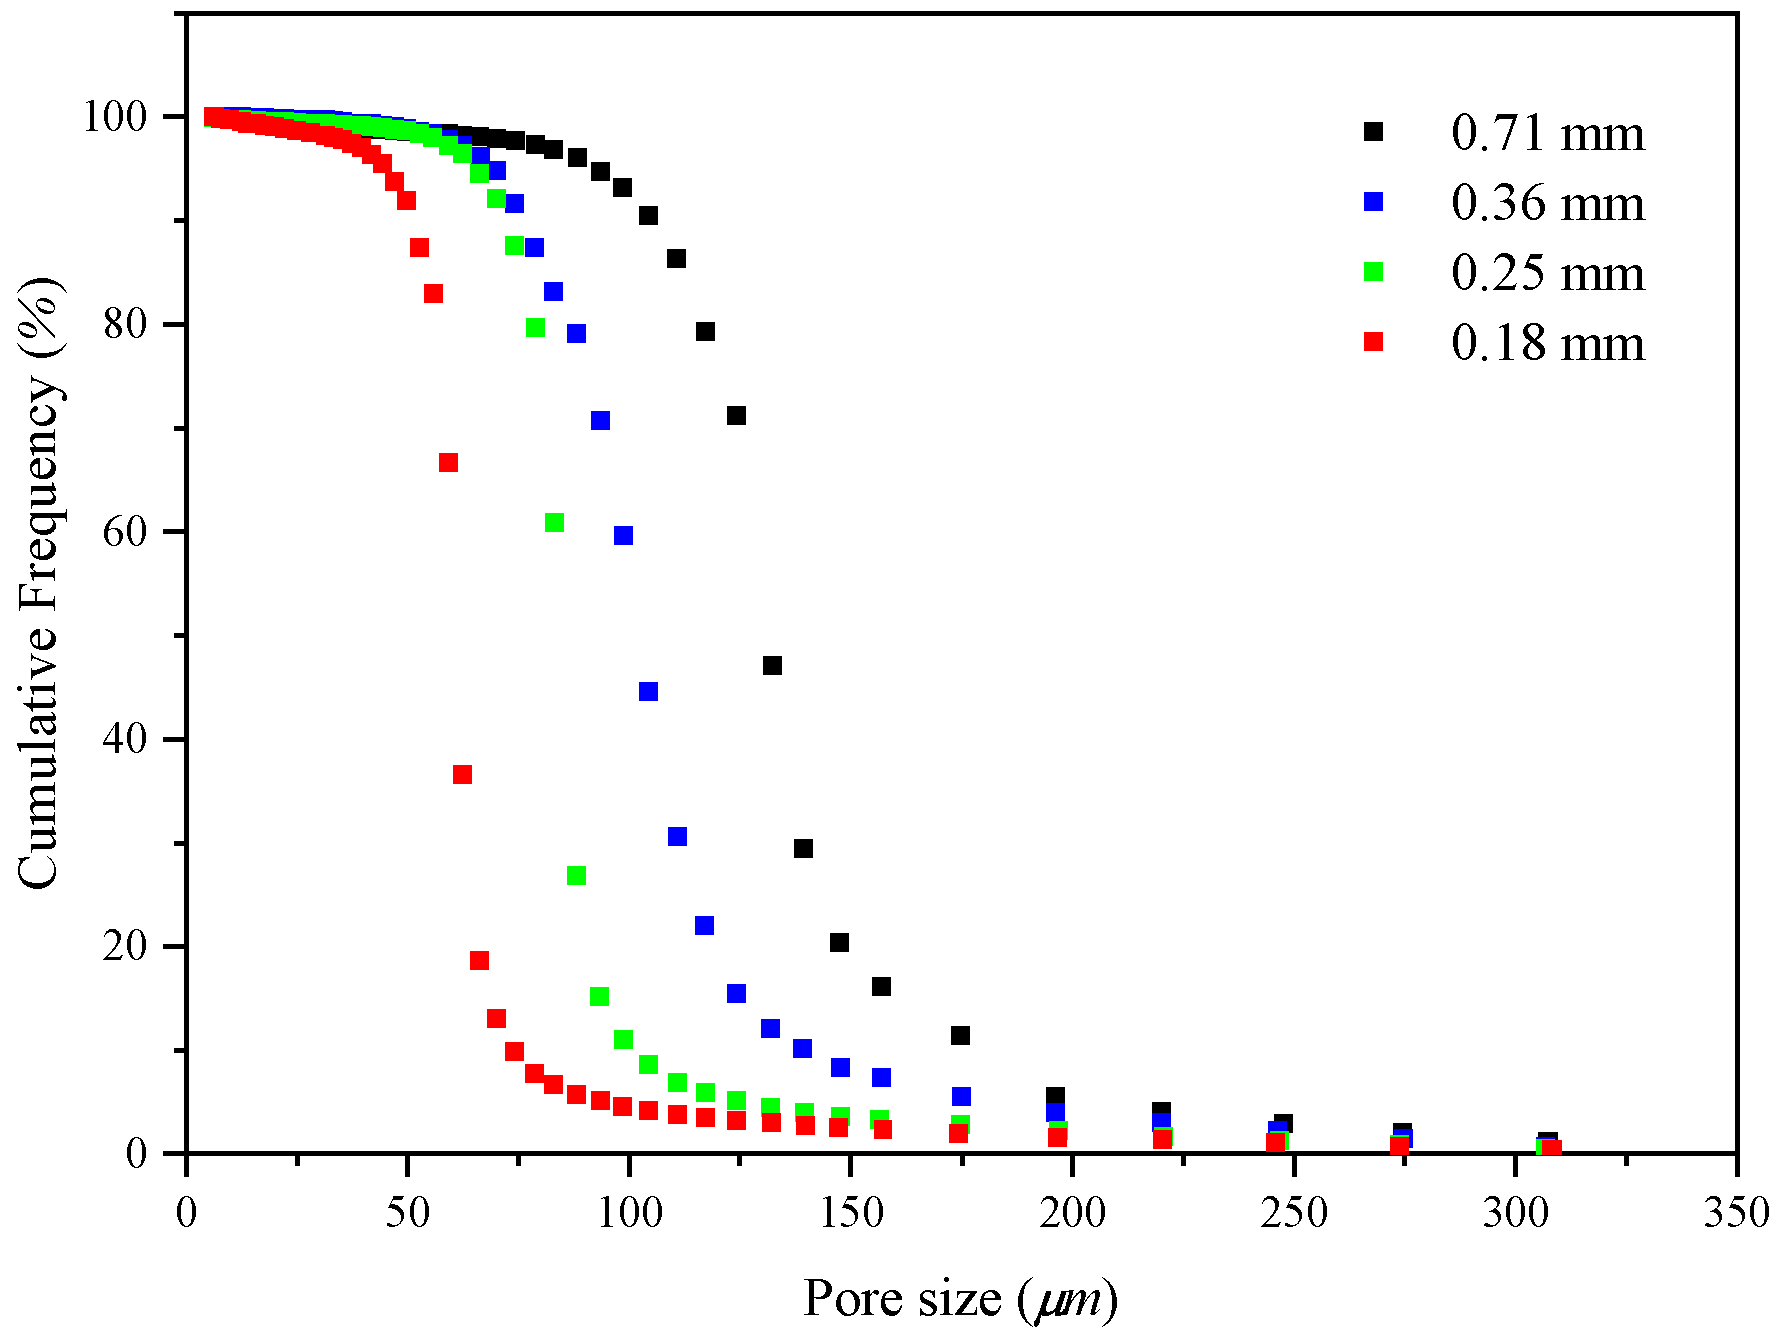
Table 3Pore size characteristic values for four permeable stones with different particle sizes.
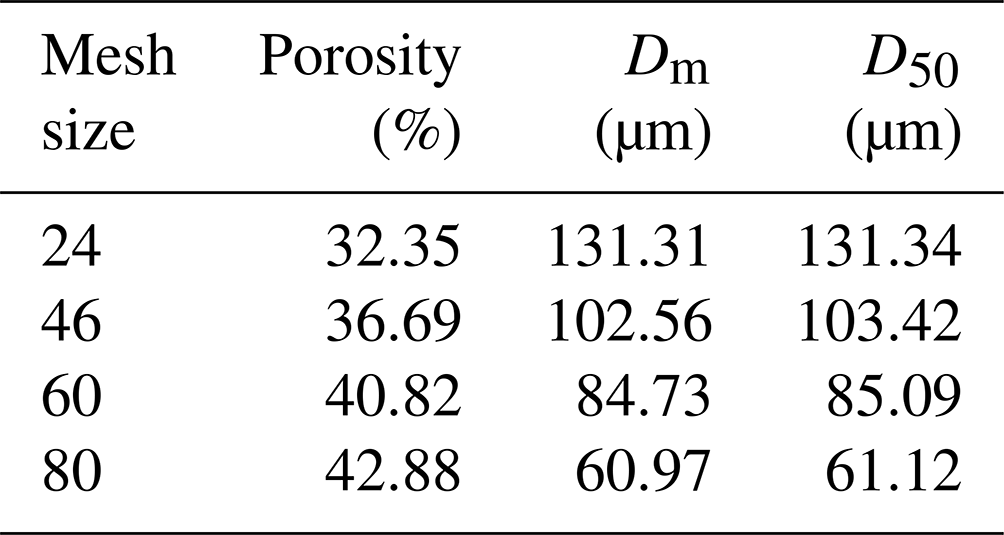
Note: Dm is the mean pore diameter; D50 is the pore diameter corresponding to the median pressure P50.
Figure 12 shows that D50 (the pore size corresponding to the median pressure P50) increases with increasing permeable stone particle size; the mean pore diameter (Dm) also increases. In general, the pore size corresponding to the median pressure (denoted as D50) may be slightly different from the mean pore diameter (Dm), which has been defined in different ways by various investigators when analyzing pore size distributions (Hea and Zhangb, 2015; Min et al., 2007; Zhihong et al., 2000). As D50 is easily identifiable in the mercury injection experiments, it is used in this study as a representative of the mean pore diameter (Dm) of the permeable stone. Also, the seepage law of permeable stone is closely related to the pore size; a smaller average pore size will result in a larger hydraulic gradient under the condition of the same specific discharge (see Fig. 4). Pore size characteristic values for different particle sizes are listed in Table 3. We find that the porosity decreases as the particle size increases, while the mean pore diameter increases. The mean pore size can reflect the influences of the particle diameter, sorting degree and arrangement mode of the porous medium on seepage parameters.
3.3 Analysis of the factors influencing the Forchheimer equation coefficients
3.3.1 Influence of the particle size on equation coefficients
The analysis of non-Darcy coefficients has always been of interest to many researchers working in different disciplines of porous media flow (Moutsopoulos et al., 2009; Sedghi-Asl et al., 2014; Shi et al., 2020). Different scholars have obtained a large amount of data through different experimental and simulation methods. They have performed quadratic fitting of the specific discharge and hydraulic gradient curves and developed numerous expressions for the Forchheimer coefficients. We obtained the coefficients of different fitting equations, which are shown in Table 4.
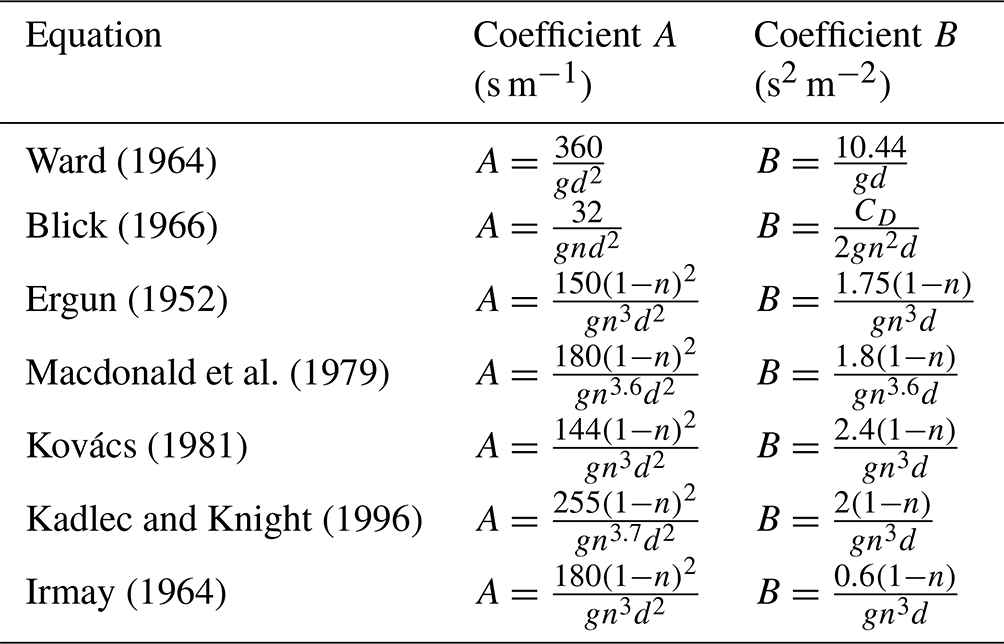
Sidiropoulou et al. (2007) focused on the Forchheimer coefficients of porous media and evaluated the Forchheimer equation above. The validity of these equations has been verified using different experimental data. In addition, the root mean square error (RMSE) was used as a criterion to quantitatively evaluate the coefficients (Moutsopoulos et al., 2009). The different forms of the Forchheimer coefficients described in Table 4 are based on different assumptions and simplifications of the pore structure. Consequently, these coefficients are applicable under specific conditions with different degrees of accuracy.
According to Eq. (2), the hydraulic gradient (J) is composed of a viscous-force-related component (Jn) and an inertial-force-related component (Jr):
For a detailed discussion of this matter, one can refer to previous studies (Huang, 2012).
We can see from Eq. (6) that Jn is inversely proportional to the square of the particle size while Jr is inversely proportional to the particle size when the specific discharge remains the same. Both Jn and Jr are closely related to the specific surface area and size of the pores. As can be seen from the above analysis, the particle size is an important factor affecting the Forchheimer coefficients. Huang et al. (2013) carried out seepage experiments in columns with different particle sizes, including 3, 5, 8 and 10 mm acrylic spheres. Accordingly, the coefficients A and B can be written as follows:
where α and β are constants related to the shape, sorting and arrangement of the particles, and the specific derivation process is detailed in a previous study (Huang, 2012). Experimental results showed that the coefficient A was inversely proportional to the particle diameter square (d2) and that coefficient B was inversely proportional to the particle size (d) (Huang et al., 2013).
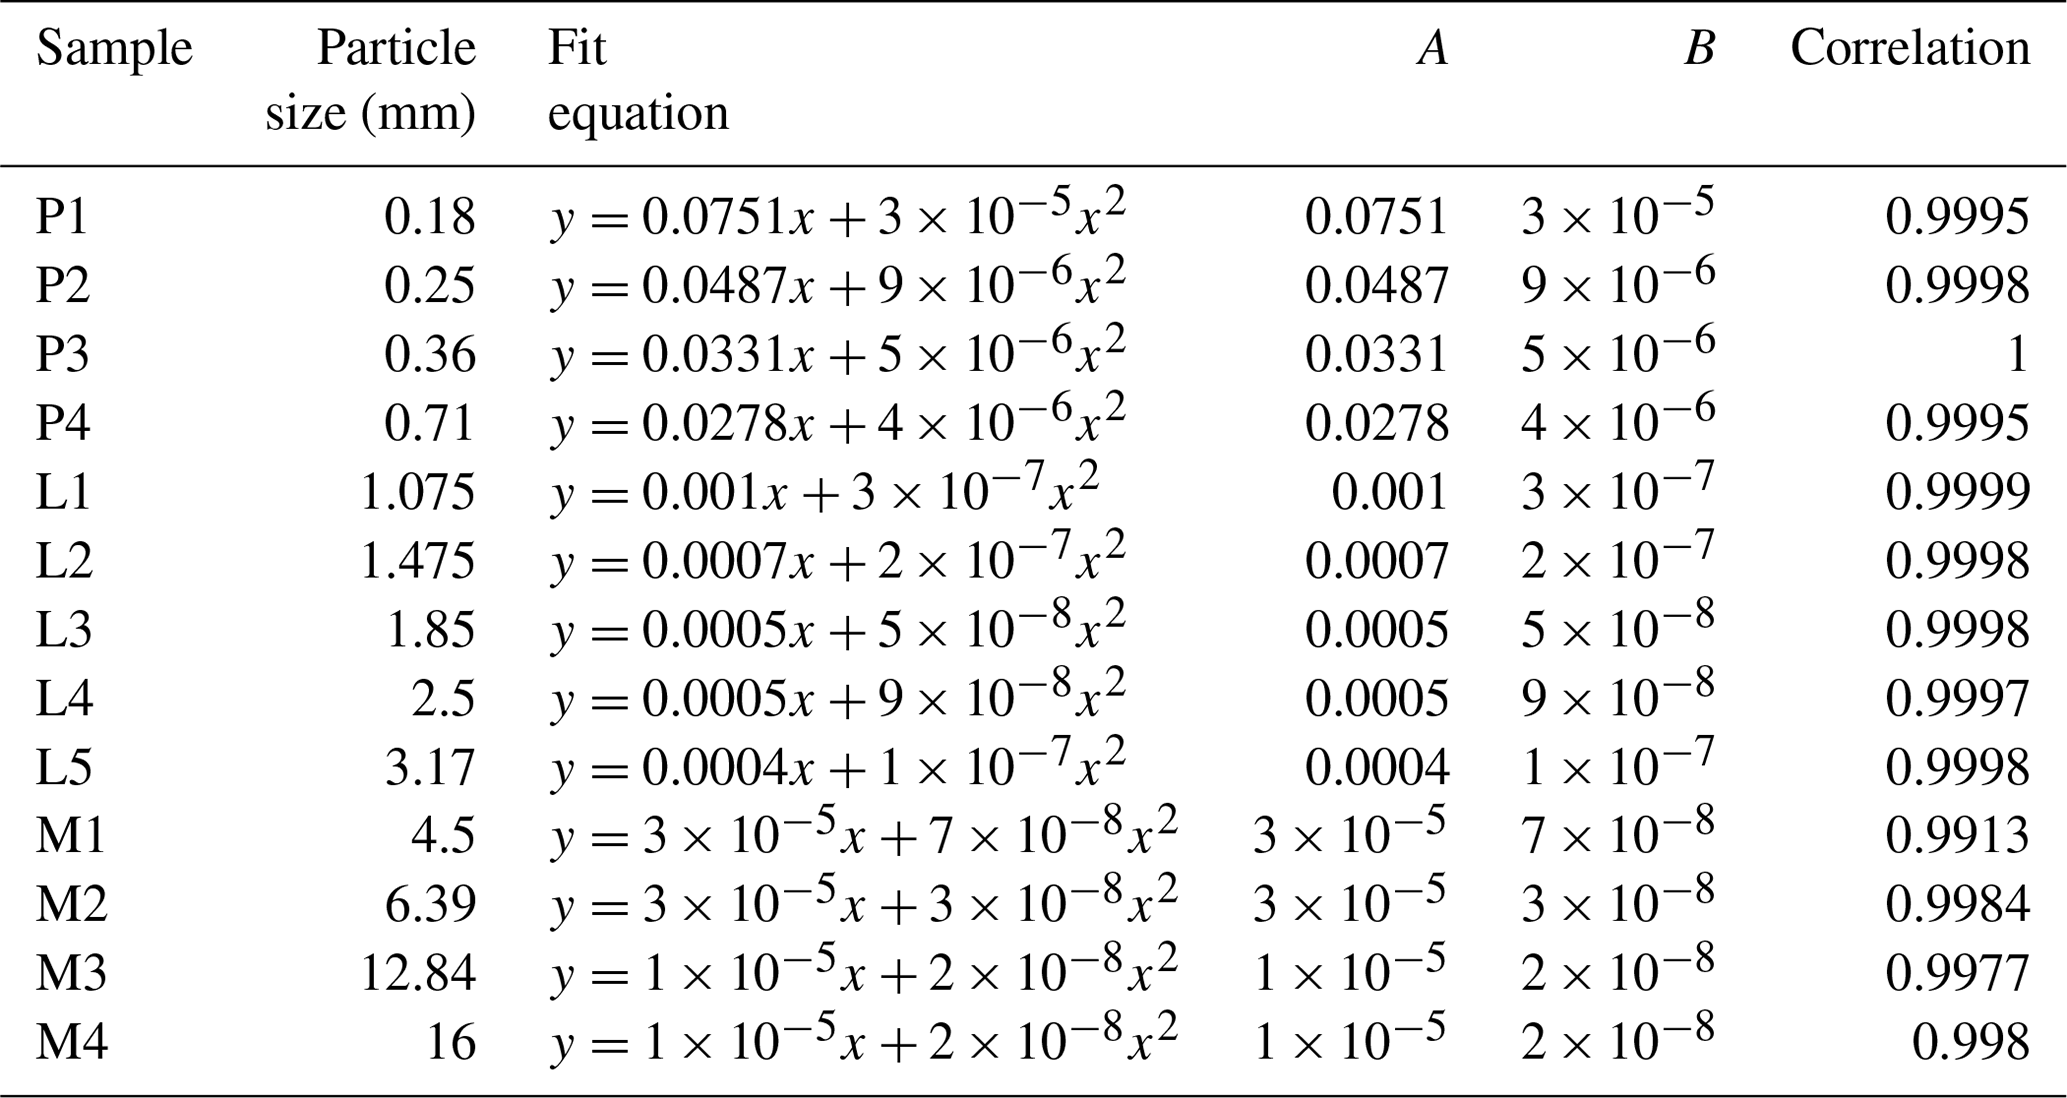
The uniform-diameter cubic arrangement of porous media is a rather ideal medium. The shape and arrangement of particles in natural pore aquifers are usually irregular. Therefore, the above-mentioned linear correlations between A and and between B and should be examined specifically. For this purpose, we collect the experimental data on homogeneous porous media, including previous research results and the results of other scholars. Among them, samples P1–P4 are the permeable stones selected in this study, samples L1–L5 are from previous studies (Li et al., 2017), and the experimental data on samples M1–M4 are from Moutsopoulos et al. (2009). The fitting coefficients are shown in Table 5. Furthermore, we can identify nice correlations between the Forchheimer coefficient A and and between the Forchheimer coefficient B and , which are shown in Figs. 13 and 14, respectively.
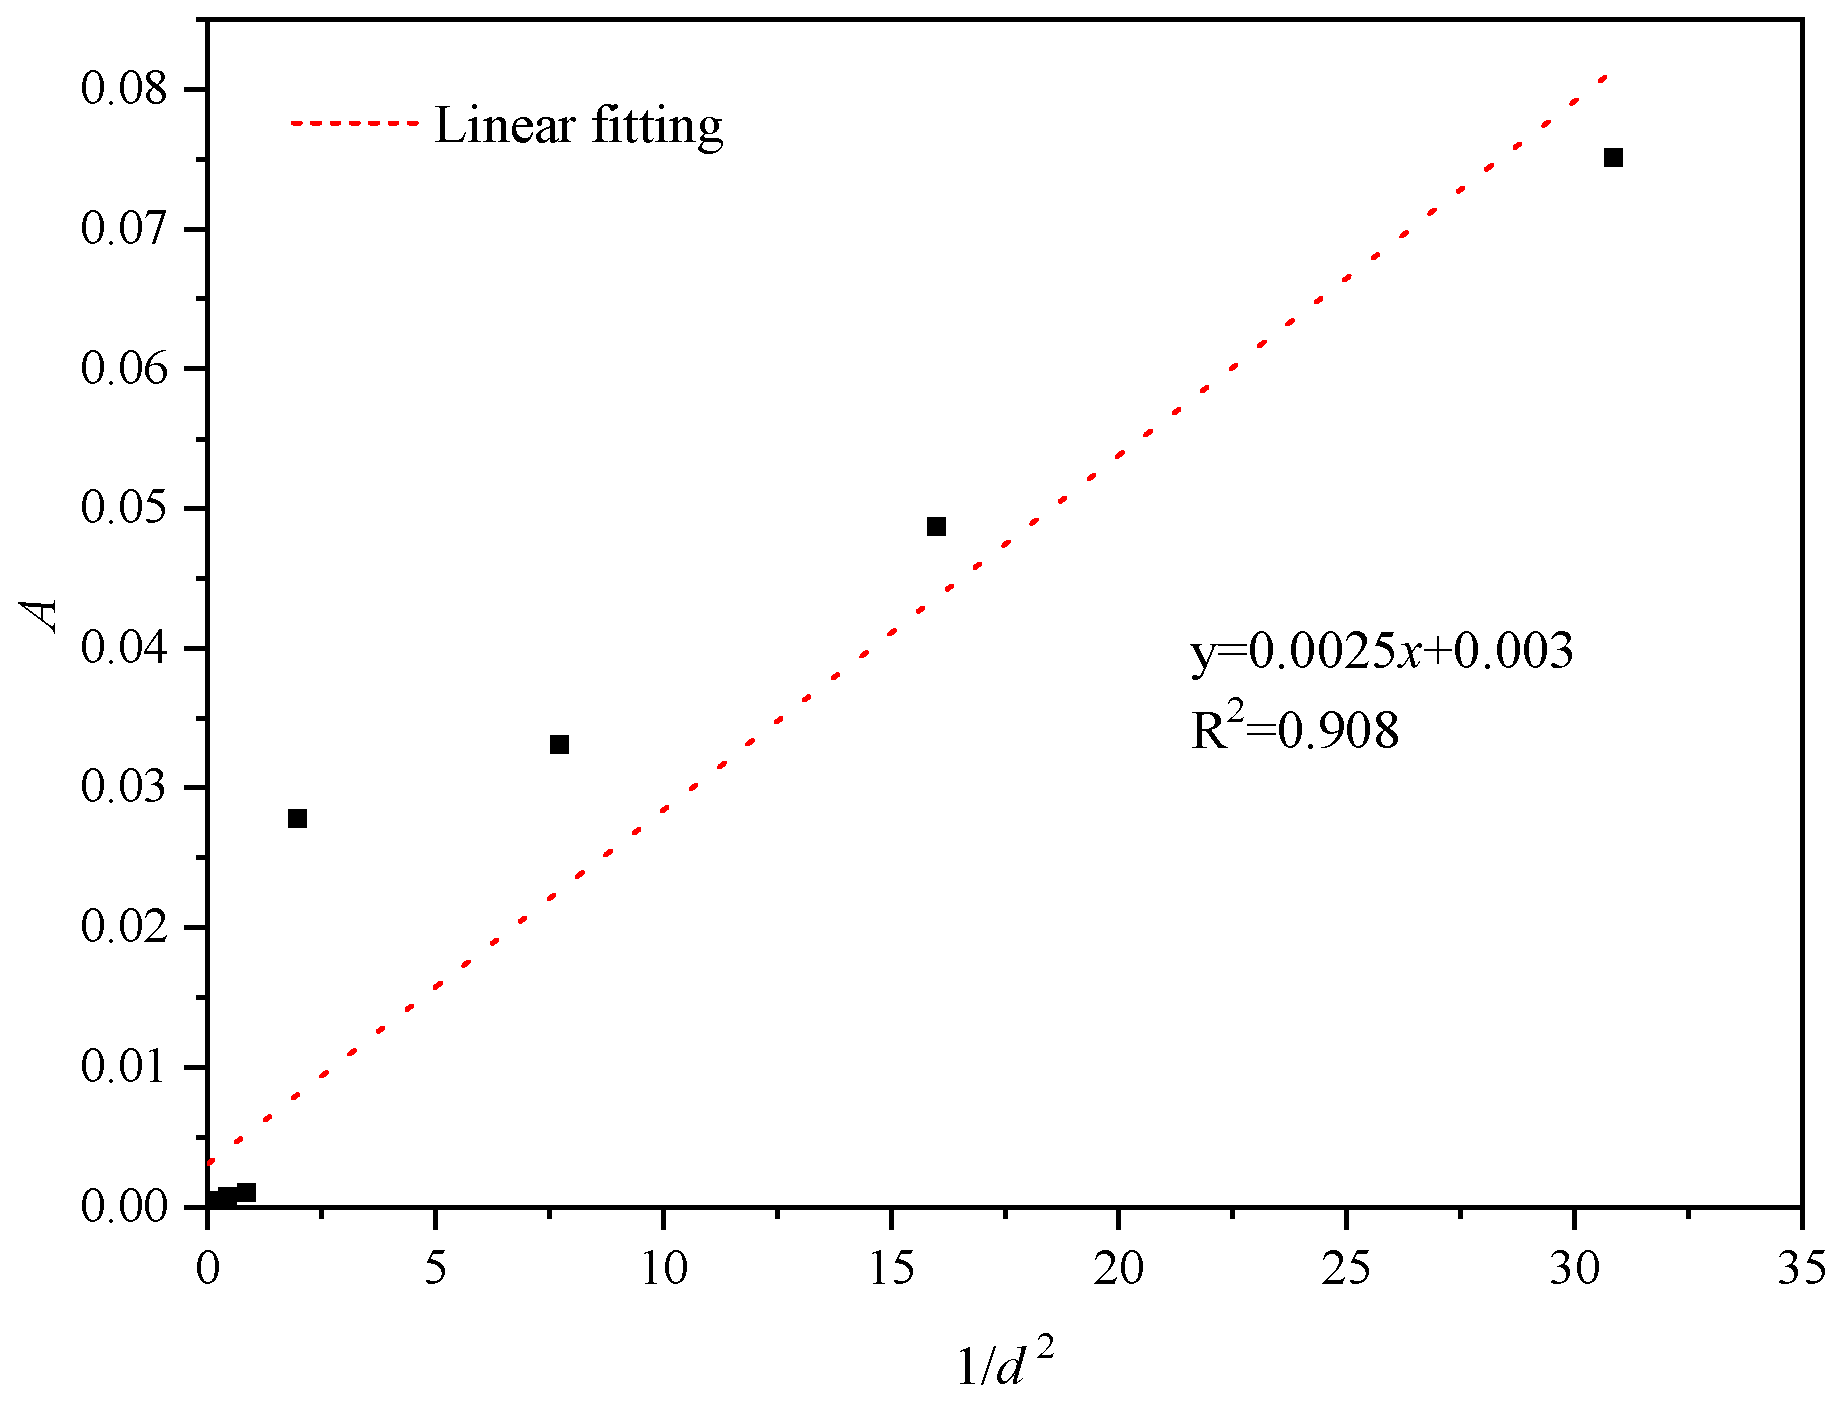

We can see from Fig. 13 that the coefficient A is linearly related to , and the relationship between A and is . The relationship between coefficient B and is completely different from the linear correlation reported above. Figure 14 shows that the coefficient B is quadratically related to , and the relationship between coefficient B and is given as . The coefficients A and B show linear relationships with and , respectively, when the particles are arranged in a simple cube (Huang, 2012). However, irregular particles such as permeable stones have a more complex geometry, resulting in a different law from that of regular spherical particles. The structure of a porous medium arranged in cubes is different from that of permeable stone. The porosity of a porous medium with spheres arranged in a cube is close to 0.48, independent of the diameter of the spheres. The particle shape, arrangement and tightness of permeable stone are different, and the porosity of permeable stone depends on the particle size (see Table 3).
Table 5Experimental fitting coefficients of different homogeneous particles sizes.
3.3.2 Influence of the porosity on the equation coefficients
In the above sections, we analyzed the influence of the particle size on the seepage coefficient. Furthermore, the pore size and pore specific surface area are also related to the arrangement and sorting degree of the particles; that is, to the porosity of the porous medium. To explore the effect of the sorting degree on the seepage coefficient, we draw a schematic diagram of different sorting degrees of particles, as shown in Fig. 15a and b. The degree of particle sorting is one of the most important factors affecting the pore size. In porous media with a poor sorting degree, the pore size is usually determined by the diameter of the smallest particle. We can see from Fig. 15 that the pores between the larger particles are filled by smaller particles, resulting in even smaller pores. In addition, a poorer sorting degree of particles leads to a larger pore specific surface area and a stronger viscous force of flow, which can lead to a larger A coefficient.
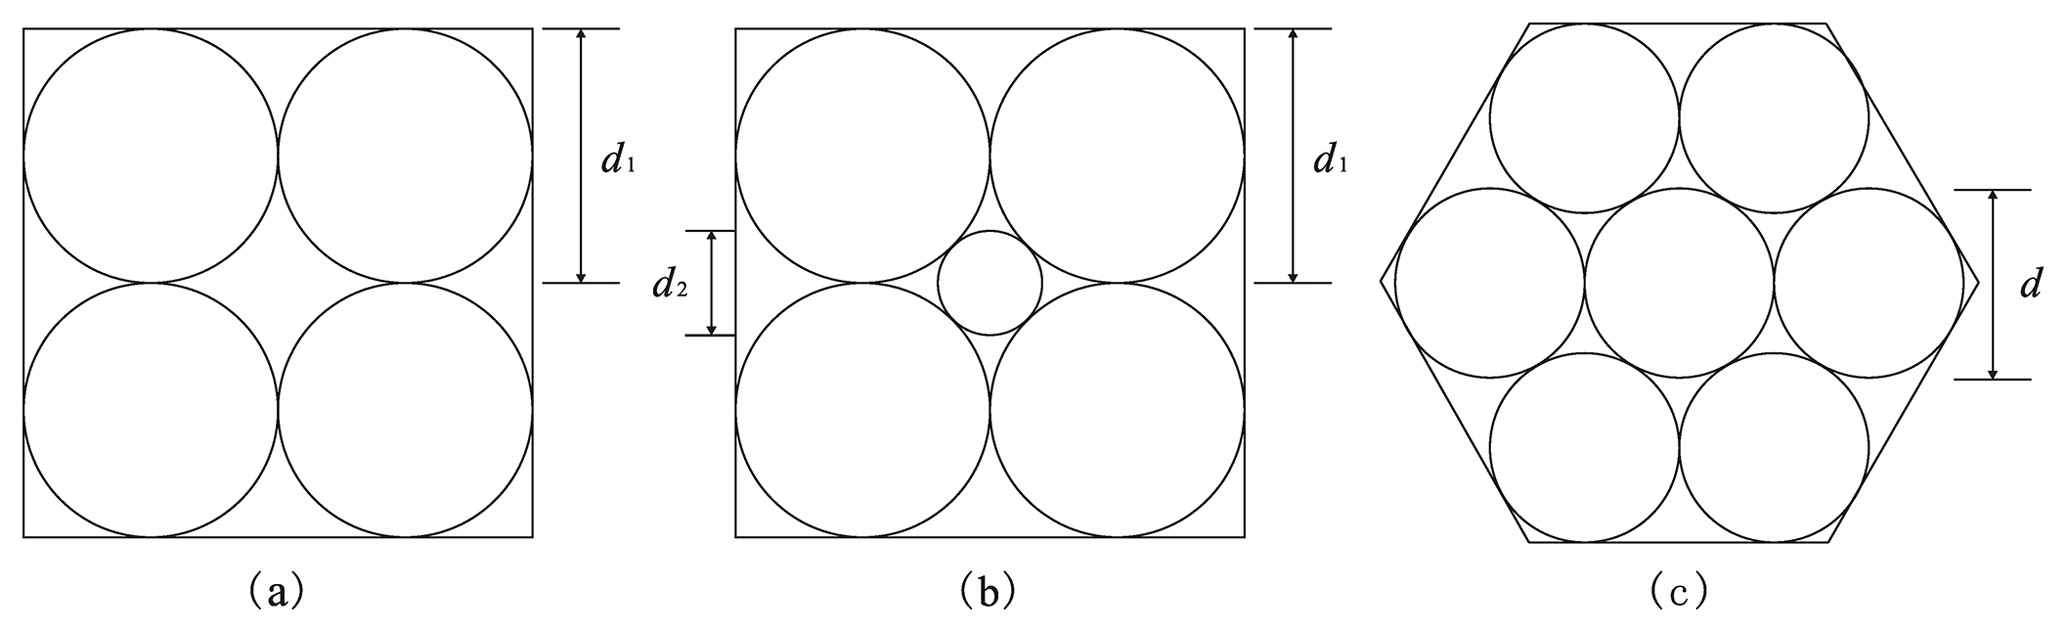
Figure 15Schematic diagrams of different particle sizes and arrangements: (a) a cubic arrangement with identical solid grains, (b) a cubic arrangement with two different sizes of solid grains, and (c) a hexahedron arrangement with identical solid grains. d1 is the diameter of each (identical) solid grain in (a) and the diameter of each large solid grain in (b), d2 is the diameter of the smaller solid grain in (b), and d is the diameter of each (identical) solid grain in (c).
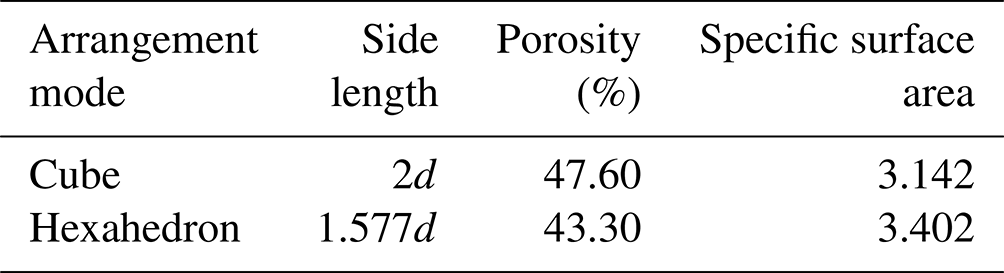
Furthermore, we have also provided schematic diagrams of spherical particles with equal sizes in two simple arrangements, namely a cubic arrangement and a hexahedron arrangement, as shown in Fig. 15a and c. The cubic arrangement is the less compact arrangement, with a pore diameter of 0.414d1, while the hexahedron arrangement is the more compact arrangement, with a pore diameter of 0.155d, where d1 and d are explained in the caption of Fig. 15. The characteristic values of the pore structure for different arrangements with the same particle size are shown in Table 6. We can see that the arrangement mode substantially affects the pore specific surface area and the pore size of the porous medium. More compactly packed particles lead to a larger pore specific surface area and a stronger viscous force. Meanwhile, a smaller pore diameter is associated with stronger effects of the viscous force and inertial force. In summary, a better sorting degree of particles leads to weaker viscous and inertial forces, so the coefficients A and B will be smaller. As a better sorting degree and a less compact (or looser) arrangement of particles means a larger porosity, we can conclude that a larger porosity leads to smaller A and B coefficients under the condition of the same particle size.
Table 6Characteristic values of the pore structure for different arrangements with the same particle size.
However, the structure of natural porous media is much more complex and heterogeneous than what is shown in Fig. 15, so it is difficult to quantitatively describe the effect of the sorting degree and arrangement on the seepage law.
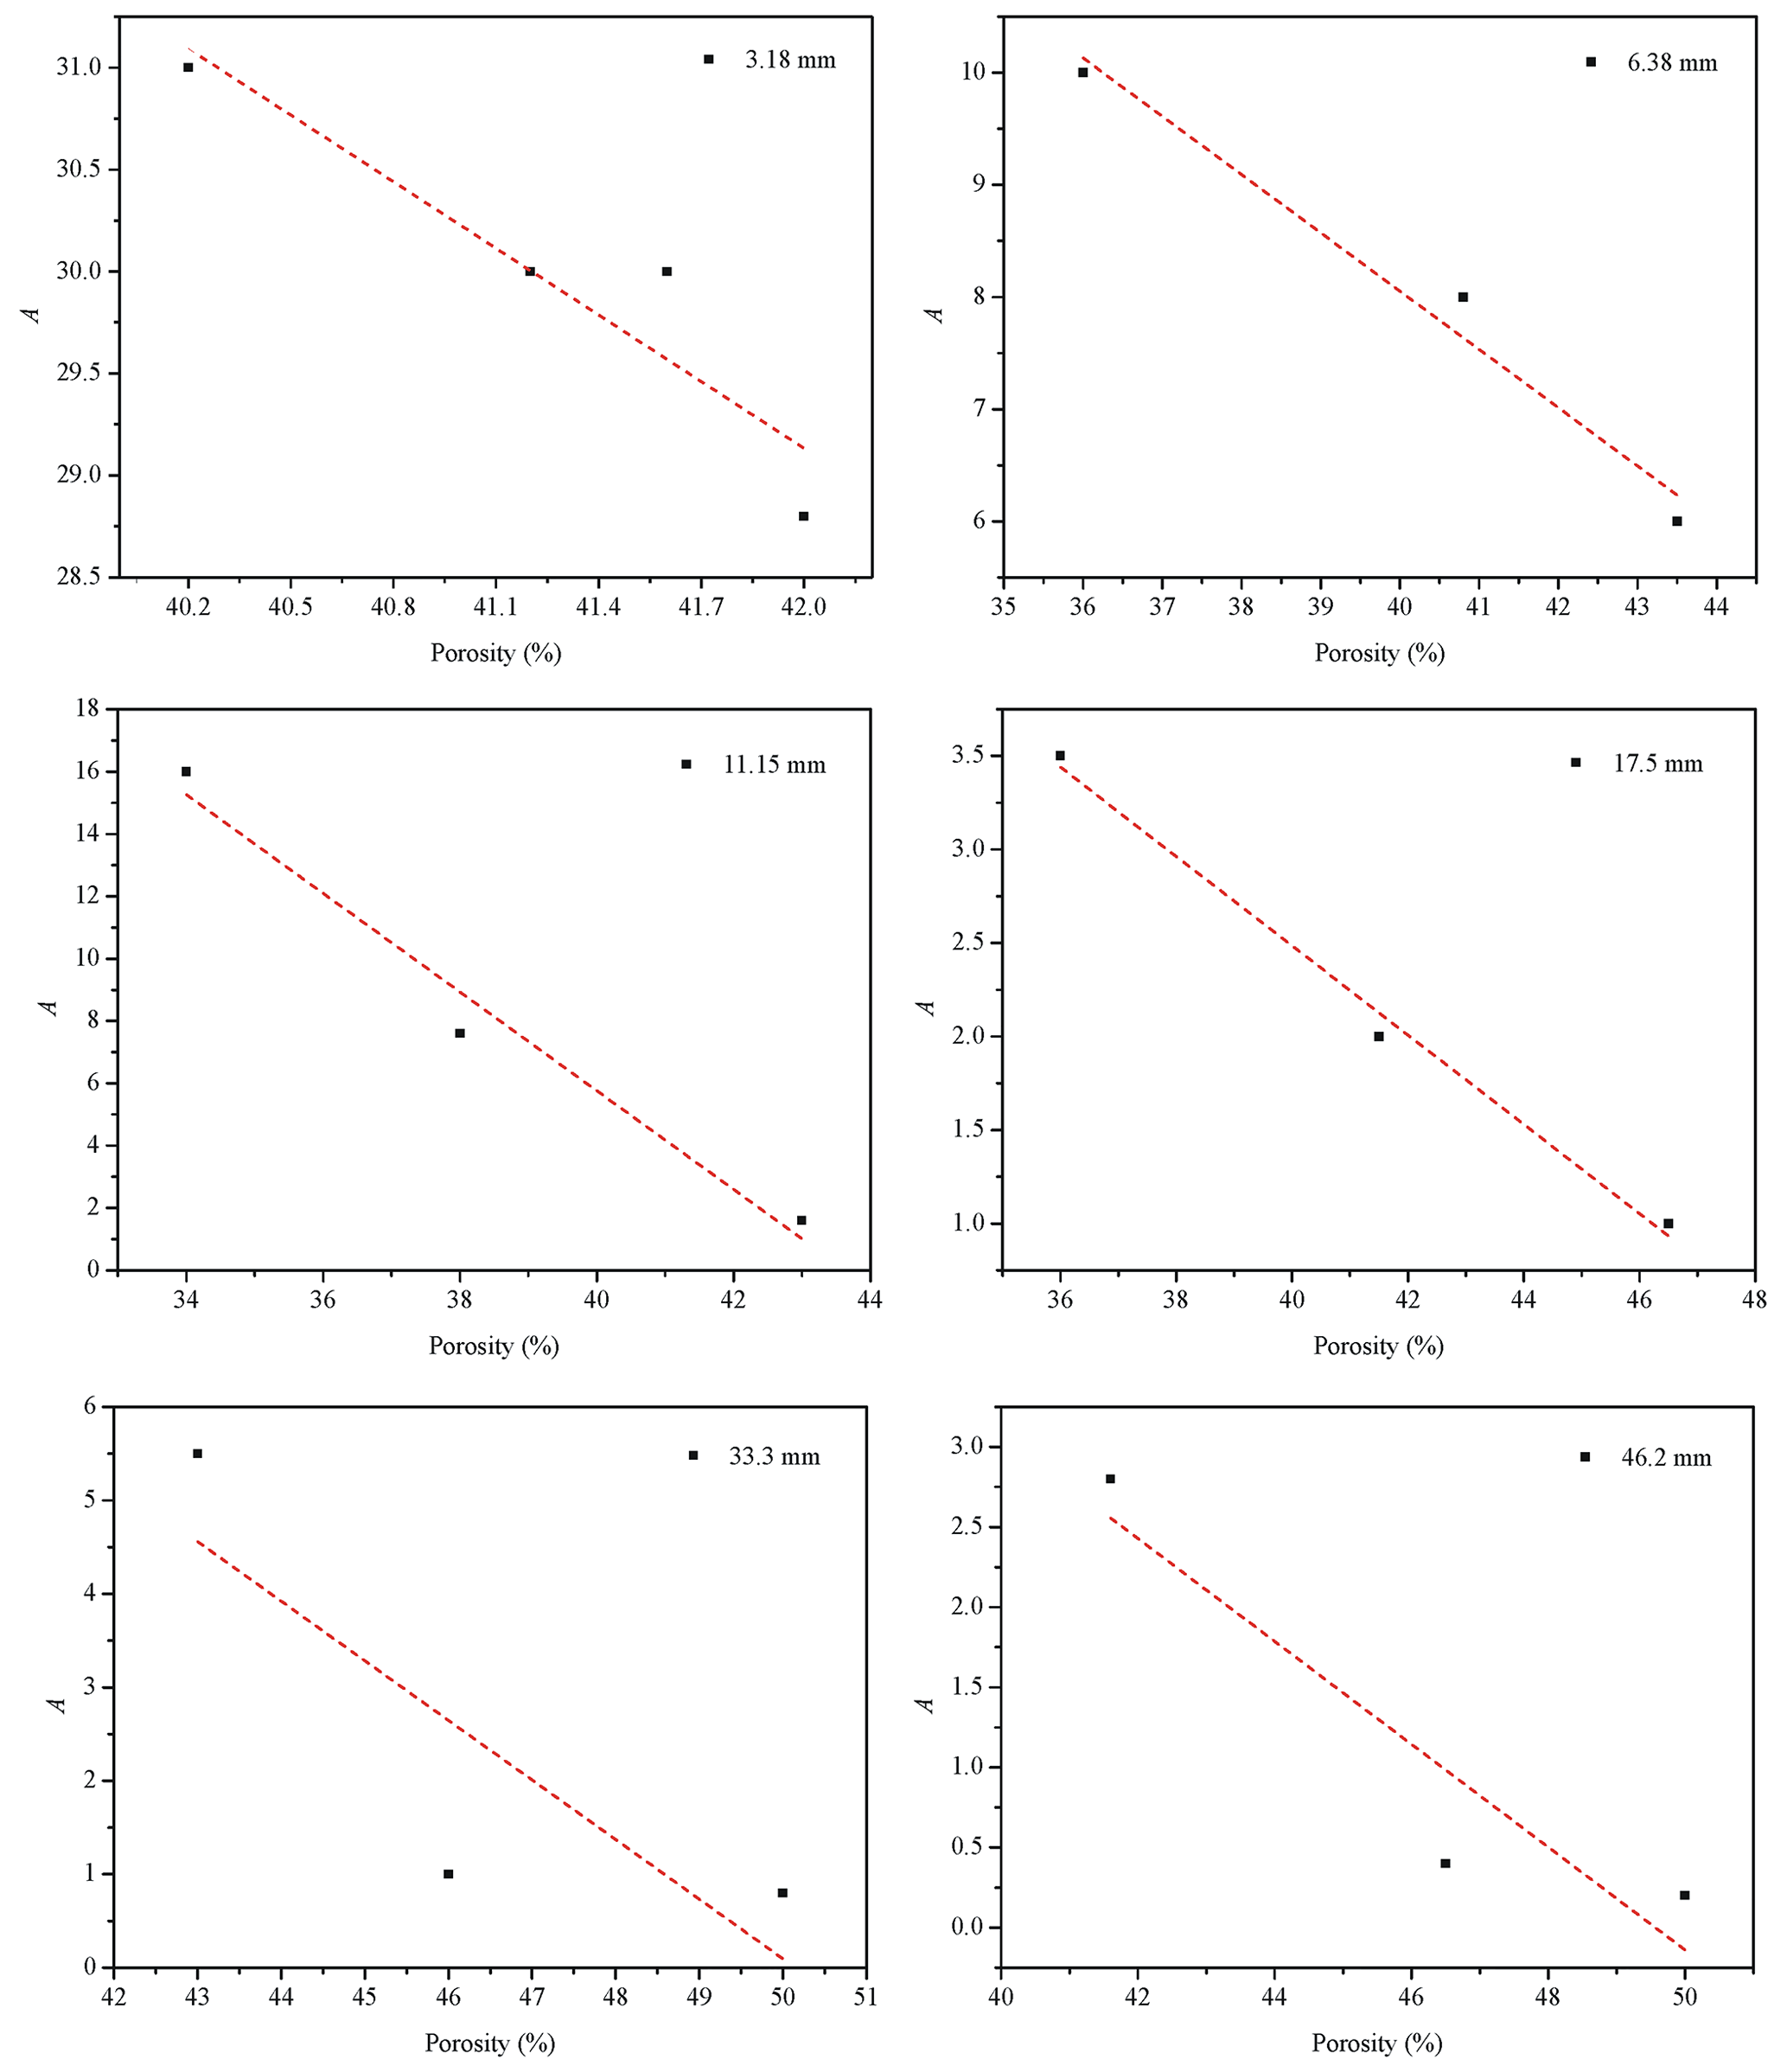
In view of this, we can use a macro parameter, porosity (n), to reveal the effect of the sorting degree and arrangement on the seepage coefficient. In order to verify the correctness of the above analytical results, we selected the seepage experiment results of Niranjan (1973) for further validation. Niranjan (1973) chose gravels of the same size but different porosities and carried out seepage experiments. We selected the experimental results for six different particle sizes (3.18, 6.38, 11.15, 17.5, 33.3 and 46.2 mm) from Niranjan (1973) and drew the relationships between the coefficients A and B and the porosity, as shown in Figs. 16 and 17. We can see that the coefficients A and B for the six groups of experimental data from Niranjan (1973) decrease with increasing porosity, which is consistent with our theoretical analysis of this investigation.

This study presents experimental results for the Forchheimer flow in four different permeable stones with different mesh sizes, including 24 mesh size (0.71 mm), 46 mesh size (0.36 mm), 60 mesh size (0.25 mm) and 80 mesh size (0.18 mm). The effects of the mean pore size and pore size distribution on the transition of the flow regime from pre-Darcy to post-Darcy are discussed. In addition, the mercury injection technique is proposed as a method to investigate the pore distributions of the permeable stones. Beyond that, the Forchheimer coefficients are specifically discussed. The main conclusions can be summarized as follows:
-
The relationships between the specific discharge (q) and the “pseudo” hydraulic conductivity (K) (which is computed as the ratio of q to the hydraulic gradient J) for the permeable stones show that a deviation from the Darcy flow regime is clearly visible. In addition, the critical specific discharge corresponding to the transition of the flow regime from pre-Darcy to post-Darcy increases with an increase in mean particle size.
-
When the specific discharge is small, only a small fraction of the pore water flows through the pores. The rest of the pore water adheres to the surfaces of the solid particles (it is immobile), partially blocking the flow pathways. As the specific discharge increases, more pore water becomes mobile and participates in the flow. Hence, the pseudo hydraulic conductivity increases with increasing specific discharge. When the specific discharge increases to the critical specific discharge (qc), the pseudo hydraulic conductivity is maximized; it then begins to decrease as the specific discharge continues to increase.
-
The mercury injection experiment results show that the mercury injection curve can be divided into three segments. The beginning and end segments of the mercury injection curves for the four permeable stones with different particle sizes are very gentle, while the main (or intermediate) mercury injection curve is steep, indicating that the pore size distribution falls within a narrow range and the proportions of large pores and small pores are relatively small.
-
The porosity decreases as the mean particle size of the permeable stone increases, while the mean pore diameter increases. The porosity faithfully reflects the influences of the particle diameter, sorting degree and arrangement mode of the porous medium on the seepage parameters. A larger porosity leads to smaller coefficients A and B under the condition of the same particle size.
-
The coefficient A is linearly related to , and the relationship between the coefficient A and is given as . The coefficient B is not linearly related to ; instead, it is quadratically related to as . The particle shape and arrangement of the permeable stone have great influences on the seepage parameters.
| q | The specific discharge, m d−1. |
| K | The “pseudo” hydraulic conductivity, |
| m d−1. | |
| J | The hydraulic gradient. |
| A | The Forchheimer equation coefficient |
| (viscous force item), s m−1. | |
| B | The Forchheimer equation coefficient |
| (inertial force item), s2 m−2. | |
| a, b | The empirical parameters that depend |
| on material properties. | |
| Re | The Reynolds number. |
| Rec | The critical Reynolds number. |
| M, m | The coefficients that depend on the |
| fluid and properties of the porous medium. | |
| CD | The appropriate phenomenological |
| coefficient. | |
| Pc | The capillary force, Pa. |
| P50 | The corresponding pressure value when |
| the saturation reaches 50 %, MPa. | |
| PA, PB, PC | The pressures corresponding |
| to different stages of the mercury injection | |
| curve, MPa. | |
| σ | The solid–liquid interfacial tension, Nm−1. |
| θ | The wet angle between the liquid and the |
| solid surface. | |
| r | The radius of curvature in the capillary, mm. |
| d | The particle size, mm. |
| d50 | The mean particle size (50 % by weight), |
| mm. | |
| Dm | The mean pore diameter, µm. |
| D50 | The pore diameter corresponding to the |
| median pressure P50, µm. | |
| H | The height of the peak of the mercury |
| injection curve. | |
| xc | The abscissa value corresponding to the peak |
| of the curve (the pore size). | |
| w | The standard variance. |
| n | The porosity. |
| Jn | The viscous-force-related component. |
| Jr | The inertial-force-related component. |
The data can be made available by contacting the first author or the corresponding authors.
ZL wrote the paper and carried out the experiment, JW and HZ revised this paper, TX and LH analyzed the experimental data and drew diagrams, and KH designed the experimental scheme.
The contact author has declared that neither they nor their co-authors have any competing interests.
Publisher’s note: Copernicus Publications remains neutral with regard to jurisdictional claims in published maps and institutional affiliations.
This article is part of the special issue “Experiments in Hydrology and Hydraulics”. It is not associated with a conference.
This study was supported by the National Natural Science Foundation of China (grant no. 41402204), the National Key Research and Development Program of China (no. 2018YFC0604202) and the Fundamental Research Funds for National Universities, China University of Geosciences (Wuhan). The authors thank Zhongzhi Shen of China University of Geosciences for his great help in developing the experimental setup. The authors want to express their sincere appreciation of the constructive comments made by the two anonymous reviewers and the associate editor for improving the quality of the manuscript.
This research has been supported by the National Natural Science Foundation of China (grant no. 41402204), the National Key Research and Development Program of China (grant no. 2018YFC0604202) and the “CUG Scholar” Scientific Research Funds at China University of Geosciences (Wuhan) (grant no. 2020106).
This paper was edited by Jorge Isidoro and reviewed by two anonymous referees.
Alvarez, A. E., Mahmoud, E., Martin, A. E., Masad, E., and Estakhri, C.: Stone-on-stone contact of permeable friction course mixtures, J. Mater. Civil Eng., 22, 1129–1138, https://doi.org/10.1061/(ASCE)MT.1943-5533.0000117, 2010.
Anovitz, L. M. and Cole, D. R.: Characterization and Analysis of Porosity and Pore Structures, Reviews in Mineralogy and Geochemistry, 80, 61–164, https://doi.org/10.2138/rmg.2015.80.04, 2015.
Bear, J.: Dynamics of fluids in porous media, Soil Science, 120, 162–163, https://doi.org/10.1097/00010694-197508000-00022, 1975.
Beavers, G. S., Sparrow, E., and Rodenz, D. E.: Influence of Bed Size on the Flow Characteristics and Porosity of Randomly Packed Beds of Spheres, J. Appl. Mech., 40, 655–660, https://doi.org/10.1115/1.3423067, 1972.
Blick, E.: Capillary-Orifice Model for High-Speed Flow through Porous Media, Industrial Engineering Chemistry Process Design Development, 5, 90–94, https://doi.org/10.1021/i260017a019, 1966.
Bu, S., Yang, J., Dong, Q., and Wang, Q.: Experimental study of transition flow in packed beds of spheres with different particle sizes based on electrochemical microelectrodes measurement, Appl. Therm. Eng., 73, 1525–1532, https://doi.org/10.1016/j.applthermaleng.2014.03.063, 2014.
Darcy, H.: Recherches expérimentales relatives au mouvement de l'eau dans les tuyaux, Impr. Impériale, Paris, France, https://www.scirp.org/reference/referencespapers.aspx?referenceid=1200904 (last access: 23 June 2022), 1857.
Dejam, M., Hassanzadeh, H., and Chen, Z.: Pre-Darcy flow in porous media, Water Resour. Res., 53, 8187–8210, https://doi.org/10.1002/2017WR021257, 2017.
Dudgeon, C. R.: An experimental study of the flow of water through coarse granular media, Houille Blanche, 785–801, https://doi.org/10.1051/lhb/1966049, 1966.
Dybbs, A. and Edwards, R. V.: A New Look at Porous Media Fluid Mechanics – Darcy to Turbulent, Springer Netherlands, 199–256, https://doi.org/10.1007/978-94-009-6175-3_4, 1984.
Ergun, S.: Fluid flow through packed columns, Chem. Eng. Prog., 89–94, https://doi.org/10.1016/0009-2509(53)80048-5, 1952.
Fancher, G. H. and Lewis, J. A.: Flow of simple fluids through porous materials, Ind. Eng. Chem., 25, 1139–1147, https://doi.org/10.1021/ie50286a020, 1933.
Fetter, C. W.: Applied Hydrogeology:International Edition, Prentice Hall, Pearson, Engelwood Cliffs, 10: 0131226878, 2001.
Forchheimer, P.: Wasserbewegung durch boden, Z. Ver. Deutsch, Ing., 45, 1728–1782, 1901.
Geertsma, J.: Estimating the Coefficient of Inertial Resistance in Fluid Flow Through Porous Media, Soc. Petrol. Eng. J., 14, 445–450, https://doi.org/10.2118/4706-PA, 1974.
Guan, X., Wang, J., and Xiao, F.: Sponge city strategy and application of pavement materials in sponge city, J. Clean. Prod., 303, 127022, https://doi.org/10.1016/j.jclepro.2021.127022, 2021.
Hall, P. L., Mildner, D., and Borst, R. L.: Small-angle scattering studies of the pore spaces of shaly rocks, J. Geophys. Res.-Atmos., 91, 2183–2192, https://doi.org/10.1029/JB091iB02p02183, 1986.
Han, D., Wei, L., and Zhang, J.: Experimental study on performance of asphalt mixture designed by different method, Procedia Engineer., 137, 407–414, https://doi.org/10.1016/j.proeng.2016.01.275, 2016.
Harlan, J., Picot, D., Loll, P., and Garavito, R.: Calibration of size-exclusion chromatography: use of a double Gaussian distribution function to describe pore sizes, Anal. Biochem., 224, 557–563, https://doi.org/10.1006/abio.1995.1087, 1995.
He, X. and Zhang, Z.: Microscopic pore structural characteristics in coal particles, 3rd International Conference on Material, Mechanical and Manufacturing Engineering (IC3ME 2015), Guangzhou, China, 1907–1911, https://doi.org/10.2991/ic3me-15.2015.368, 2015.
Huang, K.: Exploration of the basic seepage equation in porous media, PhD thesis, School of Environmental Studies, China University of Geosciences, China, 95 pp., http://kns-cnki-net-s.webvpn.cug.edu.cn:8118/kns8/defaultresult/index (last access: 22 June 2022,), 2012.
Huang, K., Wan, J., Chen, C., Linqing, H., Mei, W., and Zhang, M.: Experimental investigation on water flow in cubic arrays of spheres, J. Hydrol., 492, 61–68, https://doi.org/10.1016/j.jhydrol.2013.03.039, 2013.
Irmay, S.: Theoretical models of flow through porous media, RILEM Symp. Transfer of Water in porous media, 29, 37–43, 1964.
Izbash, S.: O Filtracii V Kropnozernstom Materiale, Leningrad, USSR, https://xueshu.dailyheadlines.cc/scholar?hl=zh-CN&as_sdt=0,5&q=Izbash,+S.:+O+Filtracii+V+Kropnozernstom+Materiale&btnG= (last access: 22 June 2022), 1931.
Javadi, M., Sharifzadeh, M., Shahriar, K., and Mitani, Y.: Critical Reynolds number for nonlinear flow through rough walled fractures: The role of shear processes, Water Resour. Res., 50, 1789–1804, https://doi.org/10.1002/2013WR014610, 2014.
Jeon, H., Cho, H., Kim, J., and Sung, B.: Non-Gaussian rotational diffusion in heterogeneous media, Phys. Rev. E, 90, 042105, https://doi.org/10.1103/PhysRevE.90.042105, 2014.
Kadlec, R. H. and Knight, R. L.: Treatment Wetlands, Lewis Pub, Boca Raton, ISBN 9781566705264, 1996.
Kate, J. M. and Gokhale, C. S.: A simple method to estimate complete pore size distribution of rocks, Eng. Geol., 84, 48–69, https://doi.org/10.1016/j.enggeo.2005.11.009, 2006.
Koch, D. and Ladd, A.: Moderate Reynolds number flows through periodic and random arrays of aligned cylinders, J. Fluid Mech., 349, 31–66, https://doi.org/10.1017/S002211209700671X, 1996.
Kovács, G.: Seepage Hydraulics, Development in Water Sciences, Elsevier, New York, ISBN 9780080870014, 1981.
Latifi, M., Midoux, N., Storck, A., and Gence, J.: The use of micro-electrodes in the study of the flow regimes in a packed bed reactor with single phase liquid flow, Chem. Eng. Sci., 44, 2501–2508, https://doi.org/10.1016/0009-2509(89)85194-2, 1989.
Li, Q., Wang, F., Yu, Y., Huang, Z., Li, M., and Guan, Y. J. J. o. E. M.: Comprehensive performance evaluation of LID practices for the sponge city construction: a case study in Guangxi, China, J. Environ. Manage., 231, 10–20, https://doi.org/10.1016/j.jenvman.2018.10.024, 2019.
Li, Z., Wan, J., Huang, K., Chang, W., and He, Y.: Effects of particle diameter on flow characteristics in sand columns, Int. J. Heat Mass Tran., 104, 533–536, https://doi.org/10.1016/j.ijheatmasstransfer.2016.08.085, 2017.
Li, Z., Wan, J., Zhan, H., Cheng, X., Chang, W., and Huang, K.: Particle size distribution on Forchheimer flow and transition of flow regimes in porous media, J. Hydrol., 574, 1–11, https://doi.org/10.1016/j.jhydrol.2019.04.026, 2019.
Lindquist, E.: On the flow of water through porous soil, Premier Congres des grands barrages, Stockholm, 81–101, https://xs2.dailyheadlines.cc/scholar?cluster=10665091756027963788&hl=zh-CN&as_sdt=2005&sciodt=0,5 (last access: 22 June 2022), 1933.
Lindquist, W. B., Venkatarangan, A., Dunsmuir, J., and Wong, T. F.: Pore and throat size distributions measured from synchrotron X-ray tomographic images of Fontainebleau sandstones, J. Geophys. Res.-Sol. Ea., 105, 21509–21527, https://doi.org/10.1029/2000JB900208, 2000.
Maalal, O., Prat, M., Peinador, R., and Lasseux, D.: Determination of the throat size distribution of a porous medium as an inverse optimization problem combining pore network modeling and genetic and hill climbing algorithms, Phys. Rev. E, 103, 023303, https://doi.org/10.1103/PhysRevE.103.023303, 2021.
Macdonald, I., El-Sayed, M., Mow, K., and Dullien, F.: Flow through porous media-the Ergun equation revisited, Ind. Eng. Chem. Fund., 18, 199–208, https://doi.org/10.1021/i160071a001, 1979.
Min, Z., Min, C., Zhang, S., Wang, X., and Wang, Y.: Effect of precursor on the pore structure of carbon foams, New Carbon Materials, 22, 75–79, https://doi.org/10.1016/S1872-5805(07)60009-2, 2007.
Moutsopoulos, K. N., Papaspyros, I. N., and Tsihrintzis, V. A.: Experimental investigation of inertial flow processes in porous media, J. Hydrol., 374, 242–254, https://doi.org/10.1016/j.jhydrol.2009.06.015, 2009.
Niranjan, H.: Non-Darcy flow through porous media, MS dissertation, ITT, Kanpur, India, https://xs2.dailyheadlines.cc/scholar?hl=zh-CN&as_sdt=0,5&q=Niranjan,+H+1973&btnG= (last access: 22 June 2022), 1973.
Panfilov, M. and Fourar, M.: Physical splitting of nonlinear effects in high-velocity stable flow through porous media, Adv. Water Resour., 29, 30–41, https://doi.org/10.1016/j.advwatres.2005.05.002, 2006.
Pittman, E. D.: Relationship of porosity and permeability to various parameters derived from mercury injection-capillary pressure curves for sandstone (1), AAPG Bull., 76, 191–198, https://doi.org/10.1306/BDFF87A4-1718-11D7-8645000102C1865D, 1992.
Prowell, B. D., Allen Cooley Jr., L., and Schreck, R. J.: Virginia's experience with 9.5-mm nominal-maximum-aggregate-size stone matrix asphalt, Transportation research record, Transportation research record, 1813, 133–141, https://doi.org/10.3141/1813-16, 2002.
Rezaee, R., Saeedi, A., and Clennell, B.: Tight gas sands permeability estimation from mercury injection capillary pressure and nuclear magnetic resonance data, J. Petrol. Sci. Eng., 88, 92–99, https://doi.org/10.1016/j.petrol.2011.12.014, 2012.
Rijfkogel, L. S., Ghanbarian, B., Hu, Q., and Liu, H. H.: Clarifying pore diameter, pore width, and their relationship through pressure measurements: A critical study, Mar. Petrol. Geol., 107, 142–148, https://doi.org/10.1016/j.marpetgeo.2019.05.019, 2019.
Scheidegger, A. E.: The physics of flow through porous media, Soil Sci., 86, 355–362, https://doi.org/10.3138/9781487583750, 1958.
Scheidegger, A. E.: On the stability of displacement fronts in porous media: a disscussion of the muskat-aronofsky model, Can. J. Phys., 38, 153–162, https://doi.org/10.1139/p60-017, 1960.
Schmitt, M., Fernandes, C. P., da Cunha Neto, J. A., Wolf, F. G., and dos Santos, V. S.: Characterization of pore systems in seal rocks using nitrogen gas adsorption combined with mercury injection capillary pressure techniques, Mar. Petrol. Geol., 39, 138–149, https://doi.org/10.1016/j.marpetgeo.2012.09.001, 2013.
Schneebeli, G.: Experiences sur la limite de validite de la loi de Darcy et l'apparition de la turbulence dans un ecoulemant de filtration, Huille Blanche, 2, 141–149, https://doi.org/10.1051/lhb/1955030, 1955.
Sedghi-Asl, M., Rahimi, H., and Salehi, R.: Non-Darcy Flow of Water Through a Packed Column Test, Transport in Porous Media, 101, 215–227, https://doi.org/10.1007/s11242-013-0240-0, 2014.
Seguin, D., Montillet, A., and Comiti, J.: Experimental characterisation of flow regimes in various porous media – I: Limit of laminar flow regime, Chem. Eng. Sci., 53, 3751–3761, https://doi.org/10.1016/S0009-2509(98)00175-4, 1998.
Shi, W., Yang, T., and Yu, S.: Experimental Investigation on Non-Darcy Flow Behavior of Granular Limestone with Different Porosity, J. Hydrol. Eng., 25, 06020004, https://doi.org/10.1061/(ASCE)HE.1943-5584.0001966, 2020.
Sidiropoulou, M. G., Moutsopoulos, K. N., and Tsihrintzis, V.: Determination of Forchheimer equation coefficients a and b, Hydrol. Process., 21, 534–554, https://doi.org/10.1002/hyp.6264, 2007.
Skjetne, E., Hansen, A., and Gudmundsson, J.: High-velocity flow in a rough fracture, J. Fluid Mech., 383, 1–28, https://doi.org/10.1017/S0022112098002444, 1999.
Soni, J., Islam, N., and Basak, P.: An experimental evaluation of non-Darcian flow in porous media, J. Hydrol., 38, 231–241, https://doi.org/10.1016/0022-1694(78)90070-7, 1978.
Souto, H. P. A. and Moyne, C.: Dispersion in two-dimensional periodic porous media. Part I. Hydrodynamics, Phys. Fluids, 9, 2243–2252, https://doi.org/10.1063/1.869365, 1997.
Suo, Z., Bao, X., Nie, L., Yan, Q., and Qi, K.: Optimization Design of Mix Proportion of Large Stone Permeable Mixture Based on Target Air Voids, Buildings, 11, 514, https://doi.org/10.3390/buildings11110514, 2021.
Swartzendruber, D.: Modification of Darcy's law for the flow of water in soils, Soil Sci., 93, 22–29, https://doi.org/10.1097/00010694-196201000-00005, 1962a.
Swartzendruber, D.: Non-Darcy flow behavior in liquid-saturated porous media, J. Geophys. Res., 67, 5205–5213, https://doi.org/10.1029/JZ067i013p05205, 1962b.
Van Lopik, J. H., Snoeijers, R., van Dooren, T. C. G. W., Raoof, A., and Schotting, R. J.: The Effect of Grain Size Distribution on Nonlinear Flow Behavior in Sandy Porous Media, Transport Porous Med., 120, 1–30, https://doi.org/10.1007/s11242-017-0903-3, 2017.
Van Lopik, J. H., Zazai, L., Hartog, N., and Schotting, R.: Nonlinear Flow Behavior in Packed Beds of Natural and Variably Graded Granular Materials, Transport Porous Med., 131, 957–983, https://doi.org/10.1007/s11242-019-01373-0, 2019.
Wang, J., Ng, P.-L., Gong, Y., Su, H., and Du, J.: Experimental Study of Low Temperature Performance of Porous Asphalt Mixture, Appl. Sci., 11, 4029, https://doi.org/10.3390/app11094029, 2021.
Ward, J. C.: Turbulent Flow in Porous Media, J. Hydraul. Eng., 90, 1–12, https://doi.org/10.1016/S0301-9322(02)00051-4, 1964.
Washburn, E. W.: The Dynamics of Capillary Flow, Phys. Rev., 17, 273–283, https://doi.org/10.1103/PhysRev.17.273, 1921.
Wright, D.: Nonlinear Flow Through Granular Media, Journal of Hydraulic Engineering, 94, 851–872, https://doi.org/10.1061/JYCEAJ.0001858, 1968.
Xie, H. and Watson, D. E.: Determining air voids content of compacted stone matrix asphalt mixtures, Transport. Res. Rec., 1891, 203–211, https://doi.org/10.3141/1891-24, 2004.
Xu, C. and Torres-Verdín, C.: Pore System Characterization and Petrophysical Rock Classification Using a Bimodal Gaussian Density Function, Math. Geosci., 45, 753–771, https://doi.org/10.1007/s11004-013-9473-2, 2013.
Yang, B., Yang, T., Xu, Z., Liu, H., Yang, X., and Shi, W.: Impact of Particle-Size Distribution on Flow Properties of a Packed Column, J. Hydrol. Eng., 24, 04018070, https://doi.org/10.1061/(ASCE)HE.1943-5584.0001735, 2019.
Yu, T., Liu, D., Zhang, H., and Wang, H.: Influence of pore water phase change on service performance for permeable pavement in Sponge City, Water Sci. Technol., 84, 3769–3779, https://doi.org/10.2166/wst.2021.459, 2021.
Zeng, Z. and Grigg, R.: A criterion for non-Darcy flow in porous media, Transport Porous Med., 63, 57–69, https://doi.org/10.1007/s11242-005-2720-3, 2006.
Zhihong, L. I., Jihong, S., Dong, W. U., Yuhan, S., Liu, Y. I., Wenjun, S., and Baozhong, D.: Determination of average pore diameter of SiO2 xerogels by small angle X-ray scattering, ACTA Phys. Sin., 49, 1312–1315, https://doi.org/10.3321/j.issn:1000-3290.2000.07.020, 2000.
Zhou, H., Fang, Y.-G., Chen, M., Gu, R.-G., and Li, W.: Experimental and analytical study on electro-osmosis in low-permeability soil considering the pore size effect, Geotechnique, 71, 141–152, https://doi.org/10.1680/jgeot.18.p.362, 2019.