the Creative Commons Attribution 4.0 License.
the Creative Commons Attribution 4.0 License.
 | 06 May 2022
Towards effective drought monitoring in the Middle East and North Africa (MENA) region: implications from assimilating leaf area index and soil moisture into the Noah-MP land surface model for Morocco
Sujay V. Kumar
Kristi R. Arsenault
Christa D. Peters-Lidard
Iliana E. Mladenova
Karim Bergaoui
Abheera Hazra
Benjamin F. Zaitchik
Sarith P. Mahanama
Rachael McDonnell
David M. Mocko
Mahdi Navari
The Middle East and North Africa (MENA) region has experienced more frequent and severe drought events in recent decades, leading to increasingly pressing concerns over already strained food and water security. An effective drought monitoring and early warning system is thus critical to support risk mitigation and management by countries in the region. Here we investigate the potential for assimilation of leaf area index (LAI) and soil moisture observations to improve the representation of the overall hydrological and carbon cycles and drought by an advanced land surface model. The results reveal that assimilating soil moisture does not meaningfully improve model representation of the hydrological and biospheric processes for this region, but instead it degrades the simulation of the interannual variation in evapotranspiration (ET) and carbon fluxes, mainly due to model weaknesses in representing prognostic phenology. However, assimilating LAI leads to greater improvement, especially for transpiration and carbon fluxes, by constraining the timing of simulated vegetation growth response to evolving climate conditions. LAI assimilation also helps to correct for the erroneous interaction between the prognostic phenology and irrigation during summertime, effectively reducing a large positive bias in ET and carbon fluxes. Independently assimilating LAI or soil moisture alters the categorization of drought, with the differences being greater for more severe drought categories. We highlight the vegetation representation in response to changing land use and hydroclimate as one of the key processes to be captured for building a successful drought early warning system for the MENA region.
- Article
(4849 KB) - Full-text XML
- BibTeX
- EndNote


The Middle East and North Africa (MENA) region has experienced intensified drought events during recent decades that are attributable to climate change (Bergaoui et al., 2015; Cook et al., 2018; Pachauri et al., 2014). Multiple dimensions of food, water, and energy security are affected by drought in the MENA countries, leading, in some instances, to increased social disparities, political disruption, and disease outbreaks (Müller et al., 2017; Rajsekhar and Gorelick, 2017; Stanke et al., 2013; Weinthal et al., 2015). While efforts have been made to cope with these extreme events through the engagement of multi-sectoral and interdisciplinary collaborations among communities and across scales, strategic drought risk management linked to operational drought early warning systems for the region are not yet in place (Pulwarty and Sivakumar, 2014; Verner et al., 2018). Recognizing the complexity in defining drought and the broad range of drought impacts, drought experts have favored using a Composite Drought Indicator (CDI) approach that combines indicators from different climate variables such as precipitation, soil moisture, vegetation, and evapotranspiration (ET) into a single product through a “convergence of evidence” framework (Hayes et al., 2012). Such approaches have been applied to four MENA countries (i.e., Morocco, Tunisia, Lebanon, and Jordan) through a United States Agency for International Development (USAID)-funded project in developing the MENA Regional Drought Management System (MENA RDMS; Bijaber et al., 2018; Fragaszy et al., 2020; Jedd et al., 2020). Accurate estimates of these constituent variables are therefore necessary for developing reliable drought assessments with CDI. Advances in remote sensing and Earth observation technologies offer the ability to infer precipitation, soil moisture, and vegetation from different sensing platforms at various spatiotemporal resolutions. While these measurements offer valuable information on the changes in land surface conditions, they suffer from spatiotemporal gaps in coverage from orbital configurations and sensing limitations, and, for soil moisture, a limitation to shallow sensing depths (∼ a few centimeters), restricting their direct use for drought representation (Brocca et al., 2017; Kerr et al., 2016). Extending the utility of spatially incomplete and temporally infrequent remote sensing data to improve the representation of variables such as root zone soil moisture is needed for improving CDI estimation.
Earth system models are powerful tools for generating continuous soil moisture profiles with full spatiotemporal coverage and provide additional information on the distribution of water resources, carbon fluxes, and their impact on hydroclimate over a broad range of scales. However, because of the uncertainties in the simplified model physics in representing complex real-world systems and deficiencies inherent in meteorological forcing inputs, soil, and vegetation parameters, model-based estimates are subject to error. Ground measurements can serve to constrain the estimation of model parameters, but such observations are very limited or unavailable for the MENA region. Therefore, one approach to mitigating the model uncertainties and extending the value of remote sensing products is to merge them through data assimilation (DA; Reichle, 2008).
Assimilating remote sensing measurements that contain information on either surface soil moisture or vegetation can affect the simulation of root zone soil moisture. Evidence from previous soil moisture DA studies suggests that DA can provide higher skill in estimating both surface and root zone soil moisture, benefiting applications such as agricultural drought monitoring and irrigation management (Bolten et al., 2009; De Lannoy and Reichle, 2016; Kolassa et al., 2017; Kumar et al., 2012; Lei et al., 2020; Liu et al., 2011). In particular, the improvement could be larger in data-sparse regions, as the model skill without assimilation in data-rich regions such as in the U.S. is generally high owing to abundant ground reference data sets (Kolassa et al., 2017). Similarly, vegetation-related products, such as leaf area index (LAI) can also inform the variations in surface and root zone soil moisture by influencing water uptake and the partitioning of evapotranspiration. Prior studies have shown that assimilating LAI helps to improve the estimation of evapotranspiration, root zone soil moisture, carbon fluxes, and crop yields (Albergel et al., 2017; Barbu et al., 2014; Ines et al., 2013; Kumar et al., 2019b; Mocko et al., 2021; Xie et al., 2017).
In this study, taking the northern part of Morocco as an example, we report on the separate assimilation of soil moisture and LAI into the Noah-MP land surface model (LSM) in a configuration where the input parameters and meteorological forcing data sets are customized for the MENA region. In this region, much of the agricultural lands are dominated by rain-fed agriculture. However, irrigation activities may still play a critical role in altering the root zone soil moisture and the associated energy and carbon fluxes for irrigated areas. The water demand for irrigation may also vary widely in a changing climate that may include persistent droughts (Kharrou et al., 2011). Therefore, we set up LSM simulations both with and without the presence of such human water management. Our objectives are twofold. First, we investigate the overall performance of the data assimilation system by comparing the simulated ET and carbon fluxes with a variety of multi-source remote sensing data sets. Second, we examine the potential of data assimilation for improving the representation of root-zone-soil-moisture-based drought, which serves as an input for the CDI estimates for the MENA region (Bijaber et al., 2018).
2.1 Model configuration
All the simulations are conducted using the Noah-MP LSM, version 4.0.1, implemented within the framework of the NASA Land Information System (LIS; Kumar et al., 2006; open-source software available at https://github.com/NASA-LIS/LISF/, last access: 14 September 2020). Building on the Noah LSM (Ek et al., 2003), the Noah-MP model advances its structure by including multi-physics options for radiation transfer, prognostic phenology, surface water infiltration, runoff, and groundwater schemes. A detailed description of the model and its performance can be found in Niu et al. (2011) and Yang et al. (2011).
Noah-MP is configured with four soil layers with the layer thicknesses, varying from 0.1, 0.3, 0.6, and 1 m, from the surface down to the bottom, making a total of 2 m. Water movement in the soil layers is simulated using the Richards equation. A simple groundwater reservoir beneath the soil layer allows for soil moisture–groundwater interaction and related runoff production. Noah-MP allows for the prognostic representation of vegetation growth, using a prognostic phenology scheme (Dickinson et al., 1998) in combination with a Ball–Berry photosynthesis-based stomatal resistance scheme (Ball et al., 1987; Bonan, 1996; Collatz et al., 1991). It simulates the carbon uptake and allocation among leaf, stem, wood, and root in response to cold and drought stress, thus inferring the seasonal growth of the leaf area and predicting carbon fluxes, such as gross primary production (GPP) and net primary production (NPP). The LAI is calculated from leaf carbon mass by multiplying by the specific leaf area. The greenness vegetation fraction (GVF), which divides a grid cell into a fractional vegetated area and a fractional bare ground area, is derived from LAI based on a simple exponential function. On the one hand, the vegetation photosynthesis rate is partially constrained by water stress through leaf assimilation, which is a function of the soil moisture controlling factor. On the other hand, canopy growth conditions can, in turn, affect moisture partitioning via GVF, thus affecting the partitioning of water and energy fluxes, such as evaporation and transpiration. Given the way Noah-MP represents vegetation phenology, assimilating either surface soil moisture or LAI can alter the soil moisture and vegetation conditions, as well as the partitioning of water, energy, and carbon fluxes.
2.2 Data assimilation configuration
2.2.1 SMAP soil moisture data assimilation (SSM-DA)
This study makes use of the Soil Moisture Active Passive (SMAP) Enhanced Level 3 (L3_E) passive soil moisture estimates derived by the National Aeronautics and Space Administration Jet Propulsion Laboratory (O'Neill et al., 2020). This SMAP L3_E product provides gridded soil moisture retrievals at 06:00 LT (local time; descending) and 18:00 LT (ascending) on a 9 km Earth-fixed grid, along with the ancillary data and quality assessment flags, starting from 31 March 2015. The product has been evaluated against many in situ networks (Cui et al., 2018; Li et al., 2018; Tavakol et al., 2019) and showed a clear spatial variation in performance, with better performance in regions with lower soil wetness, sparse vegetation, and temperate climate (Zhang et al., 2019). The product has also been proved to have higher information content with a capability to detect irrigation signals and improve irrigation simulations in large-scale LSMs (Kumar et al., 2018; Lawston et al., 2017; Felfelani et al., 2018). The bilinear interpolation method is used to regrid the 9 km product to a model space of 0.05∘. The assimilation is performed using a one-dimensional ensemble Kalman filter (EnKF; Reichle et al., 2002), similar to the assimilation strategy employed in Kumar et al. (2014), which allows the updating and propagation of a selected set of model states on the basis of relative uncertainty between the observations and the model ensemble. To address biases between the SMAP retrievals and Noah-MP soil moisture, the SMAP soil moisture estimates are rescaled to the model climatology at a monthly scale for the period 2015–2019, using cumulative density function (CDF) matching (Reichle and Koster, 2004). An ensemble of 20 members is generated by perturbing the meteorological forcing fields and the surface soil moisture state, representing the uncertainty of the model estimates. The temporal correlation of the perturbation was chosen to be 1 d for the forcing fields and 1 h for the surface soil moisture state via a first-order autoregressive model. The observation error standard deviation for the unscaled soil moisture retrievals is set to 0.04 m3 m−3, with a temporal correlation of 1 d, following Kumar et al. (2019a). Moreover, quality control flags were imposed so that we assimilate only data points recommended by the SMAP retrieval quality flag for unfrozen soils with vegetation water content of less than 5 kg m−2. Perturbation bias corrections, following Ryu et al. (2009), were applied to all the perturbed forcing fields and surface soil moisture states to avoid the biases introduced by the nonlinear processes in the model. A summary of the perturbation settings is shown in Table 1.
Table 1Ensemble perturbation parameters in the assimilation simulations.
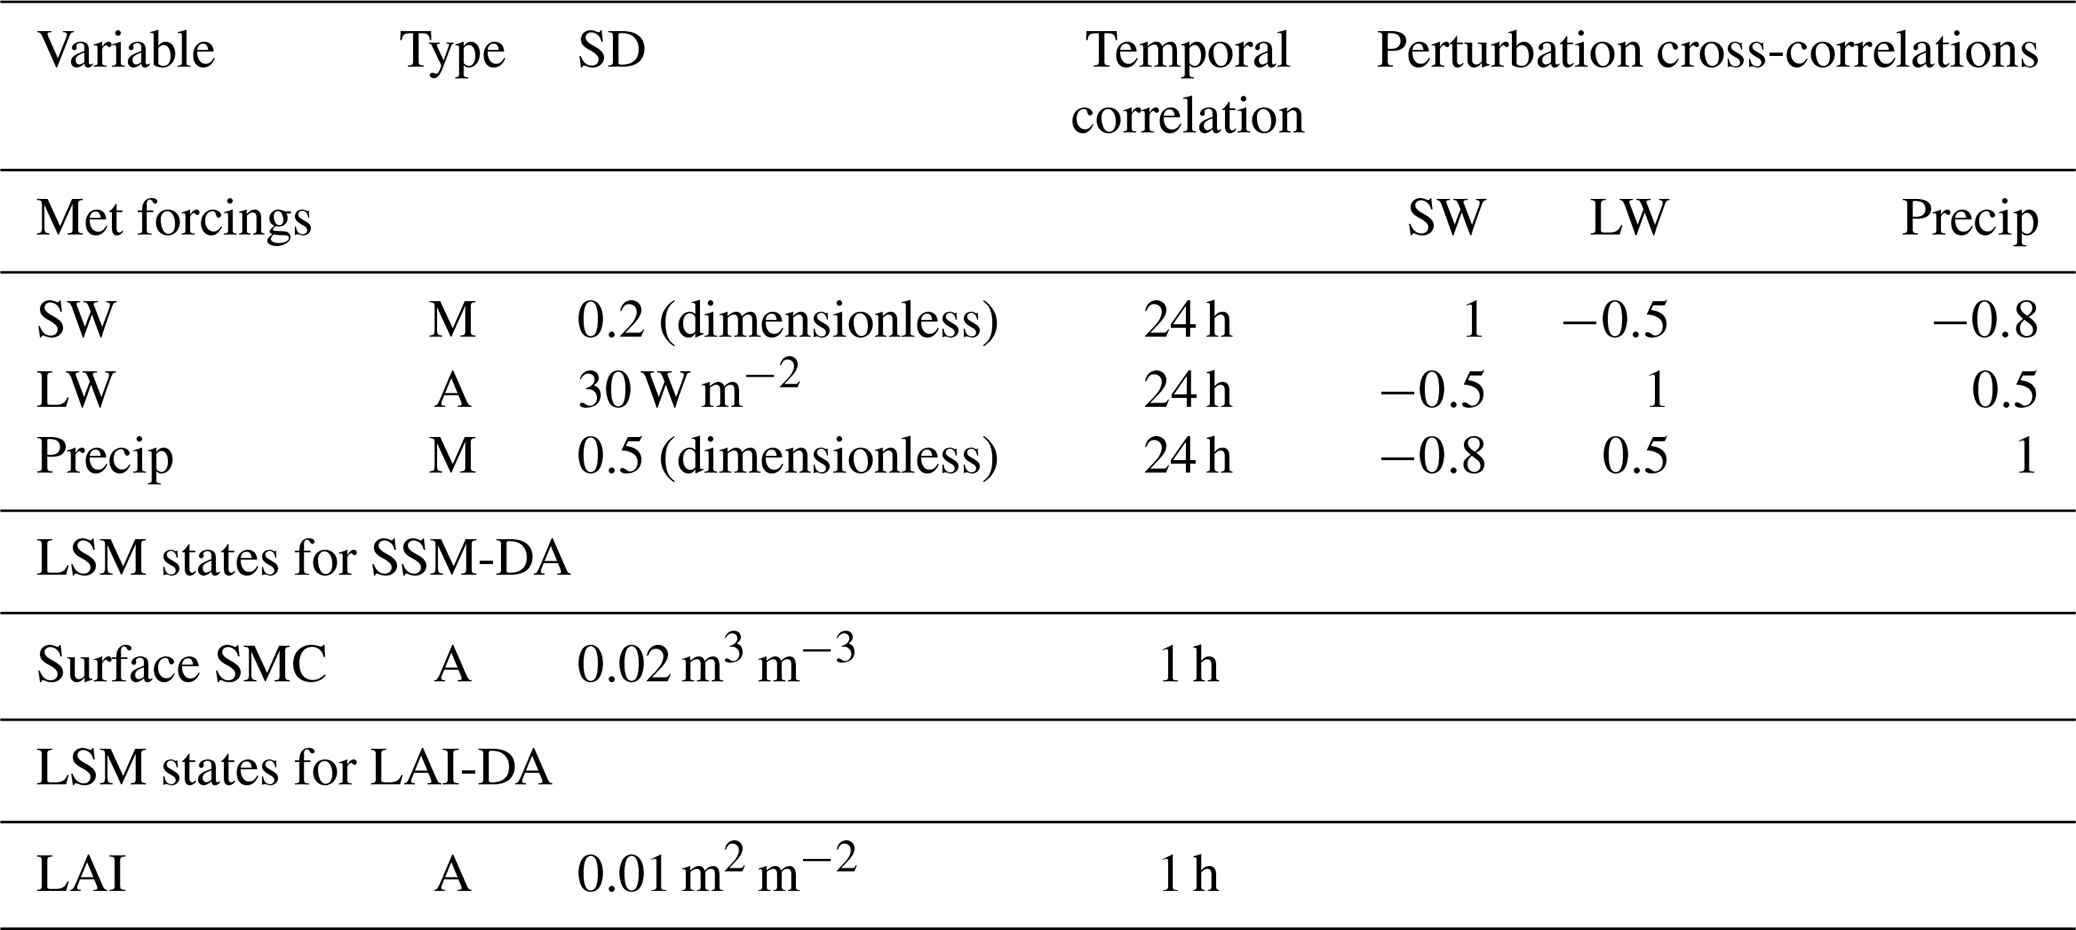
Note: SD is for standard deviation. Multiplicative (M) or additive (A) perturbations are applied to the meteorological (Met) fields, with incident shortwave radiation (SW), incident longwave radiation (LW), precipitation (Precip), and the model states, including surface soil moisture content (SMC) and LAI.
2.2.2 MODIS LAI data assimilation (LAI-DA)
The level 4, 8 d composite LAI product with 500 m pixel size is used for LAI data assimilation, as obtained from the MCD15A2H version 6 Moderate Resolution Imaging Spectroradiometer (MODIS) product, starting from July 2002 (Myneni et al., 2015). The algorithm chooses the best pixel available from all the acquisitions of MODIS sensors located on NASA's Terra and Aqua satellites. This version 6 product has been improved, as compared to previous versions, owing to the advanced input of the surface reflectance product and multiyear land cover product, and is able to provide reliable biophysical information in response to climate (Yan et al., 2016a, b). The averaging upscaling method is used to bring the LAI product into the model resolution of 0.05∘. Similar to the DA configuration for SSM-DA, an ensemble size of 20 members with the same meteorological forcing perturbation settings are set for LAI-DA using the EnKF algorithm. The model state vector in this DA instance only includes the LAI variable. Once the LAI is updated from the assimilation, the leaf carbon mass is updated by dividing LAI with the specific leaf area. Additive perturbation with a standard deviation of 0.01 (–) is applied for both the modeled and observed LAI fields with a temporal correlation of 1 h. A total of two layers of quality control flags are applied to select reliable retrievals prior to the assimilation in order to ensure retrieval quality (MODIS15, 2020), namely the (1) FparLai quality flag MODLAND_QC = 0 (good quality main algorithm with or without saturation) and (2) SFC_QC flag 000 or 001, but those only used the main (RT) algorithm. As cloud gaps often lead to spatial discontinuities in MODIS-based LAI observations, an 8 d climatological data set is used for gap-filling in such instances (Kandasamy et al., 2013). The climatological data are generated using the entire record of LAI retrievals during the period of July 2002–July 2020. The same quality control flags are also applied while generating this climatological data set. Daily LAI observations are generated by linearly interpolating between the 8 d values, and the assimilation is then conducted at a daily time step.
2.3 Irrigation
In order to account for agricultural water use activities and their impact on hydrological and carbon fluxes, we utilize a demand-driven sprinkler irrigation scheme, which was introduced into Noah-MP in Nie et al. (2018), building upon the work of Ozdogan et al. (2010). The irrigation scheme works according to three key rules, including (1) where to irrigate, (2) when to irrigate, and (3) how much to irrigate.
The model's irrigated areas are identified using a composite irrigation fraction map. This irrigation map was generated by combining the following three irrigation data sets: Global Rain-Fed, Irrigated, and Paddy Croplands (GRIPC; Salmon et al., 2015), Global Irrigated Areas (GIA; Meier et al., 2018), and the International Water Management Institute's Global Irrigated Area Map (GIAM; Thenkabail et al., 2009) product. The 500 m GRIPC, 1 km GIA, and the 250 m GIAM products were each aggregated and converted into irrigated areal percentages at the 0.05∘ resolution grid of the study domain, using the Land surface Data Toolkit (LDT; Arsenault et al., 2018). For each 0.05∘ grid cell, the following irrigation criteria were applied, where at least two of the irrigation products had at least 1 % minimum irrigated areal percentage present prior to being averaged into the composited irrigation map. The final composite irrigation fraction map was verified against other imagery (such as Google Earth) and published Morocco irrigation maps (Molle and Sanchis-Ibor, 2019), and it is shown in Fig. 1b. Note that, to avoid a potential mismatch between the land cover type and irrigation fraction, an initial check has been implemented in both LDT and LIS to constrain irrigation within certain land cover types, i.e., mainly the cropland and grassland classes.

Figure 1Map of (a) the major land cover types based on MODIS International Geosphere Biosphere Programme (IGBP) data set and (b) the composite irrigation fraction intensity for Morocco.
The timing of irrigation – the growing season – is determined as the time period when GVF is greater than a certain threshold. In the original Ozdogan et al. (2010) implementation, the irrigation onset is specified based on a prescribed GVF monthly climatology data set. However, using a prescribed GVF profile is no longer suitable when the prognostic phenology module is enabled, as this may introduce inconsistency between the prescribed GVF data set and the prognostic phenology-informed GVF. In this study, we modified the modeling system by passing the prognostic phenology module simulated GVF to the irrigation scheme so that the growing season (during which irrigation occurs) is informed by the prognostic vegetation conditions, which could be impacted by both soil moisture and LAI data assimilation. This is critical for places with intensely irrigated agriculture as the interaction between the irrigation scheme and the prognostic phenology scheme, and data assimilation enables the model to simulate the interannual variability in irrigation water use, which can directly affect the soil moisture and indirectly affect vegetation growth through the water stress factor. Once the irrigation is triggered, the irrigation water amount is calculated as the volume required to bring the root zone soil moisture deficit up to field capacity, allowing the vegetation to operate without transpiration stress. The depth of the effective root zone used for calculating irrigation water requirements varies with time, which is a function of GVF and a crop-type-dependent parameter, i.e., maximum root depth. Note that such assumptions for irrigation scheduling may be subject to uncertainties, as it is generally based on farmers' decision-making processes instead of the soil moisture deficit approach, but these are generally unknown for data-limited regions at such large scales. Moreover, this study does not account for irrigation source water partitioning, due to limited in situ observational data for model calibration. This might affect the simulation of surface and groundwater storage variations and deep soil–groundwater interaction, such as capturing groundwater depletion in major aquifers due to excessive groundwater use (Hssaisoune et al., 2020). The influence and impact on the deeper groundwater components are ignored here, as the current study is focused on improving soil-moisture-based drought estimation.
2.4 Experiment design
In order to study the impacts of SSM-DA and LAI-DA in simulating the modeled water, energy, and carbon fluxes and the impacts of irrigation on the data assimilation performance, two sets of experiments, each including an open loop (OL) run and two data assimilation runs (with and without irrigation), are performed over northern part of Morocco (Fig. 1a). The model runs are conducted at 0.05∘ spatial resolution, with a 15 min time step, and the duration of the integrations varies depending on the availability of the observations to be assimilated. A 57-year spin-up simulation was performed (three times over the period of 2000–2019) to provide the initial conditions for the two sets of experiments. A summary of the simulations is shown in Table 2.
Table 2Summary of the simulations.
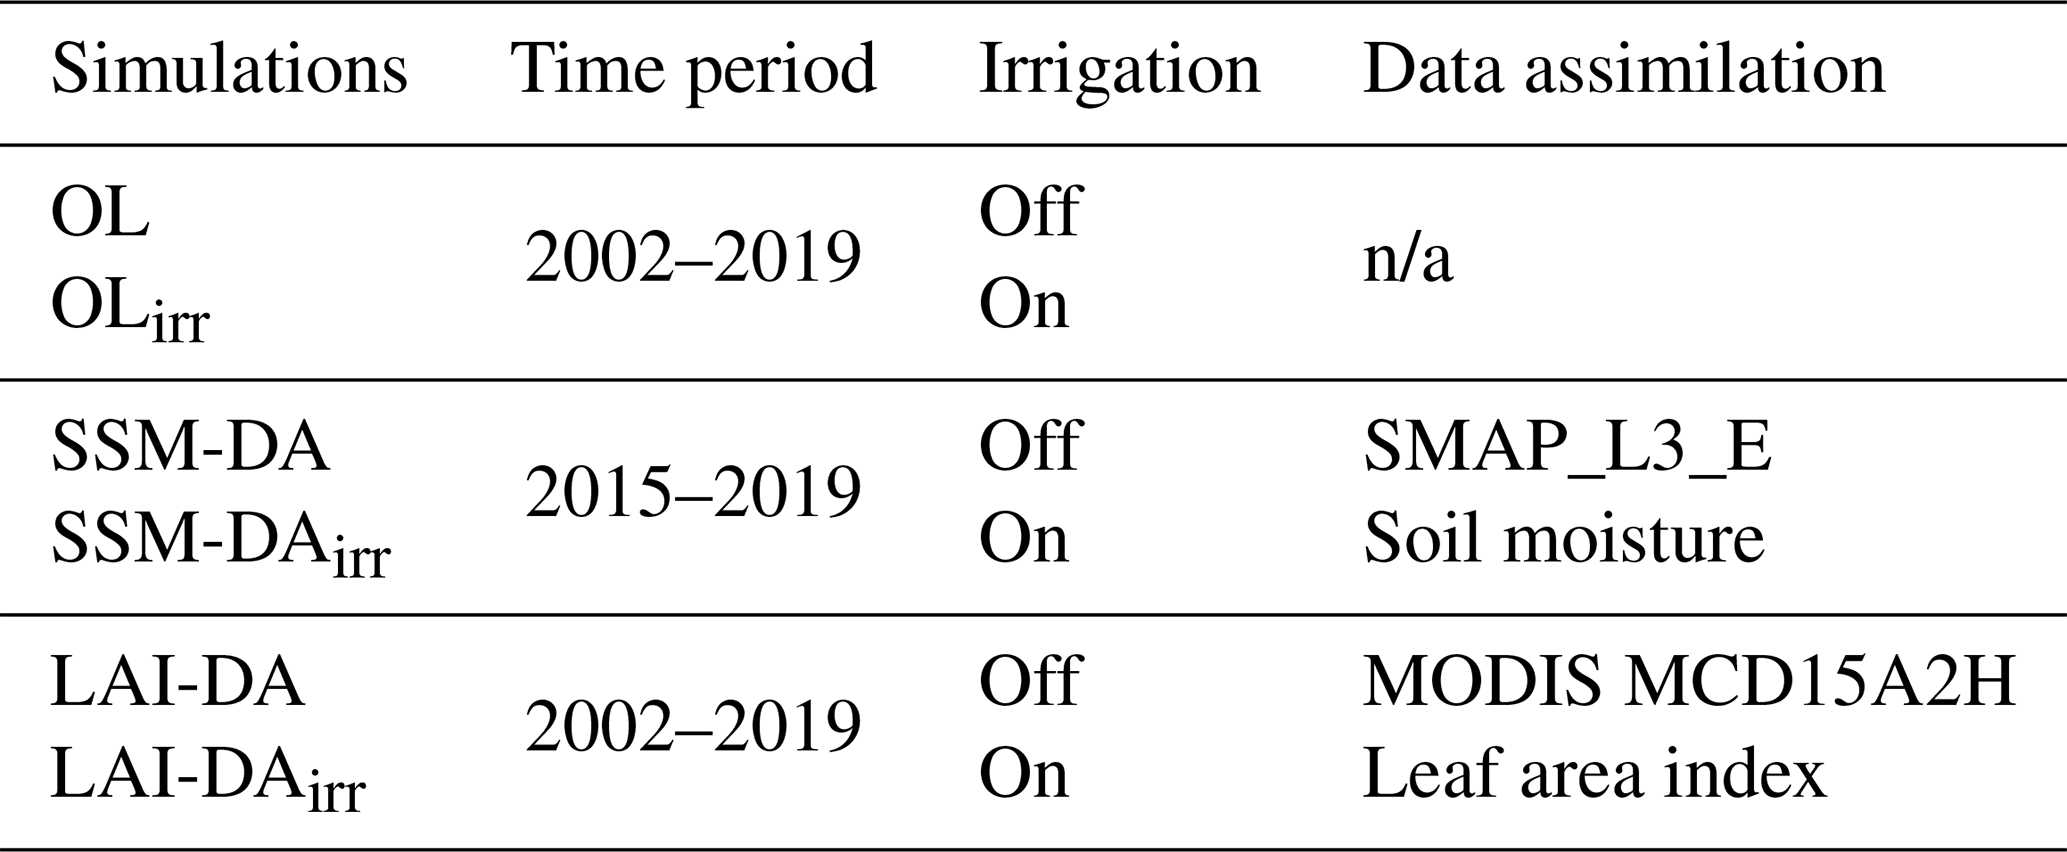
n/a stands for not applicable.
Open loop experiments (OL and OLirr). The model is run for the period 2000–2019 without assimilating any observations. Irrigation is turned off for OL and on for OLirr, with the prognostic GVF simulated by the prognostic phenology module informing the timing for irrigation in OLirr. Several sensitivity tests are performed to determine the best set of irrigation parameters to capture the general growing season for Morocco according to the report of Global Information and Early Warning System on Food and Agriculture (GIEWS) from the Food and Agricultural Organization of the United Nations (FAO). The OL represents the baseline of the model skill customized for the study domain against any potential skill improvements from assimilating either SMAP soil moisture estimates or MODIS LAI retrievals. Comparison between OL and OLirr enables us to investigate the impact of irrigation when interacting with the prognostic phenology module.
SMAP-based soil moisture assimilation (SSM-DA and SSM-DAirr). In the SSM-DA and SSM-DAirr experiment, SMAP L3_E soil moisture estimates are rescaled based on the climatology of OL and OLirr, respectively, and are then assimilated into Noah-MP for the time period of March 2015–December 2019. Irrigation is turned off for SMAP-DA and on for SMAP-DAirr. Assimilating soil moisture may affect the irrigation frequency and amount by altering the surface and root zone soil moisture condition, as it may change the timing when the threshold of root zone soil moisture condition is reached, which serves as a check to determine whether this area is dry enough to be irrigated.
MODIS-based LAI assimilation (LAI-DA and LAI-DAirr). In the LAI-DA and LAI-DAirr experiments, the gap-filled and interpolated LAI retrievals are assimilated into Noah-MP during the time period of 2002–2019. Irrigation is turned off for LAI-DA and on for LAI-DAirr. LAI-DAirr may affect irrigation in a different way as compared to SSM-DAirr, as the observed LAI may alter the magnitude and phase of the vegetation conditions. The changes in LAI affect the evolution of GVF, which serves to determine the growing season during which irrigation occurs. It may also indirectly affect the irrigation frequency and magnitude by influencing the root zone soil moisture, which in turn alters the level of transpiration under different vegetation growth conditions.
All simulations are forced by the combination of two surface meteorology data sets, with the Integrated Muti-satellitE Retrievals for Global Precipitation Measurement (IMERG; Huffman et al., 2015) near-real-time early run providing the precipitation data and the National Oceanic and Atmospheric Administration (NOAA)'s Global Data Assimilation System (GDAS; Derber et al., 1991) providing the remaining data set of meteorological fields, including 2 m air temperature, 2 m specific humidity, 10 m wind speed, surface pressure, and incoming shortwave and longwave radiation. Both lapse rate and slope-/aspect-based topographical corrections are applied to the input meteorology to represent topographic influences on temperature, humidity, pressure, and radiation. The model parameters include the Moderate Resolution Imaging Spectroradiometer International Geosphere Biosphere Program (MODIS-IGBP; Friedl et al., 2010) land cover data set (1 km), the machine-learning-based 250 m soil property and class data set generated at the International Soil Reference and Information Centre (ISRIC; Hengl et al., 2017), and the Shuttle Radar Topography Mission elevation at 30 m (Farr et al., 2007). All parameter data sets are resampled to the model resolution of 0.05∘, using LDT, as noted above.
The assessment for these experiments is organized as follows to serve the scientific objectives for this study: (1) we compare the differences in modeling skill among OL, SSM-DA, and LAI-DA by evaluating the fluxes with the available reference data sets within the overlapping period (2015–2019), (2) we then exclude SSM-DA and extend the evaluation for OL and LAI-DA for a longer time span (2003–2019), (3) we investigate the irrigation impact and its interaction with the prognostic phenology informed by data assimilation by comparing OL, OLirr, SSM-DAirr, and LAI-DAirr, and (4) we quantify the differences in categorizing drought among OL, SSM-DA, and LAI-DA.
2.5 Evaluation data and metrics
Multi-source remote-sensing-based observations covering different periods of time are used to assess the overall model performance, including ET and its components of NPP, GPP, and Sun-induced chlorophyll fluorescence (SIF).
2.5.1 FAO WaPOR data sets
The FAO portal to monitor Water Productivity through Open access of Remotely sensed derived data (WaPOR) provides estimates of evapotranspiration (ET) and its components, including bare soil evaporation (E), transpiration (T), and interception for Africa and the Middle East from 2009 onwards at dekadal time steps at three different spatial resolutions (250, 100, and 30 m) with different spatial coverage. It also provides yield-related variables, such as net primary production and total biomass production. WaPOR estimates E and T, using a modified version of the Penman–Monteith equation (FAO, 2020), with input from weather, land cover, normalized difference vegetation index (NDVI), and soil moisture stress from other sources. The weather data are obtained from the Modern-Era Retrospective analysis for Research and Applications (MERRA) up to the start of 21 February 2014 and the Goddard Earth Observing System (GEOS-5) after 21 February 2014 (Rienecker et al., 2011) in combination with the Climate Hazards Group InfraRed Precipitation with Station data (CHIRPS; Funk et al., 2015). Unlike the original ETLook model (Bastiaanssen et al., 2012), in which soil moisture stress is derived from passive microwave data, WaPOR advances the estimation of soil moisture stress by using MODIS-based land surface temperature. For the NPP estimation, besides the input for ET, the fraction of photosynthetically absorbed radiation by green vegetation (fAPAR) is also needed, which is obtained from MODIS. Note that effects, such as nutrient deficiencies, pests and plant diseases are not considered in the calculation of the WaPOR NPP, which is also true for Noah-MP-simulated NPP. Among many ET products with global coverage and different levels of uncertainties, WaPOR data sets are reported to have low biases and good spatial variability across Africa (Blatchford et al., 2020; Weerasinghe et al., 2020).
In this study, we compare the model-simulated ET, E, T and NPP to the corresponding level 1 (250 m) WaPOR data sets (https://wapor.apps.fao.org/home/WAPOR_2/1, last access: 3 July 2020), for the northern part of Morocco. The availability of E and T provides an opportunity to explore the contribution of data assimilation on different components of ET, as the updated fields by SSM-DA and LAI-DA may affect E and T in different ways. All the fields are spatially and temporally aggregated to 0.05∘ and a monthly scale, respectively, for analysis between WaPOR data sets and the simulations.
2.5.2 FLUXCOM and FLUXSAT GPP
The impact of LAI-DA on carbon fluxes is also evaluated by comparing the simulated GPP against the GPP product from the FLUXCOM (Tramontana et al., 2016) and FLUXSAT (Joiner et al., 2018) projects. The FLUXCOM project uses machine-learning-based regression tools to upscale daily carbon flux estimates from flux tower sites into global gridded GPP estimates covering the period of 2003–2015. The predictor variables required by the machine learning algorithms are based exclusively on high-resolution remote sensing data, including MODIS-based land cover and vegetation information and ERA-Interim meteorological forcing variables. As there is no flux tower site over the study domain and FLUXCOM products do not cover the SMAP period, we also utilize the recently developed FLUXSAT GPP estimates, which are available from 2000–2020. Unlike many light-use-efficiency (LUE)-based models, the FLUXSAT GPP estimates do not use an explicit parameterization of LUE that reduces its value from the potential maximum under limiting conditions such as temperature and water stress. Although the algorithm is relatively simple, FLUXSAT took advantage of satellite-based SIF data to identify areas of high productivity and has been shown to perform comparatively well compared to the FLUXCOM product. Similar to the comparison against WaPOR data, we aggregate both products to monthly means at 0.05∘ spatial resolution for evaluation.
2.5.3 GOME MetOp-A SIF
Satellite-based Sun-induced chlorophyll fluorescence provides a new opportunity to monitor GPP for terrestrial ecosystems. As part of the vegetation photosynthesis process, the variation in SIF emitted by plants can be used to infer the actual functional state of the photosynthetic apparatus, since photosynthetic efficiency affects the efficiency of the fluorescence emission (Rossini et al., 2015). In this study, the latest version (v28) of the monthly SIF product from the Global Ozone Monitoring Experiment-2 (GOME-2) aboard the MetOp-A satellite (Guanter et al., 2014; Joiner et al., 2013), from the period of February 2007 to February 2019, is used to investigate its correlation with simulated GPP. Simulations are aggregated to 0.5∘ spatial resolution and averaged to monthly means for comparison.
2.5.4 Evaluation metrics
Statistical skill metrics include the Pearson's correlation (R) and anomaly correlation (anomaly R) coefficients, based on a monthly time series with 95 % significance tested using Fisher's z transform test (Fisher, 1921), the root mean square difference (RMSD), and bias (bias) with 95 % significance tested by the paired-sample t test with the temporal correlation being accounted (Entekhabi et al., 2010). The anomaly R is calculated by removing the seasonal cycle from the time series, where the seasonal cycle is calculated as the multiyear average of each calendar month. R and anomaly R are used to examine the overall mismatch between the observations and simulations in terms of seasonality and interannual variability, respectively, while RMSD and bias provide information on how the simulations capture the magnitude of the fluxes. For the evaluations conducted without SSM-DA involved, the longer time window (i.e., 2003–2019) allows us to further investigate how the simulations capture the interannual variability for each specific month. In these cases, R and RMSD are calculated for each month, separately, for a given time period, depending on the observation-based data set (e.g., 2009–2019 for WaPOR ET, E, T, and NPP data sets). Correlation coefficients (R and anomaly R) are not additive measures and, thus, cannot be simply averaged; thus the median was computed as an evaluation score to represent the averaged performance for the full domain or for the actively irrigated area. In addition, these analyses are stratified by major land cover types and different levels of irrigation intensity in order to quantify the impact of land cover types and irrigation intensity on the performance of data assimilation.
3.1 SMAP period evaluations
3.1.1 For the full domain
The four metrics (R, anomaly R, RMSD, and bias) were computed between the simulated monthly fluxes and the corresponding reference data sets for the period 2015–2019, as the SMAP soil moisture retrievals are available starting from March 2015. Simulated E, T, ET, and NPP are compared against FAO WaPOR data sets, while simulated GPP is compared against FLUXSAT GPP estimates.
Table 3 shows the overall performance for the OL, LAI-DA, and SSM-DA simulations (no irrigation applied), and Fig. 2 demonstrates the differences between the DA simulations and OL masked using the applied significance test. For evaporation, assimilating soil moisture and LAI led to opposing impacts in terms of R. Slight degradations are found in LAI-DA (0.37), as compared to OL (0.38), while there is small improvement from SSM-DA (0.46). Nonetheless, the differences are only significant for a few grid cells in terms of both R and anomaly R, suggesting that both forms of data assimilation have limited impacts on the temporal variability in evaporation (Fig. 2a, f, k and p). Over this region, all simulations produce much larger evaporation than the FAO WaPOR estimation, and the differences among the simulations are relatively small in terms of both RMSD and bias.
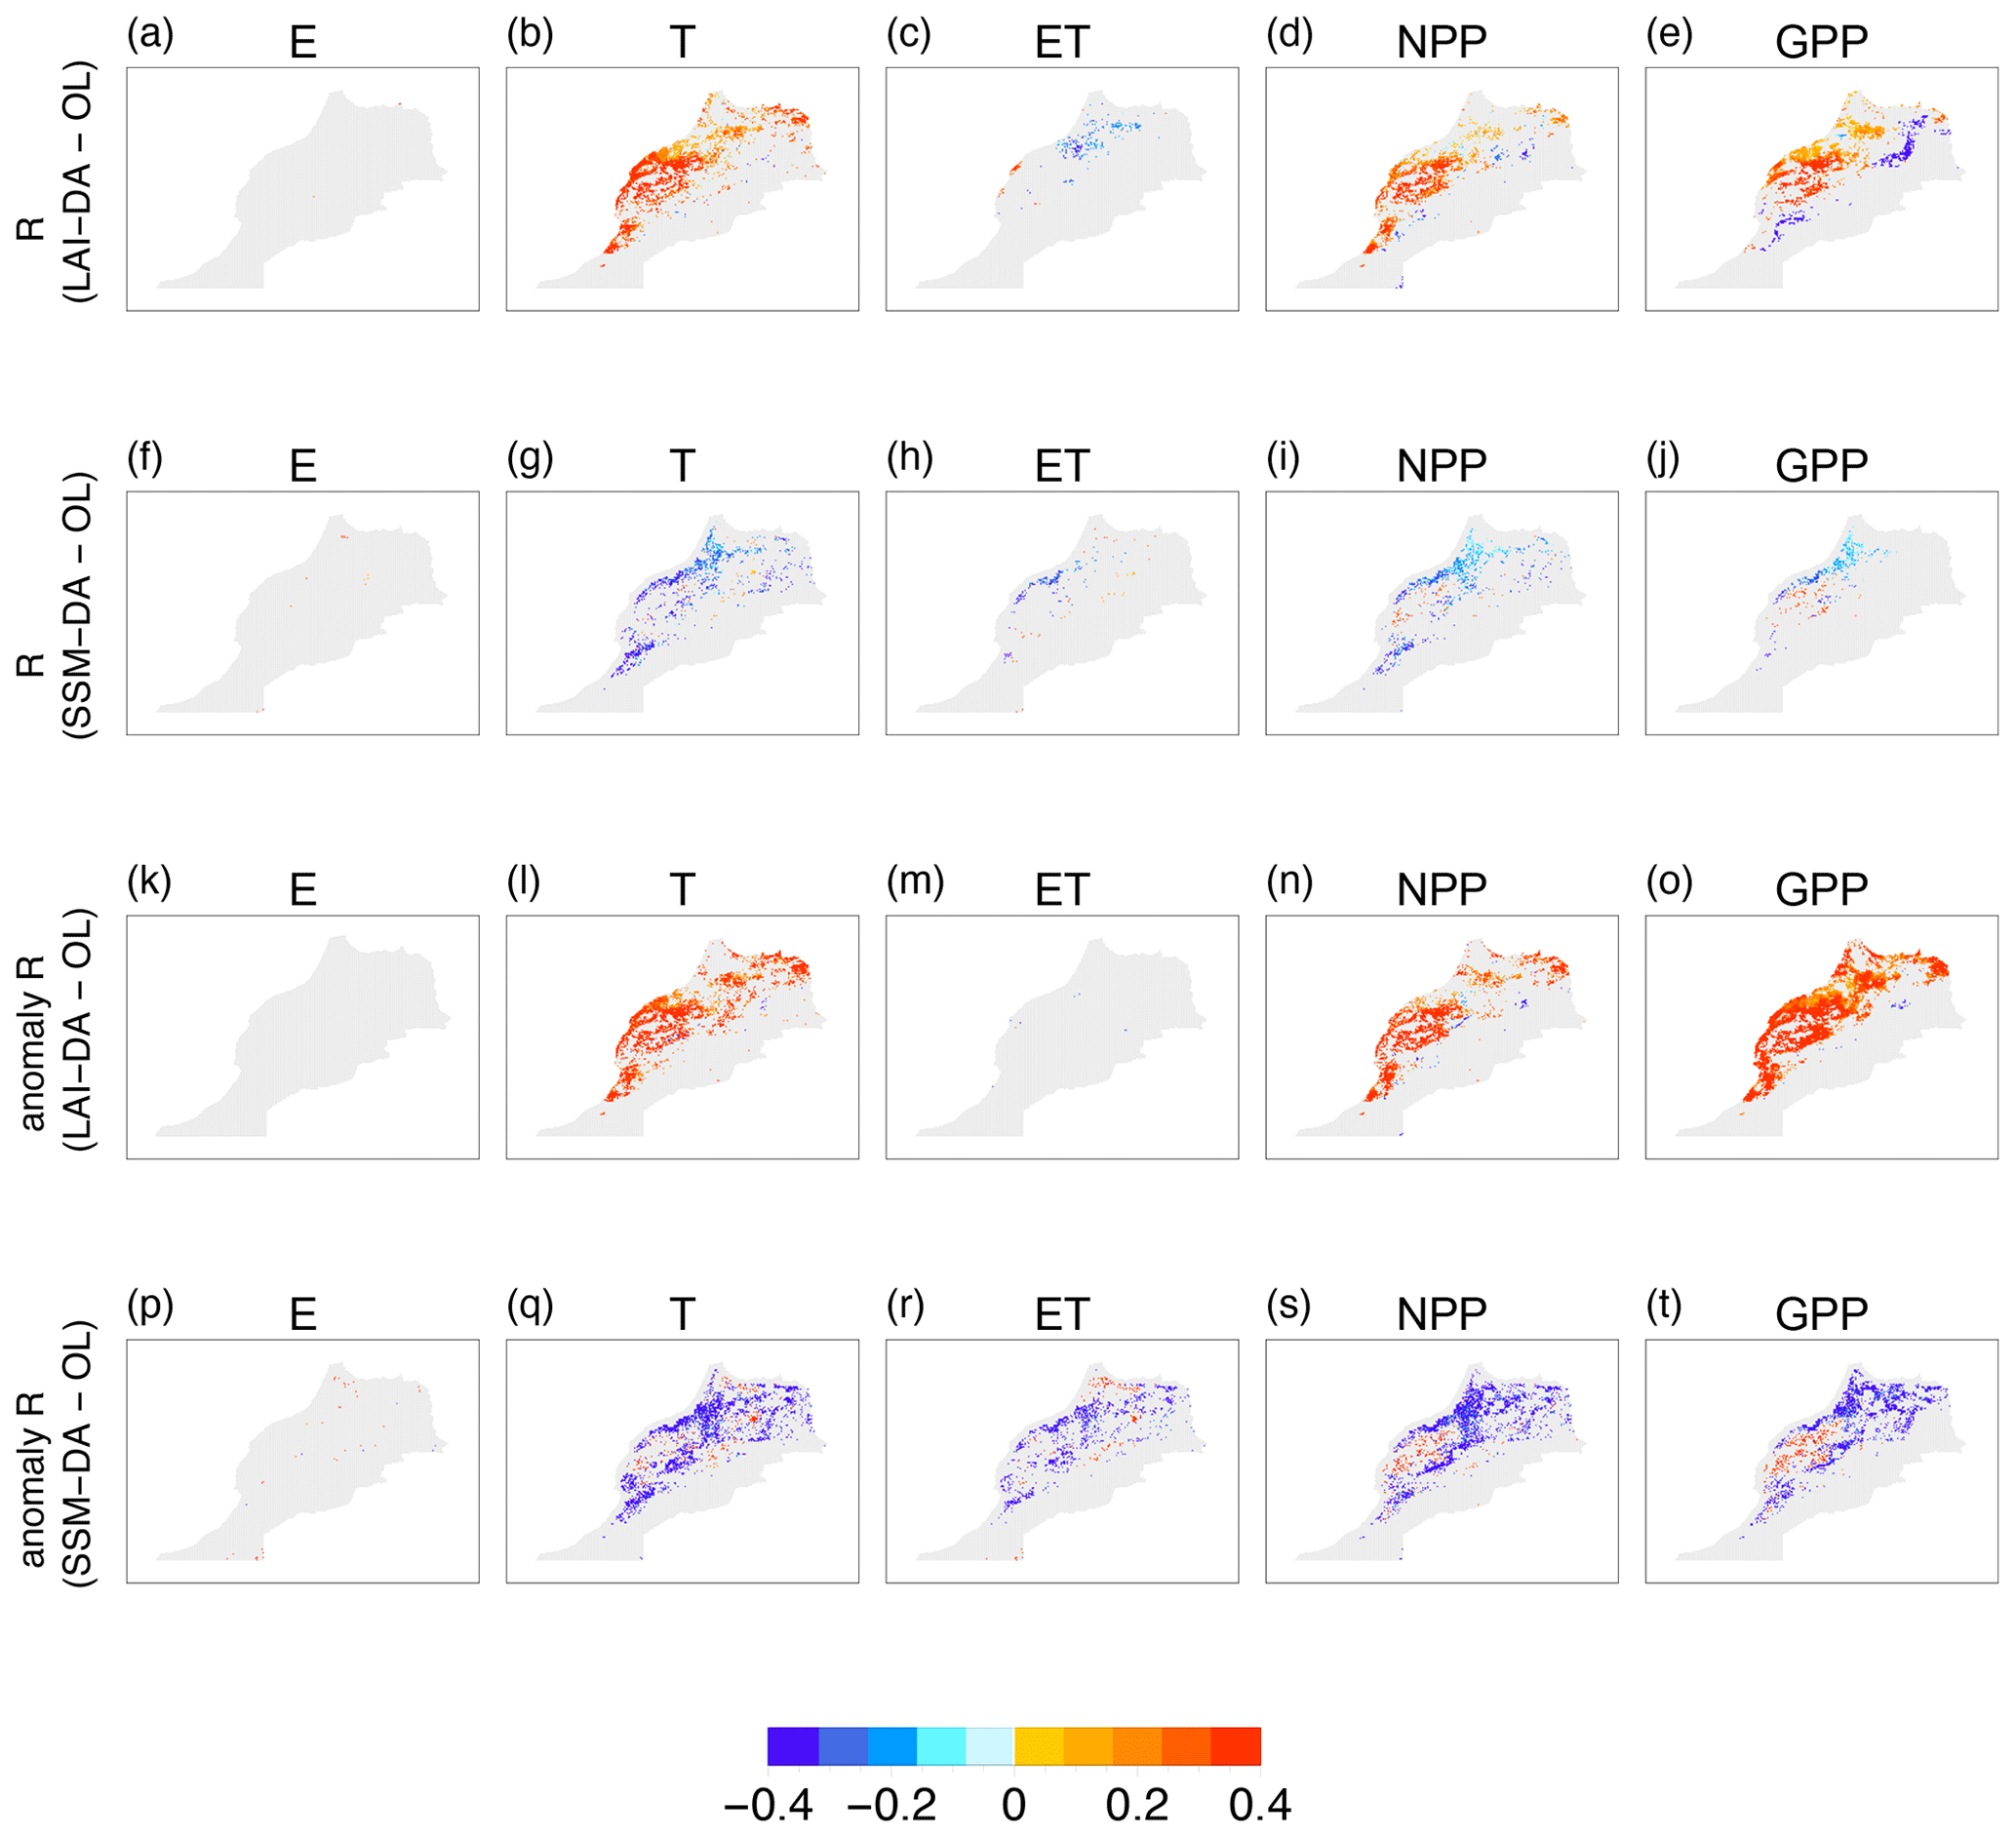
Figure 2The difference in correlation (R), computed as DA minus OL for the period of 2015–2019, for (a–e) LAI-DA and (f–j) SSM-DA simulations in terms of evaporation (E), transpiration (T), evapotranspiration (ET), net primary production (NPP), and gross primary production (GPP). Panels (k)–(t) are the same but for the difference in anomaly correlation (anomaly R). Red colors indicate that the assimilation improves R or anomaly R, with respect to the OL, and blue colors indicate a degradation at 95 % significance level using Fisher's z transform test.
Table 3Median evaluation metrics of monthly correlation (R), anomaly correlation (anomaly R), RMSD, and bias for the OL, LAI-DA, and SSM-DA simulations against FAO WaPOR data sets for evaporation (E), transpiration (T), evapotranspiration (ET), net primary production (NPP), and against the FLUXSAT data set for gross primary production (GPP) for the period of 2015–2019 over the Morocco domain.
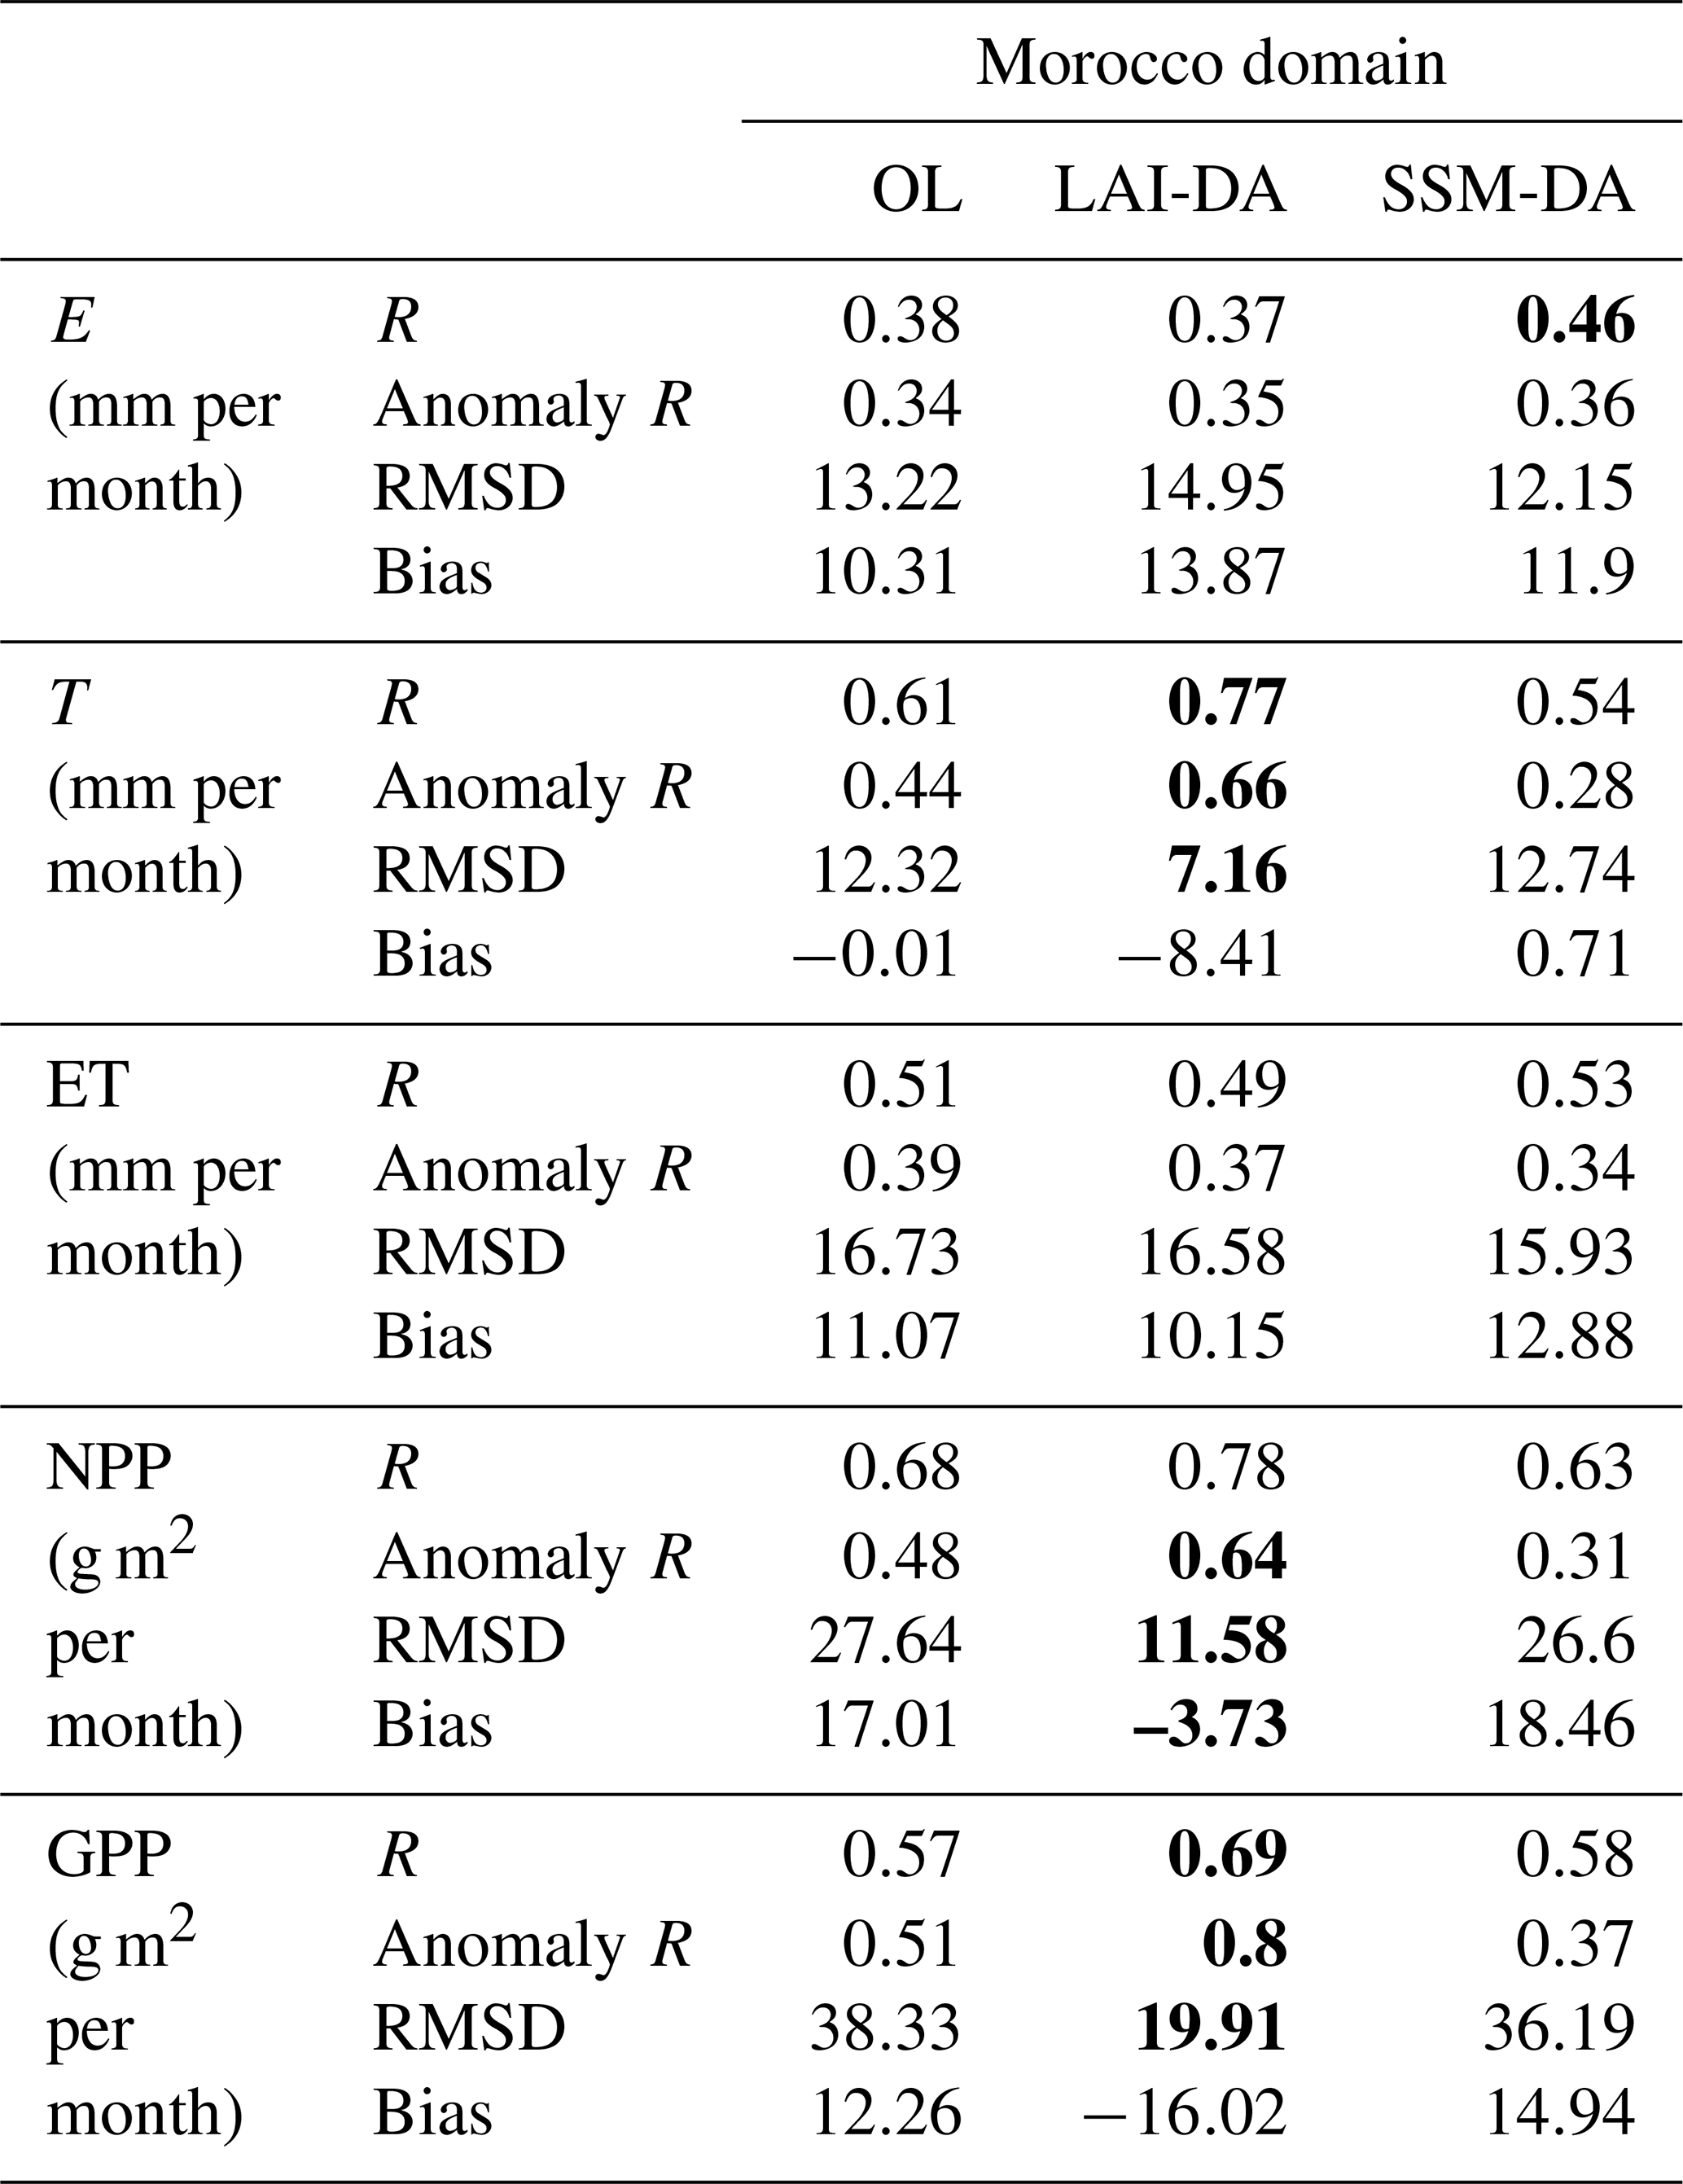
Bold font indicates a median improvement over 20 %.
The simulated temporal variation for transpiration agrees better with the WaPOR estimates than that for evaporation, as the overall R and anomaly R for T are much higher than that for E in the OL simulation. For transpiration, assimilating LAI greatly improved both R and anomaly R (Fig. 2b and l) and reduced RMSD with a relative improvement of over 20 % as compared to OL (Table 3). These positive impacts are mainly located in the vegetated northwestern part of Morocco. However, SSM-DA failed to provide any skill in simulating transpiration, as it led to degradation in terms of both R and anomaly R. LAI-DA tends to reduce the magnitude of transpiration, leading to larger negative bias, possibly contributed to by the smaller LAI magnitude in the observations as compared to that simulated by OL.
As LAI-DA and SSM-DA differ in altering the temporal variation and the magnitude of evaporation and transpiration, the impact on total ET is quite mixed. In general, for LAI-DA, improvements were found along the western coastal area, and degradations were found along the northeastern coastal area in terms of R, while there is no significant impact in terms of anomaly R (Fig. 2c and m). For SSM-DA, the degradation in the seasonality of ET is limited to the northwestern coastal area, while the degradation in interannual variability expands almost over half of the study domain (Fig. 2h and r) and is mainly contributed by the degradation in transpiration. The mixed impact of LAI-DA and SSM-DA on ET is also affected by the ratio of . For instance, regions with ET dominated by T, such as croplands, can better benefit from LAI-DA for ET as it has a strong positive impact on T by correcting for the magnitude and phase of vegetation conditions.
The impact of LAI-DA and SSM-DA on NPP and GPP is similar to their respective impacts on transpiration. LAI-DA led to significant improvements on the two carbon fluxes in terms of R, anomaly R, and RMSD, while SSM-DA resulted in overall degradation. Consistent with its impact on T, LAI-DA tends to reduce the magnitude of both NPP and GPP as compared to OL, but the absolute bias is reduced for NPP as compared to FAO WaPOR, while bias is increased for GPP as compared to FLUXSAT. We note that both FAO WaPOR and FLUXSAT data sets are remote-sensing-model-data-driven products and are thus subject to uncertainties. However, the consistent results obtained by comparing the carbon fluxes against the two independent data sources highlight the benefit of assimilating LAI into the system.
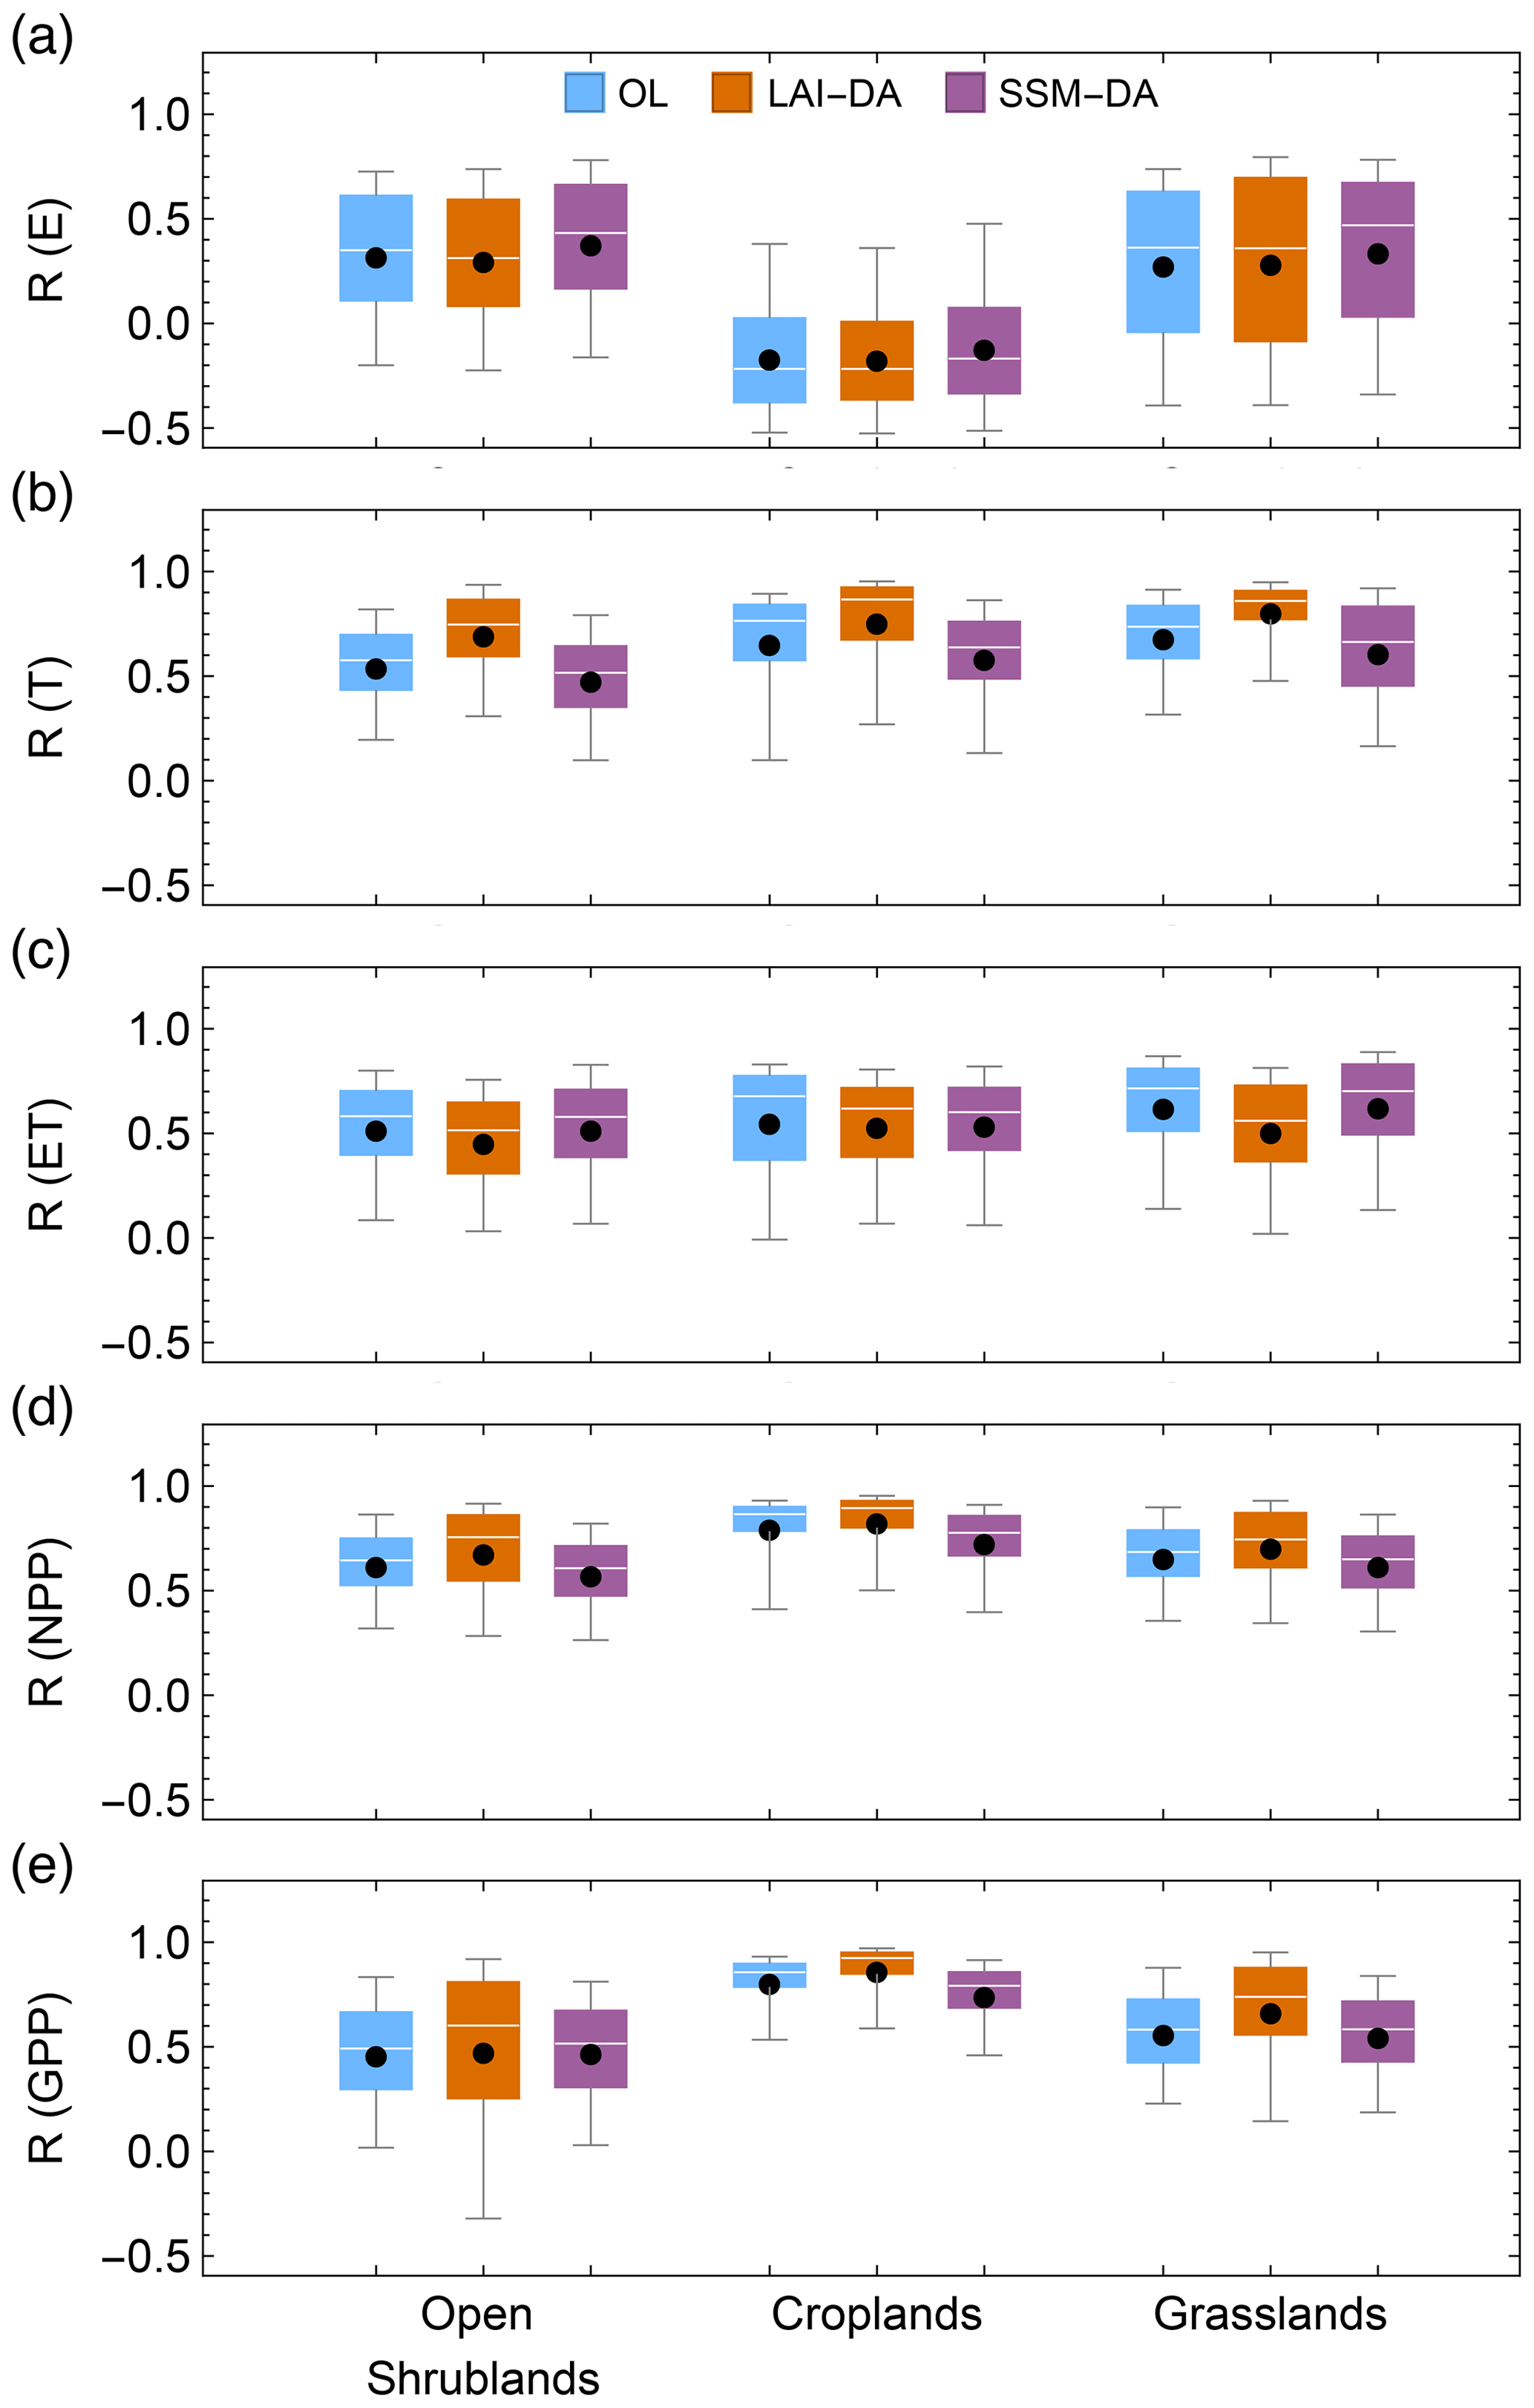
Figure 3Box plots of the correlation for (a) evaporation (E), (b) transpiration (T), (c) evapotranspiration (ET), (d) net primary production (NPP), and (e) gross primary production (GPP) stratified by the major land cover classifications for the OL, LAI-DA, and SSM-DA simulations for the period of 2015–2019. White lines represent the median, boxes represent the upper and lower quantiles, black whiskers represent the 5th and 95th percentiles, and black dots represent the mean values.
3.1.2 Stratified by land cover types
For semi-arid and arid environments such as Morocco, land cover can be quite heterogeneous with interspersed agricultural and natural vegetated areas. Therefore, land cover may play a large role in affecting the quality of the satellite-derived soil moisture and LAI estimates, thus affecting the data assimilation results. In this section, we analyze the impact of land cover on the performance of data assimilation in depth. In total, three major land cover types are selected for the analyses, which are open shrublands, croplands, and grasslands and cover almost all the vegetated areas of Morocco (Fig. 1a).
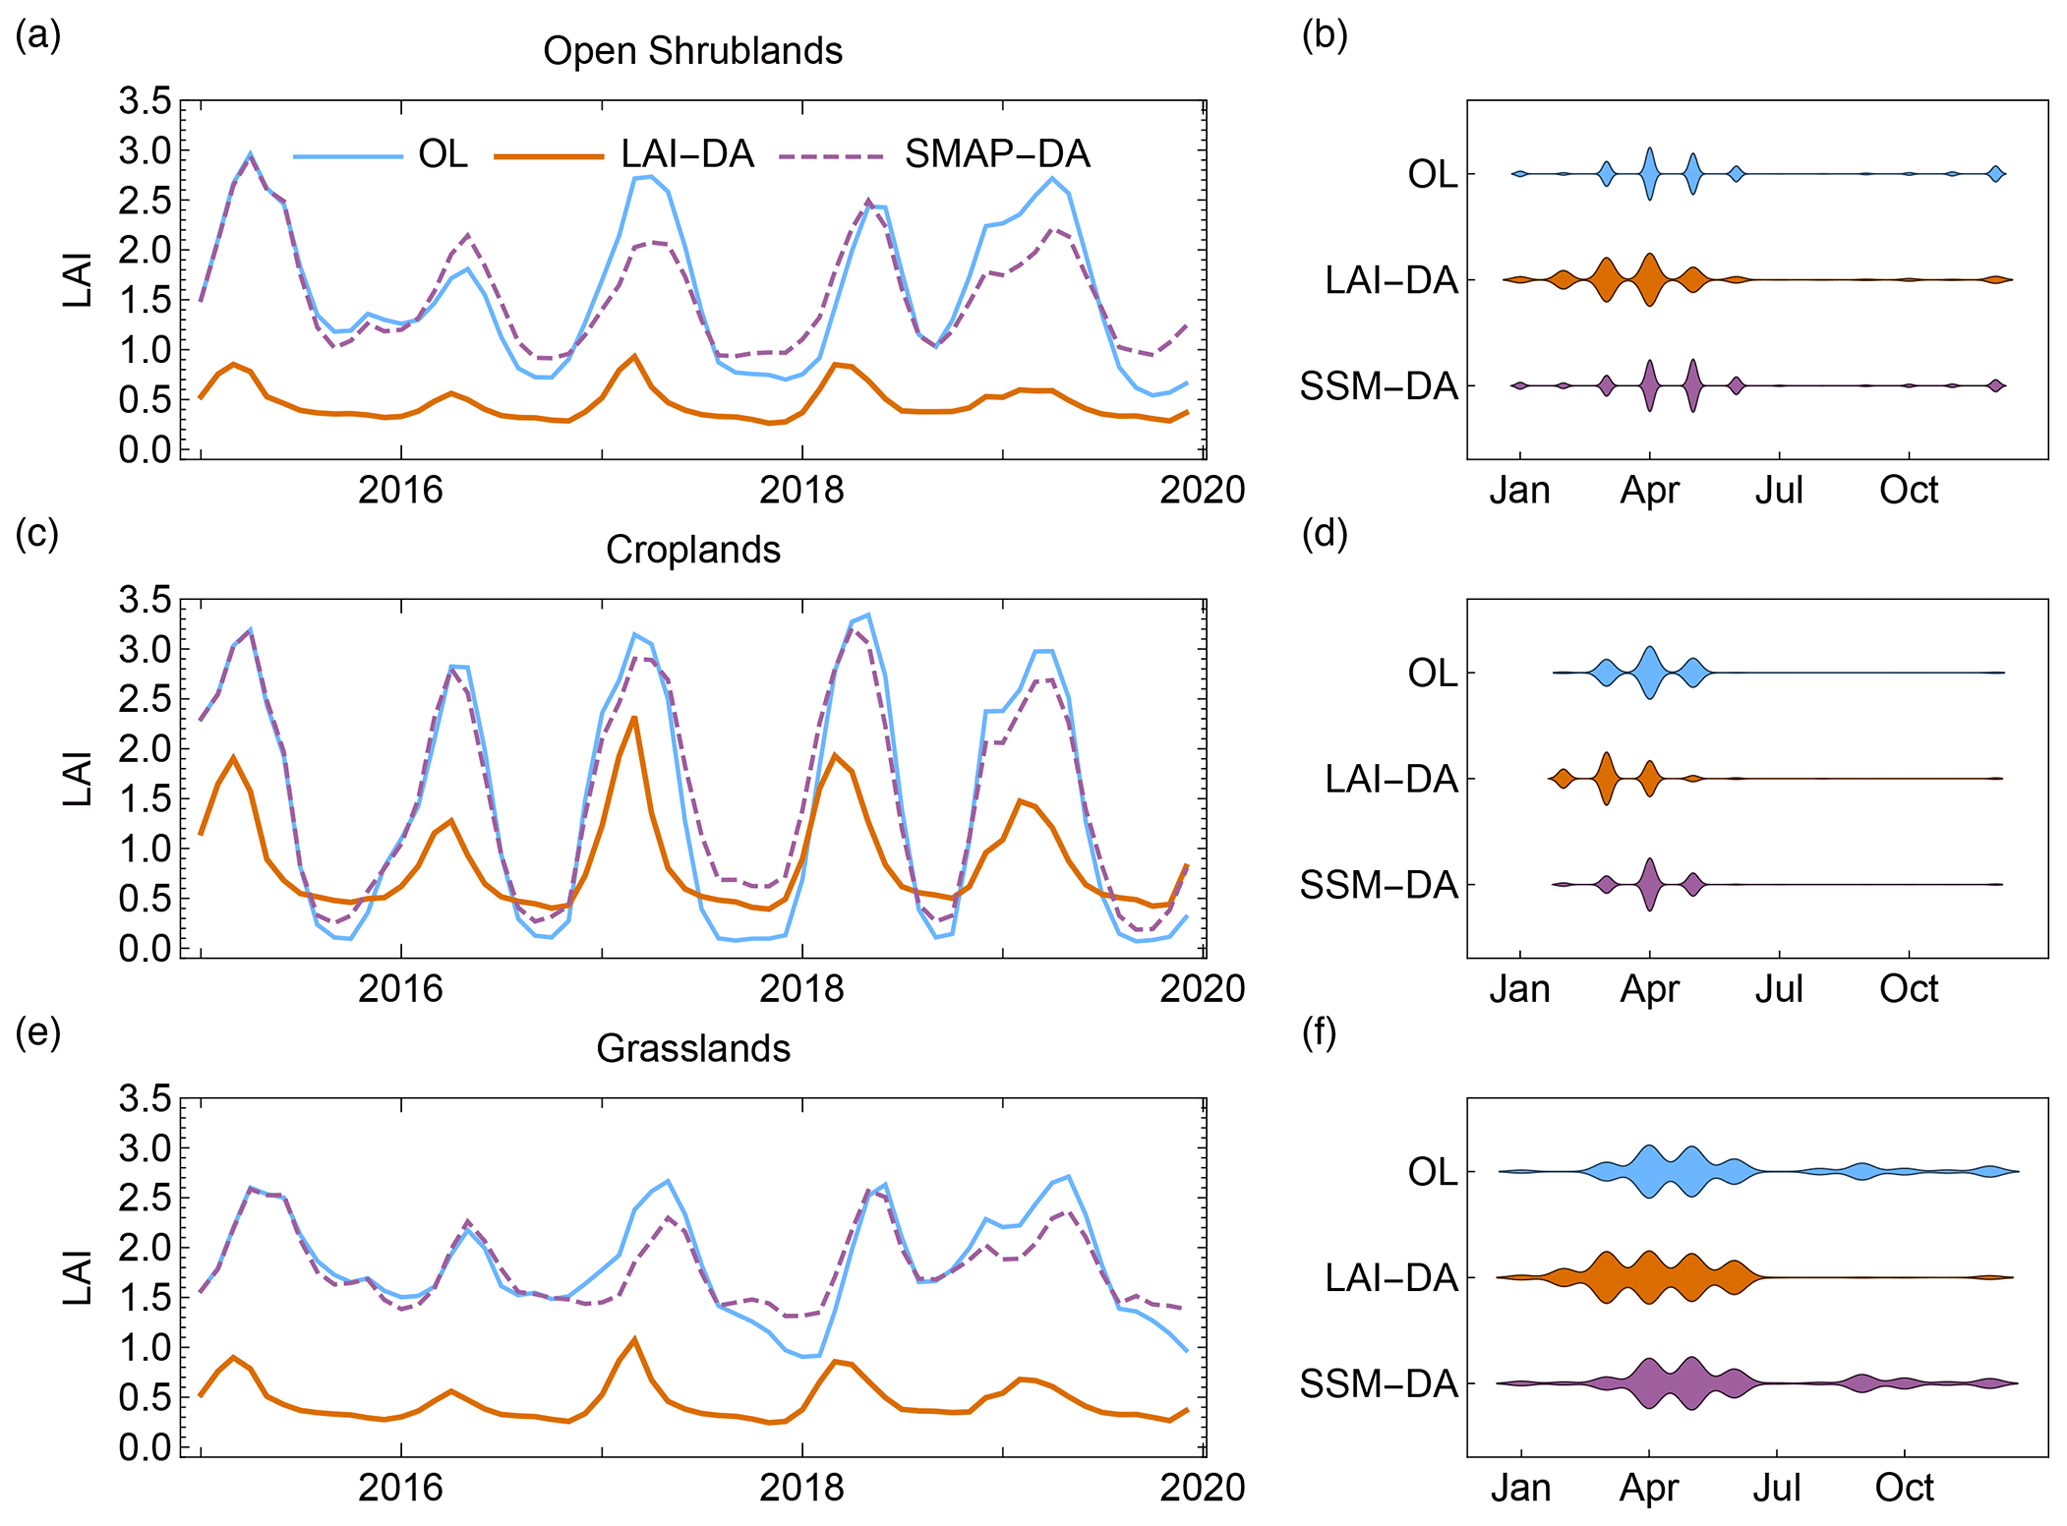
Figure 4Monthly time series of LAI estimated from OL, LAI-DA, SSM-DA, and the corresponding distribution of peak LAI month for (a, b) open shrublands, (c, d) croplands, and (e, f) grasslands.
As shown in Fig. 3, the model demonstrates better skill in simulating evaporation for open shrublands and grasslands than for croplands. However, the situation is the opposite when it comes to carbon fluxes. OL produces a much higher correlation for both NPP and GPP for croplands. The relative performance for the OL, LAI-DA, and SSM-DA simulations is similar across the three major land cover types. LAI-DA led to slight improvements in T and NPP and slight degradations in E, whereas SSM-DA does the opposite. The overall correlation of ET is increased over croplands with LAI-DA, partly because the magnitude of T (17.8 mm per month) is comparable to E (17.4 mm per month) so that the degradation on evaporation has limited impact on its skill in improving ET. Conversely, for open shrublands and grasslands, the benefits of LAI assimilation for transpiration are much weaker than that for croplands, as the magnitude of the ratio is lower than 30 % for both land cover types. Therefore, LAI-DA does not provide comparable skill in improving ET. The impact of SSM-DA on the ET components is limited. On the one hand, this may result from the coarse spatial resolution of the SMAP data set, as it cannot provide information for finer-scale soil moisture variability. On the other hand, it could also be possible that the improved soil moisture condition in SSM-DA is not effectively converted to improved ET because of the weakness in model representation of ET and soil moisture coupling. This is an known issue for many land surface models (Crow et al., 2020). Moreover, the impact of soil moisture assimilation on ET can also heavily depend on region and climate (Kumar et al., 2020).
The improvement in the simulation of transpiration and carbon fluxes by LAI-DA is largely due to the adjustment of the amplitude and phase of vegetation growth. Figure 4 shows the average monthly time series of LAI from the simulations, along with the distribution of the months when LAI reaches its peak for all the grid cells per year stratified by land cover types. The time series indicates that OL significantly overestimates LAI, which is corrected by LAI-DA. In addition, LAI-DA leads to significantly different interannual variability. Comparatively, SSM-DA has a limited impact on the evolution of LAI as compared to the OL run. The mismatch in terms of the interannual variations is even more obvious under drought conditions. For instance, both OL and SSM-DA are not able to reflect the change in vegetation conditions in response to the 2015–2016 drought event for croplands, while LAI-DA shows a clear reduction in the evolution of LAI during the 2015–2016 growing season as compared to the adjacent years (Fig. 4c). Furthermore, assimilating LAI also leads to changes to the phase of the LAI seasonality. In general, LAI-DA yields a peak in the LAI seasonality 1–2 months earlier than the OL and SSM-DA for all three land cover types (Fig. 4b, d, and f).
3.2 Evaluating beyond the SMAP time period (2003–2019)
As the overall impact of LAI-DA is much greater than SSM-DA, especially for transpiration and carbon fluxes, we further extend the evaluation period beyond 2015–2019 for LAI-DA to investigate its impact on a long-term basis and to quantify its contribution across seasons. The interannual correlation and RMSD of ET components are calculated for each month, and Fig. 5 shows the median of each metric stratified per land use type.

Figure 5Median of the interannual (a–c) correlation and (d–f) RMSD of evaporation (E), transpiration (T), and evapotranspiration (ET) averaged over the major land cover classifications for the OL and LAI-DA simulations for the period of 2009–2019.
The model in general provides much higher correlations for transpiration than for evaporation in winter and spring, overlapping with the growing seasons, regardless of data assimilation and land use types. However, it generally overestimates transpiration during summertime, especially for croplands, likely due to the misrepresentation of vegetation seasonality. Assimilating LAI into the model improves the interannual correlations for transpiration across all land use types and all seasons and generally reduces RMSD for croplands. In the case of evaporation, LAI-DA has a marginal impact on correlation but leads to larger RMSD, indicating less agreement in representing the magnitude of E. This may stem from different ET partitioning algorithm between Noah-MP and WaPOR and their associated uncertainties. The different impact on E and T due to LAI assimilation results in an overall small difference in terms of correlation while general improvements in terms of RMSD for ET.
Besides the ET components, we evaluate the impact of LAI assimilation on carbon fluxes by comparing the NPP and GPP estimates against the reference data sets. Similar to Fig. 5, Fig. 6 shows the interannual correlation and RMSD for NPP evaluating against the WaPOR data set (Fig. 6a and e) and for GPP evaluating against the FLUXSAT (Fig. 6b and f) and the FLUXCOM (Fig. 6c and g) GPP estimates and the GOME-2 SIF estimates (Fig. 6d). As the impact of LAI-DA on carbon fluxes is similar among the three land use types (not shown), the medians of the metrics for the sum of these major land use types are shown to represent the overall performance. In general, the highest correlation for NPP is found in summer- and wintertime, while the highest correlation for GPP aligns with the peak growing season of December–April. However, the largest RMSD values for both NPP and GPP also occur within the growing season (February–April). The results suggest that assimilating LAI consistently improves the interannual variability in both NPP and GPP for all months, and the greatest improvements are found within the growing seasons. Moreover, LAI-DA is able to reduce approximately half of the RMSD for both carbon fluxes.
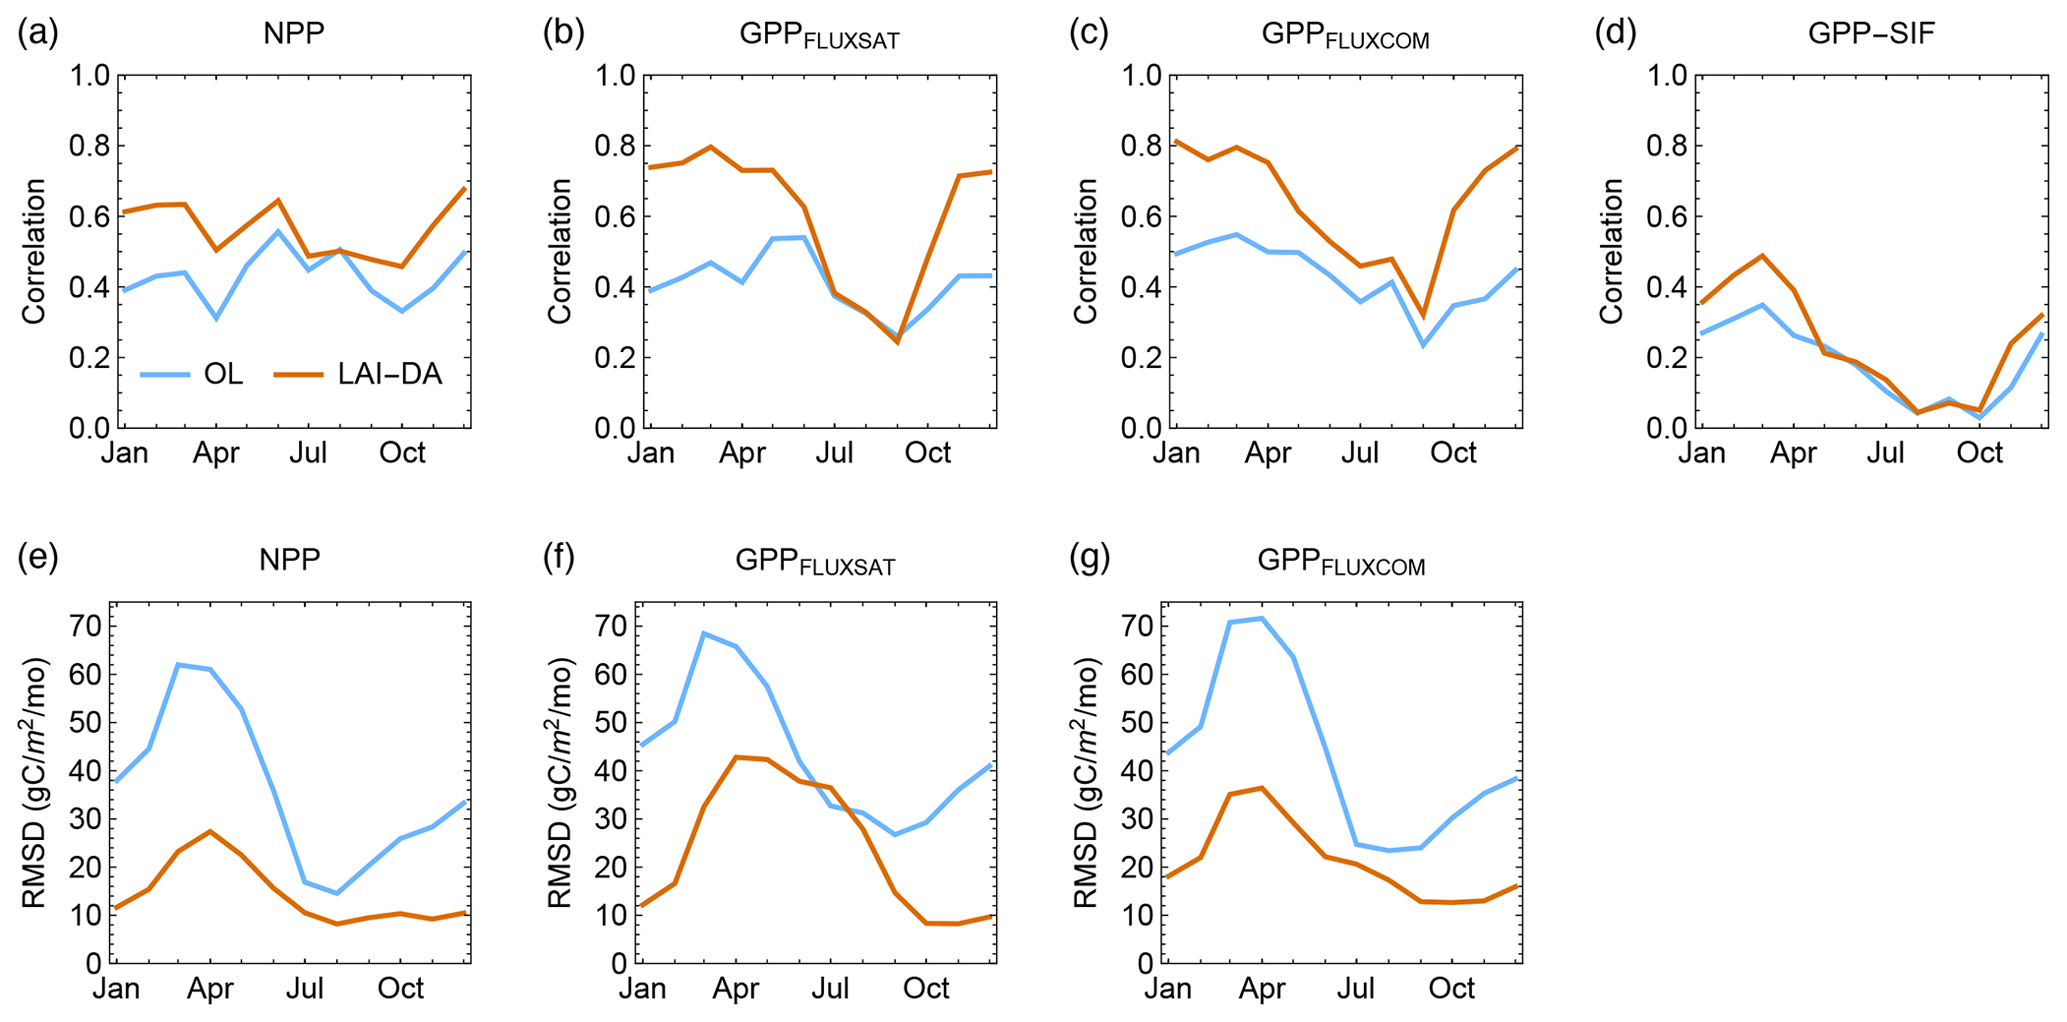
Figure 6Metrics for the OL and LAI-DA simulated net primary production (NPP) and gross primary production (GPP) against reference data sets averaged over the sum of open shrublands, croplands, and grasslands. Shown are the (a) correlation and (e) RMSD for NPP evaluated against FAO WaPOR NPP data set for the period of 2009–2019, the correlation (b, c) and (f, g) RMSD for GPP evaluating against FLUXSAT GPP product for the period of 2003–2019 and FLUXCOM GPP product for the period of 2003–2015, and the (d) correlation between the simulated GPP and GOME-2 Sun-induced chlorophyll fluorescence (SIF) for the period February 2007 to February 2019.
Evaluating against multiple independent data sets provides different insights on the impact of data assimilation on the performance of both energy and carbon fluxes. The overall accuracy of estimated ET components, NPP, and GPP, both within and beyond the SMAP time period, suggests that LAI-DA has a greater beneficial impact than SSM-DA. This is consistent with the Kumar et al. (2020) study, which demonstrated that updating vegetation phenology is more effective for generating improvements in evaporative fluxes.
3.3 The impact of irrigation
Although precipitation serves as a primary source for plant transpiration and soil evaporation, irrigation can also play a role in supplying water for agricultural productivity, and it has a significant contribution to enhance ET and carbon fluxes. To quantify the impact of irrigation on fluxes, we investigate the performance of the second set of experiments (i.e., OLirr, LAI-DAirr, and SSM-DAirr), with a special focus on grid cells that are actively irrigated. Comparing OLirr, LAI-DAirr, and SSM-DAirr with the OL simulation enables us to examine how irrigation affects the simulated fluxes under the original, the LAI, or the soil moisture assimilation configuration. Note that, according to the irrigation rules applied in the model, the growing season time window defined by GVF threshold and the root zone soil moisture can both alter the irrigation timing and amount, thus affecting the associated fluxes. Similar to the analyses in previous sections, we first evaluate the irrigation impact within the SMAP time period (Table 4) and then we exclude the SSM-DA simulation and evaluate the impact beyond the SMAP time period (Fig. 7).
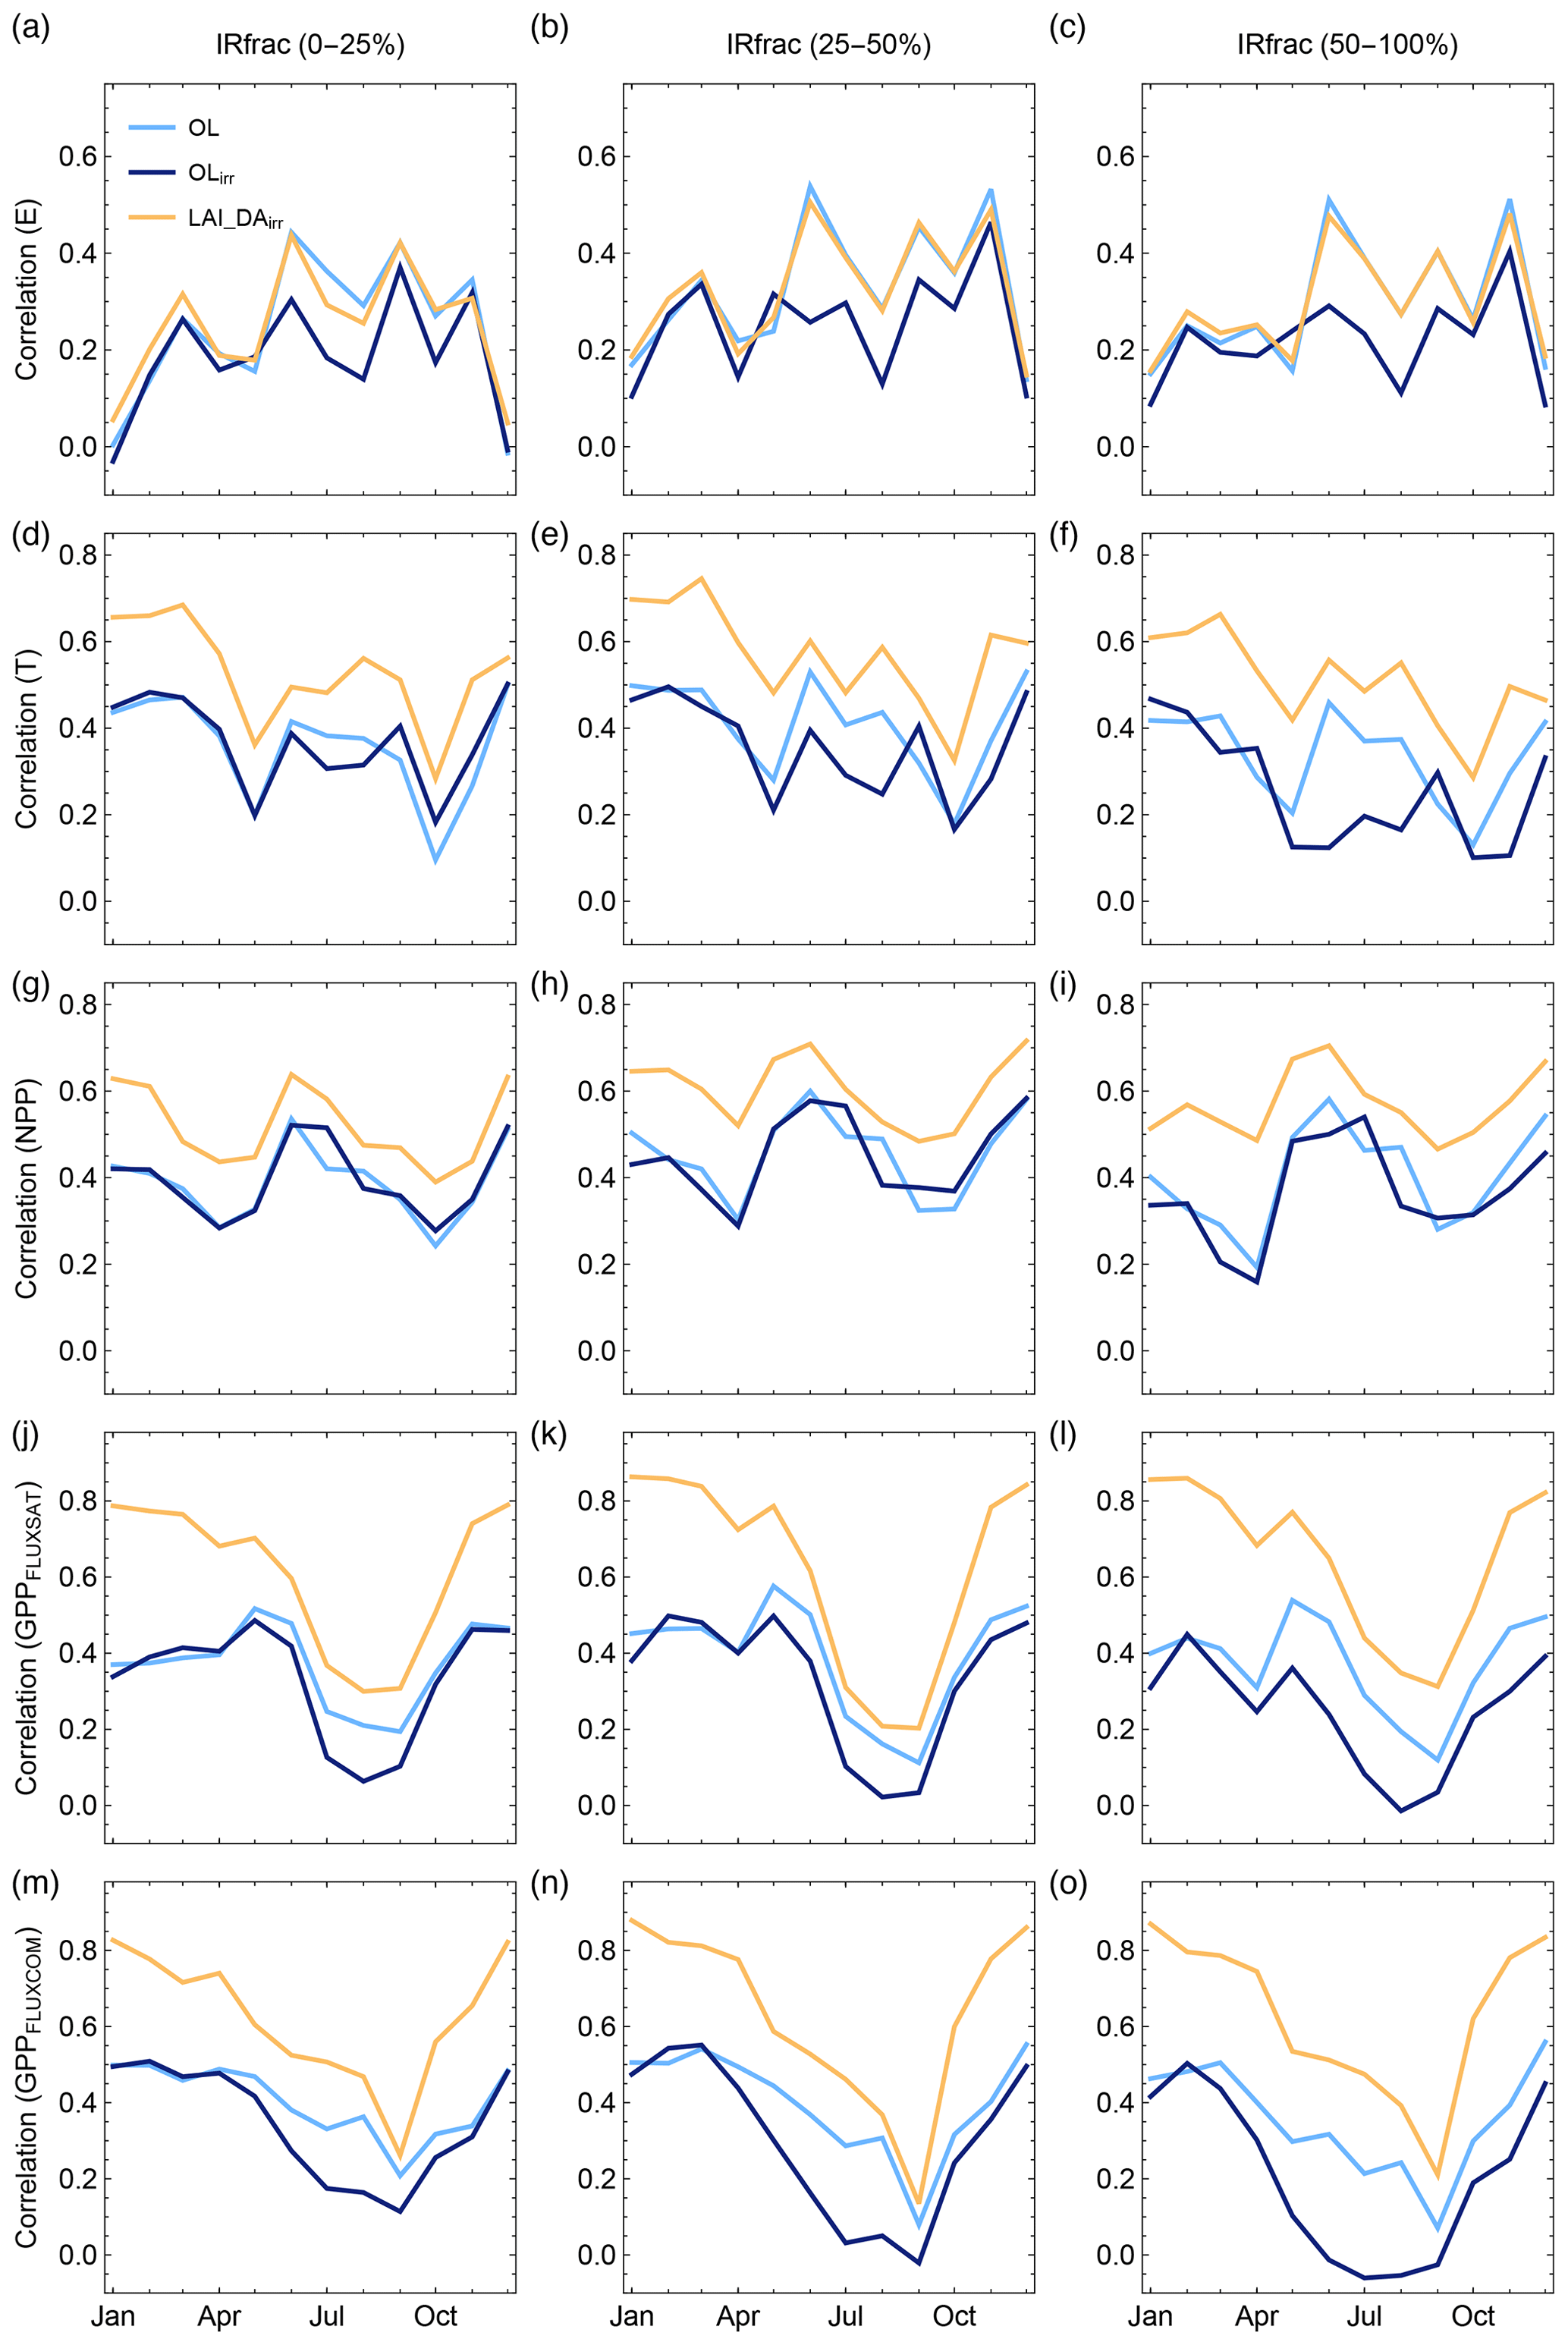
Figure 7Interannual correlation of evaporation (E) and transpiration (T), net primary production (NPP), and gross primary production (GPP) averaged over actively irrigated areas with low (a, d, g, j, m), moderate (b, e, h, k, n), and high (c, f, i, l, o) irrigation fraction intensities for the OL, OLirr, and LAI-DAirr simulations.
Table 4Median evaluation metrics of monthly correlation (R), anomaly correlation (anomaly R), RMSD, and bias for the OL, OLirr, LAI-DAirr and SSM-DAirr simulations against FAO WaPOR data sets for evaporation (E), transpiration (T), evapotranspiration (ET), net primary production (NPP), and against the FLUXSAT data set for gross primary production (GPP) for the period of 2015–2019 over the actively irrigated area.
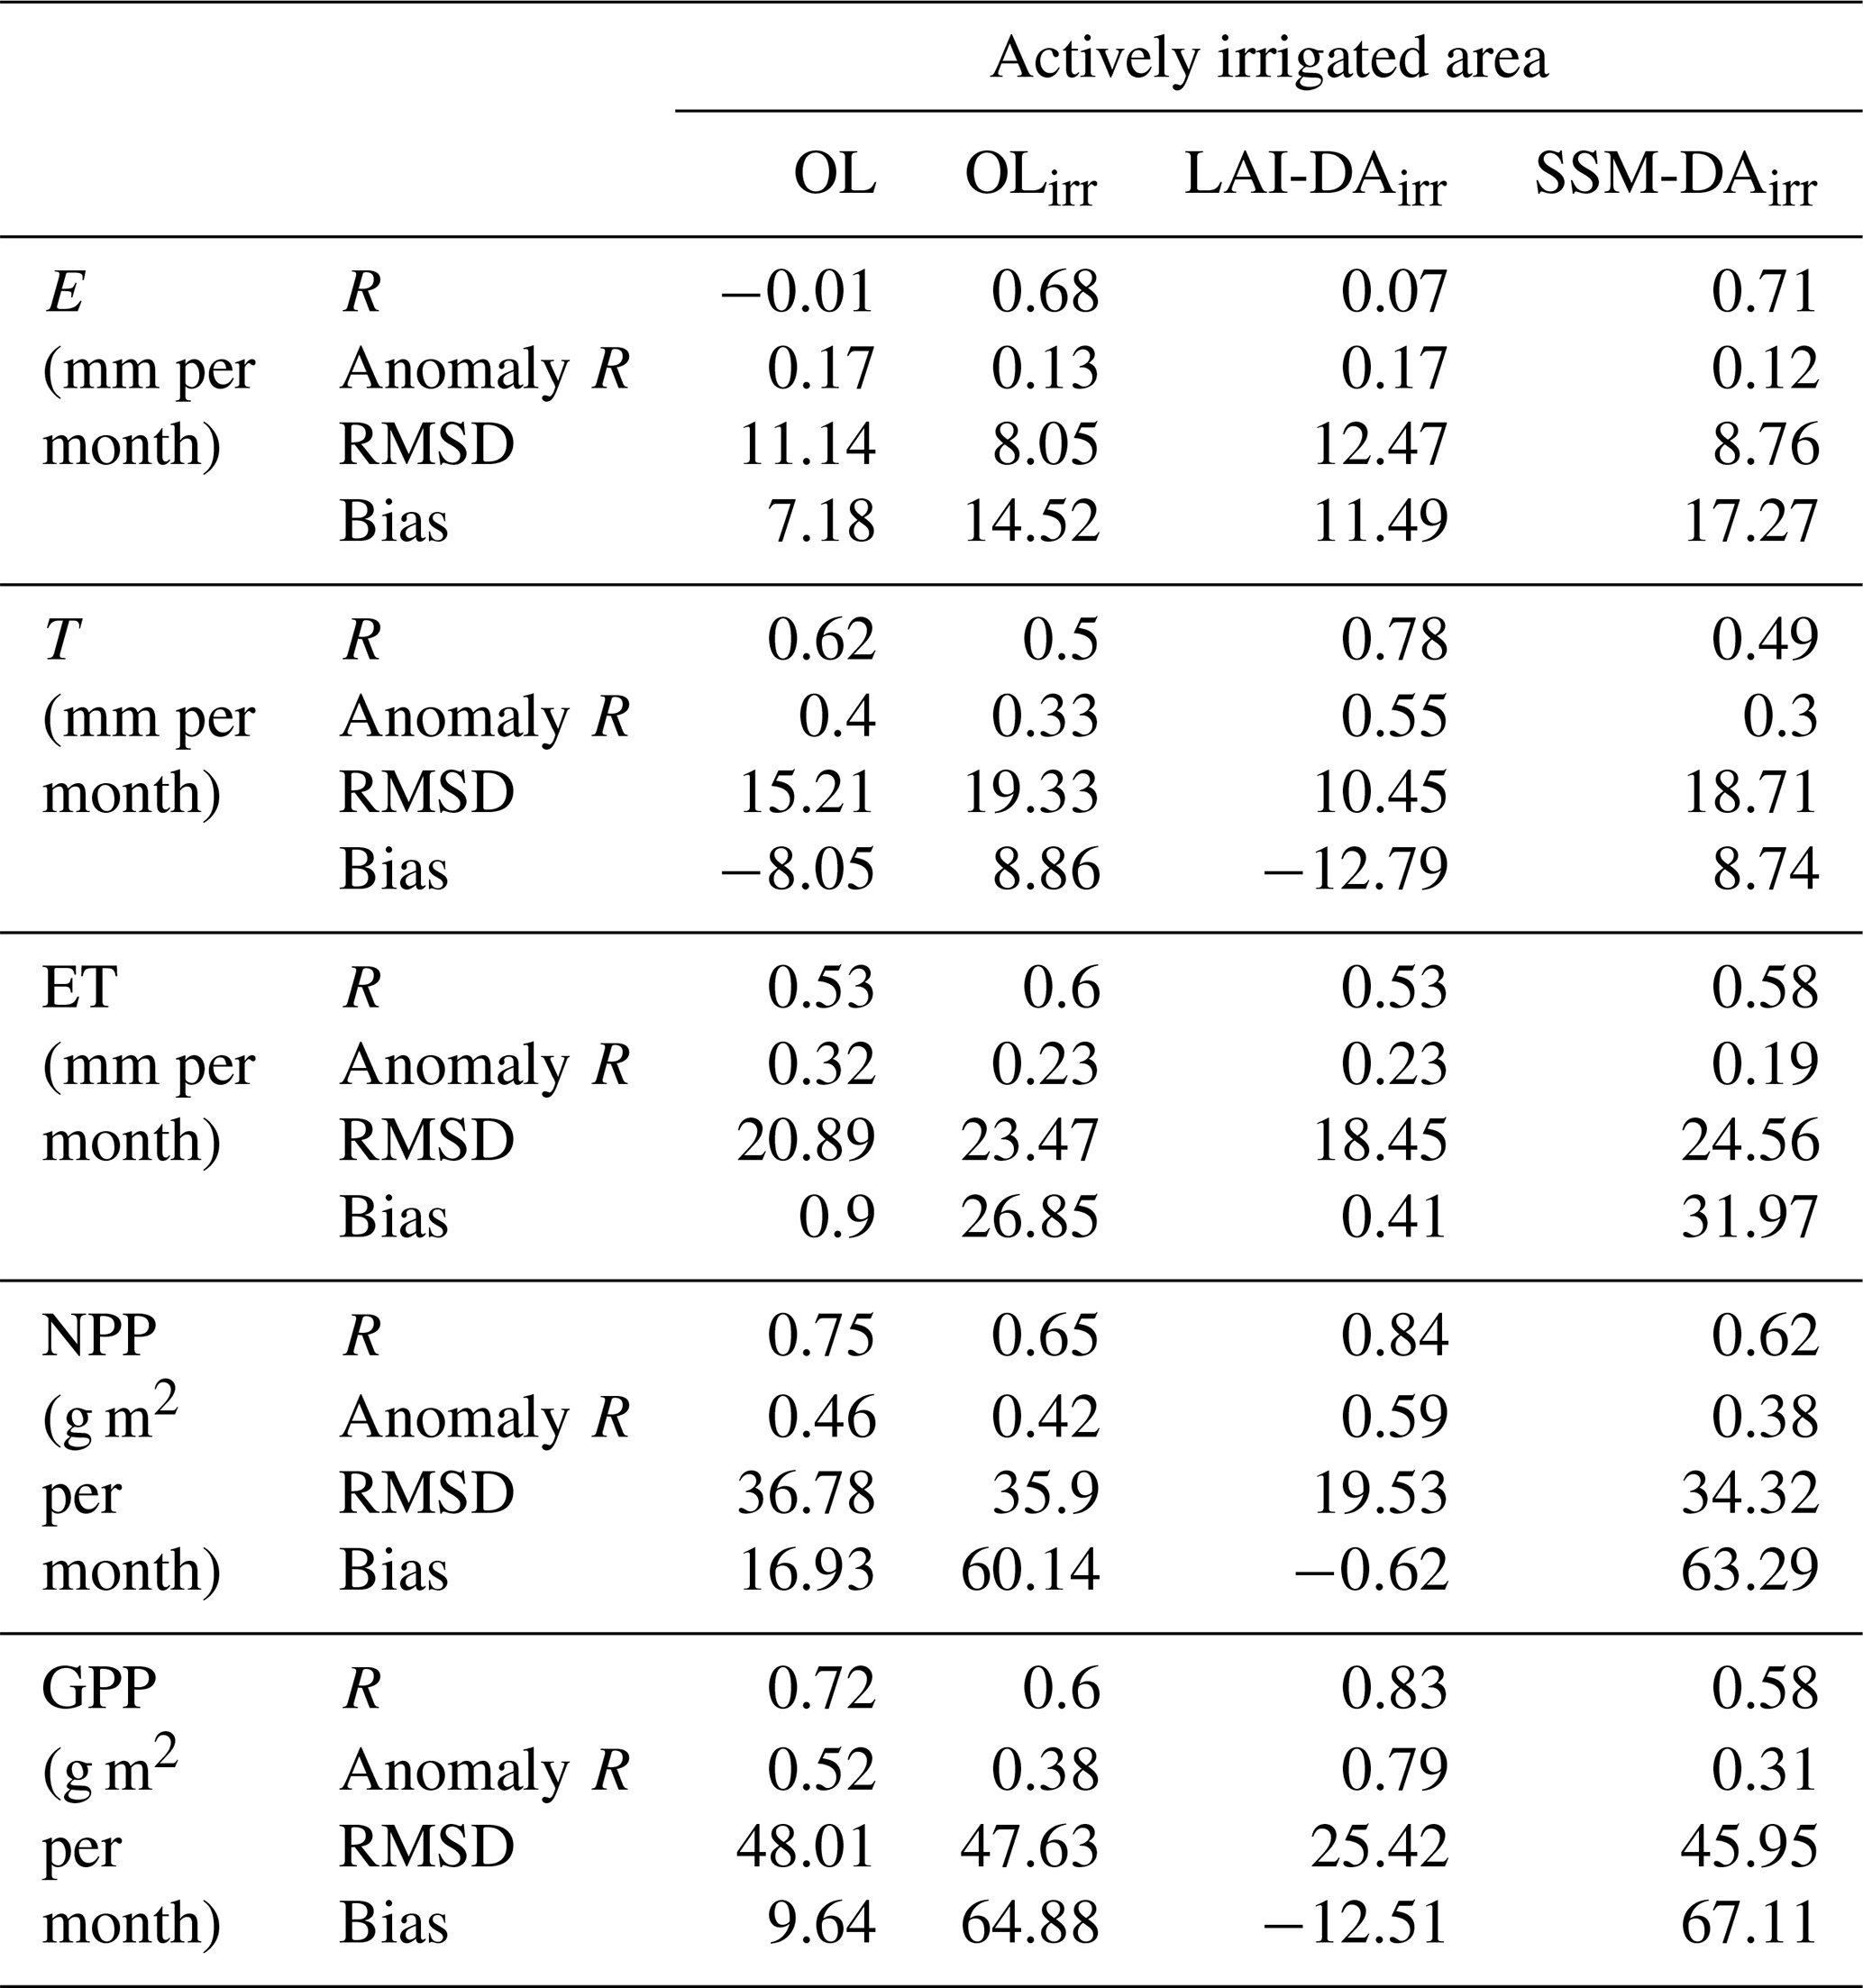
Table 4 shows the overall performance for the OL, OLirr, LAI-DAirr, and SSM-DAirr simulations for actively irrigated areas. Interestingly, OLirr dramatically improves the correlation for evaporation, bringing the median correlation from −0.01 in OL to 0.68, and SSM-DAirr further improves the correlation to 0.71. They together indicate that the inclusion of irrigation is the major factor contributing to the improvement in the seasonal variation in evaporation and that assimilating surface soil moisture leads to further improvements. The two simulations slightly degrade anomaly R, while LAI-DAirr has almost no impact on either. Compared to OL, including irrigation with or without data assimilation increases the positive bias for evaporation. Conversely, OLirr and SSM-DAirr degrade R and anomaly R for transpiration, NPP, and GPP, while LAI-DAirr leads to significant improvements. Note that the improvement in T, NPP, and GPP is mainly attributed to assimilating LAI. The inclusion of irrigation provides further improvements but is relatively small when comparing LAI-DA with LAI-DAirr for the actively irrigated areas (not shown). The overall bias of total ET and NPP is the smallest in LAI-DAirr, while both OLirr and SSM-DAirr largely increase the bias for these two terms and that of GPP. It is also interesting to note that the sign of bias for transpiration is different among the simulations. OL underestimates transpiration, and LAI-DAirr further increases this dry bias as compared to WaPOR, whereas both OLirr and SSM-DAirr lead to increased transpiration, resulting in positive transpiration BIAS.
The reason that both OLirr and SSM-DAirr lead to the improved seasonal evolution of evaporation compared to OL is that irrigation is erroneously triggered during the summertime, as the period is identified as within the growing season according to the prognostic phenology module. To bring the dry root zone soil moisture to field capacity, a large amount of water is therefore applied into the effective root zone soil layers, producing a large peak of evaporation, which is also represented in the WaPOR data sets. OL failed to simulate the summer peak of evaporation, which is likely due to the limited water availability for deep soil evaporation, as the soil thickness for Noah-MP is only 2 m and/or the underestimation of the root water uptake and groundwater capillary rise. LAI-DAirr does not provide improvements because irrigation is not triggered during summertime, which falls outside of the growing season indicated by the assimilated LAI observations with an early peak LAI seasonality. In cases like this, the improvement in evaporation in OLirr and SSM-DAirr is related to the fact that the erroneously applied irrigation compensates for the model structural error. It does improve correlation for E, but it also leads to degradation in bias for ET and carbon fluxes.
For the evaluation beyond the SMAP time period (spanning portions of 2003–2019), we further stratify the actively irrigated areas into the following three classes based on the irrigation fraction intensity (IRfrac): (i) the lightly irrigated area, where the irrigation fraction is lower than 25 %, (ii) the moderately irrigated area, where the irrigation fraction is between 25 % and 50 %, and (iii) the heavily irrigated area, where the irrigation fraction is higher than 50 % (Fig. 1b).
Medians of the interannual correlations for E, T, NPP, and GPP for the three classes are shown in Fig. 7. It is interesting to note that, when compared with OL, OLirr degrades the correlation for E, T, and GPP for almost all months, and the degradation becomes larger as the irrigation fraction intensity increases. Interacting with the original prognostic phenology module, applying irrigation does not provide any skill in improving the interannual variability for each specific month but rather makes it worse. Previous studies (Liu et al., 2016; Niu et al., 2020) have demonstrated that the prognostic phenology module in Noah-MP produces large errors in the seasonal evolution of vegetation phenology, possibly due to the overly simplified parameterization of growth characteristics and the stomatal response to stresses. In addition, many of the parameters and scaling factors determining water availability are derived and calibrated within the continental U.S. (CONUS) and may not be optimal for application to the MENA region. The misrepresentation of the vegetation condition may introduce erroneous information to trigger irrigation, and irrigation further affects the vegetation growth and the associated carbon fluxes by altering the soil moisture condition and the associated water stress controlling factor. Therefore, errors accumulate and drive the simulated fluxes further away from the reference data sets.
In this context, assimilating LAI can correct for the seasonal evolution of vegetation conditions, thus constraining the time window to trigger irrigation, leading to improved correlations for transpiration, NPP, and GPP. However, its impact on evaporation is very limited. Temporally, its contribution would be centered within the growing season, so it is not likely to compensate for model weakness in simulating the summertime evaporation; spatially, significant differences occur mostly in the intensely irrigated areas, where transpiration is the dominant component in ET.
3.4 Implications for drought categorization
3.4.1 Applications for root-zone-soil-moisture-based drought
Limited by the availability of in situ soil moisture observations, it is challenging to directly evaluate the data assimilation impact on soil moisture. Nevertheless, we can quantify how data assimilation differentiates the categorization of drought and reproduces the evolution, duration, and intensity of past drought events as an indirect way to evaluate its impact on root zone soil moisture.
Estimates of droughts are generated through percentile-based indices using root zone soil moisture outputs (top 1 m depth) from OL, SSM-DA, and LAI-DA. The percentile-based root zone soil moisture indicator is computed in a manner similar to that used in the North American Land Data Assimilation System (NLDAS) drought monitoring system (Kumar et al., 2016; Sheffield et al., 2012). Daily outputs from OL and LAI-DA for the period 2002–2019 are used to generate the climatology, and the daily percentile values are computed by ranking each day's estimates against the climatology for OL and LAI-DA, respectively. Since SSM-DA involves a shorter time period (2015–2019), we use the climatology generated by OL to rank the estimates from SSM-DA without further scaling, as the SMAP observations are already scaled to OL before the assimilation is performed. The drought percentage area values are then produced per land cover type and are categorized into the following five drought levels: D0 (abnormally dry; percentile ≤ 30 %), D1 (moderate drought; percentile ≤ 20 %), D2 (severe drought; percentile ≤ 10 %), D3 (extreme drought; percentile ≤ 5 %), and D4 (exceptional drought; percentile ≤ 2 %).

Figure 8Time series of percentages of area under drought in OL, LAI-DA, and SSM-DA for each root zone soil moisture drought percentile category and for each land use type.
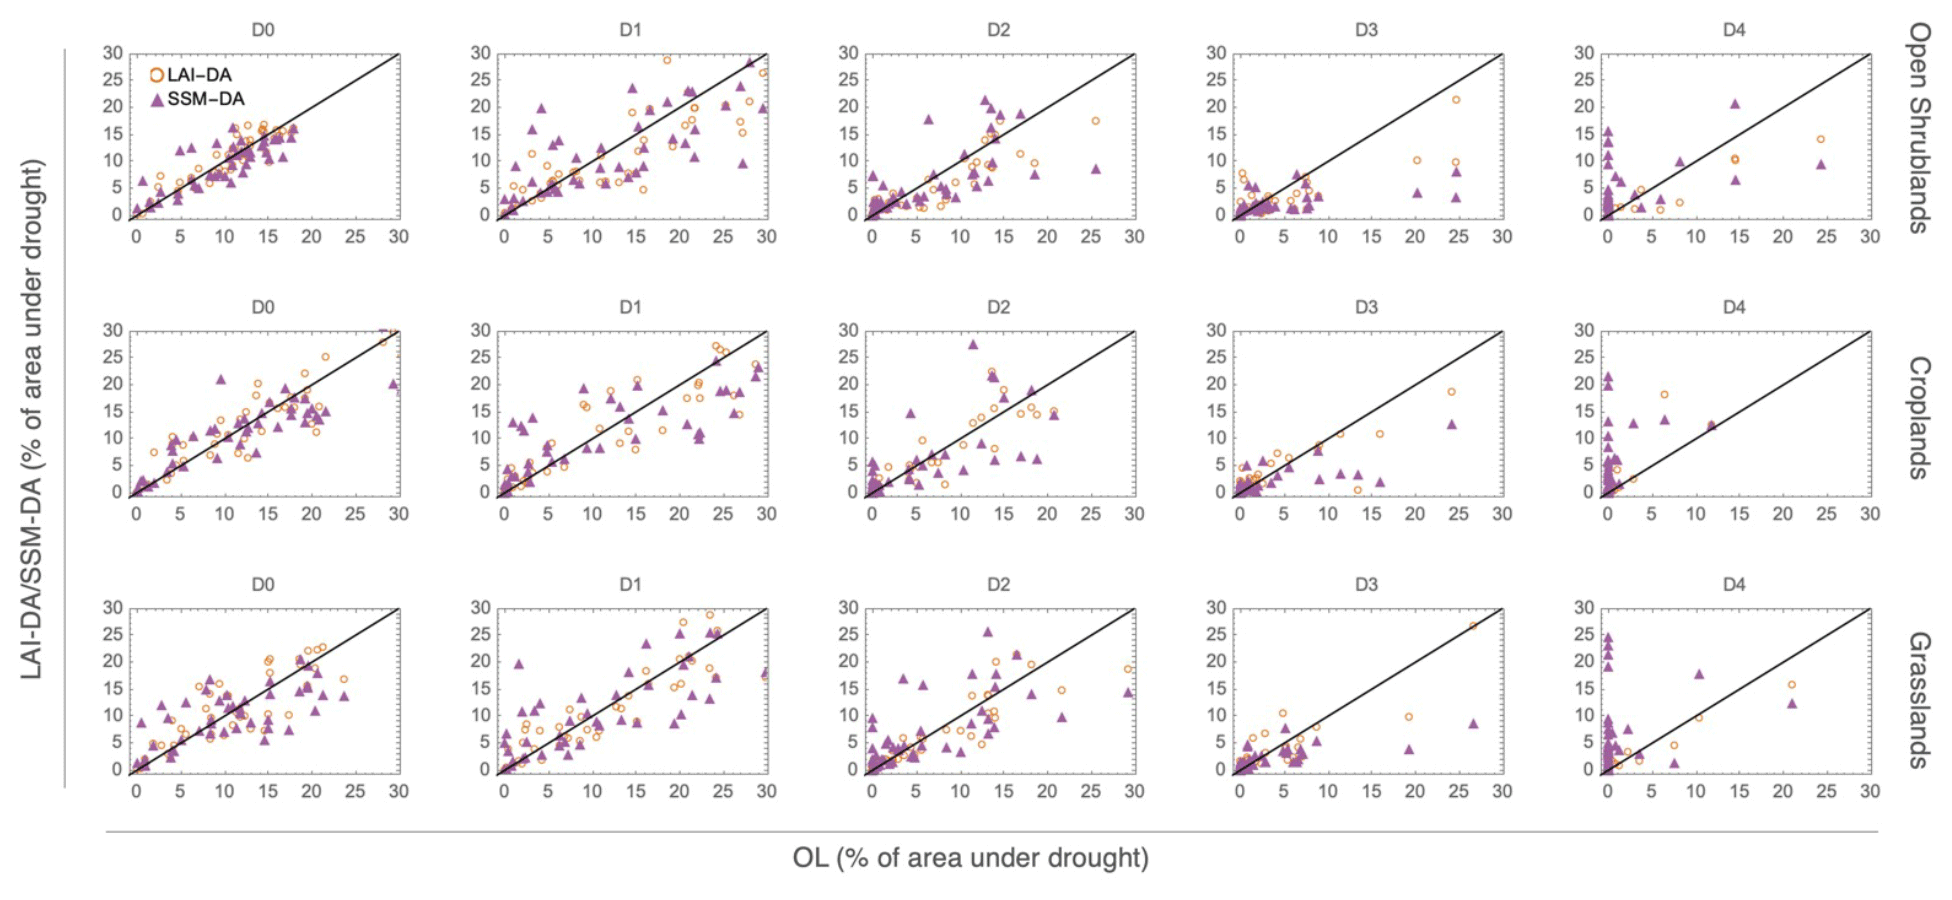
Figure 9The scatterplot for the percentage of area under drought between OL and LAI-DA/SSM-DA for the five drought categories stratified by the three major land use types. The data for summertime (June–August) are excluded for this analysis.
Figure 8 presents the time series of the monthly drought percentage area derived from OL, LAI-DA, and SSM-DA for five drought percentile categories, stratified by the three major land cover types over the SMAP period (2015–2019). Overall, all simulations are able to capture major drought periods for Morocco, such as the 2015–2016 (Bijaber et al., 2018) and 2018–2019 (Bhaga et al., 2020) events. However, the categorized drought intensity and corresponding duration vary. For example, for the December 2015–February 2016 drought event over open shrublands, LAI-DA estimates 28 % less area experiencing extreme drought (D3) as compared to the OL run. Moreover, LAI-DA also tends to estimate a weaker drought evolution and faster recovery during the post-drought period, while SSM-DA differs from OL and LAI-DA more in terms of the drought intensity categorization, as 14 % of area is detected as the exceptional drought (D4) compared to zero in both OL and LAI-DA. For the 2018–2019 event, under which cereal production is reported to have decreased by 49 % compared to the 2017–2018 season, LAI-DA tends to estimate more severe drought intensity and longer duration for croplands but relatively weaker and smaller expansion for open shrublands as compared to both OL and SSM-DA. This may imply that the incorporation of the LAI observations helps to reflect different drought representation across land cover types, as agricultural lands seem to be more vulnerable and face a severe drought, while natural vegetation types are less affected. However, without LAI-DA, the model is not able to distinguish these drought sensitivities. Moreover, LAI estimated in OL is much higher than that simulated in LAI-DA (Fig. 4), especially for open shrublands and grasslands, leading to increased transpiration through vegetation and drier root zone soil moisture. Assimilating LAI helps to correct this overestimation of drought by improving the magnitude of LAI simulation. This is also consistent with the findings in Mocko et al. (2021) for the CONUS region.
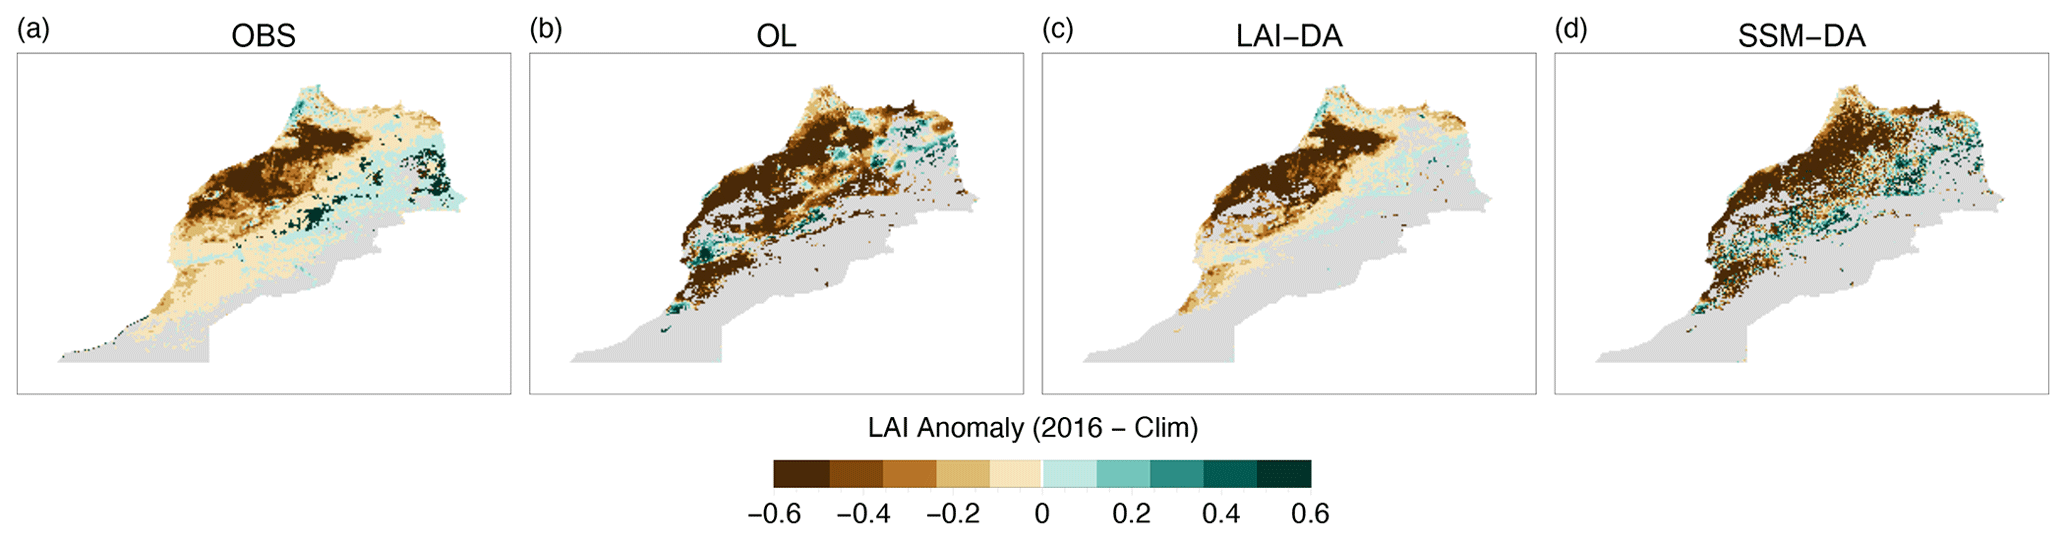
Figure 10LAI anomaly under a drought event (2016 February) with respect to climatology of February within a SMAP period (2015–2019) for (a) a MODIS observation, (b) OL, (c) LAI-DA, and (d) SSM-DA.
To further assess the impact of data assimilation on differentiating the categorization of drought as compared to OL, Fig. 9 shows the percentage of area under each drought level for LAI-DA and SSM-DA against OL stratified by the three major land cover types. All three simulations are similar in diagnosing the extent of the mild drought (D0), especially for open shrubland and croplands. More differences are seen in categorizing the moderate to extreme drought events (D1–D3), and there is no clear pattern associated with the differences. When it comes to the exceptional drought (D4), LAI-DA and SSM-DA show the opposite tendency as compared to OL for open shrublands and grasslands in that LAI-DA tends to limit the spatial extent of the extreme and exceptional drought, while SSM-DA is more likely to expand the impact of higher level of drought extremes. However, their tendency is similar over croplands. It should be noted that uncertainties exist in assigning the percentile for SSM-DA based on the climatology of OL. Nevertheless, the result that LAI-DA tends to limit the estimates of the most severe drought categories implies that assimilating vegetation states may have a stronger impact on the simulation of extreme moisture anomalies, information which might not be carried by the soil moisture observations or represented by the model.
3.4.2 Data assimilation impact on vegetation response to drought
As demonstrated in the above section, vegetation may contain critical information in altering the root-zone-soil-moisture-based drought classifications; thus, we further investigate how the model simulates vegetation in response to drought. Representing the vegetation response to drought is often a challenge in land surface modeling as most of the models use oversimplified parameterizations to downregulate stomatal conductance and photosynthesis under drought stress (Eller et al., 2020; Liu et al., 2020; Niu et al., 2020). In Fig. 10, we examine the spatial distribution of the LAI anomaly under the 2015–2016 drought by comparing the difference between LAI in Feb 2016 and its climatology derived within the SMAP period (2015–2019). The vegetation response to drought in the OL estimates significantly differs from the observation, as the OL underestimates the spatial variability in the response, the pattern of which may relate to land cover types. More specifically, OL tends to underestimate the LAI anomaly over the northwestern region, including most of the croplands, while overestimating the drought effect for the northeastern region and along the southern edge of the open shrublands. The spatial pattern of the LAI anomaly in the SSM-DA is similar to that of the OL, except for the southeastern area, where SSM-DA brings the positive LAI anomaly into closer agreement with the observation. However, the increased small-scale variability in the LAI anomaly in the SSM-DA likely reflects the fact that assimilated surface soil moisture has degraded the model's ability to simulate vegetation conditions in terms of spatial consistency. Although assimilating soil moisture inherits uncertainties due to shallow vertical penetration depth and scale mismatch, this does not necessarily mean that the observed soil moisture condition provides limited or erroneous stress information to the model. The fact that SMAP observation is scaled to the model via CDF-matching also means that observational information is lost so that we are only incorporating the anomalies outside of what is captured by precipitation (Nearing et al., 2018), limiting the possible added value via SSM-DA. Besides, the simplified concepts and parameterization of stomatal conductance and prognostic phenology schemes may also fail to reasonably digest and properly apply the stress information to represent vegetation response to drought. In this case, LAI-DA, as expected, can reasonably replicate the spatial distribution of vegetation in response to drought by constraining the vegetation cycle, thus leading to more accurate simulations of transpiration and associated carbon fluxes.
Morocco is known to have experienced intensified drought events during recent decades, and this increasing trend, associated with global climate change, will likely be more evident in the future (Verner et al., 2018). In fact, many countries in the MENA region are vulnerable to drought due to underlying aridity and limits to current water and agricultural management practices, as well as the limited information available to aid decision-making for drought preparedness. A robust drought monitoring and early warning system would be beneficial to mitigate the drought effects and facilitate timely and effective responses from government and private sector stakeholders (Fragaszy et al., 2020). However, challenges exist as modeling efforts in the MENA region are severely limited by the lack of in situ observations to support an optimal set of parameterizations. Remotely sensed observations of soil moisture and vegetation conditions contain information from both anthropogenic and natural changes in response to climate variability and extremes, and data assimilation provides a way to incorporate such information into land surface modeling, extending the potential of benefiting drought monitoring and forecasting efforts.
In this study, we look at Morocco as an example to demonstrate the capabilities of remotely sensed soil moisture and leaf area index (LAI) to improve the simulation of water–energy–carbon fluxes and the representation of drought conditions over the MENA region. The combination of GDAS and IMERG meteorological forcing fields is selected to drive the modeling system, and the EnKF algorithm is used to separately assimilate the SMAP-based surface soil moisture retrievals and MODIS-based LAI retrievals into Noah-MP during the 2015–2019 and 2002–2019 time periods, respectively. We conducted two sets of simulations (with or without irrigation) to investigate the influence of data assimilation and its interaction with irrigation via informing the prognostic phenology on the estimation of ET components and carbon fluxes by comparing against multi-source satellite observations.
Results show that assimilating soil moisture does not meaningfully improve the model representation of hydrological processes for the study region but rather leads to degradation in the simulation of the interannual variations in T, NPP, and GPP. Relatively coarse spatial resolution of SMAP soil moisture retrievals, uncertainties inherited in the irrigation scheduling assumptions, and the CDF-matching approach used to scale SMAP data to the model prior data assimilation may all limit the value of integrating model and SMAP soil moisture observations for this case. Although SMAP products are reported to show capability in detecting irrigation signal for places such as the California Central Valley and High Plains (Felfelani et al., 2018; Kumar et al., 2018; Lawston et al., 2017), this capability is likely to be limited within the intensively irrigated hot spots that have limited spatial extents. To capture the irrigation signal for smaller or sparsely distributed irrigation areas, soil moisture products at higher resolution have greater potential to provide benefits such as the SMAP/Sentinel1 data sets (Das et al., 2019; Jalilvand et al., 2021; Lievens et al., 2017). In contrast, assimilating LAI leads to substantial improvements in the simulation of these fluxes in terms of both temporal variation and RMSE, which are primarily due to the correction of the phase and magnitude of LAI. Both SSM-DA and LAI-DA have a limited impact on evaporation in terms of the seasonal and interannual variability, but they differ from OL in the partitioning of E and T. SSM-DA tends to increase both E and T, while LAI-DA leads to increase E but decrease T, likely due to the reduced magnitude of LAI. The fact that the two data assimilation experiments affect E and T differently results in mixed skill on the estimation of ET. For open shrubland and grassland, where the ratio of is high, both SSM-DA and LAI-DA have limited impact on ET, while ET is improved for croplands by LAI-DA as the magnitude of T is comparable to E.
In the presence of irrigation, significant improvements in the seasonal cycle of evaporation are observed in both OLirr and SSM-DAirr. This is, however, a result of the irrigation water supply erroneously capturing the peak during the summertime. The failure to capture the summertime E peak in OL is attributed to model limitations in describing the water availability and underestimation of the groundwater capillary rise. Therefore, the erroneously applied irrigation compensates for the model structural error. Though it improves the correlation for E, the magnitude of E is greatly overestimated. In addition, the irrigation simulation is also found to degrade the temporal variability in carbon fluxes. In this case, LAI-DAirr provides comparable skill to LAI-DA by constraining the timing of irrigation within the MODIS LAI observation informed growing season. The inclusion of irrigation provides marginal improvements in LAI-DAirr compared to LAI-DA, specifically in the correlation for T, NPP, and GPP compared to LAI-DA (not shown).
LAI-DAirr outperforms other simulations by correcting vegetation phenology processes, whereas SSM-DAirr provides no measurable skill in avoiding the erroneous triggering of summertime irrigation, introducing greater bias to other variables. This result underscores the fact that data assimilation helps to diagnose model weakness, and that it may amplify model errors by translating the change of one variable into changes of other variables without proper support from model physics, similar to the findings of other data assimilation applications (Girotto et al., 2017; Kolassa et al., 2017).
The influence of SSM-DA and LAI-DA on categorizing drought is examined by generating percentile-based root zone soil moisture drought indicators. The percentage of the area under drought for five drought severity categories is quantified for three major land cover types. Results suggest that both SSM-DA and LAI-DA do not differ much from OL for mild drought events, but the differences become greater as the drought severity category increases. For example, assimilating LAI tends to reduce the estimated area under the D4 category for open shrubland and grassland, implying alleviated moisture anomalies under extreme conditions in response to vegetation states which might not be captured by either OL or SSM-DA. This study has focused on the differences between simulations with respect to drought indicators. Further assessment against independent data is needed to assess whether the differences introduced by data assimilation improve the accuracy of drought categorizations, or whether these changes offer a benefit for drought monitoring and management in MENA countries.
Different data sets used for the model evaluation were obtained from the various sources described in Sect. 2. The model output relevant to this work is available through the Johns Hopkins University Data Archive (https://doi.org/10.7281/T1/X4MXHC; Nie et al., 2022).
WN, CDP, SVK, and KRA conceived the study. WN, KRA, and IEM set up the model. SVK, DMM, and MN provided support on modeling development. SPM provided support on the input data sets. WN designed the workflow and conducted the analyses, with all co-authors providing input. WN led the writing, with contributions from all co-authors.
The contact author has declared that neither they nor their co-authors have any competing interests.
The opinions expressed in this publication are those of the authors and do not necessarily reflect the views of the U.S. Agency for International Development or the United States government.
Publisher's note: Copernicus Publications remains neutral with regard to jurisdictional claims in published maps and institutional affiliations.
Computational resources were provided by the NASA's Center for Climate Simulation (NCCS). We would like to acknowledge the NASA LIS team, for their help on the model development and support of the GDAS and IMERG data sets. We also thank Timothy Lahmers and Kimberly Slinski, for providing valuable feedback on this study.
This research has been supported by the United States Agency for International Development (grant no. 7200-ME-18-IO-00001).
This paper was edited by Narendra Das and reviewed by Claire Michailovsky and two anonymous referees.
Albergel, C., Munier, S., Leroux, D. J., Dewaele, H., Fairbairn, D., Barbu, A. L., Gelati, E., Dorigo, W., Faroux, S., Meurey, C., Le Moigne, P., Decharme, B., Mahfouf, J.-F., and Calvet, J.-C.: Sequential assimilation of satellite-derived vegetation and soil moisture products using SURFEX_v8.0: LDAS-Monde assessment over the Euro-Mediterranean area, Geosci. Model Dev., 10, 3889–3912, https://doi.org/10.5194/gmd-10-3889-2017, 2017.
Arsenault, K. R., Kumar, S. V., Geiger, J. V., Wang, S., Kemp, E., Mocko, D. M., Beaudoing, H. K., Getirana, A., Navari, M., Li, B., Jacob, J., Wegiel, J., and Peters-Lidard, C. D.: The Land surface Data Toolkit (LDT v7.2) – a data fusion environment for land data assimilation systems, Geosci. Model Dev., 11, 3605–3621, https://doi.org/10.5194/gmd-11-3605-2018, 2018.
Ball, J. T., Woodrow, I. E., and Berry, J. A.: A model predicting stomatal conductance and its contribution to the control of photosynthesis under different environmental conditions, Prog. Photosynthes. Res., 221–224, 1987.
Barbu, A. L., Calvet, J.-C., Mahfouf, J.-F., and Lafont, S.: Integrating ASCAT surface soil moisture and GEOV1 leaf area index into the SURFEX modelling platform: a land data assimilation application over France, Hydrol. Earth Syst. Sci., 18, 173–192, https://doi.org/10.5194/hess-18-173-2014, 2014.
Bastiaanssen, W., Cheema, M., Immerzeel, W. W., Miltenburg, I. J., and Pelgrum, H.: Surface energy balance and actual evapotranspiration of the transboundary Indus Basin estimated from satellite measurements and the ETLook model, Water Resour. Res., 48, W11512, https://doi.org/10.1029/2011WR010482, 2012.
Bergaoui, K., Mitchell, D., Otto, F., Allen, M., Zaaboul, R., and McDonnell, R.: The contribution of human-induced climate change to the drought of 2014 in the southern Levant region, B. Am. Meteorol. Soc., 96, S66–S70, 2015.
Bhaga, T. D., Dube, T., Shekede, M. D., and Shoko, C.: Impacts of Climate Variability and Drought on Surface Water Resources in Sub-Saharan Africa Using Remote Sensing: A Review, Remote Sens., 12, 4184, https://doi.org/10.3390/rs12244184, 2020.
Bijaber, N., El Hadani, D., Saidi, M., Svoboda, M., Wardlow, B., Hain, C., Poulsen, C., Yessef, M., and Rochdi, A.: Developing a Remotely Sensed Drought Monitoring Indicator for Morocco, Geosciences, 8, 55, https://doi.org/10.3390/geosciences8020055, 2018.
Blatchford, M. L., Mannaerts, C. M., Njuki, S. M., Nouri, H., Zeng, Y., Pelgrum, H., Wonink, S., and Karimi, P.: Evaluation of WaPOR V2 evapotranspiration products across Africa, Hydrol. Process., 3, 1–22, https://doi.org/10.1002/hyp.13791, 2020.
Bolten, J. D., Crow, W. T., Zhan, X., Jackson, T. J., and Reynolds, C. A.: Evaluating the utility of remotely sensed soil moisture retrievals for operational agricultural drought monitoring, IEEE J. Select. Top. Appl. Earth Obs. Remote Sens., 3, 57–66, 2009.
Bonan, G. B.: Land surface model (LSM version 1.0) for ecological, hydrological, and atmospheric studies: Technical description and users guide, Technical note No. PB-97-131494/XAB; NCAR/TN-417-STR, National Center for Atmospheric Research, Climate and Global Dynamics Div., Boulder, CO, USA, http://n2t.net/ark:/85065/d78c9vm7 (last access: 14 July 2020), 1996.
Brocca, L., Crow, W. T., Ciabatta, L., Massari, C., De Rosnay, P., Enenkel, M., Hahn, S., Amarnath, G., Camici, S., and Tarpanelli, A.: A review of the applications of ASCAT soil moisture products, IEEE J. Select. Top. Appl. Earth Obs. Remote Sens., 10, 2285–2306, 2017.
Collatz, G. J., Ball, J. T., Grivet, C., and Berry, J. A.: Physiological and environmental regulation of stomatal conductance, photosynthesis and transpiration: a model that includes a laminar boundary layer, Agr. Forest Meteorol., 54, 107–136, 1991.
Cook, B. I., Mankin, J. S., and Anchukaitis, K. J.: Climate change and drought: From past to future, Curr. Clim. Change Rep., 4, 164–179, 2018.
Crow, W. T., Gomez, C. A., Sabater, J. M., Holmes, T., Hain, C. R., Lei, F., Dong, J., Alfieri, J. G., and Anderson, M. C.: Soil Moisture–Evapotranspiration Overcoupling and L-Band Brightness Temperature Assimilation: Sources and Forecast Implications, J. Hydrometeorol., 21, 2359–2374, https://doi.org/10.1175/JHM-D-20-0088.1, 2020.
Cui, C., Xu, J., Zeng, J., Chen, K.-S., Bai, X., Lu, H., Chen, Q., and Zhao, T.: Soil moisture mapping from satellites: An intercomparison of SMAP, SMOS, FY3B, AMSR2, and ESA CCI over two dense network regions at different spatial scales, Remote Sens., 10, 33, https://doi.org/10.3390/rs10010033, 2018.
Das, N. N., Entekhabi, D., Dunbar, R. S., Chaubell, M. J., Colliander, A., Yueh, S., Jagdhuber, T., Chen, F., Crow, W., and O'Neill, P. E.: The SMAP and Copernicus Sentinel 1A/B microwave active-passive high resolution surface soil moisture product, Remote Sens. Environ., 233, 111380, https://doi.org/10.1016/j.rse.2019.111380, 2019.
De Lannoy, G. J. M. and Reichle, R. H.: Assimilation of SMOS brightness temperatures or soil moisture retrievals into a land surface model, Hydrol. Earth Syst. Sci., 20, 4895–4911, https://doi.org/10.5194/hess-20-4895-2016, 2016.
Derber, J. C., Parrish, D. F., and Lord, S. J.: The new global operational analysis system at the National Meteorological Center, Weather Forecast., 6, 538–547, 1991.
Dickinson, R. E., Shaikh, M., and Climate, R. B. O.: Interactive canopies for a climate model, J. Climate, 11, 2823–2836, 1998.
Ek, M. B., Mitchell, K. E., Lin, Y., Rogers, E., Grunmann, P., Koren, V., Gayno, G., and Tarpley, J. D.: Implementation of Noah land surface model advances in the National Centers for Environmental Prediction operational mesoscale Eta model, J. Geophys. Res., 108, 8851, https://doi.org/10.1029/2002JD003296, 2003.
Eller, C. B., Rowland, L., Mencuccini, M., Rosas, T., Williams, K., Harper, A., Medlyn, B. E., Wagner, Y., Klein, T., Teodoro, G. S., Oliveira, R. S., Matos, I. S., Rosado, B. H. P., Fuchs, K., Wohlfahrt, G., Montagnani, L., Meir, P., Sitch, S., and Cox, P. M.: Stomatal optimization based on xylem hydraulics (SOX) improves land surface model simulation of vegetation responses to climate, New Phytol., 226, 1622–1637, https://doi.org/10.1111/nph.16419, 2020.
Entekhabi, D., Njoku, E. G., O'Neill, P. E., Kellogg, K. H., Crow, W. T., Edelstein, W. N., Entin, J. K., Goodman, S. D., Jackson, T. J., and Johnson, J.: The soil moisture active passive (SMAP) mission, Proc. IEEE, 98, 704–716, 2010.
FAO: WaPOR Database Methodology: Version 2 release, April 2020, FAO, Rome, 1–91, https://doi.org/10.4060/ca9894en, 2020.
Farr, T. G., Rosen, P. A., Caro, E., Crippen, R., Duren, R., Hensley, S., Kobrick, M., Paller, M., Rodriguez, E., and Roth, L.: The shuttle radar topography mission, Rev. Geophys., 45, 1–33, https://doi.org/10.1029/2005RG000183, 2007.
Felfelani, F., Pokhrel, Y., Guan, K., and Lawrence, D. M.: Utilizing SMAP soil moisture data to constrain irrigation in the Community Land Model, Geophys. Res. Lett., 45, 12–892–12–902, 2018.
Fisher, R. A.: On the Probable Error of a Coefficient of Correlation Deduced from a Small Sample, Metron, 1, 1–32, 1921.
Fragaszy, S. R., Jedd, T., Wall, N., Knutson, C., Belhaj Fraj, M., Bergaoui, K., Svoboda, M., Hayes, M., and McDonnell, R.: Drought Monitoring in the Middle East and North Africa (MENA) Region: Participatory Engagement to Inform Early Warning Systems, B. Am. Meteorol. Soc., 101, E1148–E1173, https://doi.org/10.1175/BAMS-D-18-0084.1, 2020.
Friedl, M. A., Sulla-Menashe, D., Tan, B., Schneider, A., Ramankutty, N., Sibley, A., and Huang, X.: MODIS Collection 5 global land cover: Algorithm refinements and characterization of new datasets, Remote Sens. Environ., 114, 168–182, 2010.
Funk, C., Peterson, P., Landsfeld, M., Pedreros, D., Verdin, J., Shukla, S., Husak, G., Rowland, J., Harrison, L., and Hoell, A.: The climate hazards infrared precipitation with stations – a new environmental record for monitoring extremes, Scient. Data, 2, 1–21, 2015.
Girotto, M., De Lannoy, G. J., Reichle, R. H., Rodell, M., Draper, C., Bhanja, S. N., and Mukherjee, A.: Benefits and pitfalls of GRACE data assimilation: A case study of terrestrial water storage depletion in India, Geophys. Res. Lett., 44, 4107–4115, 2017.
Guanter, L., Zhang, Y., Jung, M., Joiner, J., Voigt, M., Berry, J. A., Frankenberg, C., Huete, A. R., Zarco-Tejada, P., and Lee, J.-E.: Global and time-resolved monitoring of crop photosynthesis with chlorophyll fluorescence, P. Natl. Acad. Sci. USA, 111, E1327–E1333, 2014.
Hayes, M. J., Svoboda, M. D., Wardlow, B. D., Anderson, M. C., and Kogan, F.: Drought monitoring: Historical and current perspectives, Digital Commons @ University of Nebraska, Lincoln, https://digitalcommons.unl.edu/droughtfacpub/94 (last access: 14 July 2020), 2012.
Hengl, T., Mendes de Jesus, J., Heuvelink, G. B., Ruiperez Gonzalez, M., Kilibarda, M., Blagotić, A., Shangguan, W., Wright, M. N., Geng, X., and Bauer-Marschallinger, B.: SoilGrids250m: Global gridded soil information based on machine learning, PLoS ONE, 12, e0169748, https://doi.org/10.1371/journal.pone.0169748, 2017.
Hssaisoune, M., Bouchaou, L., Sifeddine, A., Bouimetarhan, I., and Chehbouni, A.: Moroccan Groundwater Resources and Evolution with Global Climate Changes, Geosciences, 12, 81, https://doi.org/10.3390/geosciences10020081, 2020.
Huffman, G. J., Bolvin, D. T., Braithwaite, D., Hsu, K., Joyce, R., Xie, P., and Yoo, S.-H.: NASA global precipitation measurement (GPM) integrated multi-satellite retrievals for GPM (IMERG), Algorithm Theoretical Basis Document (ATBD) Version 4, NASA/GSFC, 26 pp., 2015.
Ines, A. V. M., Das, N. N., Hansen, J. W., and Njoku, E. G.: Assimilation of remotely sensed soil moisture and vegetation with a crop simulation model for maize yield prediction, Remote Sens. Environ., 138, 149–164, https://doi.org/10.1016/j.rse.2013.07.018, 2013.
Jalilvand, E., Abolafia-Rosenzweig, R., Tajrishy, M., and Das, N. N.: Evaluation of SMAP/Sentinel 1 High-resolution soil moisture data to detect irrigation over agricultural domain, IEEE J. Select. Top. Appl. Earth Obs. Remote Sens., 14, 10733–10747, 2021.
Jedd, T., Fragaszy, S. R., Knutson, C., Hayes, M. J., Fraj, M. B., Wall, N., Svoboda, M., and McDonnell, R.: Drought Management Norms: Is the Middle East and North Africa Region Managing Risks or Crises?, J. Environ. Dev., 116, 107049652096020-38, https://doi.org/10.1177/1070496520960204, 2020.
Joiner, J., Guanter, L., Lindstrot, R., Voigt, M., Vasilkov, A. P., Middleton, E. M., Huemmrich, K. F., Yoshida, Y., and Frankenberg, C.: Global monitoring of terrestrial chlorophyll fluorescence from moderate-spectral-resolution near-infrared satellite measurements: methodology, simulations, and application to GOME-2, Atmos. Meas. Tech., 6, 2803–2823, https://doi.org/10.5194/amt-6-2803-2013, 2013.
Joiner, J., Yoshida, Y., Zhang, Y., Duveiller, G., Jung, M., Lyapustin, A., Wang, Y., and Tucker, C.: Estimation of Terrestrial Global Gross Primary Production (GPP) with Satellite Data-Driven Models and Eddy Covariance Flux Data, Remote Sens., 10, 1346, https://doi.org/10.3390/rs10091346, 2018.
Kandasamy, S., Baret, F., Verger, A., Neveux, P., and Weiss, M.: A comparison of methods for smoothing and gap filling time series of remote sensing observations – application to MODIS LAI products, Biogeosciences, 10, 4055–4071, https://doi.org/10.5194/bg-10-4055-2013, 2013.
Kerr, Y. H., Wigneron, J. P., Al Bitar, A., Mialon, A., and Srivastava, P. K.: Soil moisture from space: Techniques and limitations, Satellite Soil Moisture Retrieval, 3–27, https://doi.org/10.1016/B978-0-12-803388-3.00001-2, 2016.
Kharrou, M. H., Er-Raki, S., Chehbouni, A., Duchemin, B., Simonneaux, V., LePage, M., Ouzine, L., and Jarlan, L.: Water use efficiency and yield of winter wheat under different irrigation regimes in a semi-arid region, Agricult. Sci., 2, 273–282, https://doi.org/10.4236/as.2011.23036, 2011.
Kolassa, J., Reichle, R., Liu, Q., Cosh, M., Bosch, D., Caldwell, T., Colliander, A., Holifield Collins, C., Jackson, T., Livingston, S., Moghaddam, M., and Starks, P.: Data Assimilation to Extract Soil Moisture Information from SMAP Observations, Remote Sens., 9, 1179, https://doi.org/10.3390/rs9111179, 2017.
Kumar, S. V., Peters-Lidard, C. D., Tian, Y., Houser, P. R., Geiger, J., Olden, S., Lighty, L., Eastman, J. L., Doty, B., and Dirmeyer, P.: Land information system: An interoperable framework for high resolution land surface modeling, Environ. Model. Softw., 21, 1402–1415, 2006.
Kumar, S. V., Reichle, R. H., Harrison, K. W., Peters-Lidard, C. D., Yatheendradas, S., and Santanello, J. A.: A comparison of methods for a priori bias correction in soil moisture data assimilation, Water Resour. Res., 48, W03515, https://doi.org/10.1029/2010WR010261, 2012.
Kumar, S. V., Peters-Lidard, C. D., Mocko, D., Reichle, R., Liu, Y., Arsenault, K. R., Xia, Y., Ek, M., Riggs, G., and Livneh, B.: Assimilation of remotely sensed soil moisture and snow depth retrievals for drought estimation, J. Hydrometeorol., 15, 2446–2469, 2014.
Kumar, S. V., Zaitchik, B. F., Peters-Lidard, C. D., Rodell, M., Reichle, R., Li, B., Jasinski, M., Mocko, D., Getirana, A., and De Lannoy, G.: Assimilation of gridded GRACE terrestrial water storage estimates in the North American Land Data Assimilation System, J. Hydrometeorol., 17, 1951–1972, 2016.
Kumar, S. V., Dirmeyer, P. A., Peters-Lidard, C. D., Bindlish, R., and Bolten, J.: Information theoretic evaluation of satellite soil moisture retrievals, Remote Sens. Environ., 204, 392–400, 2018.
Kumar, S. V., Jasinski, M., Mocko, D. M., Rodell, M., Borak, J., Li, B., Beaudoing, H. K., and Peters-Lidard, C. D.: NCA-LDAS land analysis: Development and performance of a multisensor, multivariate land data assimilation system for the National Climate Assessment, J. Hydrometeorol., 20, 1571–1593, 2019a.
Kumar, S. V., Mocko, D., Wang, S., Peters-Lidard, C. D., and Borak, J.: Assimilation of Remotely Sensed Leaf Area Index into the Noah-MP Land Surface Model: Impacts on Water and Carbon Fluxes and States over the Continental United States, J. Hydrometeorol., 20, 1359–1377, https://doi.org/10.1175/JHM-D-18-0237.1, 2019b.
Kumar, S. V., Holmes, T. R., Bindlish, R., de Jeu, R., and Peters-Lidard, C.: Assimilation of vegetation optical depth retrievals from passive microwave radiometry, Hydrol. Earth Syst. Sci., 24, 3431–3450, https://doi.org/10.5194/hess-24-3431-2020, 2020.
Lawston, P. M., Santanello Jr., J. A., and Kumar, S. V.: Irrigation signals detected from SMAP soil moisture retrievals, Geophys. Res. Lett., 44, 11-860–11-867, 2017.
Lei, F., Crow, W. T., Kustas, W. P., Dong, J., Yang, Y., Knipper, K. R., Anderson, M. C., Gao, F., Notarnicola, C., Greifeneder, F., McKee, L. M., Alfieri, J. G., Hain, C., and Dokoozlian, N.: Data assimilation of high-resolution thermal and radar remote sensing retrievals for soil moisture monitoring in a drip-irrigated vineyard, Remote Sens. Environ., 239, 111622, https://doi.org/10.1016/j.rse.2019.111622, 2020.
Li, C., Lu, H., Yang, K., Han, M., Wright, J. S., Chen, Y., Yu, L., Xu, S., Huang, X., and Gong, W.: The evaluation of SMAP enhanced soil moisture products using high-resolution model simulations and in-situ observations on the Tibetan Plateau, Remote Sens., 10, 535, https://doi.org/10.3390/rs10040535, 2018.
Lievens, H., Reichle, R. H., Liu, Q., De Lannoy, G. J. M., Dunbar, R. S., Kim, S. B., Das, N. N., Cosh, M., Walker, J. P., and Wagner, W.: Joint Sentinel-1 and SMAP data assimilation to improve soil moisture estimates, Geophys. Res. Lett., 44, 6145–6153, https://doi.org/10.1002/2017GL073904, 2017.
Liu, Q., Reichle, R. H., Bindlish, R., Cosh, M. H., Crow, W. T., de Jeu, R., De Lannoy, G. J., Huffman, G. J., and Jackson, T. J.: The contributions of precipitation and soil moisture observations to the skill of soil moisture estimates in a land data assimilation system, J. Hydrometeorol., 12, 750–765, 2011.
Liu, X., Chen, F., Barlage, M., Zhou, G., and Niyogi, D.: Noah-MP-Crop: Introducing dynamic crop growth in the Noah-MP land surface model, J. Geophys. Res.-Atmos., 121, 13953–13972, https://doi.org/10.1002/2016JD025597, 2016.
Liu, Y., Kumar, M., Katul, G. G., Feng, X., and Konings, A. G.: Plant hydraulics accentuates the effect of atmospheric moisture stress on transpiration, Nat. Clim. Change, 10, 691–695, https://doi.org/10.1038/s41558-020-0781-5, 2020.
Meier, J., Zabel, F., and Mauser, W.: A global approach to estimate irrigated areas – a comparison between different data and statistics, Hydrol. Earth Syst. Sci., 22, 1119–1133, https://doi.org/10.5194/hess-22-1119-2018, 2018.
Mocko, D. M., Kumar, S. V., Peters-Lidard, C. D., and Wang, S.: Assimilation of vegetation conditions improves the representation of drought over agricultural areas, J. Hydrometeorol., 22, 1085–1098, https://doi.org/10.1175/JHM-D-20-0065.1, 2021.
MODIS15: MODIS Collectio 6 (C6) LAI/FPAR Product User's Guide, p. 13, https://lpdaac.usgs.gov/documents/624/MOD15_User_Guide_V6.pdf, last access: 20 July 2020.
Molle, F. and Sanchis-Ibor, C.: Irrigation policies in the Mediterranean: Trends and challenges, Irrigation in the Mediterranean, Springer, Cham, 279–313, ISBN 13 978-3030036966, 2019.
Müller, M. F., Müller-Itten, M. C., and Gorelick, S. M.: How Jordan and Saudi Arabia are avoiding a tragedy of the commons over shared groundwater, Water Resour. Res., 53, 5451–5468, 2017.
Myneni, R., Knyazikhin, Y., and Park, T.: MCD15A2H MODIS/Terra+Aqua Leaf Area Index/FPAR 8-day L4 Global 500 m SIN Grid V006, NASA EOSDIS Land Processes DAAC [data set], https://doi.org/10.5067/MODIS/MCD15A2H.061, 2015.
Nearing, G., Yatheendradas, S., Crow, W., Zhan, X., Liu, J., and Chen, F.: The efficiency of data assimilation, Water Resour. Res., 54, 6374–6392, 2018.
Nie, W., Zaitchik, B. F., Rodell, M., Kumar, S. V., Anderson, M. C., and Hain, C.: Groundwater withdrawals under drought: Reconciling GRACE and land surface models in the United States High Plains Aquifer, Water Resour. Res., 54, 5282–5299, 2018.
Nie, W., Kumar, S. V., Arsenault, K. R., Peters-Lidard, C. D., Mladenova, I. E., Bergaoui, K., Hazra, A., Zaitchik, B. F., Mahanama, S. P., McDonnell, R., Mocko, D. M., and Navari, M.: Data associated with the publication: Towards effective drought monitoring in the Middle East and North Africa (MENA) region: Implications from assimilating leaf area index and soil moisture into the Noah-MP land surface model for Morocco, V1, Johns Hopkins University Data Archive [data set], https://doi.org/10.7281/T1/X4MXHC, 2022.
Niu, G. Y., Yang, Z. L., Mitchell, K. E., Chen, F., Ek, M. B., Barlage, M., Kumar, A., Manning, K., Niyogi, D., Rosero, E., Tewari, M., and Xia, Y.: The community Noah land surface model with multiparameterization options (Noah-MP): 1. Model description and evaluation with local-scale measurements, J. Geophys. Res., 116, 1381–1419, https://doi.org/10.1029/2010JD015139, 2011.
Niu, G. Y., Fang, Y. H., Chang, L. L., Jin, J., Yuan, H., and Zeng, X.: Enhancing the Noah-MP Ecosystem Response to Droughts with an Explicit Representation of Plant Water Storage Supplied by Dynamic Root Water Uptake, J. Adv. Model. Earth Syst., 12, 1–29, https://doi.org/10.1029/2020MS002062, 2020.
O'Neill, P. E., Chan, S., Njoku, E. G., Jackson, T., Bindlish, R., and Chaubell, J.: SMAP Enhanced L3 Radiometer Global Daily 9 km EASE-Grid Soil Moisture, Version 4, NASA National Snow and Ice Data Center Distributed Active Archive Center, Boulder, Colorado, USA, https://doi.org/10.5067/T90W6VRLCBHI, 2020.
Ozdogan, M., Rodell, M., Beaudoing, H. K., and Toll, D. L.: Simulating the effects of irrigation over the United States in a land surface model based on satellite-derived agricultural data, J. Hydrometeorol., 11, 171–184, 2010.
Pachauri, R. K., Allen, M. R., Barros, V. R., Broome, J., Cramer, W., Christ, R., Church, J. A., Clarke, L., Dahe, Q., and Dasgupta, P.: Climate change 2014: synthesis report, in: Contribution of Working Groups I, II and III to the fifth assessment report of the Intergovernmental Panel on Climate Change, IPCC, 2014.
Pulwarty, R. S. and Sivakumar, M. V. K.: Information systems in a changing climate_Early warnings and drought risk management, Weather Clim. Extrem., 3, 14–21, https://doi.org/10.1016/j.wace.2014.03.005, 2014.
Rajsekhar, D. and Gorelick, S. M.: Increasing drought in Jordan: Climate change and cascading Syrian land-use impacts on reducing transboundary flow, Sci. Adv., 3, e1700581, https://doi.org/10.1126/sciadv.1700581, 2017.
Reichle, R. H.: Data assimilation methods in the Earth sciences, Adv. Water Resour., 31, 1411–1418, 2008.
Reichle, R. H. and Koster, R. D.: Bias reduction in short records of satellite soil moisture, Geophys. Res. Lett., 31, L19501, https://doi.org/10.1029/2004GL020938, 2004.
Reichle, R. H., McLaughlin, D. B., and Entekhabi, D.: Hydrologic data assimilation with the ensemble Kalman filter, Mon. Weather Rev., 130, 103–114, 2002.
Rienecker, M. M., Suarez, M. J., Gelaro, R., Todling, R., Bacmeister, J., Liu, E., Bosilovich, M. G., Schubert, S. D., Takacs, L., and Kim, G.-K.: MERRA: NASA's modern-era retrospective analysis for research and applications, J. Climate, 24, 3624–3648, 2011.
Rossini, M., Nedbal, L., Guanter, L., Ač, A., Alonso, L., Burkart, A., Cogliati, S., Colombo, R., Damm, A., and Drusch, M.: Red and far red Sun-induced chlorophyll fluorescence as a measure of plant photosynthesis, Geophys. Res. Lett., 42, 1632–1639, 2015.
Ryu, D., Crow, W. T., Zhan, X., and Jackson, T. J.: Correcting unintended perturbation biases in hydrologic data assimilation, J. Hydrometeorol., 10, 734–750, 2009.
Salmon, J. M., Friedl, M. A., Frolking, S., Wisser, D., and Douglas, E. M.: Global rain-fed, irrigated, and paddy croplands: A new high resolution map derived from remote sensing, crop inventories and climate data, Int. J. Appl. Earth Obs. Geoinf., 38, 321–334, 2015.
Sheffield, J., Xia, Y., Luo, L., Wood, E. F., Ek, M., and Mitchell, K. E.: Drought monitoring with the North American Land Data Assimilation System (NLDAS): A framework for merging model and satellite data for improved drought monitoring, Remote Sensing of Drought: Innovative Monitoring Approaches, Taylor & Friends Group, 227–259, https://doi.org/10.1201/b11863, 2012.
Stanke, C., Kerac, M., Prudhomme, C., Medlock, J., and Murray, V.: Health effects of drought: a systematic review of the evidence, PLoS Currents, 5, https://doi.org/10.1371/currents.dis.7a2cee9e980f91ad7697b570, 2013.
Tavakol, A., Rahmani, V., Quiring, S. M., and Kumar, S. V.: Evaluation analysis of NASA SMAP L3 and L4 and SPoRT-LIS soil moisture data in the United States, Remote Sen. Environ., 229, 234–246, 2019.
Thenkabail, P. S., Biradar, C. M., Noojipady, P., Dheeravath, V., Li, Y., Velpuri, M., Gumma, M., Gangalakunta, O. R. P., Turral, H., and Cai, X.: Global irrigated area map (GIAM), derived from remote sensing, for the end of the last millennium, Int. J. Remote Sens., 30, 3679–3733, 2009.
Tramontana, G., Jung, M., Schwalm, C. R., Ichii, K., Camps-Valls, G., Ráduly, B., Reichstein, M., Arain, M. A., Cescatti, A., Kiely, G., Merbold, L., Serrano-Ortiz, P., Sickert, S., Wolf, S., and Papale, D.: Predicting carbon dioxide and energy fluxes across global FLUXNET sites with regression algorithms, Biogeosciences, 13, 4291–4313, https://doi.org/10.5194/bg-13-4291-2016, 2016.
Verner, D., Treguer, D., Redwood, J., Christensen, J., McDonnell, R., Elbert, C., Konishi, Y., and Belghazi, S.: Climate Variability, Drought, and Drought Management in Morocco's Agricultural Sector, World Bank, https://doi.org/10.1596/30603, 2018.
Weerasinghe, I., Bastiaanssen, W., Mul, M., Jia, L., and van Griensven, A.: Can we trust remote sensing evapotranspiration products over Africa?, Hydrol. Earth Syst. Sci., 24, 1565–1586, https://doi.org/10.5194/hess-24-1565-2020, 2020.
Weinthal, E., Zawahri, N., and Sowers, J.: Securitizing water, climate, and migration in Israel, Jordan, and Syria, Intern. Environ. Agreements, 15, 293–307, 2015.
Xie, Y., Wang, P., Bai, X., Khan, J., Zhang, S., Li, L., and Wang, L.: Assimilation of the leaf area index and vegetation temperature condition index for winter wheat yield estimation using Landsat imagery and the CERES-Wheat model, Agr.d Forest Meteorol., 246, 194–206, 2017.
Yan, K., Park, T., Yan, G., Chen, C., Yang, B., Liu, Z., Nemani, R. R., Knyazikhin, Y., and Myneni, R. B.: Evaluation of MODIS LAI/FPAR product collection 6. Part 1: Consistency and improvements, Remote Sens., 8, 359, https://doi.org/10.3390/rs8050359, 2016a.
Yan, K., Park, T., Yan, G., Liu, Z., Yang, B., Chen, C., Nemani, R. R., Knyazikhin, Y., and Myneni, R. B.: Evaluation of MODIS LAI/FPAR product collection 6. Part 2: Validation and intercomparison, Remote Sens., 8, 460, https://doi.org/10.3390/rs8060460, 2016b.
Yang, Z. L., Niu, G. Y., Mitchell, K. E., Chen, F., Ek, M. B., Barlage, M., Longuevergne, L., Manning, K., Niyogi, D., and Tewari, M.: The community Noah land surface model with multiparameterization options (Noah-MP): 2. Evaluation over global river basins, J. Geophys. Res., 116, D12109, https://doi.org/10.1029/2010JD015139, 2011.
Zhang, R., Kim, S., and Sharma, A.: A comprehensive validation of the SMAP Enhanced Level-3 Soil Moisture product using ground measurements over varied climates and landscapes, Remote Sens. Environ., 223, 82–94, 2019.