the Creative Commons Attribution 4.0 License.
the Creative Commons Attribution 4.0 License.
 | 24 Feb 2021
A novel causal structure-based framework for comparing a basin-wide water–energy–food–ecology nexus applied to the data-limited Amu Darya and Syr Darya river basins
Haiyang Shi
Geping Luo
Hongwei Zheng
Chunbo Chen
Olaf Hellwich
Tie Liu
Shuang Liu
Jie Xue
Peng Cai
Huili He
Friday Uchenna Ochege
Tim Van de Voorde
Philippe de Maeyer
The previous comparative studies on watersheds were mostly based on the comparison of dispersive characteristics, which lacked systemicity and causality. We proposed a causal structure-based framework for basin comparison based on the Bayesian network (BN) and focus on the basin-scale water–energy–food–ecology (WEFE) nexus. We applied it to the Syr Darya River basin (SDB) and the Amu Darya River basin (ADB), of which poor water management caused the Aral Sea disaster. The causality of the nexus was effectively compared and universality of this framework was discussed. In terms of changes in the nexus, the sensitive factor for the water supplied to the Aral Sea changed from the agricultural development during the Soviet Union period to the disputes in the WEFE nexus after the disintegration. The water–energy contradiction of the SDB is more severe than that of the ADB, partly due to the higher upstream reservoir interception capacity. It further made management of the winter surplus water downstream of the SDB more controversial. Due to this, the water–food–ecology conflict between downstream countries may escalate and turn into a long-term chronic problem. Reducing water inflow to depressions and improving the planting structure prove beneficial to the Aral Sea ecology, and this effect of the SDB is more significant. The construction of reservoirs on the Panj River of the upstream ADB should be cautious to avoid an intense water–energy conflict such as the SDB's. It is also necessary to promote the water-saving drip irrigation and to strengthen the cooperation.
- Article
(18401 KB) - Full-text XML
- BibTeX
- EndNote


The Aral Sea disaster has warned us of the terrible impact of unsustainable water use on the ecosystem. Recently, with the growing focus on the water–energy–food (WEF) nexus (Biggs et al., 2015; Cai et al., 2018; Conway et al., 2015; Espinosa-Tasón et al., 2020; Sadeghi et al., 2020; Yang and Wi, 2018) in integrated water resource management, we have come to realize that a harmonious and optimized water–energy–food–ecology (WEFE) nexus may be the key to effective cross-border water management of the Aral Sea basin (Jalilov et al., 2016, 2018; Lee and Jung, 2018; Ma et al., 2020; Sun et al., 2019), with “ecology” added to the WEF nexus because ecology is usually more concerned in the Aral Sea basin. The latter mainly includes the Syr Darya River basin (SDB) and the Amu Darya River basin (ADB). Due to the similarity in the natural geographical conditions and management approaches, these two basins are generally considered to be very similar. The rapid melting of glaciers, drought disasters, excessive irrigation water use, increasing food demand, contradictions on water for the energy production and irrigation between the upstream and downstream countries, soil salinization and poor water quality are the common problems the two basins are facing nowadays (Immerzeel et al., 2020; Micklin, 2010). However, there seems to be a lack of attention to the quantitative differences on the characteristics of the interactions of the WEFE nexus between the two river basins. We want to understand the differences and their levels and think about what experience can be gained from it. The practice of an integrated watershed management often draws on the experience and lessons of other watersheds with similar natural conditions, such as management concepts, hydrological model applications and climate change risk assessments (Grafton et al., 2012; Immerzeel et al., 2020; Joetzjer et al., 2013; Ladson and Argent, 2002; Syed et al., 2005; Vetter et al., 2017; Wang et al., 2020; Zawahri, 2008). Most of these previous studies investigated the differences of dispersive or individual characteristics between the river basins but lacked attention to the systemicity and causality (Fig. 1) in the changing water systems at the basin scale, which may be able to more directly provide new experience and knowledge for practical watershed management. In the SDB and ADB, this kind of comparison might be more practical and meaningful on the application level (based on a higher similarity in the natural conditions and management history). Learning from each other's successes and failures could reduce the trial-and-error costs in the water use management. For example, the seasonal runoff pattern and its impact on the water use of the SDB nowadays with a low glacier cover might be considered a reference for the water use management of the ADB, if most glaciers would melt in a warmer future (Sorg et al., 2012). Analogously, such comparisons are focusing on the detailed differences under a general similarity and might also be helpful for understanding the WEFE nexus and a better assignment of the detailed responsibilities of countries regarding transboundary watershed cooperation and management.
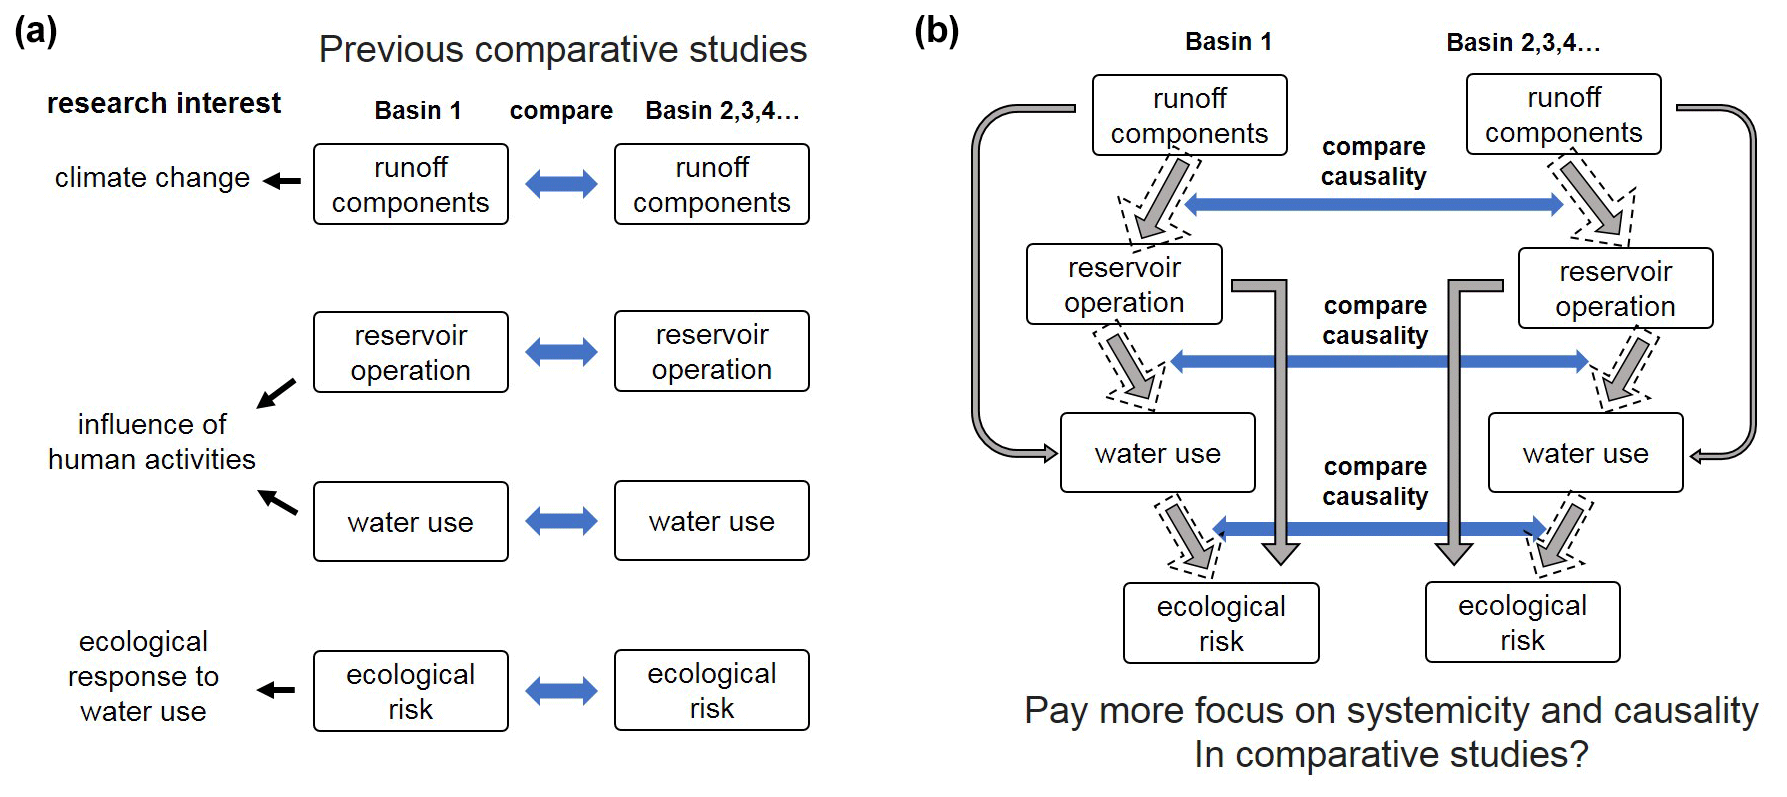
Figure 1Previous comparative studies focusing on local or individual aspects (a), and more attention should be directed to the identification and comparison of causality and systemicity between river basins (b).
When studying the water system and the WEFE nexus in the Aral Sea basin, we found that the first main source of uncertainty might include the fact that it is difficult for us to accurately predict the runoff amount from the mountainous areas. In the arid regions of central Asia, most of the available water resources originate from the precipitation, melting snow and glaciers of the water towers in the alpine areas. However, the observations of the water resources in the mountainous areas of this region have been greatly restricted (Chen et al., 2017), especially after the collapse of the Union of Soviet Socialist Republics (USSR), and some gauging stations were abandoned. It has restricted the implementation of the physics-based and statistical models for the runoff prediction, although remote-sensing technology proved helpful in the estimation of the alpine precipitation and glacier melting (Guo et al., 2017; Pohl et al., 2017) as forcing data. In addition, the weak prediction capacity of incoming water might propagate the uncertainty in the downstream water use, food production, energy production, ecology and their interactions in the WEFE nexus. Facing the uncertainty of the amount of incoming water and some other exogenous sources such as climate change and population growth, some models concerning the WEF nexus that are commonly used now may not work well. Previous studies focused more on the WEF nexus in integrated water resource management (IWRM) (Cai et al., 2018) and many current WEF nexus studies applied the system analysis or integrated process-based model methods (Daher and Mohtar, 2015; Jalilov et al., 2018; Kaddoura and El Khatib, 2017; Lee et al., 2019, 2020; Payet-Burin et al., 2019; Zhang and Vesselinov, 2017). However, in order to parameterize these models, we found that many empirical parameters or factors need to be set (Feng et al., 2016; Ravar et al., 2020), which could mask the shortcomings of an insufficient understanding of uncertain and complex processes. For example, empirical coefficients were used to determine the conversion coefficient of electricity demand for pumping water from different depths and energy demand coefficients of various water sectors (Ravar et al., 2020), including the driving functions of water supply, power generation and hydro-ecology (Feng et al., 2016). The effectiveness depends on our judgements of the values of each parameter under various conditions, but we might ignore the dynamic influence of the probability distribution of some remotely related causal variables. In order to improve this, we considered a longer causal chain matching of the uncertainty propagation process and to obtain details on the possibility distributions of the parameters' values under various combinations of multiple conditions. Therefore, we realized that the Bayesian network might prove to be an effective tool for these two problems.
The Bayesian network (BN) is based on Bayesian theory and graph theory (Friedman et al., 1997; Pearl, 1985). It can simulate complex causal relationships, integrate expert knowledge from multiple fields and has shown its advantages in water resource research and management (Chan et al., 2010; Fienen et al., 2013; Giordano et al., 2013; Hines and Landis, 2014; Hunter et al., 2011; Nash and Hannah, 2011; Pagano et al., 2014; Quinn et al., 2013; Taner et al., 2019; Xue et al., 2017). In our previous study, the WEFE nexus in the single SDB was simulated based on a BN (Shi et al., 2020), which also demonstrated its advantages in terms of uncertainty quantification. Based on this, we try to explore the framework significance and portability of this method when applied to other watersheds for comparing watershed systemic behaviours focusing more on the global causality, which aimed at obtaining the universal evolution law and discovering the specific differences of the basin-wide WEFE nexus.
The research goals of this paper mainly include (1) proposing a causal structure-based framework to compare the basin-wide WEFE nexus and applying it to the SDB and ADB with the BN method, (2) comparing the differences in historical and current causality of the WEFE nexus and water use between the SDB and ADB within the new framework and (3) proposing a comprehensive optimization proposal of the WEFE nexus management.
We propose a new framework (Fig. 2) for comparing the basin-wide WEFE nexus and watershed management representing the causal structure based on combining the similar causal structure and data differences. Under different levels of similarity, similar causal structures generated by expert knowledge are combined with the observation and statistical datasets of different river basins. The elements of the WEFE nexus can be adjusted to a water–energy nexus, water–food–ecological nexus (Fig. 2), etc., according to the dynamic research aims and similarity levels among the specifically investigated river basins.
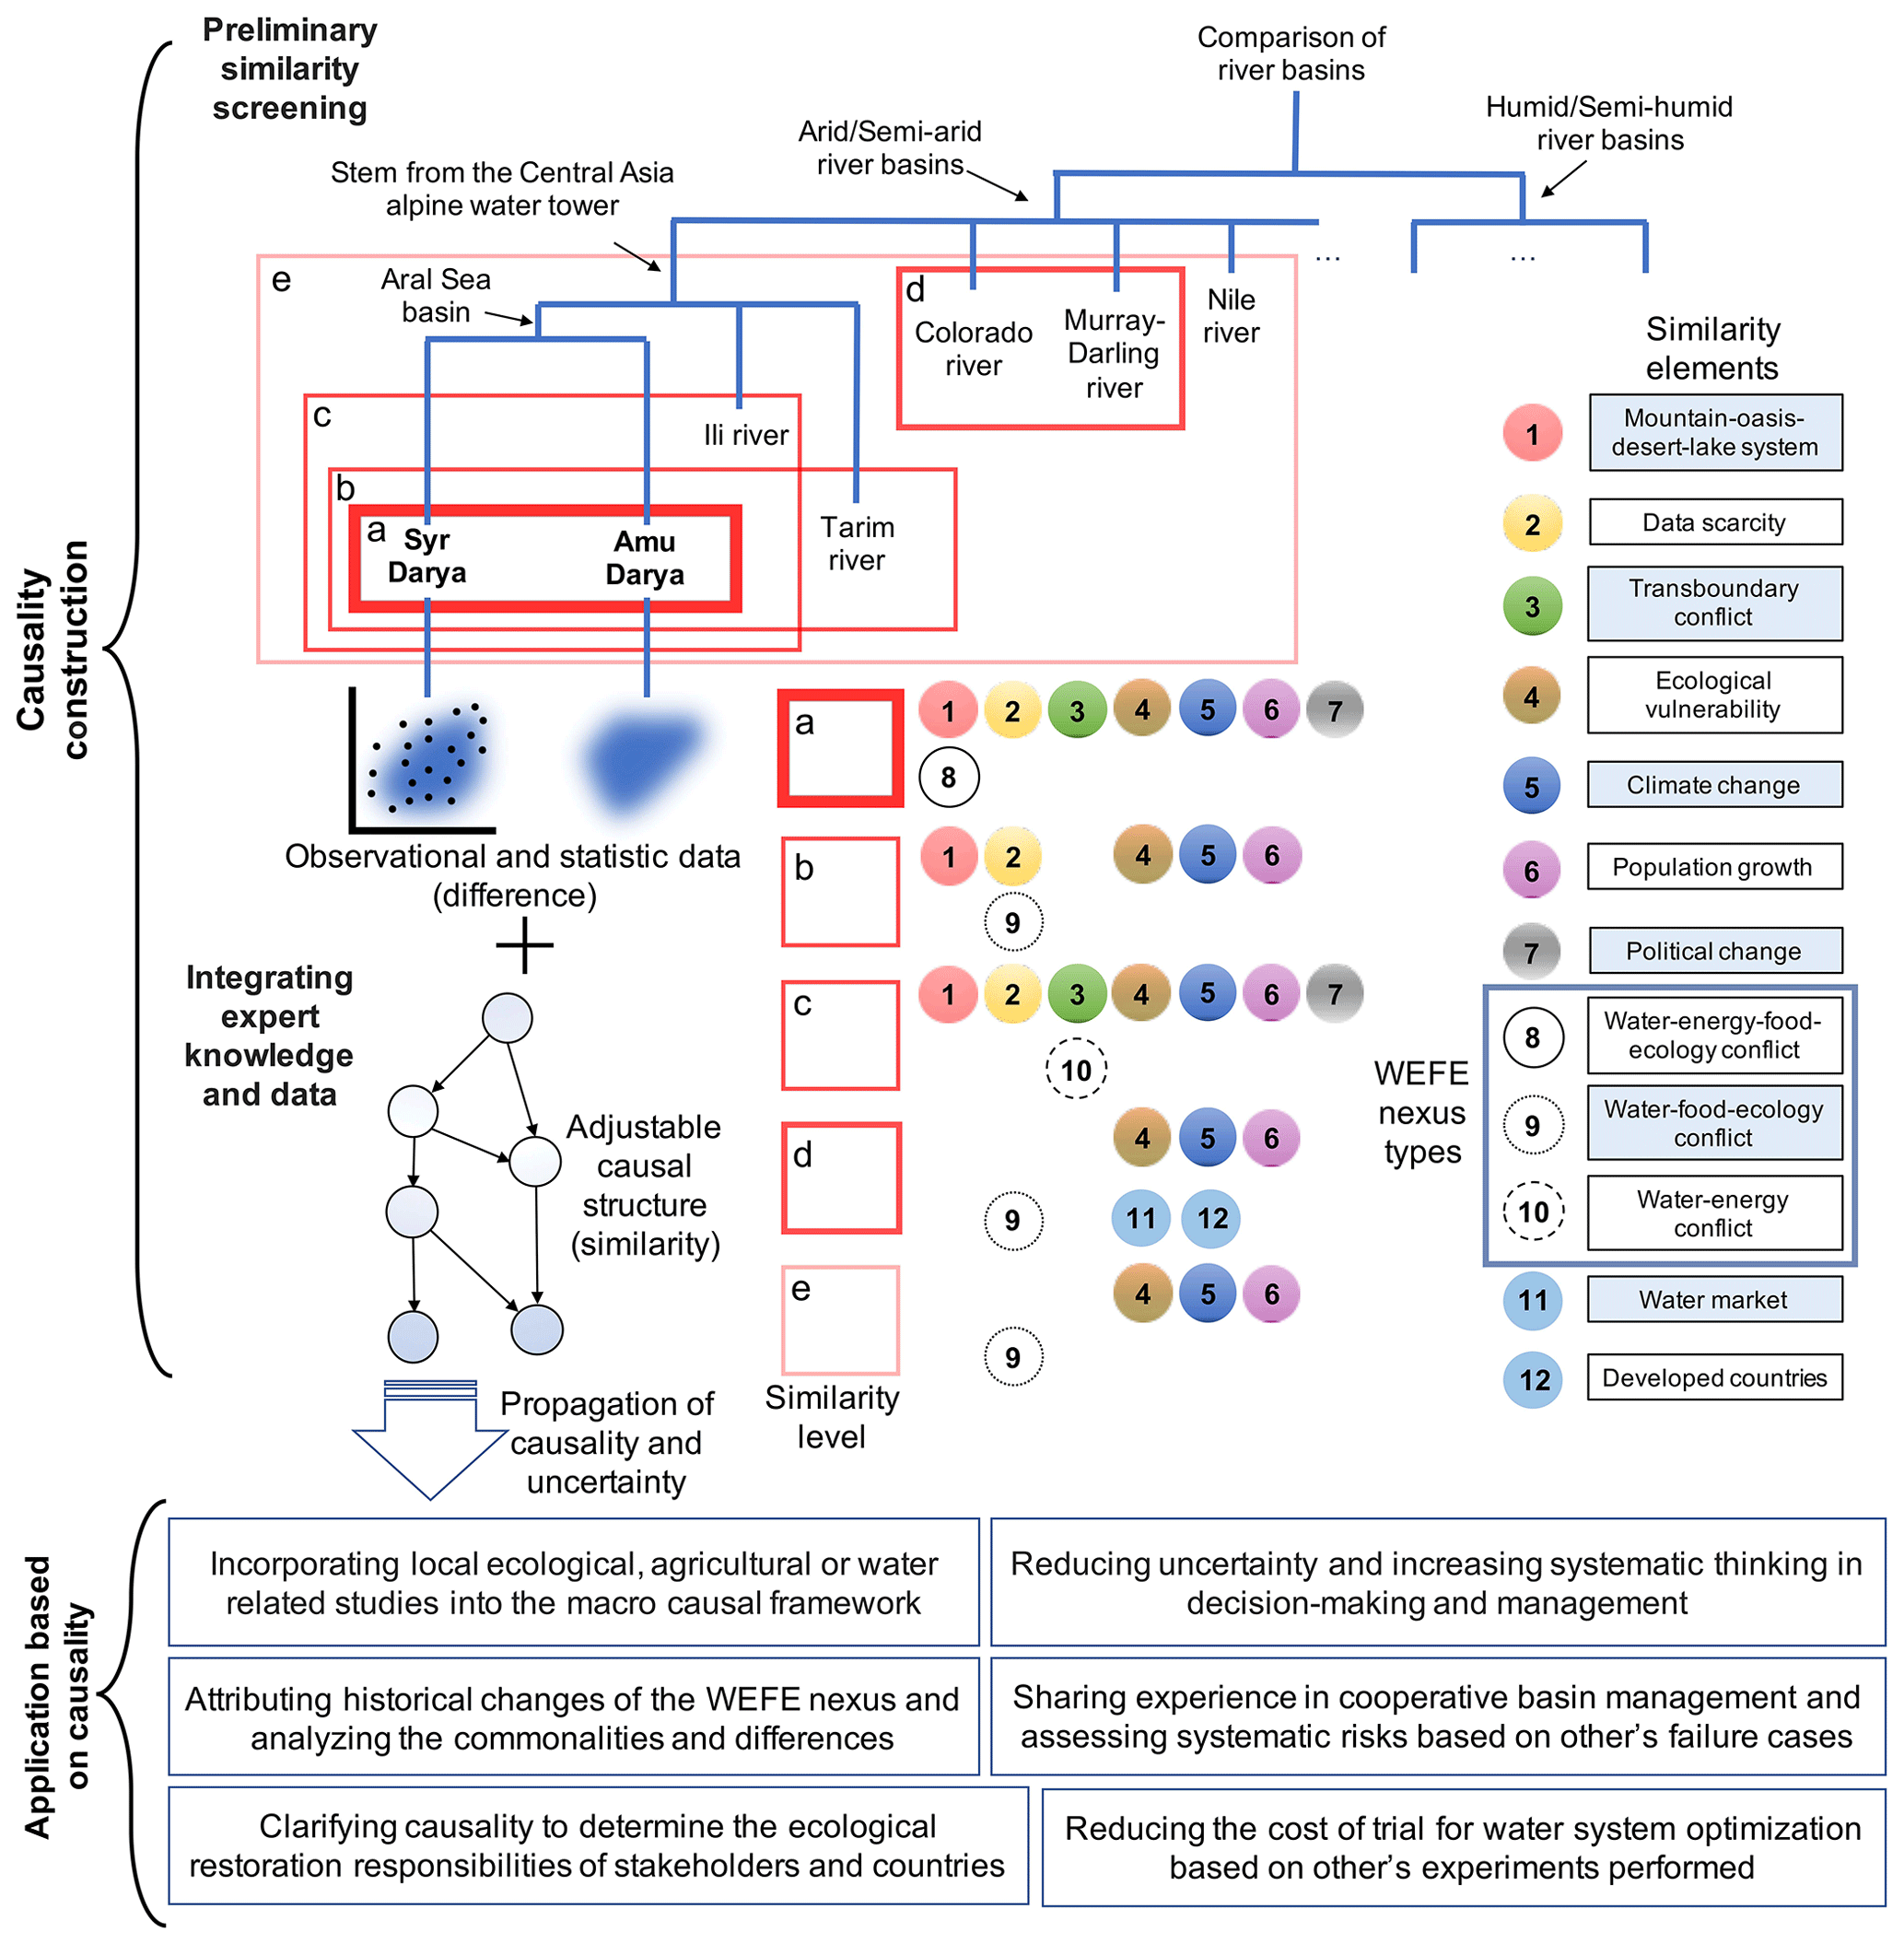
Figure 2The new generalized basin-wide water–energy–food–ecology nexus comparison framework based on combining the similar causal structure and data differences. The upper tree structure shows the a priori classification of river basins, and the arid/semi-arid branch is more subdivided. The lower left part illustrates the operation mode of the new basin comparison framework: combining the similar causal structure determined by experts and the multi-dimensional observation dataset containing differences. The red boxes marked with a–e contain elements identified by the 1–12 serial numbers on the right that measure similarities at different levels. Numbers 8–10 show the different water–energy–food–ecology-related nexus types adjusted according to boxes a–e. River basins in the same red box can be compared by a specific structure of causality generated by the elements the box contains. The bottom part shows the significance of the application under this new framework.
The steps of the workflow of the framework are as follows.
-
We conduct a preliminary screening of the basin. Such a screening can be based on a similar geographic region, landform, climate type, etc., which reflect the basic natural conditions. Based on other factors such as whether the river is transboundary, whether the country that manages the basin is economically developed, etc., we further filter the selected basins.
-
We construct a same WEFE nexus causality structure for the river basins selected in the previous step, which can be represented by a directed graph model such as the Bayesian network. In this step, we need to balance the degree of refinement of the causal relationship structure and its universality in the selected river basins. The conceptual structure constructed should be reviewed by a panel of experts and revised if necessary. This feedback can help to identify key variables or processes that have been overlooked so as to correct errors in the conceptual structure. In some cases, it may be appropriate to build a conceptual structure with stakeholder groups, especially if the model will be used as a management tool and the results will affect stakeholders (Chan et al., 2010; Chen and Pollino, 2012). At the same time, the availability of actual expert knowledge and data should also be considered to avoid constructing a causal structure that is too detailed so that the available expert knowledge and data are not enough to fill it or too rough that the causal relationship is underfitted so as to avoid underutilization of knowledge and data (Chen and Pollino, 2012; Marcot et al., 2006). Including insignificant variables will increase the complexity of the network and reduce the sensitivity of the model output to important variables, unnecessarily spending extra time and effort, and will not add value to the entire model (Chen and Pollino, 2012).
-
In this step, we combine the causal structure representing expert knowledge from multiple fields with actual statistics and observation data to update the initial understanding of causality (Cain, 2001; Chan et al., 2010; Chen and Pollino, 2012; Marcot et al., 2006). Expert judgment based on past observations, knowledge and experience can be used to provide an initial estimate of the probability, which can then be updated with the available observation data (Chen and Pollino, 2012). The ability to use expert opinions to parameterize the BN model is an advantage, especially for environmental systems that have few quantitative data required for statistical modelling methods (Smith et al., 2007). In this way, the conditional probability table of the original causal structure is updated with actual data, and the originally scattered actual data are closely connected by the causal structure.
-
Based on the quantified new causal structure in the previous step, we can explore its value in practical applications within the new framework, including discovering the common evolutionary law of the nexus, discovering the differences in the responses of various nodes to the same management scenario by synchronizing the operations of BNs of different river basins, analysing differences of the causality of the historical nexus changes, incorporating previous unsystematic and local studies on water resources, agriculture, ecology, etc., into the new causal framework such as incorporating the upstream multi-source causal factors into the downstream soil salinization studies, sharing experience and reflecting on the failure cases of the historical management, optimizing the current nexus, and incorporating causality and uncertainty into the decision-making and the future risk assessment (Chan et al., 2010).
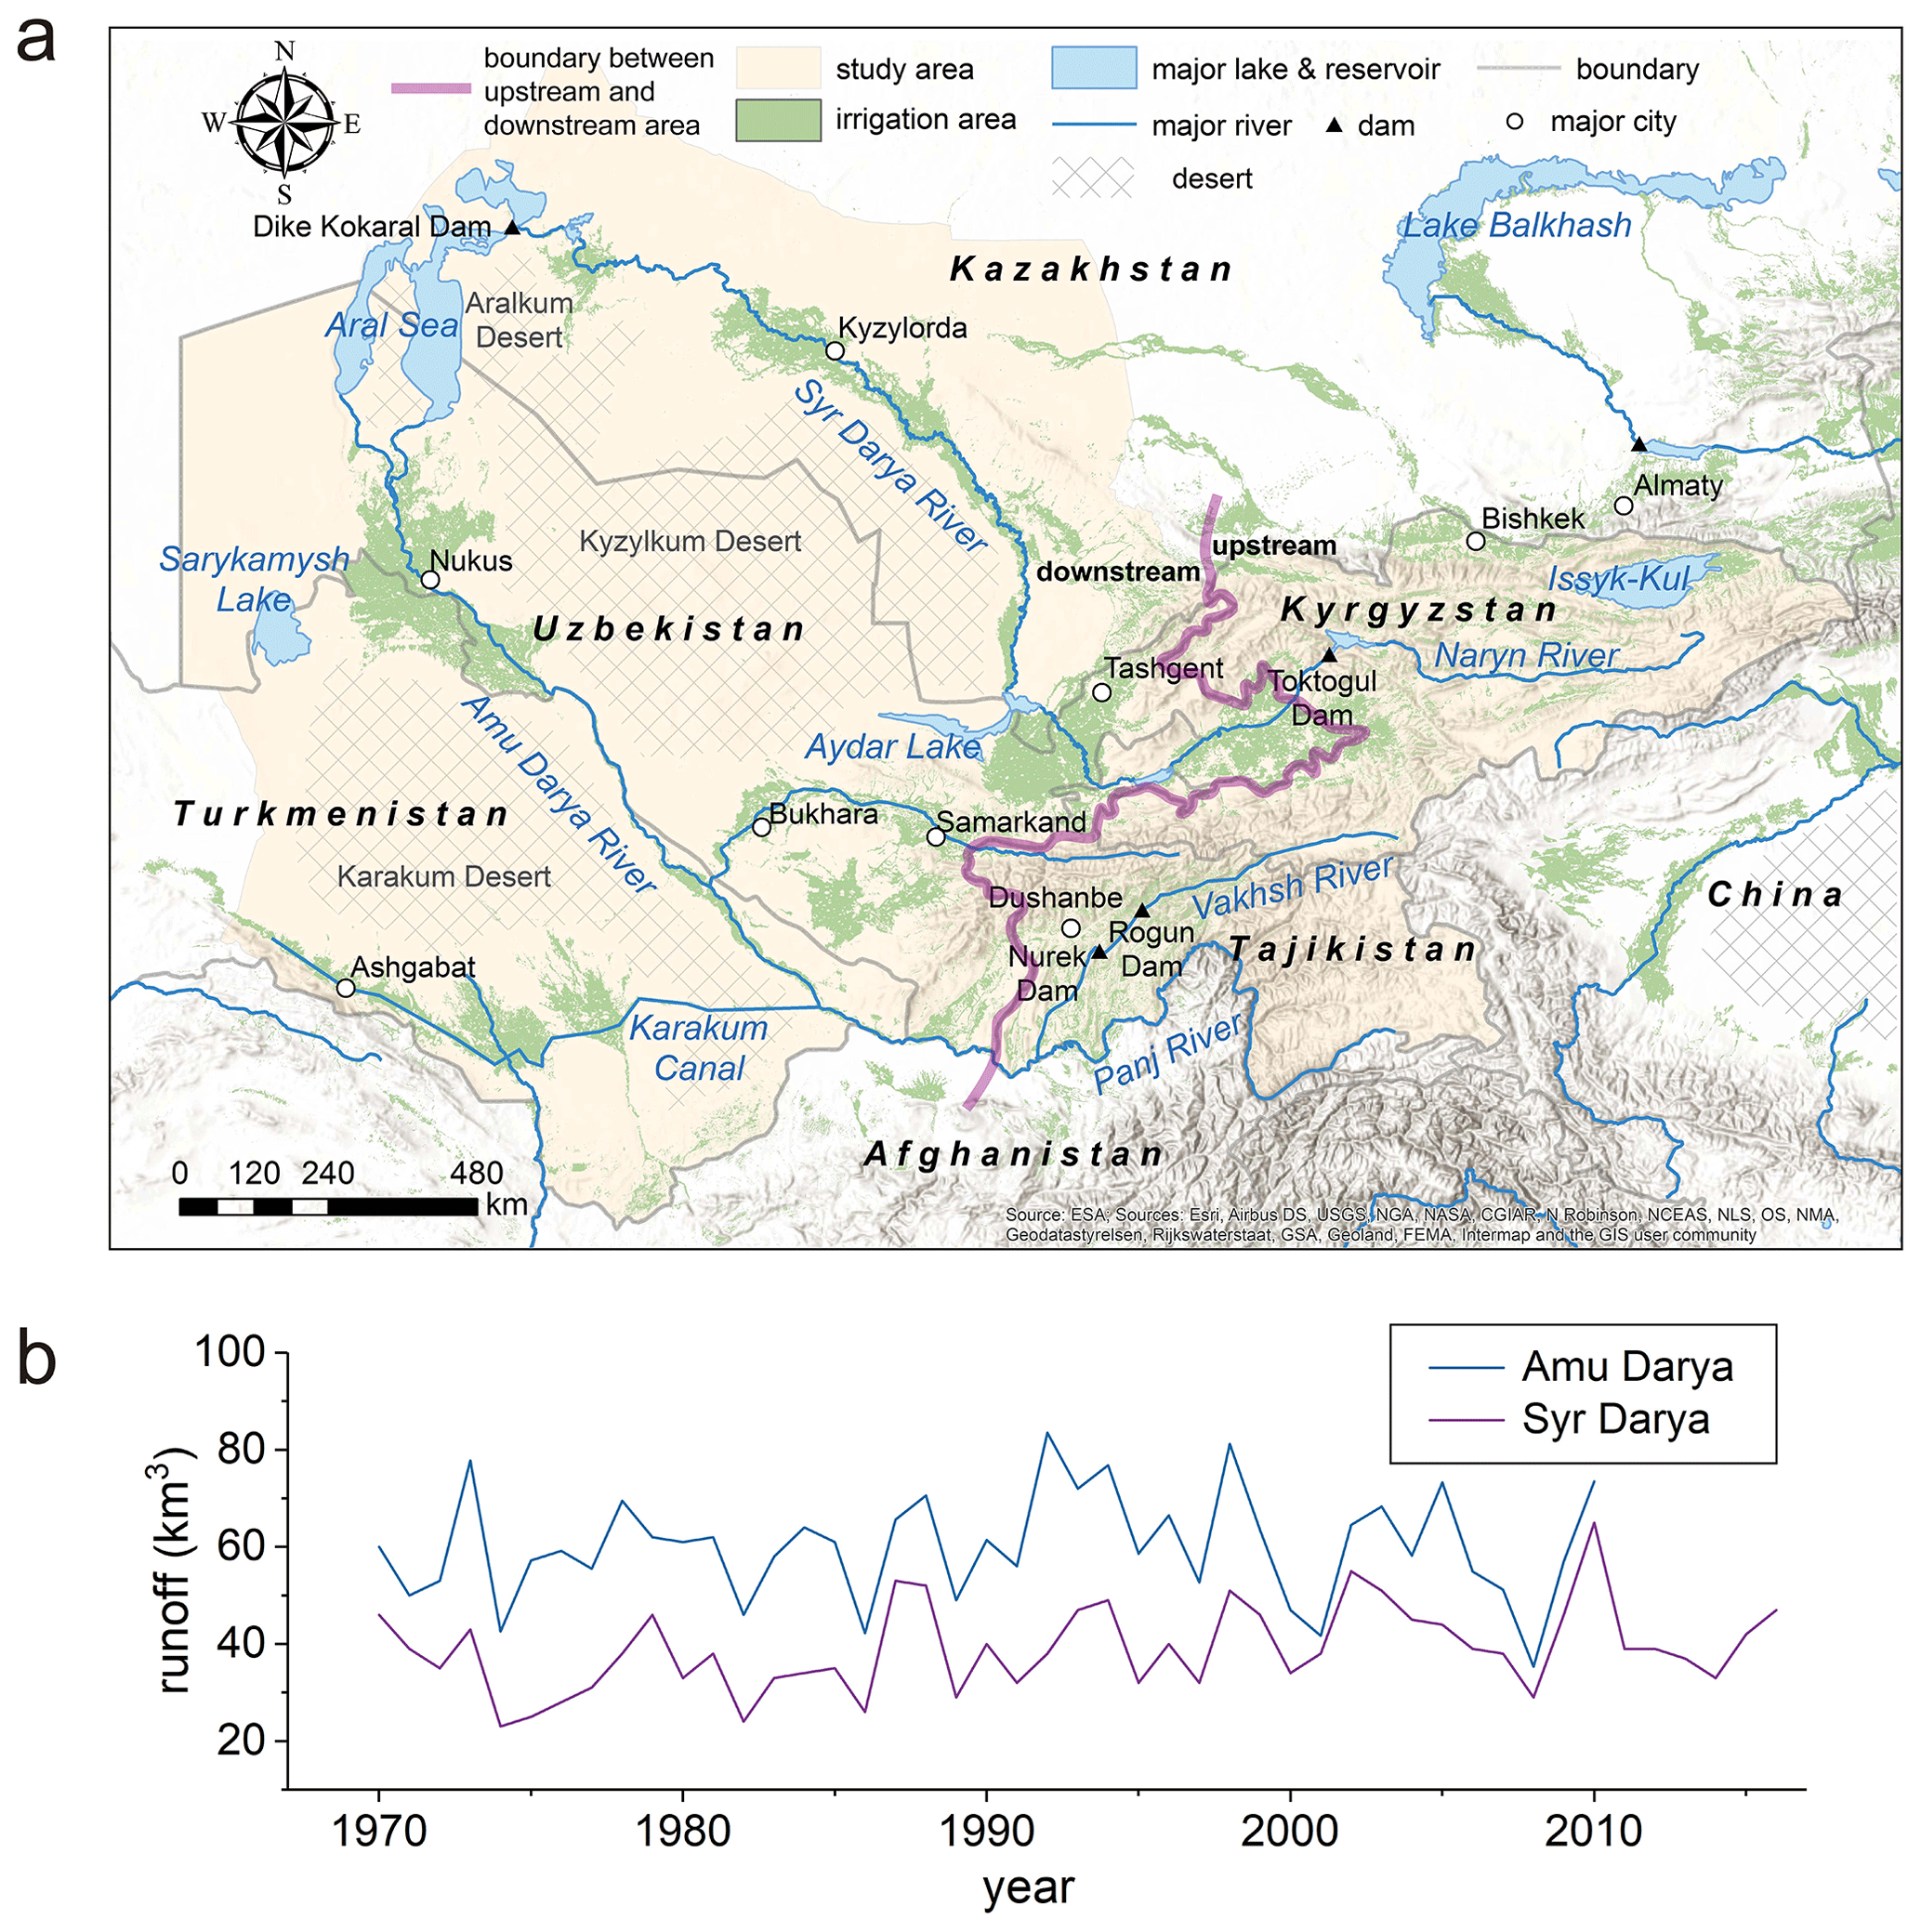
Figure 3Location of the Aral Sea basin and the water resource variation. Panel (a) shows the location of the Aral Sea basin; the two main rivers are the Syr Darya and Amu Darya. This map is made with ArcGIS and the layers come from the public layers in the ESRI base map and ArcGIS online. Panel (b) demonstrates the annual runoff variation of the Syr Darya river total runoff and the Amu Darya river main stream at the Atamyrat cross section upstream the Karakum Canal.
3.1 Location of the selected SDB and ADB
The Aral Sea basin is located in central Asia (Fig. 3) with a total area of 1549 million km2 and is one of the largest endorheic river basins in the arid regions worldwide. The two major rivers, the Syr Darya and the Amu Darya, originate from the West Tien-Shan and Pamir Plateau as a part of the central Asian water tower. They flow through five countries in central Asia which were once part of the USSR. The surface water resources of the basin mainly stem from the precipitation, snow melting and ice in the mountainous area. The lower part of the basin is very dry, and most areas are deserts. The large-scale agricultural production here is highly dependent on the irrigation, and large amounts of water are consumed by a high evapotranspiration and leakage during the water diversion.
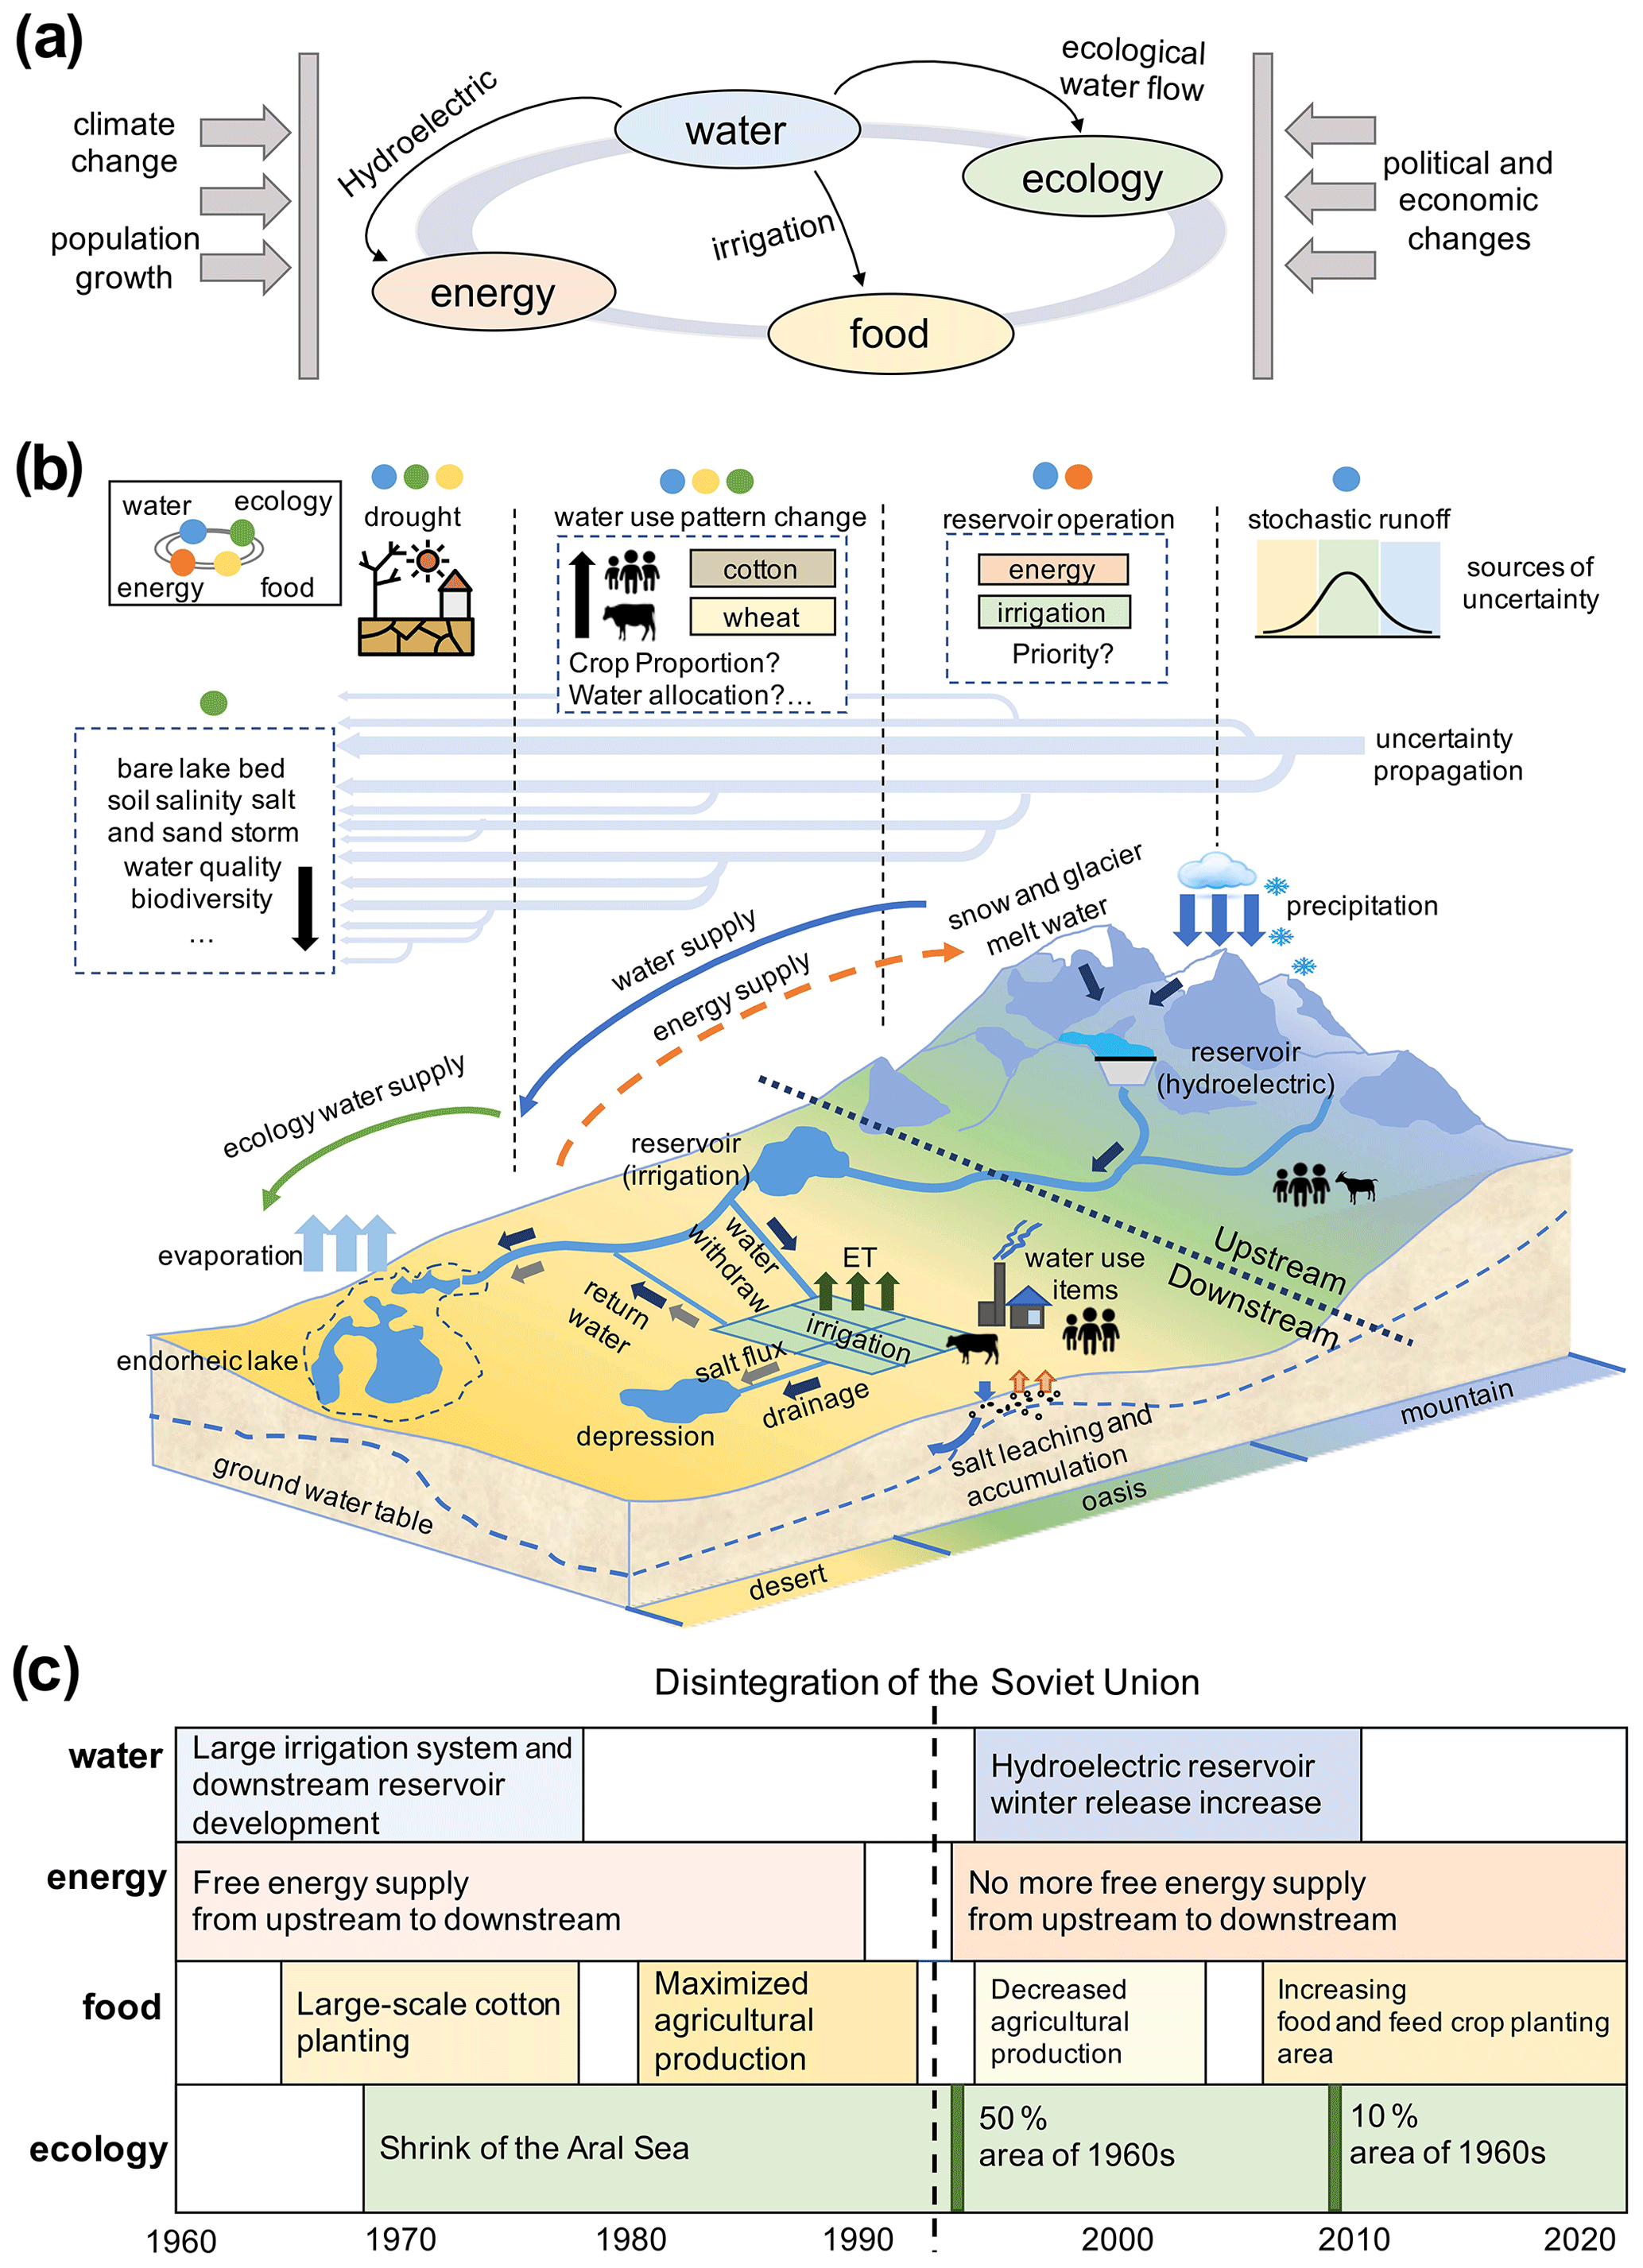
Figure 4The a priori and general basin-wide WEFE nexus mode of the SDB and ADB and its temporal change during the past 50 years (a) shows the sources of the exogenous stress on the WEFE nexus dominated by water in the Aral Sea basin. Panel (b) illustrates the hydrologic uncertainty spread from the alpine area to the lower part through a typical “mountain–oasis–desert–lake” system. The elements of the WEFE nexus are represented by circles in four colours and the relevant uncertainty items are tagged with these icons as a classification by respective roles in the WEFE nexus. Panel (c) demonstrates the specific changes in the elements in the WEFE nexus during the past 50 years and the influence from the collapse of the USSR in 1991.
3.2 A priori and general mode of the water–energy–food–ecology (WEFE) nexus of the SDB and ADB
Since the 1960s, the WEFE nexus in the Aral Sea basin has been suffering from increasing pressure (Fig. 4). In addition to the population growth, climate change, ecological degradation and other problems, the issue of the transboundary water and energy disputes in this region has intensified with the collapse of the USSR. Therefore, this basin-wide transboundary WEFE nexus has unique characteristics on spatial and chronological scales. In this study, according to the spatial characteristics of the transboundary management, the watershed is divided into upstream and downstream areas. In response to the impact of the collapse of the USSR, the water resource management period was divided into four periods, namely 1970–1980, 1980–1991, 1991–2005 and 2005–2015. This is mainly based on the WEFE nexus change between the upstream and downstream areas in different periods, which are applicable to both the SDB and ADB as a priori and general modes.
-
The agricultural development stage (1970–1980): during this period, large-scale land development was carried out, mainly planting cotton with high water consumption and by means of flood irrigation. During this period, large-scale reservoirs, irrigation and drainage canals and other hydraulic irrigation projects were built. With serious leakage and a low efficiency, a large amount of water resources was being consumed before going to the farmlands and the water amount entering the Aral Sea had already begun to decrease (Micklin, 1988).
-
Cultivated land development reaches the highest level and agricultural production continued to be high-load (1980–1991): during this period, because the Aral Sea basin was regarded as the main agricultural production area of the USSR, the agricultural demand was extremely large. When the agricultural products were ready, they were handed over to Moscow, where they were uniformly distributed to other regions of the USSR. The scale of the agricultural development had reached its peak and was relatively stable. The water amount entering the lake from the Aral Sea was reduced further (Micklin, 2007, 2010). In some years, even river depletion occurred. The agricultural water in the downstream area was given priority and the gap in the upstream power generation needs was compensated for by free fossil energy from the downstream area. The operation mode of the reservoir in the upstream mountain area was close to the natural mode. When the summer streamflow was large, the reservoir outflow was also high in order to ensure the agricultural water use in the lower part.
-
The stage of economic stagnation after the collapse of the USSR (1991–2005): politics in the newly born central Asian countries remained unstable during this period, and there was social and economic stagnation. The cotton production scale of the previous USSR period was far greater than the actual demand of the five new countries. The area of agricultural land decreased. However, due to population growth and the new countries' own food security needs, the proportion of food crops grown increased. The downstream area no longer supplied energy to the upstream area for free. The upstream region had an energy crisis and the demand for electricity was not met, especially in the cold winter during the peak in electricity consumption. In order to ensure the electricity supply in winter, the upstream countries increased the interception water with reservoirs in the high mountains during summer and released more water in winter so as to generate electricity. This resulted in a downstream agricultural water shortage in summer and flood risk during winter (Micklin, 2007, 2010). The long-term flood irrigation caused serious salinization and decreased the fertility of the farmland soil downstream. Pesticides and salt in the return flow of irrigation entered the river, causing the downstream water quality to decline. The exposed Aral Sea lake bed increased the frequency of the sand and salt dust storms, threatening the health of the residents, and the Aral Sea crisis developed further as a result.
-
The stage of socioeconomic recovery (2005–2015): Kazakhstan and Turkmenistan were rich in fossil energy, have a certain foundation for industrial development, and have experienced rapid economic development. Relatively wealthy, Kazakhstan built large reservoirs so as to prevent floods and to regulate the irrigation, alleviating its own disadvantages in the water resource competition. Turkmenistan withdraws more water, along with the economic development and population growth. The energy disputes between the upstream and downstream areas have become increasingly fierce. For example, the amount of natural gas exported from Uzbekistan to the upstream region was greatly reduced. The power satisfaction and living standards of the upstream countries have only improved little. The Aral Sea continued to shrink, and by 2010, only 10 % of the area was left compared to the 1960s (Micklin, 2010).
3.3 A general Bayesian network (BN) structure with macro spatial information within the new framework applied to the SDB and ADB
We separated the upstream area, downstream area and the Aral Sea as geographically discrete regions and introduced the elements in the WEFE nexus joint to these regions into the BN as different variables (Fig. 5). Each variable represents a certain element in the WEFE nexus of a certain region. The BN could be divided into six modules, including the natural water resources, upstream, downstream, Aral Sea and target variables, and a causal structure has been established based on the expert experiences (Fig. 6). We established this common framework as a prerequisite for establishing a joint probability table, and at the same time we tried to adapt the SDB and ADB so as to keep each variable universal, although the specific meaning of the variables should be different in the two river basins. The responsibility for exploring the differences between the two river basins mainly relies on the input observation data.
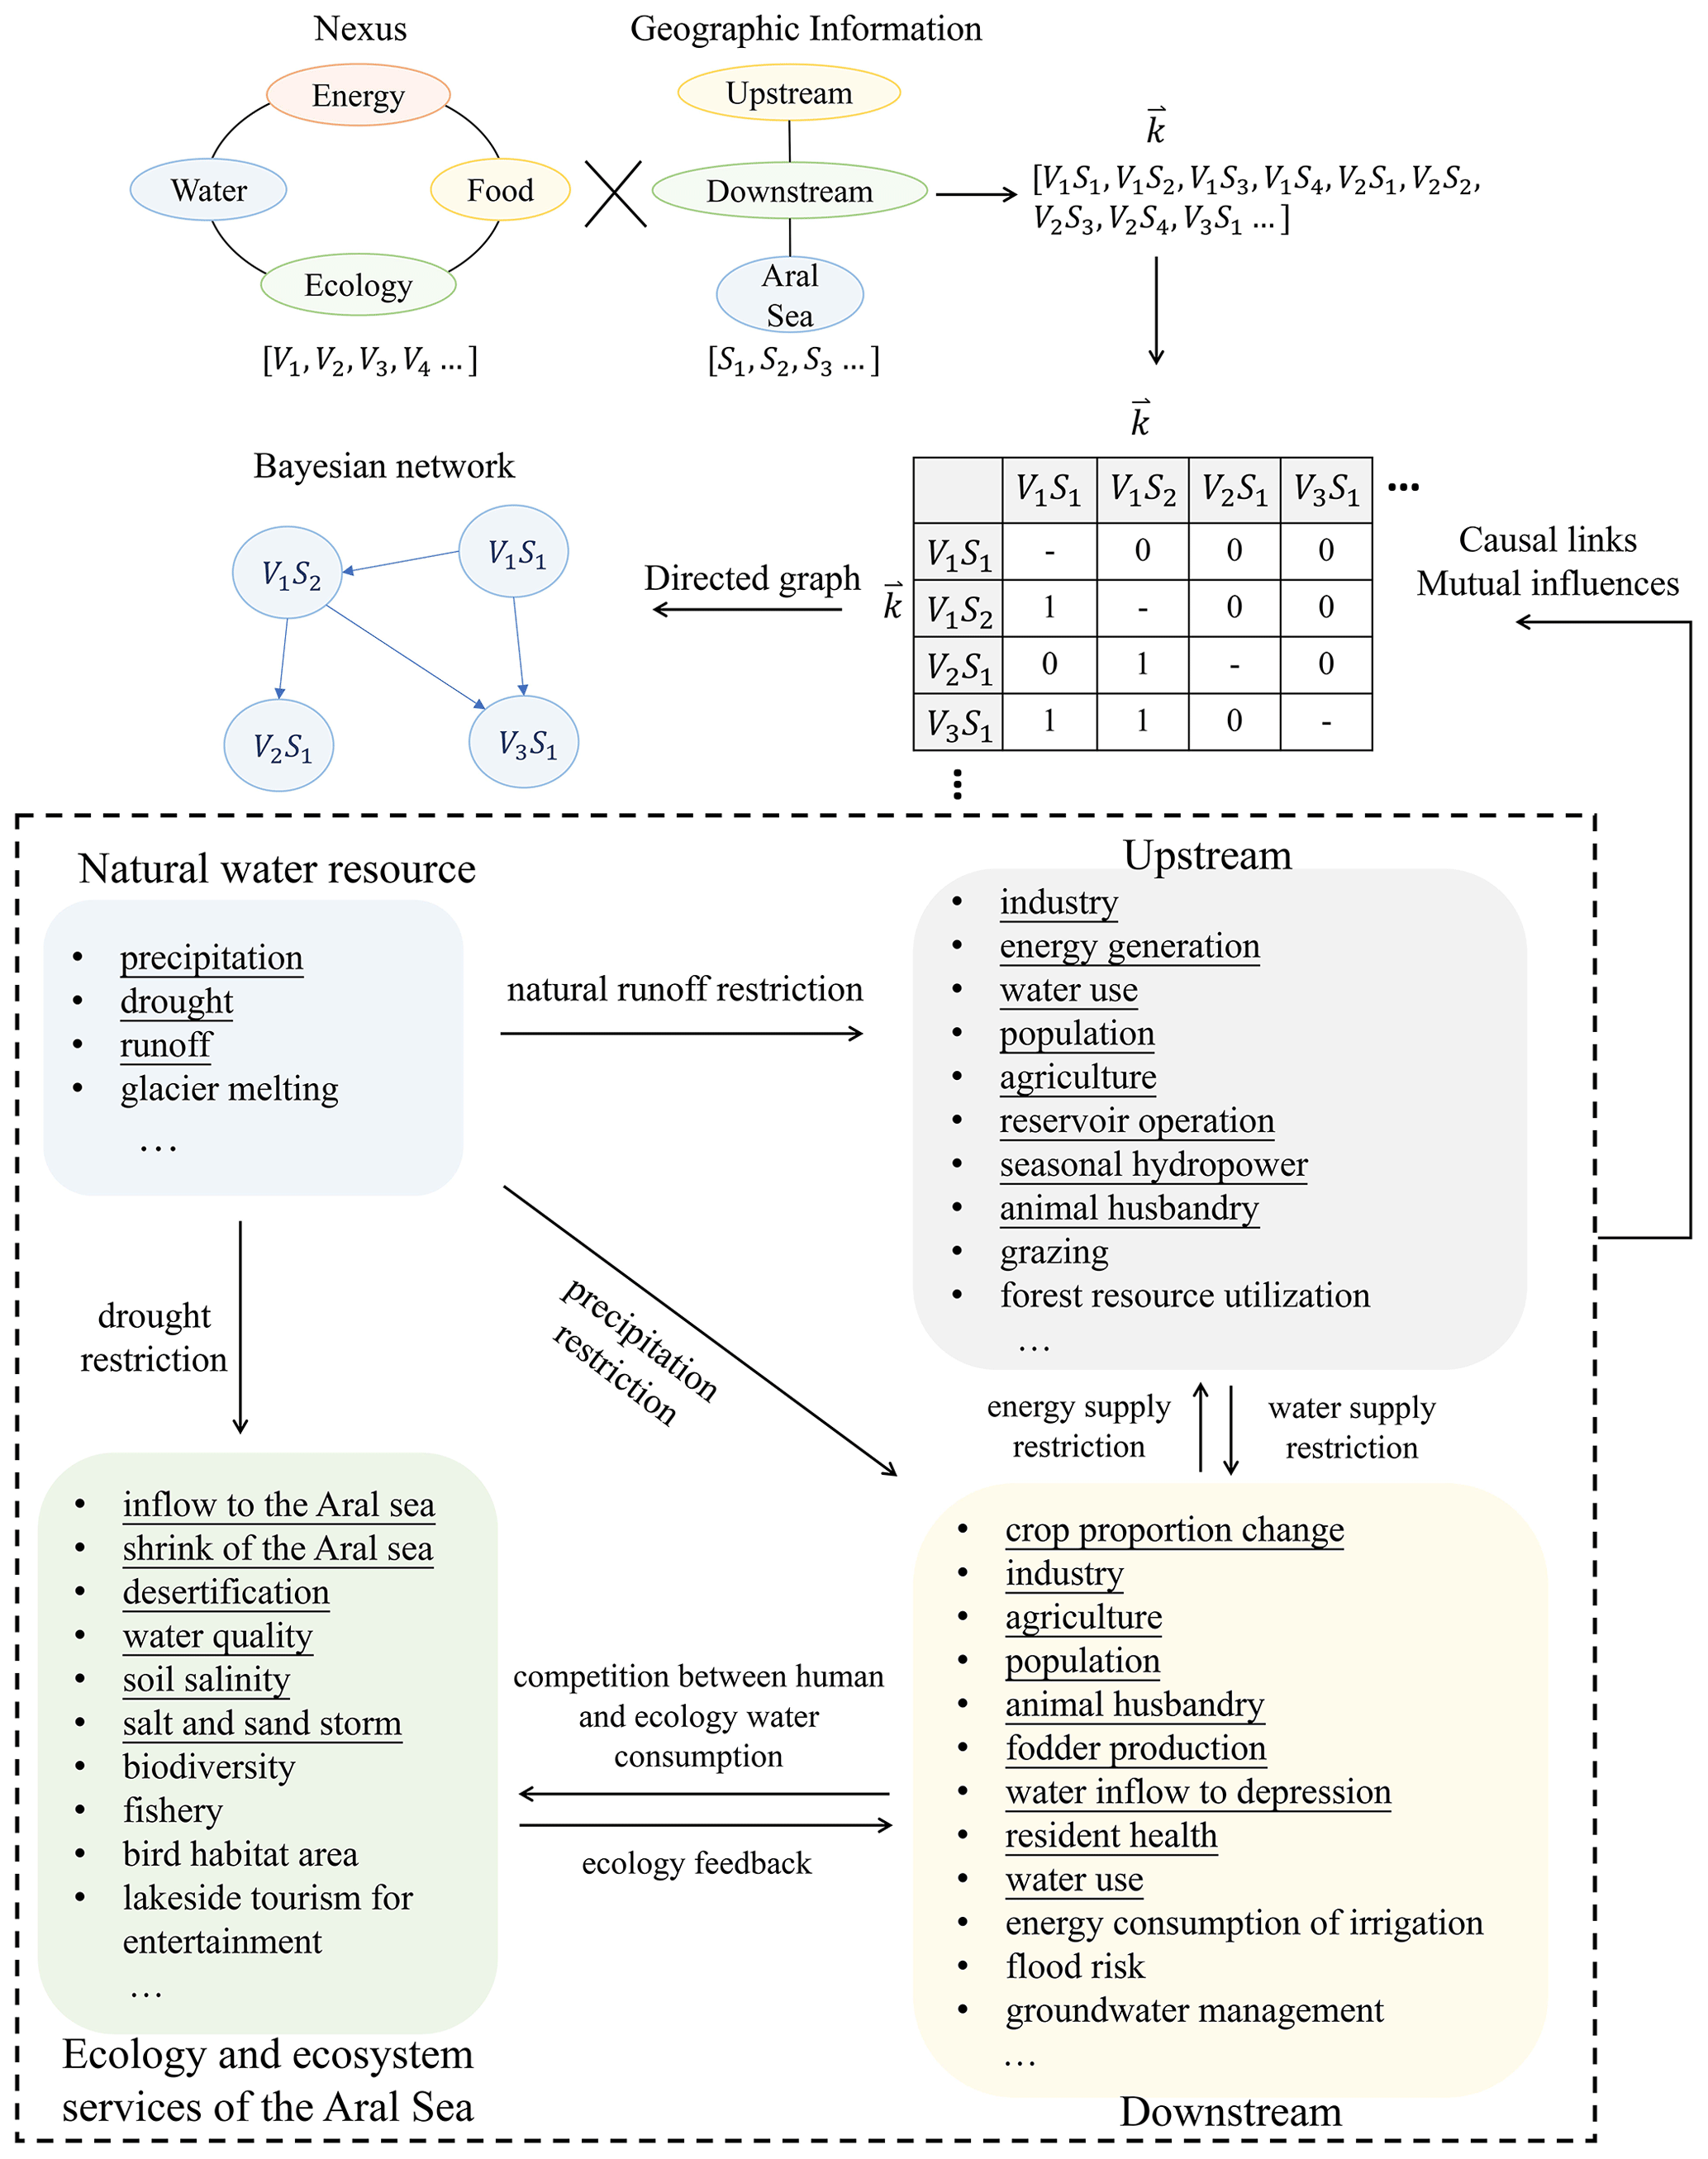
Figure 5Integrate expert knowledge into Bayesian networks to simulate the WEFE nexus. The geographical area is divided into the upstream and downstream regions and the surrounding area of the Aral Sea. The lower part contains the factors that can be considered in the framework, and the underlined ones are actually used in this study.
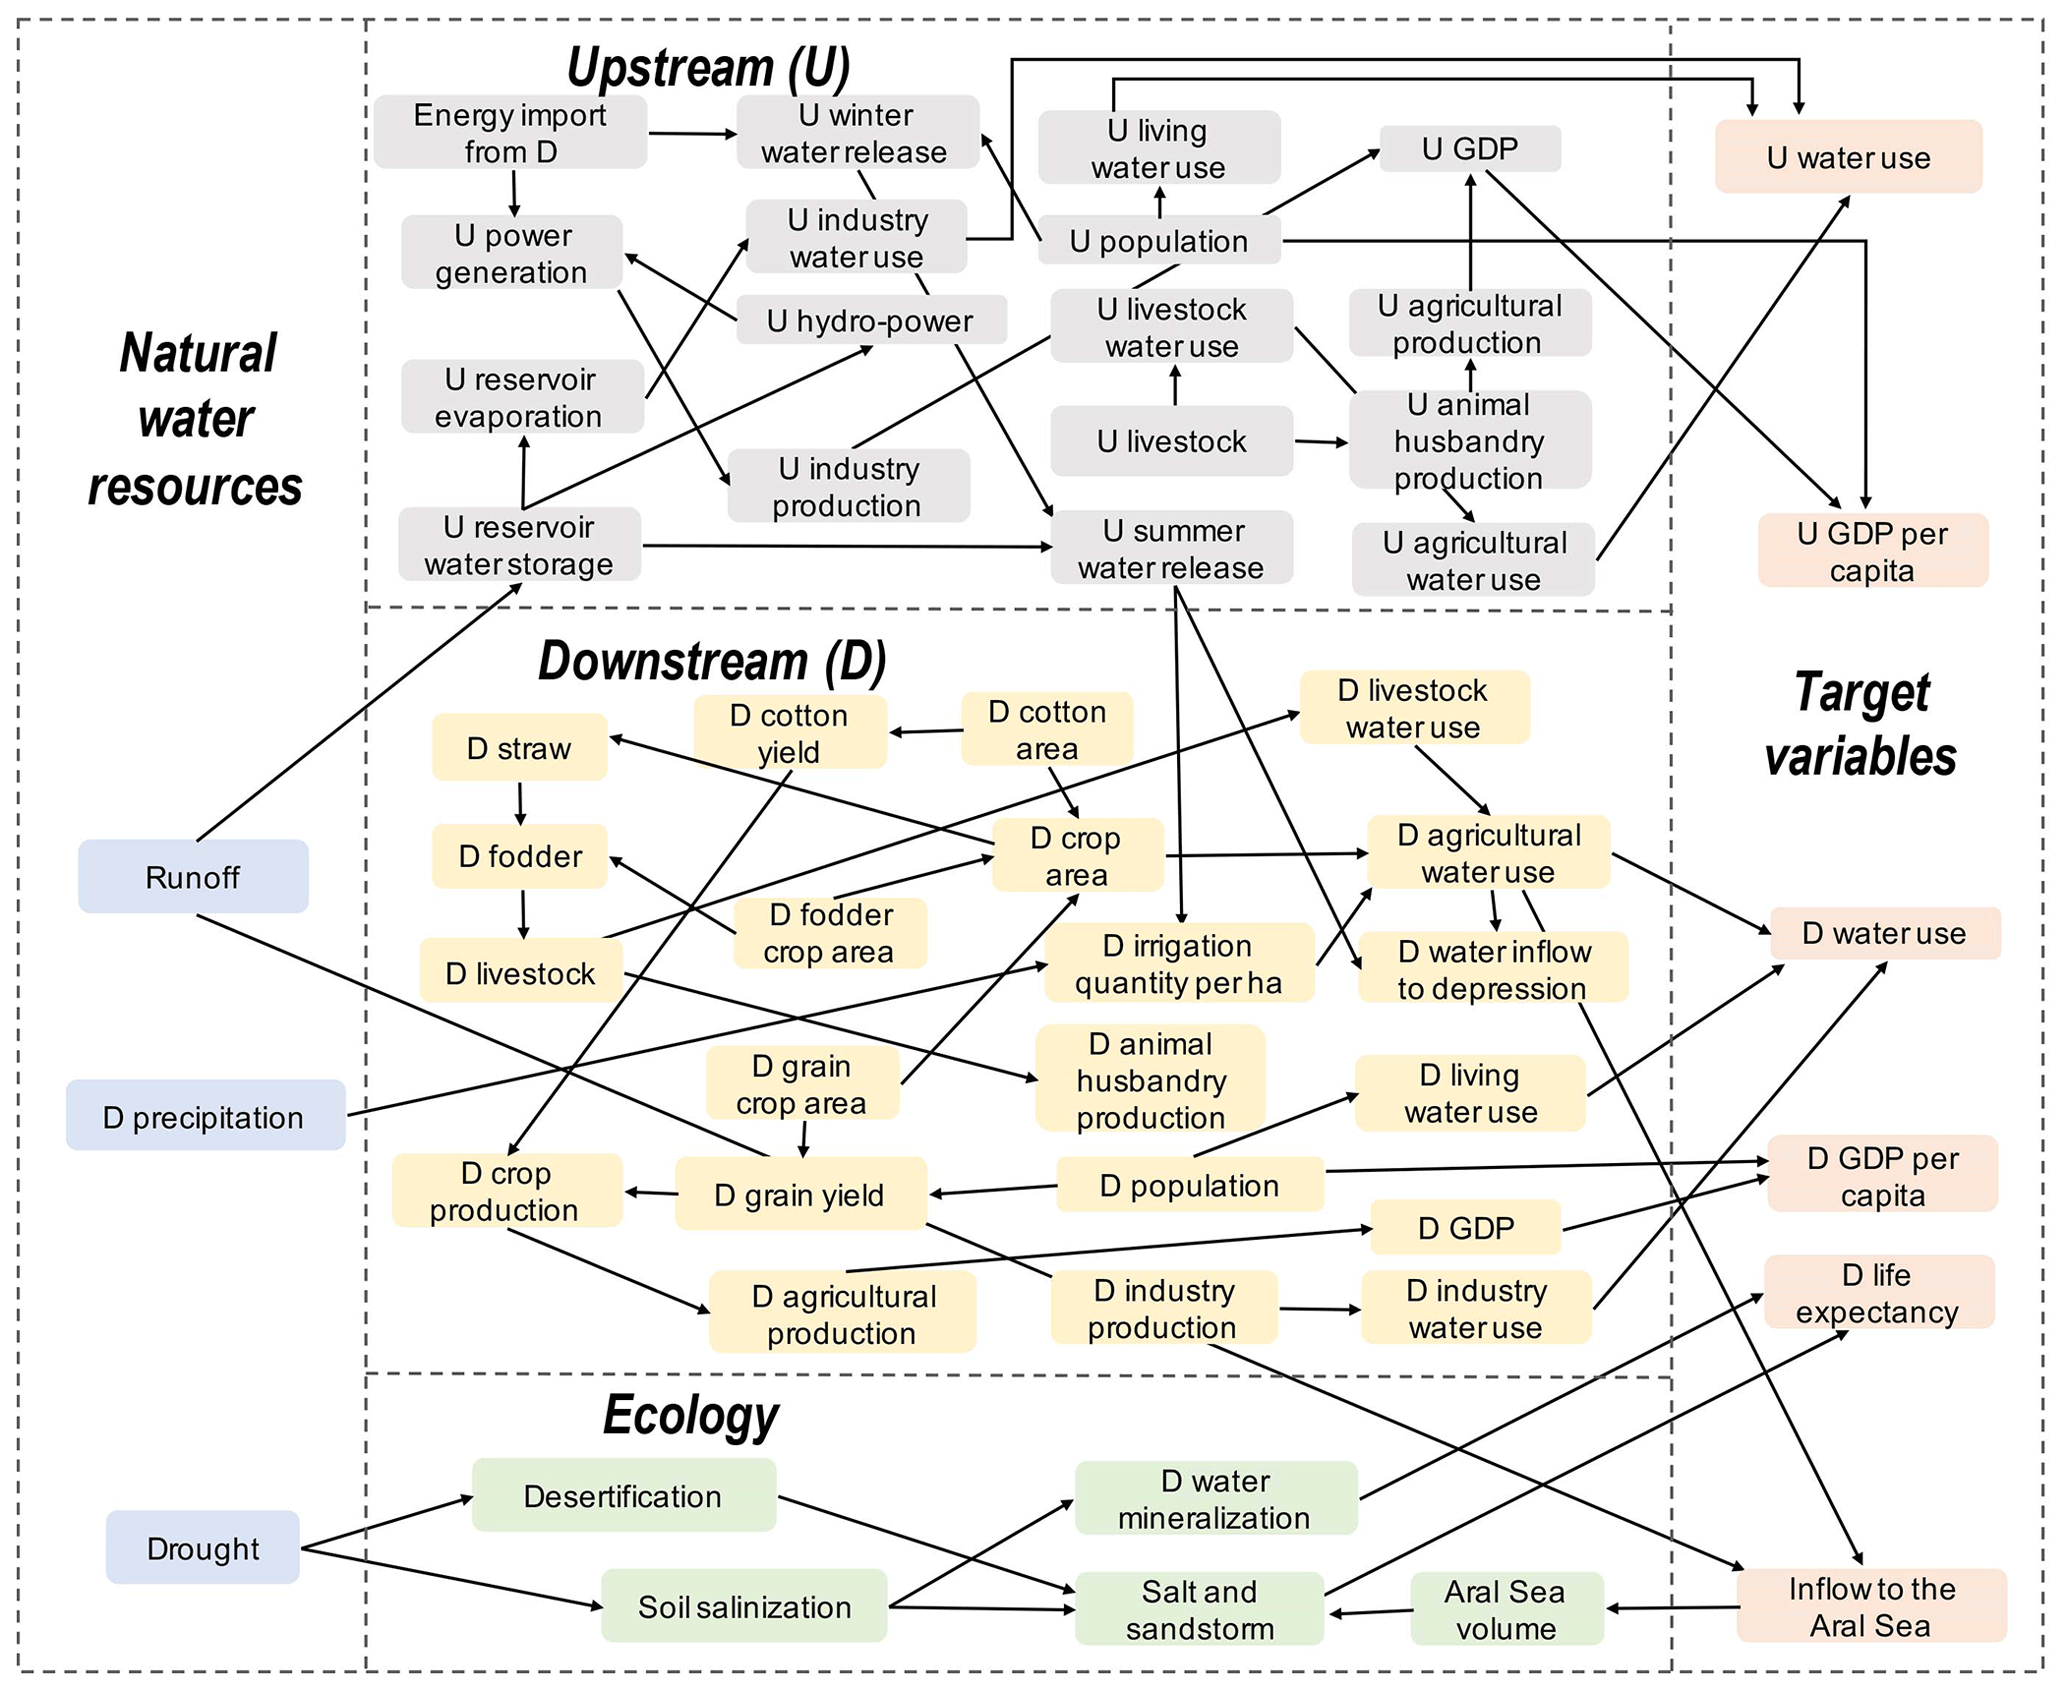
Figure 6The Bayesian network structure shared by the ADB and SDB when simulating the water–energy–food–ecology nexus. D stands for “downstream” and U stands for “upstream”.
3.4 Compiling and evaluation of the BN
A BN describes the joint probability distribution of the set of nodes. For a BN in which nodes represent random variables (X1, …, Xn), its joint probability distribution P(X) is given as (Pearl, 1985)
where pa(Xi) are the values of the parents of Xi and X1, …, Xn are variables in the WEFE nexus structure. Based on the expert knowledge, we initially gave values to the corresponding conditional probability table for each node of the BN. We discretized the value range of nodes to reduce computational requirements (Table 1). The discretized interval also has a certain extension to ensure the robustness of the later prediction function and to prevent cases from easily exceeding the boundary. According to the differences in the political and economic backgrounds at different stages, we divided the development process during the past 50 years into four stages, 1970–1980, 1980–1991, 1991–2005 and 2005–2015, based on the assumption that the WEFE nexus shows a relative stability under similar political and economic backgrounds. Next, in order to integrate actual observations and statistical data, the expectation–maximization (EM) algorithm (Moon, 1996) function of the Netica software is used to iteratively calculate the joint probability distribution of the BN. In the Netica software, the “experience” variable is used to indicate the reliability of a priori knowledge, and the “degree” variable is used to indicate the training times of the observation data. By combining these two variables, we can dynamically adjust and balance the weights of a priori knowledge and the actual data in the probability distribution update. In this study, we initially set “experience” < 0.3 “degree” to ensure that the weight of the information represented by the actual data is sufficient.
Table 1Discretization and description of variables.
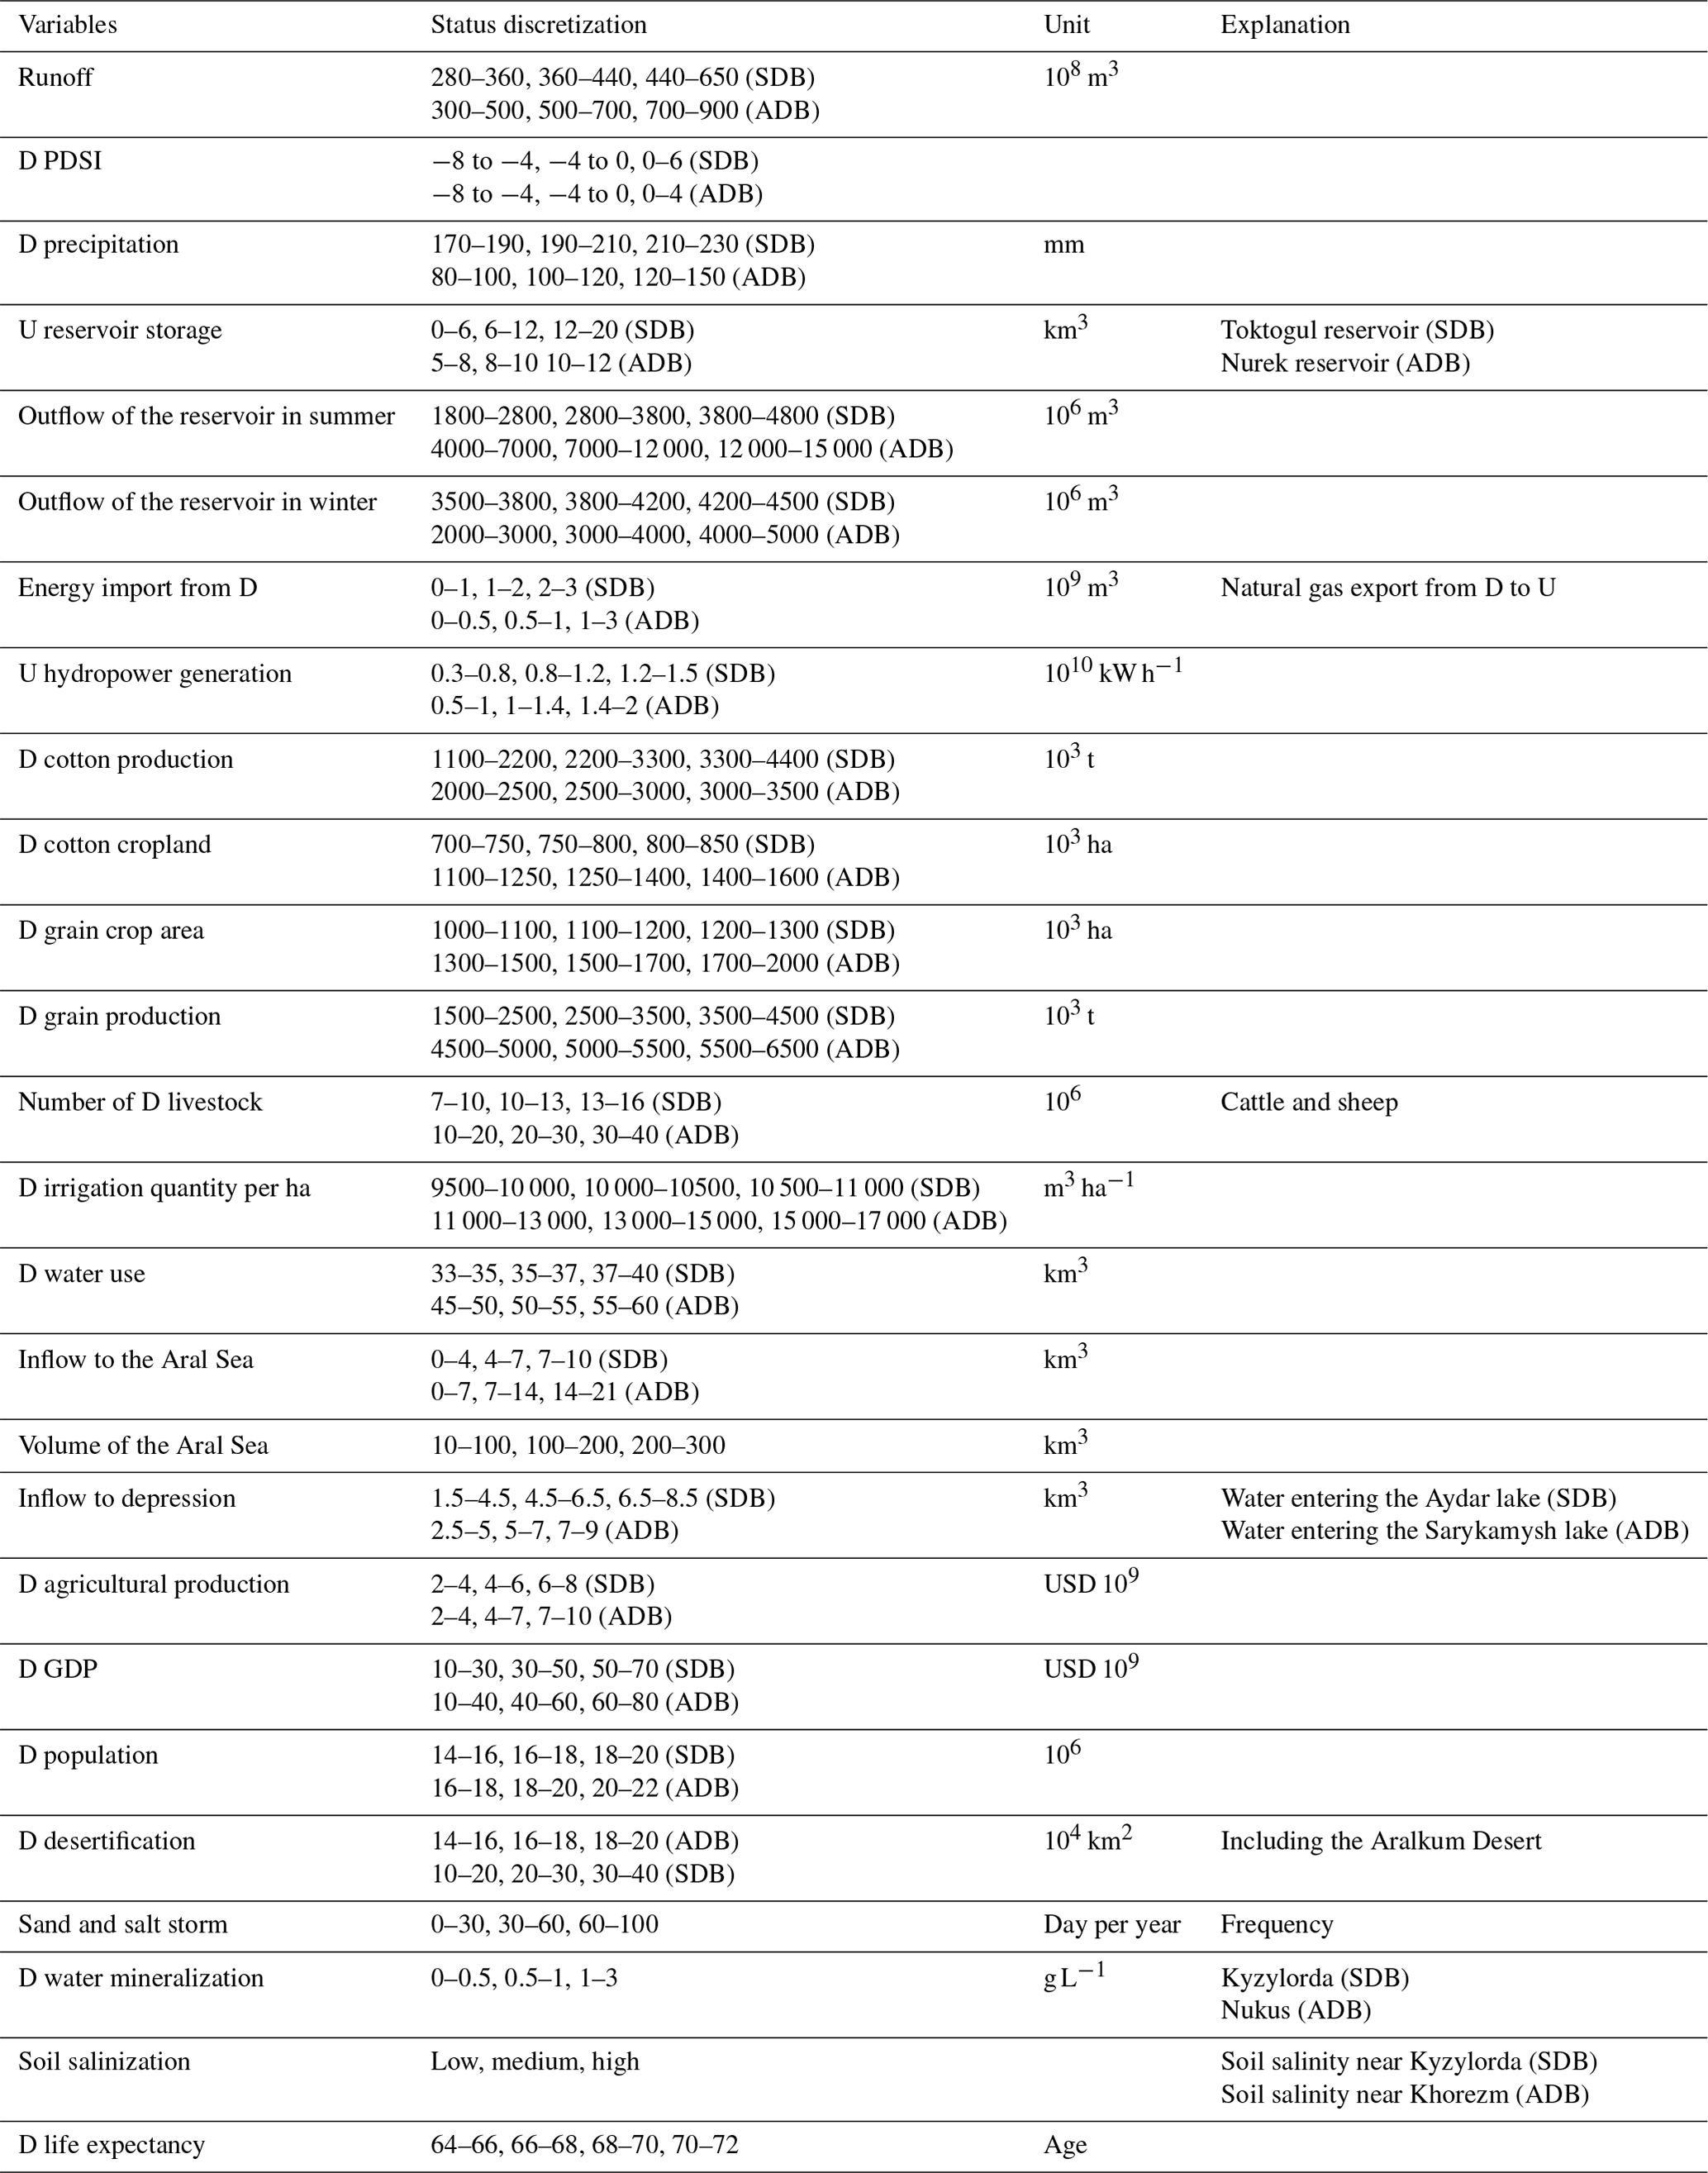
Note: D stands for “downstream” and U stands for “upstream”.
To assess the degree of agreement between the parameterization of the BN and the actual situation, we used the sensitivity analysis of the BN (Castillo et al., 1997; Laskey, 1995; Marcot, 2012). The index variance of belief (VB) and the index mutual information (MI) based on the change in information entropy (Barton et al., 2008; Marcot, 2012) are applied to evaluate the change in strength and uncertainty of the causal relation between the nodes. They respectively represent the reduction in variance and entropy of the probability distribution of child nodes caused by the determination of the state of the parent nodes. As the value range of the parent node is reduced, the variance or entropy of its distribution is usually reduced. The greater the variance or entropy of the distribution of child nodes that can be further caused by this reduction, the more sensitive the child node is to the parent node, which also reflects the stronger causality. These two indicators are as follows:
where H stands for the entropy, V stands for the variance, Q stands for the target node, F stands for other nodes and q and f stand for the status of Q and F. Xq is the true value of the status q.
3.5 A BN-based analysis of the historical factors in the water entering the Aral Sea, the post-test probability prediction and multi-criteria evaluation with the Markov chain–Monte Carlo sampling
We used the index VB that is utilized in the sensitivity analysis to analyse the factors that affect the water entering the Aral Sea in the four stages during the past 50 years. It is mainly significant to form a quantified understanding that was originally only qualitative. Quantifying and updating the past knowledge can help us to better understand the impact and differences of the water resource development and the WEFE nexus change at different stages in the SDB and ADB, because the difference in the current status of the two rivers may have been accumulated from the historical differences in the water–land–energy development during the past 50 years.
We utilized the posterior probability prediction function of the BN so as to support the decision optimization. Assuming that the values of some variables have been determined, the posterior probability prediction of the BN might be employed to infer the possible effect on the variables we are concerned about. The prediction function is usually used to infer and predict how one node (D) is likely to change with the distribution of its parent node (A) determined. All nodes that have dependencies between A and D should be included in the calculation. For example, suppose we have the simple Bayesian network for discrete variables with the structures A and D connected through a dependency of D on C, C on B and B on A, and we can use the following formula (Heckerman and Breese, 1996) to calculate the probability of D when the state of A is given.
Parent nodes are regarded as the independent variables; child nodes are regarded as the objectives. When the state of a parent node is given, the beneficial probability distribution change in the child node can be regarded as our optimization goal. We formulated a change measure (ΔP) (Robertson et al., 2009; Xue et al., 2017) to assess the impact of a management scenario compared to a base case:
where e represents the determination of the state of the parent node (management scenario) in the form of hard evidence specifying a definite finding, P(Xi|e)low is the probability of the lowest state for the management scenario, P(Xi)low is the probability of the lowest state for the base case and ΔPlow is calculated as the change. The meanings of these variables are the same for the subscripts “high”.
The goal of the above optimization only contains a single variable; to test whether they seemed beneficial under multiple comprehensive criteria, we selected the scenarios with a good effect (“reducing the water inflow to the depression” and “improving the planting structure”) for the multi-criteria (combination of the above single target variables) assessment. Based on the Markov chain–Monte Carlo (MCMC) (Neal, 1993) sampling of the BN, we explore its role in multi-criteria assessment and optimization based on previous studies (Farmani et al., 2009; Molina et al., 2011; Shi et al., 2020; Watthayu and Peng, 2004). The point or solution set obtained from MCMC sampling matches the high-dimensional joint probability distribution of BN nodes, which encompasses the causality of the system (Neal, 1993). This will be applied so as to determine the size of the uncertainty behind the optimization effect of the scenario and to verify the ability of the BN to manipulate the multi-dimensional uncertainty in the decision-making. When the states of some nodes in the BN are determined, the joint probability distribution of the posterior changes, and the distribution of the point set in the multi-criteria space also changes accordingly. The distribution of this point set is constrained by the causality constructed by the BN. If the Pareto solutions obtained by conventional system optimization analysis are far outside the distribution range of this point set, then these optimization solutions may actually not meet the true causality constraints as an overestimated optimized solution that does not conform to the reality. In addition, this process could be seen as a test of the robustness of the optimization solutions. The degree in dispersion of the optimization cases in the three-dimensional criterion space could visually illustrate the size of its uncertainty, which is helpful for the decision-making with intuitively displaying a high-dimensional joint probability. The three indicators, the reliability (REL) (Cai et al., 2002), total benefit (TB) and degree of cooperation (DC) (Shi et al., 2020), used for multi-criteria evaluation are as follows:
where HA is the planted area, A represents the area suitable for planting, WECO determines the ecological flow calculated as the water entering the Aral Sea, TWECO is the target flow and is an adjustable weight.
where HP indicates the benefits of hydroelectric power generation from upstream dams. EB is the benefit of downstream ecological flow entering the Aral Sea, which is calculated as a linear function of WECO in this paper. AP indicates the agricultural production in downstream countries. Pa, Ph and Pe are the prices or weights which can be adjusted according to the actual market price in the international trade when it comes to cross-border cooperative management in which different types of benefits (such as upstream hydropower and downstream agricultural products) may need to be weighted and summed. It may be more reasonable to use the universal price of various benefits in the international market to determine the weight. The value of ecological flow can be calculated as the value of the ecosystem services it provides. As a simplified calculation, we normalized the three indicators to 0–1 and sum them with equal weights.
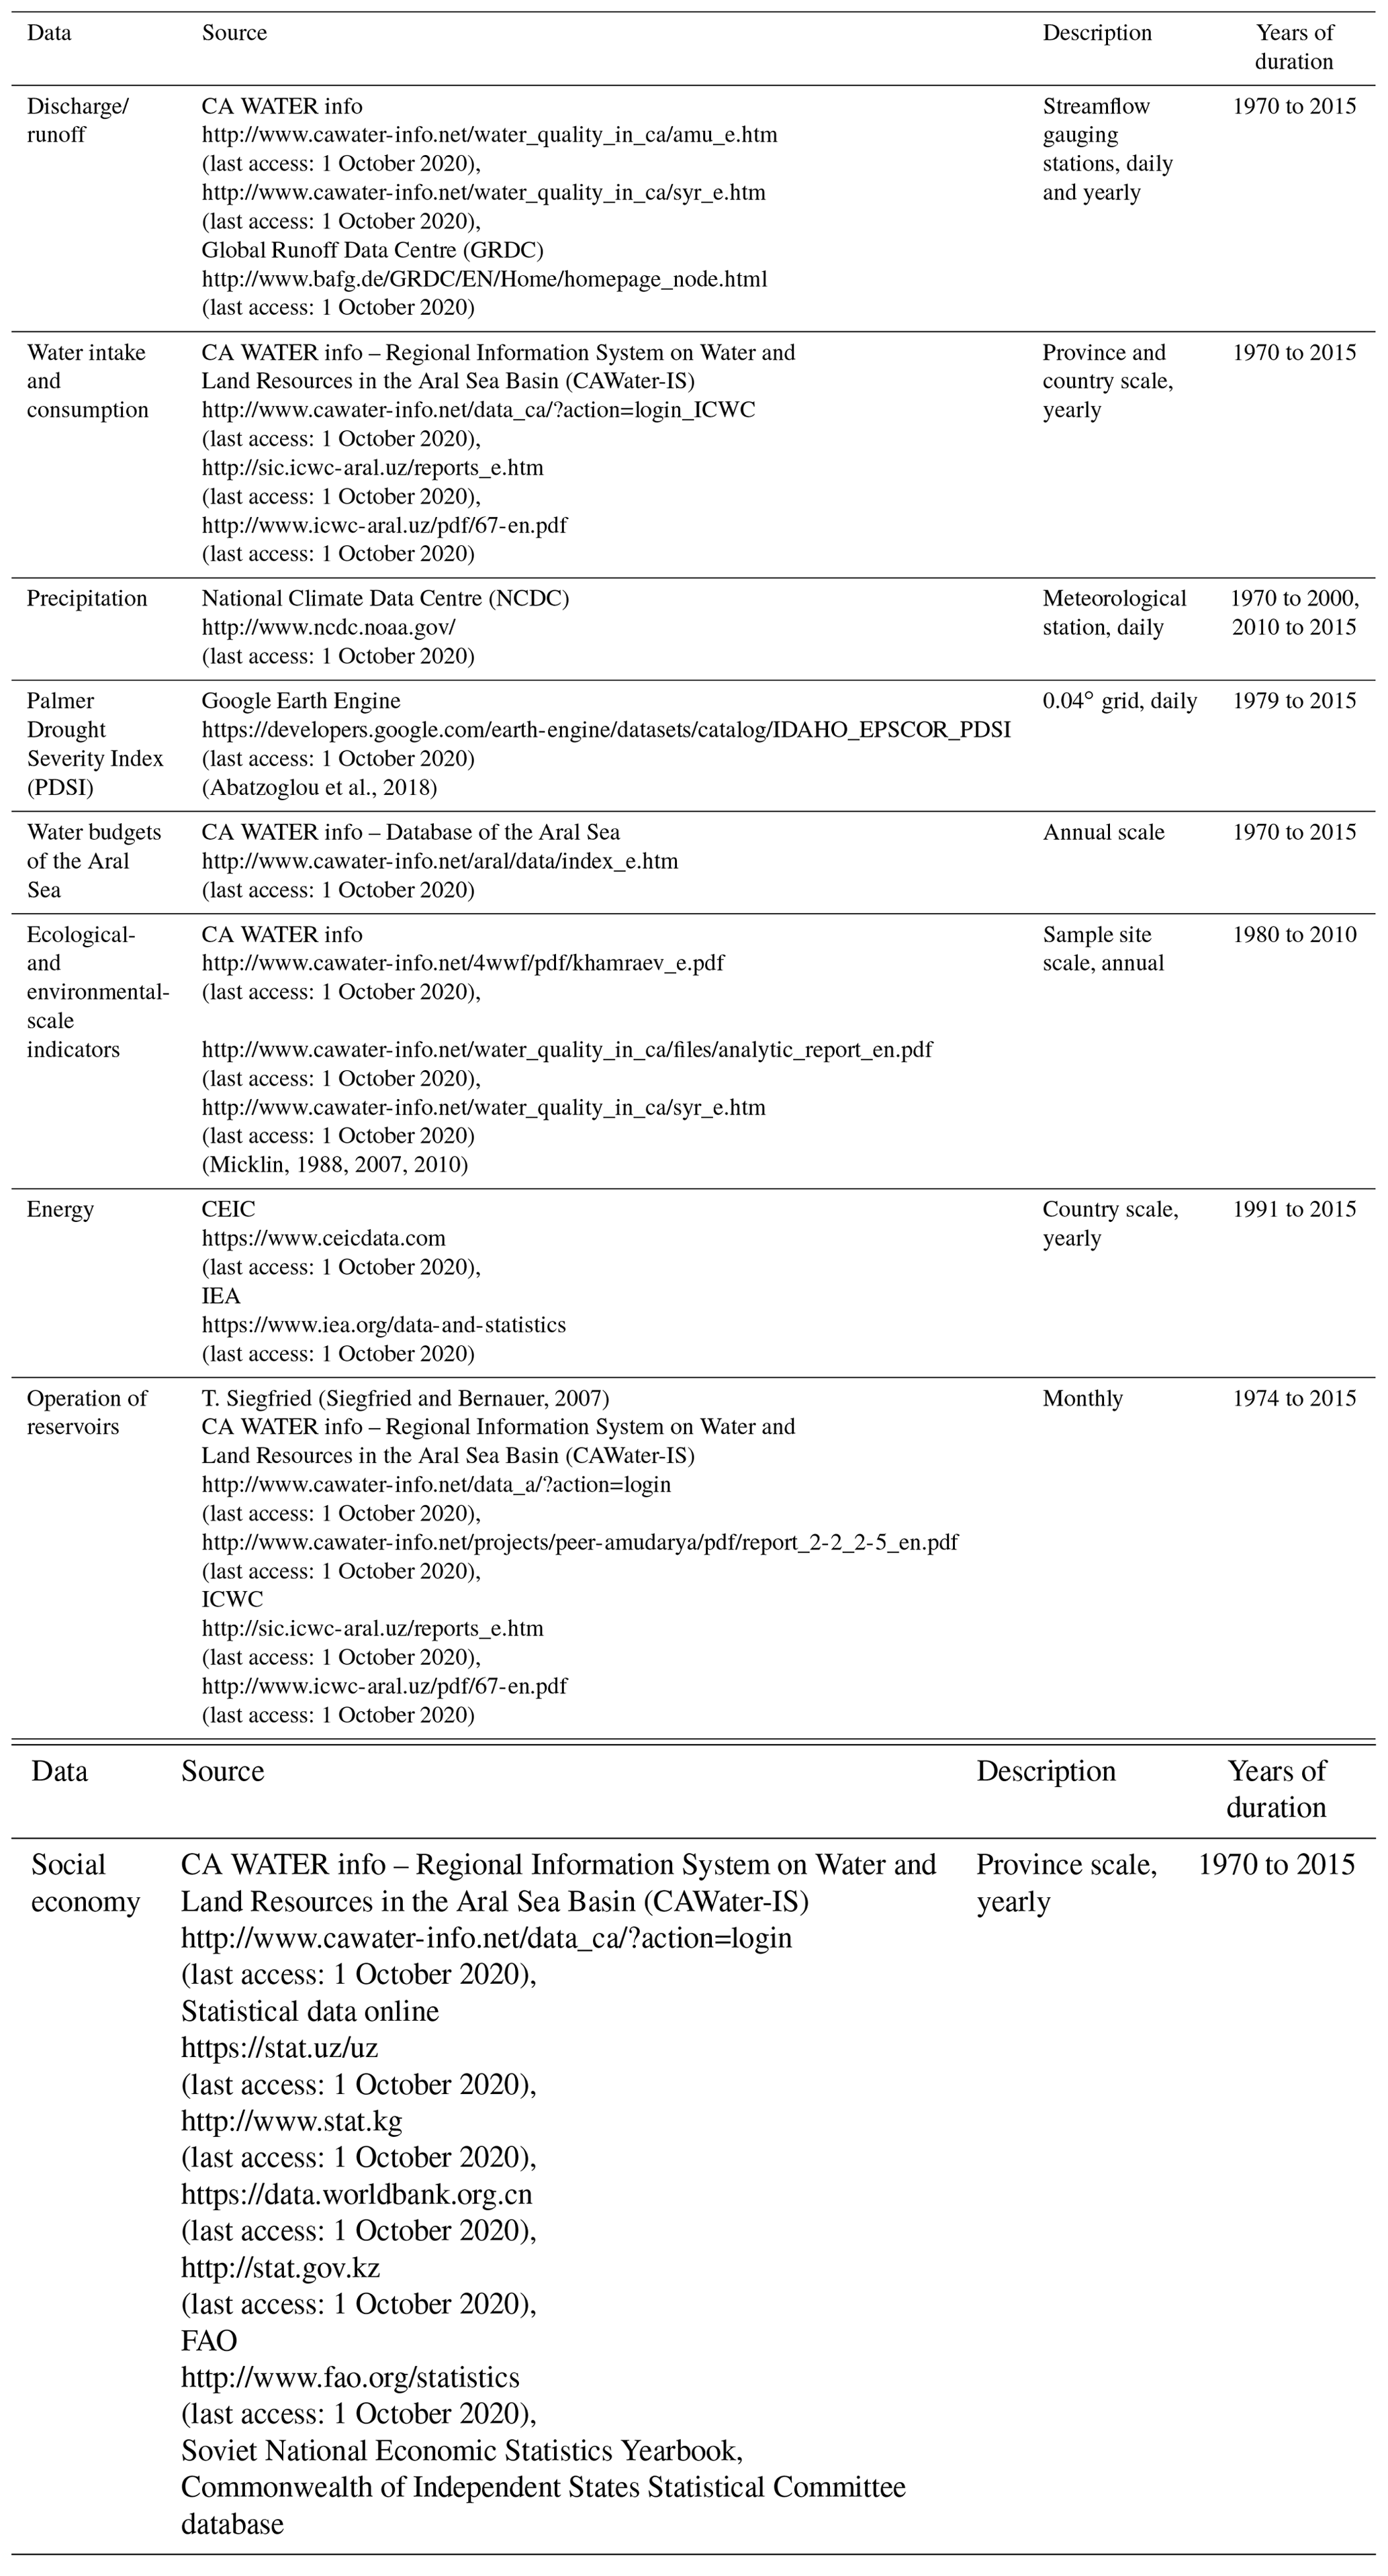
3.6 Data
We collected data on the WEFE nexus from 1970 to 2015 in the Aral Sea basin (Table 2). They will be entered into the BN along with expert knowledge. For the SDB, the upstream area includes Kyrgyzstan and the downstream area covers Kyzylorda and Shymkent in Kazakhstan and Namangan, Andijan, Fergana, Jizzakh, Syrdarya and Tashkent in Uzbekistan. Regarding the ADB, the upstream region includes Tajikistan and the downstream region comprises Surxondaryo, Qashqadaryo, Samarqand, Bukhara, Navoiy, Khorezm and Karakalpakstan in Uzbekistan and the entire Turkmenistan.
4.1 Model evaluation
We input the collected data and expert knowledge into the BN and compiled it with the EM algorithm in the Netica. In this study, we selected four nodes as target variables for a sensitivity analysis (Fig. 7). We found that VB and MI have similar trends, and when VB is larger, MI is also larger. This indicates that the correlation and uncertainty between nodes are synchronized in response to changes in the parent node. The upstream power generation of the two basins is sensitive to the hydropower and imported energy. The downstream water use is more sensitive to agricultural water and living water use. The downstream agricultural production is very sensitive to crop production, animal husbandry production and soil salinization. The water inflow to the Aral Sea is sensitive to runoff, water use and reservoir operation. The ranking of these sensitivity factors matches our knowledge and experience about the Aral Sea basin well. Since the impact of the other variables in the BN gradually decreases as the number of intermediate variables increases, these sensitivity results match well with expert and stakeholder perspectives. A strong pseudo-causality was not found between two variables with no obvious a priori causality. In general, the variables with a strong causality are directly connected in the network. This indicates that the established a priori causal structure has withstood the test of the actual data.
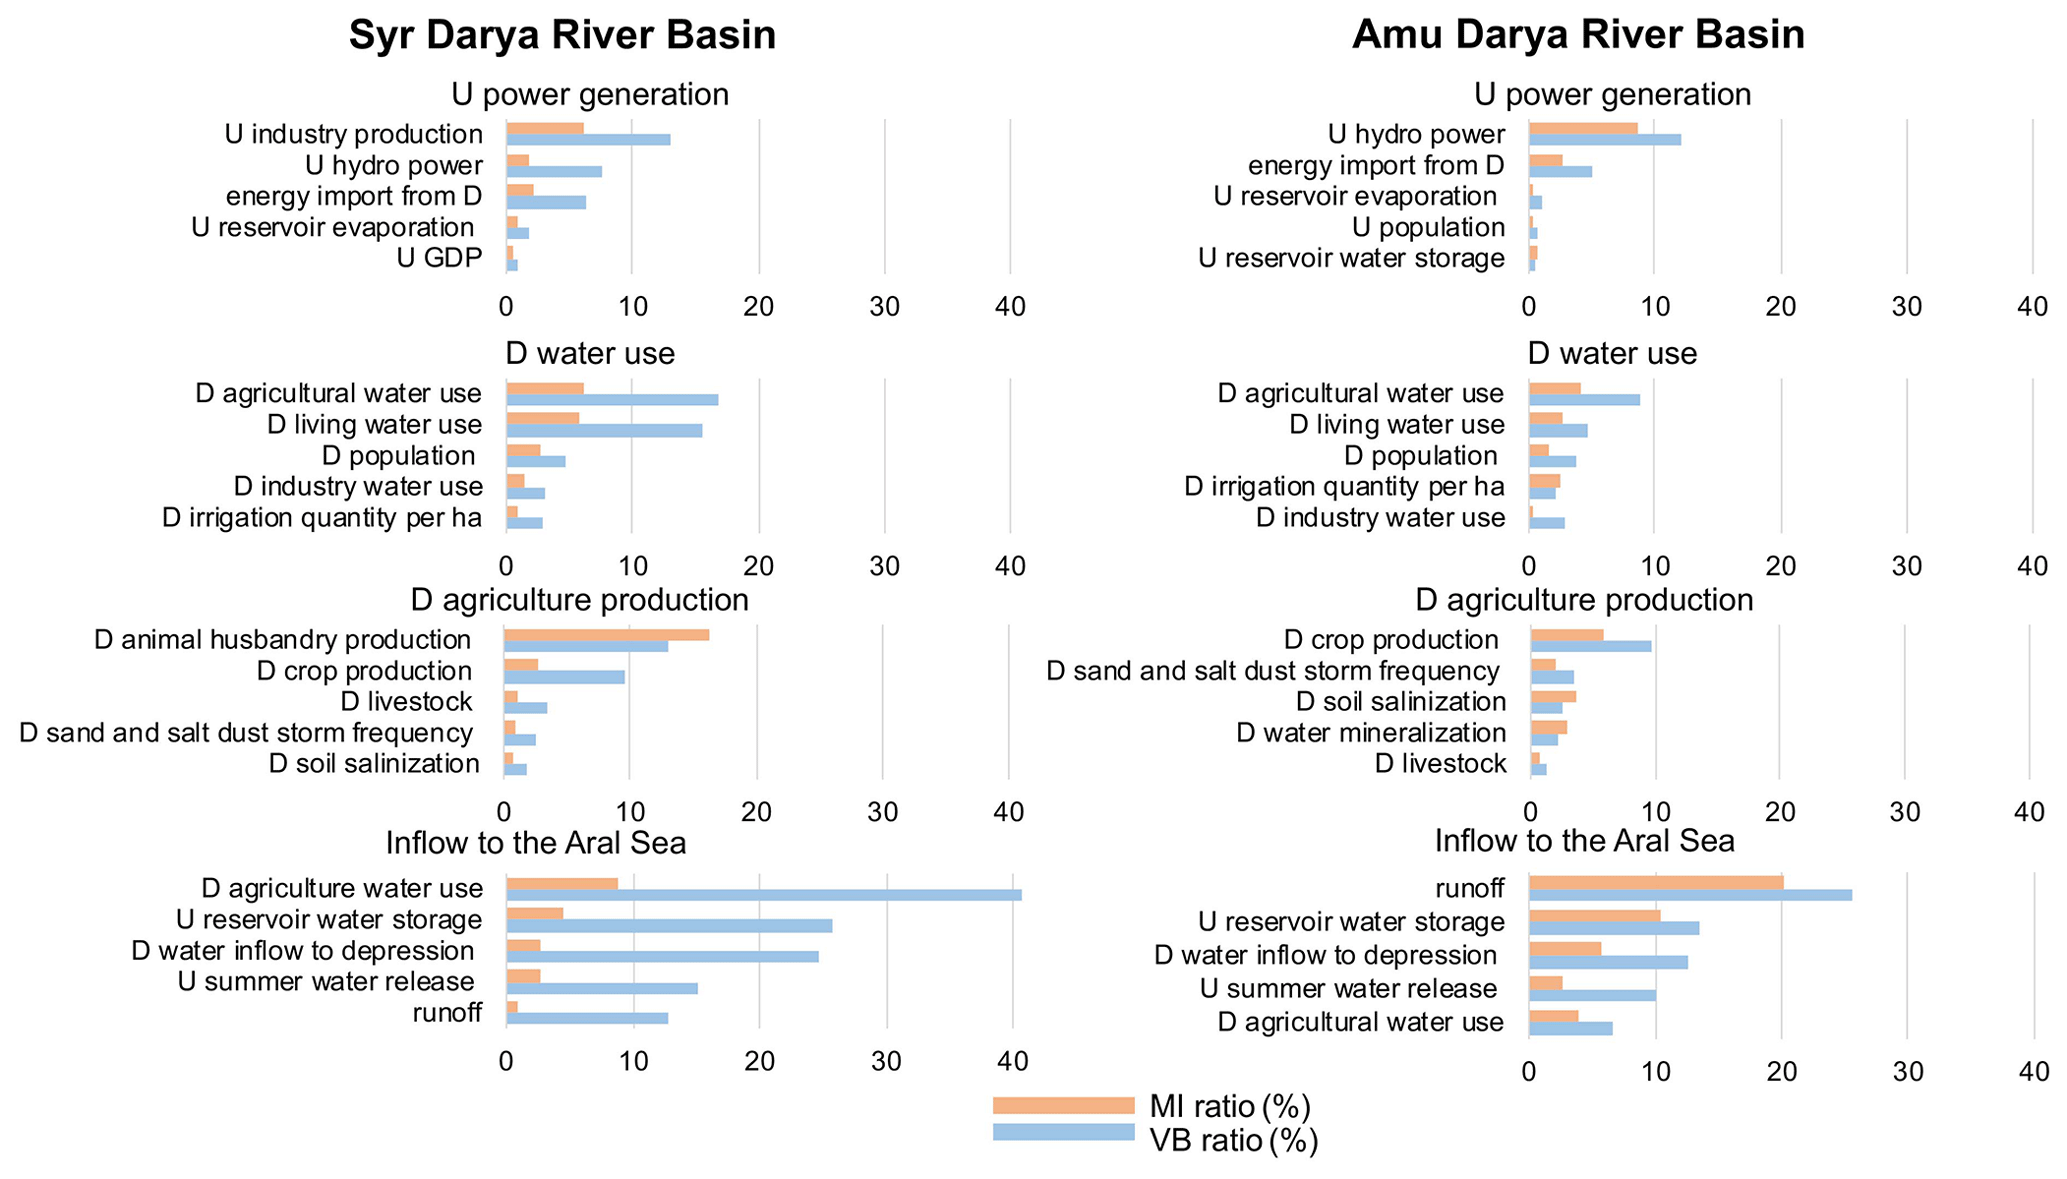
Figure 7Sensitivity analysis of some variables. VB stands for “variance of belief” and MI stands for “mutual information”. D stands for “downstream”; correspondingly, U stands for “upstream”.
4.2 Comparing the WEFE nexus of the SDB and ADB during the past 50 years
We applied the sensitivity analysis to the node “water inflow to the Aral Sea” of the SDB and ADB at different historical stages (Fig. 8). During the period 1970–1980, there was no significant difference between the influencing factors of the two river basins, and the related variables of the increased agricultural development contributed greatly. With the completion of the upstream reservoirs, the rising reservoir storage also had a certain contribution in both river basins. In this period, the variability of the natural runoff of the Syr Darya River was significantly larger than the Amu Darya River's, and the contribution of the natural runoff was higher. During the period 1980–1991, the contribution of most variables declined, which may be related to the normalization of the maximized agricultural production, leaving only the natural runoff as the main variation contribution. During the period 1991–2005, for the SDB, the contribution of the water inflow into the depression rose significantly. In both river basins, the reservoir storage and summer release contribution also augmented largely, with the SDB even higher, and the support of the upstream energy import from the downstream area also increased. During the period 2005–2015, for the SDB, the contributions of the agricultural water and downstream crop area rose significantly and the output of the water inflow to the depression decreased.
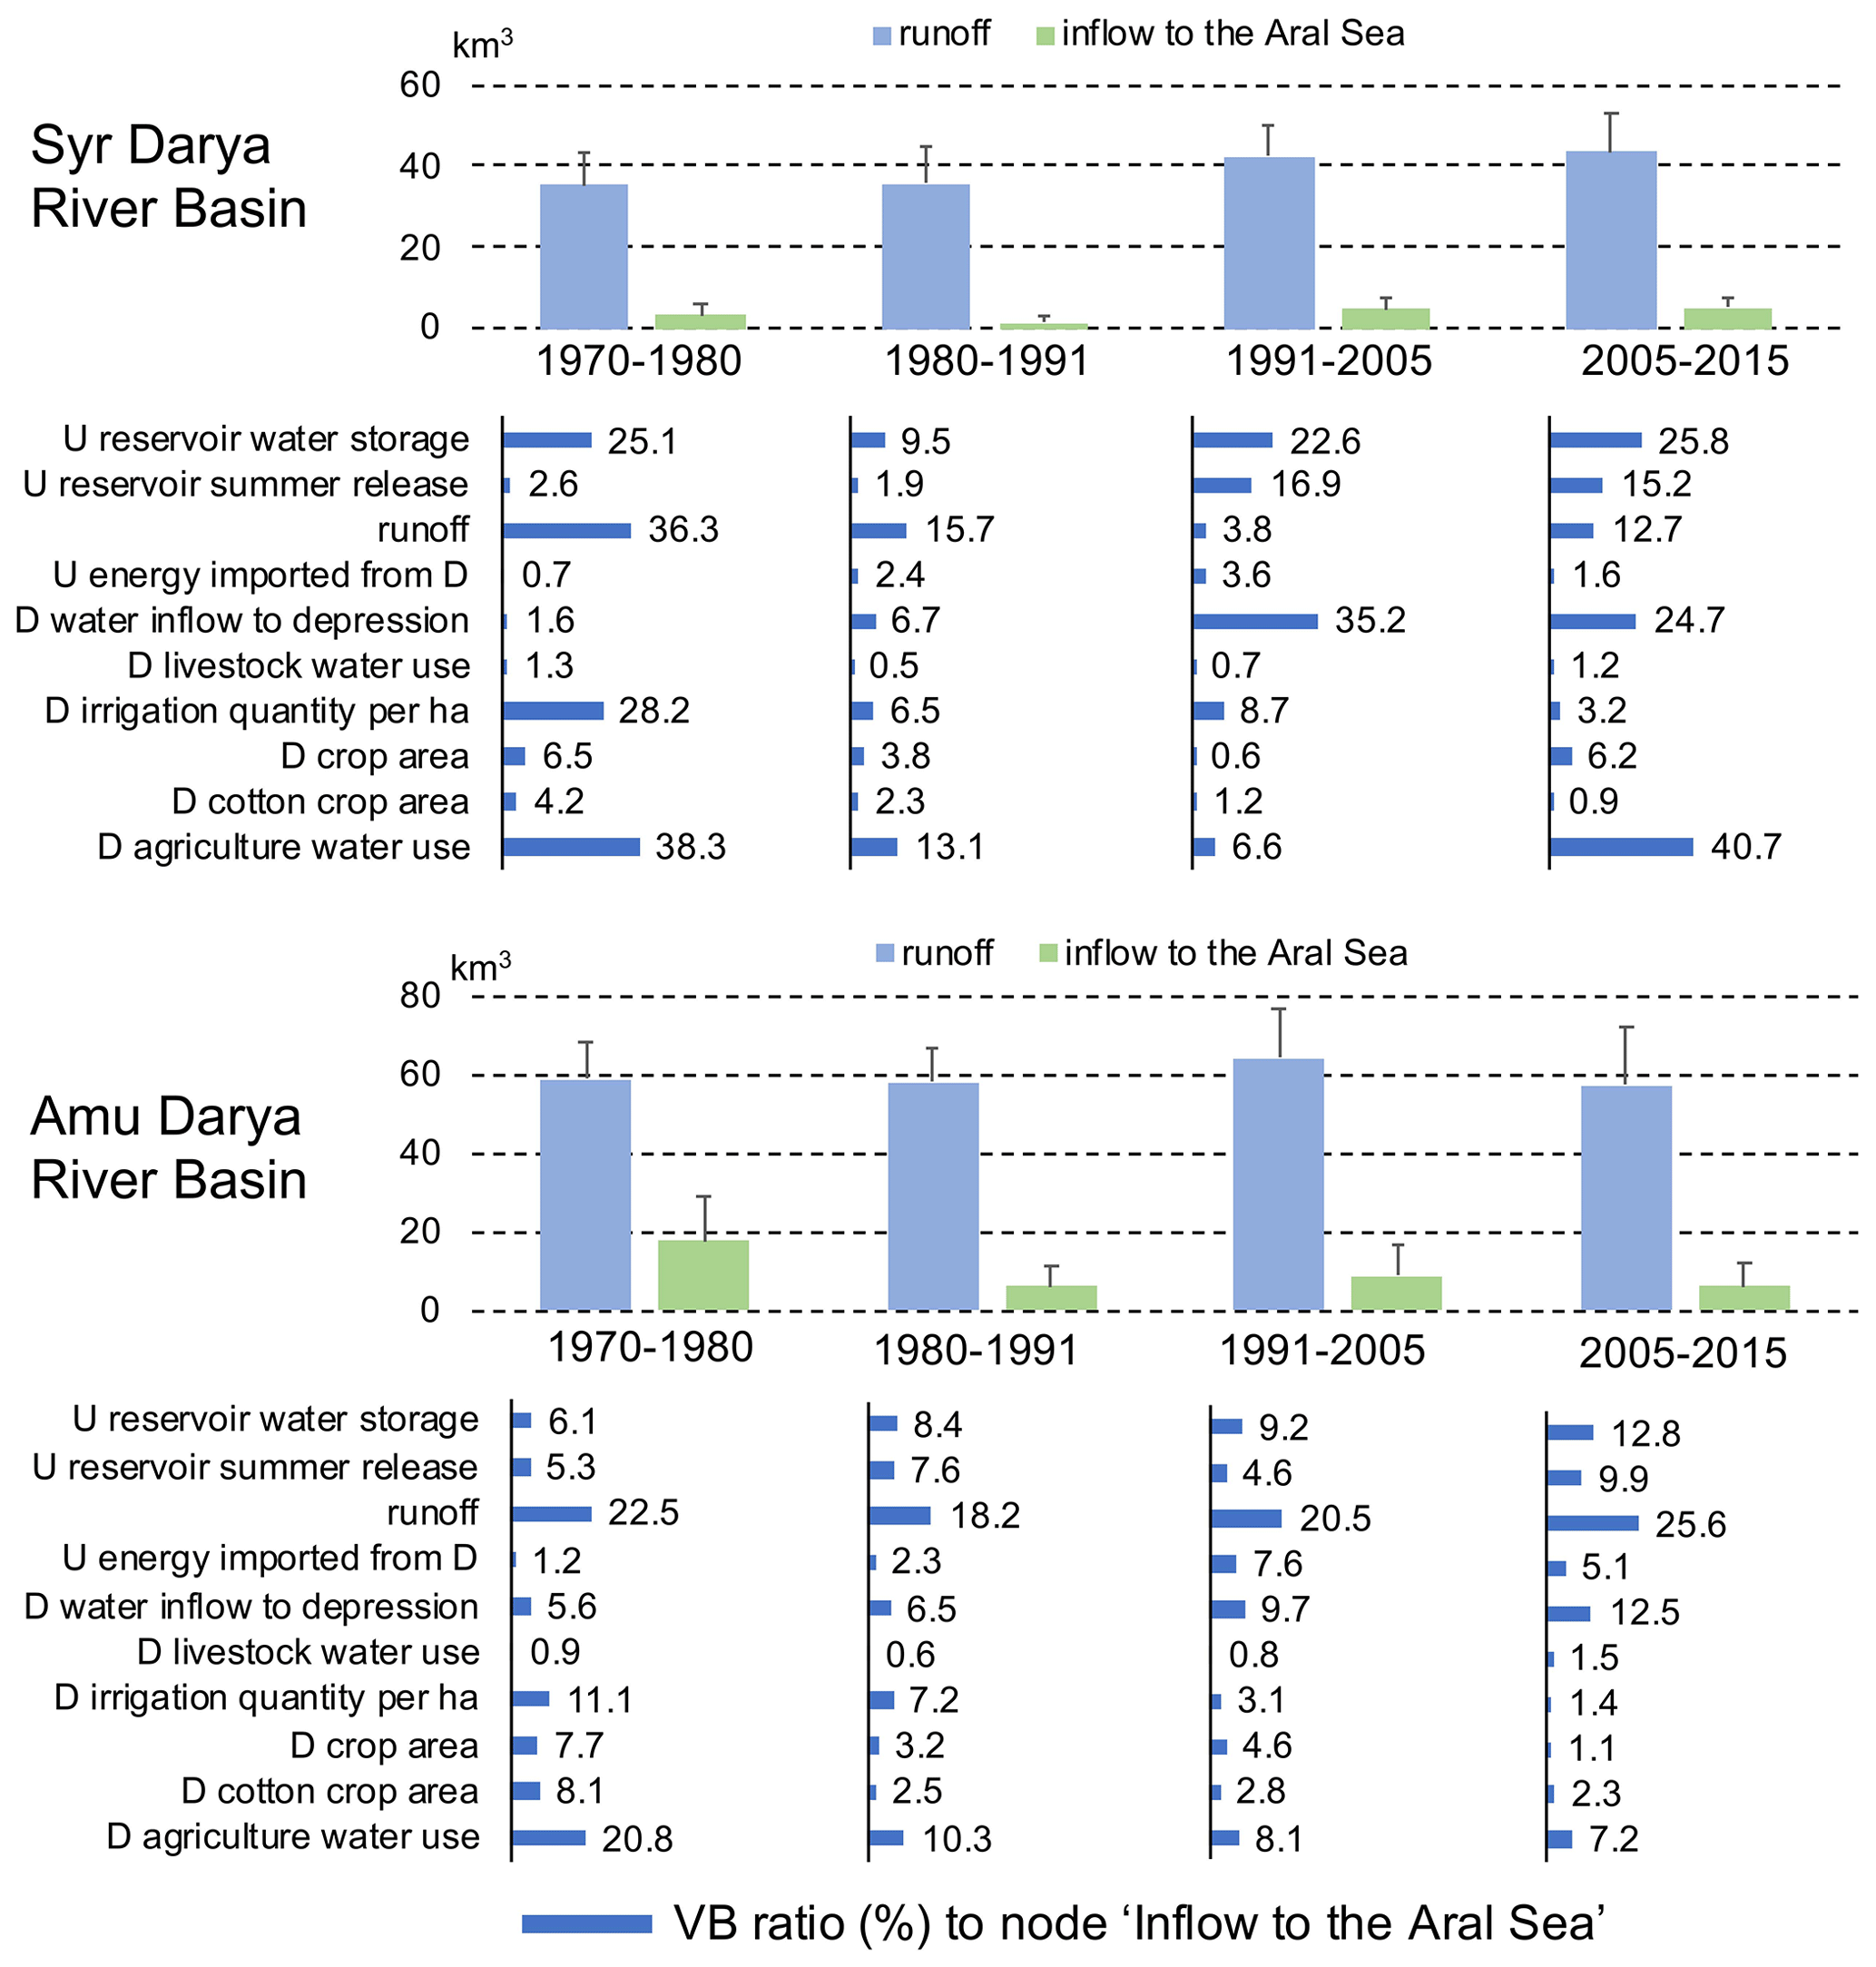
Figure 8Comparison of the sensitivity analysis of the “water inflow to the Aral Sea” node of the ADB and SDB in four historical periods from 1970 to 2015. D stands for “downstream”; correspondingly, U stands for “upstream”. VB stands for “variance of belief”.
In general, before the collapse of the USSR, the difference was mainly sourced from the runoff variability and the proportion of the upstream reservoir interception to the total natural runoff. The runoff proportion of the Naryn River tributary (about 35 % of the total runoff of the Syr Darya River) intercepted by the Toktogul hydropower station was higher than the one of the Vakhsh River tributary (about 25 % of the total runoff of the Amu Darya River) intercepted by the Nurek hydropower station. It also shows that the SDB's upstream major reservoir had a stronger streamflow control capability than the ADB's. After the collapse of the USSR, the contradiction in the question “Should water be used for the summer irrigation water of the downstream country or the winter power generation in the upstream country?” in both river basins escalated, but the conflict in the SDB has become more and more intense and the Toktogul reservoir operation in Kyrgyzstan has changed completely from the original natural model to a winter-release-dominated mode. However, the contribution of downstream energy supplied to the upstream country has not augmented much. This might be due to the fact that the changes in the energy trade agreements are hard to match with the annual hydrological cycle change. Receiving too much winter flow, the contribution of the SDB's water entering the Aydar depression increased rapidly after the disintegration and is higher than the ADB. The other part of the water entering the Aydar depression is the irrigation drainage water from collectors, which is similar to the Sarykamysh Lake in the ADB. However, during the 2005–2015 period of the SDB, the sensitivity to the flow of depressions decreased. This may be due to the increased water storage capacity of Kazakhstan's newly built plain reservoirs such as Koksaray, which reduces the risk of dam failure of the Chardara reservoir located on the border of Uzbekistan and Kazakhstan. As there is no provision in the basin water distribution agreement for the discharge of water from the Chardara reservoir to the Aydar depression, Kazakhstan may tend to release the surplus water from the Chardara reservoir to Koksaray rather than the Aydar depression. This will threaten the volume, water salinity, stability and fishery production (Groll et al., 2016) of the Aydar depression in Uzbekistan and intensify the water conflict between Uzbekistan and Kazakhstan. In addition, the contribution of some variables (such as livestock water use) has always been very low, possibly because the livestock water consumption only accounts for a small amount of the total runoff.
4.3 Scenario analysis and optimization of the WEFE nexus based on the BN
Based on the Bayesian posterior probability prediction ability, we enumerated the influence of some variables on other target nodes under different scenarios. Reducing the water volume entering depressions (Table 3) may be the most positive and helpful to restore the ecological water entering the Aral Sea. This implies that the efficiency of salt leaching and irrigation should be improved. It is also effective to increase the planting ratio of grain crops and reduce cotton planting with high water consumption to ensure food security. Increasing the energy supply from upstream to downstream areas and reducing the downstream irrigation quantity per hectare may also indirectly increase the ecological water inflow to the Aral Sea. Increasing the upstream reservoir water storage and winter water release may increase the inflow of salt water under high runoff conditions. The high upstream reservoir water storage and winter water release may indicate high runoff conditions, which may also lead to an increase in the inflow of the Aral Sea. Increasing the industrial production and animal husbandry may significantly increase GDP and livestock production. Among the damages that need prevention, drought is first because it has a significant effect on the desertification, soil salinization and water mineralization.
Table 3Comparison of the BN-based scenario analysis of the SDB and ADB.
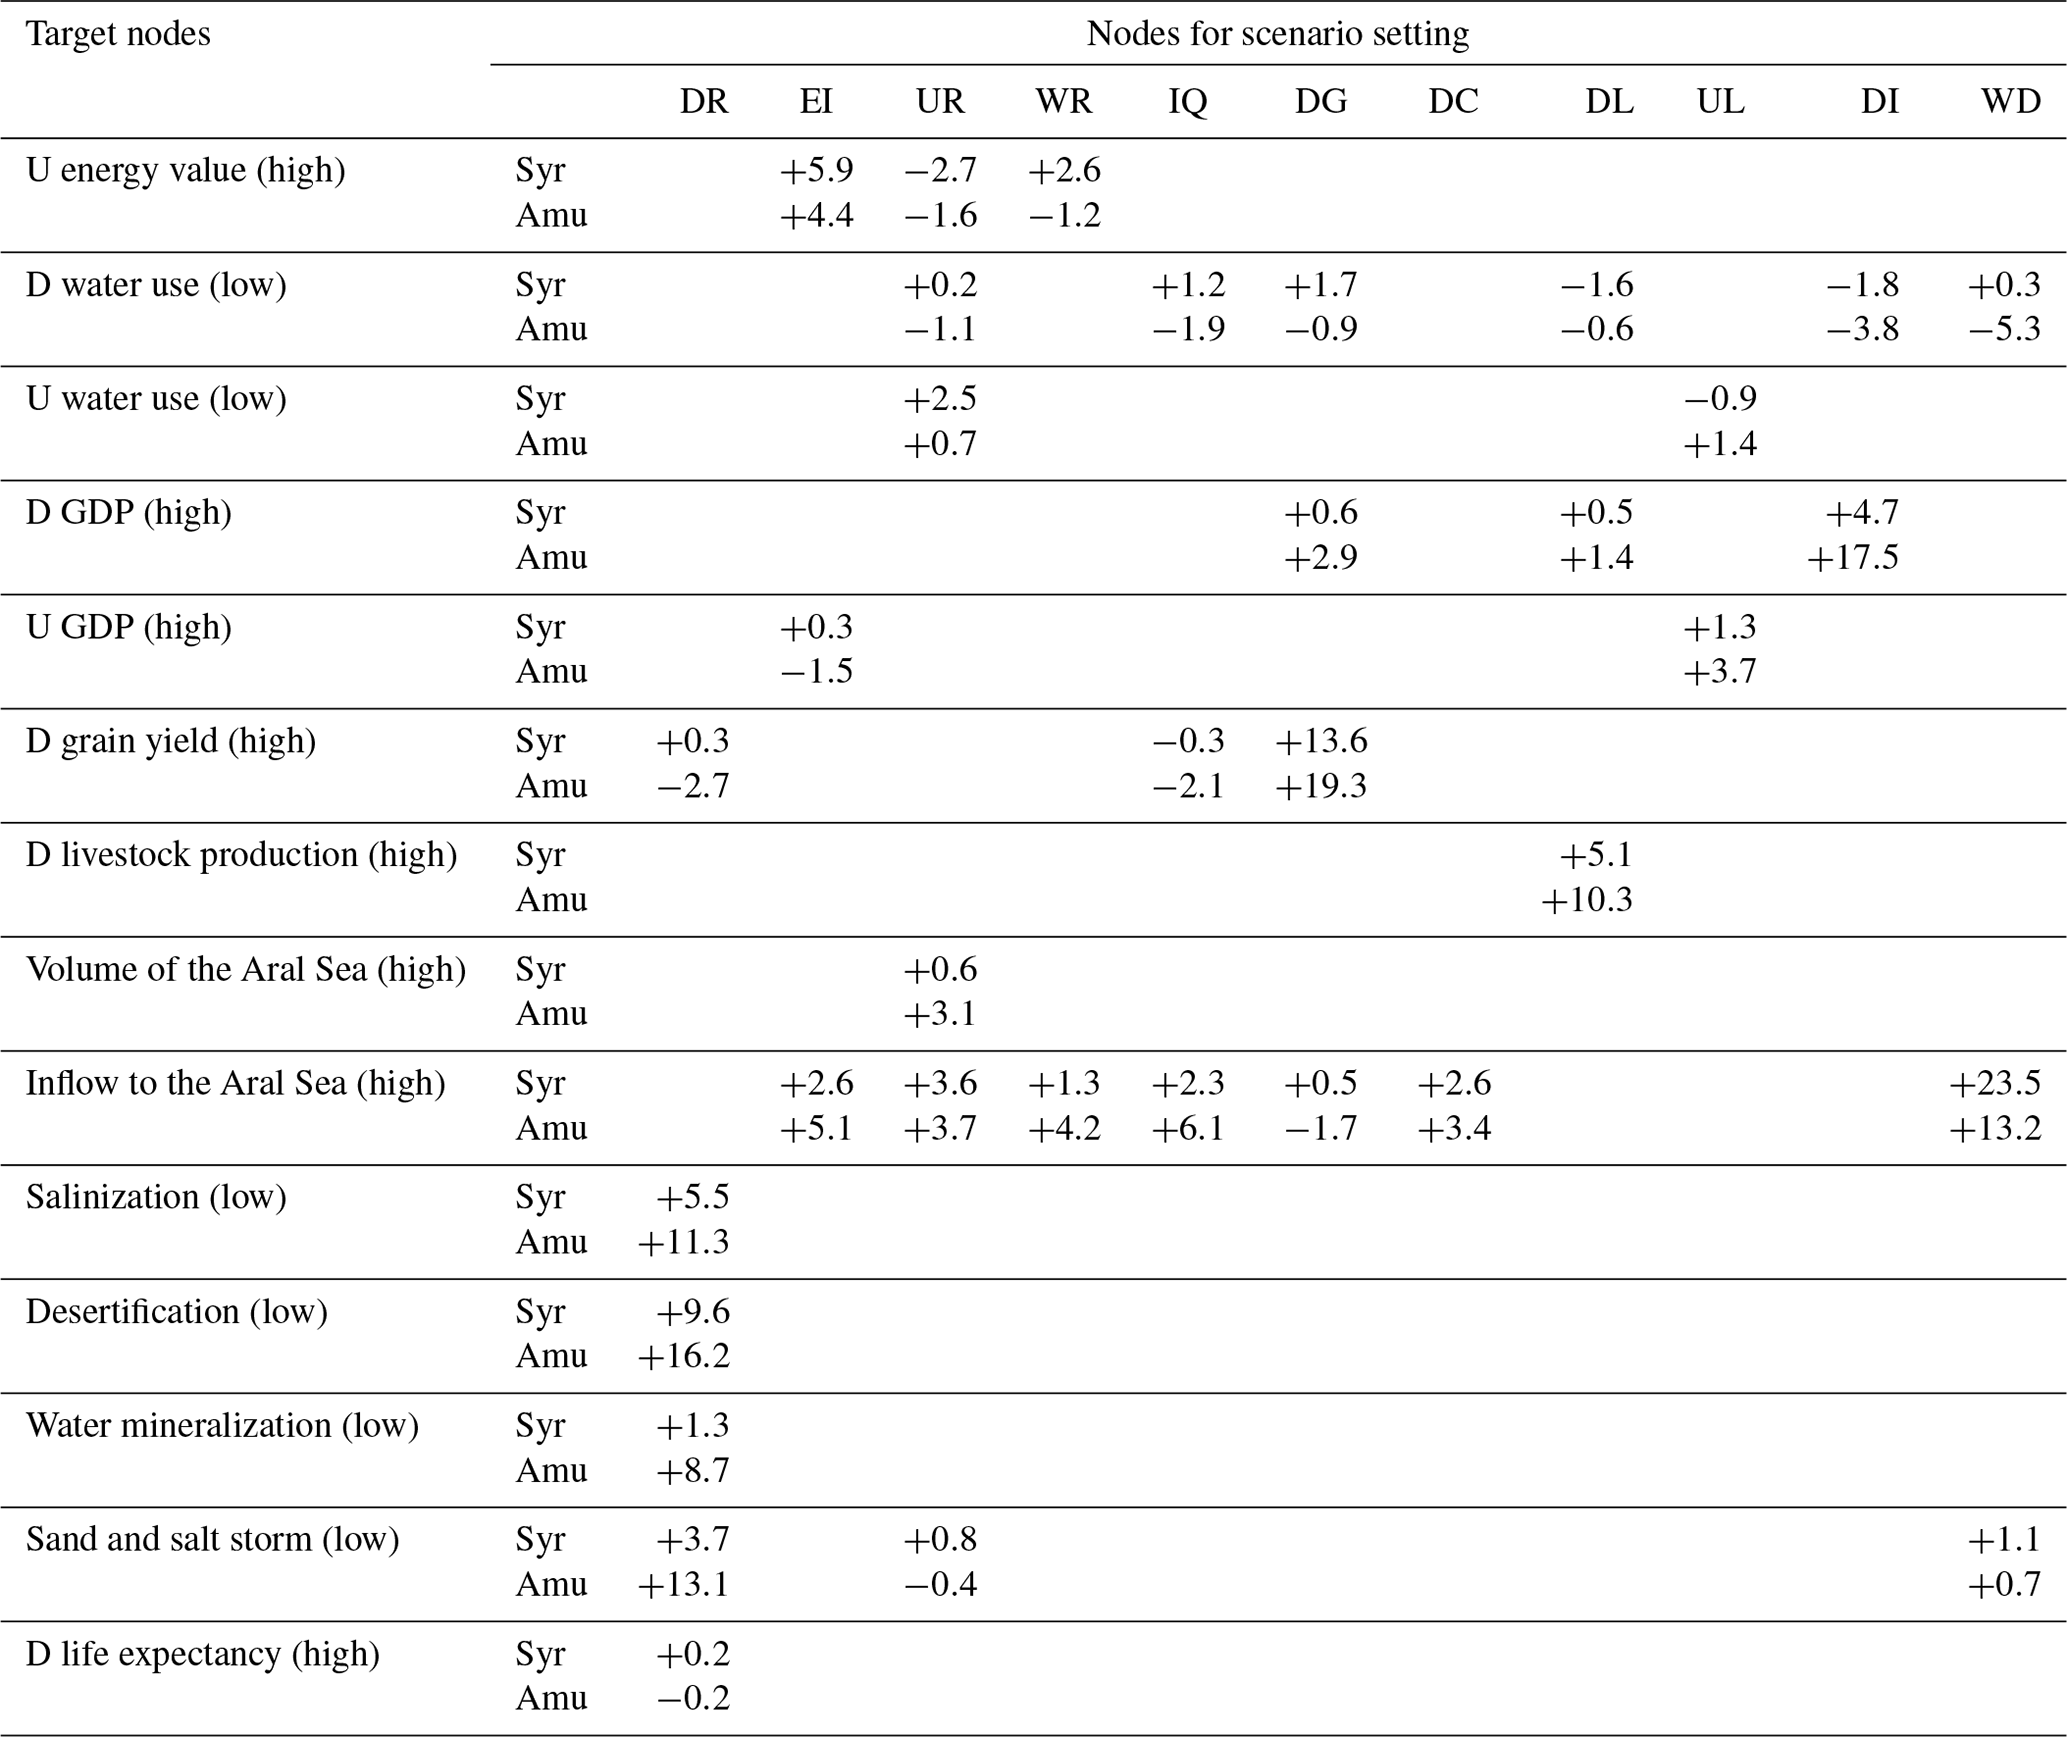
Note: D stands for the downstream region and U stands for the upstream region. DR represents drought index (low), EI represents energy import from D (high), UR represents U reservoir water storage (high), WR represents U winter water release (high), DG represents D grain crop area (high), IQ represents D irrigation quantity per hectare (low), DC represents D cotton crop area (low), UL represents U livestock amount (high), WD represents D water inflow to depressions (low), DI represents D industry production (high) and DL represents D livestock amount (high). The “high” and “low” respectively indicate the highest or lowest level of each node after discretization. The values in the table show the change in the percentage probability values of the specific states of the response nodes on the left after the “high” or “low” states of the upper scenario variables are determined.
4.4 The multi-criteria evaluation based on the MCMC sampling of the BN
The causal constraint of the Bayesian network on the distribution range of the point set in the multi-criteria evaluation space makes the decision-makers more intuitive about the multi-dimensional uncertainty of the system (Fig. 9). We found that the advantage of Bayesian probability theory was effectively integrated into the multi-criteria assessment. As one of the parent nodes, the a priori distribution of “runoff” affects the probability distribution of child nodes (such as benefit variables) through the transfer of joint probability calculations (Fig. 9). After the determination of the decision nodes, the distribution of the point set changed (shifted from the a priori joint distribution to the posterior distribution). The distribution of comprehensive benefits under different runoffs is obviously more regular or clustered. Unlike the independent Monte Carlo sampling of different variables which makes the distribution of the point set in the multi-criteria assessment space appear disorderly or chaotic in the previous system optimization analysis (Fig. 9), the BN-based MCMC sampling contains the causality and dependence between sampling of different variables.
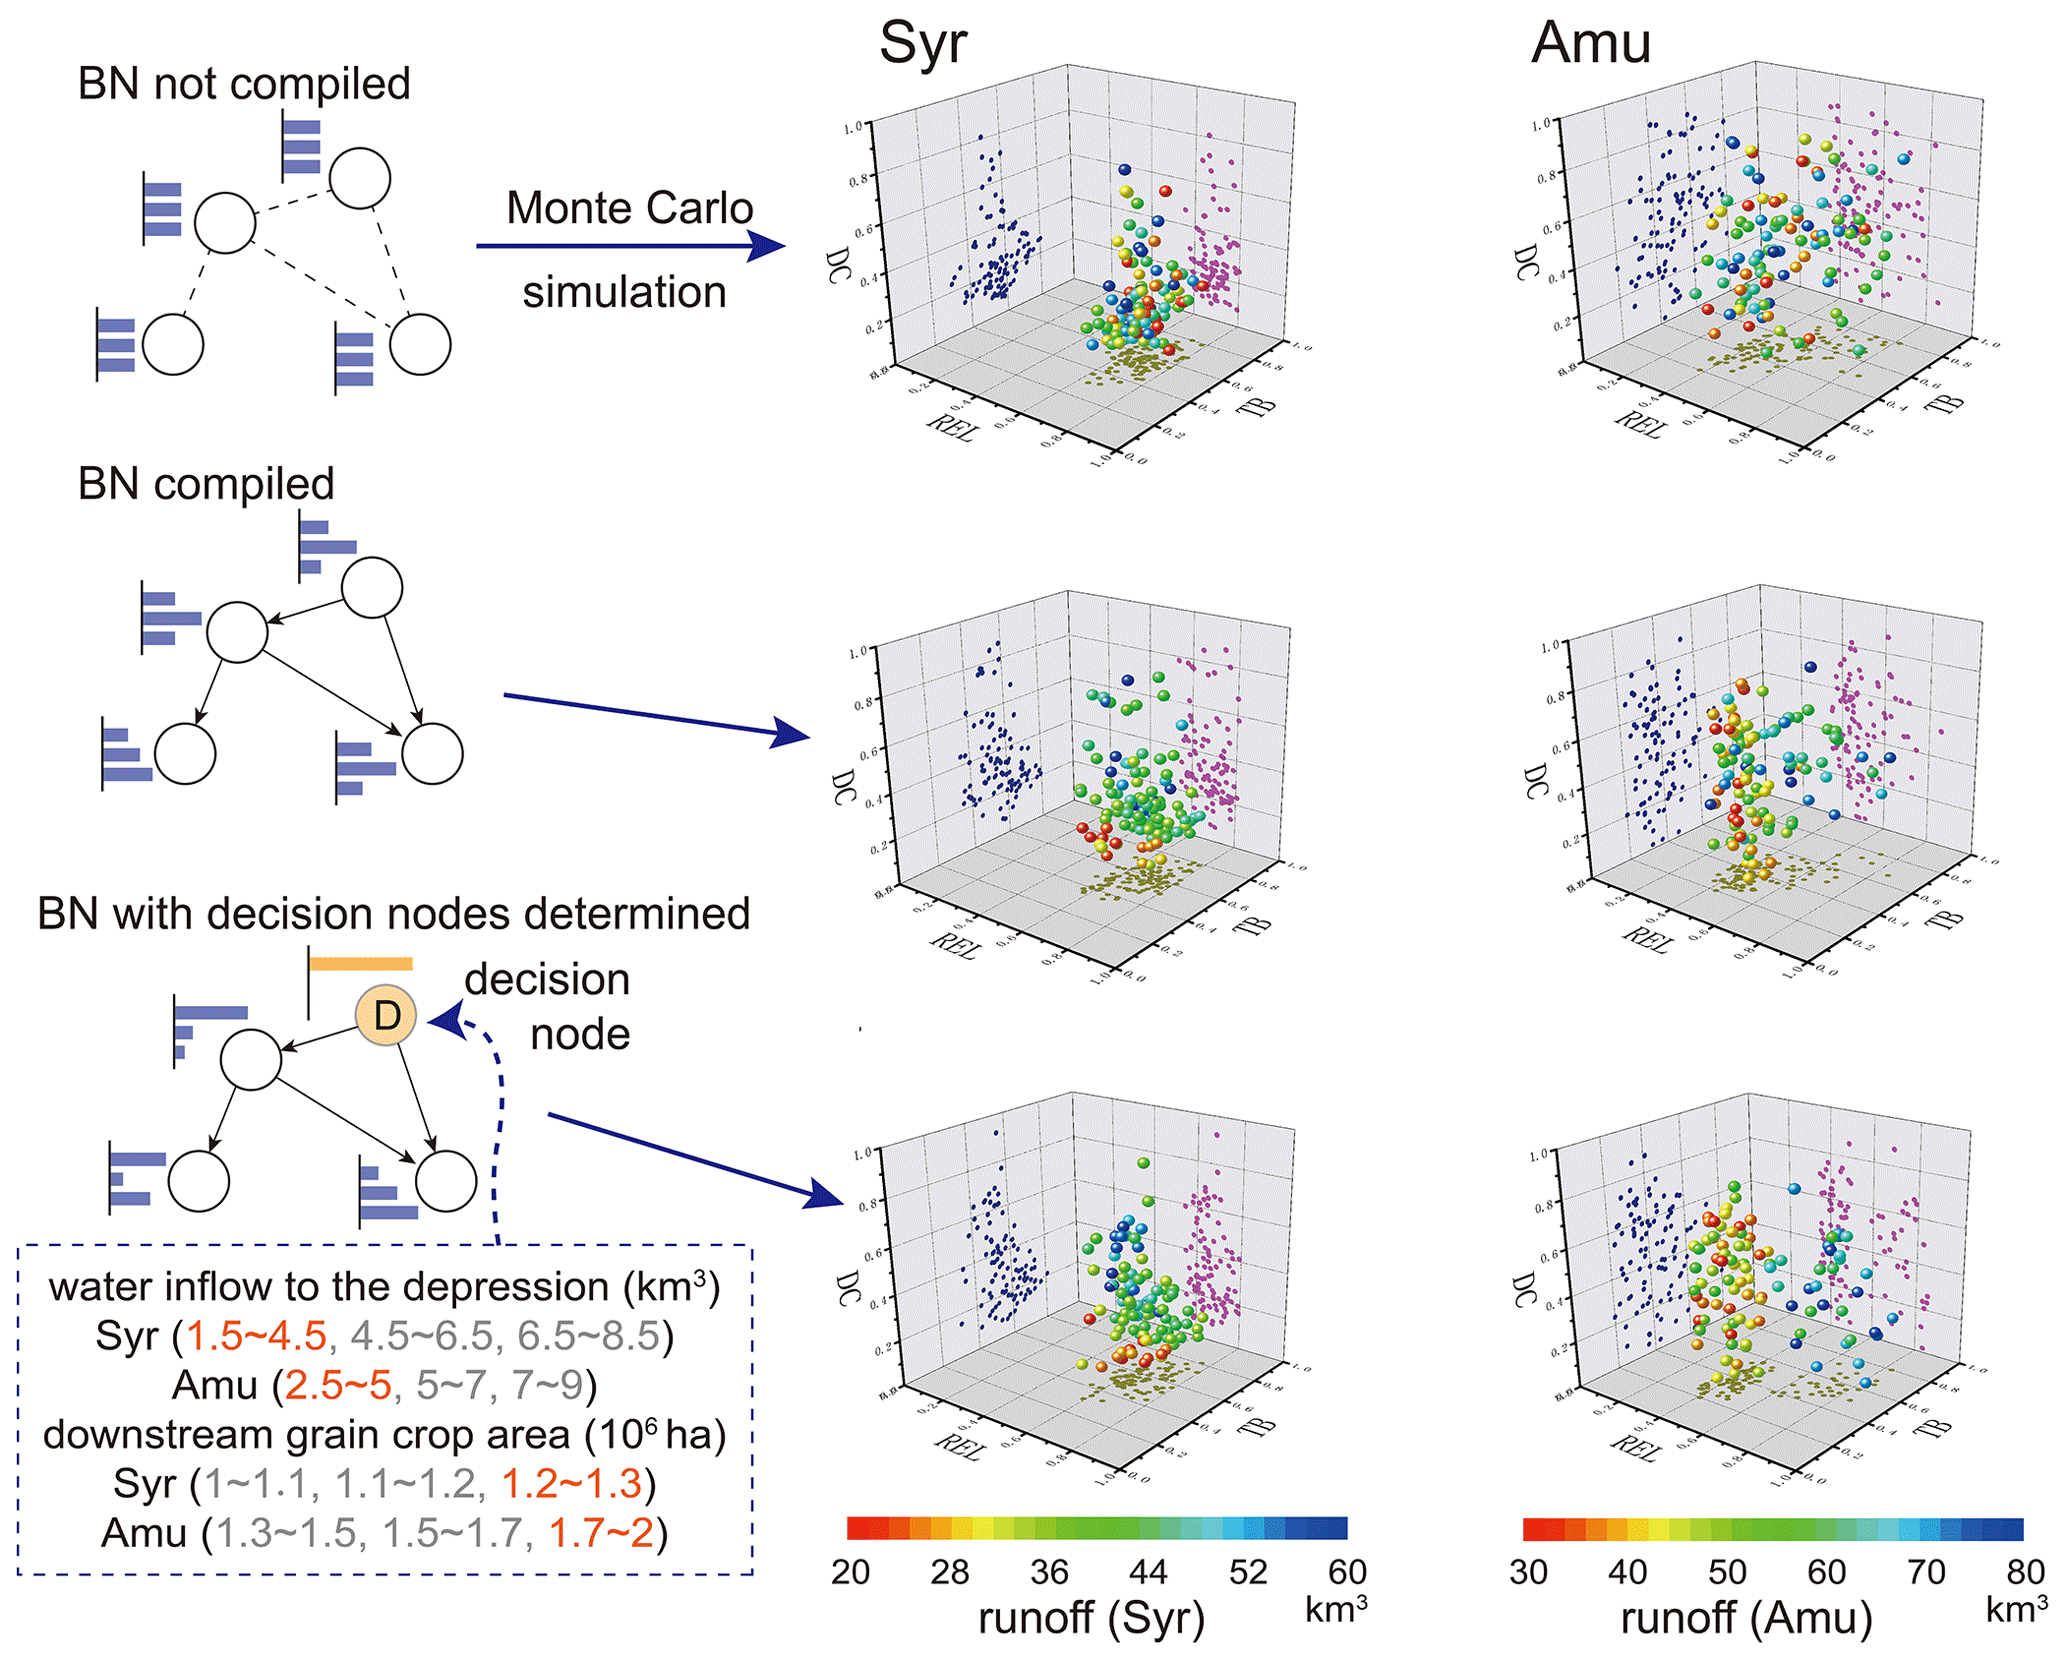
Figure 9Comparison of multi-criteria evaluation of the SDB and ADB based on the BN causality constraint-based MCMC sampling. At the top is the multi-criteria evaluation based on random sampling with no joint probability included, in the middle is the multi-criteria assessment containing the BN causality constraints and the bottom is based on the BN with nodes for optimization and decision determined.
However, this phenomenon varies on the specific axis of the two river basins. For example, for the SDB, the degree of cooperation (DC), which is calculated as the ratio of the upstream hydropower profit to the downstream agricultural production, is an effective index to cluster the cases under various runoffs. In view of the ADB, however, the DC is not a good index for clustering, and the partial distribution pattern of the cases on the DC axis is hardly controlled by various runoffs. This illustrates that in the SDB and ADB, the relationship between the DC and the annual runoff is quite different. The DC in the SDB driven by water–energy conflict is more affected by annual runoff. When the nodes for optimization are determined (“water inflow to the depression” and “downstream grain crop area”), in the practical decision-making, the Pareto fronts can be solved as the optimal solution set, with no other solution than the cases which could be found better in all three criteria in a multi-objective optimization. The solution sets under high, medium and low runoff could be solved separately but, in this study, we paid more attention to the uncertainty of the Pareto solutions. For example, under a high runoff, the uncertainty of the Pareto fronts of the ADB is higher than the one of the SDB, which shows that if these two optimization measures are applied to the ADB, the stability and robustness of the comprehensive benefits may be lower than the SDB's.
5.1 Effectiveness and limitations of the new framework
5.1.1 When applied to a single river basin
When applied to a single river basin, by measuring the involved uncertainties with joint probability, this framework can help decision-makers to re-examine causal and remotely related factors that may have been overlooked before. It also helps to update their empirical knowledge of the probability distribution of some nodal variables because the previous empirical knowledge may not include the collaborative consideration of the distribution of parent nodes. Compared with process-based models, it has advantages in integrating knowledge from multi-fields and quantification of uncertainty and causality caused by data limitations and disadvantages in its ability to explain detailed processes or driving mechanisms.
The main limitations of the framework may include inappropriate selection of nodes, mismatches in the temporal and spatial representation of variables, and lack of consideration of detailed causal processes and feedback causality. If the selected nodes are inappropriate, it may lead to the failure of the capture of causality. For example, it may be inappropriate for us to select the average life expectancy instead of the incidence of specific diseases caused by ecological problems such as respiratory diseases caused by sand and salt storms. The BN may not be suitable in cases that require detailed spatial and/or temporal representation (Chen and Pollino, 2012). The factors that differ from the annual scale of hydrological information may not be modelled well. For example, the changes in the energy supply from downstream to upstream might not match the variation of the annual water supply from upstream to downstream, although there is an obvious causal relation between them. In addition, the variables with cumulative values may not match the annual variation of the hydrological information. As a cumulative value, the node “the area of the Aral Sea” is not as good as the annual water entering the Aral Sea to adapt to the annual hydrological variation, and the node “soil salinity” is also not as good as the node “water mineralization” in order to adapt to the annual hydrological variation. Therefore, this BN trained from the yearly data may be more suitable for modelling variables that are sensitive to the annual hydrological variation, because each hydrological year is considered to be independent in this BN. The evaluation of some long-term variables may require a further integration of the process models, such as the long-term trend of soil salinization below the root zone and the long-term melting trend of the upstream glaciers with its impacts on components and spatiotemporal processes of the runoff in these river basins (Liu et al., 2011; Wang et al., 2016). The lack of a more detailed description of causality may cause some detailed but important causality to be ignored, making it difficult for us to discover the differences between river basins. Therefore, the scale to which the structure needs to be refined and when it needs to be refined are what we need to consider carefully when promoting this framework. In addition, the causal relationship between variables in the BN is unidirectional, which may make it difficult to quantify the complex interactive feedback effects (Chen and Pollino, 2012).
5.1.2 When applied to two or multiple river basins comparatively
In terms of comparing basins, this new BN-based framework performs well in the SDB and ADB. Compared with previous comparison methods (Alcamo et al., 2003; Döll et al., 2003; Grafton et al., 2012; Immerzeel et al., 2020; Joetzjer et al., 2013; Ladson and Argent, 2002; Müller Schmied et al., 2014; Syed et al., 2005; Vetter et al., 2017; Wang et al., 2020; Zawahri, 2008), this framework is more systematic and pays more attention to the description of causality. Based on the similarity of detail causality, the comparison of the WEFE nexus is comprehensive and meaningful in terms of historical analysis, uncertainty comparison and future system optimization. A comparative application to multiple watersheds may provide more extensive causal knowledge than application to a single watershed only. For example, in this study, we found that care should be taken when building large reservoirs on the Panj River in the upper Amu Darya to avoid disputes over surplus water downstream caused by the release of upstream reservoirs in winter. Without the lessons of the Syr Darya, it will be difficult to evaluate the downstream conflicts on the possible surplus water that will be caused by the further development of the Amu Darya. This may be related to the different levels of development in different river basins. Some river basins have gone through the development stage and can therefore provide lessons for the river basins that are now being rapidly developed.
Compared to process-based models, this framework quantified the actual differences between watersheds in the data-driven approach rather than in the parameter adjustment and calibration approach with the same process-based model, which has shown that the issue of parameter heterogeneity is important in the global multi-watershed comparison (Alcamo et al., 2003; Döll et al., 2003; Müller Schmied et al., 2014). In the comparison of the basin-wide WEFE nexus, we need to integrate multi-field knowledge, which may cause the problem of such parameter heterogeneity to be magnified, and the complexity of parameter adjustment will be higher, because more parameters are included and accuracy testing is also no longer limited to the original single field. In addition, the flexibility and universality of comparison under this framework may be stronger due to the use of the form of conditional probability tables. A conditional probability table can be constructed for each watershed as a general representation of the relationship between variables, but the form of a certain equation or driving function in the process-based model may not be suitable for each watershed. In addition, in this framework, the relatively simple model structure and the use of expert knowledge enable data-limited watersheds located in developing countries to be simulated more effectively, thereby making the modelling effects of watersheds located in different countries comparable. In contrast, the demand for observational data for complex process-based models may be too high for data-limited watersheds located in some developing countries (Chen et al., 2017). Due to the under-refined local parameters and processes in the data-limited watersheds, comparisons based on the process-based model at the fine-scale level may be unconvincing with uncertainty.
As far as the scalability and universality of this framework are concerned, due to the similarities between the concepts of the WEFE nexus and integrated water resource management, the past water resource management studies based on BNs in some arid regions or data-limited river basins (Frank et al., 2014; Keshtkar et al., 2013; Xue et al., 2017) may be able to provide additional evidence for the effectiveness of this framework. If we use this framework to compare more river basins, we may lose a little in the details of the structure and need to consider the trade-off of structure refinement and universality (Fig. 10). For example, comparing the Aral Sea basin with the Tarim River basin may require removing the water–energy conflict module, because there is no energy conflict between the upper and lower reaches in the non-transboundary Tarim River basin. However, this may also lead to deviations in the attribution of some specific downstream water system behaviours, because the difference in upstream water–energy conflict is ignored. In addition, the limitations of this comparison framework may include the inconsistency of network nodes and the difference in the value range of variables. For example, the defined location and attributes of “depressions” are different, and the difference in the spatial extent represented by the defined “upstream” and “downstream” regions may also affect the effect of comparative research. For the same variable of different basins, the difference in the value range and the variable status discretization operation may also bring errors to the comparison.
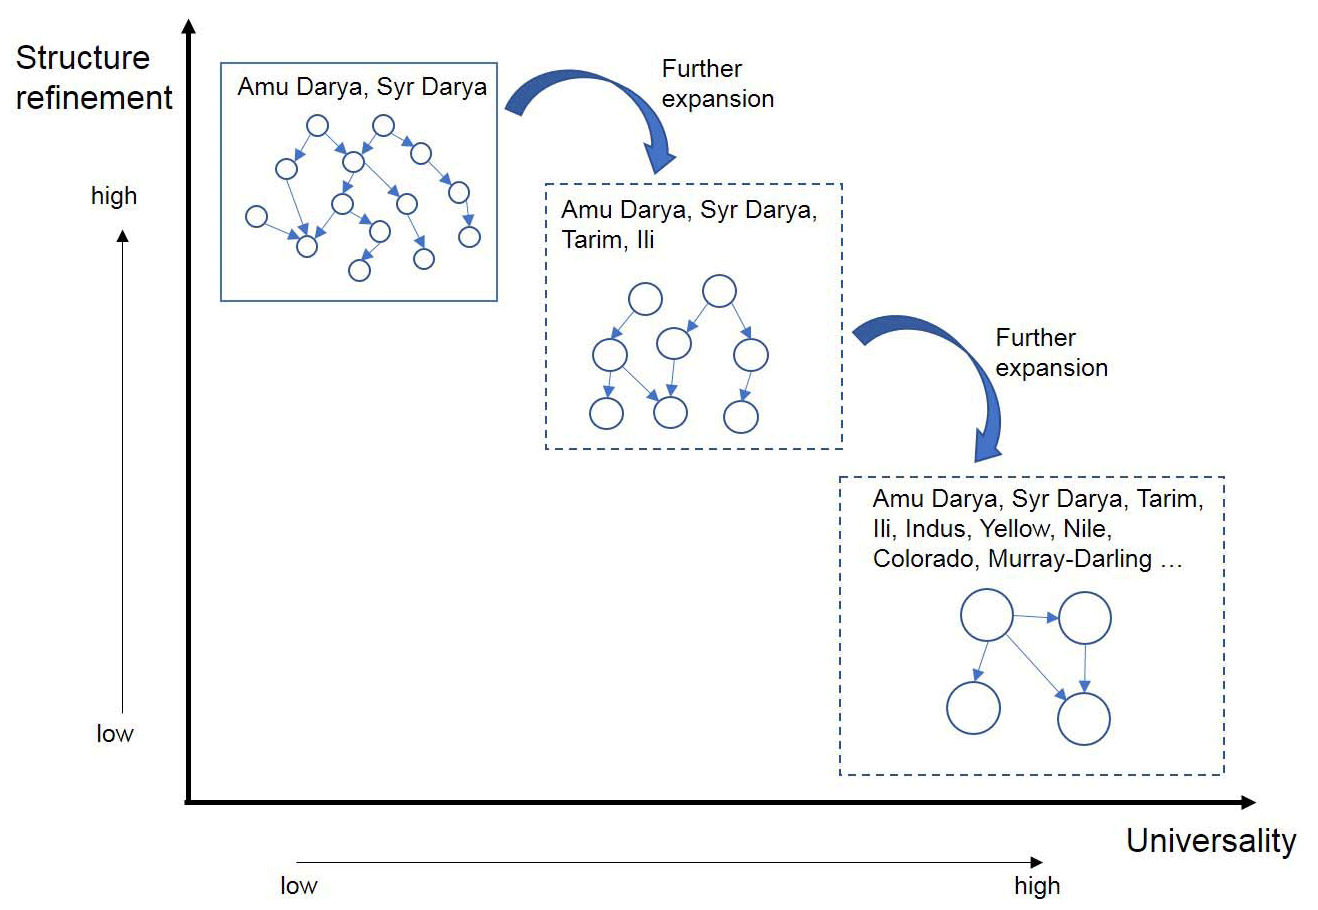
Figure 10The trade-off of structure refinement and universality in the new framework for comparing the basin-wide water–energy–food–ecology nexus based on the adjustable causal structure.
5.2 The main differences between the SDB and ADB concerning the WEFE nexus
In addition to the widely recognized differences in glacier melting in high mountainous areas (Farinotti et al., 2015; Immerzeel et al., 2020; Kraaijenbrink et al., 2017; Sorg et al., 2012), differences in interception capacity of upstream reservoirs in these two river basins (accounting for 47 % of total runoff of the SDB and 13 % of the ADB) could affect the seasonal distribution of the downstream runoff and the upper limit of the level of water–energy conflicts between the upstream and downstream countries. In the ADB, although the new Rogun dam on the Vakhsh River was brought into operation in 2018, it has a modest impact on downstream irrigation if the reservoir is operated to maximize basin-wide benefits (Jalilov et al., 2016). We should warn that in the future some large reservoirs may be constructed on the upstream Panj River, which would account for more than 40 % of the total runoff of the Amu Darya River. If so, the water–energy conflict between the upstream area of Tajikistan and the downstream part of Uzbekistan might escalate just like the SDB. One possible solution is to re-establish the complementary water–energy mechanism of the USSR period.
The water–energy conflicts between the upstream and downstream have gradually become everyday, but new conflicts and changes have been generated in the middle and lower reaches of the two rivers. In the SDB, in the face of excessive winter water discharge from Kyrgyzstan upstream, from 1991 to 2005, Kazakhstan could only release the surplus water from the Chardara reservoir to the Aydar depression in Uzbekistan in order to reduce flooding risk. However, after 2005, with the construction of more water conservancy projects in Kazakhstan, such as the Koksaray reservoir built to receive surplus water from the Chardara reservoir for irrigation, the water volume of the Aydar depression was affected. The current basin water distribution agreement does not specify the amount of water that the Aydar depression should receive from the Chardara reservoir. If this part of the water is subtracted, the Aydar depression can only be fed by irrigation drainage water with poor quality. These will lead to reduced water volume, deterioration of water quality, decreased ecological stability and fishery production of the Aydar depression. Therefore, it is necessary to pay more attention to the ecological problems of new water bodies in the water allocation of the basin, such as determining the annual release of Kazakhstan's Chardara reservoir to Uzbekistan's Aydar depression. This is also a reference value for Turkmenistan and Uzbekistan in the lower reaches of the ADB. With the increase in population and economic development, the contradictions in water use between downstream countries will gradually increase. The water–food–ecology conflict between downstream countries may be a chronic problem compared to the water–energy conflict with upstream mountainous countries.
Table 4Comparison of four river basins in the arid regions.
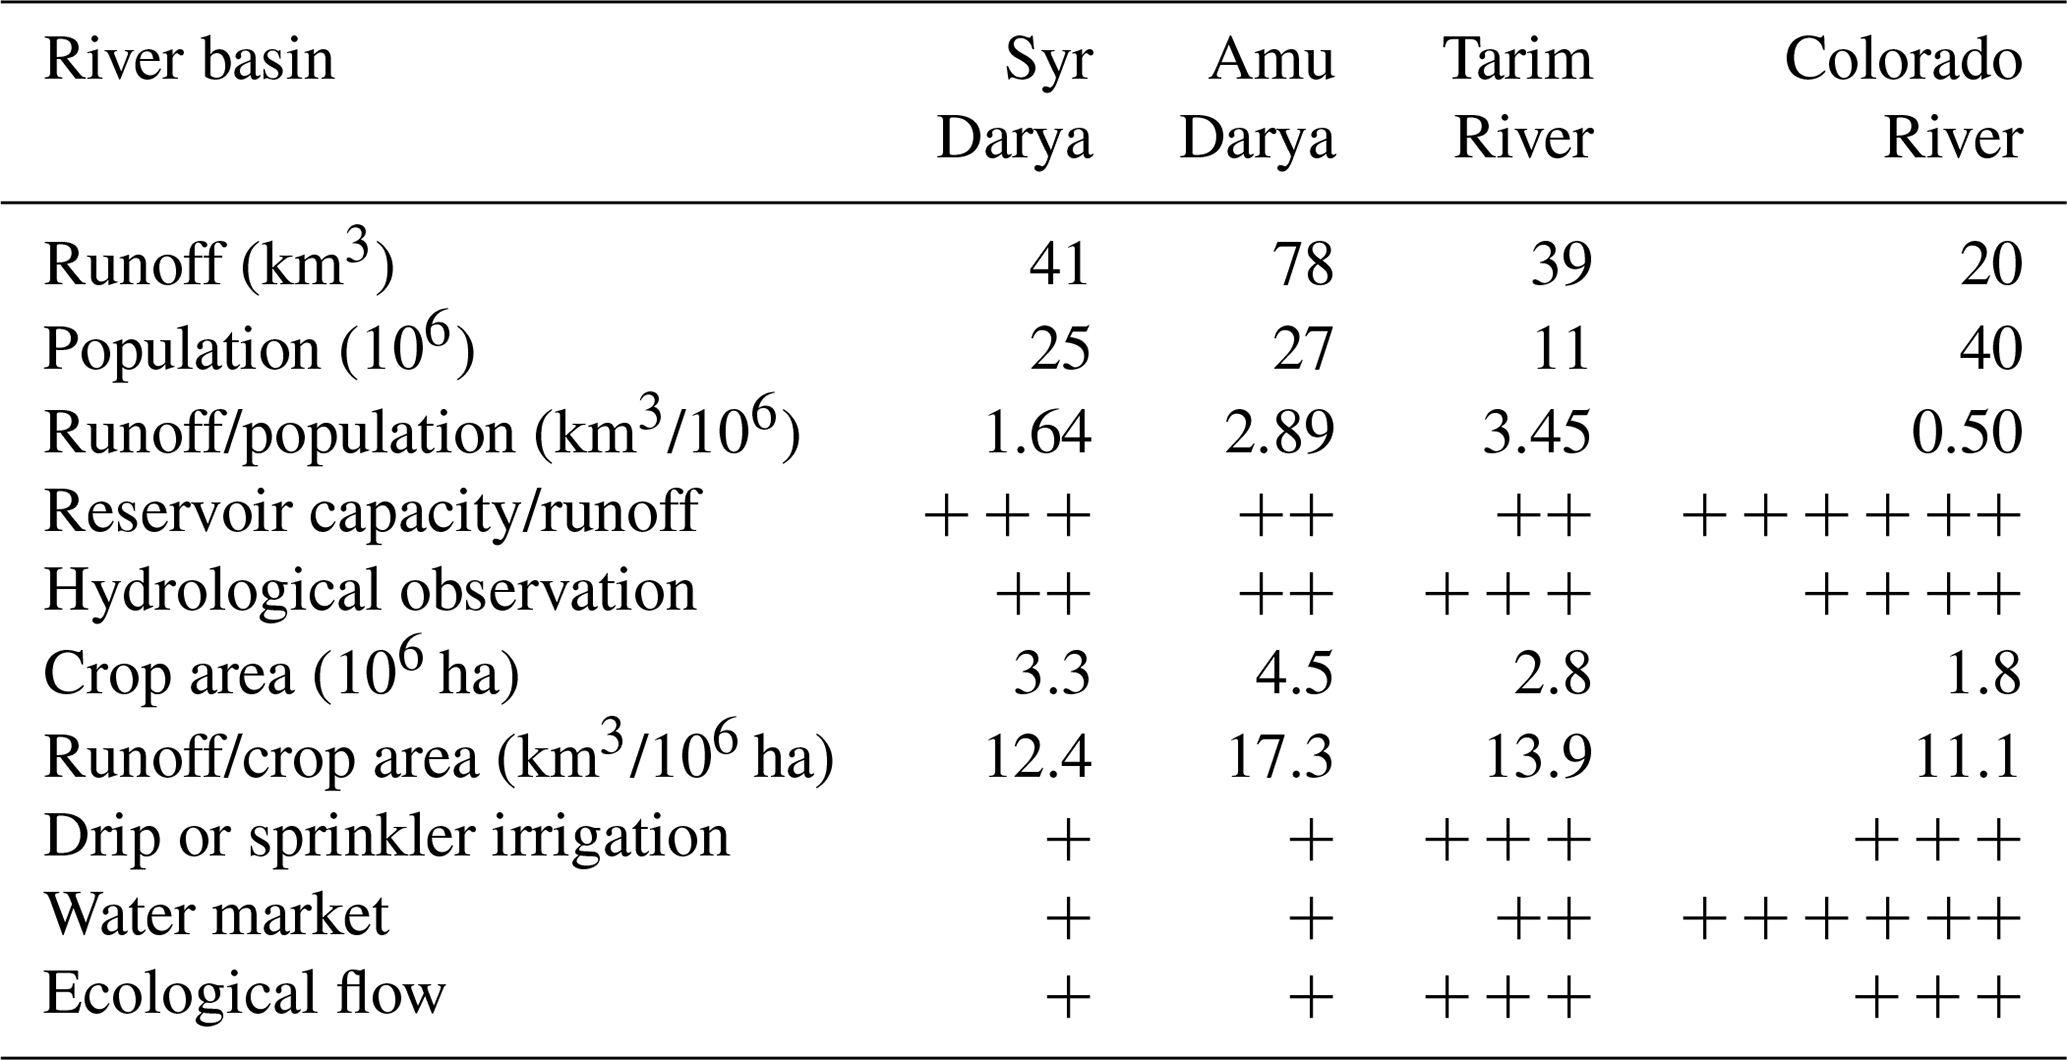
Note that the number of “+” represents the values from qualitative knowledge.
5.3 Other external measures
The Bayesian network in this study was mainly based on the expert knowledge and data only within the Aral Sea basin. It did not incorporate other potential external solutions indirectly based on the framework. However, some external measures derived from further consideration of the analysis of differences and optimization measures within the framework may also be useful as a complement to the solutions directly based on the framework. These external measures can be generated from the successful management experience of other river basins if more river basins are included in this framework. After the collapse of the USSR, the decline in the agricultural demand allowed more water to flow into the Aral Sea. However, the downstream countries in the basin seemed to lack concern for ecological water demand of the Aral Sea. The expansion of the water volume and depression area (Fig. 11) confirms this, although part of the water flow into the depressions is necessary for the leaching of soil salt in the irrigation lands. These expanding water bodies or wetlands could provide some ecosystem services such as fish supply. Such lower water efficiency will be challenged in the future, and saving water is the long-term solution. In addition to the repair of channels so as to reduce leakage, a spread and large-scale drip irrigation may reduce the total water consumption by more than 30 % and provide 20 to 30 km3 more ecological flow for the Aral Sea. It could also lower the high-salinity groundwater levels (Fig. 11), curb the secondary soil salinization (Zhang et al., 2014), reduce the drainage water with pesticides and salt to rivers, and reduce diseases caused by the poor water quality downstream. The promotion of drip irrigation has been considered useful for improving the irrigation efficiency in other arid regions, such as the Tarim River basin (Zhang et al., 2014) also located in the arid region of central Asia, of which the downstream water use efficiency has increased during recent years after the drip irrigation promotion. Also, reducing the water inflow to depressions may require stronger ability to regulate runoff and improve the low efficiency of surplus water management perhaps caused by the lack of water market regulation. Taking the Colorado River (Table 4) as an example, the construction of water conservancy facilities in the SDB and ADB could be improved. Enhancing the ability to regulate the runoff may allow a better use of the surplus water in the high-flow years but, at the same time, it is necessary to avoid the upstream and downstream conflicts caused by the new large reservoirs. Building a water market as efficient as the Colorado River in the Aral Sea basin still seems to have a long way to go. The Tarim River basin has set prices for the irrigation water since 2003, but in most parts of the Aral Sea basin, the irrigation water has not been priced yet. It might depend on the economic flexibility and a more efficient water delivery network. It is also necessary to strengthen the water–energy cooperation and to avoid zero-sum games between the upstream and downstream countries. This is a prerequisite for an optimal management of the Aral Sea basin. In addition, strengthening the cooperation with the neighbouring countries, such as Russia and China, might be helpful in terms of the water conservancy projects, energy and agricultural trade and indirectly ease the crisis in the WEFE nexus as a result.
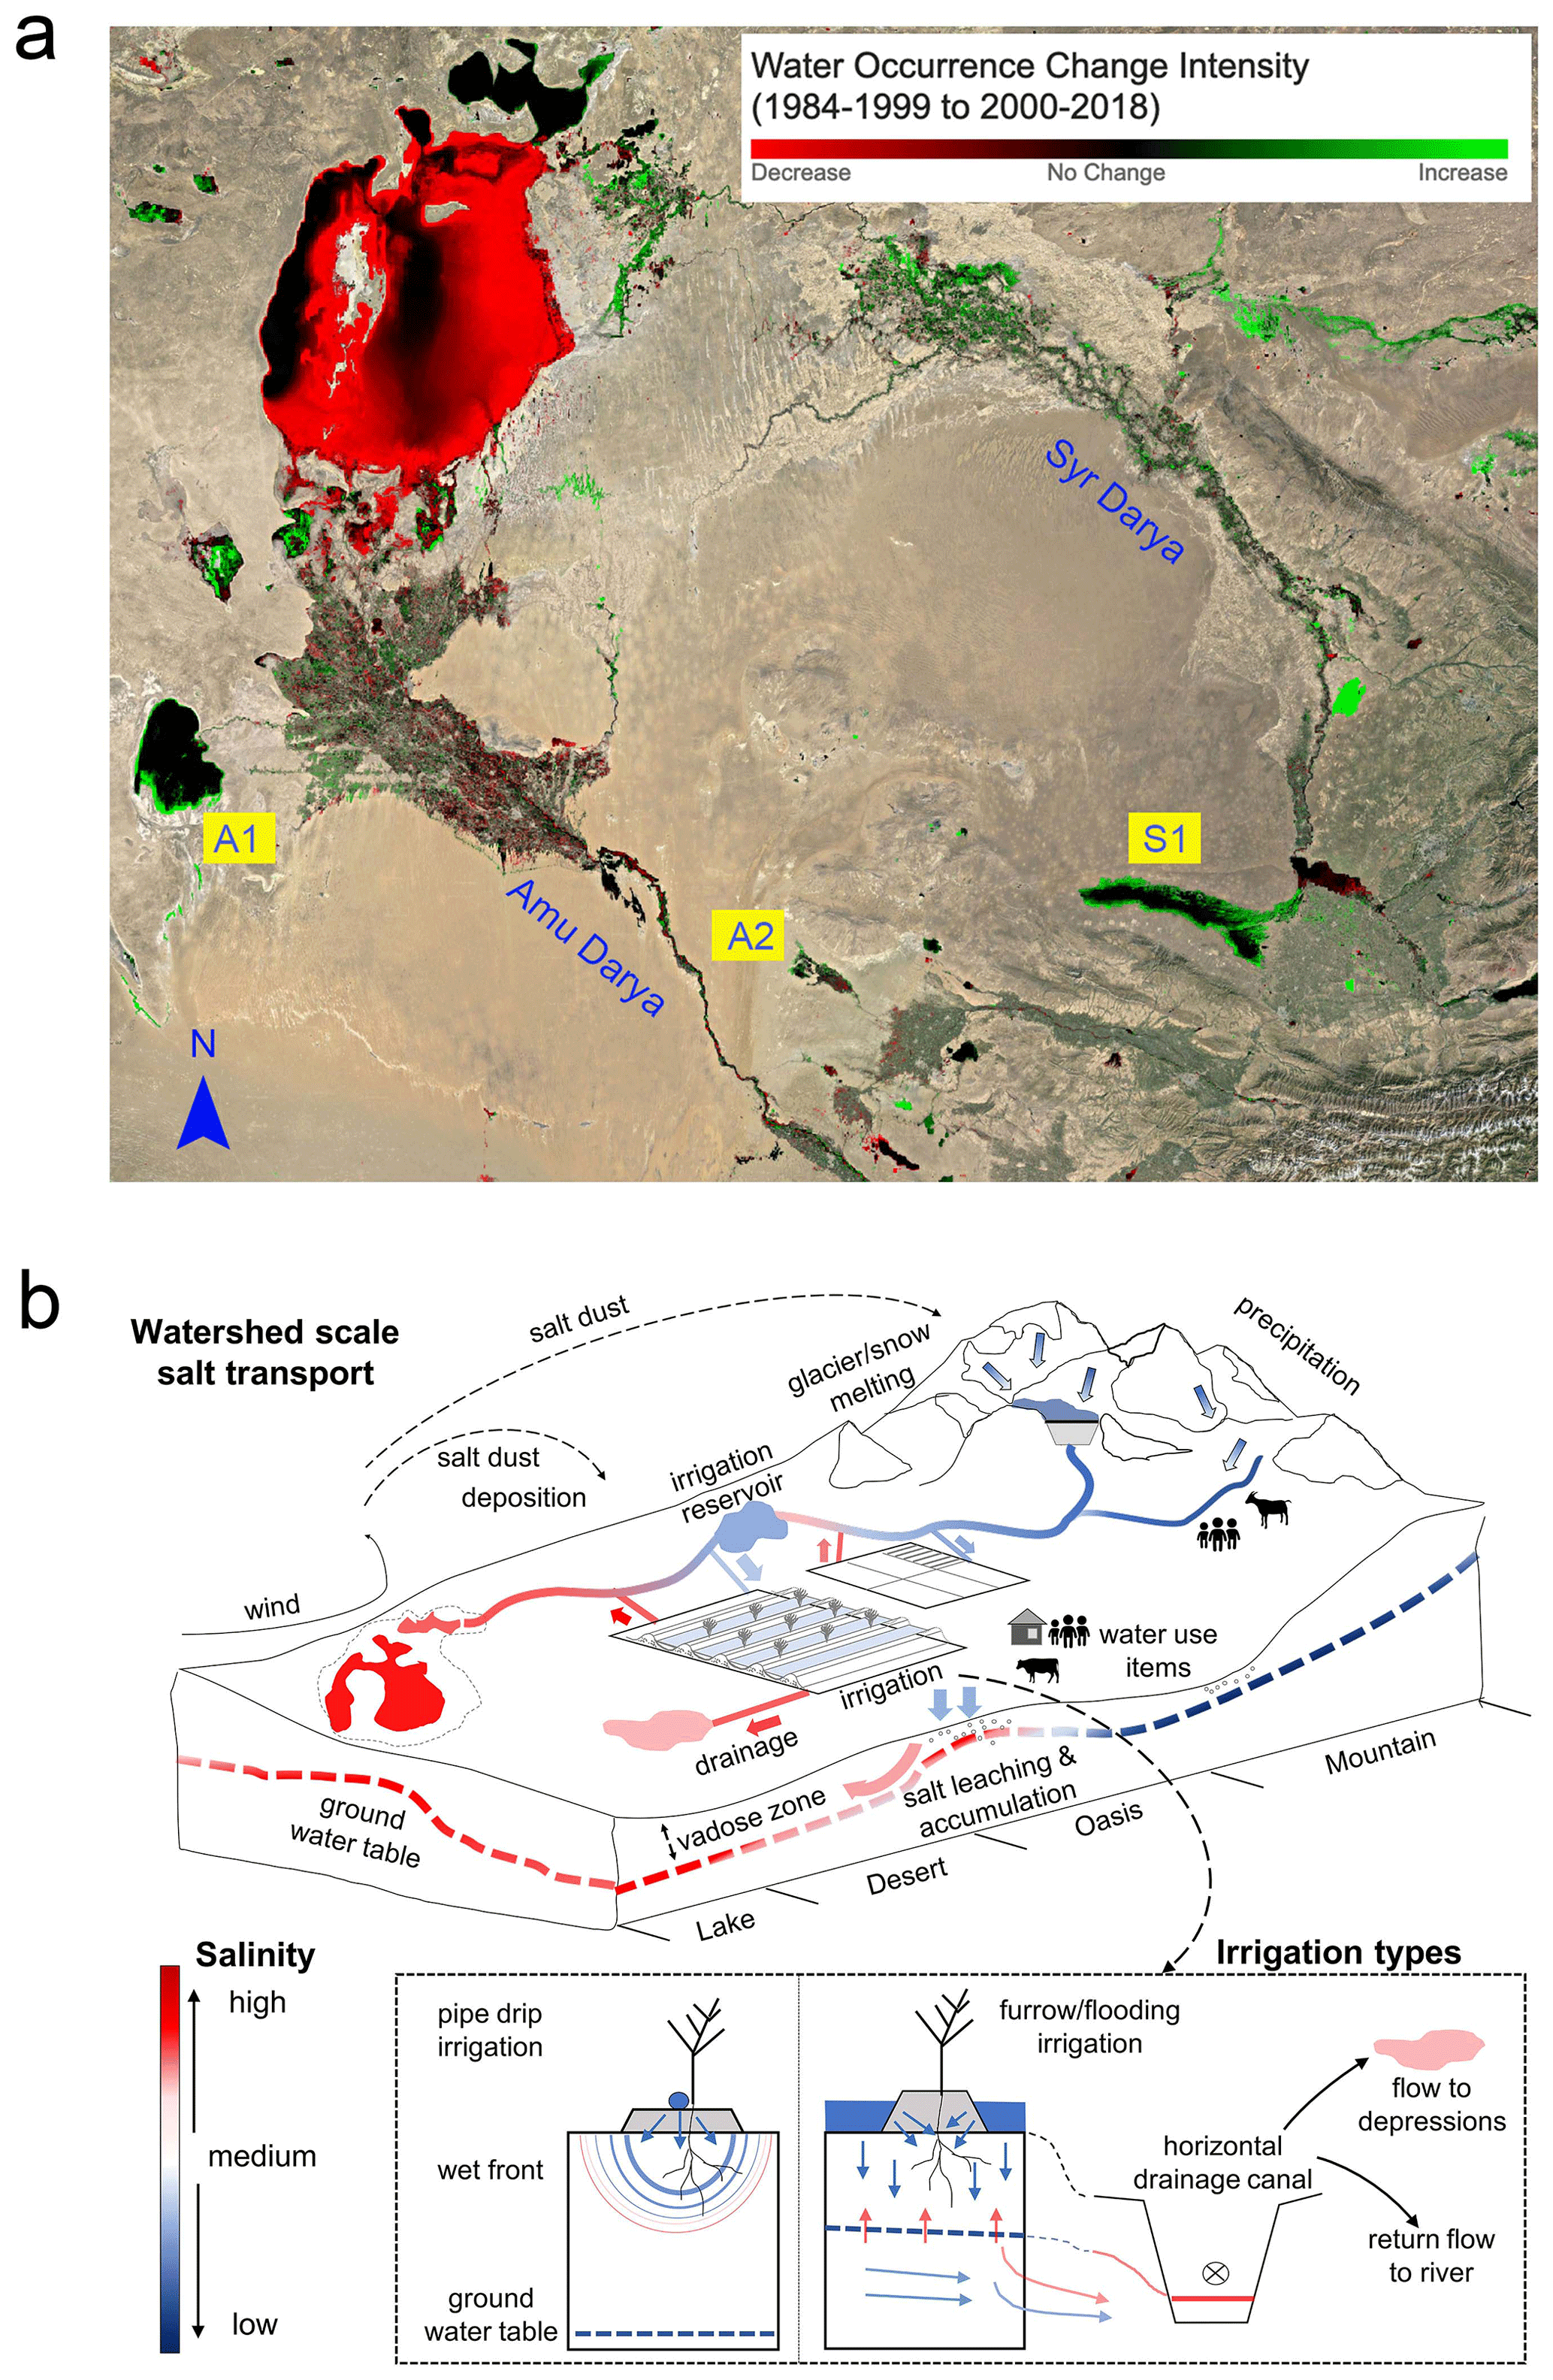
Figure 11The long-term inefficiency and risk of the irrigation-drainage system. (a) Changes in the surface water occurrence in the Aral Sea basin. The data and information originate from the Global Water Surface Explorer (https://global-surface-water.appspot.com/, last access: 1 October 2020) (Pekel et al., 2016). S1, A1 and A2 are examples of expanded depressions, which collected the drainage and surplus water. S1 is the Aydar Lake in the Syr Darya River basin. In the Amu Darya River basin, A1 represents the Sarykamysh Lake and A2 illustrates a drainage depression of the Bukhara irrigation district. (b) Salinity concentration in the irrigation-drainage system of the Aral Sea basin. The upper part stands for the salt transport and concentration at the river basin scale. The lower part shows the positive effect of drip irrigation compared with flood irrigation on reducing the drainage water and lowering the groundwater level to reduce the secondary salinization.
In this paper, we applied a new causal structure-based framework to compare the WEFE nexus and applied it to the SDB and ADB with the BN. The main conclusions are as follows.
-
The new causal structure-based framework (combined with the support of actual data) is proved effective when modelling and comparing the basin-wide causal WEFE nexus under uncertainty with a lower cost in data-limited or poorly gauged river basins. It may help decision support mainly in the quantification of the influence of complex causality and more remotely related variables. This systematic and causal comparison framework can be used to compare more basins based on the different levels of similarity of the causal structure.
-
Before the collapse of the USSR, the water flow entering the Aral Sea was sensitive to the agricultural development of the two river basins. After the collapse of the USSR, its sensitivity to the water–energy conflicts between the upstream and downstream countries increased a lot. Compared with the Syr Darya, the amount of water flowing into the Aral Sea from the Amu Darya is less sensitive to the water competition between downstream summer irrigation and upstream winter hydropower partly due to the lower percentage of total runoff intercepted by upstream reservoirs. It further made the management of the surplus water in the lower reaches of the SDB in winter more difficult and controversial than the ADB with a large amount of water flowing into depressions outside the river and irrigation area.
-
In the short term, reducing the water inflow to depressions and improving the planting structure prove beneficial to the Aral Sea ecology. In the long term, the construction of large reservoirs on the Panj River of the upstream ADB should be cautious so as not to get an intense water–energy conflict such as the SDB's. Moreover, the water–food–ecology conflict between downstream countries may escalate and turn into a long-term chronic problem such as between Kazakhstan and Uzbekistan. More attention should be paid to the reasonable ecological water consumption of new water bodies such as the Aydar–Arnasay depression in the basin-wide water allocation. It is also necessary to promote the water-saving drip irrigation and to strengthen the cooperation between internal and external countries.
Intermediate data, model files and codes are available upon request from the first author Haiyang Shi (shihaiyang16@mails.ucas.ac.cn).
The data sources that were used in this study have been listed in the main text (Table 2). The data collected from yearbooks are available at https://doi.org/10.6084/m9.figshare.13516472 (Shi et al., 2021), and other data are available from the links in Table 2.
HS and GL were responsible for the conceptualization. HS, HZ, OH and JX were responsible for the methodology. HS, SL, JB, TL, CC, PC, HH and FUO were responsible for data searching and processing. HS and JX provided the software. HS performed the formal analysis and prepared the manuscript. GL, TVDV and PDM were responsible for the supervision. GL and PDM were responsible for the revision.
The authors declare that they have no conflict of interest.
This article is part of the special issue “Socio-hydrology and transboundary rivers”. It is not associated with a conference.
We would like to thank Sabine Cnudde of the Department of Geography of Ghent University for correcting our English. We would also like to thank the two anonymous reviewers for their comments and suggestions, which substantially improved this paper.
This research has been supported by the Strategic Priority Research Programme of the Chinese Academy of Sciences (grant no. XDA20060302), the National Natural Science Foundation of China (grant nos. U1803243 and 41877012), the Team project of the Chinese Academy of Sciences (grant no. 2018-YDYLTD-002), the Chinese Academy of Sciences President's International Fellowship Initiative (PIFI) (grant no. 2017VCA0002), the West Light Foundation of the Chinese Academy of Sciences (grant no. 2018-XBQNXZ-B-011), and the Long-term Recruitment Program of Foreign Experts.
This paper was edited by Murugesu Sivapalan and reviewed by two anonymous referees.
Abatzoglou, J. T., Dobrowski, S. Z., Parks, S. A., and Hegewisch, K. C.: TerraClimate, a high-resolution global dataset of monthly climate and climatic water balance from 1958–2015, Sci. Data, 5, 170191, https://doi.org/10.1038/sdata.2017.191, 2018.
Alcamo, J., Döll, P., Henrichs, T., Kaspar, F., Lehner, B., Rösch, T., and Siebert, S.: Development and testing of the WaterGAP 2 global model of water use and availability, Hydrolog. Sci. J., 48, 317–337, 2003.
Barton, D. N., Saloranta, T., Moe, S. J., Eggestad, H. O., and Kuikka, S.: Bayesian belief networks as a meta-modelling tool in integrated river basin management – Pros and cons in evaluating nutrient abatement decisions under uncertainty in a Norwegian river basin, Ecol. Econ., 66, 91–104, 2008.
Biggs, E. M., Bruce, E., Boruff, B., Duncan, J. M. A., Horsley, J., Pauli, N., McNeill, K., Neef, A., Van Ogtrop, F., and Curnow, J.: Sustainable development and the water–energy–food nexus: A perspective on livelihoods, Environ. Sci. Policy, 54, 389–397, 2015.
Cai, X., McKinney, D. C., and Lasdon, L. S.: A framework for sustainability analysis in water resources management and application to the Syr Darya Basin, Water Resour. Res., 38, 21-1–21-14, https://doi.org/10.1029/2001WR000214, 2002.
Cai, X., Wallington, K., Shafiee-Jood, M., and Marston, L.: Understanding and managing the food-energy-water nexus – opportunities for water resources research, Adv. Water Resour., 111, 259–273, 2018.
Cain, J.: Planning improvements in natural resources management, Cent. Ecol. Hydrol., Wallingford, UK, 124, 1–123, 2001.
Castillo, E., Gutiérrez, J. M., and Hadi, A. S.: Sensitivity analysis in discrete Bayesian networks, IEEE T. Syst. Man Cybern. A Syst. Humans, 27, 412–423, 1997.
Chan, T., Ross, H., Hoverman, S., and Powell, B.: Participatory development of a Bayesian network model for catchment-based water resource management, Water Resour. Res., 46, W07544, https://doi.org/10.1029/2009WR008848, 2010.
Chen, S. H. and Pollino, C. A.: Good practice in Bayesian network modelling, Environ. Model. Softw., 37, 134–145, 2012.
Chen, Y., Li, W., Fang, G., and Li, Z.: Review article: Hydrological modeling in glacierized catchments of central Asia – status and challenges, Hydrol. Earth Syst. Sci., 21, 669–684, https://doi.org/10.5194/hess-21-669-2017, 2017.
Conway, D., Van Garderen, E. A., Deryng, D., Dorling, S., Krueger, T., Landman, W., Lankford, B., Lebek, K., Osborn, T., and Ringler, C.: Climate and southern Africa's water–energy–food nexus, Nat. Clim. Change, 5, 837–846, 2015.
Daher, B. T. and Mohtar, R. H.: Water–energy–food (WEF) Nexus Tool 2.0: guiding integrative resource planning and decision-making, Water Int., 40, 748–771, 2015.
Döll, P., Kaspar, F., and Lehner, B.: A global hydrological model for deriving water availability indicators: model tuning and validation, J. Hydrol., 270, 105–134, 2003.
Espinosa-Tasón, J., Berbel, J., and Gutiérrez-Martín, C.: Energized water: Evolution of water-energy nexus in the Spanish irrigated agriculture, 1950–2017, Agr. Water Manage., 233, 106073, https://doi.org/10.1016/j.agwat.2020.106073, 2020.
Farinotti, D., Longuevergne, L., Moholdt, G., Duethmann, D., Mölg, T., Bolch, T., Vorogushyn, S., and Güntner, A.: Substantial glacier mass loss in the Tien Shan over the past 50 years, Nat. Geosci., 8, 716–722, https://doi.org/10.1038/ngeo2513, 2015.
Farmani, R., Henriksen, H. J., and Savic, D.: An evolutionary Bayesian belief network methodology for optimum management of groundwater contamination, Environ. Model. Softw., 24, 303–310, https://doi.org/10.1016/j.envsoft.2008.08.005, 2009.
Feng, M., Liu, P., Li, Z., Zhang, J., Liu, D., and Xiong, L.: Modeling the nexus across water supply, power generation and environment systems using the system dynamics approach: Hehuang Region, China, J. Hydrol., 543, 344–359, 2016.
Fienen, M. N., Masterson, J. P., Plant, N. G., Gutierrez, B. T., and Thieler, E. R.: Bridging groundwater models and decision support with a Bayesian network, Water Resour. Res., 49, 6459–6473, 2013.
Frank, S. K., Pollino, C. A., and Döll, P.: Using Bayesian Networks to link Environmental Flows to Ecosystem Services in the Murray-Darling Basin, Australia, in: Proceedings of the 7th International Congress on Environmental Modelling and Software, 15–19 June 2014, San Diego, California, USA, available at: http://www.iemss.org/sites/iemss2014/proceedings.php, last access: 12 September 2014.
Friedman, N., Geiger, D., and Goldszmidt, M.: Bayesian network classifiers, Mach. Learn., 29, 131–163, 1997.
Giordano, R., D'Agostino, D., Apollonio, C., Lamaddalena, N., and Vurro, M.: Bayesian belief network to support conflict analysis for groundwater protection: the case of the Apulia region, J. Environ. Manage., 115, 136–146, 2013.
Grafton, R. Q., Libecap, G. D., Edwards, E. C., O'Brien, R. J., and Landry, C.: Comparative assessment of water markets: insights from the Murray–Darling Basin of Australia and the Western USA, Water Policy, 14, 175–193, 2012.
Groll, M., Kulmatov, R., Mullabaev, N., Opp, C., and Kulmatova, D.: Rise and decline of the fishery industry in the Aydarkul–Arnasay Lake System (Uzbekistan): effects of reservoir management, irrigation farming and climate change on an unstable ecosystem, Environ. Earth Sci., 75, 921, https://doi.org/10.1007/s12665-016-5691-5, 2016.
Guo, H., Bao, A., Ndayisaba, F., Liu, T., Kurban, A., and De Maeyer, P.: Systematical Evaluation of Satellite Precipitation Estimates Over Central Asia Using an Improved Error-Component Procedure, J. Geophys. Res.-Atmos., 122, 10906–10927, https://doi.org/10.1002/2017JD026877, 2017.
Heckerman, D. and Breese, J. S.: Causal independence for probability assessment and inference using Bayesian networks, IEEE T. Syst. Man Cybern. A Syst. Humans, 26, 826–831, 1996.
Hines, E. E. and Landis, W. G.: Regional risk assessment of the Puyallup River Watershed and the evaluation of low impact development in meeting management goals, Integr. Environ. Assess. Manage., 10, 269–278, 2014.
Hunter, P. R., de Sylor, M. A., Risebro, H. L., Nichols, G. L., Kay, D., and Hartemann, P.: Quantitative microbial risk assessment of cryptosporidiosis and giardiasis from very small private water supplies, Risk Anal., 31, 228–236, 2011.
Immerzeel, W. W., Lutz, A. F., Andrade, M., Bahl, A., Biemans, H., Bolch, T., Hyde, S., Brumby, S., Davies, B. J., and Elmore, A. C.: Importance and vulnerability of the world's water towers, Nature, 577, 364–369, 2020.
Jalilov, S.-M., Keskinen, M., Varis, O., Amer, S., and Ward, F. A.: Managing the water–energy–food nexus: Gains and losses from new water development in Amu Darya River Basin, J. Hydrol., 539, 648–661, 2016.
Jalilov, S.-M., Amer, S. A., and Ward, F. A.: Managing the water-energy-food nexus: Opportunities in Central Asia, J. Hydrol., 557, 407–425, 2018.
Joetzjer, E., Douville, H., Delire, C., Ciais, P., Decharme, B., and Tyteca, S.: Hydrologic benchmarking of meteorological drought indices at interannual to climate change timescales: a case study over the Amazon and Mississippi river basins, Hydrol. Earth Syst. Sci., 17, 4885–4895, https://doi.org/10.5194/hess-17-4885-2013, 2013.
Kaddoura, S. and El Khatib, S.: Review of water-energy-food Nexus tools to improve the Nexus modelling approach for integrated policy making, Environ. Sci. Policy, 77, 114–121, 2017.
Keshtkar, A. R., Salajegheh, A., Sadoddin, A., and Allan, M. G.: Application of Bayesian networks for sustainability assessment in catchment modeling and management (Case study: The Hablehrood river catchment), Ecol. Model., 268, 48–54, 2013.
Kraaijenbrink, P. D. A., Bierkens, M. F. P., Lutz, A. F., and Immerzeel, W. W.: Impact of a global temperature rise of 1.5 degrees Celsius on Asia's glaciers, Nature, 549, 257–260, https://doi.org/10.1038/nature23878, 2017.
Ladson, A. R. and Argent, R. M.: Adaptive management of environmental flows: lessons for the Murray-Darling Basin from three large North American rivers, Australas, J. Water Resour., 5, 89–101, 2002.
Laskey, K. B.: Sensitivity analysis for probability assessments in Bayesian networks, IEEE T. Syst. Man. Cybern., 25, 901–909, 1995.
Lee, S.-H., Mohtar, R. H., and Yoo, S.-H.: Assessment of food trade impacts on water, food, and land security in the MENA region, Hydrol. Earth Syst. Sci., 23, 557–572, https://doi.org/10.5194/hess-23-557-2019, 2019.
Lee, S.-H., Assi, A. T., Daher, B., Mengoub, F. E., and Mohtar, R. H.: A Water-Energy-Food Nexus approach for conducting trade-off analysis: Morocco's phosphate industry in the Khouribga region, Hydrol. Earth Syst. Sci., 24, 4727–4741, https://doi.org/10.5194/hess-24-4727-2020, 2020.
Lee, S. O. and Jung, Y.: Efficiency of water use and its implications for a water-food nexus in the Aral Sea Basin, Agr. Water Manage., 207, 80–90, 2018.
Liu, T., Willems, P., Pan, X. L., Bao, An. M., Chen, X., Veroustraete, F., and Dong, Q. H.: Climate change impact on water resource extremes in a headwater region of the Tarim basin in China, Hydrol. Earth Syst. Sci., 15, 3511–3527, https://doi.org/10.5194/hess-15-3511-2011, 2011.
Ma, Y., Li, Y. P., and Huang, G. H.: A bi-level chance-constrained programming method for quantifying the effectiveness of water-trading to water-food-ecology nexus in Amu Darya River basin of Central Asia, Environ. Res., 183, 109229, https://doi.org/10.1016/j.envres.2020.109229, 2020.
Marcot, B. G.: Metrics for evaluating performance and uncertainty of Bayesian network models, Ecol. Model., 230, 50–62, 2012.
Marcot, B. G., Steventon, J. D., Sutherland, G. D., and McCann, R. K.: Guidelines for developing and updating Bayesian belief networks applied to ecological modeling and conservation, Can. J. Forest Res., 36, 3063–3074, 2006.
Micklin, P.: Desiccation of the Aral Sea: a water management disaster in the Soviet Union, Scienc, 241, 1170–1176, 1988.
Micklin, P.: The Aral sea disaster, Annu. Rev. Earth Planet. Sci., 35, 47–72, 2007.
Micklin, P.: The past, present, and future Aral Sea, Lakes Reserv. Res. Manage., 15, 193–213, 2010.
Molina, J.-L., Farmani, R., and Bromley, J.: Aquifers management through evolutionary bayesian networks: The altiplano case study (se spain), Water Resour. Manage., 25, 3883, https://doi.org/10.1007/s11269-011-9893-z, 2011.
Moon, T. K.: The expectation-maximization algorithm, IEEE Sig. Process. Mag., 13, 47–60, 1996.
Müller Schmied, H., Eisner, S., Franz, D., Wattenbach, M., Portmann, F. T., Flörke, M., and Döll, P.: Sensitivity of simulated global-scale freshwater fluxes and storages to input data, hydrological model structure, human water use and calibration, Hydrol. Earth Syst. Sci., 18, 3511–3538, https://doi.org/10.5194/hess-18-3511-2014, 2014.
Nash, D. and Hannah, M.: Using Monte-Carlo simulations and Bayesian Networks to quantify and demonstrate the impact of fertiliser best management practices, Environ. Model. Softw., 26, 1079–1088, 2011.
Neal, R. M.: Probabilistic inference using Markov chain Monte Carlo methods, Department of Computer Science, University of Toronto, Toronto, ON, Canada, 1993.
Pagano, A., Giordano, R., Portoghese, I., Fratino, U., and Vurro, M.: A Bayesian vulnerability assessment tool for drinking water mains under extreme events, Nat. Hazards, 74, 2193–2227, 2014.
Payet-Burin, R., Kromann, M., Pereira-Cardenal, S., Strzepek, K. M., and Bauer-Gottwein, P.: WHAT-IF: an open-source decision support tool for water infrastructure investment planning within the water–energy–food–climate nexus, Hydrol. Earth Syst. Sci., 23, 4129–4152, https://doi.org/10.5194/hess-23-4129-2019, 2019.
Pearl, J.: Bayesian netwcrks: A model cf self-activated memory for evidential reasoning, in Proceedings of the 7th Conference of the Cognitive Science Society, University of California, Irvine, CA, USA, 15–17, 1985.
Pekel, J.-F., Cottam, A., Gorelick, N., and Belward, A. S.: High-resolution mapping of global surface water and its long-term changes, Nature, 540, 418–422, 2016.
Pohl, E., Gloaguen, R., Andermann, C., and Knoche, M.: Glacier melt buffers river runoff in the Pamir Mountains, Water Resour. Res., 53, 2467–2489, 2017.
Quinn, J. M., Monaghan, R. M., Bidwell, V. J., and Harris, S. R.: A Bayesian Belief Network approach to evaluating complex effects of irrigation-driven agricultural intensification scenarios on future aquatic environmental and economic values in a New Zealand catchment, Mar. Freshw. Res., 64, 460–474, 2013.
Ravar, Z., Zahraie, B., Sharifinejad, A., Gozini, H., and Jafari, S.: System dynamics modeling for assessment of water–food–energy resources security and nexus in Gavkhuni basin in Iran, Ecol. Indic., 108, 105682, https://doi.org/10.1016/j.ecolind.2019.105682, 2020.
Robertson, D. E., Wang, Q. J., McAllister, A. T., Abuzar, M., Malano, H. M., and Etchells, T.: A Bayesian network approach to knowledge integration and representation of farm irrigation: 3. Spatial application, Water Resour. Res., 45, W02411, https://doi.org/10.1029/2006WR005421, 2009.
Sadeghi, S. H., Moghadam, E. S., Delavar, M., and Zarghami, M.: Application of water-energy-food nexus approach for designating optimal agricultural management pattern at a watershed scale, Agr. Water Manage., 233, 106071, https://doi.org/10.1016/j.agwat.2020.106071, 2020.
Shi, H., Luo, G., Zheng, H., Chen, C., Bai, J., Liu, T., Ochege, F. U., and De Maeyer, P.: Coupling the water-energy-food-ecology nexus into a Bayesian network for water resources analysis and management in the Syr Darya River basin, J. Hydrol., 581, 124387, https://doi.org/10.1016/j.jhydrol.2019.124387, 2020.
Shi, H., Luo, G., Liu, S., and Bai, J.: Aral Basin data, Figshare, https://doi.org/10.6084/m9.figshare.13516472, 2021.
Siegfried, T. and Bernauer, T.: Estimating the performance of international regulatory regimes: Methodology and empirical application to international water management in the Naryn/Syr Darya basin, Water Resour. Res., 43, W11406, https://doi.org/10.1029/2006WR005738, 2007.
Smith, C. S., Howes, A. L., Price, B., and McAlpine, C. A.: Using a Bayesian belief network to predict suitable habitat of an endangered mammal – The Julia Creek dunnart (Sminthopsis douglasi), Biol. Conserv., 139, 333–347, 2007.
Sorg, A., Bolch, T., Stoffel, M., Solomina, O., and Beniston, M.: Climate change impacts on glaciers and runoff in Tien Shan (Central Asia), Nat. Clim. Change, 2, 725–731, 2012.
Sun, J., Li, Y. P., Suo, C., and Liu, Y. R.: Impacts of irrigation efficiency on agricultural water-land nexus system management under multiple uncertainties – A case study in Amu Darya River basin, Central Asia, Agr. Water Manage., 216, 76–88, 2019.
Syed, T. H., Famiglietti, J. S., Chen, J., Rodell, M., Seneviratne, S. I., Viterbo, P., and Wilson, C. R.: Total basin discharge for the Amazon and Mississippi River basins from GRACE and a land-atmosphere water balance, Geophys. Res. Lett., 32, L24404, https://doi.org/10.1029/2005GL024851, 2005.
Taner, M. Ü., Ray, P., and Brown, C.: Incorporating Multidimensional Probabilistic Information Into Robustness-Based Water Systems Planning, Water Resour. Res., 55, 3659–3679, https://doi.org/10.1029/2018WR022909, 2019.
Vetter, T., Reinhardt, J., Flörke, M., van Griensven, A., Hattermann, F., Huang, S., Koch, H., Pechlivanidis, I. G., Plötner, S., and Seidou, O.: Evaluation of sources of uncertainty in projected hydrological changes under climate change in 12 large-scale river basins, Climatic Change, 141, 419–433, 2017.
Wang, A., Wang, Y., Su, B., Kundzewicz, Z. W., Tao, H., Wen, S., Qin, J., Gong, Y., and Jiang, T.: Comparison of Changing Population Exposure to Droughts in River Basins of the Tarim and the Indus, Earth's Future, 8, e2019EF001448, https://doi.org/10.1029/2019ef001448, 2020.
Wang, X., Luo, Y., Sun, L., He, C., Zhang, Y., and Liu, S.: Attribution of runoff decline in the Amu Darya River in Central Asia during 1951–2007, J. Hydrometeorol., 17, 1543–1560, 2016.
Watthayu, W. and Peng, Y.: A Bayesian network based framework for multi-criteria decision making, in: Proceedings of the 17th international conference on multiple criteria decision analysis, 6–11 August 2004, Whistler, BC, Canada, 2004.
Xue, J., Gui, D., Lei, J., Zeng, F., Mao, D., and Zhang, Z.: Model development of a participatory Bayesian network for coupling ecosystem services into integrated water resources management, J. Hydrol., 554, 50–65, 2017.
Yang, Y. C. E. and Wi, S.: Informing regional water-energy-food nexus with system analysis and interactive visualization – A case study in the Great Ruaha River of Tanzania, Agr. Water Manage., 196, 75–86, 2018.
Zawahri, N. A.: International rivers and national security: The Euphrates, Ganges–Brahmaputra, Indus, Tigris, and Yarmouk rivers 1, Nat. Resour. Forum, 32, 280–289, https://doi.org/10.1111/j.1477-8947.2008.00204.x, 2008.
Zhang, X. and Vesselinov, V. V: Integrated modeling approach for optimal management of water, energy and food security nexus, Adv. Water Resour., 101, 1–10, 2017.
Zhang, Z., Hu, H., Tian, F., Yao, X., and Sivapalan, M.: Groundwater dynamics under water-saving irrigation and implications for sustainable water management in an oasis: Tarim River basin of western China, Hydrol. Earth Syst. Sci., 18, 3951–3967, https://doi.org/10.5194/hess-18-3951-2014, 2014.
- Abstract
- Introduction
- A generalized causal structure-based framework for comparing the basin-wide water–energy–food–ecology nexus
- Application of the framework in the SDB and the ADB
- Results
- Discussion
- Conclusions
- Code availability
- Data availability
- Author contributions
- Competing interests
- Special issue statement
- Acknowledgements
- Financial support
- Review statement
- References