the Creative Commons Attribution 4.0 License.
the Creative Commons Attribution 4.0 License.
 | 24 Nov 2021
The impact of wind on the rainfall–runoff relationship in urban high-rise building areas
Xichao Gao
Zhiyong Yang
Dawei Han
Kai Gao
Wind drift has a significant influence on the rainfall–runoff relationship in urban high-rise building areas since the oblique rainfall caused by the wind drift can interact with the building walls. However, the impact of the rainfall inclination angle on the rainfall–runoff process in urban high-rise building areas has not been studied. In this study, the relationship between wind and the rainfall–runoff process in such areas was explored. A theoretical framework has been developed to describe their relationship, including a computational fluid dynamics (CFD) method to obtain the relationship between wind speed and rainfall inclination and a newly derived equation to describe the relationship between rainfall inclination and the runoff coefficient. Subsequently, a laboratory scale model experiment was conducted to verify the proposed framework. The main results are that (1) the runoff coefficient calculated by the proposed theoretical framework is highly consistent with that obtained from the laboratory experiment, (2) the runoff coefficient of urban high-rise building areas increases with wind speed and the increase rate is linear with the tangent of the rainfall inclination angle, and (3) the change in the runoff coefficient for the experiment with larger raindrop is 0.047 when the wind speed increases from 0 to 5.9 m s−1, while that for the experiment with smaller raindrop is 0.064, which means that the rainfall with larger droplets is less influenced by the wind.
- Article
(6184 KB) - Full-text XML
- BibTeX
- EndNote


In recent years, due to global warming, the frequency and magnitude of extreme storms, characterized by heavy precipitation and strong winds, have increased in urban areas. In the storm environment, raindrops are influenced by the wind's drag force and obtain a horizontal velocity, leading to oblique rainfall which is usually called wind-driven rain (WDR) (Blocken and Carmeliet, 2004). WDR can have a significant impact on the rainfall–runoff process in urban areas. The local wind field can be disturbed by complex, unlevel urban terrains and affect the spatial distribution of rainfall. The change in rainfall distribution accompanied by catchment heterogeneity can affect the hydrological response of an urban catchment (Cristiano et al., 2017). Many studies have shown that the spatial variability of rainfall can translate into large streamflow variations (Kavetski et al., 2006; Smith et al., 2004; Syed et al., 2003), especially in urban areas (Cristiano et al., 2017; Ochoa-Rodriguez et al., 2015). Moreover, wind flow can alter the rainfall inclination angle. High-rise buildings can interact with the oblique rainfall, leading to runoff on the wall. Changes in the rainfall inclination angle can alter the distribution of rainfall intensity on the wall and thus change the rainfall–runoff process in urban areas (Blocken and Carmeliet, 2004; Blocken et al., 2013; Zhou et al., 2018, 2019). Isidoro et al. (2012) explored the impact of WDR on the hydrological response in a high-density urbanized area using a scale model in the laboratory and concluded that the spatial and temporal rainfall distribution caused by storm movement and wind has an obvious influence on the rainfall–runoff process. However, their study only illustrates the impact of wind on the hydrological response of an urban area with experimental data, and the influence mechanism of the wind on the rainfall–runoff process in urban catchments is not clearly explained.
Theoretically, the impact of wind on the rainfall–runoff process can be divided into two aspects: the impact of wind on raindrop trajectories (rainfall inclination) and the impact of rainfall inclination on runoff generation. The first aspect has been fully studied in building science in recent decades. Some researchers measured WDR using the WDR gauge, a special gauge with a vertical aperture (Blocken and Carmeliet, 2005, 2006; Kubilay et al., 2014; Nore et al., 2007). With the measured WDR, the rainfall inclination angle can be analyzed through the ratio of the rainfall amount measured by WDR and normal rain gauges. However, Blocken and Carmeliet (2006) indicated that WDR measurements suffered from large errors (up to 100 %) caused by water adhesion and evapotranspiration. Because of the limitations of the direct measurement of WDR, numerical analysis based on computational fluid dynamics (CFD) has been employed to study raindrop trajectories. Choi (1993, 1994a, b, 1997) developed an Euler–Lagrange-based framework to numerically simulate raindrop trajectories around a building using CFD. In the framework, the wind flow pattern around a building is assumed to be steady and can be calculated by solving the continuity equation, the Reynolds-averaged Navier–Stokes equations, and the standard k-ε turbulence model; raindrop trajectories are then calculated by solving motion equations, considering the wind field forces acting on the raindrops that were obtained in the previous step. With the proposed framework, Choi analyzed the wind flow pattern around rectangular buildings of different sizes and the corresponding raindrop trajectories for raindrops of different diameters. The results demonstrate that raindrop diameters and building shapes have a significant impact on raindrop trajectories and thus on the impinging angle of raindrops on building faces. Blocken and Carmeliet (2000a, b) extended the framework to consider the spatial and temporal distribution of WDR and verified it by comparing the numerical simulations and experimental data. Verification of Choi's framework has also been conducted by Lakehal et al. (1995) and Hangan (1999). However, previous studies on the runoff generated by WDR have focused on the runoff from the wall of the building (Blocken et al., 2013), and the impact of the rainfall inclination angle on the rainfall–runoff process in an urban high-rise building area has not been studied. Since the runoff from the wall of the building generally flows directly into the drainage system through dispersal and cut-off ditches around buildings, the impact of the rainfall inclination angle on the rainfall–runoff process in an urban high-rise building area cannot be ignored. Yoo et al. (2021) revealed the impact of high-rise buildings on runoff hydrographs through a newly improved hydrological model and a laboratory experiment. However, their work ignored the infiltration and focused on changes in peak flow mainly caused by changes in flow path in high-rise building areas. The paper did not elucidate the effect of wind on runoff generation in high-rise building areas at the physical level.
In this paper, we developed a framework to clarify the impact of rainfall inclination caused by wind on runoff generation in urban high-rise building areas. The runoff coefficient was selected as the representative of the rainfall–runoff relationship to eliminate the effect of variation in rainfall intensity caused by the local wind field. The proposed framework consists of two parts: a CFD method which was used to explore the relationship between wind speed and rainfall inclination and a newly derived theoretical equation used to describe the relationship between rainfall inclination and the runoff coefficient. Additionally, we conducted a laboratory experiment based on a physical scale model of an urban high-rise building area and compared the experimental results with that derived from the proposed theoretical framework.
The paper is organized as follows. Section 2 describes the derivation of the theoretical equation, the CFD model, and the laboratory experiment. Section 3 presents the results of the laboratory experiment and CFD numerical experiment and verifies the proposed theoretical equation with the experiment results. Further discussion is given in Sect. 4, and a short conclusion is presented in Sect. 5.
Our goal is to develop a theoretical framework concerning the relationship between the wind speed and the rainfall–runoff process in urban high-rise building areas. It consists of two parts: a CFD method used to simulate raindrop trajectories in the wind and a theoretical equation used to describe the relationship between the runoff coefficient and rainfall inclination. To verify the proposed framework, a laboratory experiment apparatus, including a rainfall simulator system, an electric fan system, a physical scale model of an urban high-rise building area, and a data collection and processing system was built and the relationship between the wind speed and the corresponding rainfall–runoff was determined.
2.1 The theory of the CFD method
We used a CFD model to explore the relationship between wind speed and rainfall inclination. Assuming that the wind flow around buildings is steady, the motion of raindrops in the wind field can be simulated by two steps: (1) the wind flow around buildings is simulated by solving the continuity equation, the Reynolds-averaged Navier–Stokes equations, and the standard k-ε turbulence model; (2) the movement of raindrops is then calculated by motion equations based on the wind field obtained from the previous step.
2.1.1 Wind flow simulation around buildings
The continuity equation (Eq. 1), the Reynolds-averaged Navier–Stokes equations (Eq. 2), and the standard k-ε turbulence model (Eqs. 3–6) used to simulate the wind flow around buildings are as follows (Lakehal et al., 1995):
where Ui is the average speed of the wind flow in direction i (), ui is the turbulent speed of the wind flow in direction i (), P is the pressure, is the Reynolds stress, k is the turbulent kinetic energy, ε is the dissipation rate of the turbulent kinetic energy, vt is the turbulent eddy viscosity, and ν is the kinematic viscosity. The set of coefficients in the standard model can be defined as follows (Lakehal et al., 1995; Hanjalic and Launder, 1972):
2.1.2 Simulation of raindrop movement in the wind field
The raindrop trajectories in the wind field were simulated by considering raindrops to be particles driven by gravitational force and the wind's drag force. The control equations of the movement are as follows (Choi, 1993):
where r is the radius of the raindrop, ρa and ρw represent the density of air and water, respectively, μ is the air viscosity, U, V, and W represent the wind velocity in the x, y, and z directions, m is the mass of raindrops, R is the Reynolds number which is determined by the relative velocity between the raindrop and the wind flow, and CD is the drag coefficient acting on the raindrop, which can be obtained from the study of Gunn and Kinzer (1949).
2.2 The theoretical equation for the relationship between rainfall inclination and the runoff coefficient
The derivation of the theoretical equation for the relationship between rainfall inclination and the runoff coefficient is described in this section. In order to derive the equation, the following assumptions were made.
-
The interaction between buildings is ignored, so that the urban high-rise building area can be simplified: it contains only one building (Fig. 1).
-
The forces on the raindrop are in equilibrium before the raindrop arrives at the top level of the building, and the impact of the local wind field deformation on the motion of the raindrop after it arrives at the top level of the building can be ignored.
-
The diameters of all raindrops are the same in a rainfall event.
-
The wall and the roof of the building are impervious.
-
The wind direction is perpendicular to the wall and does not change during the rainfall event.
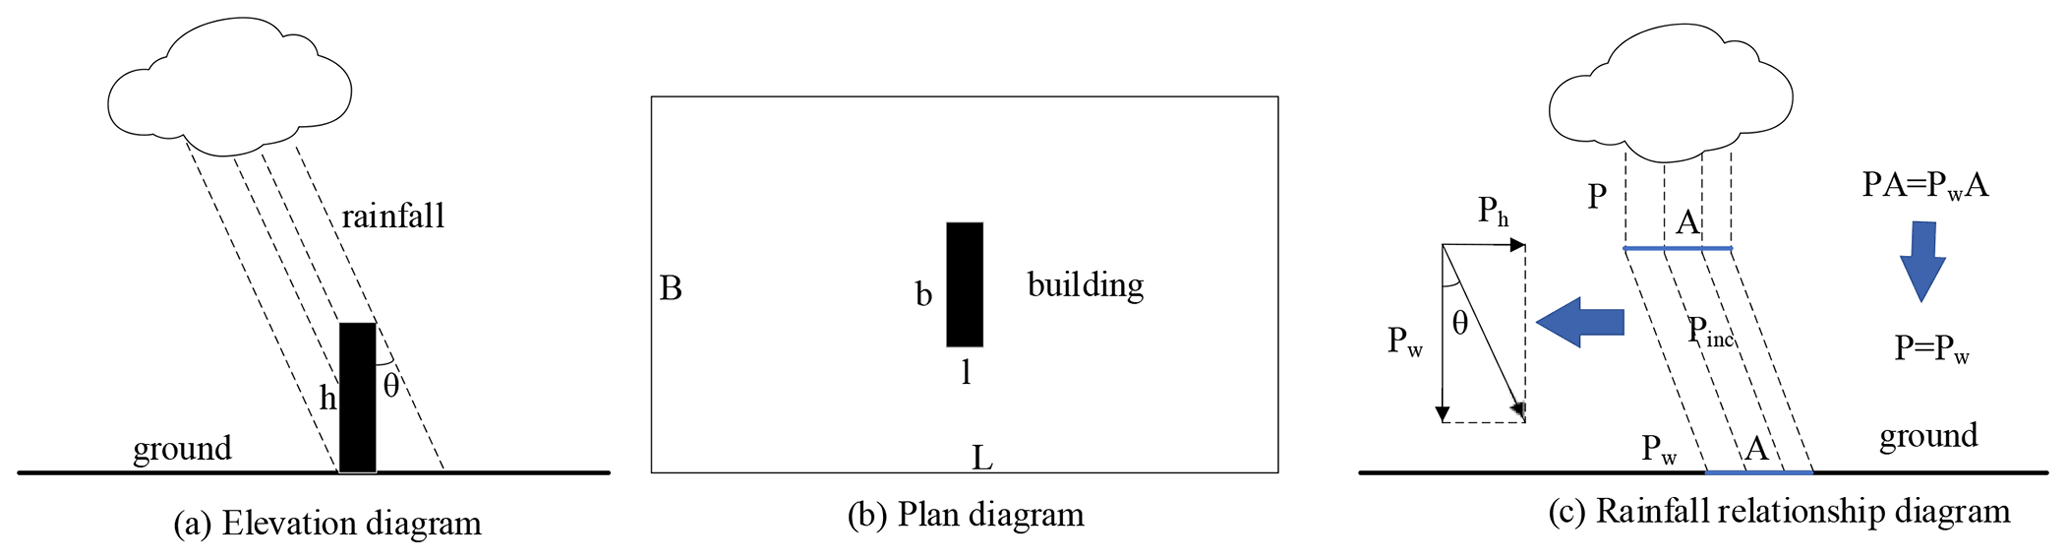
According to these assumptions, the raindrop trajectory near the building can be regarded as a straight line, which is shown in Fig. 1. It can easily be seen that a part of rainfall lands on the wall of the building instead of the ground in windy conditions. The water from the building walls generally goes directly to the drainage system, which changes the partitioning of runoff and infiltration in urban high-rise building areas. Assuming that subsurface runoff in a rainfall–runoff process in urban high-rise building areas can be ignored, the runoff of the urban high-rise building area shown in Fig. 2, with and without the influence of the wind, can be mathematically expressed as follows:
where q and qw are instant runoff rates of the whole catchment without and with the influence of wind, respectively, and P and Pw are rainfall intensity without and with the influence of wind, respectively. It should be noted that Pw refers to the component of the rainfall intensity vector causing rainfall flux through the horizontal plane and can also be measured by the rainfall gauge. Pw is the same as P according to conservation of mass if the local wind field is not affected by the building and raindrop trajectories are parallel (Fig. 1c). Ph is the component of the rainfall intensity vector causing rainfall flux through the vertical plane. The value of Ph can be inferred from Pw according to the theory of vector decomposition (Fig. 1c and Eq. 15). θ is the inclination angle of the raindrop trajectory (Fig. 1), f is the infiltration rate, n is the number of buildings (n=1 in Fig. 1), and s is the water retained in the model in unit time. Equation (14) means that the greater the wind, the more oblique the rainfall, leading to more rainfall to be intercepted by the impervious building wall and less infiltration, which leads to more runoff.
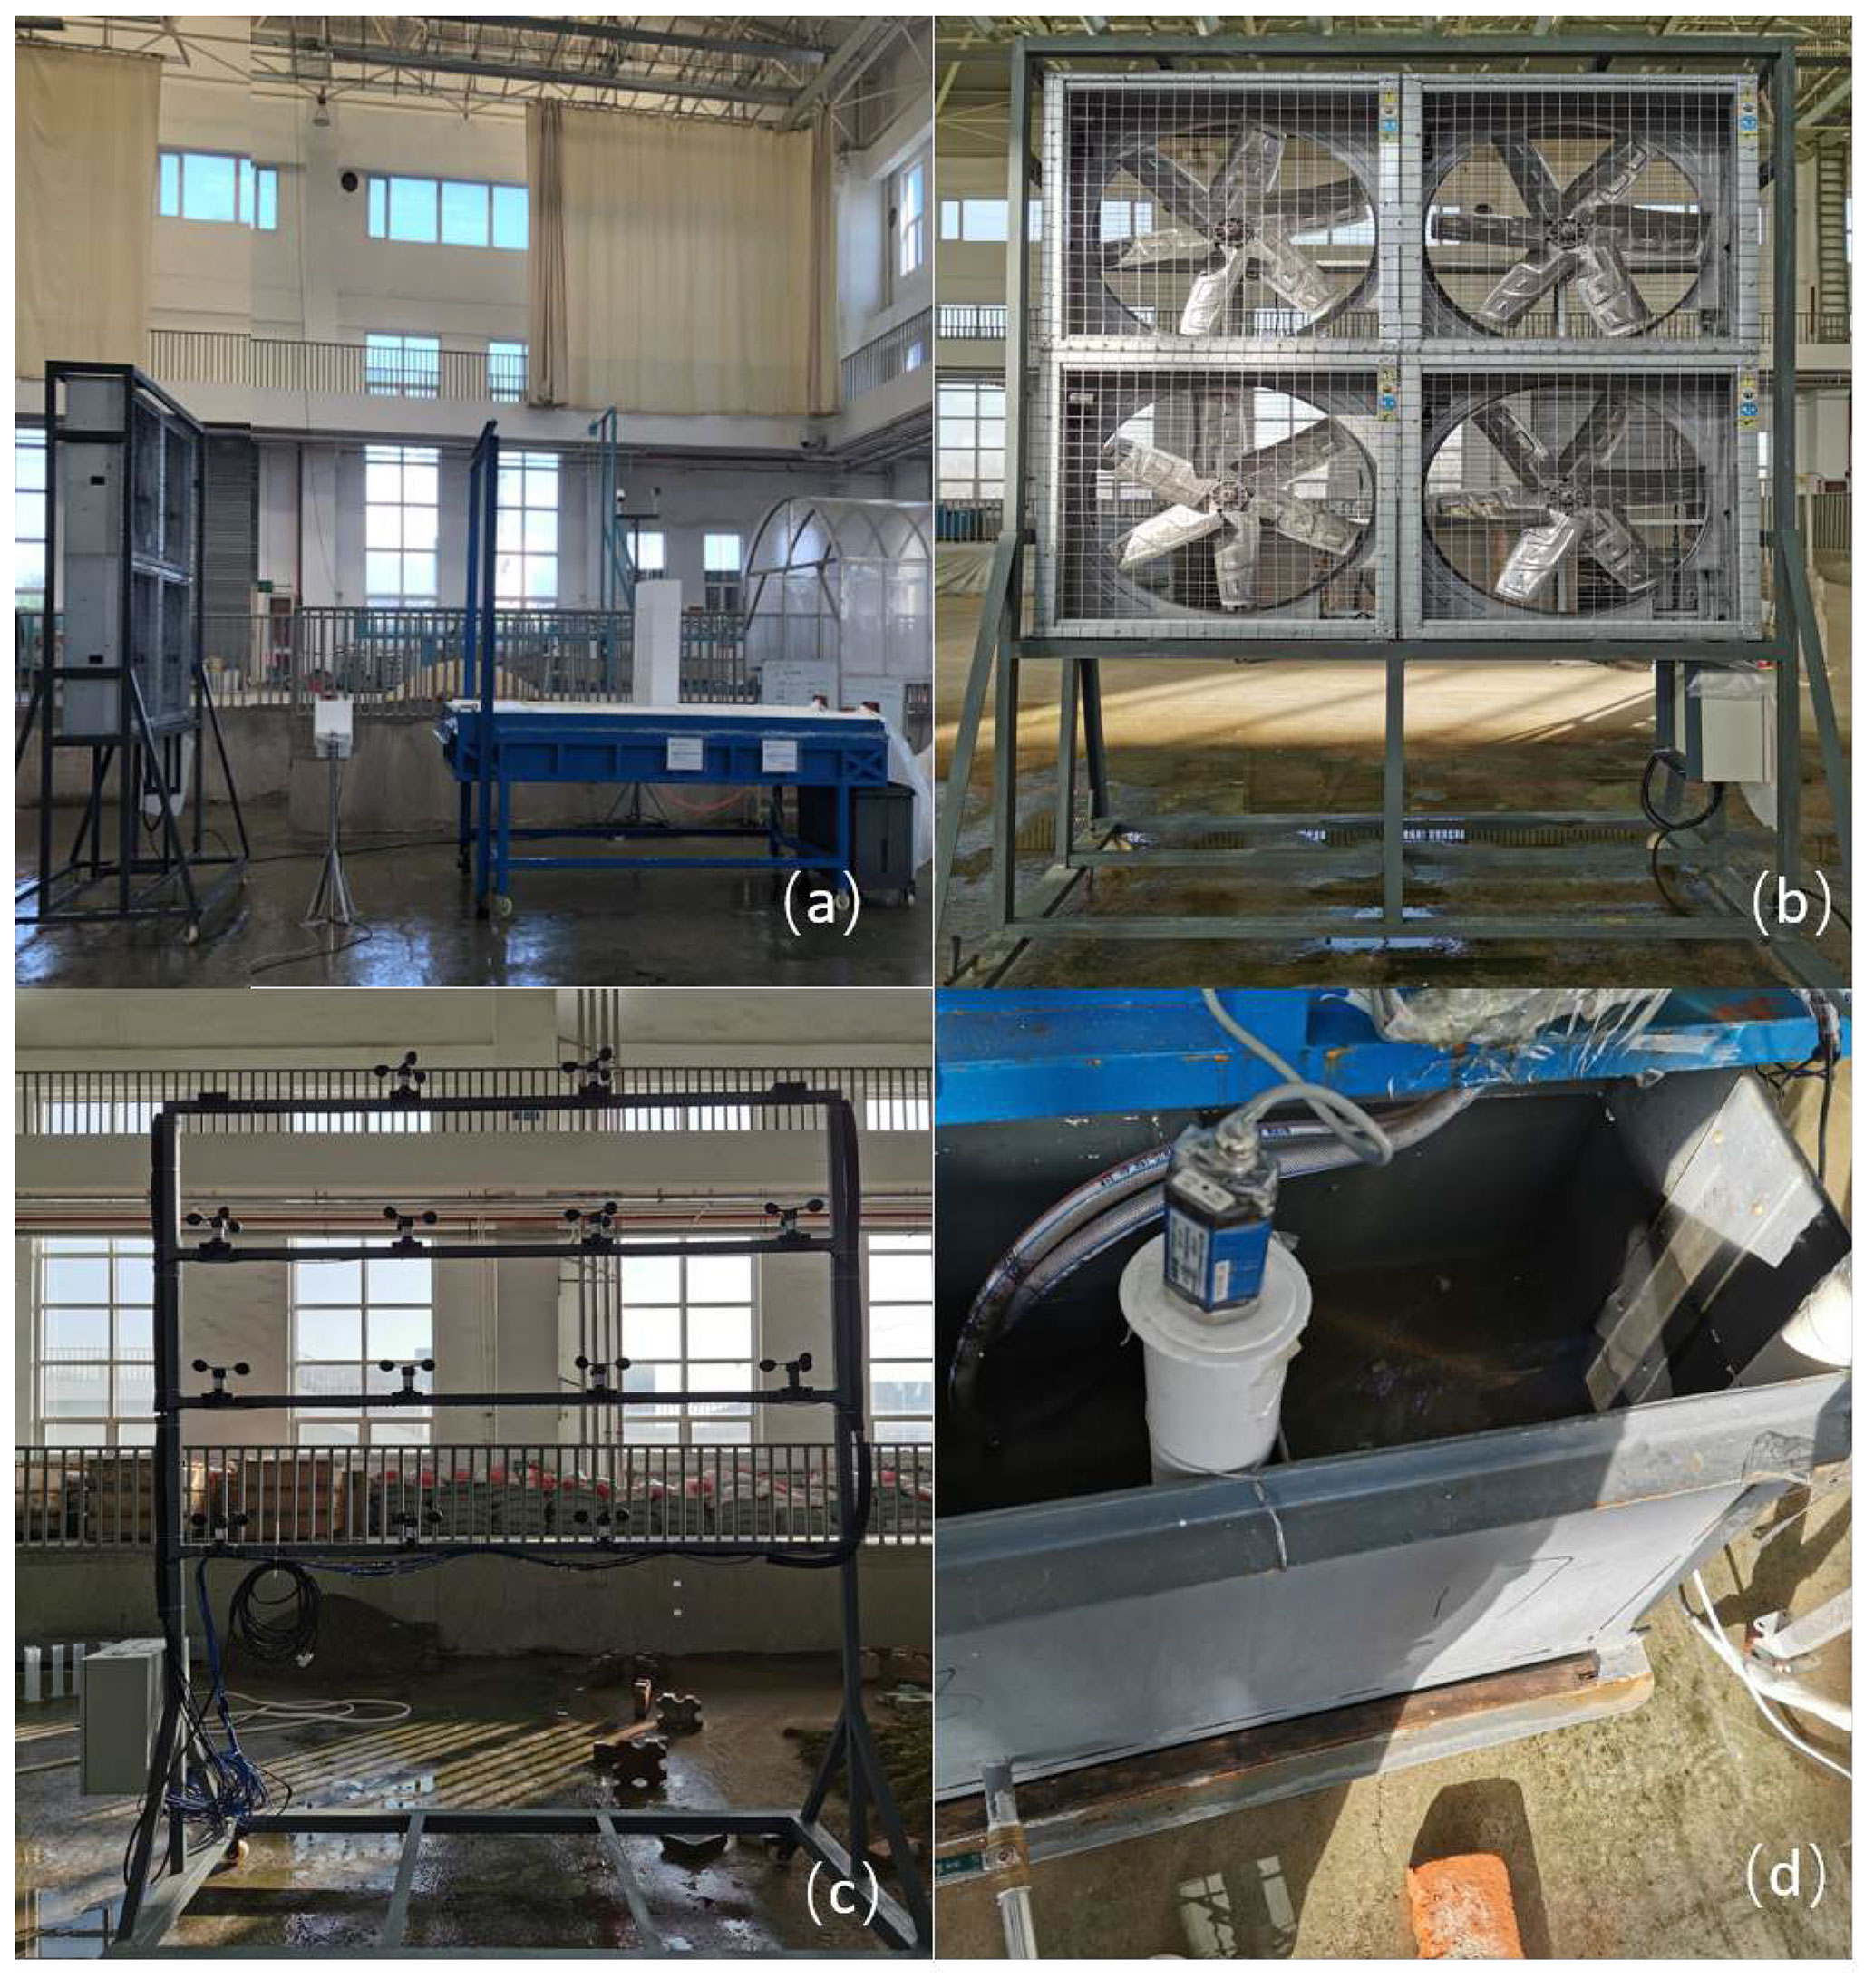
Figure 2Laboratory apparatus. Panels (a–d) show the overall experimental device, the electric fan system, the wind-speed-measuring device, and the flow-measuring device, respectively.
The first term of the right-hand side of Eq. (14) represents the total precipitation falling on the horizontal plane, including the ground and the roof; the second term represents the total infiltration; the third term represents the total precipitation falling on the building walls. It should be noted that the runoff mentioned here includes surface runoff and the runoff collected by the drainage system.
According to Eq. (15), Eq. (14) can be simplified as
The runoff coefficient of the urban high-rise building area can thus be obtained:
where represents the ratio of the building areas to the urban high-rise building area (i.e., the impervious area ratio), represents the ratio of the area of building walls on the windward side to the horizontal area of the buildings, represents the ratio of the infiltration water volume to the rainfall water volume within a certain time (Δt) during which f and P are constants (the value of Ki ranges from 0 to 1, and when Ki>1, it is set to 1), and represents the ratio of the water ponded on the surface and stored in the drainage system to the rainfall water volume within a certain time (Δt). The CFD model can identify tan θ. It should be noted that tan θ in Eq. (17) is linked to wind speed. In the whole storm event, tan θ and thus r need to be calculated in sections according to the wind speed. In addition, the runoff coefficient in Eq. (17) is an instant runoff coefficient and is only meaningful within the duration of the rainfall since the physical basis of the equation is the inclination of the raindrop trajectory. The runoff generation occurs within the duration of the rainfall in an urban flood, so that the study of the runoff coefficient within the duration of the rainfall is of practical significance.
Physically, the first term of the right-hand side of Eq. (17) represents the effect of building walls on the runoff coefficient, the second term of the right-hand side of Eq. (17) represents the effect of building roofs on the runoff coefficient, and the last three terms of the right-hand side of Eq. (17) represent the runoff coefficient that is not affected by buildings. Letting , Eq. (17) can be expressed by
where r0 represents the initial runoff coefficient of the watershed without the effect of the wind and the building. This equation illustrates that Eq. (17) is essentially a modification of the initial runoff coefficient considering the effect of the wind and the building.
2.3 Laboratory experiment
2.3.1 The laboratory apparatus
The laboratory apparatus, including a rainfall simulator system, a hypothetical 1:100 scale model of an urban high-rise building community, an electric fan system, and a measurement system, was designed to experimentally explore the relationship between wind speed and the corresponding runoff coefficient. An overview of the laboratory apparatus is shown in Fig. 2a.
-
The rainfall simulator system. The rainfall simulator system (shown in Fig. 2a) can simulate rainfall with intensity from 0 to 250 mm h−1 and with a drop diameter from 0.5 to 5.5 mm. The rainfall height of the simulator system is 12.5 m. According to Gunn and Kinzer (1949) and numerical simulations by CFD, raindrops in the experiment can reach their terminal speeds. The rainfall simulator system uses a pressurized water feed system: three types of full cone nozzles with different apertures are used to generate raindrops. Users can determine the water feed pressure and the combination of the three nozzles to generate different types of rainfall. In this study, the water feed pressure is set at 120 kPa, and only two types of nozzles (the large one and the middle one) are used.
-
The scale model. A 1:100 scale physical model of a real urban high-rise building area was built. The model consists of a platform used to simulate the ground surface and a building model used to simulate the buildings. The size of the platform is 916×3066 mm2, representing an area of 91.6×306.6 m2. The platform consists of two layers. The upper layer is made of acrylic board with many small holes which are used to simulate infiltration. In the experiment, runoff, including runoff from the ground surface and the drainage system, is generated on the upper layer. The lower layer consists of a steel tank which is used to collect the water that infiltrates from the upper layer. For each layer, there is a duct used to transfer the water collected by the layer into the measurement system. The building model is located at the center of the upper layer of the platform. The length, width, and height of the building model are mm, representing a cuboid building of m3. Placed under the building model, a 720×270 mm2 tray collects the water from the building model above. The water collected by the tray can be transferred to the measurement system by two 10 mm diameter ducts which are hung on the upper layer of the platform. The design can separate the volumes of water from the building and that from the ground. The scale model is shown in Fig. 2a, and the model size is indicated in Fig. 3.
-
The electric fan system. The electric fan system consists of four industrial axial fans with a diameter of 1.0 m and a frequency converter. The fans are grouped together in a 2×2 configuration (Fig. 2b). The frequency converter is used to control the four fans to generate a relatively uniform wind field. The electric fan system can generate a wind field with a speed up to 7 m s−1.
-
The measurement system. The measurement system includes a wind-speed-measuring device for a surface, a flow-measuring device, a raindrop disdrometer, and a data collection and processing system. The wind-speed-measuring device consists of 16 anemometers grouped in a 4×4 configuration (Fig. 2c). The accuracy of the anemometers is 3 %, and the interval between them is 600 mm. The flow-measuring device consists of two water tanks used to collect runoff and infiltration and two water-level gauges; each tank contains one water-level gauge (Fig. 2d). Both tanks are the same size, with a length, width, and height of 500, 500, and 600 mm, respectively. The accuracy of the water-level gauge is 1 mm. An RT800 data logger was used to collect the measured water level and wind speed and to transfer the collected data to a computer. The above-mentioned equipment was provided by Nanjing Quanshui Technologies Co., Ltd. The RD-80 raindrop disdrometer, produced by Distromet Ltd., Switzerland (https://distromet.com/, last access: 2021), was used to obtain the distribution of the raindrop size. The accuracy of the raindrop disdrometer is 5 %.

2.3.2 Experiment arrangement
In total, 12 rainfall–runoff simulations were conducted with different combinations of rainfall and wind speeds to obtain the hydrographs in the scale model basin. Two types of rainfall and a total of six wind speeds (including no wind) were used in the experiment. The details of the combinations of the control rainfall intensities, the raindrop diameters, and the wind speeds are shown in Table 1. The control rainfall intensity refers to the rainfall intensity not disturbed by the wind. The two control rainfall intensities represent rainfall intensities of 10- and 200-year return periods in Beijing, according to the storm equation of Beijing (Yuan et al., 2021). The two return periods are used since they represent a relatively common extreme rainfall and an especially extreme rainfall intensity. It should be noted that there are slight differences in the rainfall intensities calculated by the storm equation and those used in the experiment due to the limitations of the rainfall simulator system. The distribution of raindrop diameters was set to be uniform in the simulated rainfall process to simplify the analysis of the data, since the dynamic characteristics of raindrops in the wind field are significantly influenced by their diameters. The rainfall intensity atop the model is not the same as the control rainfall intensity since the raindrop trajectories are disturbed by the wind. Some of the raindrops are intercepted by building walls, and some of the raindrops flow out of the platform range. The spatial distribution of the rainfall intensity atop the model is very uneven. Table 1 gives the spatial mean value of the rainfall intensity atop the model, which was obtained by adding the runoff and the infiltration collected by the two tanks after the water retained in the model has infiltrated, to illustrate the impact of the wind and the buildings on rainfall intensities in an urban high-rise building area. The infiltration rate was obtained from calibration test of the experiment platform under different control rainfall intensities prior to the experiment. We can find that the infiltration rates for the two different rainfalls are not the same. It may be caused by the different dynamic characteristics of the two rainfalls; i.e., larger raindrop diameter leads to larger final speed and thus larger infiltration rate. Each experiment was repeated three times. The final experiment result was determined according to the following rules. If the deviations of the three results are less than 10 %, the average of the three results will be recorded as the final result; if the deviation of one of the three results is greater than 10 %, this result will be discarded and the average of the other two results will be recorded as the final result; if the deviations of two or three results are greater than 10 %, the experiment will be repeated three times again and the final result will be determined according to the same rules.
Table 1The combinations of rainfall, wind speeds, and infiltration rates.

2.4 The CFD model for the laboratory experiment
A 2D CFD model was built for the laboratory experiment described in Sect. 2.3 to obtain the inclination angle of the raindrop trajectory. The building was positioned at a distance of 15H (H is the height of the building) from the outlet boundary (Tominaga et al., 2008). The top boundary, represented by the ceiling of the experiment hall, was 15H from the building, and the inlet boundary was 2.5H from the building according to the experiment. The inlet profile of the wind speed was defined by a piecewise function (Eq. 19), consistent with the laboratory experiment. Turbulent kinetic energy and turbulent dissipation were used to establish the turbulent boundary (Wang et al., 2015). Non-slip conditions were imposed on the ground and building surfaces, and the top boundary and the standard wall functions proposed by Launder and Spalding (1983) were applied to them. The raindrop was simulated by spherical particles released from a virtual face that was 12.5 m above the ground, the same as the rainfall height in the experiment. The initial velocity of the particles was set at 0 m s−1.
where U is the inlet profile of the wind speed and U0 is the wind speed used in the laboratory experiment shown in Table 1. The characteristic of the inlet wind speed profile is caused by the size of the electric fan system. The height of the electric fan system is 2H, and the wind speed outside this range is 0.
The commercial software FLUENT (https://www.ansys.com/, last access: 2021) was used for the CFD code in this study. The calculation region was discretized by structural grids with a size up to 15×15 mm2. In order to identify the grid size, the calculation results of different models with grid sizes from 20×20 to 10×10 mm2 were compared. The gap between the results becomes exceedingly small when the grid size becomes less than 15×15 mm2. This illustrates that the calculation result of the model is independent of the grid size when the grid size is less than 15×15 mm2. The second-order upwind method was used to discretize the governing equations, and the Semi-Implicit Method for Pressure Linked Equations (SIMPLE) algorithm was used to solve the equations.
3.1 Experimental relationship between the wind speed and the runoff coefficient
The hydrographs of the runoff and the infiltration of the scale model for the 12 different combinations of rainfall and wind speed are compared in Figs. 4 and 5, with each sub-figure representing one rainfall type. The results demonstrate that the peak flow rate of the runoff and the infiltration varies with wind speeds for both types of rainfall. However, no obvious relationship can be found between the peak flow rate of the runoff and the infiltration and the wind speed for either type of rainfall. The variable range of the two types of peak flow for rainfall 1 is less than that for rainfall 2, indicating that the rainfall with larger droplets is less affected by wind. Since the local wind field can disturb the distribution of raindrops and thus affect rainfall intensity, the spatial mean values of the actual rainfall intensities atop the scale model for different wind speeds were compared (Fig. 6). Figure 6 reveals that the rainfall intensities atop the model demonstrate a decreasing trend with the increase in the wind speed for both types of rainfall, though there are some fluctuations.
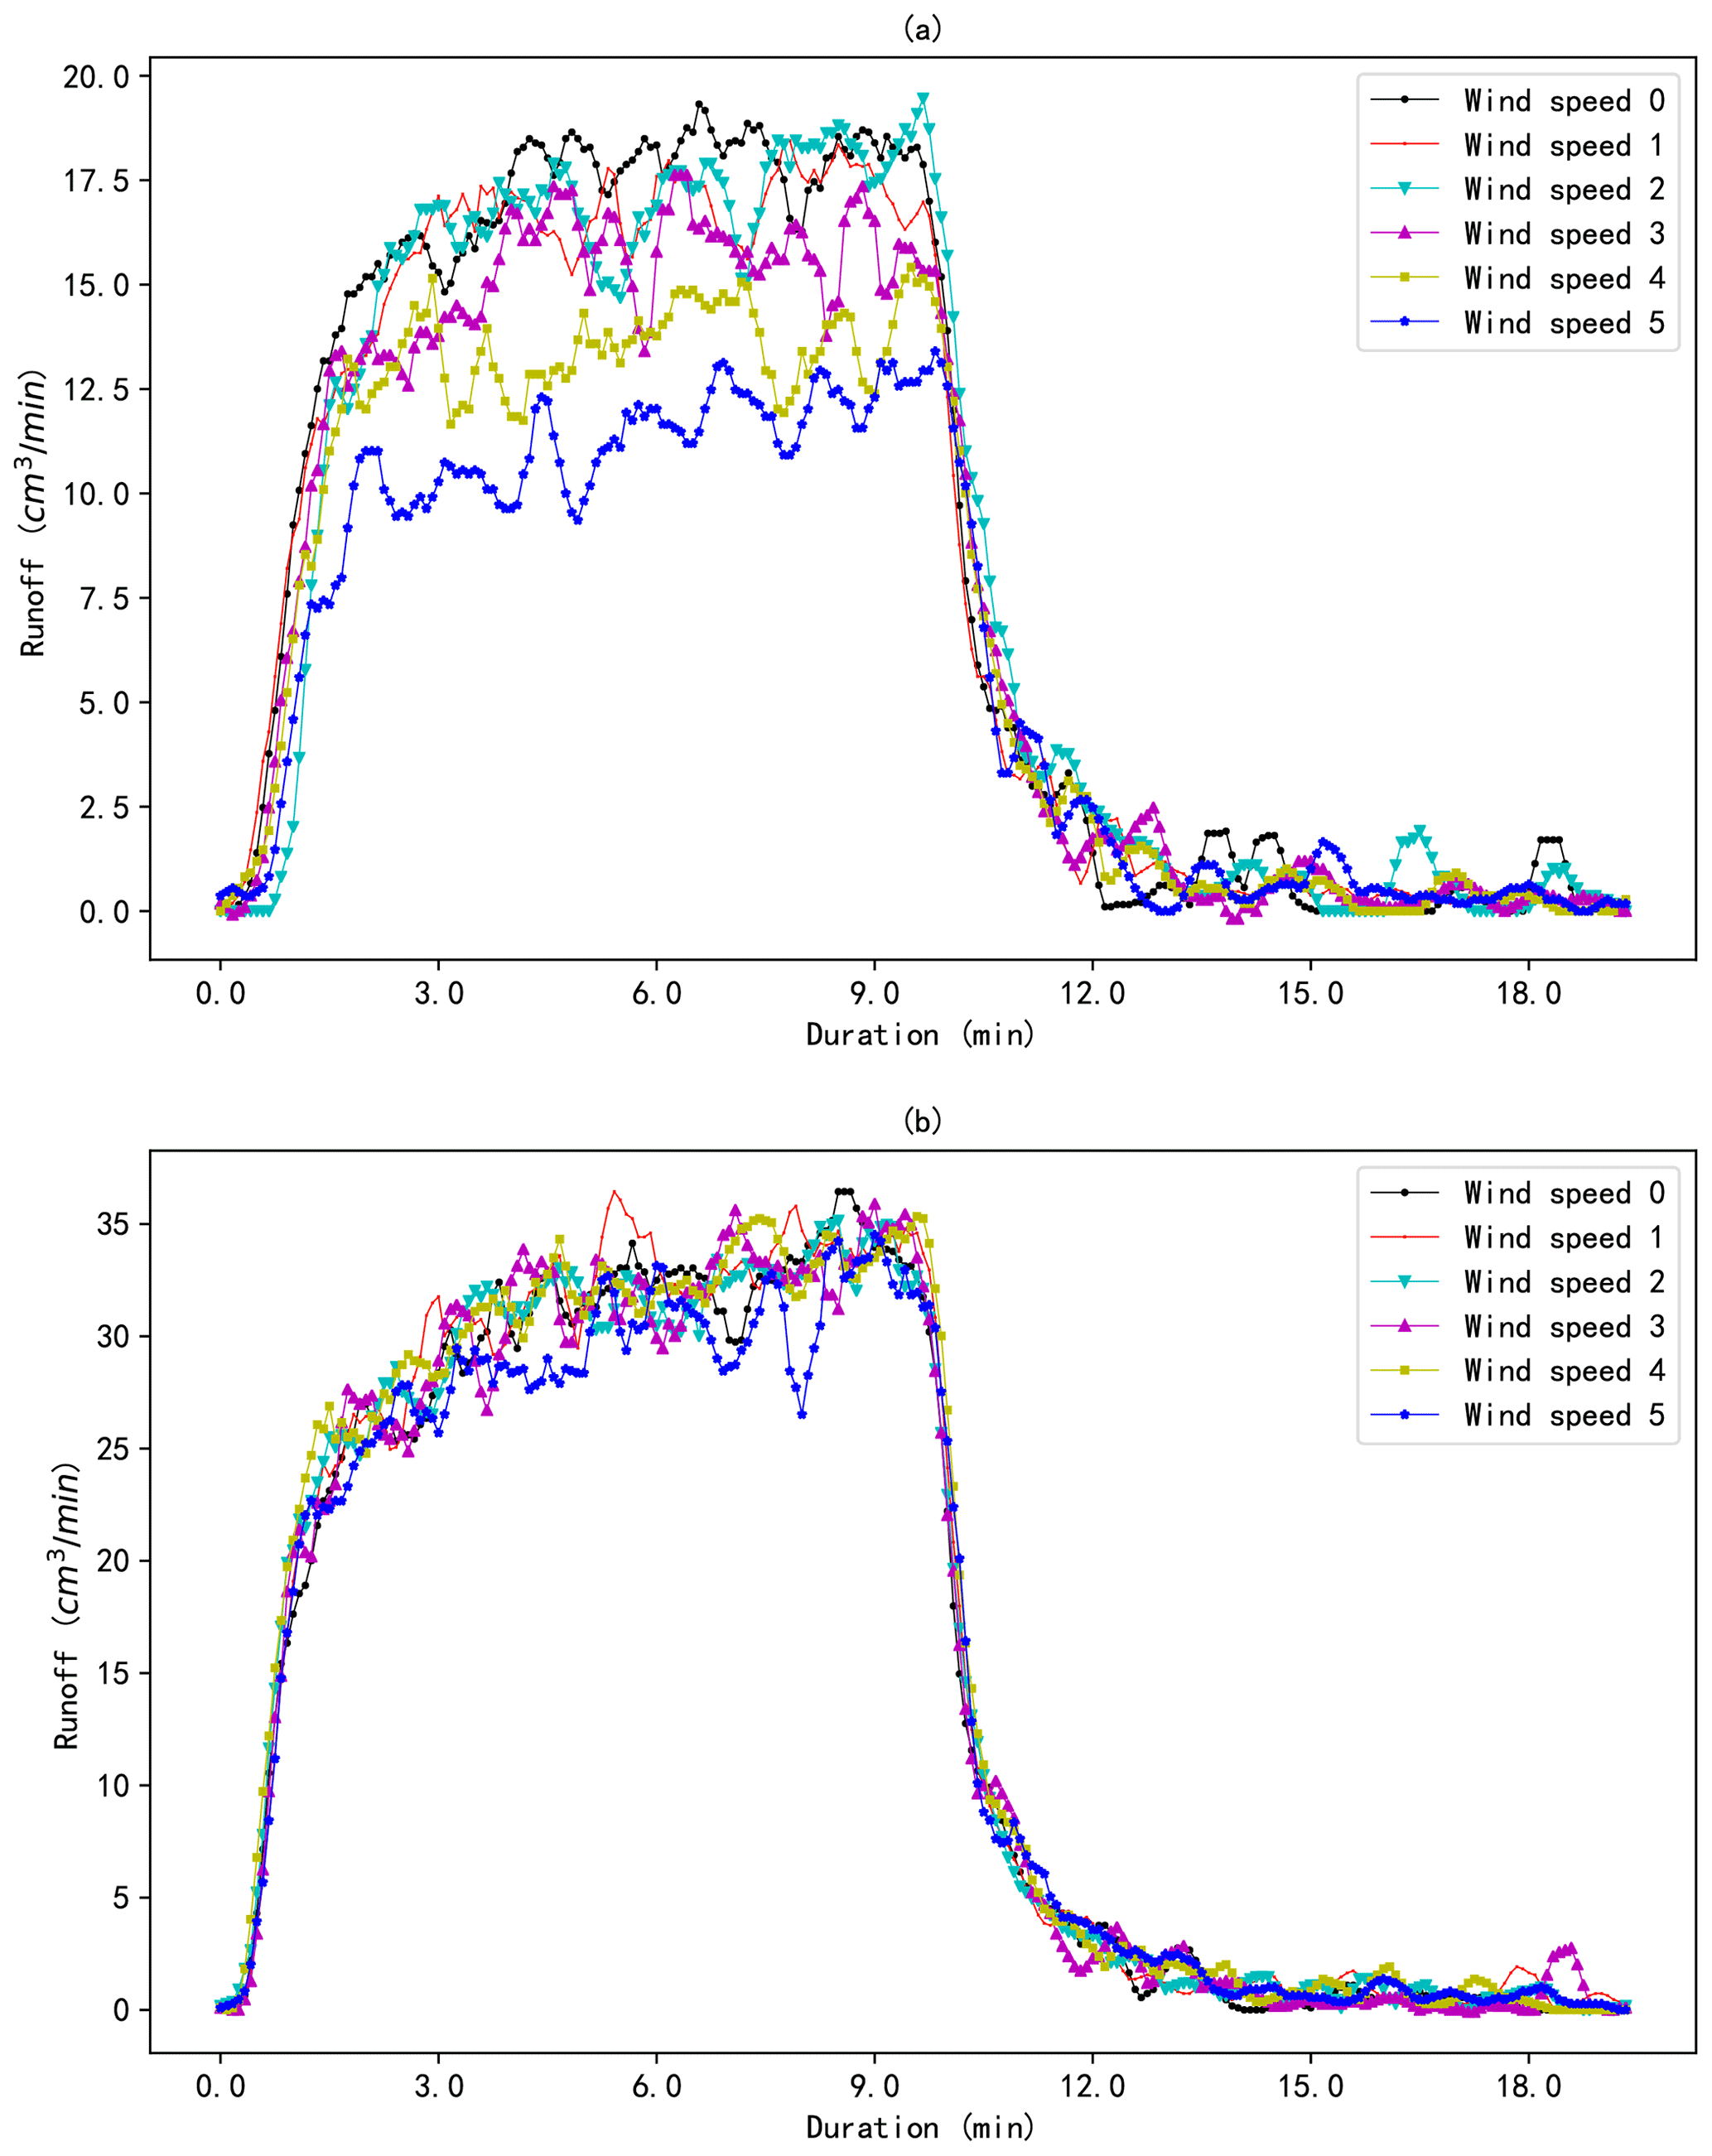
Figure 4The hydrographs of the runoff of the scale model for different wind speeds under rainfall types 1 (a) and 2 (b).
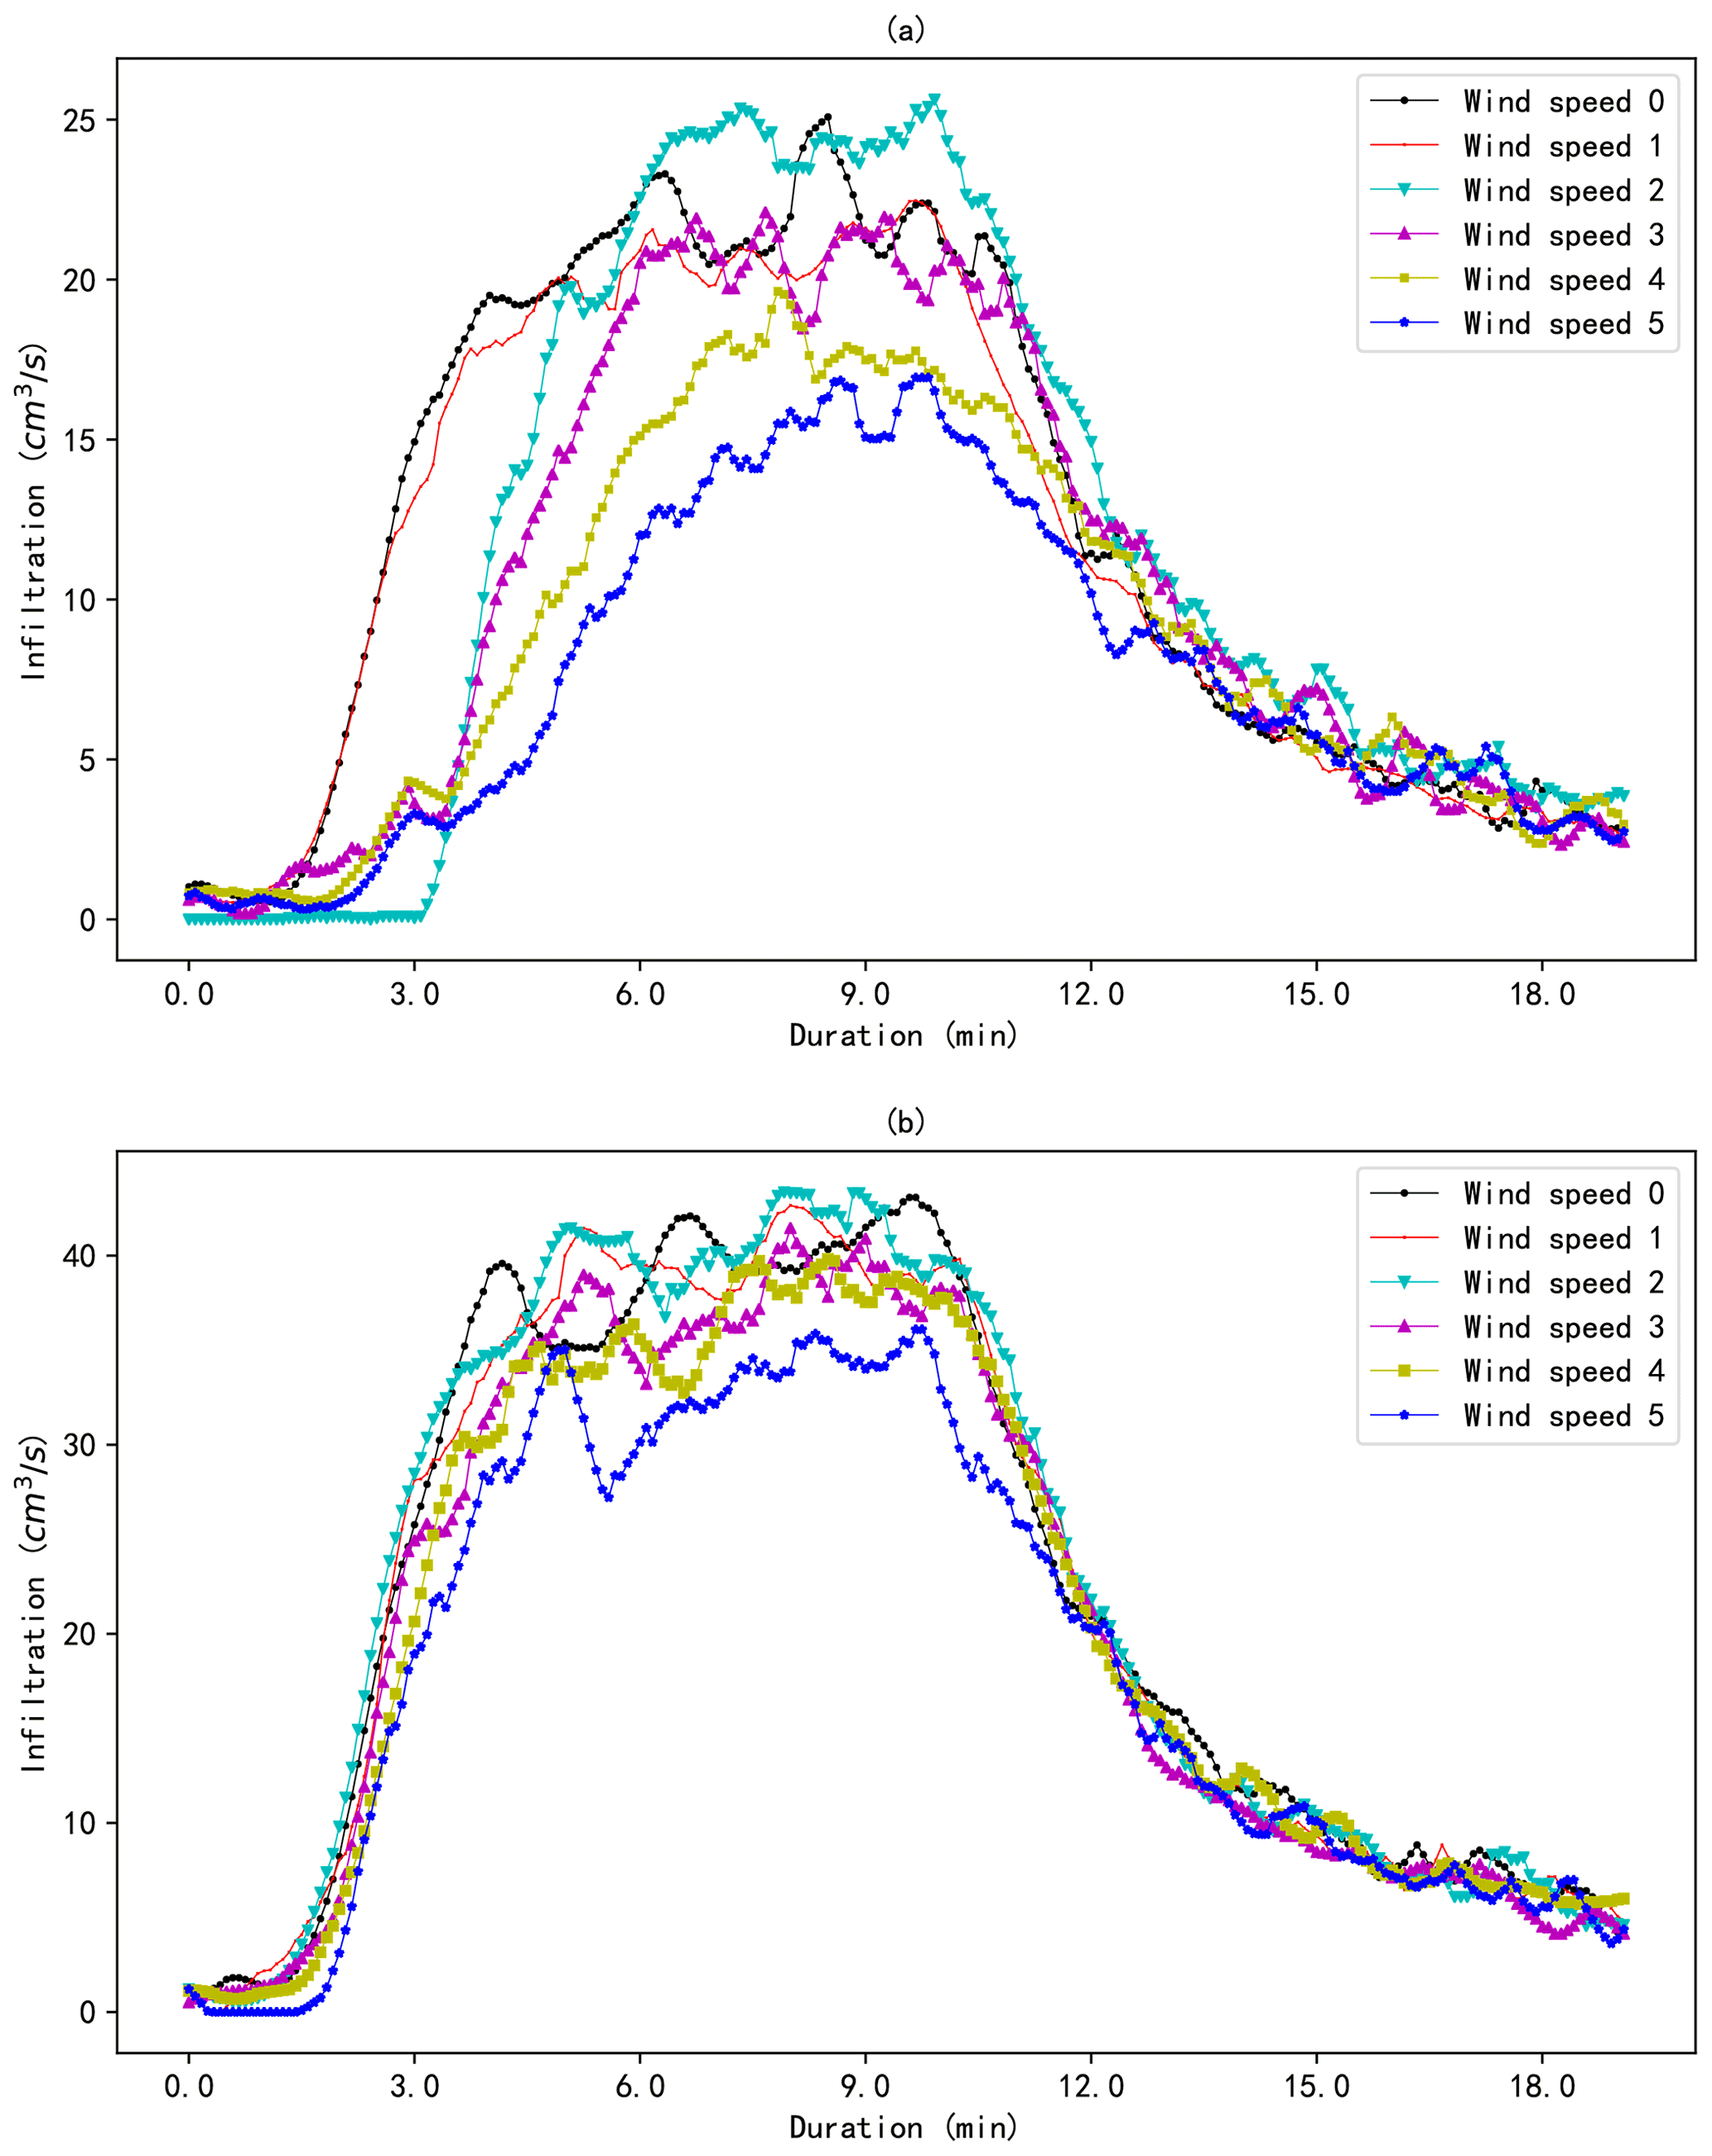
Figure 5The hydrographs of the infiltration of the scale model for different wind speeds under rainfall types 1 (a) and 2 (b).
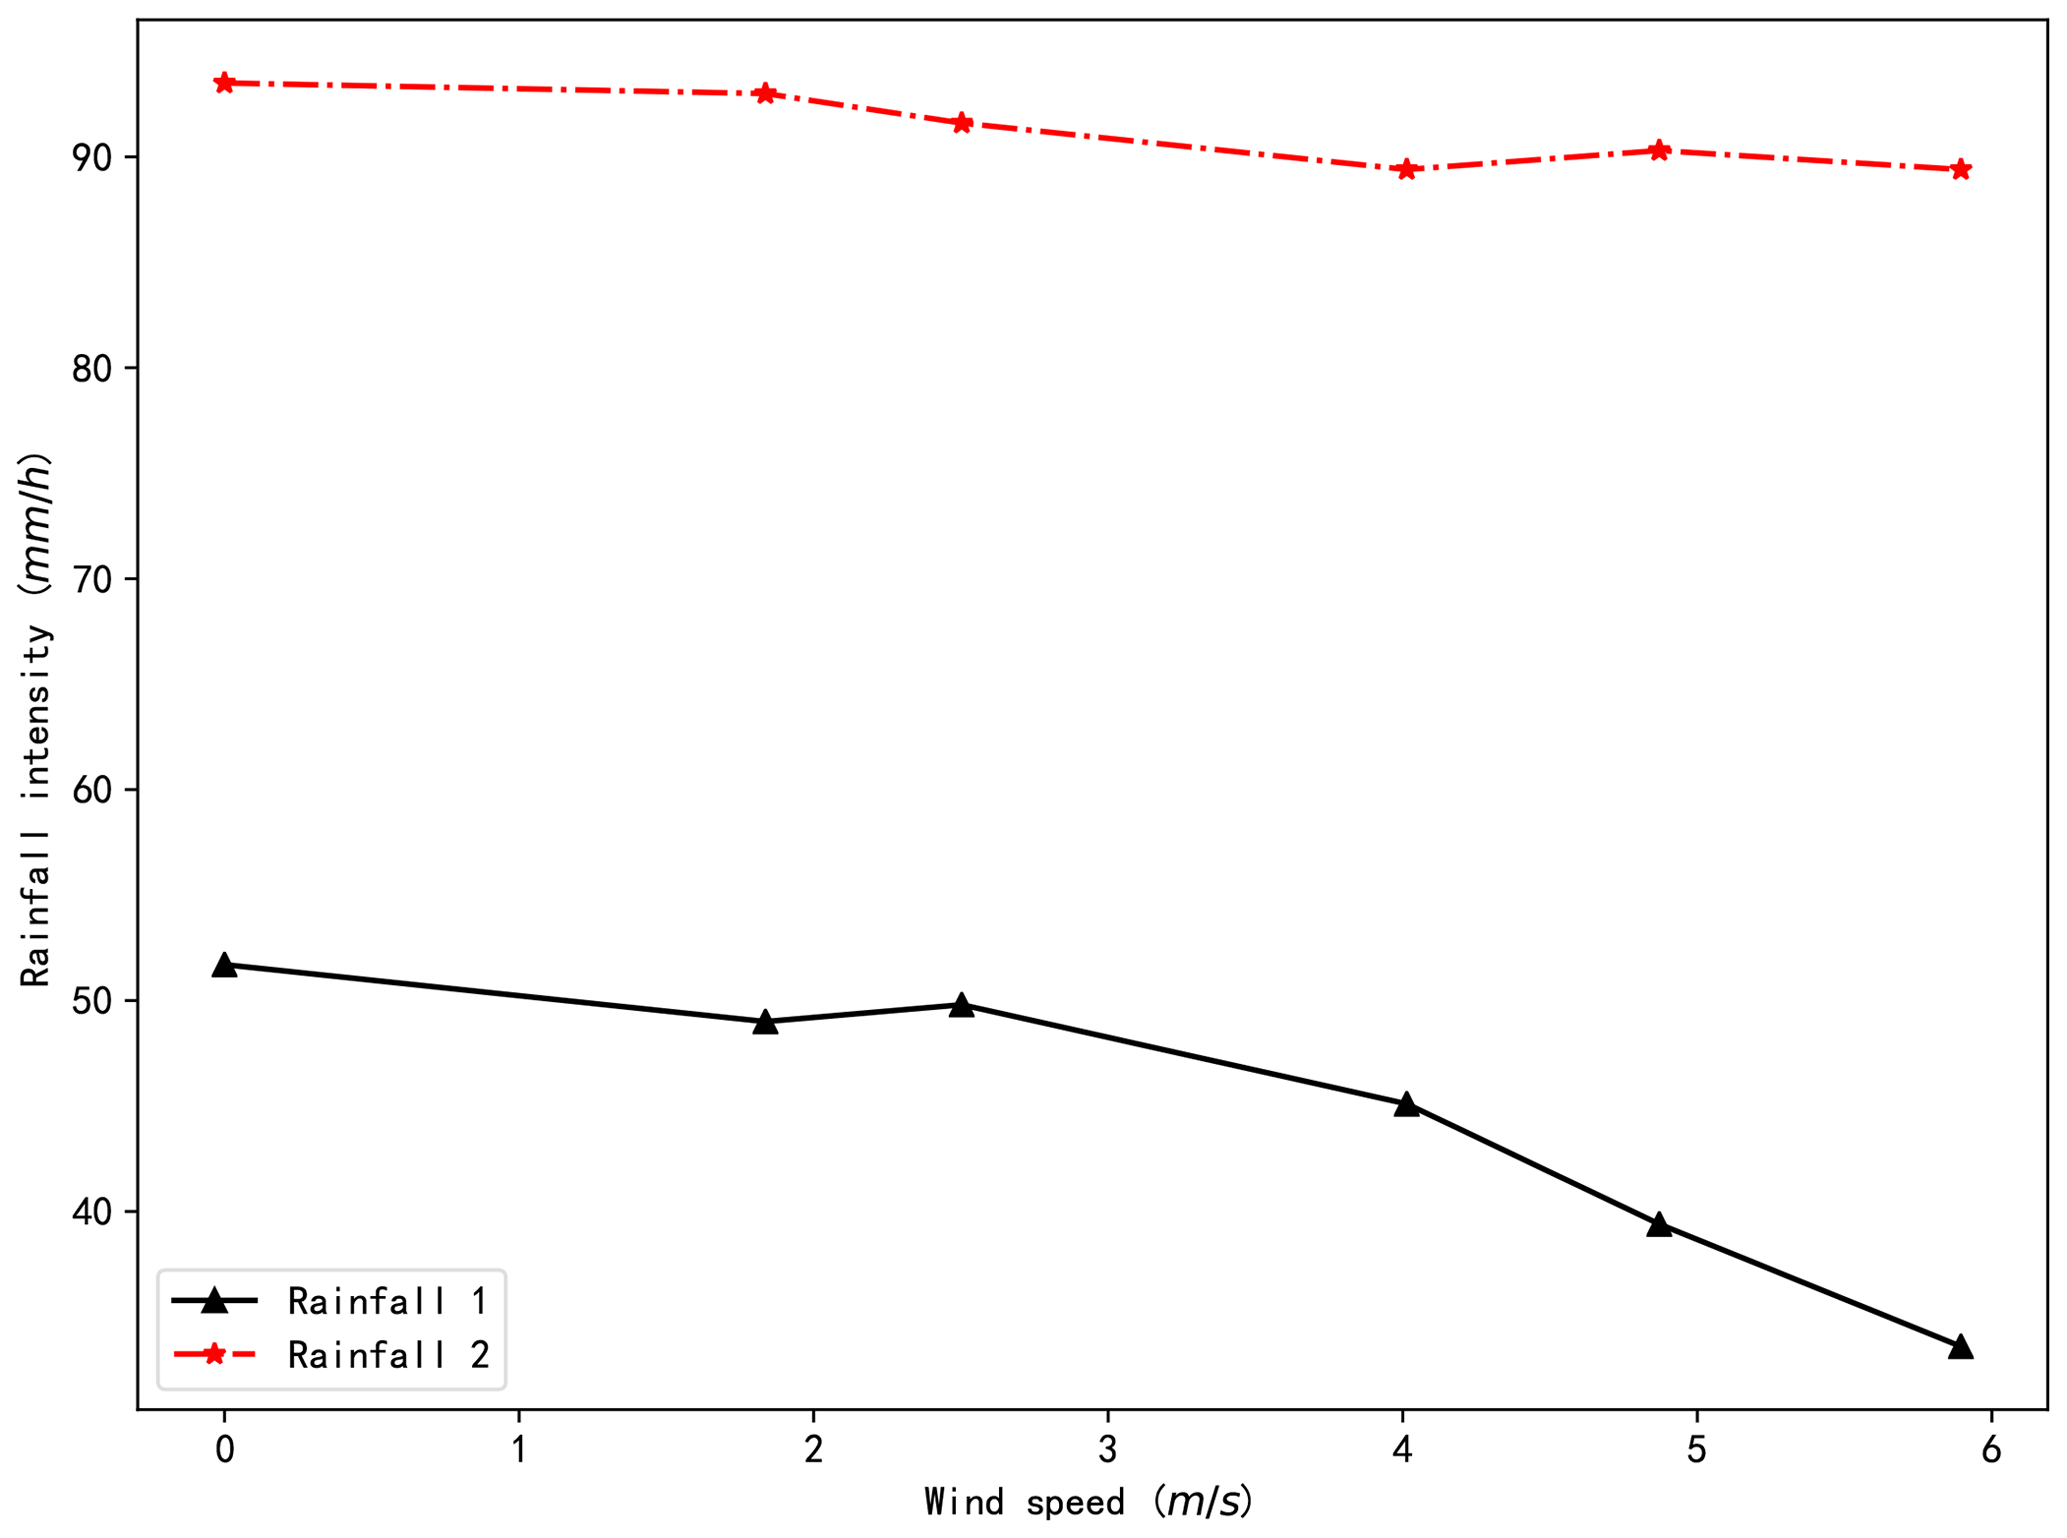
Figure 6The actual rainfall intensity atop the scale model for different wind speeds under rainfalls 1 and 2.
To avoid potential misunderstandings about the relationship between rainfall inclination and the rainfall–runoff process caused by changes in rainfall intensity, the runoff coefficients of the scale model for the 12 different combinations of rainfall and wind speed were calculated (Fig. 7). Considering the theoretical equations and the fact that the water retained in the model can hardly be measured, the runoff coefficient, when the surface runoff is stable, is used to verify Eq. (17). The steady state of the surface runoff indicates that the water retained in the model remains unchanged under the conditions of the experiment. Specifically, the runoff coefficient is calculated by dividing the water collected in the water tank used to collect the runoff by the sum of the water collected by the two tanks when the runoff is stable. The sum of the water collected by the two tanks when the runoff is stable can be regarded as the total rainfall during this time period, since the water retained in the model remains unchanged at this stage. By using the volume of the water instead of the runoff (infiltration) rate to estimate the runoff coefficient, measurement error caused by the oscillation of the water in the two water tanks can be reduced. The results indicate that the runoff coefficient for rainfall 1 ranges from 0.501 to 0.565, while that for rainfall 2 ranges from 0.499 to 0.546. The runoff coefficient increases with wind speed for both types of rainfall. The variable range of the runoff coefficient for rainfall 1 (0.064) is greater than rainfall 2 (0.047), indicating that the runoff coefficient for rainfall with a smaller droplet diameter is more affected by the wind.
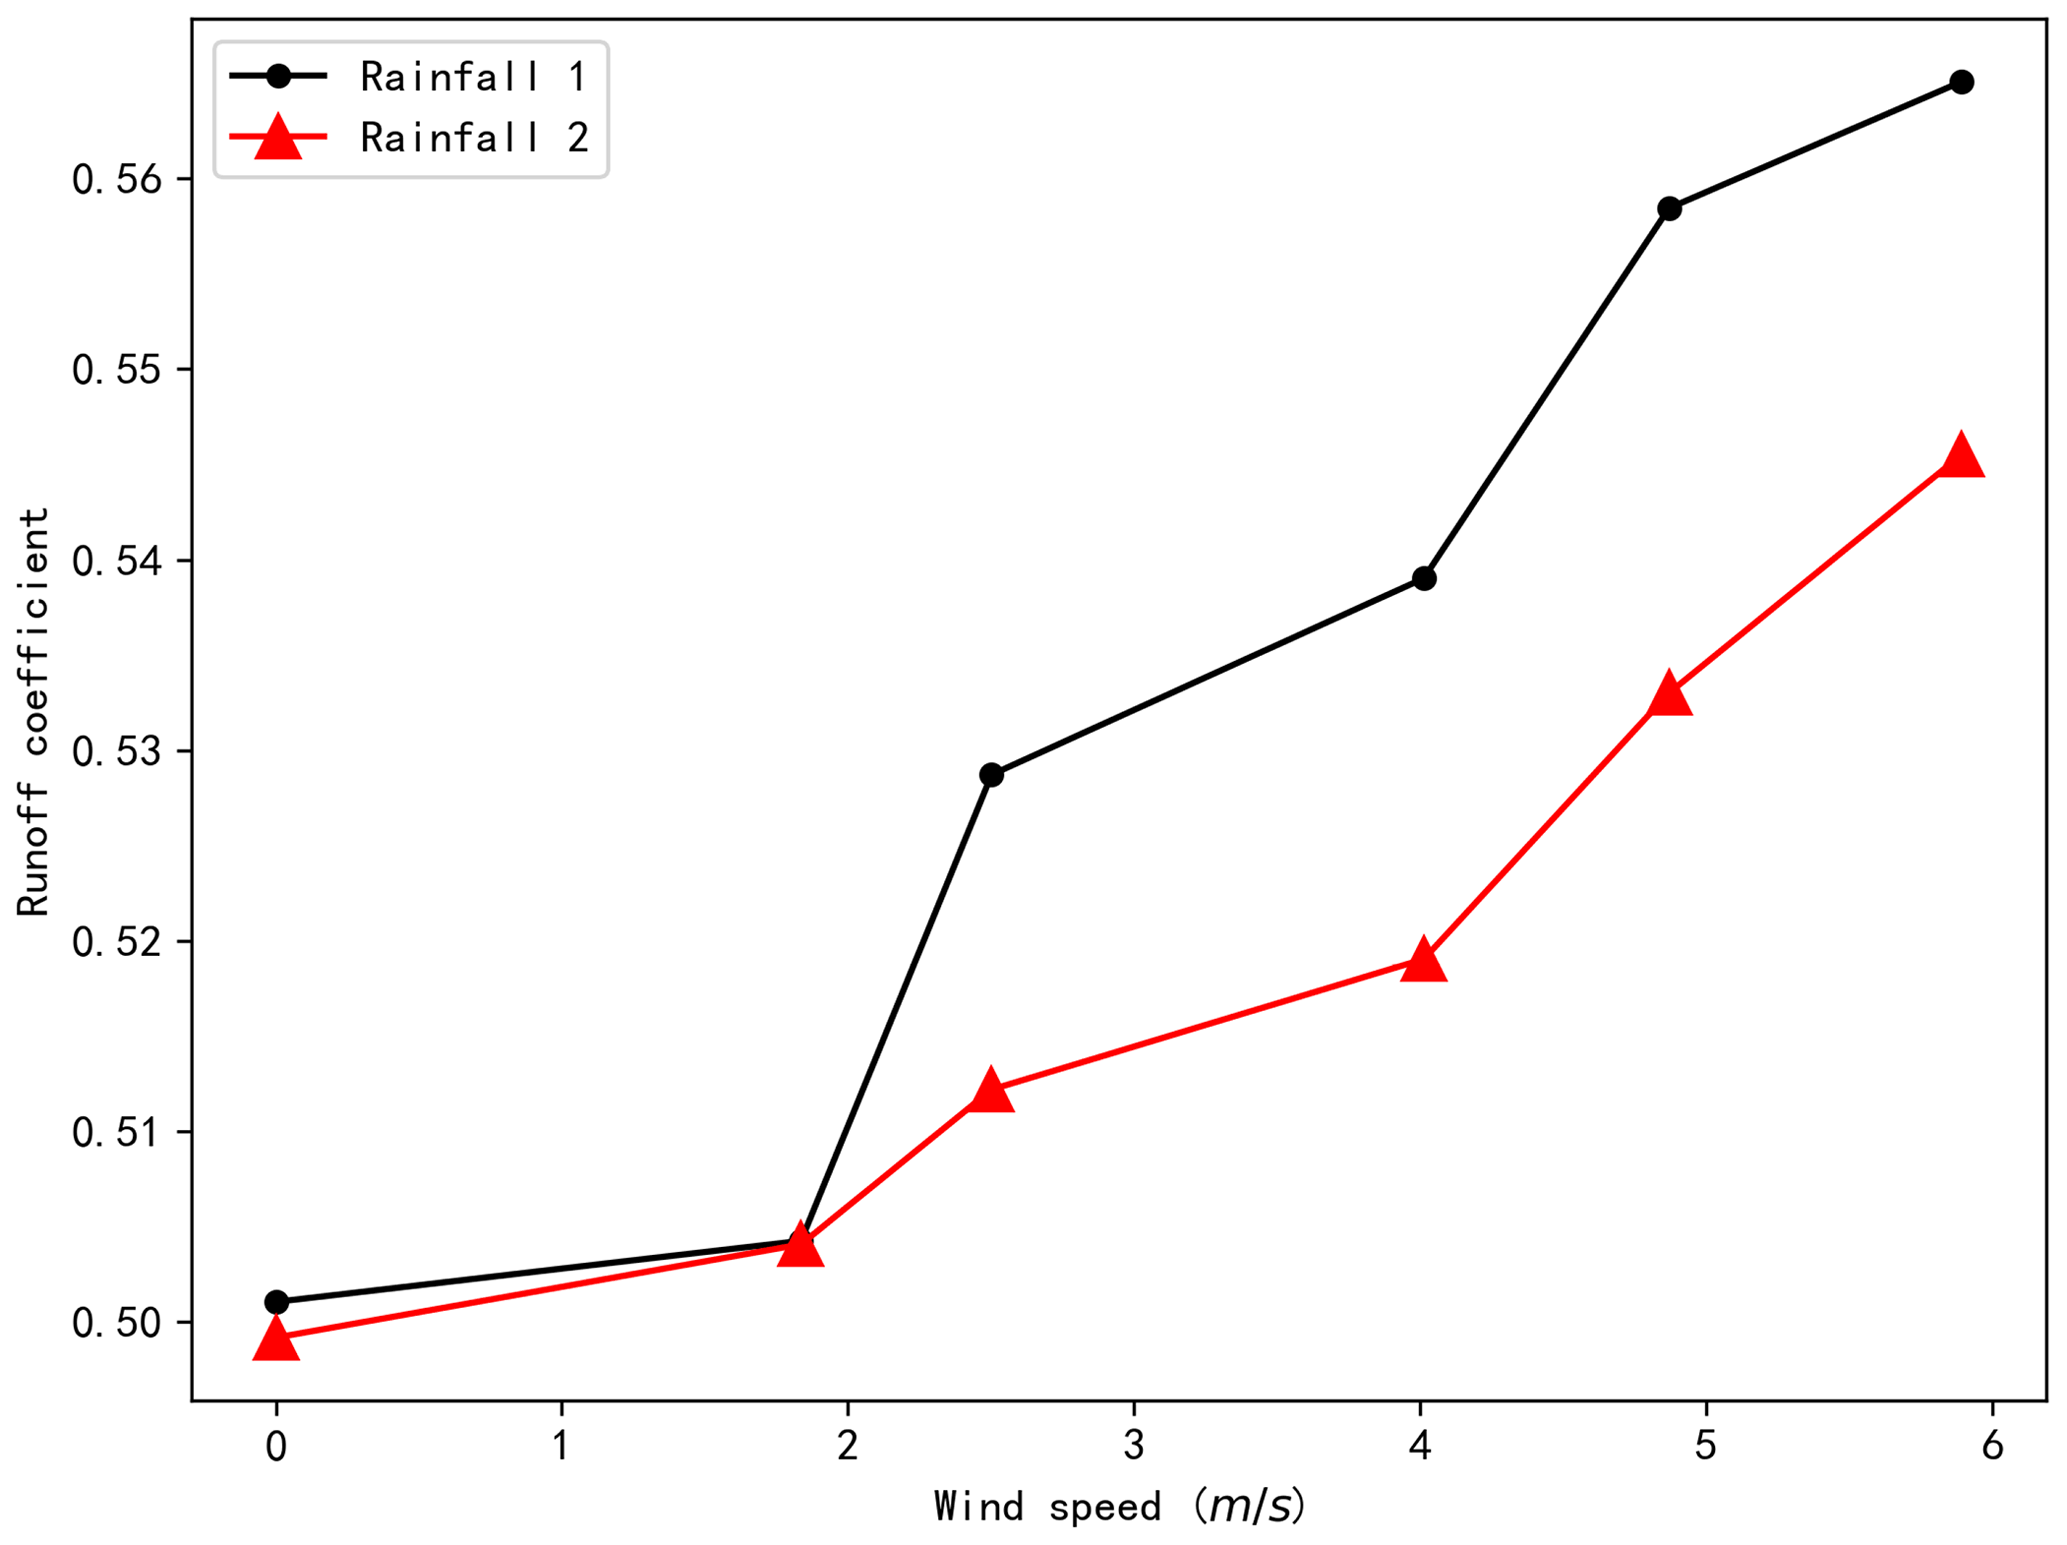
Figure 7The runoff coefficients of the scale model for different wind speeds under the two types of rainfall.
3.2 The relationship between the wind speed and the rainfall inclination
The wind fields of the scale model under different wind speed boundary conditions were first simulated by the CFD model described in Sect. 2.3. The velocity of the wind around the building model is shown in Fig. 8 (taking the velocity input boundary of winds 3 and 5 as an example). The results indicate that wind flow is obviously disturbed by the building. The velocity of the wind varies significantly near the upper corner on the windward side of the building. The horizontal wind velocity clearly increases above the corner and decreases on the windward surface of the corner. The increase in the wind speed above the building can be explained as follows: since the air moving at low speed can be regarded as incompressible, the product of the velocity and the area of the flow section remains constant at different locations according to the law of conservation of mass. The area of the flow section just above the building is less than that at the front of the building, which creates a faster wind speed for the former in comparison to the latter. Moreover, the horizontal wind velocity recorded on the direct leeward side of the building decreases to approximately 0 because the building blocks the wind flow. The vertical velocity appears near the top of the building and dissipates in the distance. The maximum magnitudes of horizontal and vertical velocities are comparable.
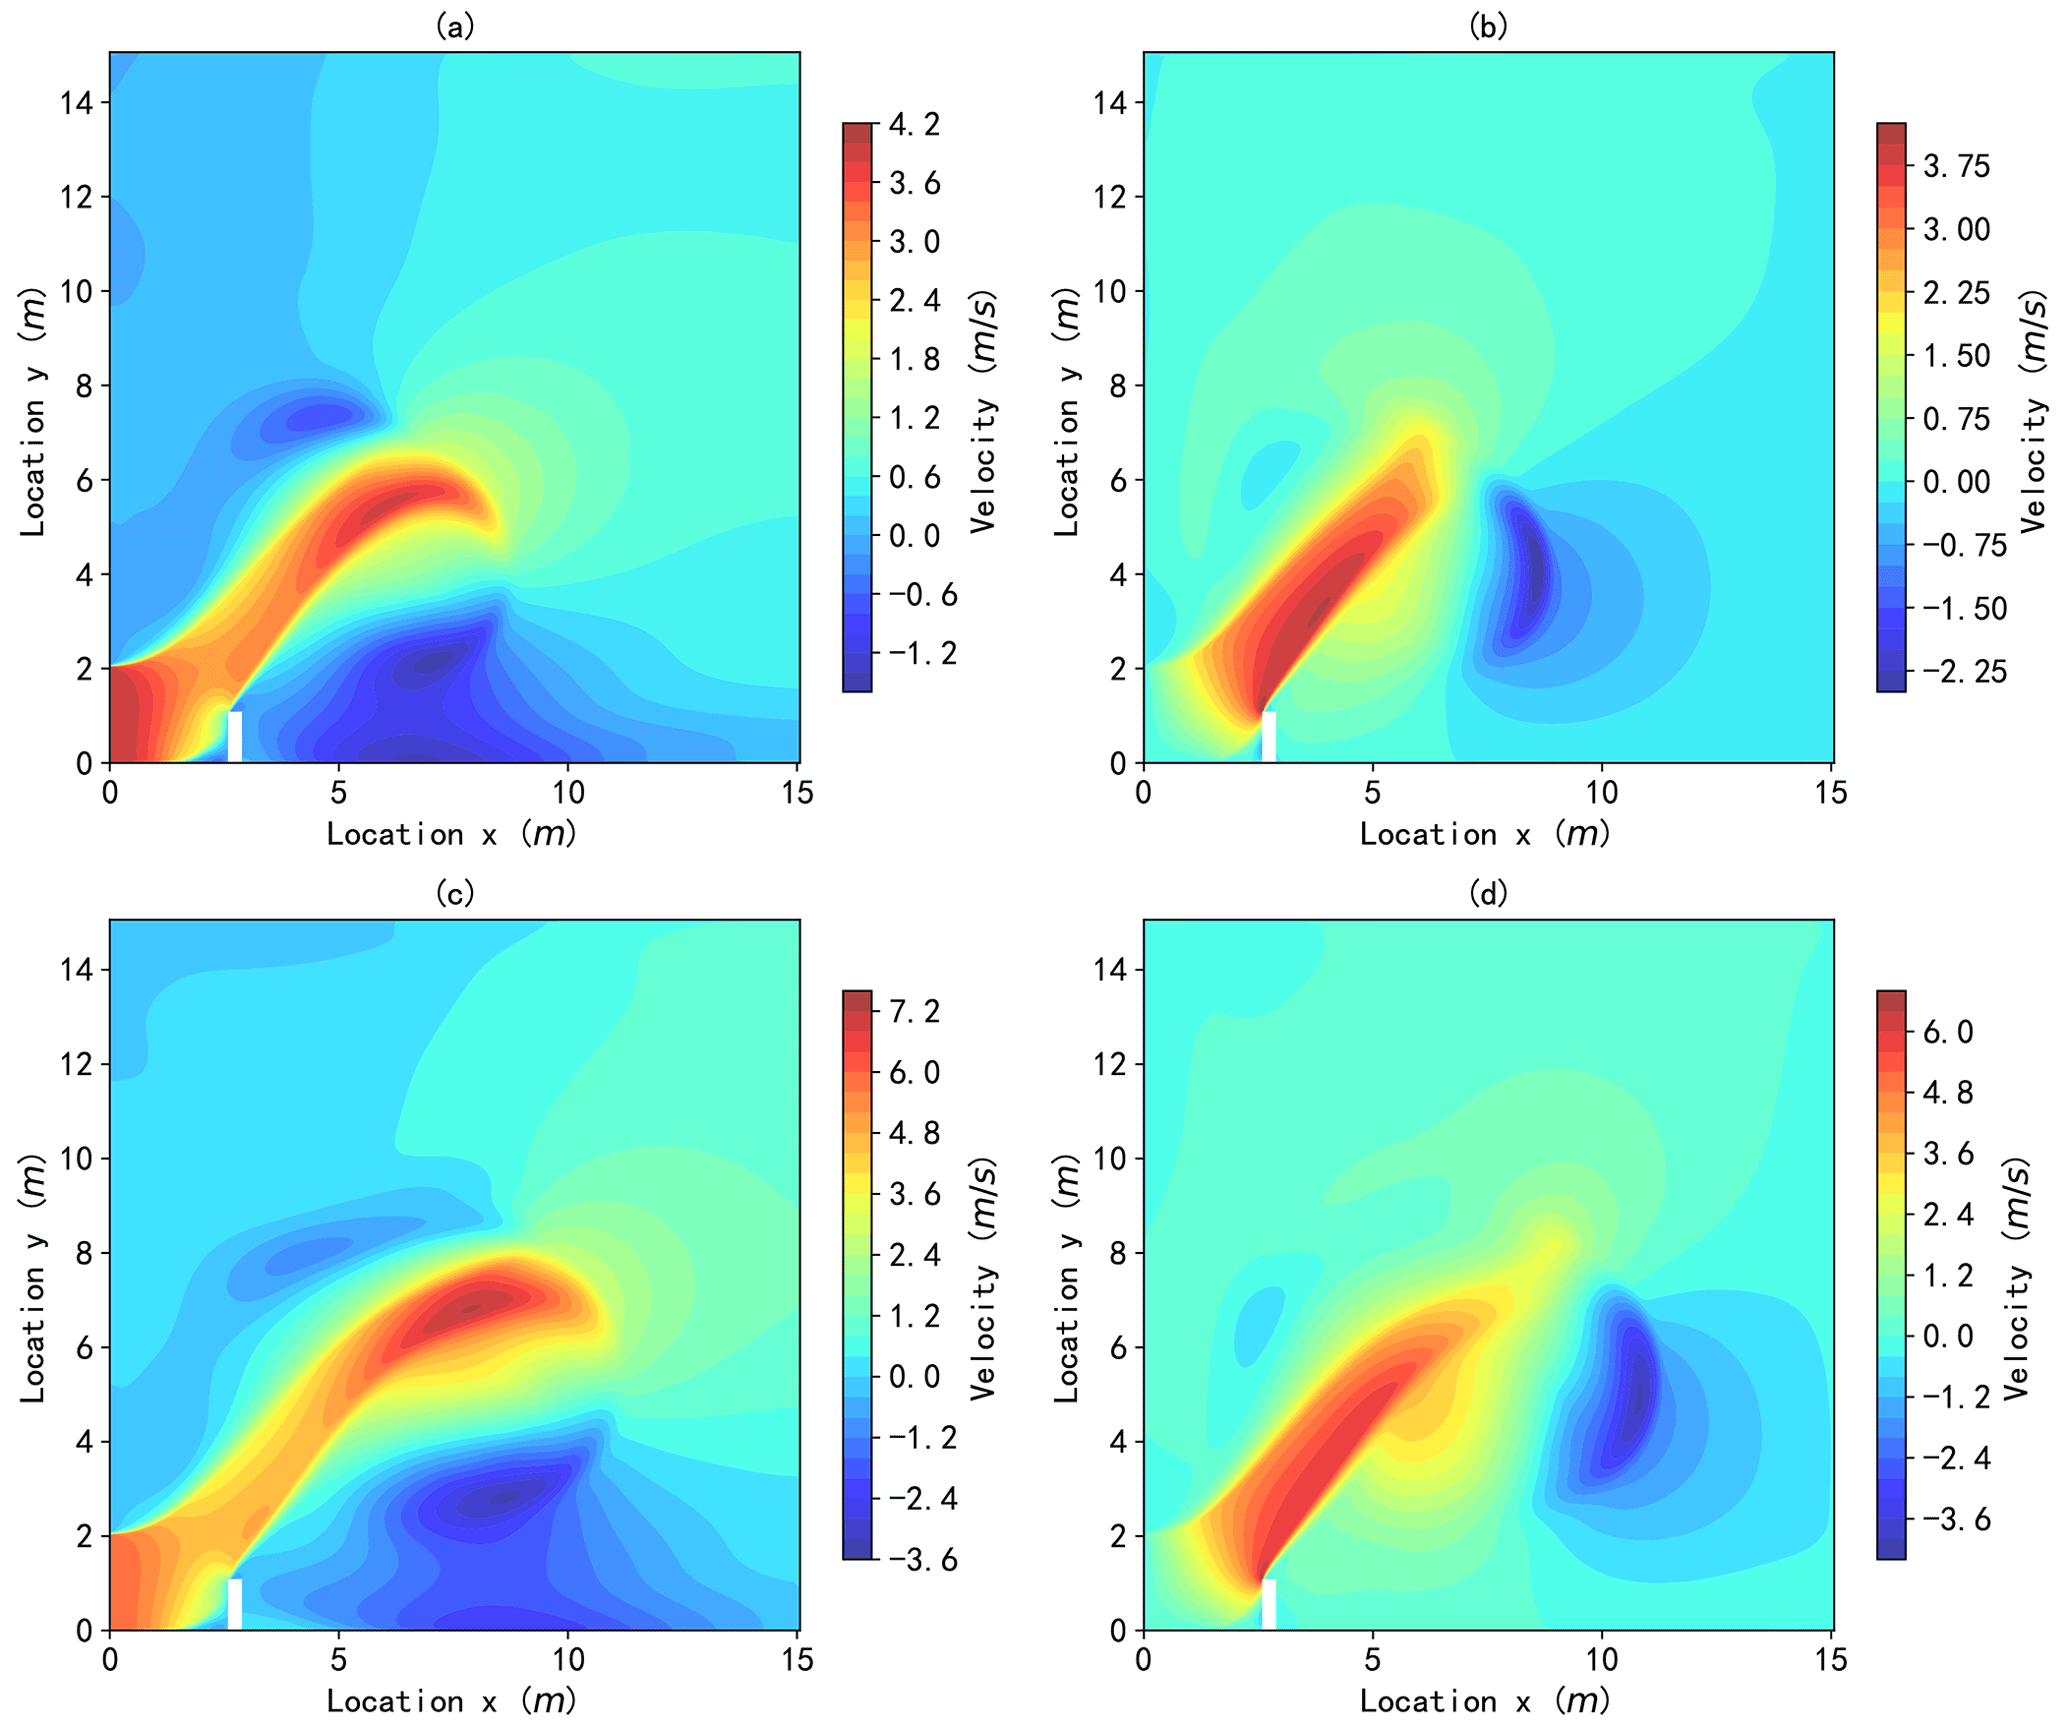
Figure 8Simulated wind velocity. Panels (a) and (b) represent horizontal and vertical velocities, respectively, for wind 3. Panels (c) and (d) represent horizontal and vertical velocities, respectively, for wind 5. Location x means horizonal position, while Location y means vertical position in a 2D plane space.
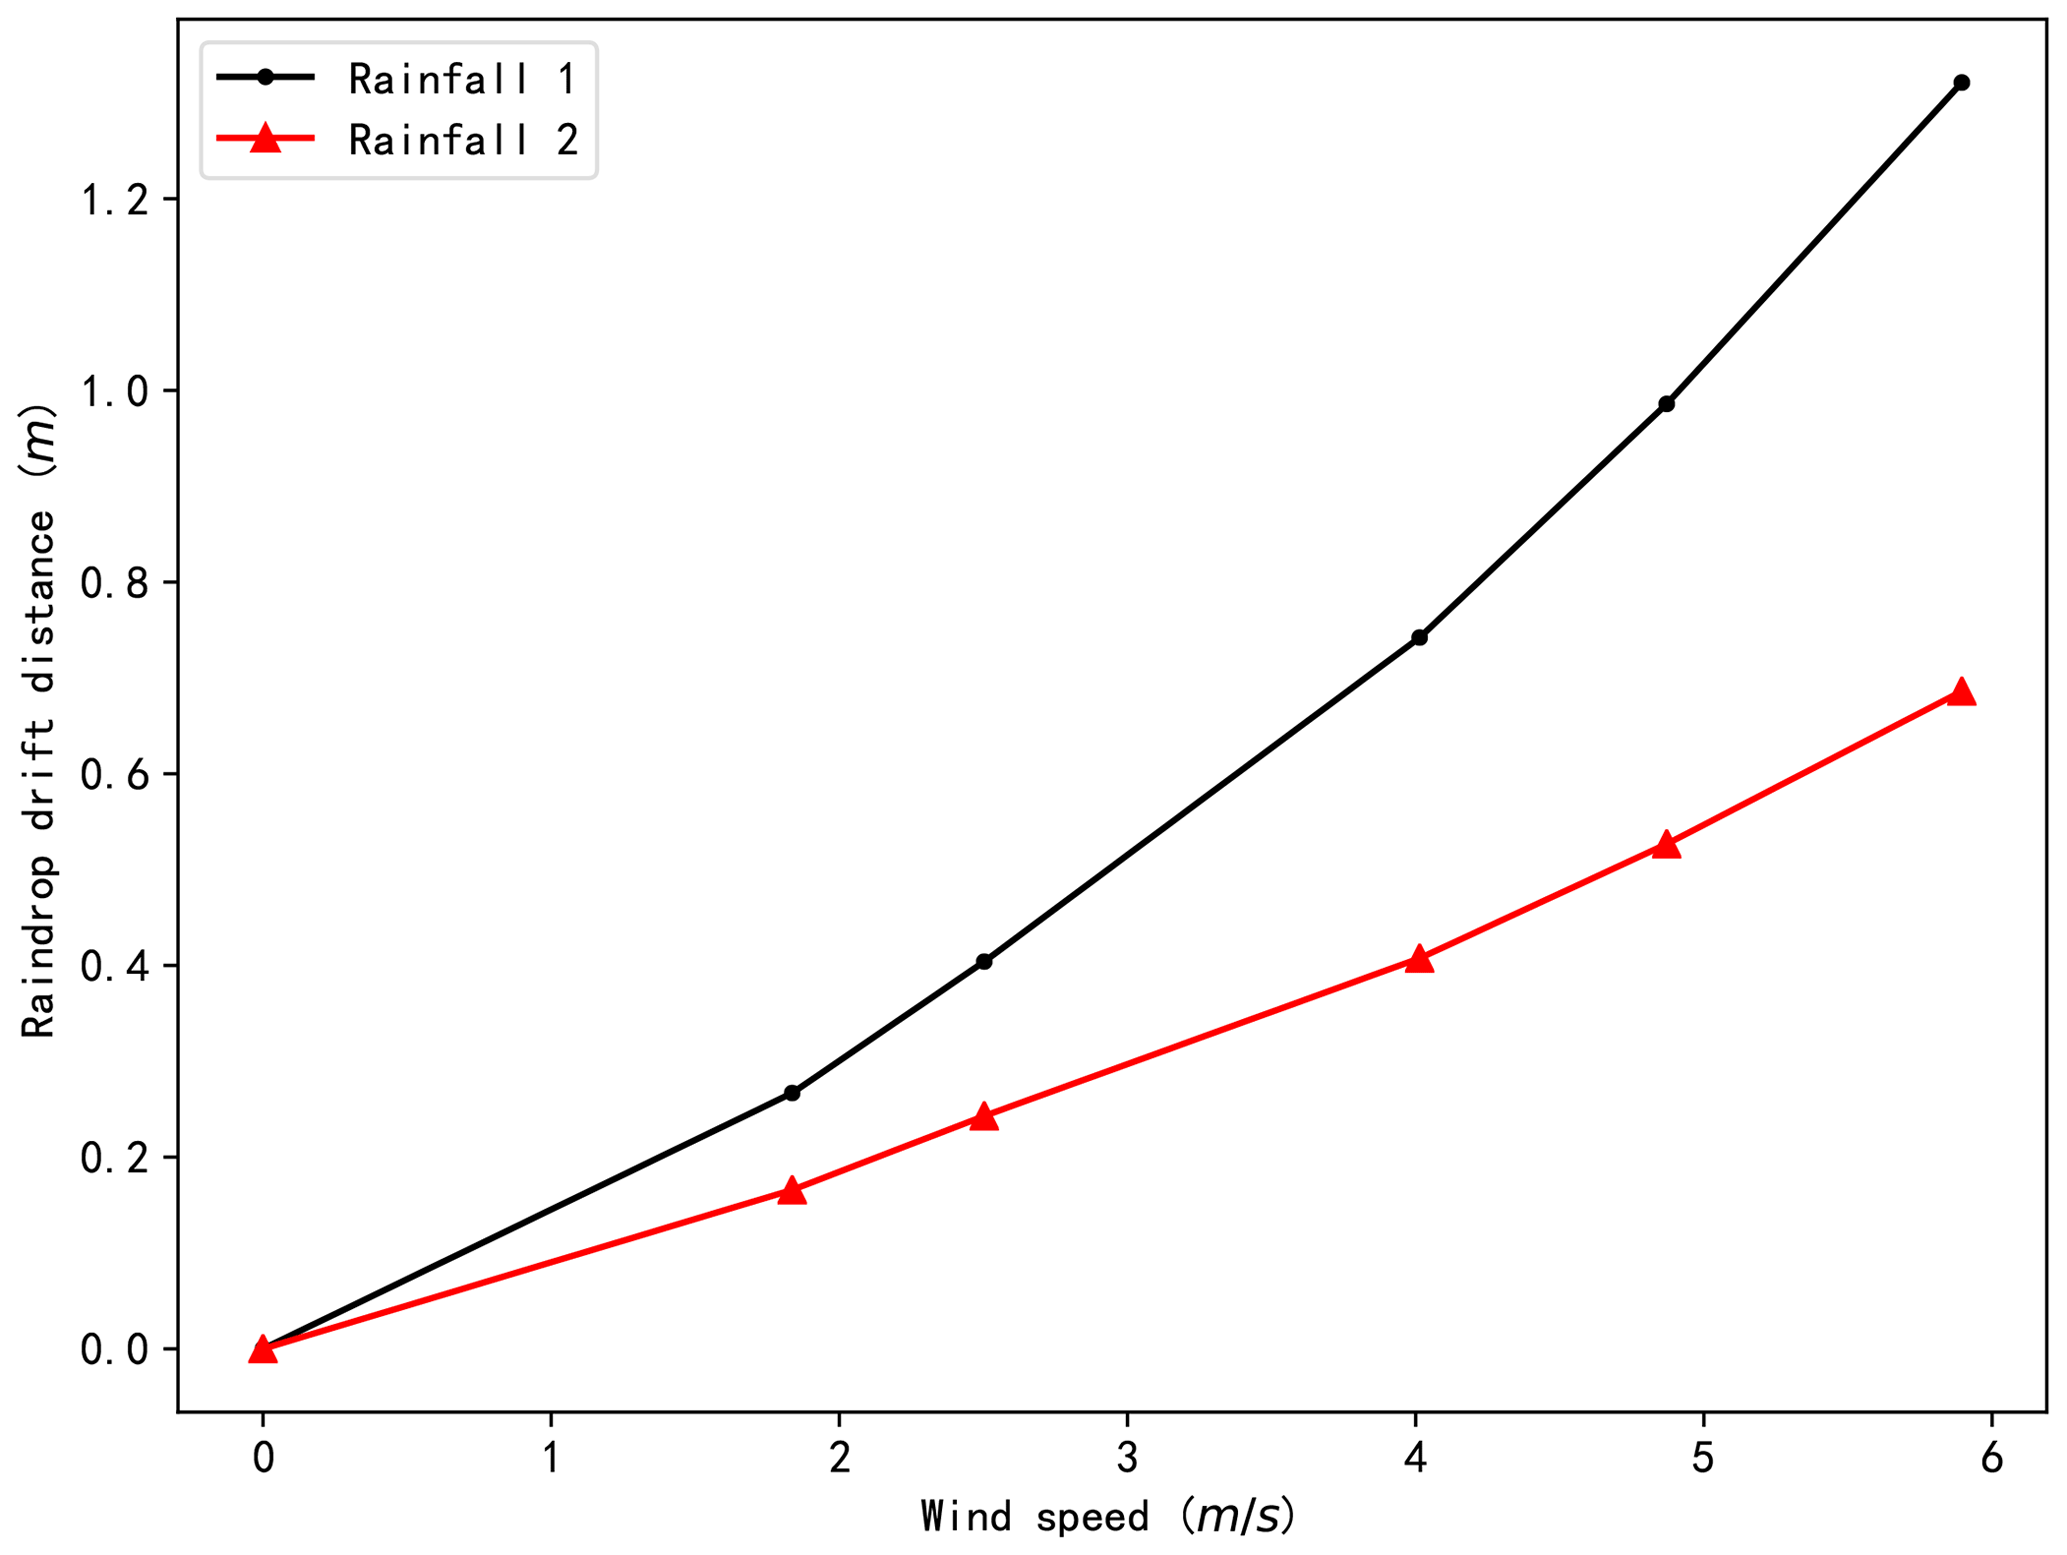
The raindrop trajectories of the different combinations of rainfall and wind speed were calculated based on the obtained wind fields. The raindrop trajectories and velocities are presented in Fig. 9 (taking rainfalls 1 and 2 under wind 5 as examples). The results indicate that the raindrops have achieved their ultimate vertical speed before reaching the scale model and drift with the wind. The final horizontal speed and drift distance of the raindrops vary with the diameter of the raindrops. A larger raindrop diameter leads to a lower horizontal velocity and shorter drift distance. The maximum horizontal speeds for rainfall 1 and rainfall 2 under wind speed 5 are 2.55 and 1.87 m s−1, respectively. The average raindrop drift distances for the two types of rainfall under different wind speeds are illustrated in Fig. 10. The figure demonstrates that the average wind drift distances for the two types of rainfall increase as the wind speed increases. The distance for rainfall 1 under wind speed 5 is 1.32 m, while that for rainfall 2 is 0.67 m. These indicate that lighter raindrops are more sensitive to wind than heavier raindrops.
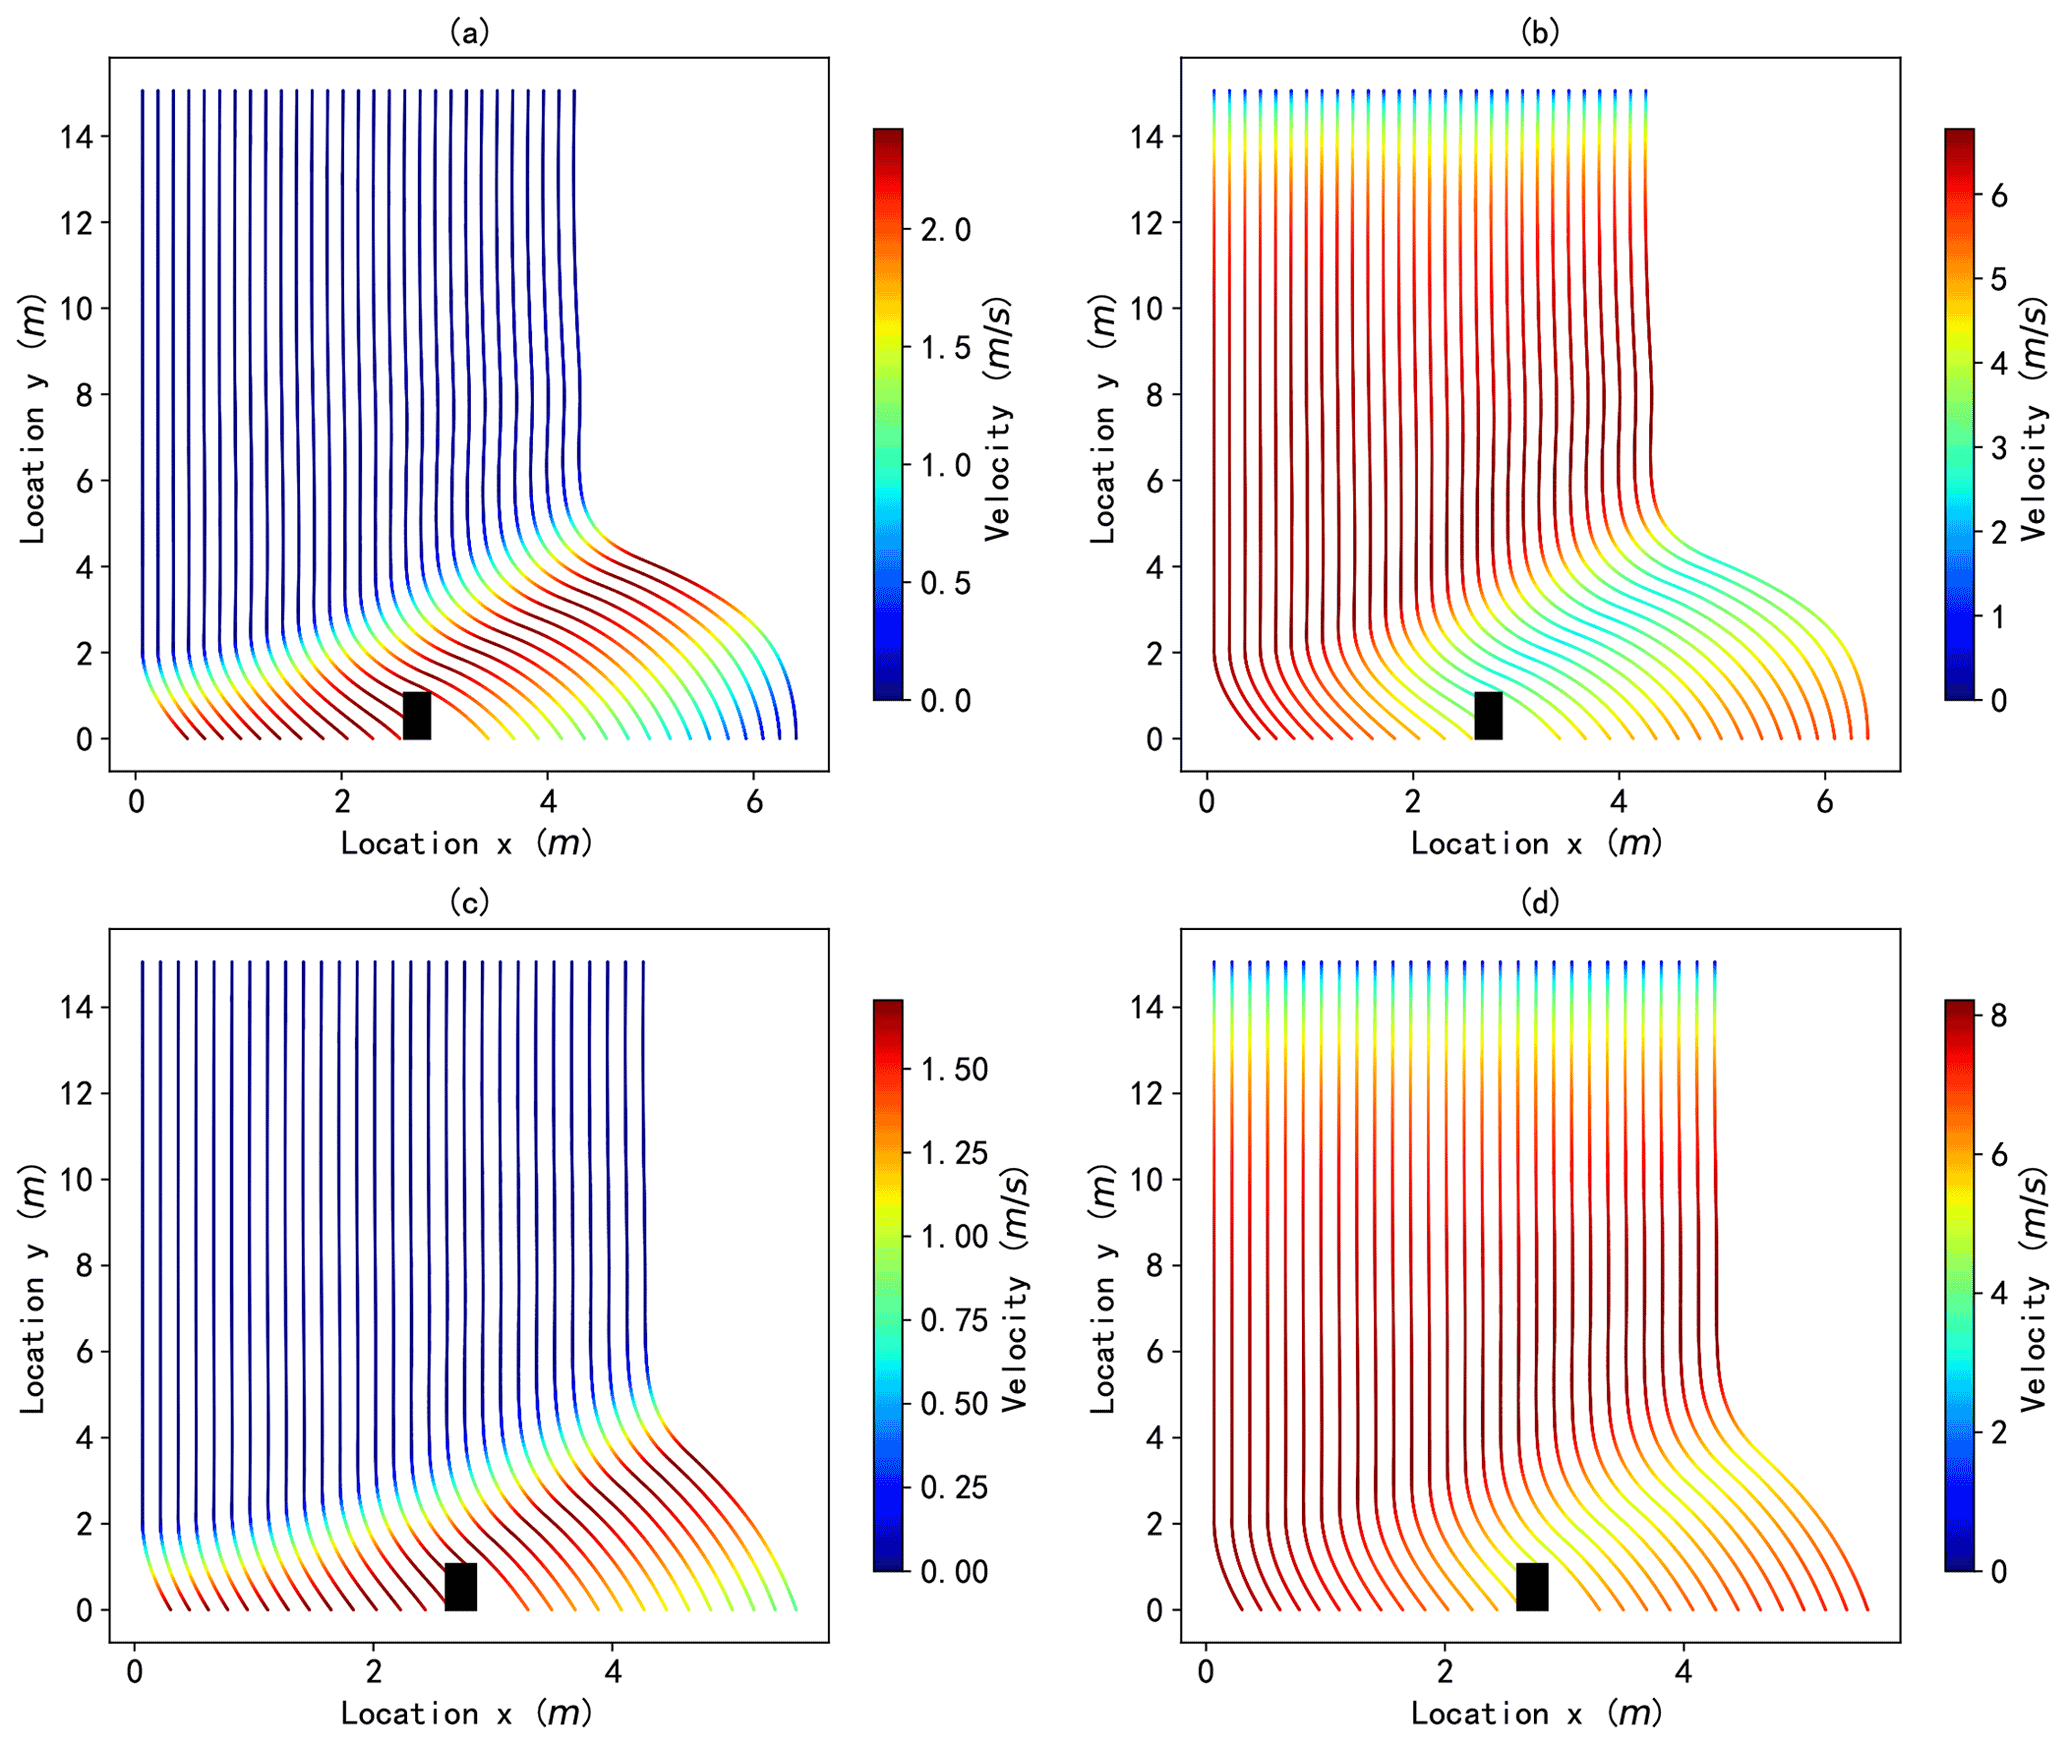
Figure 9The trajectory and velocity of raindrops. The line represents the trajectory, and the color represents the velocity. Panels (a) and (b) represent the horizontal and vertical velocities, respectively, for the drops of rainfall 1 under wind 5. Panels (c) and (d) represent the horizontal and vertical velocities, respectively, for the drops of rainfall 2 under wind 5. Location x means horizonal position, while Location y means vertical position in a 2D plane space.
The tan θ (shown in Fig. 2) for different combinations of rainfall and wind speeds were compared, and the results are presented in Fig. 11. It should be noted that the secant from the building to the ground of the raindrop trajectory, which is just across the upper corner on the leeward side of building, was used to calculate tan θ. The results demonstrate that rainfall inclination increases with wind speed for both types of rainfall and that rainfall with larger raindrops is less inclined.
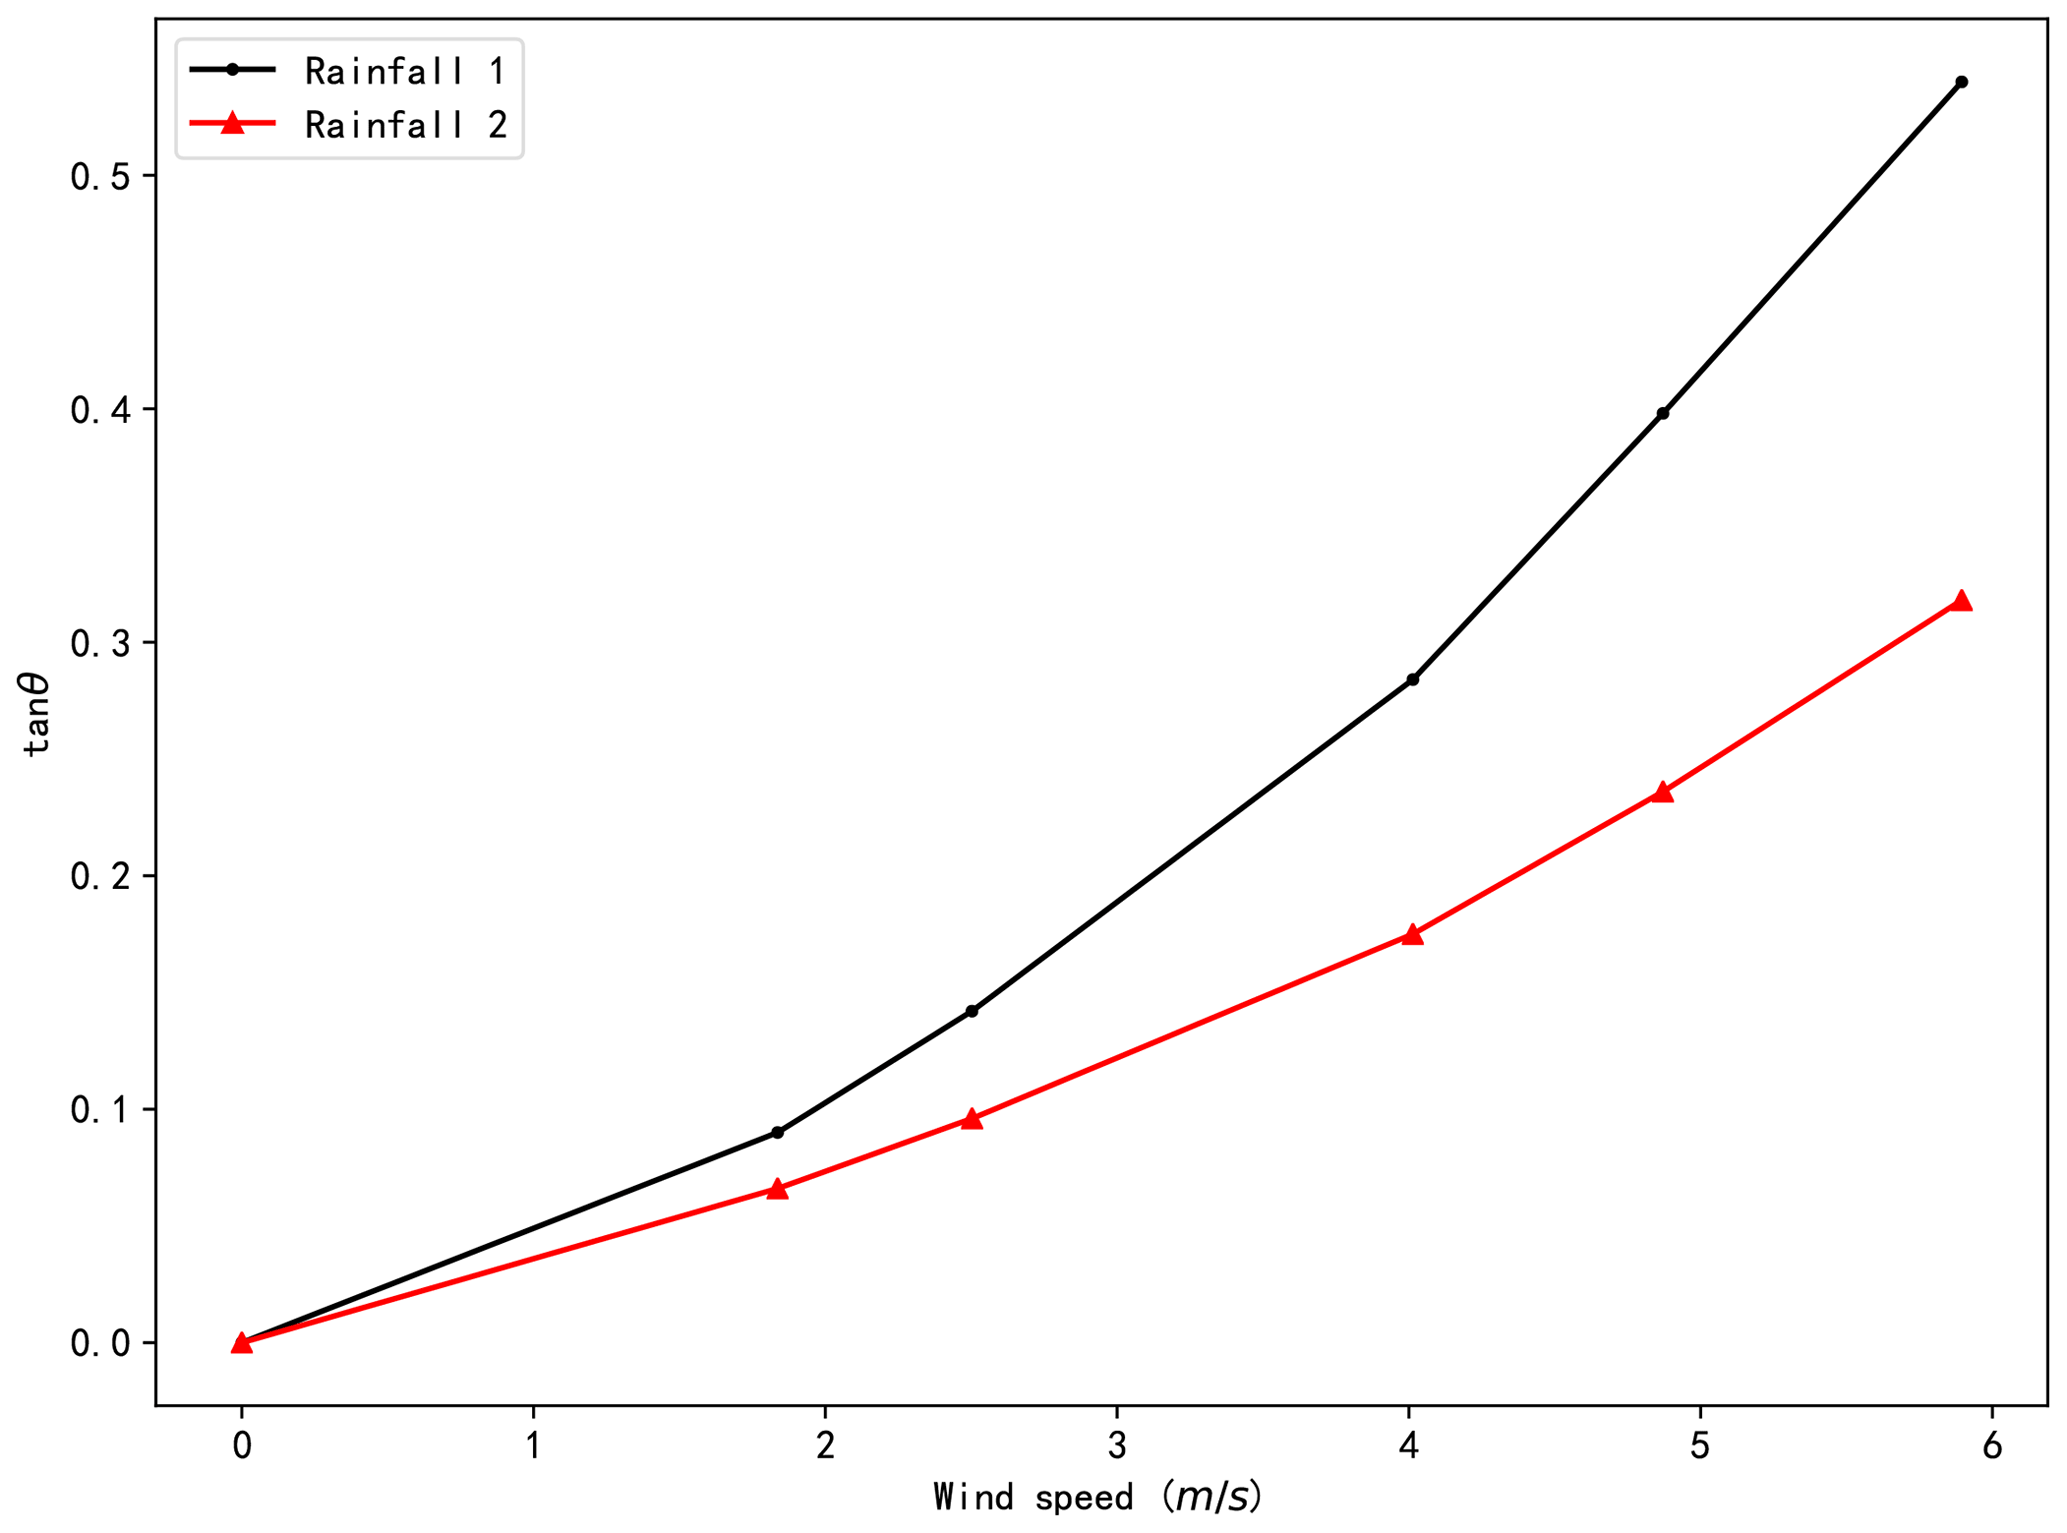
Figure 11The tangent of the raindrop trajectory inclination angle for different wind speeds under rainfalls 1 and 2.
3.3 Comparison between the theoretical and experimental results
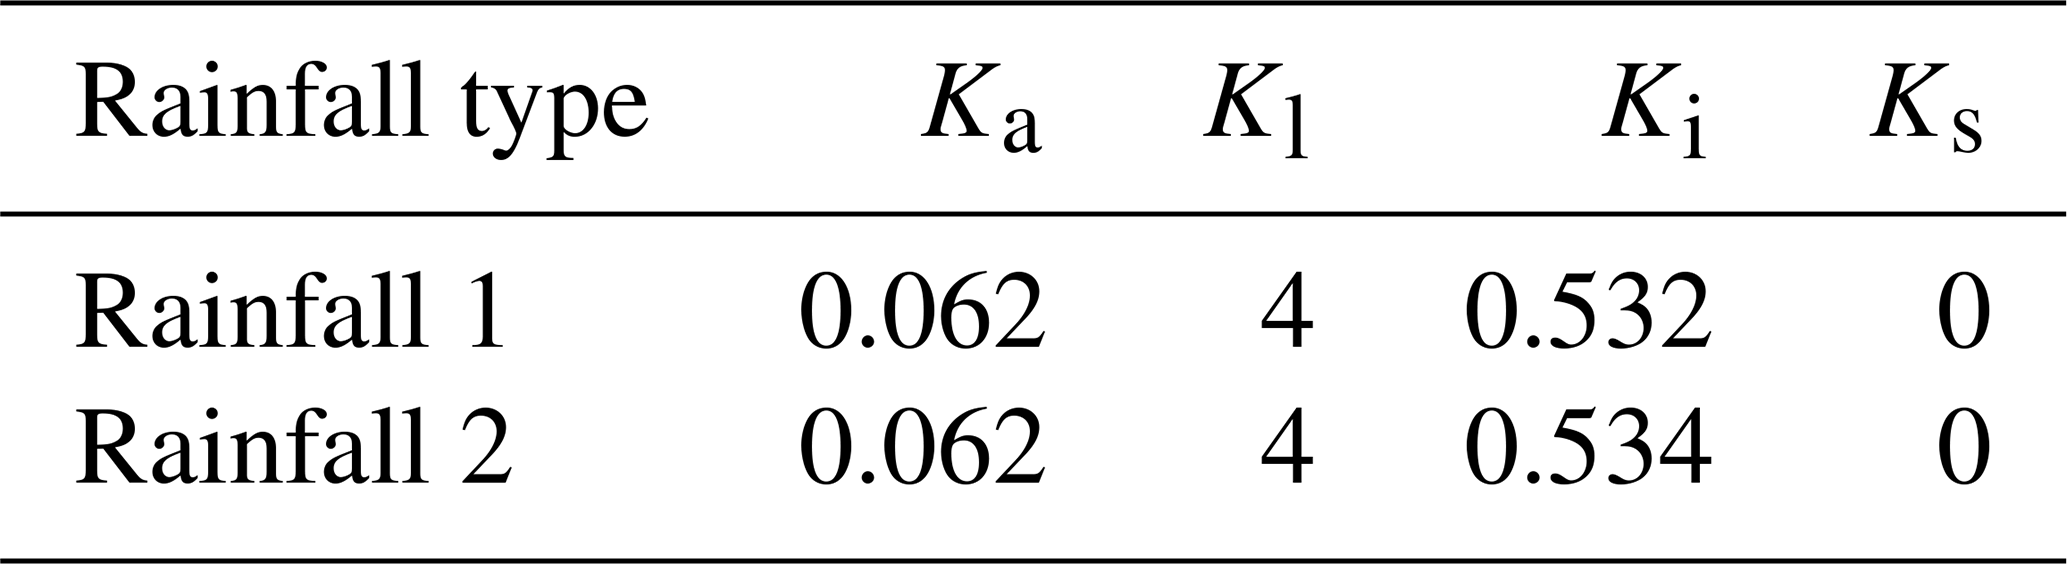
The parameters of the theoretical equation derived in Sect. 2.1 were calculated according to the laboratory experiment. The values of the parameters for the experiment are presented in Table 2. The theoretical values of the runoff coefficients for the laboratory experiment were calculated according to these parameters. As mentioned in Sect. 3.1, the runoff coefficient was used when the runoff was stable to verify the theoretical framework, so the value of Ks can be assumed to be 0. The Ki was obtained by dividing the infiltration rate by the control rainfall intensity shown in Table 1. The reason for not using the mean rainfall intensity atop the model is that infiltration occurs at the ground surface. The raindrop trajectories (Fig. 9) show that the rainfall intensity on the ground surface (the upper layer of the platform) and the control rainfall intensity are not much different, although the rainfall intensity is spatially distributed and the mean rainfall intensity is obviously less than the control rainfall intensity.
Table 2The parameters of the theoretical equation for the laboratory experiment.
The theoretical and experimental runoff coefficients for the scale model are compared in Fig. 12, with the same initial rainfall in one sub-figure. The results demonstrate that the theoretical runoff coefficients are in good agreement with the experimental values for both types of rainfall. Specifically, the theoretical runoff coefficients for rainfall 2 (with a larger raindrop diameter) are slightly more consistent with the corresponding experimental values than with rainfall 1 (with a smaller raindrop diameter). The relative bias between the theoretical and experimental runoff coefficients is 0.09 % for rainfall 1 and 0.03 % for rainfall 2, which means that the proposed theory reflects the experiment well.

Figure 12Comparison between the theoretical and experimental runoff coefficients for different wind speeds under rainfall types 1 (a) and 2 (b).
One finding of the experiment indicates that the rainfall intensity atop the scale model decreases with the increase in the wind speed. Figures 9 and 10 can explain the decrease in rainfall intensity caused by wind. The figures show that the rainfall area increases as wind speed increases, resulting in a decrease in rainfall intensity according to the law of conservation of mass. Another significant finding of the experiment is that the runoff coefficient increases as the wind speed increases. This phenomenon occurs due to the inclination of raindrop trajectories to increase in conjunction with the increase in wind speed. The increase in the raindrop trajectory inclination leads to more rainfall being intercepted by impervious building walls. The rainfall intercepted by walls flows directly into the drainage system, resulting in less infiltration. Therefore, the proportion of runoff and thus the runoff coefficient increase with the increase in wind speed.
In this study, the distance between buildings is assumed to be large enough to render the impact of interactions between buildings insignificant. In most urban areas, such assumptions are justified because the space between buildings should meet the requirements of plot ratio and daylight factors. However, in extreme situations, e.g., if the wind is strong and the raindrop size is small, interactions between buildings cannot be ignored. In these situations, the projection of the building overlaps with the adjacent building, and the bhtan θCFD does not reflect the actual area where the rainfall is intercepted by the building wall. When ignoring these interactions between buildings, the impact of wind on runoff generation will be exaggerated. To address this problem, we can consider interactions between buildings by modifying tan θ as follows:
where tan θCFD is the tangent of the rainfall inclination obtained from the CFD model, tan θ is the tangent of the rainfall inclination used in Eq. (14), n is the number of buildings in the scale model, w is the interval between the buildings in the scale model, and h is the height of the buildings. It should be noted that the method proposed by Eq. (20) considers only the overlapping shading of buildings and cannot reduce errors from changes in the local wind field caused by surrounding buildings.
Scaling effects in physical model experiments are very important and need to be carefully considered. The scaling question here is complicated due to at least two scaling aspects existing. The raindrop behavior in the wind stream would scale with Reynolds based on drop size (roughly 1:1), while the flow field across the building should scale with Reynolds based on building size (roughly 1:100). In this study, the wind speeds are designed according to the former scaling since the raindrop behavior is the main controlling factor of the experiment.
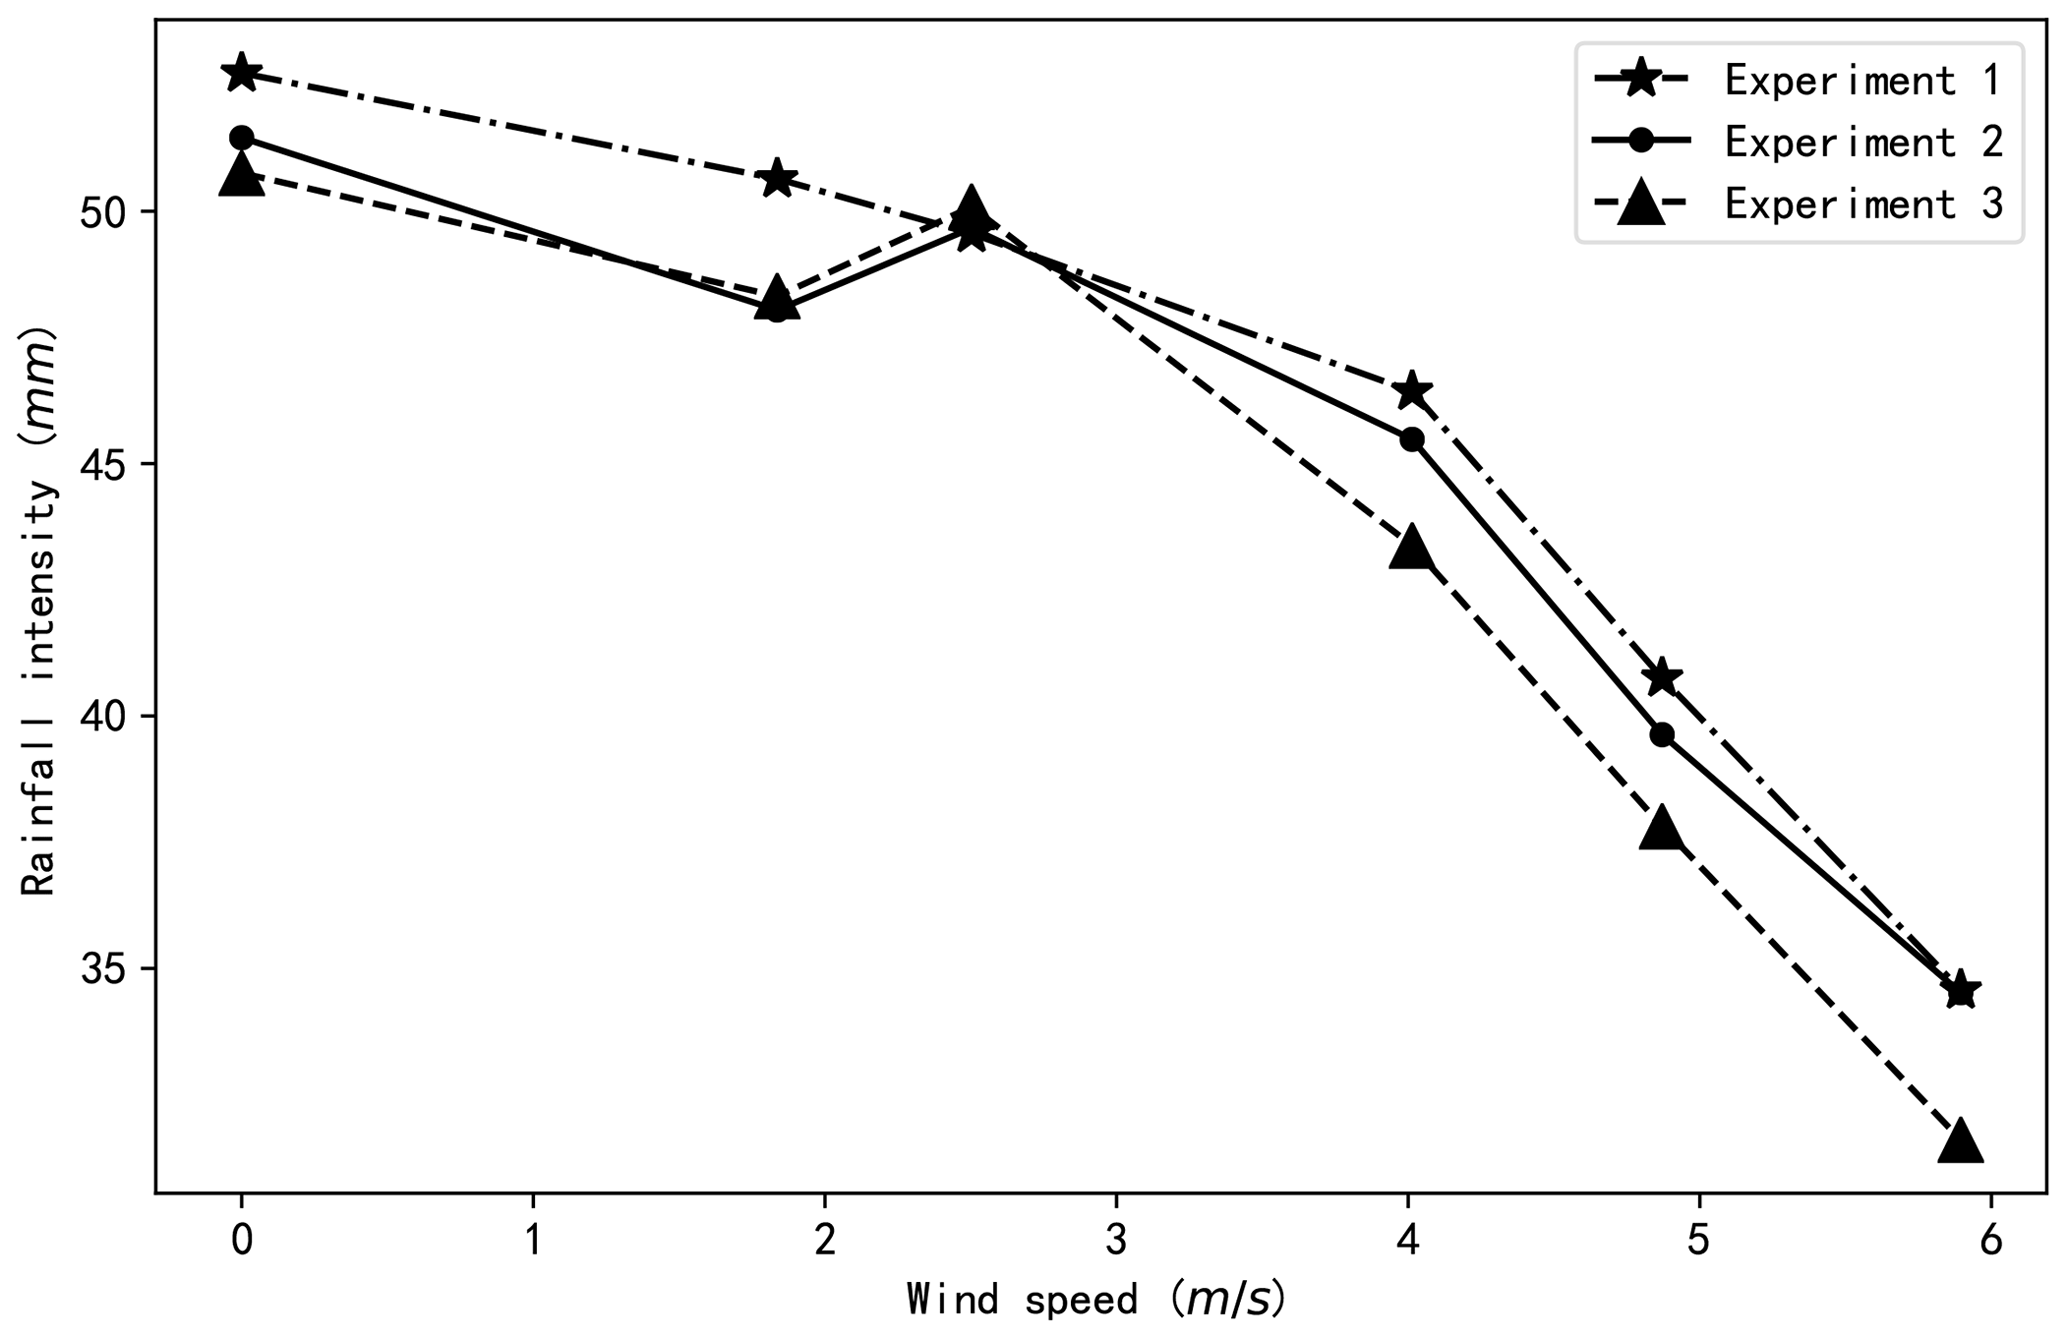
Figure 13The rainfall intensity atop the scale model under different wind speeds for rainfall 1 of three replicate trials.
Uncertainties are inevitable in experiments. For example, the theoretical and experimental runoff coefficients shown in Fig. 12 are not completely consistent. These may be caused by experimental errors. In the study, each experiment was repeated three times, and the average of two or three results was regarded as the final result of the experiment, according to the rules delineated in Sect. 2.3.2. The use of the average values conceals the uncertainty of the experiment. Here, we use the actual rainfall intensity atop the model for rainfall 1 as an example to illustrate the uncertainty of the experiment, considering that the main source of the error is the turbulence of the wind and that rainfall with small droplets is more easily affected by the wind. Rainfall intensity rather than the runoff coefficient is used as an example because the rainfall intensity is directly affected by the turbulence of the wind. Results of the relationship between the actual rainfall intensity and the wind speed for rainfall 1 are presented in Fig. 13. The figure illustrates that the differences between the actual rainfall intensity for a certain wind speed are relatively small. The relative standard deviations (RSDs) for the experimental values under different wind speeds are all less than 5 %. Such minimal uncertainty may be unexpected since turbulence is an inherent property of the wind and raindrop trajectories may be different in different experiments affected by the turbulence of the wind. However, the rainfall intensity used in this study was determined from the water collected by the water tanks and was the average value of the rainfall intensity atop the scale model. Therefore, only the oscillation of raindrops near the edges of the scale model has an influence on the average rainfall intensity. Regardless, the accumulation of the rainfall over time can reduce the error caused by the oscillation of raindrops near the edges of the scale model, since the oscillation of raindrops caused by the wind turbulence can compromise them.
When deriving the relationship between the runoff coefficient and rainfall inclination, the raindrop sizes in a rainfall event were assumed to be the same in order to simplify the problem. However, a natural rainfall event consists of raindrops with different sizes. Therefore, many different raindrop trajectories can be found in a natural rainfall event for a specific wind speed, and the rainfall inclination angle used in Eq. (17) is no longer a fixed value. To further explore this, raindrop size distribution should be introduced in further studies. Prior studies have shown that raindrop size distribution follows some empirical formulae (Best, 1950). By incorporating raindrop size distribution, the distribution of rainfall inclination angle in natural rainfall can be obtained and the representative rainfall inclination angle that reflects real situations can be derived (Dai and Han, 2014; Dai et al., 2019). Another important assumption was made that raindrop trajectories are a group of parallel straight lines and are not disturbed by the deformation of the wind field near buildings. Under actual conditions, raindrop trajectories are not straight lines, as seen in Fig. 9. In this situation, the inclination angle of the raindrop trajectory in the front of the building is not necessarily the same as the inclination angle of the secant from the building to the ground of the raindrop trajectory, which is just across the upper corner on the leeward side of the building. In such a case, θ in Eq. (14) may be not the same as in Eq. (15), which introduces errors in Eq. (16). However, the error can be ignored from the perspective of the total rainfall falling on the wall because of the inconsistency of the inclination angles, which counteract each other to some extent. The ratio of infiltration and rainfall is an important parameter in Eq. (17), and the larger ratio leads to the bigger runoff coefficient. In this study, the infiltration of the wall was assumed to be 0, which may not be reasonable in all real-world situations (Domínguez-Hernández et al., 2017). In further studies, the initial loss of building walls should be considered. Under such circumstances, the infiltration in Eq. (17) should be the relative value of the infiltrations of the ground and the wall; i.e., the infiltration of the wall is subtracted from the infiltration of the ground.
This study indicates that wind can increase the runoff coefficient in urban areas. However, the impact of wind on the runoff generation has never been considered in urban hydrological simulations, which may lead to the underestimation of peak flow in urban areas and risks to urban flood control. In the future, new hydrological models should be developed to consider the impact of wind on the runoff generation in urban areas. Moreover, this study provides a new perspective for low-impact development (LID) in urban areas. Most traditional LID facilities focus on horizontal planes in urban areas, such as roofs, roads, and the ground. We can learn from this study that walls of buildings are also sites that generate runoff, which supports the development of LID facilities that can be used on building walls. These facilities can be used to purify and reduce runoff as well as to regulate the thermal environment of buildings.
In this study, the relationship between wind and the rainfall–runoff process in urban high-rise building areas was explored. A theoretical framework, including a CFD method to determine the relationship between wind speed and rainfall inclination and a newly derived equation to describe the relationship between rainfall inclination and the runoff coefficient, was developed. A laboratory scale model experiment was conducted to verify the proposed framework. The main results are that (1) the runoff coefficient calculated by the proposed theoretical framework is highly consistent with that obtained from the laboratory experiment, (2) the runoff coefficient of urban high-rise building areas increases with wind speed and the increase rate is linear with that of the tangent of the rainfall inclination angle, and (3) the runoff coefficient of rainfall with larger raindrop size is less influenced by wind flow than that of rainfall with smaller raindrop size.
The experimental data are available at https://github.com/pandagxc/building-areas-runoff.git (Gao, 2021).
XG and ZY designed the research; XG and KG performed the research; XG and QZ analyzed the data; XG, ZY, DH, and QZ wrote the paper.
The contact author has declared that neither they nor their co-authors have any competing interests.
Publisher's note: Copernicus Publications remains neutral with regard to jurisdictional claims in published maps and institutional affiliations.
Thanks to the authors of Matplotlib for providing an instrument for the visualization works. The authors would like to extend great thanks to the anonymous reviewers, who provide many valuable pieces of advice for the improvement of the paper.
This study was financially supported by the National Key Research and Development Project (2018YFC1508201), the National Natural Science Foundation of China (51739011 and 51879274), the Research Fund of the State Key Laboratory of Simulation and Regulation of Water Cycle in River Basin, China Institute of Water Resources and Hydropower Research (2020ZY03), and the Program of China Scholarships Council (201908110323).
This paper was edited by Yue-Ping Xu and reviewed by two anonymous referees.
Best, A.: The size distribution of raindrops, Q. J. Roy. Meteor. Soc., 76, 16–36, https://doi.org/10.1002/qj.49707632704, 1950.
Blocken, B. and Carmeliet, J.: Driving rain on building envelopes – I. Numerical estimation and full-scale experimental verification, J. Therm. Envel. Build. Sci., 24, 61–85, https://doi.org/10.1177/109719630002400104, 2000a.
Blocken, B. and Carmeliet, J.: Driving rain on building envelopes – II. Representative experimental data for driving rain estimation, J. Therm. Envel. Build. Sci., 24, 89–110, https://doi.org/10.1106/EGXC-T4CL-E8VN-9JRL, 2000b.
Blocken, B. and Carmeliet, J.: A review of wind-driven rain research in building science, J. Wind Eng. Ind. Aerod., 92, 1079–1130, https://doi.org/10.1016/j.jweia.2004.06.003, 2004.
Blocken, B. and Carmeliet, J.: High-resolution wind-driven rain measurements on a low-rise building – experimental data for model development and model validation, J. Wind Eng. Ind. Aerod., 93, 905–928, https://doi.org/10.1016/j.jweia.2005.09.004, 2005.
Blocken, B. and Carmeliet, J.: On the accuracy of wind-driven rain measurements on buildings, Build Environ., 41, 1798–1810, https://doi.org/10.1016/j.buildenv.2005.07.022, 2006.
Blocken, B., Derome, D., and Carmeliet, J.: Rainwater runoff from building facades: A review, Build Environ., 60, 339–361, https://doi.org/10.1016/j.buildenv.2012.10.008, 2013.
Choi, E.: Simulation of wind-driven-rain around a building, J. Wind Eng. Ind. Aerod., 46–47, 721–729, https://doi.org/10.1016/B978-0-444-81688-7.50080-2, 1993.
Choi, E.: Determination of wind-driven-rain intensity on building faces, J. Wind Eng. Ind. Aerod., 51, 55–69, https://doi.org/10.1016/0167-6105(94)90077-9, 1994a.
Choi, E.: Numerical modelling of gust effect on wind-driven rain, J. Wind Eng. Ind. Aerod., 72, 107–116, https://doi.org/10.1016/S0167-6105(97)00246-8, 1997.
Choi, E. C.: Parameters affecting the intensity of wind-driven rain on the front face of a building, J. Wind Eng. Ind. Aerod., 53, 1–17, https://doi.org/10.1016/0167-6105(94)90015-9, 1994b.
Cristiano, E., ten Veldhuis, M.-C., and van de Giesen, N.: Spatial and temporal variability of rainfall and their effects on hydrological response in urban areas – a review, Hydrol. Earth Syst. Sci., 21, 3859–3878, https://doi.org/10.5194/hess-21-3859-2017, 2017.
Dai, Q. and Han, D.: Exploration of discrepancy between radar and gauge rainfall estimates driven by wind fields, Water Resour. Res., 50, 8571–8588, https://doi.org/10.1002/2014WR015794, 2014.
Dai, Q., Yang, Q., Han, D., Rico-Ramirez, M. A., and Zhang, S.: Adjustment of radar-gauge rainfall discrepancy due to raindrop drift and evaporation using the Weather Research and Forecasting model and dual-polarization radar, Water Resour. Res., 55, 9211–9233, https://doi.org/10.1029/2019WR025517, 2019.
Domínguez-Hernández, J., Pérez-Bella, J. M., Alonso-Martínez, M., Cano-Suñén, E., and del Coz-Díaz, J.: Assessment of water penetration risk in building facades throughout Brazil, Build. Res. Inf., 45, 492–507, https://doi.org/10.1080/09613218.2016.1183441, 2017.
Gao, X.: Experimental data, available at: https://github.com/pandagxc/building-areas-runoff, last access: November 2021.
Gunn, R. and Kinzer, G. D.: The terminal velocity of fall for water droplets in stagnant air, J. Meteorol., 6, 243–248, https://doi.org/10.1175/1520-0469(1949)006<0243:TTVOFF>2.0.CO;2, 1949.
Hangan, H.: Wind-driven rain studies. A C-FD-E approach, J. Wind Eng. Ind. Aerod., 81, 323–331, https://doi.org/10.1016/S0167-6105(99)00027-6, 1999.
Hanjalić, K. and Launder, B. E.: A Reynolds stress model of turbulence and its application to thin shear flows, J. Fluid Mech., 52, 609–638, https://doi.org/10.1017/S002211207200268X, 1972.
Isidoro, J. M., de Lima, J. L., and Leandro, J.: Influence of wind-driven rain on the rainfall-runoff process for urban areas: Scale model of high-rise buildings, Urban Water J., 9, 199–210, https://doi.org/10.1080/1573062X.2012.654801, 2012.
Kavetski, D., Kuczera, G., and Franks, S. W.: Bayesian analysis of input uncertainty in hydrological modeling: 1. Theory, Water Resour. Res., 42, W03407, https://doi.org/10.1029/2005WR004368, 2006.
Kubilay, A., Derome, D., Blocken, B., and Carmeliet, J.: High-resolution field measurements of wind-driven rain on an array of low-rise cubic buildings, Build Environ., 78, 1–13, https://doi.org/10.1016/j.buildenv.2014.04.004, 2014.
Lakehal, D., Mestayer, P., Edson, J., Anquetin, S., and Sini, J.-F.: Eulero-Lagrangian simulation of raindrop trajectories and impacts within the urban canopy, Atmos. Environ., 29, 3501–3517, https://doi.org/10.1016/1352-2310(95)00202-A, 1995.
Launder, B. E. and Spalding, D. B.: The numerical computation of turbulent flows, in: Numerical prediction of flow, heat transfer, turbulence and combustion, Elsevier, Pergamon, 96–116, 1983.
Nore, K., Blocken, B., Jelle, B. P., Thue, J. V., and Carmeliet, J.: A dataset of wind-driven rain measurements on a low-rise test building in Norway, Build Environ., 42, 2150–2165, https://doi.org/10.1016/j.buildenv.2006.04.003, 2007.
Ochoa-Rodriguez, S., Wang, L.-P., Gires, A., Pina, R. D., Reinoso-Rondinel, R., Bruni, G., Ichiba, A., Gaitan, S., Cristiano, E., and van Assel, J.: Impact of spatial and temporal resolution of rainfall inputs on urban hydrodynamic modelling outputs: A multi-catchment investigation, J. Hydrol., 531, 389–407, https://doi.org/10.1016/j.jhydrol.2015.05.035, 2015.
Smith, M. B., Koren, V. I., Zhang, Z., Reed, S. M., Pan, J.-J., and Moreda, F.: Runoff response to spatial variability in precipitation: an analysis of observed data, J. Hydrol., 298, 267–286, https://doi.org/10.1016/j.jhydrol.2004.03.039, 2004.
Syed, K. H., Goodrich, D. C., Myers, D. E., and Sorooshian, S.: Spatial characteristics of thunderstorm rainfall fields and their relation to runoff, J. Hydrol., 271, 1–21, https://doi.org/10.1016/S0022-1694(02)00311-6, 2003.
Tominaga, Y., Mochida, A., Yoshie, R., Kataoka, H., Nozu, T., Yoshikawa, M., and Shirasawa, T.: AIJ guidelines for practical applications of CFD to pedestrian wind environment around buildings, J. Wind Eng. Ind. Aerod., 96, 1749–1761, https://doi.org/10.1016/j.jweia.2008.02.058, 2008.
Wang, H., Hou, X., and Deng, Y.: Numerical simulations of wind-driven rain on building facades under various oblique winds based on Eulerian multiphase model, J. Wind Eng. Ind. Aerod., 142, 82–92, 2015.
Yuan, F., Zhang, J. Z., Wang, J., and Wang, R.: Variation characteristics of intensity and pattern of short duration rainstorm in Beijing under the background of climate change, Transactions of Atmospheric Sciences, 43, 802–809, https://doi.org/10.13878/j.cnki.dqkxxb.20191129001, 2021 (in Chinese).
Yoo, C., Cho, E., Na, W., Kang, M., and Lee, M.: Change of rainfall–runoff processes in urban areas due to high-rise buildings, J. Hydrol., 597, 126155, https://doi.org/10.1016/j.jhydrol.2021.126155, 2021.
Zhou, J., Liu, J., Wang, H., Wang, Z., and Mei, C.: Water dissipation mechanism of residential and office buildings in urban areas, Sci. China Ser. E, 61, 1072–1080, https://doi.org/10.1007/s11431-017-9193-8, 2018.
Zhou, J., Liu, J., Yan, D., Wang, H., Wang, Z., Shao, W., and Luan, Y.: Dissipation of water in urban area, mechanism and modelling with the consideration of anthropogenic impacts: A case study in Xiamen, J. Hydrol., 570, 356–365, https://doi.org/10.1016/j.jhydrol.2018.12.054, 2019.