the Creative Commons Attribution 4.0 License.
the Creative Commons Attribution 4.0 License.
 | 03 Nov 2021
Land use and climate change effects on water yield from East African forested water towers
Charles Nduhiu Wamucii
Pieter R. van Oel
Arend Ligtenberg
John Mwangi Gathenya
Adriaan J. Teuling
East African forested mountain regions are vital in generating and supplying water resources to adjacent arid and semi-arid lowlands. However, these ecosystems are under pressure from both climate and land use changes. This study aimed to analyze the effects of climate and land use changes on water yield using the Budyko framework as a first-order conceptual framework assuming steady-state for pristine/protected forested areas. For nine selected forested water towers in East Africa, the amount and distribution of water resources and their decadal changes were analyzed. Results show that most areas inside and outside the water towers are under pressure from human influences. Water yield was more sensitive to climate changes compared to land use changes within the selected East African water towers themselves. However, for the surrounding lowlands, the effects of land use changes had greater impacts on water yield. We conclude that the East African water towers have seen a strong shift towards wetter conditions, especially in the period of 2011–2019, while, at the same time, the potential evapotranspiration is gradually increasing. Given that most of the water towers were identified as non-resilient to these changes, future water yield is likely to also experience more extreme variations.
- Article
(3722 KB) - Full-text XML
- BibTeX
- EndNote


Many mountainous areas act as water towers by generating and supplying runoff and streamflow to adjacent lowlands that would otherwise be much drier. Beyond the supply of water, the elevated water towers maintain high actual evapotranspiration, hence playing a key role in regional rainfall recycling (WWF, 2005). Water towers have been defined in various ways. Viviroli et al. (2007) categorized water towers into four types, namely essential, supportive, occasional, and limited water towers, based on their contribution to downstream discharge. Dewi et al. (2017) introduced the following quantification criterion for defining water towers as an area that satisfies two conditions: (a) an aridity–humidity index (i.e., a ratio of precipitation to potential evapotranspiration) of above 0.65 and (b) where the aridity–humidity index relative to the elevation is greater than 2.77. Immerzeel et al. (2020) introduced a global Water tower Index (WTI), which ranks water towers in terms of their water-supplying role and the downstream dependence of ecosystems and society. The United Nations Environment Programme (UNEP, 2010) defined water towers as elevated areas of land (generally at least 200 m above the surrounding area) that receive at least 750 mm of rainfall and 250 mm of runoff per year and are significant water sources for populations beyond their immediate delineated boundaries.
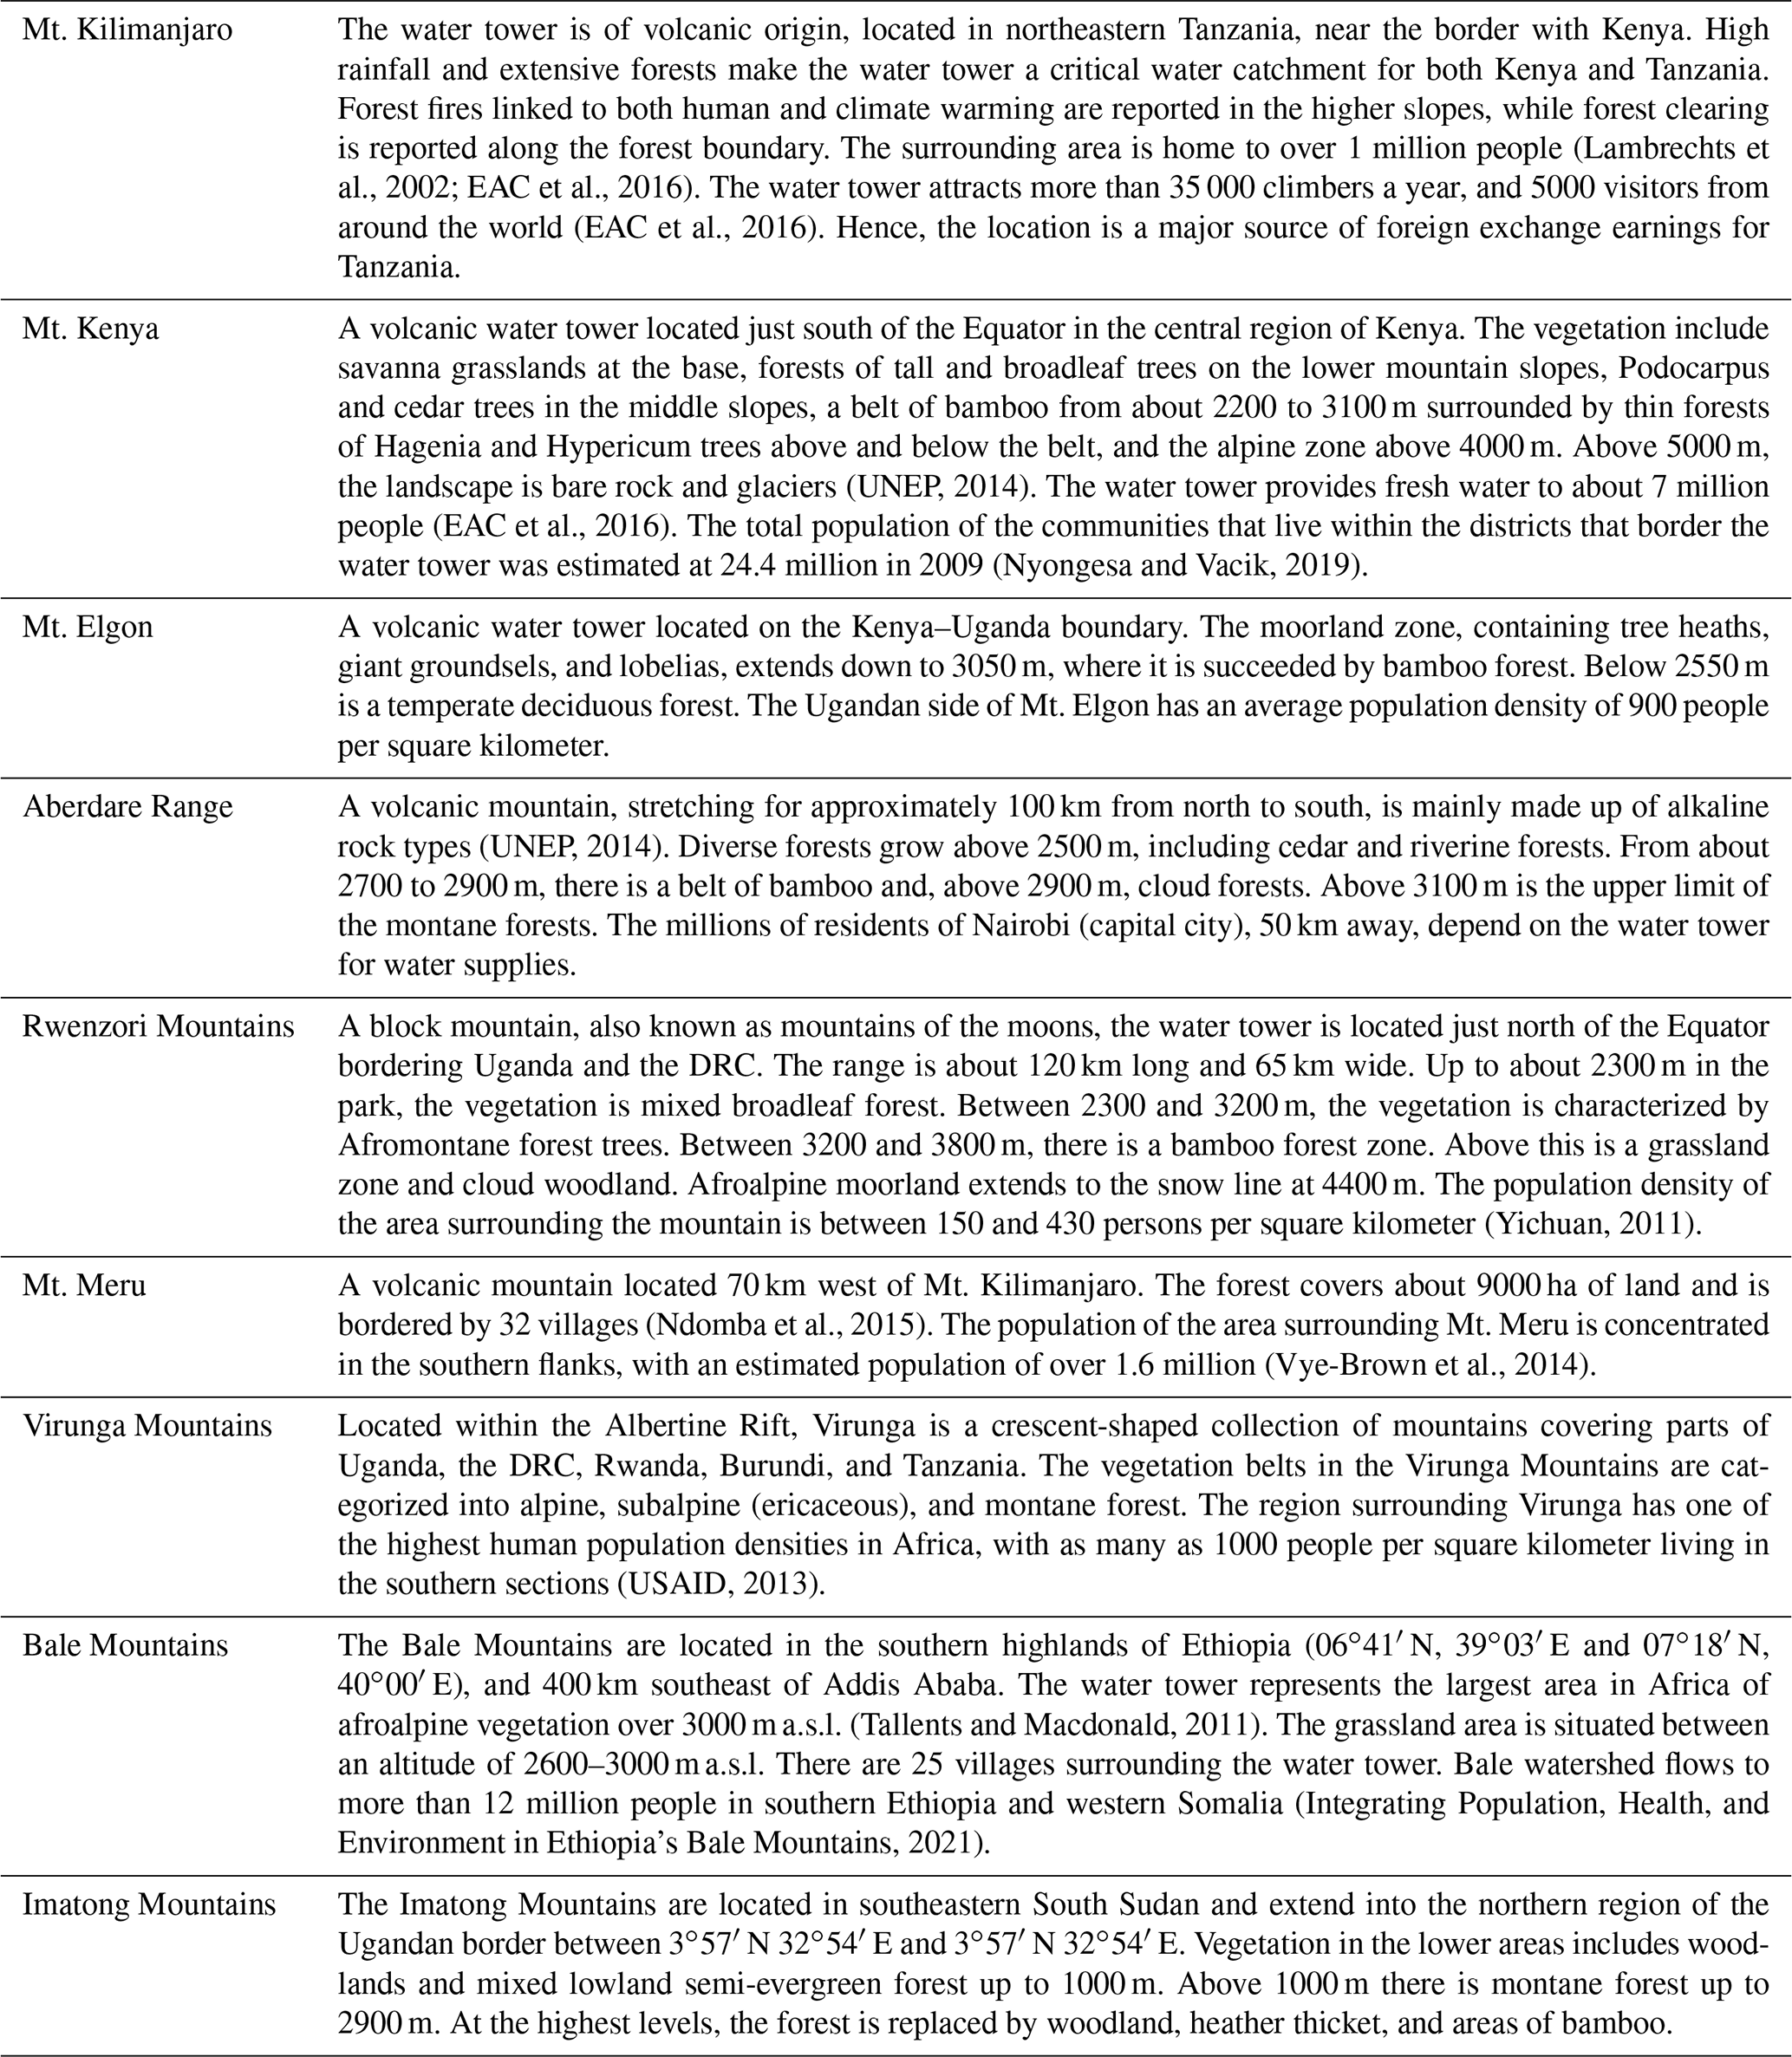
What is evident in all definitions is that high elevation and high precipitation are key components that determine the generation of streamflow to the drier lowland areas – an important aspect for arid and semi-arid areas in the East African region. EAC et al. (2016) defined the key water towers based on major rivers in East Africa and delineated the following three major montane forest ecosystems: the Albertine Rift, the Kenyan highlands, and the Ethiopian Highlands. Although research on water towers has focused mainly on glaciated mountain chains (Immerzeel et al., 2020) where the temperature is a key factor in determining water flows from glaciated mountain chains, there is growing awareness that forested mountains can provide similar services (Viviroli and Weingartner, 2004). Mountainous areas in Africa cover approximately 20 % of Africa's surface area and maintain significantly more precipitation than adjacent lowlands (UNEP, 2014; EAC et al., 2016). Mountain forests capture, store, purify, and release water to lowland areas (UNEP, 2014). The East African region is one of the most mountainous areas of Africa, with several peaks above 4500 m, and hosts the three highest mountains on the continent, namely Mt. Kilimanjaro (5895 m), Mount Kenya (5119 m), and the Rwenzori Mountains (5109 m; UNEP, 2014). Many of the water towers are of volcanic origin which can be linked to the extensive plate tectonics of the East African rift system (Dawson, 2008; Scoon, 2020).
Montane forest ecosystems in the East African region are classified as water towers due to their high elevations and high humidity, thus generating water yield for adjacent lowland areas (UNEP, 2010). There is a high dependency on surface water in the East African region (Jacobs et al., 2018), but rainfall distribution is insufficient in most parts of the region, with several areas experiencing frequent severe droughts (Nicholson, 2017). El Tom (1972) tested the reliability of rainfall and showed that, in the dry areas, the rainfall is highly variable and nearly independent of the mean annual value, affecting rainfed agriculture in the region. Fluctuations in rainfall are evident in both seasonal and decadal time series mainly in the semi-arid zones (Hulme, 1990). The forested water towers in the region are, therefore, important sources of water that sustain environmental and human water demands in the dry lowland areas.
The water towers of East Africa are under pressure from human intensification and climate change (WWF, 2005; Gebrehiwot et al., 2014). According to the Intergovernmental Panel for Climate Change (IPCC) Fifth Assessment Report, the average annual temperature for Africa has risen by at least 0.5 ∘C during the last 100 years, and this is predicted to increase by approximately 3.2 ∘C by 2080. This will dramatically diminish glaciers in East African water towers, whose surface area has already decreased by 80 % since the 1990s (EAC et al., 2016), affecting runoff and water resources downstream. The East African montane forest zones continue to be lost to agriculture and other anthropogenic uses. This is mainly attributed to a high and increasing population density, which is a major driving force of environmental change in the mountainous areas (UNEP, 2014).
Understanding historical climate and human-induced land use changes and their impacts on streamflow can explain some of the hydrological events experienced in the adjacent lowlands. This can help inform the role of forested water towers in observed extremities in the lowlands, such as floods and hydrological droughts. To our knowledge, there are no studies that have focused on the East African forested water towers and their ability to generate streamflow under a changing climate and land use. At the regional scale, studies have either focused on studying forest trends such as deforestation (Aleman et al., 2018) or the effects of land use changes on climate (Otieno and Anyah, 2012). At the river basin scale, studies have focused on hydrological responses (Hyandye et al., 2018; Mango et al., 2011; Gabiri et al., 2020).
Guzha et al. (2018), in their review, emphasized the importance of forests in streamflow generation in the East African region, with forest degradation leading to increased stream discharges and surface runoff. Muthoni et al. (2019) focused on spatiotemporal trends and variability in precipitation within eastern and southern Africa. However, there is limited information on the partitioning of the available precipitation into water yield and evapotranspiration from the forested water towers of the East African region. Given the semi-arid conditions in the lowlands of the East African region, there is a need to study the sensitivity of forested water towers to changes in climate and land use.
Various approaches have been used for studying the effects of climate and land use changes on streamflow. Jiang et al. (2015) categorized such methods into the following two: (a) deterministic rainfall–runoff models and (b) statistical methods. Ma et al. (2014) combined the two categories by running rainfall statistics and recorded land use change patterns in reverse order in calibrated process-based models. Dey and Mishra (2017) reviewed the existing approaches and categorized these approaches into the following four categories; (i) experimental approach, e.g., paired catchment method (Bosch and Hewlett, 1982), (ii) hydrological modeling, e.g., SWAT (Tech, 2019), (iii) conceptual approaches, e.g., Budyko approach (Budyko, 1974), and (iv) analytical approaches, e.g., climate elasticity method (Schaake, 1990).
Generally, the different approaches can be grouped into modeling (or distributed models) and conceptual approaches (Marhaento et al., 2017; Mianabadi et al., 2020). The advantage of modeling approaches is that the results are more reliable (Booij et al., 2019). However, the challenges of modeling approaches, e.g., SWAT, is that the underlying processes must be explicit, and they require complex and multiple data inputs and time-consuming calibration and validation (Zhang et al., 2012). The application of modeling approaches is, therefore, limited to small watersheds where detailed streamflow observations are available or in watersheds that are well monitored with extensive, long-term available data on vegetation, soil, topography, land use, hydrology, and climate (Wei and Zhang, 2011). Conceptual approaches, such as Budyko frameworks, require fewer data, hence making them flexible in their application from small to large study areas, and they generally give logical primary results (Marhaento et al., 2017; Booij et al., 2019). These primary results can be very crucial for data-limited regions such as East Africa and can form the basis for detailed hydrological studies (Teng et al., 2012). In this study, we selected the Budyko framework, assuming a steady state, to analyze the impact of land use and climate changes on water yield for the selected forested water towers of East Africa.
The Budyko framework considers both water and energy constraints in hydrological processes over a long-term period. The framework has been applied to quantify or separate the impacts of climate change and human activities on runoff (Jiang et al., 2015; Xu et al., 2013; Roderick and Farquhar, 2011). A steady state is reached when the total input (i.e., precipitation) equals the total output (i.e., evapotranspiration and water yield; Han et al., 2020) and changes in soil water storage are zero (Donohue et al., 2007). Hence, a simple water balance equation assuming steady-state conditions can be written as follows:
where P is precipitation, ET is actual evapotranspiration, and Q is water yield.
The steady-state assumption of the Budyko curve has been challenged in several studies (Van der Velde et al., 2014; Donohue et al., 2007; Mianabadi et al., 2020; Du et al., 2016). Most of these studies have, however, challenged the steady-state assumption for studies focused on catchments in the lower slopes at finer temporal or spatial scales and the unreliability of the Budyko framework to predict future water cycles. In the lower slopes, the hydrological processes are under the influence of anthropogenic changes, e.g., urbanization, water abstraction, agricultural intensification, deforestation, etc. To our knowledge, the steady-state assumption has not been challenged in studies focusing on the upper slopes of the elevated forested mountains, where we assume steady-state assumptions would probably hold due to pristine conditions. Du et al. (2016) demonstrated that the basins in the upper slopes met steady-state conditions, while this was not the case for downstream basins due to human interference and water inflows from the upstream basins. In their study, Van der Velde et al. (2014) demonstrated that the climate and land use changes do not outpace the ability of the forests to adapt their water use and energy use strategies to the prevailing conditions. Han et al. (2020) studied 1057 global unimpaired catchments and showed that over 70 % of the catchments attain a steady-state within 10 years, with co-evolution between climate and vegetation coverage playing a key role in maintaining the steady-state conditions.
Generally, the Budyko framework, either in the original format (i.e., steady state) or in the modified format (i.e., non-steady-state conditions) is a quick first-order tool for estimating precipitation partitioning into evaporation and water yield (Mianabadi et al., 2020; Teng et al., 2012; Zeng et al., 2020). The framework is particularly useful in evaluating the sensitivity of water yield to changes in climate and catchment characteristics (Mianabadi et al., 2020; Liu et al., 2013; Sankarasubramanian et al., 2001; Sun et al., 2014; Yang et al., 2014; Zhang et al., 2004; Roderick and Farquhar, 2011; Creed et al., 2014; Jiang et al., 2015; Xu et al., 2013; Mwangi et al., 2016). In spite of the criticism on the validity of the Budyko model outlined before, it is being applied widely and successfully at scales ranging from coarse global grid resolution to smaller basins of less than 10 km2 (Zhang et al., 2004; Redhead et al., 2016; Teuling et al., 2019).
In this paper, we aim to use the Budyko framework to analyze the hydroclimatic changes over the past few decades, focusing on the selected forested water towers of East Africa. The selection of water towers was based on aridity index (AI), high elevation, and continuous forest block. The selected water towers have AI ≥ 0.65 (i.e., humid) and are located in high elevated areas under a continuous forest block from the foot slope contour to the peak. The montane forests are the three major forest ecosystems in East Africa, as defined and delineated by (UNEP, 2010; EAC et al., 2016), and they include the Albertine Rift, the Kenyan highlands, and the Ethiopian Highlands. They were defined and delineated based on major rivers in the region. All the selected water towers in this study fall into the three forest ecosystems. The Budyko framework was used to answer the following research question: what are the effects of climate and land use changes on water yield for the selected forested water towers?
We hypothesize that, in areas considered as being pristine or protected zones (i.e., high elevated forested areas), with AI ≥ 0.65, changes in water yield would majorly be attributed to climate changes and negligibly due to land use/cover changes. The high elevated forested areas would then be expected to fall on the theoretical Budyko curve over the study period. The water yield simulations were evaluated against observation-based runoff.
We used the Budyko conceptual framework to evaluate the impacts of land use changes and climate changes on water yield from the selected forested water towers. The study area is the East African region. The montane forest ecosystems are the major forest types in eastern Africa. They range from the Ethiopian Highlands to Albertine Rift mountains stretching along the Democratic Republic of Congo (DRC) and bordering Uganda, Rwanda, Burundi, and Tanzania. This study focused on montane forest ecosystems and their moorlands. The selected water towers are shown in Fig. 1 and summarized in Tables 1 and A2.

Figure 1The East African forest ecosystems and the location of the selected water towers (adapted from The Nature Conservancy, 2012).
Table 1The selected water towers of East Africa. Note: a.s.l. – above sea level.
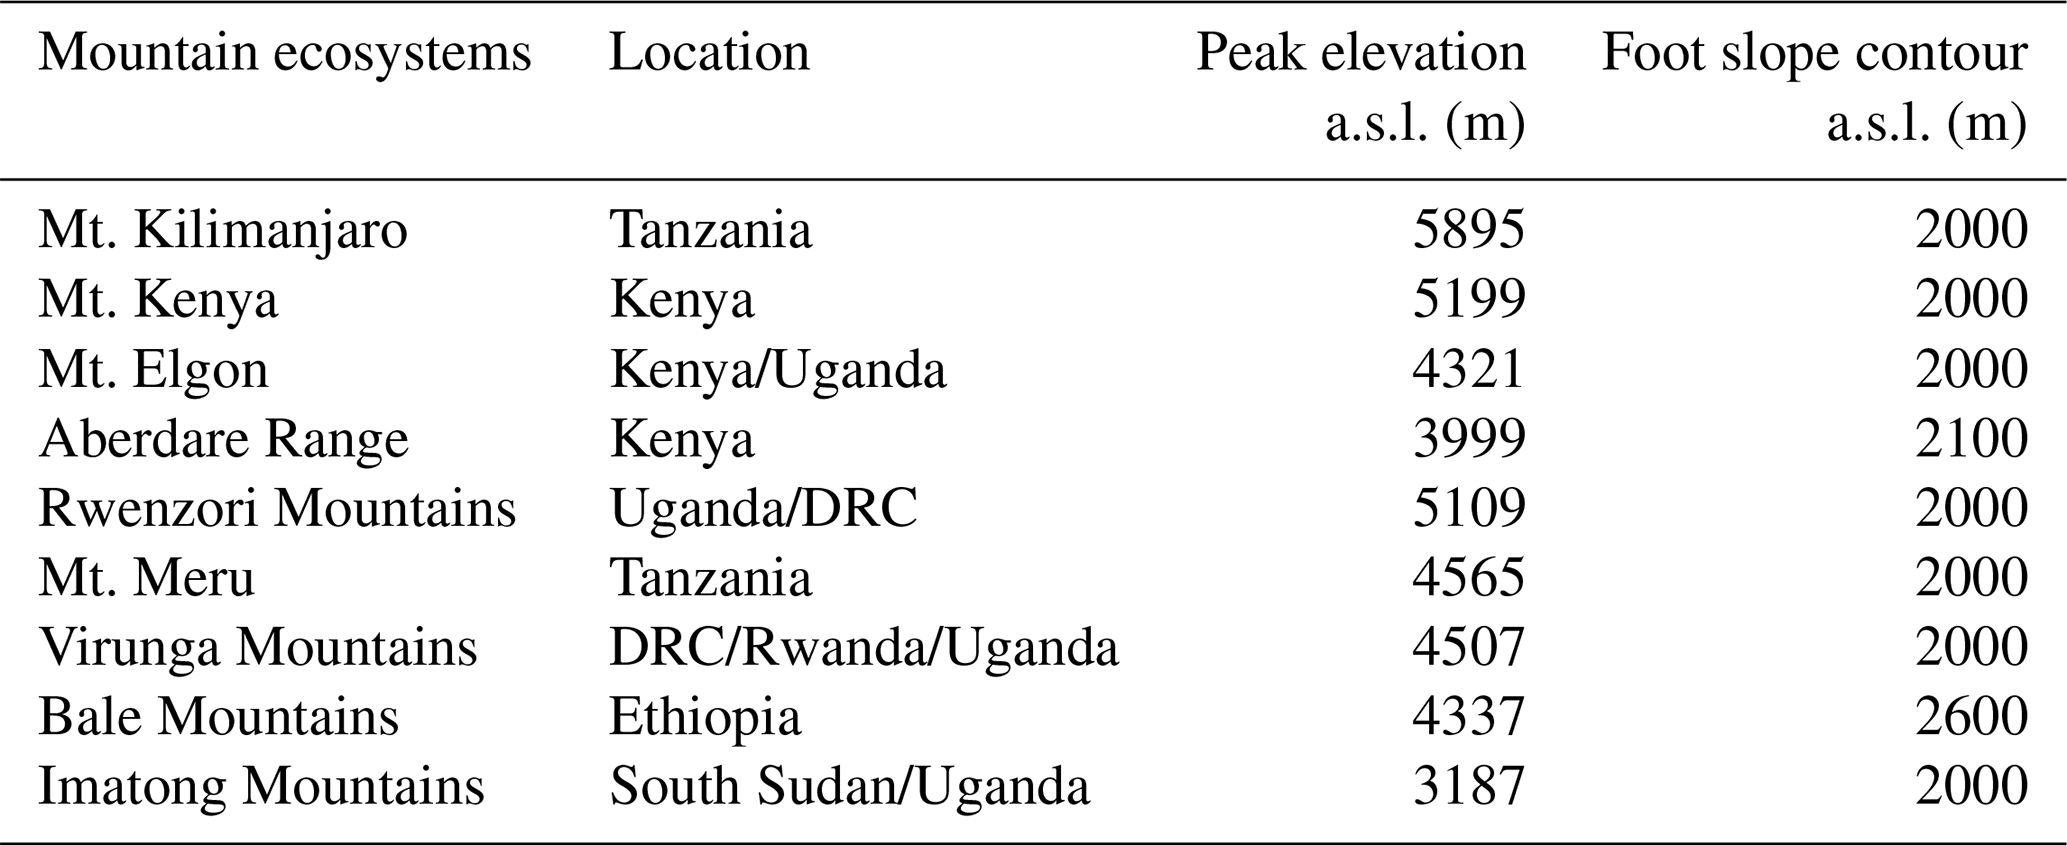
Note: the selected water towers have an aridity index above 0.65 (i.e., humid) located in high elevated areas. The foot slope was selected such that there is a continuous forest block from the foot slope contour to the peak. The foot slope contour was adjusted upwards for two water towers (i.e., Aberdare Range and Bale Mountains) to 2100 and 2600 m a.s.l., respectively, to ensure that we capture the majority of the elevated forested areas presumably under pristine conditions.
2.1 Data and analysis
Precipitation (P) data were gathered from the Climate Hazards Group Infrared Precipitation with Stations (CHIRPS v2), with a temporal coverage beginning in 1981 and a spatial resolution of 0.05∘. CHIRPS uses the Tropical Rainfall Measuring Mission Multi-satellite Precipitation Analysis version 7 (TMPA 3B42-V7) to calibrate global cold cloud duration (CCD) rainfall estimates (Funk et al., 2015). Potential evapotranspiration (PET) data were sourced from the Climate Research Unit (CRU) database, with the temporal coverage beginning in 1981 and a spatial resolution of 0.5∘. The CRU-PET is calculated using the Penman–Monteith formula (Harris et al., 2020; Ekström et al., 2007). Normalized Difference Vegetation Index (NDVI) data to estimate land surface characteristics were sourced from the Global Inventory Monitoring and Modeling System third generation (GIMMS 3 g) Advanced Very High-Resolution Radiometer (AVHRR) sensor on board the National Oceanic and Atmospheric Administration (NOAA) satellites at a spatial resolution of 0.07∘ (Pinzon and Tucker, 2014; Tucker et al., 2005; Kalisa et al., 2019). The NDVI is derived using the Bayesian methods with high-quality, well-calibrated SeaWiFS NDVI data. The resulting NDVI values give an error of ±0.005 NDVI (Pinzon and Tucker, 2014).
The research borrows from the concept of quantifying the long-term impact of climate and land use changes on mean annual evapotranspiration and water yield at catchment scales based on data and parameters that are easily measurable at a regional scale (Zhang et al., 2001). Forested catchments generally have higher evapotranspiration than other land covers such as grassed catchments. Therefore, changes in land use and forest management have an impact on catchment water balance and, hence, water yield (Zhang et al., 2001; Teuling and Hoek van Dijke, 2020).
One way of estimating water yield (Q) and actual evapotranspiration (ET) is to assume that evapotranspiration from land surfaces is controlled by water availability and atmospheric demand (Zhang et al., 2001). The water availability can be approximated by precipitation; the atmospheric demand represents the maximum possible evapotranspiration and is often considered as being the potential evapotranspiration (PET). Under very dry conditions, PET exceeds precipitation (P) and actual evapotranspiration (ET) equals precipitation. About 60 % of the world's land surface is considered an arid area, i.e., P PET ratio, also known as the aridity index (AI), of below 0.65 (Convention on Biological Diversity, 2021). Under very wet conditions, water availability exceeds PET, and ET will asymptotically approach the potential evapotranspiration (Zhang et al., 2001; see Fig. A1 for key assumptions on energy and water limits). The Budyko Curve provides a “business as usual” reference condition for the water balance. Assuming that it can depict the expected partitioning of P into ET and Q, then it is possible to account for the reasons why some points depart from the baseline (Creed and Spargo, 2012b). The vertical deviations reflect a change in the partitioning of P into ET and Q; hence, the higher the evaporative index (EI), the lesser the streamflow (Q). The horizontal deviations reflect the change in climatic conditions (i.e., temperature and precipitation); thus, the higher the dryness index (DI), the warmer/drier the conditions. One important feature of the Budyko curve is the assumption that, under stationary conditions (i.e., naturally occurring fluctuations due to P and PET), study areas will fall on the Budyko Curve. However, under non-stationary conditions (i.e., anthropogenic influence manifested in ET changes), each catchment will deviate from the Budyko curve, depending on land cover and physical catchment characteristics (Creed and Spargo, 2012b; Mwangi et al., 2016). This feature can be used to separate land cover change effects from climate change.
In this study, we used the Budyko framework and two recently introduced Budyko metrics (deviation and elasticity; Creed et al., 2014) to study the changes in the water yields. Similar methodologies were adopted by Helman et al. (2017) to determine the resilience of forested catchments and Sinha et al. (2018) to understand the involvement of anthropogenic stress and climatic variance on the partitioning of precipitation. Based on these studies, catchments can be assumed to shift predictably along the Budyko curve. This forms the basis for interpreting the vertical and horizontal deviations as a result of changes in climate and anthropogenic effects. The elasticity is defined as a measure of a catchment's ability to maintain hydroclimatic conditions as the climate varies. In contrast to other studies using the Budyko framework to look at different drivers of change, we used Budyko-derived data rather than observations. Therefore, the deviations are thereby constructed and presented as a way to visualize and interpret the results. Beyond the maps and graphs presented following the Budyko equation, we further illustrate the movement of water towers within the Budyko space.
2.1.1 The Budyko equations
Several analytical equations have been proposed for the Budyko curve. In this study, Fu's equation was used (Eq. 2) in a 10-year time step for 1981–2010 and 9 years for 2011–2019. The equation has been applied in different studies (Teuling et al., 2019; Li et al., 2013; Zhang et al., 2004).
where P, PET, and ET are the precipitation, potential evaporation, and actual evapotranspiration. PET P and ET P are termed the dryness index and evapotranspiration ratio, respectively. The ω parameter is an empirical parameter that controls how much of the available water will be evaporated given the available energy.
The ω parameter is the most difficult parameter to estimate in Budyko framework applications (Bai et al., 2019). It reflects the impact of other factors such as land surface characteristics and climate seasonality on water and energy balances (Li et al., 2013). Previous studies have adopted various ways of estimating the ω parameter. Some studies used fitted values based on the land use/cover of the areas under investigation. For instance, Zhang et al. (2012) used values of 2, 0.5, and 1 to represent ω for the forest, grassland, and shrubland, respectively. Creed et al. (2014) used ω= 2 in forested catchments, ω= 0.5 in grassland or cropland catchments, and ω= 1 in mixed cover catchments. Other studies calibrated it based on historical data (Gunkel and Lange, 2017; Redhead et al., 2016; Yang et al., 2014). However, for data-limited regions, calibration-based estimations are impossible, and simpler methods to estimate the ω parameter based on readily available data are desirable. Land surface hydrology varies due to variations in different factors such as vegetation, soil types, topography, and climate seasonality (Li et al., 2013; Yan et al., 2020). Soil texture and topography influence the amount of water available for vegetation; hence, the vegetation signatures can reflect the underlying conditions of soil water conditions, topography, seasonality, etc. Donohue et al. (2007) argued, based on the theory of ecohydrological equilibrium, that, in water-limited environments, vegetation is the integrated response to all processes affecting the availability of water. Therefore, vegetation information can serve as a good integrated indicator of these ecohydrological impacts on water and energy balances as it reflects the integrated landscape and climatic features. Using data from 26 major global river basins under a wide range of climate regimes, Li et al. (2013) developed a simple parameterization for the Budyko ω parameter based solely on vegetation information as shown in Eq. (3), as follows:
where M represents the vegetation coverage, which is calculated based on NDVI indices as follows (Yang et al., 2009):
In this study, the M values were calculated for 1985, 1995, 2005, and 2015 and assumed to represent the ω parameters for the respective periods of 1981–1990, 1991–2000, 2001–2010, and 2010–2019.
The water yield was estimated using the following equation:
where Q represents the water yield (parameter to be estimated), P is precipitation (input from data sets), ET is the simulated actual evapotranspiration (input from Budyko equation), and ΔS is the water storage term. Over a long period (i.e., 5–10 years), it is reasonable to assume that changes in soil water storage are zero under stationary climate conditions (Teuling et al., 2019; Creed et al., 2014; Zhang et al., 2001). Therefore, ΔS was assumed to be zero in our study.
2.1.2 Developing the Budyko curves
To develop Budyko curves that are representative of the selected forested water towers, 100 random points were generated in each of the water towers in ArcGIS. The random points were used to extract values from raster P, PET, and ET grids for developing the Budyko curves. For maximum representation, the minimum allowed distance between the random points was set to 100 m. The random points generated were assigned the respective values of PET, ET, and P using the Extract Multi Values to Points tool in ArcGIS. The evaporative index (EI) values, calculated as a ratio of ET and P, and dryness index (DI) values, a ratio of PET and P, were used to draw the Budyko curves. In this study, the Budyko curve for the 1981–1990 period was used as the reference condition for the water balance to effectively assess the trends in the succeeding periods of 1991–1990, 1991–2000, 2001–2010, and 2011–2019.
2.1.3 Evaluating the effects of land use and climate changes
To evaluate the impacts of climate and land use changes, the sensitivity of climate and land use changes was conducted. The climate and land use values for the years 1981–1990 were used as the reference conditions in the Budyko framework. The climatic conditions (i.e., P and PET) for the years 1981–1990 were held constant in the Budyko framework to evaluate the impacts under changing land use conditions in the succeeding periods of 1991–2000, 2001–2010, and 2011–2019. Similarly, the land use conditions (i.e., ω parameters) for the years 1981–1990 were held constant in the Budyko framework to evaluate the impacts under changing climatic conditions in the succeeding periods of 1991–2000, 2001–2010, and 2011–2019.
Deviations from the Budyko curves were also investigated to give a further illustration of the movement of water towers in the Budyko space. The x axis (horizontal deviations) in the Budyko space illustrates the aridity indices and the y axis (vertical deviations) characterizes the evaporative indices (Heidari et al., 2021; Creed et al., 2014). Vertical deviations from the Budyko curve indicate anthropogenic effects which result in increases or decreases in water yield (Creed and Spargo, 2012b, a). Horizontal deviations reflect a shift to warmer or humid conditions, mainly due to resultant variations in temperature and precipitation (Creed and Spargo, 2012b, a). The deviation (d) and elasticity (e) are two indices used to describe the potential departure from the theoretical Budyko curve of a catchment's DI and EI points with time (Creed et al., 2014). The deviation (d) was defined as vertical deviation from the Budyko curve calculated using the following formula:
where EISim represents EI simulated for periods in 1991–2000, 2001–2010, and 2011–2019, and EIBud represents the predicted theoretical Budyko value for the reference period of 1981–1990. The EIBud therefore represents the theoretical value (i.e., point on the Budyko curve where the water tower was expected to fall at a particular period). The EISim represents the point where the water tower plotted in that period. The difference between the expected/reference point (EIBud) and the actual point (EISim) was then calculated to give the deviation (d) from the Budyko curve. A negative d represents a downward shift from the Budyko curve and, hence, an increase in Q (Creed and Spargo, 2012a). A positive d represents an upward shift from the Budyko curve and, hence, a decrease in Q. Elasticity (e) was defined as being the ratio of interdecadal variation in dryness index (DI) to interdecadal variation in the evaporative index (EI), as shown in the following formula:
where ΔDI represents a range in DI values, and ΔEI represents a range in EI values observed in the periods of 1991–2000, 2001–2010, and 2011–2019, using the period of 1981–1990 as the reference period. In our study, the evaporative indices (EI) for the four periods (i.e., 1981–1990, 1991–2000, 2001–2010, and 2011–2019) were calculated (based on averages of ET and P for each period). The range in EI (i.e., ΔEI) is the difference between the reference/baseline EI (of 1981–1990) and succeeding periods of 1991–2000, 2001–2010, and 2011–2019. The water towers with lower elasticity values indicate greater ranges in their EI values. The water towers with higher elasticity values demonstrate fewer ranges in their EI values (i.e., larger denominator reduces elasticity).
2.1.4 Comparison of simulated streamflow with observation-based runoff
The simulated streamflow of the water towers was compared with composite runoff data downloaded from the Global Runoff Data Centre (GRDC). The composite runoff fields, developed through combining observed river discharge information with a climate-driven water balance model, provide the best estimate of terrestrial runoff over large domains (Fekete et al., 2002). A total of 312 points above 2000 m a.s.l. (above sea level), which is the focus of this study (i.e., elevated water towers), were randomly generated in ArcGIS. For maximum representation, the minimum allowed distance between the random points was set to 100 m. The selected random points and their respective values of simulated streamflow and composite runoff were compared.
3.1 Climate characteristics over the period 1981–2019 (precipitation and potential evapotranspiration)
Higher long-term mean annual rainfall of above 1000 mm yr−1 was generally observed in the mountainous forest ecosystems located in the western region and the Ethiopian Highlands in the north of East Africa (Fig. 2a). The mountainous forest ecosystems are important rainfall regions in drier environments, as represented by Mt. Kilimanjaro (average 1800 mm yr−1), Mt. Meru (average 1200 mm yr−1), Mt. Kenya (average 1400 mm yr−1), and the Aberdare Range (average 1200 mm yr−1) as shown in Fig. 2a and c. The 10-year moving averages analysis revealed patterns of increasing and decreasing trends in precipitation in the different water towers (Fig. A2).
Changes in precipitation, relative to the 1981–1990 period, showed a longitudinal gradient. Negative changes in rainfall were observed in the water towers located towards the eastern side, except for the Virunga Mountains. Positive trends were observed in the water towers located towards the western side with exception of the Aberdare Range. Mt. Kilimanjaro experienced a strong mean annual rainfall reduction, with an average annual reduction of 13.5 % and 12 % observed in 2001–2010 and 2011–2019, respectively (Fig. 2e). Conversely, a steady increase in mean annual rainfall was observed in Mt. Elgon, with an average increase of over 20 % recorded in the years 2011–2019 (Fig. 2e).
Long-term assessment of atmospheric demand (PET) showed areas with relatively higher mean annual PET to coincide with areas of low rainfall and vice versa (Fig. 2b). Generally, atmospheric demand continued to increase over time in all the water towers, with a peak observed in 2001–2010 (Figs. 2d and A3). The Imatong Mountains water tower had the highest atmospheric demand, with an average long-term mean of approximately 1500 mm yr−1, followed closely by Mt. Elgon, with an average long-term mean of approximately 1400 mm yr−1. The water towers located towards the western side exhibited lower atmospheric demand (examples are the Virunga Mountains – long-term mean of 990 mm yr−1 – and Rwenzori Mountains – long-term mean of 1100 mm yr−1).
All water towers experienced increases in the annual atmospheric demand relative to the 1981–1990 period (Fig. 2f.) The Bale Mountains saw a sharp increase in atmospheric demand of approximately 6 % in 2001–2010 and 2011–2019. A minimal increase in atmospheric demand was observed at Mt. Kilimanjaro, with an average annual increase of 0.1 %, 1.0 %, and 0.8 % in 1991–2000, 2001–2010, and 2011–2019, respectively, as shown in Fig. 2f.
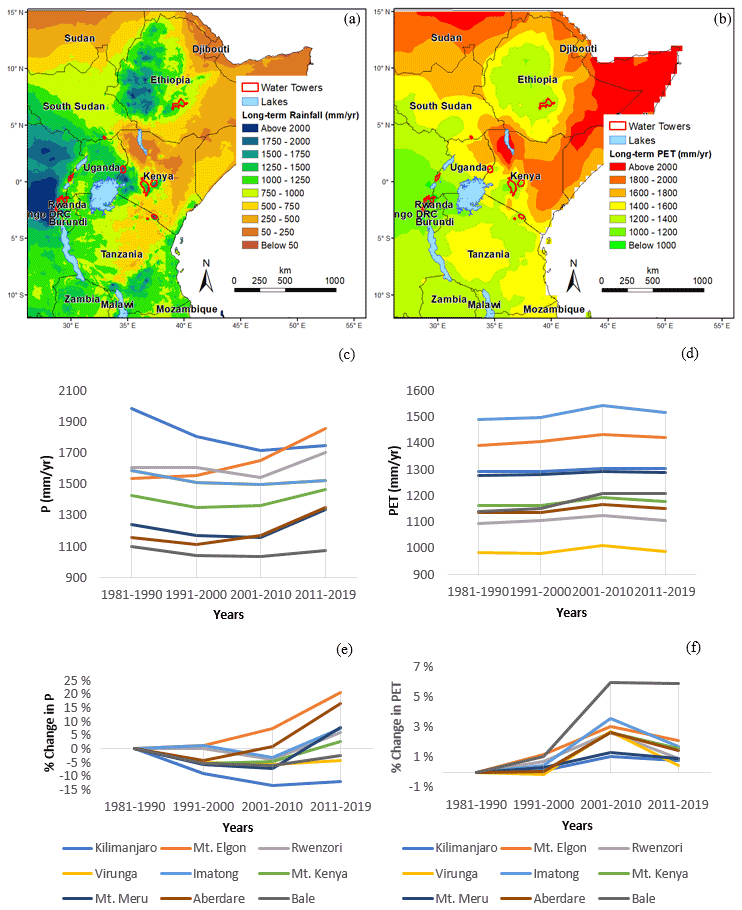
Figure 2Long-term mean annual rainfall and potential evapotranspiration. The left panels show the precipitation and the observed changes for the period 1981–2019 (a, c, e). The right panels show potential evapotranspiration and the observed changes for the period 1981–2019 (b, d, f).
3.2 Land cover characteristics over the period 1981–2019
Higher values for the Budyko parameter (ω) were derived in the western part of the DRC and Uganda, the Ethiopian Highlands and along the coastline of Tanzania, Kenya, and Somalia (Fig. 3a). The land surface characteristics (ω) ranged between 2.4 and 3.1 in the different water towers, with the exception of the Bale Mountains where a drop to 2.3 was observed in 2015 (Fig. 3b). Using 1985 as the reference period for the land cover characteristics, different patterns of negative changes and positive changes were observed. A major drop was observed in Mt. Meru and Mt. Kilimanjaro, while Mt. Elgon and the Imatong Mountains maintained a positive change (Fig. 3c).

Figure 3The land surface characteristics. Spatial distribution of the Budyko parameter (ω) for 1985 to 2015 (a) and the changes observed between 1985 and 2015 (b) and (c) are shown.
3.3 Simulation of actual evapotranspiration
The long-term actual evapotranspiration (ET) assessment revealed longitudinal differences in the spatial distribution. The water towers towards the west were observed to be located in regions with higher ET (examples are Mt. Elgon and the Imatong, Rwenzori, and Virunga mountains). The water towers towards the east are located in regions with relatively lower ET (examples are Mt. Meru, Mt. Kilimanjaro, the Aberdare Range, and Mt. Kenya; Figs. 4a and 5a, b, c, d). The changes in ET in the region were analyzed using the 1981–1990 period as the baseline (Fig. 4a). Decreases in ET were observed in the southeastern parts of Ethiopia, along a north–south gradient in Kenya, central Tanzania, and the western side of the DRC and Burundi region, as shown in Fig. 4b, c, and d. Increases in ET were observed in northern parts of eastern Africa (i.e., Sudan, South Sudan, Djibouti, northern Somalia, the Kenyan–Somali border, and parts of northwestern Kenya bordering Uganda and South Sudan (Fig. 4b, c, and d).
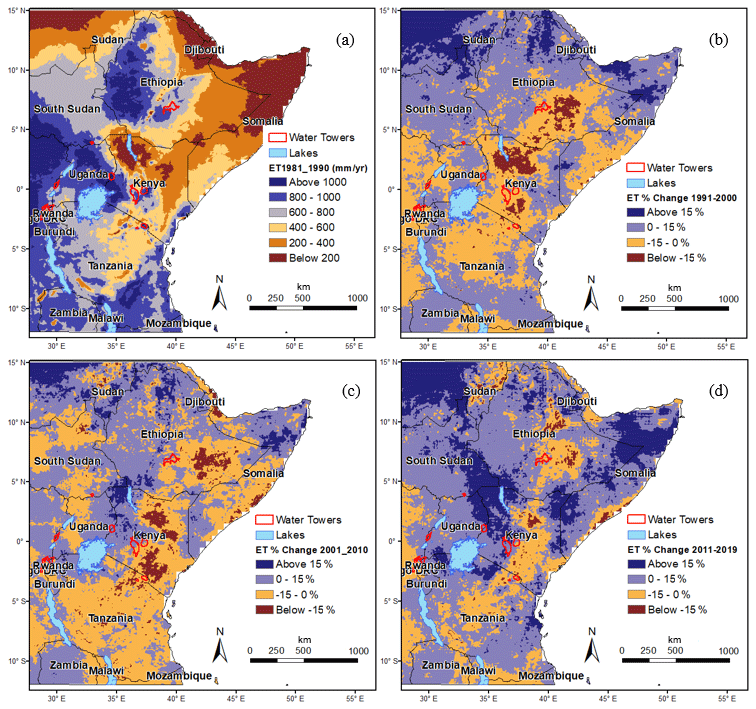
Figure 4Distribution of simulated actual evapotranspiration in East Africa. (a) ET for 1981–1990, (b) ET changes in 1991–2000, (c) ET changes in 2001–2010, and (d) ET changes in 2011–2019.
Despite the longitudinal differences in the region, the individual water towers recorded varied ET values. Higher ET values were simulated around the Imatong Mountains, with a long-term mean of 1107 mm yr−1, Mt. Elgon, with a long-term mean of 1097 mm yr, and Mt. Kilimanjaro, with a long-term mean of 1012 mm yr−1. The lowest ET values were observed in the Bale Mountains, with a long-term mean of 747 mm yr−1 (Fig. 5j). Using the 1981–1990 period as the reference period, Mt. Elgon recorded a steady increase in annual mean ET, with an average increase of the order of 10 % between 2011 and 2019. Pronounced decreases in ET were observed in the Mt. Kilimanjaro and Mt. Meru water towers (Fig. 5k), consistent with the decreasing trend in precipitation.
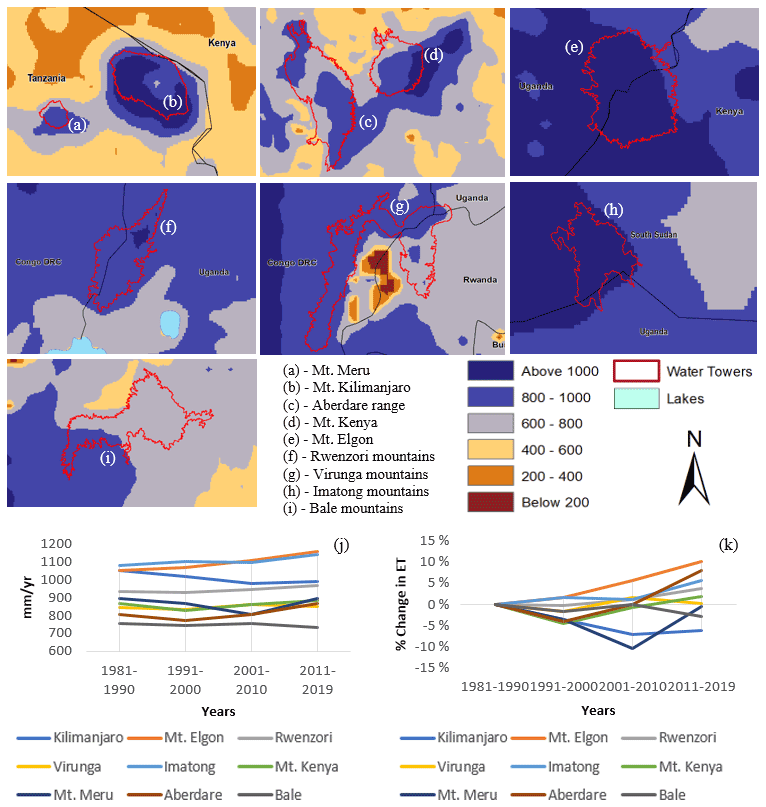
Figure 5Distribution of long-term actual evapotranspiration. The spatial distribution of long-term ET in and around the water towers (a–i) and the changes in the different water towers (j, k) are shown.
3.4 Simulation of water yield
Similar to what was observed for ET, the long-term water yield (Q) assessment also showed that the water towers located towards the east are surrounded by regions with low water yield potential below 200 mm yr−1 (examples are Mt. Meru, Mt. Kilimanjaro, the Aberdare Range, and Mt. Kenya; Figs. 6a and 7a, b, c, d). Using the period 1981–1991 as the baseline, major increases in Q were observed in areas of Sudan and the Kenyan–Somali border as shown in Fig. 6b, c, and d.
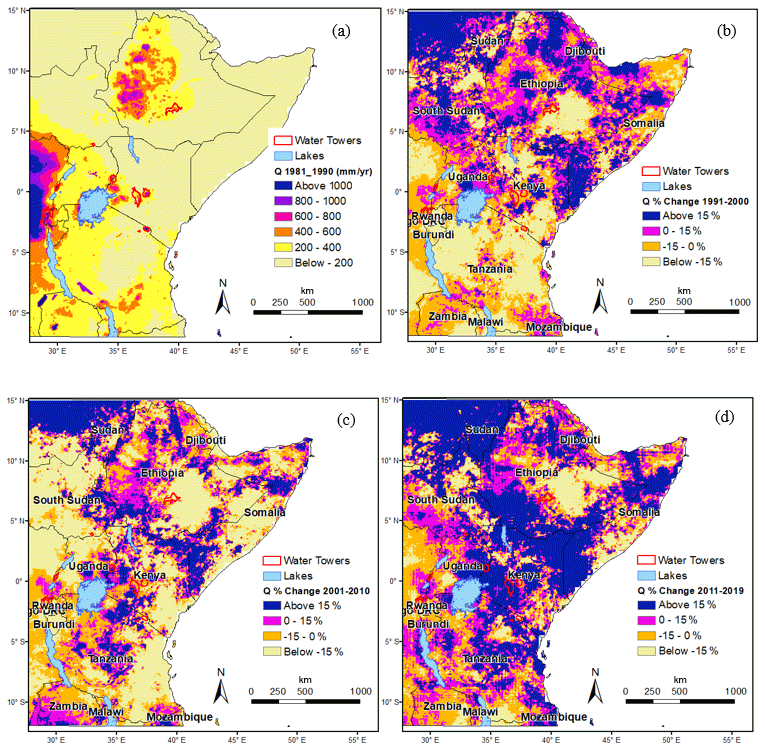
Figure 6Spatial distribution of simulated water yield. (a) Q is for 1981–1990, (b) Q is for changes in 1991–2000, (c) Q is for changes in 2001–2010, and (d) Q is for changes in 2011–2019.
Despite longitudinal differences, the higher mean annual water yield was observed at the Mt. Kilimanjaro water tower located on the eastern side, with the long-term annual mean of 794 mm yr−1, followed by two water towers located on the western side (i.e., Virunga Mountains, with a long-term annual mean of 676 mm yr−1, and Rwenzori Mountains, with a long-term annual mean of 650 mm yr−1). The lowest annual mean water yield was observed in the Bale Mountains, with a long-term annual mean of 315 mm yr−1 (Fig. 7j). Conversion of water yield units from millimeters per year to cubic meters per second per unit area revealed that Mt. Kilimanjaro and Mt. Kenya are important sources of water in the drier parts of the East African region (Table A1).
Using the period 1981–1990 as the reference point, positive and negative changes in water yield were observed at the different water towers. There was a consistent increase in annual mean water yield at the Mt. Elgon water tower, with increases of 11.4 % and 42.9 % recorded in 2001–2010 and 2011–2019, respectively (Fig. 7k). There was a decrease in water yield in the Aberdare Range and Mt. Meru water towers during the 1991–2000 period, after which an increase in annual mean water yield was recorded in the later years. A consistent decline was observed at Mt. Kilimanjaro and the Virunga Mountains during the study period.
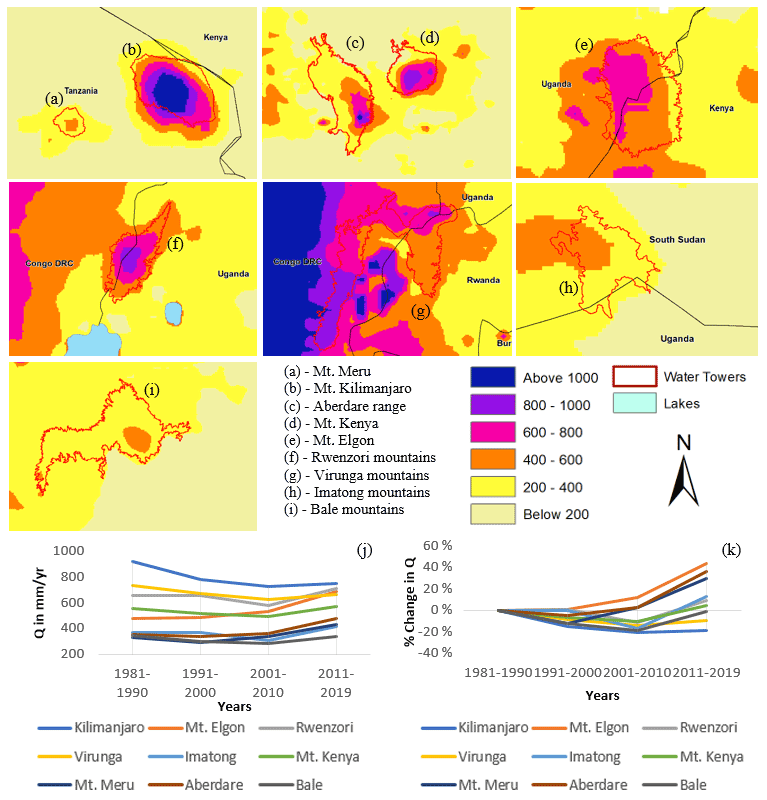
Figure 7Distribution of long-term water yield (Q). The spatial distribution in and around the water towers (a–i) and the changes in the different water towers (j, k) are shown.
The elevation plays a key important role in influencing hydroclimatic conditions in the East African region. The average atmospheric demand increases with a reducing elevation gradient. A steady increase in P, ET, and Q was observed as elevation increases. For regions above 2000 m a.s.l, the precipitation exceeds potential evapotranspiration as shown in Fig. A4. This demonstrates the importance of the elevated humid zones in generating and sustaining water yield to the adjacent lowland areas in the region.
3.5 Comparison of simulated streamflow with existing runoff data
The simulated streamflow was compared with composite runoff data downloaded from the GRDC (Fekete et al., 2002). The spatial pattern of the simulated streamflow closely resembles the pattern produced by GRDC composite runoff, as shown in Fig. 8a and b. A total of 312 points above 2000 m above sea level, the focus of this study (i.e., elevated water towers), were randomly selected, and their respective values of simulated streamflow and composite runoff were compared. The Kling–Gupta efficiency test revealed positive values (KGE = 0.33), as shown in Fig. 8c.
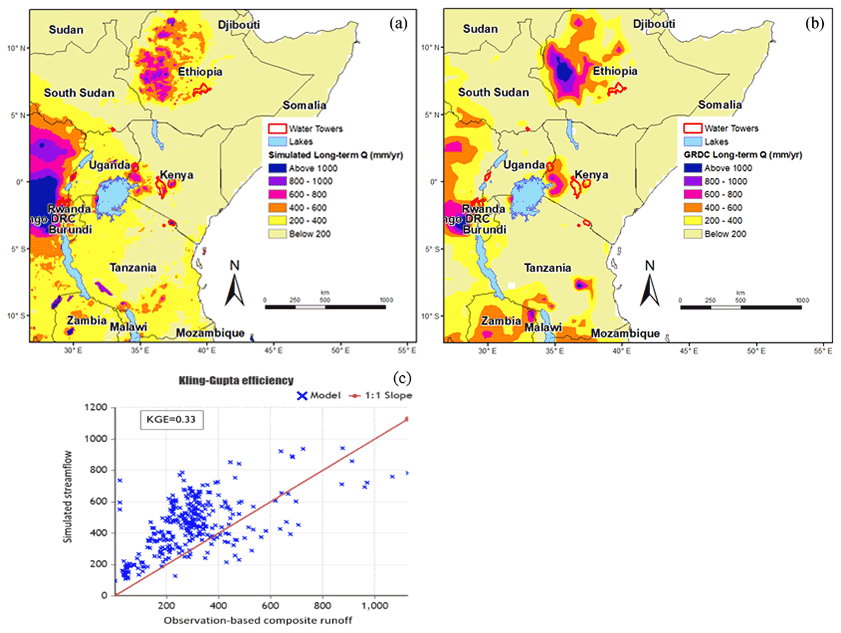
Figure 8Comparison of simulated streamflow and observation-based runoff. (a) Simulated streamflow, (b) observation-based composite runoff, and (c) Kling–Gupta efficiency calculation are shown.
3.6 The effects of land use and climate changes on water yield
The water yield was observed to be relatively more sensitive to climate changes (i.e., P and PET) than land use changes within the selected East African water towers. However, a closer look at the regions surrounding the selected water towers revealed that the effects of land use changes have greater impacts on water yield outside the water towers boundaries (Fig. 9). An example is on the eastern side of Mt. Elgon, where there was a major reduction in water yield, especially in the periods of 2001–2010 and 2011–2019 (Fig. 9; see the third row in column B). Climate changes showed a reduction in water yield in seven water towers in the periods of 1991–2000 and 2001–2010. However, in the years 2011–2019, climate changes triggered increased water yield in seven water towers (Fig. 10). The climate changes in Mt. Elgon resulted in a consistent increase in water yield, while a consistent decrease was inferred for Mt. Kilimanjaro.
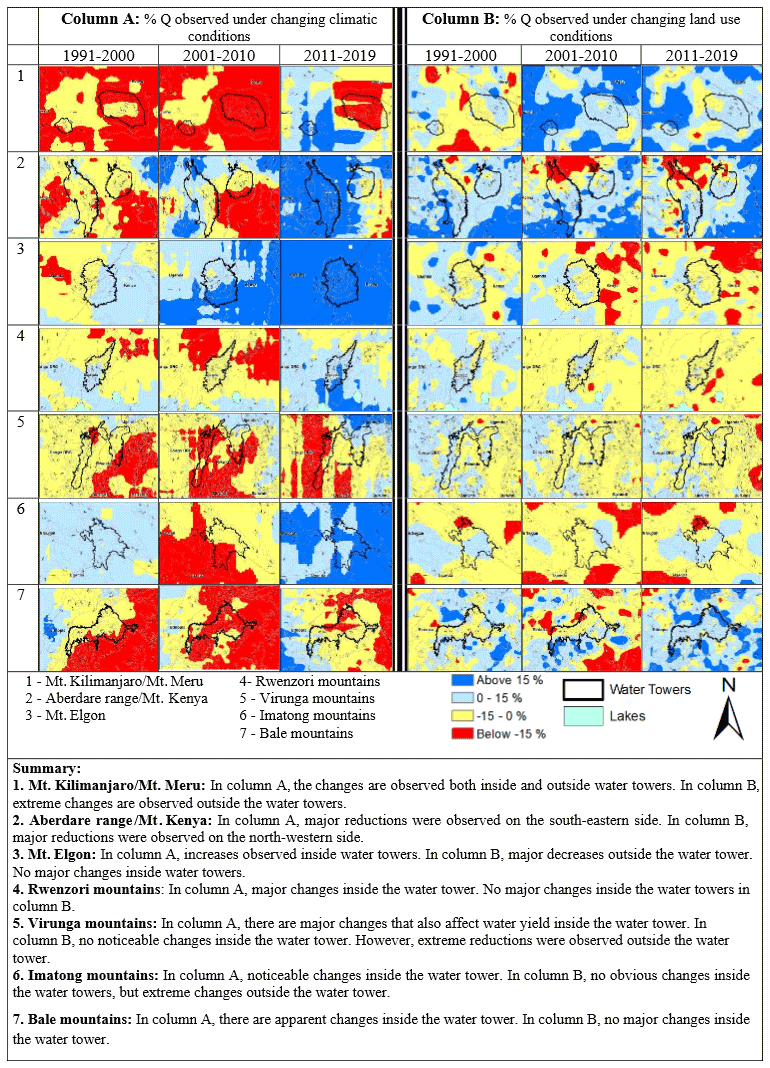
Figure 9Effects of land use and climate change on water yield (Q).
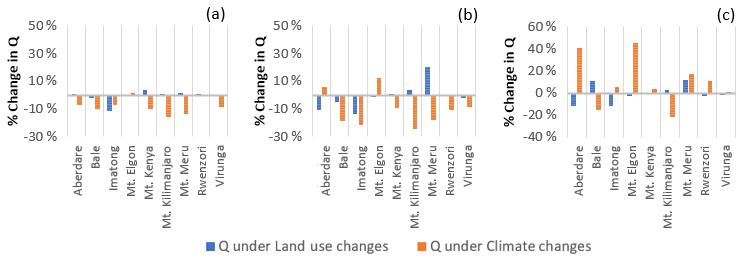
Figure 10Relative change in water yield for East African water towers. (a) 1991–2000, (b) 2001–2010, (c) 2011–2019.
3.7 Analyzing the water towers in the Budyko space
The analysis of vertical deviations revealed downward and upward shifts from the Budyko curve in the different water towers. The vertical deviations (d) ranged from negative (−0.05) to positive (+0.02; Fig. 11a). There were no vertical deviations observed in Mt. Elgon and the Imatong Mountains, indicating that the values observed (between 1991 and 2019) were approximately close to those predicted by the reference Budyko curve. The elasticity (e) values ranged from 0.49 to 17.6, with most of the water towers recording lower elasticity values as shown in Fig. 11b. The higher elasticity (e) values were observed at the Mt. Kenya water tower in 1991–2000, the Bale Mountains in 2011–2019, and the Aberdare Range in 1991–2000 and 2001–2010.
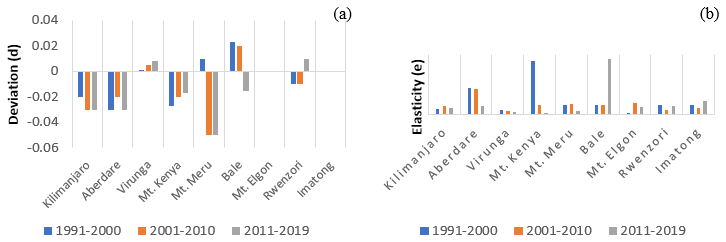
Figure 11Illustration of the water towers in the Budyko space. (a) The deviation from the Budyko curve and (b) elasticity are shown.
The horizontal shifts, either to the left or to the right relative to the dryness index (DI), were observed in the water towers. Figure A5 demonstrates that seven of the nine water towers plotted in the left (i.e., DI values less than 1; towards humid conditions). However, two of the water towers (i.e., Mt. Meru and the Bale Mountains) plotted more towards the right (i.e., DI values greater than 1). Mt. Meru seems to have shifted from warmer to humid conditions in the period of 2011–2019, as shown in Fig. A5.
We found that, within the water towers, water yield was more sensitive to climate changes than to land use changes. In contrast, outside the water towers, the water yield was observed to be more sensitive to land use changes than to climate changes. This suggests that anthropogenic influences are relatively higher outside the water towers. Contrary to our expectation, our analysis showed that most of the water towers (i.e., seven of nine) did not plot on the reference Budyko curve over the study period. This is a relevant finding, since all water towers were considered pristine and protected. Only two water towers, Mt. Elgon and the Imatong Mountains, showed no deviations from the reference Budyko curve. Generally, our investigation highlights the importance of elevated water towers in a semi-arid region in the generation and supply of water to adjacent lowland areas. The forested water towers located in drier environments (such as Mt. Kilimanjaro, Mt. Meru, Mt. Kenya, and the Aberdare Range) are important rainfall regions as they receive relatively higher rainfall than the adjacent areas. This ensures water availability in the adjacent lowlands in the arid and semi-arid (ASAL) regions.
Our results indicate that changes in precipitation and potential evapotranspiration are currently the major determinants of water availability from high elevated forested water towers in the East African region. Related observations have been made in the region, where climate changes in Africa have been reported to have a higher impact on water yield compared to other drivers such as land use changes (Alcamo et al., 2007; Niang et al., 2014). However, the lack of evidence of sensitivity to land use changes within the water towers themselves may be linked to existing institutional arrangements. We presume that the results would be different if such rules would be relaxed. That said, the movement of water towers in the Budyko space revealed that anthropogenic influence within the water towers cannot be ruled out. Our analysis revealed vertical deviations (d) from the Budyko curve for seven of nine forested water towers. According to Creed et al. (2014), these vertical deviations may indicate the presence of anthropogenic effects within the water towers. The two water towers where no deviations were observed (i.e., Mt. Elgon and the Imatong Mountains) indicate that the hydroclimatic conditions in the study period did not vary much from the reference conditions of 1981–1990, and any changes in water yield in the two water towers can largely be associated with climatic changes in P and PET.
Moreover, the lack of deviations in the two water towers may indicate the resilience of forested regions (i.e., adaptable nature of forests), as described in Van der Velde et al. (2014), Creed et al. (2014), and Helman et al. (2017). Such resilience (measured as elasticity) could be a key factor in forested water towers, indicating their ability to resist change or bounce back to their initial natural conditions, hence plotting along the reference Budyko curve. Long-term adaptations of forests have been achieved by trees even in the most water-limited forests (Helman et al., 2017). However, our investigations on elasticity (which refers to the degree of initial change using 1981–1990 as the reference period) did not support the above science as lower elasticity values were observed in most of the water towers. Given that low elasticity indicates broad ranges in the evaporative index (EI) compared to the dryness index (DI), this may further indicate the presence of anthropogenic influence within the water towers. According to Creed et al. (2014), elastic catchments are expected to plot along the Budyko curve (i.e., high elasticity = resilient to climate changes), while inelastic catchments (i.e., low elasticity = non-resilience to climate changes) would deviate from the Budyko curve.
Further illustrations can be shown in the Budyko space based on the horizontal shifts relative to the dryness index (DI). The horizontal shifts are important indicators of the behavior of the water towers towards warmer or humid conditions. These horizontal deviations reflect a change in the climatic conditions, specifically temperature and precipitation (Creed and Spargo, 2012a). This study observed that many of the water towers (seven of nine) were plotted within humid conditions (i.e., DI < 1). On the other hand, two of the water towers (i.e., Mt. Meru and the Bale Mountains) demonstrated warmer conditions (i.e., DI > 1). One major observation is that water towers in eastern Africa seem to shift towards the left in the Budyko space, an indication of the increased humid conditions, especially in the period of 2011–2019. At the same time, a gradual increase in PET was observed in all the water towers. A climate shift to wetter conditions and simultaneous increases in regional temperatures have also been reported in the East African region and projected to increase by the end of the 21st century (Niang et al., 2014; Giannini et al., 2018; Omambia et al., 2012).
The effects of increasing temperatures have already been identified to have decreased the surface area of glaciers by 80 % in East African water towers (EAC et al., 2016), affecting runoff and water resources downstream. According to Niang et al. (2014), the temperatures in Africa are projected to rise faster than other parts of the world, which could exceed 2 ∘C by the mid-21st century and 4 ∘C by the end of the 21st century. Therefore, the water towers are under pressure from climate changes and PET is proving to be an important climate driver influencing water availability in the region. There are chances that the shifts to wetter conditions in the water towers may also be as a result of the extended impact of increasing PET on the El Niño–Southern Oscillation (ENSO), a phenomenon that influences precipitation in the East African region. Li et al. (2016) investigated annual flood frequencies, from 1990 to 2014, and observed upward trends that were linked to the ENSO phenomenon in Africa. Furthermore, the shifts to wetter conditions also coincide with the recent reports on the rising lake levels phenomenon in the eastern Africa region (Patel, 2020, 2021; Wambua, 2020; Chebet, 2020; Chepkoech, 2020). We, however, do not believe we have the results to link the climatic shifts and swelling of lakes to ENSO variations in our study which requires further scientific investigations.
The simulated actual evapotranspiration (ET) and water yield (Q) revealed longitudinal differences with low to high values ranging from east to west. A related pattern on climate varying across East Africa from arid conditions in the east to more humid conditions in the west was also observed by Daron (2014). However, the individual water towers revealed independent variations that do not follow the longitudinal pattern. For instance, a higher mean annual water yield was observed at Mt. Kilimanjaro despite being in a drier environment on the eastern side. This emphasizes the importance of elevated forested areas in ensuring water availability in semi-arid areas. This study revealed that in high elevated forested zones, the precipitation exceeds potential evapotranspiration, which ensures a surplus of water that eventually flows downstream.
The extreme opposite temporal trends observed in water yields from the different water towers confirm a strong variation in the regional climatic patterns. For instance, while there was a consistent increase in annual mean water yield at Mt. Elgon, the opposite was true at Mt. Kilimanjaro, where a steady decline in water yield was observed. Our results further revealed that precipitation (P) is the dominant driver in the East African region. For instance, a consistent increase in Q at Mt. Elgon coincided with a steady increase in land surface characteristics (ω), as shown in Fig. 3c. Ideally, a decrease in Q would have occurred due to the increases in ET (associated with increases in land surface characteristics), but this was diffused by the increases in rainfall, as shown in Fig. 2c. At the Mt. Kilimanjaro water tower, a continuous decrease in Q coincided with a steady reduction in ω. Again, an increase in Q would have been expected due to decreases in ET. Therefore, precipitation is the dominant driver in the generation and supply of water from the forested water towers in the East African region.
As a first-order tool, the Budyko framework provides an important reference point for relating variations in water yield to variations in climatic conditions and catchment properties. In this study, the spatial pattern of the simulated streamflow in the Budyko framework closely resembles the pattern observed in the GRDC composite runoff. We, however, noted an overestimation of water yield in the comparison. This type of observation was also reported by Teng et al. (2012), where the Budyko equation was found to overestimate water yield in drier regions. Moreover, other factors, such as interception, soil type, topography, seasonality, water storage, etc., were not accounted for in the quantitative framework, which can affect the simulations in the selected forested water towers.
Canopy interception, for instance, plays an important role in the water balance of forested ecosystems as noted in several studies (Teuling et al., 2019; Gash et al., 1980; Zimmermann et al., 1999; Astuti and Suryatmojo, 2019). In their study, Teuling et al. (2019) found many forested points to have average yearly observed evapotranspiration (ET) that exceeds the average potential evapotranspiration (PET). Van Dijk et al. (2015) opined that this is possible due to underestimation of evapotranspiration which was attributed to evaporation of interception water by energy not captured in the formulation of PET. The forest evapotranspiration paradox is further discussed in Teuling (2018). The correction of underestimation in Teuling et al. (2019) indicates the need for long-term lysimeter observations for studies focusing on forested ecosystems. The availability of meteorological data in the upper slopes of the East African mountains is a big gap as the majority of meteorological observations are conducted below 1500 m a.s.l., and most of the upper slopes data rely on the extrapolation of hydrological analysis in the lowlands (Røhr and Killingtveit, 2003). Locally based runoff measurements would have helped to interpret if there is indeed an overestimation in our study.
We, however, observed a positive KGE, which indicates a good model performance (Knoben et al., 2019). Therefore, we considered the Budyko simulations as being acceptable. However, it should be noted that this comparison is added for reference only and should not be seen as validation. This is because the global composite runoff (Fekete et al., 2002) is not a strictly observational data set, and it is used here as the best estimate available for long-term estimates of streamflow in the East African region. The fact the Budyko framework uses fewer data and parameters that are easily measurable at a regional scale makes it a suitable approach for data-limited regions such as East Africa.
Besides the strengths of using the Budyko approach, uncertainties may exist which could have affected our results. The study used data from different data sets (CHIRPS, CRU, and GIMMS/AVHRR) at various scales, which could potentially affect results due to various assumptions and approaches in the processing of each data set. For instance, the CRU data set is fairly coarse and contains rather few observations in Africa. One substantial weakness of the current CHIRPS algorithm is the lack of uncertainty information provided by the inverse distance weighting algorithm used to blend the CHIRP data and station data (Funk et al., 2015). The overall NDVI 3g uncertainty comes from spatial and temporal coherence variability, which gives approximately an error of ±0.002 NDVI units. However, this NDVI error is considered low uncertainty and, hence, applicable for studying seasonal and interannual non-stationary phenomena (Pinzon and Tucker, 2014). Uncertainties may also arise in the general assumption that estimation of land surface characteristics (ω) based on NDVI formulation provides values that represent integrated conditions for soil, topography, and climate seasonality. Some studies using various hydrological approaches have reported the significance of these factors in influencing catchment hydrology (Kirkby et al., 2002; Woods, 2002; Western et al., 2004; Troch et al., 2013). There is a need for more research to come up with methodological consistency in estimating ω parameters when using the Budyko framework. Although the focus of the study was in the elevated forested areas, an empirical adjustment of the Budyko framework may be needed to capture special features, such as desert wadis, in the application of the Budyko equation in the lowland areas.
We also recognize other factors that may influence the results of this study. For instance, increasing atmospheric CO2 concentrations may affect terrestrial water cycling through changes in climate and changes in transpiration (i.e., stomatal conductance; Frank et al., 2015; Mamuye, 2018; Huntington, 2008). We also note that if CO2 leads to higher NDVI, then this effect is accounted for in our modeling approach. Some studies have reported that NDVI linear trends can be linked to increasing CO2 levels (Krakauer et al., 2017; Yuan et al., 2017). However, detailed investigations are recommended within the East African region. Other factors that may affect our results include the human alteration to water usage. Kiteme et al. (2008) reported unregulated abstraction of water upstream of Mt. Kenya water tower, leading to hydrological droughts downstream. An intensification of irrigated agriculture and a growing human population was reported at the foot slopes of the water towers (Ulrich et al., 2012; Liniger et al., 2005). The effects of anthropogenic presence at the foot slope of the water towers were not accounted for, and further studies are needed to understand how humans living at the foot slope of protected water towers affect the pristine conditions of the water towers at high elevations. Notwithstanding these limitations, our study offers important findings on the sensitivity of water yield to climate and land use changes and the importance of these water towers in the generation and supply of water to adjacent lowland areas. These results can be used by decision-makers, policymakers, stakeholders, and scientists to emphasize the need to protect and conserve the high elevated forested areas in the region, particularly forest ecosystems above 2000 m a.s.l. where there is a surplus of water.
The Budyko framework provides primary results that can inform detailed hydrological assessments. For instance, our findings show that elevated forested water towers are important areas for maintaining high ET in the region. This finding can be explored further by studying the role of water towers in the supply of rainfall water in the region (i.e., the role of water towers in regional rainfall/moisture recycling; Ellison et al., 2017; Keys et al., 2014), including the effect of mountain rain shadows on water yield (Van den Hende et al., 2021). The major reference period for this study was the 1981–1990 period, based on the CHIRPS rainfall data set, with data beginning from 1981 onwards. We believe the results would be different if an older reference period was used, e.g., 100 years ago (presumably actual pristine conditions). This would help to strengthen the findings of this study, especially after the evidence of climatic shifts towards wetter conditions in all the water towers. The anthropogenic presence both inside and outside the forested water towers indicates the relevance of local context, and ground research for understanding the forest–water–people nexus (Van Noordwijk et al., 2020) is recommended. This will help in understanding in detail the dynamics and co-evolution of coupled human–forest–water systems.
The forested water towers provide important water sources for the surrounding semi-arid area through both runoff generation and regional rainfall recycling. Climate changes (i.e., changes in precipitation and potential evapotranspiration) have a relatively large effect on water yield within the East African water towers. The effects of land use changes on water yield are larger in the adjacent regions surrounding the water towers. The majority of East African water towers are under pressure from human influences both within and outside the water towers. Generally, the patterns in water yield showed a strong longitudinal difference (east to west), though the elevation is a key factor that ensures the generation of water in the water towers located in drier environments. A hydroclimatic phenomenon is occurring in the East African region as the water towers show a strong shift towards wetter conditions (especially in the period of 2011–2019), while at the same time the atmospheric demand is gradually increasing. Given that most of the water towers were identified as non-resilient to changes, it means there are greater possibilities of extreme variations in water yield under changing climatic conditions. The Budyko framework is an important first-order tool that uses fewer data inputs and provides important illustrations of hydroclimatic conditions of areas under study. The primary results contribute to the general understanding that can further inform detail hydrological studies. Therefore, Budyko is a suitable approach, especially for data-deficit regions such as East Africa.

Figure A1The Budyko curve. The water limit (ET = P) is shown; a site cannot plot above the blue line unless there is input of water beyond precipitation. The energy limit (ET = PET) is shown; a site cannot plot above the red line unless precipitation is being lost from system by means other than discharge (adapted from Creed and Spargo, 2012a).
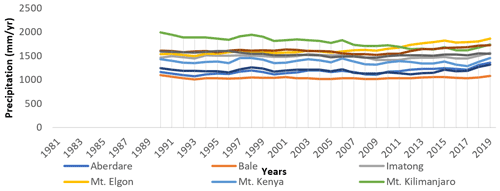
Figure A2The 10-year moving averages of mean annual mean precipitation at the different water towers.
Higher levels of annual precipitation were observed in 1990–1992, 1998–1999, and 2013–2015. Lower levels of annual precipitation were observed in 1987, 1995–1996, 2004–2005, and 2017. Mt. Kilimanjaro was observed to have a consistent decline in annual mean rainfall between 1981 and 2017. The Mt. Elgon water tower recorded a consistent increase in annual mean rainfall during the study period.
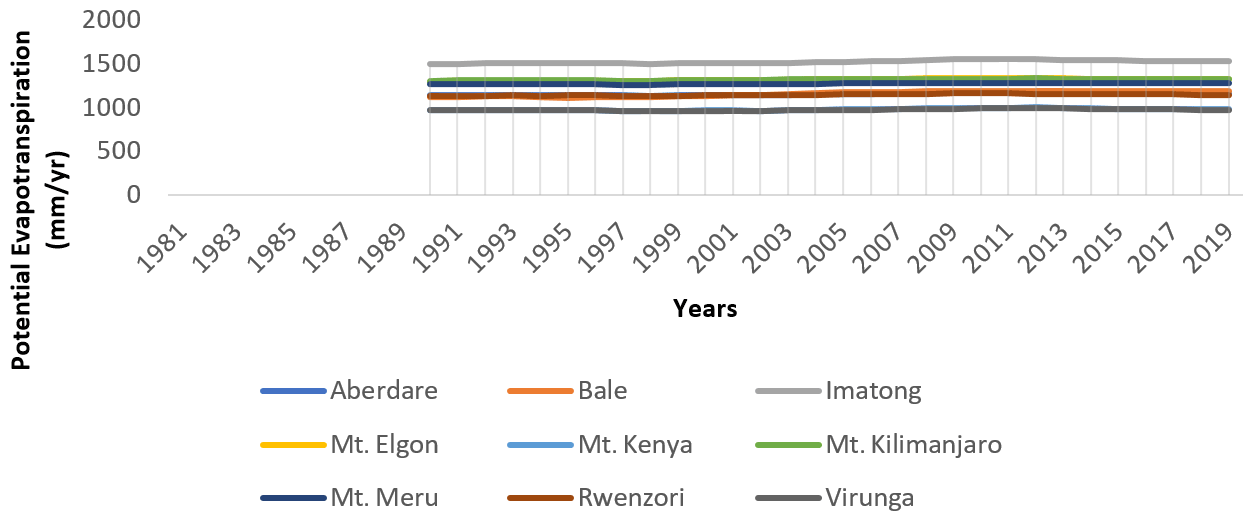
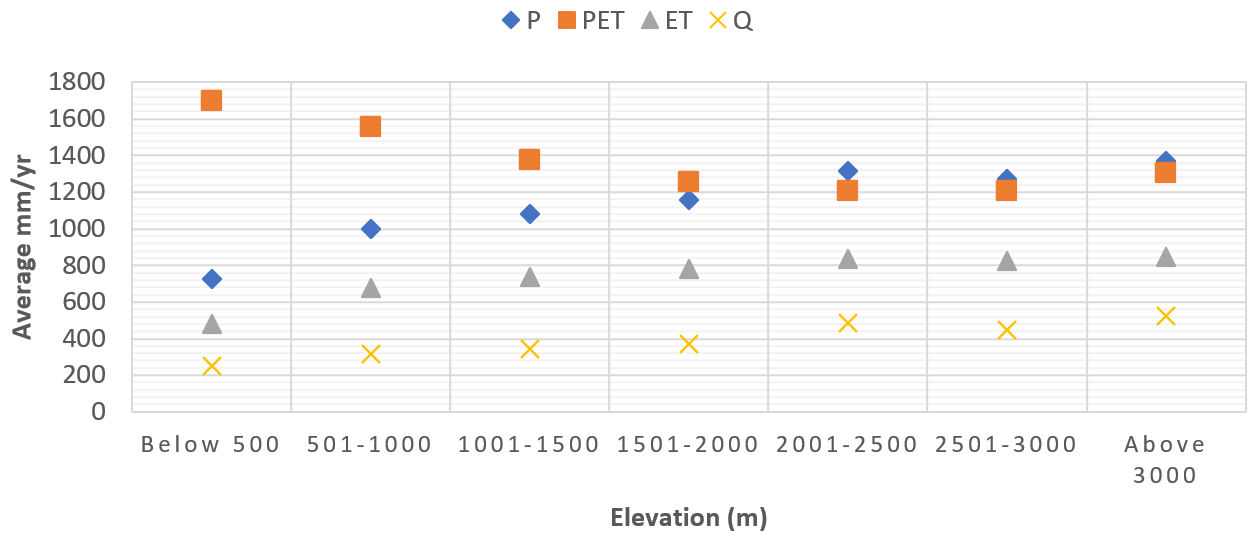
Table A1Summary of simulated evapotranspiration (ET) and water yield (Q), given the precipitation (P) between 1981 and 2019.
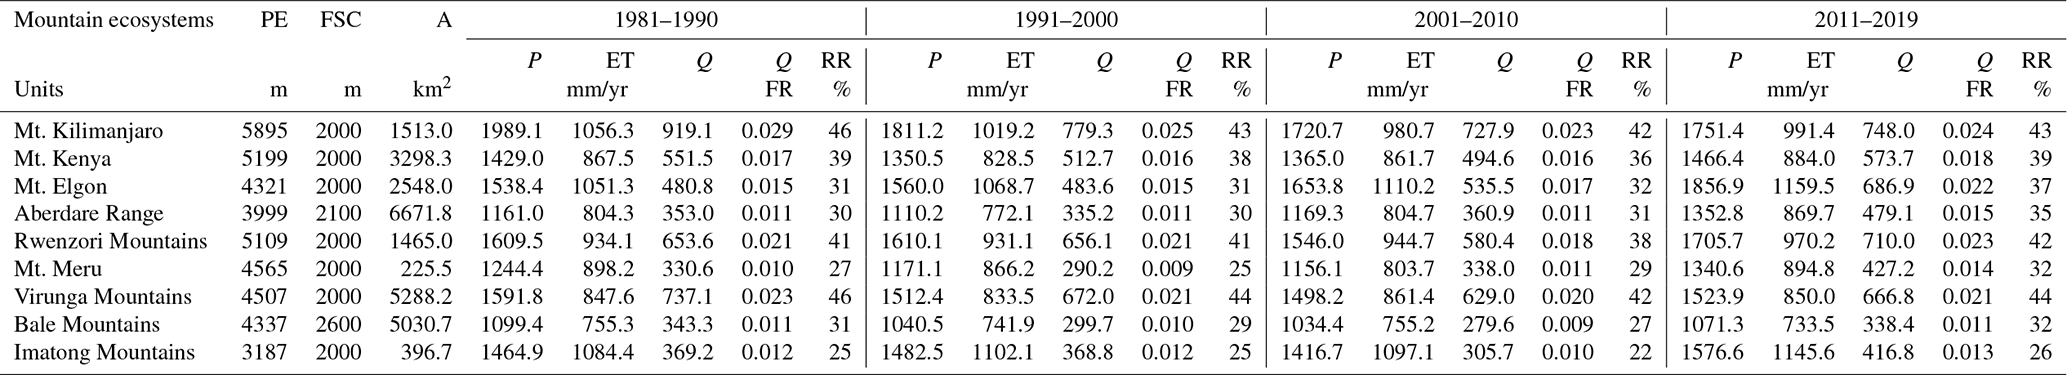
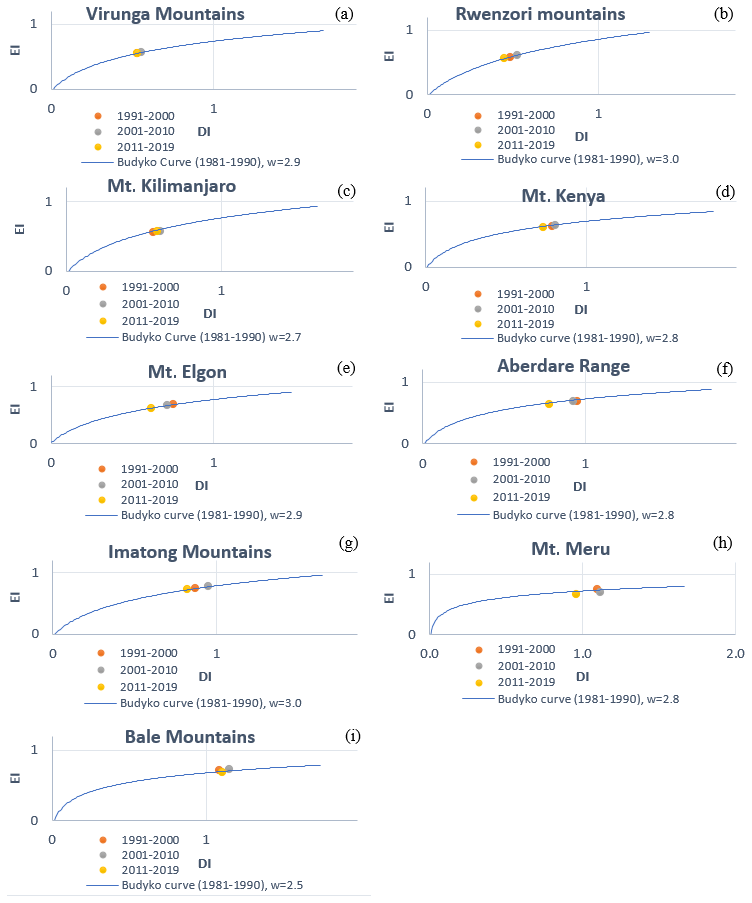
Figure A5Graphical representation of the baseline Budyko curve (estimated for 1981–1990) and the trends of water towers in the different years.
All climatic data used in this study (i.e., P, PET, and NDVI) are publicly available. Precipitation data (P) were downloaded from Climate Hazards Group Infrared Precipitation with Stations (CHIRPS v2) https://www.chc.ucsb.edu/data/chirps (University of California, 2020). Potential evapotranspiration (PET) data were downloaded from the CRU database https://crudata.uea.ac.uk/cru/data/hrg/ (Climatic Research Unit (University of East Anglia) and NCAS, 2020). The Normalized Difference Vegetation Index (NDVI) was sourced from Global Inventory Monitoring and Modeling System third generation (GIMMS 3 g) Advanced Very High-Resolution Radiometer (AVHRR) sensor on board the National Oceanic and Atmospheric Administration (NOAA) satellites https://climatedataguide.ucar.edu/climate-data/ndvi-normalized-difference-vegetation-index-3rd-generation-nasagfsc-gimms (National Center for Atmospheric Research Staff, 2018). The water towers analyzed data sets are summarized in Table A1 for each water tower, and the full analysis is available in the SESAM project SharePoint. The data can be provided upon request from the first author (charles.wamucii@wur.nl).
CNW and AJT designed the study. CNW performed the analysis and drafted the paper. PRO, AL, and JMG contributed to the analysis of the results and editing of the paper. AJT oversaw and critically reflected on the analysis as the senior scientist.
The authors declare that they have no conflict of interest.
Publisher's note: Copernicus Publications remains neutral with regard to jurisdictional claims in published maps and institutional affiliations.
This research was made possible by Wageningen University through the Scenario Evaluation for Sustainable Agro-forestry Management (SESAM) project that was funded by its Interdisciplinary Research and Education Fund (INREF).
This research has been supported by the Wageningen University Fund (INREF; Scenario Evaluation for Sustainable Agro-forestry Management (SESAM) Project).
This paper was edited by Daniel Viviroli and reviewed by Meine van Noordwijk and two anonymous referees.
Alcamo, J., Flörke, M., and Märker, M.: Future long-term changes in global water resources driven by socio-economic and climatic changes, Hydrolog. Sci. J., 52, 247–275, https://doi.org/10.1623/hysj.52.2.247, 2007.
Aleman, J. C., Jarzyna, M. A., and Staver, A. C.: Forest extent and deforestation in tropical Africa since, Nat. Ecol. Evol., 2, 26–33, https://doi.org/10.1038/s41559-017-0406-1, 2018.
Astuti, H. P. and Suryatmojo, H.: Water in the forest: Rain-vegetation interaction to estimate canopy interception in a tropical borneo rainforest, IOP Conf. Ser. Earth Environ. Sci., 361, 012035, https://doi.org/10.1088/1755-1315/361/1/012035, 2019.
Bai, P., Zhang, D., and Liu, C.: Estimation of the Budyko model parameter for small basins in China, Hydrol. Process., 34, 125–138, https://doi.org/10.1002/hyp.13577, 2019.
Booij, M. J., Schipper, T. C., and Marhaento, H.: Attributing changes in streamflow to land use and climate change for 472 catchments in australia and the United States, Water, 11, 1059, https://doi.org/10.3390/w11051059, 2019.
Bosch, J. M. and Hewlett, J. D.: A review of catchment experiments to determine the effect of vegetation changes on water yield and evapotranspiration, J. Hydrol., 55, 3–23, https://doi.org/10.1016/0022-1694(82)90117-2, 1982.
Budyko, M. I.: Climate and Life, Acad. Press, New York, 18, 1st Edition, 1974.
Chebet, C.: Environmental degradation to blame for swelling of Rift Valley lakes, Stand. Media, Kenya, 2020.
Chepkoech, A.: Kenya: Rift Valley Lakes Water Levels Rise Dangerously, Dly. Nation, Kenya, 2020.
Climatic Research Unit (University of East Anglia) and NCAS: High-resolution gridded datasets (and derived products), available at: https://crudata.uea.ac.uk/cru/data/hrg/, last access: 22 July 2020.
Convention on Biological Diversity: Biodiversity of Dry and Sub-Humid Land Ecosystems, Secr. Conv. Biol. Divers., available at: https://www.cbd.int/gbo1/chap-01.shtml (last access: 20 May 2021), 2007.
Creed, I. and Spargo, A.: Application of the Budyko curve to explore sustainability of water yields from headwater catchments under changing environmental conditions, in: Ecological Society of America, 5–10 August 2012, Portland, 2012a.
Creed, I. and Spargo, A.: Budyko guide to exploring sustainability of water yields from catchments under changing environmental conditions, Meet. IAHS-PUB (Prediction Ungauged Basins) Symp. “Completion IAHS Decad. Predict. Ungauged Basins W. ahead”, 59, 2012b.
Creed, I., Spargo, A., Jones, J., Buttle, J., Adams, M., Beall, F. D., Booth, E. G., Campbell, J. L., Clow, D., Elder, K., Green, M. B., Grimm, N. B., Miniat, C., Ramlal, P., Saha, A., Sebestyen, S., Spittlehouse, D., Sterling, S., Williams, M. W., Winkler, R., and Yao, H.: Changing forest water yields in response to climate warming: Results from long-term experimental watershed sites across North America, Glob. Change Biol., 20, 3191–3208, https://doi.org/10.1111/gcb.12615, 2014.
Daron, J. D.: Regional Climate Messages: East Africa, Scientific report from the CARIAA Adaptation at Scale in Semi-Arid Regions (ASSAR), Project Report, University of Cape Town, South Africa, 2014.
Dawson, J. B.: The Gregory Rift Valley and Neogene-recent Volcanoes of Northern Tanzania, Geological Society, Memoir 13, 2008.
Dewi, S., Van Noordwijk, M., Zulkarnain, M. T., Dwiputra, A., Hyman, G., Prabhu, R., Gitz, V., and Nasi, R.: Tropical forest-transition landscapes: a portfolio for studying people, tree crops and agro-ecological change in context, Int. J. Biodivers. Sci. Ecosyst. Serv. Manag., 13, 312–329, https://doi.org/10.1080/21513732.2017.1360394, 2017.
Dey, P. and Mishra, A.: Separating the impacts of climate change and human activities on streamflow: A review of methodologies and critical assumptions, J. Hydrol., 548, 278–290, https://doi.org/10.1016/j.jhydrol.2017.03.014, 2017.
Donohue, R. J., Roderick, M. L., and McVicar, T. R.: On the importance of including vegetation dynamics in Budyko's hydrological model, Hydrol. Earth Syst. Sci., 11, 983–995, https://doi.org/10.5194/hess-11-983-2007, 2007.
Du, C., Sun, F., Yu, J., Liu, X., and Chen, Y.: New interpretation of the role of water balance in an extended Budyko hypothesis in arid regions, Hydrol. Earth Syst. Sci., 20, 393–409, https://doi.org/10.5194/hess-20-393-2016, 2016.
EAC, UNEP, and GRID-Arendal: Sustainable Mountain Development in East Africa in a Changing Climate, East African Community, United Nations Environment Programme and GRID-Arendal, Arusha, Nairobi and Arendal, 100 pp., 2016.
El Tom, M. A.: The Reliability of Rainfall over the Sudan, Geogr. Ann. Ser. A , 54, 28–31, 1972.
Ekström, M., Jones, P. D., Fowler, H. J., Lenderink, G., Buishand, T. A., and Conway, D.: Regional climate model data used within the SWURVE project – 1: projected changes in seasonal patterns and estimation of PET, Hydrol. Earth Syst. Sci., 11, 1069–1083, https://doi.org/10.5194/hess-11-1069-2007, 2007.
Ellison, D., Morris, C. E., Locatelli, B., Sheil, D., Cohen, J., Murdiyarso, D., Gutierrez, V., Noordwijk, M. van, Creed, I. F., Pokorny, J., Gaveau, D., Spracklen, D. V., Tobella, A. B., Ilstedt, U., Teuling, A. J., Gebrehiwot, S. G., Sands, D. C., Muys, B., Verbist, B., Springgay, E., Sugandi, Y., and Sullivan, C. A.: Trees, forests and water: Cool insights for a hot world, Global Environ. Chang., 43, 51–61, https://doi.org/10.1016/j.gloenvcha.2017.01.002, 2017.
Fekete, B. M., Vörösmarty, C. J., and Grabs, W.: High-resolution fields of global runoff combining observed river discharge and simulated water balances, Global Biogeochem. Cy., 16, 15-1–15-10, https://doi.org/10.1029/1999gb001254, 2002.
Frank, D. C., Poulter, B., Saurer, M., Esper, J., Huntingford, C., Helle, G., and Treydte, K.: Water-use efficiency and transpiration across European forests during the Anthropocene, Nat. Clim. Change, 5, 579–584, https://doi.org/10.1038/NCLIMATE2614, 2015.
Funk, C., Peterson, P., Landsfeld, M., Pedreros, D., Verdin, J., Shukla, S., Husak, G., Rowland, J., Harrison, L., Hoell, A., and Michaelsen, J.: The climate hazards infrared precipitation with stations – A new environmental record for monitoring extremes, Sci. Data, 2, 1–21, https://doi.org/10.1038/sdata.2015.66, 2015.
Gabiri, G., Diekkrüger, B., Näschen, K., Leemhuis, C., van der Linden, R., Mwanjalolo Majaliwa, J. G., and Obando, J. A.: Impact of Climate and Land Use/Land Cover Change on the Water Resources of a Tropical Inland Valley, 83, 1–25, 2020.
Gash, J. H. C., Wright, I. R., and Lloyd, C. R.: Comparative estimates of interception loss from three coniferous forests in Great Britain, J. Hydrol., 48, 89–105, https://doi.org/10.1016/0022-1694(80)90068-2, 1980.
Gebrehiwot, S. G., Gärdenäs, A. I., Bewket, W., Seibert, J., Ilstedt, U., and Bishop, K.: The long-term hydrology of East Africa's water tower: Statistical change detection in the watersheds of the Abbay Basin, Reg. Environ. Change, 14, 321–331, https://doi.org/10.1007/s10113-013-0491-x, 2014.
Giannini, A., Lyon, B., Seager, R., and Vigaud, N.: Dynamical and Thermodynamic Elements of Modeled Climate Change at the East African Margin of Convection, Geophys. Res. Lett., 45, 992–1000, https://doi.org/10.1002/2017GL075486, 2018.
Gunkel, A. and Lange, J.: Water scarcity, data scarcity and the Budyko curve – An application in the Lower Jordan River Basin, J. Hydrol. Reg. Stud., 12, 136–149, https://doi.org/10.1016/j.ejrh.2017.04.004, 2017.
Guzha, A. C., Rufino, M. C., Okoth, S., Jacobs, S., and Nóbrega, R. L. B.: Impacts of land use and land cover change on surface runoff, discharge and low flows: Evidence from East Africa, J. Hydrol. Reg. Stud., 15, 49–67, https://doi.org/10.1016/j.ejrh.2017.11.005, 2018.
Han, J., Yang, Y., and Roderick, M. L.: Assessing the Steady – State Assumption in Water Balance Calculation Across Global Catchments, Water Resour. Res., 1–16, https://doi.org/10.1029/2020WR027392, 2020.
Harris, I., Osborn, T. J., Jones, P., and Lister, D.: Version 4 of the CRU TS monthly high-resolution gridded multivariate climate dataset, Sci. Data, 7, 1–18, https://doi.org/10.1038/s41597-020-0453-3, 2020.
Heidari, H., Warziniack, T., Brown, T. C., and Arabi, M.: Impacts of Climate Change on Hydroclimatic Conditions of U.S. National Forests and Grasslands, Forests, 12, 1–17, https://doi.org/10.3390/f12020139, 2021.
Helman, D., Lensky, I. M., Yakir, D., and Osem, Y.: Forests growing under dry conditions have higher hydrological resilience to drought than do more humid forests, Glob. Change Biol., 23, 2801–2817, https://doi.org/10.1111/gcb.13551, 2017.
Hulme, M.: The Changing Rainfall Resources of Sudan, R. Geogr. Soc., 15, 21–34, https://doi.org/10.2307/623090, 1990.
Huntington, T. G.: CO2-induced suppression of transpiration cannot explain increasing runoff, Hydrol. Process., 22, 311–314, https://doi.org/10.1002/hyp.6925, 2008.
Hyandye, C. B., Worqul, A., Martz, L. W., and Muzuka, A. N. N.: The impact of future climate and land use/cover change on water resources in the Ndembera watershed and their mitigation and adaptation strategies, Environ. Syst. Res., 7, 7, https://doi.org/10.1186/s40068-018-0110-4, 2018.
Immerzeel, W. W., Lutz, A. F., Andrade, M., Bahl, A., Biemans, H., Bolch, T., Hyde, S., Brumby, S., Davies, B. J., Elmore, A. C., Emmer, A., Feng, M., Fernández, A., Haritashya, U., Kargel, J. S., Koppes, M., Kraaijenbrink, P. D. A., Kulkarni, A. V., Mayewski, P. A., Nepal, S., Pacheco, P., Painter, T. H., Pellicciotti, F., Rajaram, H., Rupper, S., Sinisalo, A., Shrestha, A. B., Viviroli, D., Wada, Y., Xiao, C., Yao, T., and Baillie, J. E. M.: Importance and vulnerability of the world's water towers, Nature, 577, 364–369, https://doi.org/10.1038/s41586-019-1822-y, 2020.
Integrating Population, Health, and Environment in Ethiopia's Bale Mountains: https://www.newsecuritybeat.org/2010/04/integrating-population-health-and-environment-in-ethiopias-bale-mountains, last access: 19 May 2021.
Jacobs, S. R., Timbe, E., Weeser, B., Rufino, M. C., Butterbach-Bahl, K., and Breuer, L.: Assessment of hydrological pathways in East African montane catchments under different land use, Hydrol. Earth Syst. Sci., 22, 4981–5000, https://doi.org/10.5194/hess-22-4981-2018, 2018.
Jiang, C., Xiong, L., Wang, D., Liu, P., Guo, S., and Xu, C. Y.: Separating the impacts of climate change and human activities on runoff using the Budyko-type equations with time-varying parameters, J. Hydrol., 522, 326–338, https://doi.org/10.1016/j.jhydrol.2014.12.060, 2015.
Kalisa, W., Igbawua, T., Henchiri, M., Ali, S., Zhang, S., Bai, Y., and Zhang, J.: Assessment of climate impact on vegetation dynamics over East Africa from 1982 to 2015, Sci. Rep.-UK, 9, 1–20, https://doi.org/10.1038/s41598-019-53150-0, 2019.
Keys, P. W., Barnes, E. A., van der Ent, R. J., and Gordon, L. J.: Variability of moisture recycling using a precipitationshed framework, Hydrol. Earth Syst. Sci., 18, 3937–3950, https://doi.org/10.5194/hess-18-3937-2014, 2014.
Kirkby, M., Bracken, L., and Reaney, S.: The influence of land use, soils and topography on the delivery of hillslope runoff to channels in SE Spain, Earth Surf. Proc. Land., 27, 1459–1473, https://doi.org/10.1002/esp.441, 2002.
Kiteme, B. P., Liniger, H., and Notter, B.: Dimensions of Global Change in African Mountains : The Example of Mount Kenya, IHDP, 2, 18–22, 2008.
Knoben, W. J. M., Freer, J. E., and Woods, R. A.: Technical note: Inherent benchmark or not? Comparing Nash–Sutcliffe and Kling–Gupta efficiency scores, Hydrol. Earth Syst. Sci., 23, 4323–4331, https://doi.org/10.5194/hess-23-4323-2019, 2019.
Krakauer, N. Y., Lakhankar, T., and Anadón, J. D.: Mapping and Attributing Normalized Difference Vegetation Index Trends for Nepal, Remote Sens., 9, 1–15, https://doi.org/10.3390/rs9100986, 2017.
Lambrechts, C., Woodley, B., Hemp, A., Hemp, C., and Nnyiti, P.: Aerial Survey of the Threats to Mt. Kilimanjaro Forests. Community Management of Protected Areas Conservation Project, The GEF Small Grants Programme Report, 2002.
Li, C., Chai, Y., Yang, L., and Li, H.: Spatio-temporal distribution of flood disasters and analysis of influencing factors in Africa, Nat. Hazards, 82, 721–731, https://doi.org/10.1007/s11069-016-2181-8, 2016.
Li, D., Pan, M., Cong, Z., Zhang, L., and Wood, E.: Vegetation control on water and energy balance within the Budyko framework, Water Resour. Res., 49, 969–976, https://doi.org/10.1002/wrcr.20107, 2013.
Liniger, H., Gikonyo, J., Kiteme, B., and Wiesmann, U.: Assessing and Managing Scarce Tropical Mountain Water Resources, Mt. Res. Dev., 25, 163–173, https://doi.org/10.1659/0276-4741(2005)025[0163:AAMSTM]2.0.CO;2, 2005.
Liu, X., Liu, W., and Xia, J.: Comparison of the streamflow sensitivity to aridity index between the Danjiangkou Reservoir basin and Miyun Reservoir basin, China, Theor. Appl. Climatol., 111, 683–691, https://doi.org/10.1007/s00704-012-0701-3, 2013.
Ma, X., Lu, X. X., van Noordwijk, M., Li, J. T., and Xu, J. C.: Attribution of climate change, vegetation restoration, and engineering measures to the reduction of suspended sediment in the Kejie catchment, southwest China, Hydrol. Earth Syst. Sci., 18, 1979–1994, https://doi.org/10.5194/hess-18-1979-2014, 2014.
Mamuye, M.: Review on Impacts of Climate Change on Watershed Hydrology, J. Environ. Earth Sci., 8, 91–99, 2018.
Mango, L. M., Melesse, A. M., McClain, M. E., Gann, D., and Setegn, S. G.: Land use and climate change impacts on the hydrology of the upper Mara River Basin, Kenya: results of a modeling study to support better resource management, Hydrol. Earth Syst. Sci., 15, 2245–2258, https://doi.org/10.5194/hess-15-2245-2011, 2011.
Marhaento, H., Booij, M. J., and Hoekstra, A. Y.: Attribution of changes in stream flow to land use change and climate change in a mesoscale tropical catchment in Java, Indonesia, Hydrol. Res., 48, 1143–1155, https://doi.org/10.2166/nh.2016.110, 2017.
Mianabadi, A., Davary, K., Pourreza-Bilondi, M., and Coenders-Gerrits, A. M. J.: Budyko framework; towards non-steady state conditions, J. Hydrol., 588, 125089, https://doi.org/10.1016/j.jhydrol.2020.125089, 2020.
Muthoni, F. K., Odongo, V. O., Ochieng, J., Mugalavai, E. M., Mourice, S. K., Hoesche-Zeledon, I., Mwila, M., and Bekunda, M.: Long-term spatial-temporal trends and variability of rainfall over Eastern and Southern Africa, Theor. Appl. Climatol., 137, 1869–1882, https://doi.org/10.1007/s00704-018-2712-1, 2019.
Mwangi, H. M., Julich, S., Patil, S. D., McDonald, M. A., and Feger, K. H.: Relative contribution of land use change and climate variability on discharge of upper Mara River, Kenya, J. Hydrol. Reg. Stud., 5, 244–260, https://doi.org/10.1016/j.ejrh.2015.12.059, 2016.
National Center for Atmospheric Research Staff (Eds.): The Climate Data Guide: NDVI: Normalized Difference Vegetation Index-3rd generation: NASA/GFSC GIMMS, available at: https://climatedataguide.ucar.edu/climate-data/ndvi-normalized-difference-vegetation-index-3rd-generation-nasagfsc-gimms (last access: 12 July 2020), 2018.
Ndomba, O. A., Bakengesa, S., Petro, R., Maguzu, J., Chamshama, S. A. O., Kiimu, H. R., and Lema, M.: Perils of taungya to the productivity of forest plantations and need for modification: case study of Meru forest plantation in Tanzania., Int. J. Agric. For., 5, 267–275, 2015.
Niang, I., Ruppel, O. C., Abdrabo, M. A., Essel, A., Lennard, C., Padgham, J., and Urquhart, P.: Africa, in: Climate Change 2014: Impacts, Adaptation, and Vulnerability, in: Part B: Regional Aspects. Contribution of Working Group II to the Fifth Assessment Report of the Intergovernmental Panel on Climate Change, edited by: Barros, V. R., Field, C. B., Dokken, D. J., Mastrandrea, M. D., Mach, K. J., Bilir, T. E., Chatterjee, M., Ebi, K. L., Estr, Y. O., edited by: Barros, V. R., Field, C. B., Dokken, D. J., Mastrandrea, M. D., and Mach, K. J., Cambridge University Press, Cambridge, 1199–1265, https://doi.org/10.1017/CBO9781107415386.002, 2014.
Nicholson, S. E.: Climate and climatic variability of rainfall over eastern Africa, Rev. Geophys., 55, 590–635, https://doi.org/10.1002/2016RG000544, 2017.
Nyongesa, K. W. and Vacik, H.: Evaluating management strategies for Mount Kenya Forest Reserve and National Park to reduce fire danger and address interests of various stakeholders, 10, 426, https://doi.org/10.3390/f10050426, 2019.
Omambia, A. N., Shemsanga, C., and Hernandez, I. A. S.: Climate Change Impacts, Vulnerability, and Adaptation in East Africa (EA) and South America (SA), B. Handb. Clim. Chang. Mitig., 1–4, 573–620, https://doi.org/10.1007/978-1-4419-7991-9_17, 2012.
Otieno, V. O. and Anyah, R. O.: Effects of land use changes on climate in the Greater Horn of Africa, Clim. Res., 52, 77–95, https://doi.org/10.3354/cr01050, 2012.
Patel, K.: Rising Waters on Kenya's Great Rift Valley Lakes, Earth Obs. NASA, available at: https://earthobservatory.nasa.gov/images/147226/rising-waters-on-kenyas-great-rift-valley-lakes (last access: 15 May 2021), 2020.
Pinzon, J. E. and Tucker, C. J.: A non-stationary 1981–2012 AVHRR NDVI3g time series, Remote Sens., 6, 6929–6960, https://doi.org/10.3390/rs6086929, 2014.
Redhead, J. W., Stratford, C., Sharps, K., Jones, L., Ziv, G., Clarke, D., Oliver, T. H., and Bullock, J. M.: Empirical validation of the InVEST water yield ecosystem service model at a national scale, Sci. Total Environ., 569–570, 1418–1426, https://doi.org/10.1016/j.scitotenv.2016.06.227, 2016.
Roderick, M. L. and Farquhar, G. D.: A simple framework for relating variations in runoff to variations in climatic conditions and catchment properties, Water Resour. Res., 47, 1–11, https://doi.org/10.1029/2010WR009826, 2011.
Røhr, P. C. and Killingtveit, Å.: Rainfall distribution on the slopes of Mt Kilimanjaro, Hydrolog. Sci. J., 48, 65–77, https://doi.org/10.1623/hysj.48.1.65.43483, 2003.
Sankarasubramanian, A., Vogel, R. M., and Limbrunner, J. F.: Climate elasticity of streamflow in the United States, Water Resour. Res., 37, 1771–1781, https://doi.org/10.1029/2000WR900330, 2001.
Schaake, J. S.: From climate to flow, in: Climate Change and US Water Resources, edited by: Waggoner, P. E., John Wiley, New York, 177–206, 1990.
Scoon, R. N.: Geotourism, Iconic Landforms and Island-Style Speciation Patterns in National Parks of East Africa, 12, 66, https://doi.org/10.1007/s12371-020-00486-z, 2020.
Sinha, J., Sharma, A., Khan, M., and Goyal, M. K.: Assessment of the impacts of climatic variability and anthropogenic stress on hydrologic resilience to warming shifts in Peninsular India, Sci. Rep.-UK, 8, 1–14, https://doi.org/10.1038/s41598-018-32091-0, 2018.
Sun, Y., Tian, F., Yang, L., and Hu, H.: Exploring the spatial variability of contributions from climate variation and change in catchment properties to streamflow decrease in a mesoscale basin by three different methods, J. Hydrol., 508, 170–180, https://doi.org/10.1016/j.jhydrol.2013.11.004, 2014.
Tallents, L. A. and Macdonald, D. W.: Mapping high-altitude vegetation in the Bale Mountains, Ethiopia, in: Walia—Special Edition on the Bale Mountains, edited by: Randall, D., Thirgood, S., and Kinahan, A., Frankfurt Zoological Society, Addis Ababa, 97–117, 2011.
Tech, J.: About SWAT+ − SWAT+ Documentation, Texas A&M Univ. – TAMU, 126, available at: https://swatplus.gitbook.io/docs/ (last access: 31 May 2021), 2019.
Teng, J., Chiew, F. H. S., Vaze, J., Marvanek, S., and Kirono, D. G. C.: Estimation of climate change impact on mean annual runoff across continental Australia using Budyko and Fu equations and hydrological models, J. Hydrometeorol., 13, 1094–1106, https://doi.org/10.1175/JHM-D-11-097.1, 2012.
Teuling, A. J.: A Forest Evapotranspiration Paradox Investigated Using Lysimeter Data, Vadose Zone J., 17, 170031, https://doi.org/10.2136/vzj2017.01.0031, 2018.
Teuling, A. J. and Hoek van Dijke, A. J.: Forest age and water yield, Nature, 578, E16–E18, https://doi.org/10.1038/s41586-020-1941-5, 2020.
Teuling, A. J., de Badts, E. A. G., Jansen, F. A., Fuchs, R., Buitink, J., Hoek van Dijke, A. J., and Sterling, S. M.: Climate change, reforestation/afforestation, and urbanization impacts on evapotranspiration and streamflow in Europe, Hydrol. Earth Syst. Sci., 23, 3631–3652, https://doi.org/10.5194/hess-23-3631-2019, 2019.
The Nature Conservancy: Global Ecoregions, Major Habitat Types, Biogeographical Realms and The Nature Conservancy Terrestrial Assessment Units, Nat. Conserv, available at: https://tnc.maps.arcgis.com/apps/mapviewer/index.html?layers=7b7fb9d945544d41b3e7a91494c42930 (last access: 26 July 2020), 2012.
Troch, P. A., Carrillo, G., Sivapalan, M., Wagener, T., and Sawicz, K.: Climate-vegetation-soil interactions and long-term hydrologic partitioning: signatures of catchment co-evolution, Hydrol. Earth Syst. Sci., 17, 2209–2217, https://doi.org/10.5194/hess-17-2209-2013, 2013.
Tucker, C. J., Pinzon, J. E., Brown, M. E., Slayback, A., Pak, E. W., Mahoney, R., Vermote, E. F., and Saleous, N. E. L.: An extended AVHRR 8-kni NDVI dataset compatible with MODISand SPOT vegetation NDVI data, Int. J. Remote Sens., 26, 4485–4498, 2005.
Ulrich, A., Ifejika Speranza, C., Roden, P., Kiteme, B., Wiesmann, U., and Nüsser, M.: Small-scale farming in semi-arid areas: Livelihood dynamics between 1997 and 2010 in Laikipia, Kenya, J. Rural Stud., 28, 241–251, https://doi.org/10.1016/j.jrurstud.2012.02.003, 2012.
UNEP: “Africa Water Atlas”. Division of Early Warning and Assessment (DEWA), United Nations Environ. Program, (UNEP), Nairobi, Kenya, 2010.
UNEP: Africa Mountains Atlas, United Nations Environment Programme (2014), available at: https://wedocs.unep.org/handle/20.500.11822/9301 (last access: 24 April 2021), 310 pp., 2014.
University of California: CHIRPS: Rainfall Estimates from Rain Gauge and Satellite Observations, available at: https://www.chc.ucsb.edu/data/chirps, last access: 31 July 2020.
USAID: Virunga Landscape Factsheet, available at: https://carpe.umd.edu/sites/default/files/documentsarchive/CAFEC_Virunga Fact Sheet.pdf (last access: 24 April 2021), 2013.
Van der Velde, Y., Vercauteren, N., Jaramillo, F., Dekker, S. C., Destouni, G., and Lyon, S. W.: Exploring hydroclimatic change disparity via the Budyko framework, Hydrol. Process., 28, 4110–4118, https://doi.org/10.1002/hyp.9949, 2014.
Van den Hende, C., Van Schaeybroeck, B., Nyssen, J., Van Vooren, S., Van Ginderachter, M., and Termonia, P.: Analysis of rain-shadows in the Ethiopian Mountains using climatological model data, Clim. Dynam., 56, 1663–1679, https://doi.org/10.1007/s00382-020-05554-2, 2021.
Van Dijk, A. I. J. M., Gash, J. H., Van Gorsel, E., Blanken, P. D., Cescatti, A., Emmel, C., Gielen, B., Harman, I. N., Kiely, G., Merbold, L., Montagnani, L., Moors, E., Sottocornola, M., Varlagin, A., Williams, C. A., and Wohlfahrt, G.: Rainfall interception and the coupled surface water and energy balance, Agr. Forest Meteorol., 214–215, 402–415, https://doi.org/10.1016/j.agrformet.2015.09.006, 2015.
Van Noordwijk, M., Speelman, E., Hofstede, G. J., Farida, A., Wamucii, C. N., Kimbowa, G., Geraud, G., Assogba, C., Best, L., Tanika, L., Githinji, M., Rosero, P., Sari, R. R., Satnarain, U., Adiwibowo, S., Ligtenberg, A., Muthuri, C., Marielos Purwanto, E. P.-C., van Oel, P., Rozendaal, D., Suprayogo, D., and Teuling, A. J.: Sustainable Agroforestry Landscape Management: Changing the Game, Land, 9, 1–38, https://doi.org/10.3390/land9080243, 2020.
Viviroli, D. and Weingartner, R.: The hydrological significance of mountains: from regional to global scale, Hydrol. Earth Syst. Sci., 8, 1017–1030, https://doi.org/10.5194/hess-8-1017-2004, 2004.
Viviroli, D., Dürr, H. H., Messerli, B., Meybeck, M., and Weingartner, R.: Mountains of the world, water towers for humanity: Typology, mapping, and global significance, Water Resour. Res., 43, 1–13, https://doi.org/10.1029/2006WR005653, 2007.
Vye-Brown, C., Crummy, J., Smith, K., Mruma, A., and Kabelwa, H.: Mt Meru case study, Earthwise, available at: http://earthwise.bgs.ac.uk/index.php/OR/14/005_Mt_Meru_case_study (last access: 18 May 2021), 2014.
Wambua, C.: Why Kenya’s Rift Valley lakes are going through a crisis, Aljazeera, available at: https://www.aljazeera.com/news/2020/08/30/why-kenyas-rift-valley-lakes-are-going-through-a-crisis/ (last access: 2 July 2021), 2020.
Wei, X. and Zhang, M.: Research Methods for Assessing the Impacts of Forest Disturbance on Hydrology at Large-scale Watersheds, Landsc. Ecol. For. Manag. Conserv., 119–147, https://doi.org/10.1007/978-3-642-12754-0_6, 2011.
Western, A. W., Zhou, S. L., Grayson, R. B., McMahon, T. A., Blöschl, G., and Wilson, D. J.: Spatial correlation of soil moisture in small catchments and its relationship to dominant spatial hydrological processes, J. Hydrol., 286, 113–134, https://doi.org/10.1016/j.jhydrol.2003.09.014, 2004.
Woods, R.: The relative roles of climate, soil, vegetation and topography in determining seasonal and long-term catchment dynamics, Adv. Water Resour., 30, 1061, https://doi.org/10.1016/j.advwatres.2006.10.010, 2002.
WWF: Water towers of eastern Africa Policy, issues and vision for community-based protection and management of montane forests report, Nairobi, Kenya, available at: http://awsassets.panda.org/downloads/water_towers_policy_report_1.pdf (last access: 13 September 2020), 2005.
Xu, X., Liu, W., Scanlon, B. R., Zhang, L., and Pan, M.: Local and global factors controlling water-energy balances within the Budyko framework, Geophys. Res. Lett., 40, 6123–6129, https://doi.org/10.1002/2013GL058324, 2013.
Yan, D., Lai, Z., and Ji, G.: Using Budyko-type equations for separating the impacts of climate and vegetation change on runoff in the source area of the yellow river, Water, 12, 1–15, https://doi.org/10.3390/w12123418, 2020.
Yang, D., Shao, W., Yeh, P. J. F., Yang, H., Kanae, S., and Oki, T.: Impact of vegetation coverage on regional water balance in the nonhumid regions of China, Water Resour. Res., 45, 1–13, https://doi.org/10.1029/2008WR006948, 2009.
Yang, H., Qi, J., Xu, X., Yang, D., and Lv, H.: The regional variation in climate elasticity and climate contribution to runoff across China, J. Hydrol., 517, 607–616, https://doi.org/10.1016/j.jhydrol.2014.05.062, 2014.
Yuan, W., Piao, S., Qin, D., Dong, W., Xia, J., Lin, H., and Chen, M.: Influence of Vegetation Growth on the Enhanced Seasonality of Atmospheric CO2, Global Biogeochem. Cy., 32, 32–41, https://doi.org/10.1002/2017GB005802, 2017.
Yichuan, S.: Rwenzori Mountains National Park, 2017 Int. Union Conserv. Nat. UN Environ. World Conserv. Monit. Cent, available at: http://world-heritage-datasheets.unep-wcmc.org/datasheet/output/site/rwenzori-mountains-national-park/#:~:text=Local Human Population,-In 1910%2C the&text=The region is one of,people (Loefler%2C 1997, (last access: 18 May 2021), 2011.
Zeng, F., Ma, M. G., Di, D. R., and Shi, W. Y.: Separating the impacts of climate change and human activities on runoff: A review of method and application, Water, 12, 1–17, https://doi.org/10.3390/W12082201, 2020.
Zhang, L., Dawes, W. R., and Walker, G. R.: Response of mean annual evapotranspiration to vegetation changes at catchment scale, Water Resour. Res., 37, 701–708, https://doi.org/10.1029/2000WR900325, 2001.
Zhang, L., Hickel, K., Dawes, W. R., Chiew, F. H. S., Western, A. W., and Briggs, P. R.: A rational function approach for estimating mean annual evapotranspiration, Water Resour. Res., 40, 1–14, https://doi.org/10.1029/2003WR002710, 2004.
Zhang, M., Wei, X., Sun, P., and Liu, S.: The effect of forest harvesting and climatic variability on runoff in a large watershed: The case study in the Upper Minjiang River of Yangtze River basin, J. Hydrol., 464–465, 1–11, https://doi.org/10.1016/j.jhydrol.2012.05.050, 2012.
Zimmermann, L., Frühauf, C., and Bernhofer, C.: The role of interception in the water budget of spruce stands in the Eastern Ore Mountains/Germany, Phys. Chem. Earth, Pt. B, 24, 809–812, https://doi.org/10.1016/S1464-1909(99)00085-4, 1999.