the Creative Commons Attribution 4.0 License.
the Creative Commons Attribution 4.0 License.
 | 07 Oct 2021
Technical note: Evaporating water is different from bulk soil water in δ2H and δ18O and has implications for evaporation calculation
Hongxiu Wang
Jingjing Jin
Buli Cui
Xiaojun Ma
Mingyi Wen
Soil evaporation is a key process in the water cycle and can be conveniently quantified using δ2H and δ18O in bulk surface soil water (BW). However, recent research shows that soil water in larger pores evaporates first and differs from water in smaller pores in δ2H and δ18O, which disqualifies the quantification of evaporation from BW δ2H and δ18O. We hypothesized that BW had different isotopic compositions from evaporating water (EW). Therefore, our objectives were to test this hypothesis first and then evaluate whether the isotopic difference alters the calculated evaporative water loss. We measured the isotopic composition of soil water during two continuous evaporation periods in a summer maize field. Period I had a duration of 32 d, following a natural precipitation event, and period II lasted 24 d, following an irrigation event with a 2H-enriched water. BW was obtained by cryogenically extracting water from samples of 0–5 cm soil taken every 3 d; EW was derived from condensation water collected every 2 d on a plastic film placed on the soil surface. The results showed that when event water was heavier than pre-event BW, δ2H of BW in period II decreased, with an increase in evaporation time, indicating heavy water evaporation. When event water was lighter than the pre-event BW, δ2H and δ18O of BW in period I and δ18O of BW in period II increased with increasing evaporation time, suggesting light water evaporation. Moreover, relative to BW, EW had significantly smaller δ2H and δ18O in period I and significantly smaller δ18O in period II (p<0.05). These observations suggest that the evaporating water was close to the event water, both of which differed from the bulk soil water. Furthermore, the event water might be in larger pores from which evaporation takes precedence. The soil evaporative water losses derived from EW isotopes were compared with those from BW. With a small isotopic difference between EW and BW, the evaporative water losses in the soil did not differ significantly (p>0.05). Our results have important implications for quantifying evaporation processes using water stable isotopes. Future studies are needed to investigate how soil water isotopes partition differently between pores in soils with different pore size distributions and how this might affect soil evaporation estimation.
- Article
(5295 KB) - Full-text XML
-
Supplement
(106 KB) - BibTeX
- EndNote


Terrestrial ecosystems receive water from precipitation and subsequently release all or part of the water to the atmosphere through evapotranspiration. The evapotranspiration process consumes approximately 25 % of the incoming solar energy (Trenberth et al., 2009) and can be divided into two components, namely transpiration from plant leaves and evaporation from the soil surface. Soil evaporation varies from 10 % to 60 % of the total precipitation (Good et al., 2015; Oki and Kanae, 2006). Precise estimation of soil evaporative water loss relative to precipitation is critical for improving our knowledge of water budgets, plant water use efficiency, global ecosystem productivity, allocation of increasingly scarce water resources, and calibrating hydrological and climatic models (Kool et al., 2014; Oki and Kanae, 2006; Or et al., 2013; Or and Lehmann, 2019; Wang et al., 2014).
Water loss from soil progresses with air invasion into the soil in the order of large to small pores (Aminzadeh and Or, 2014; Lehmann and Or, 2009; Or et al., 2013). Soil pores can be divided into large, medium, and small pores. There is a minimum amount of small pore water at which liquid water in soil is still continuous or connected and below which liquid water is hydraulically disconnected, and vapor transport is the only way to further reduce water in soil. This water content is called the residual water content in the soil characteristic curve (Van Genuchten, 1980; Zhang et al., 2015). When large soil pores are filled with water, water in small pores does not participate in evaporation (Or and Lehmann, 2019; Zhang et al., 2015). Therefore, soil evaporation can be divided into three stages (Hillel, 1998; Or et al., 2013). Stage I is the evaporation front in the surface soil, and water in large and medium pores participates in evaporation, but larger pores are the primary contributors. With the progressive reduction of water in the larger pores, the evaporation rate gradually decreases. Stage II is the evaporation front still in the surface soil, but larger pores are filled with air, with water residing in the medium soil pores in the surface soil evaporates, and deep larger soil pores recharge the surface medium pores by capillary pull (Or and Lehmann, 2019), and the evaporation rate remains constant. Stage III is when the hydraulic connectivity between the surface medium pores and deep large pores breaks, such that the evaporation front recedes into the subsurface soil. Water in the surface small pores and water in medium pores on the evaporation front evaporates. The evaporation rate decreases to a low value (Or et al., 2013).
Furthermore, water in small pores and large pores may differ in isotopic compositions. As is well-known, pre-event soil water occupies the smallest pores. Depending on the rainfall amount and intensity, an event water may have three pathways. First, a subsequent small event water fills the empty small soil pores. Second, event water with small rates, but long duration, may also displace the pre-existing, saturated smaller pores with slow flow velocity (Beven and Germann, 1982; Brooks et al., 2010; Klaus et al., 2013; Sklash et al., 1996); in cases where the water flows into a relatively impermeable layer, the pre-event water in smaller pores may be forced into large pores due to the underlining hydraulic barriers (Si et al., 2017). Third, when the event water is large and intense, the event water preferentially enters large pores, bypassing the saturated small pores with large flow velocity (Beven and Germann, 1982; Booltink and Bouma, 1991; Kumar et al., 1997; Levy and Germann, 1988; Radolinski et al., 2021; Sprenger and Allen, 2020). Because the exchange rate between these two flow domains is small (Šimůnek and van Genuchten, 2008), small pores will lock the signature of first filling water. As the flow velocity is determined by the soil pore size, larger pores have greater hydraulic conductivity, and consequently, water residing in larger pores flows faster and, thus, drains first. Conversely, water residing in small pores drains last (Gerke and Van Genuchten, 1993; Phillips, 2010; Van Genuchten, 1980). Therefore, soil water in smaller pores has a longer residence time or memory (Sprenger et al., 2019b), while water in large pores generally have a short memory. This differing memory between large pore and smaller pores, due to the sequence of water infiltration and drainage, could introduce variability in the isotopic composition between soil pore spaces.
Additionally, due to seasonal, temperature, and amount effects of local precipitation events, there is strong temporal variation in the isotopic composition of precipitation (Kendall and McDonnell, 2012). As a result, precipitation events, differing in isotopic compositions, could recharge different soil pores, which may yield isotopic heterogeneities in soil pore spaces (Brooks et al., 2010; Goldsmith et al., 2012; Good et al., 2015). Isotopically, small-pore water may be similar to old precipitation, with large-pore water resembling new precipitation (Sprenger et al., 2019a, b).
The isotopic variations in the soil pore space could also result from mineral–water interaction, soil particle surface adsorption, and soil tension (Gaj et al., 2017a; Gaj and McDonnell, 2019; Oerter et al., 2014; Orlowski and Breuer, 2020; Thielemann et al., 2019).
Despite the recent progress in understanding evaporation processes and isotope partitioning in soil pore space, the latter, to the best of our knowledge, is not considered in the calculation of soil evaporative water loss in terms of the isotope-based method. The isotopic composition of bulk soil water, which is extracted by cryogenic vacuum distillation, containing all pore water, is still routinely used in evaporation calculations using the Craig–Gordon model (Allison and Barnes, 1983; Dubbert et al., 2013; Good et al., 2014; Robertson and Gazis, 2006; Sprenger et al., 2017). This might bias the evaporation estimates because of isotopic variation in pore space and the preference for larger-pore water by evaporation.
Therefore, we hypothesize that the isotopic composition in evaporating water (EW) is similar to that of water in larger pores but differs from that in bulk surface soil water (BW); thus, evaporative water loss based on isotope values in BW will be biased. The objectives of this study were to verify (1) whether isotopic compositions differ between EW and BW and (2) if the isotopic composition difference substantially biases the calculated evaporative water loss. This study may help improve our understanding of soil evaporation and ecohydrological processes.
2.1 Experimental site
The field experiment was conducted from June to September 2016 at Huangjiabao village (34∘17′ N, 108∘05′ E, 534 m a.s.l. – above sea level), located in the southern Chinese Loess Plateau. The study site experiences a temperate, semi-humid climate, with a mean annual temperature of 13 ∘C, precipitation of 620 mm, and potential evaporation of 1400 mm (Liang et al., 2012). Winter wheat followed by summer maize rotation is routine practice in this region (Chen et al., 2015).
2.2 Experimental design
A summer maize field (35 m long and 21 m wide) was selected for this study. On 18 June 2016, maize seeds were sown in alternating row spaces of 70 cm and 40 cm, with 30 cm seed intervals in each row. Seeds were planted at a depth of 5 cm beneath the soil surface using a hole-sowing machine. On 26 August 2016, the field was irrigated with 30 mm water ( ‰; ‰; n=5) which was a mixture of tap water ( ‰; ‰) and deuterium-enriched water (the 2H concentration was 99.96 %; ‰; Cambridge Isotope Laboratories, Inc., Tewksbury, MA, USA).
2.3 Samples collection and measurement
A randomized replication design was used to collect samples. To determine the water isotopic composition in EW from the condensation water of the evaporation vapor, we randomly selected three rectangular plots (40 cm long and 30 cm wide) in the field. A channel of 3 cm deep was dug around the edge of the plot (Fig. 1). Subsequently, a piece of plastic film without holes (approximately 0.2 m2; 40 and 50 cm) was used to cover the soil surface, with an extra 5 cm on each side. The channels were then backfilled with soil to keep the covered area free of the wind. To eliminate the secondary evaporation of the condensation water, we first allowed evaporation and condensation to equilibrate for 2 d under the plastic film. Then, in the early morning (approximately 07:00 LT – local time), we collected the condensation water adhered to the underside of the plastic film using an injection syringe (Fig. 1a). The collected water was immediately transferred into a 1 mL glass vial. Therefore, it is reasonable to assume that the condensation water was in constant equilibrium with the evaporating water in the soil, and the water isotopes of evaporating water in the soil could be obtained from condensation water on the plastic film. After collection, the plastic film was removed with little disturbance to the site. Subsequently, three new plots were selected randomly and, similarly, covered with a new piece of plastic film for the next water collection.
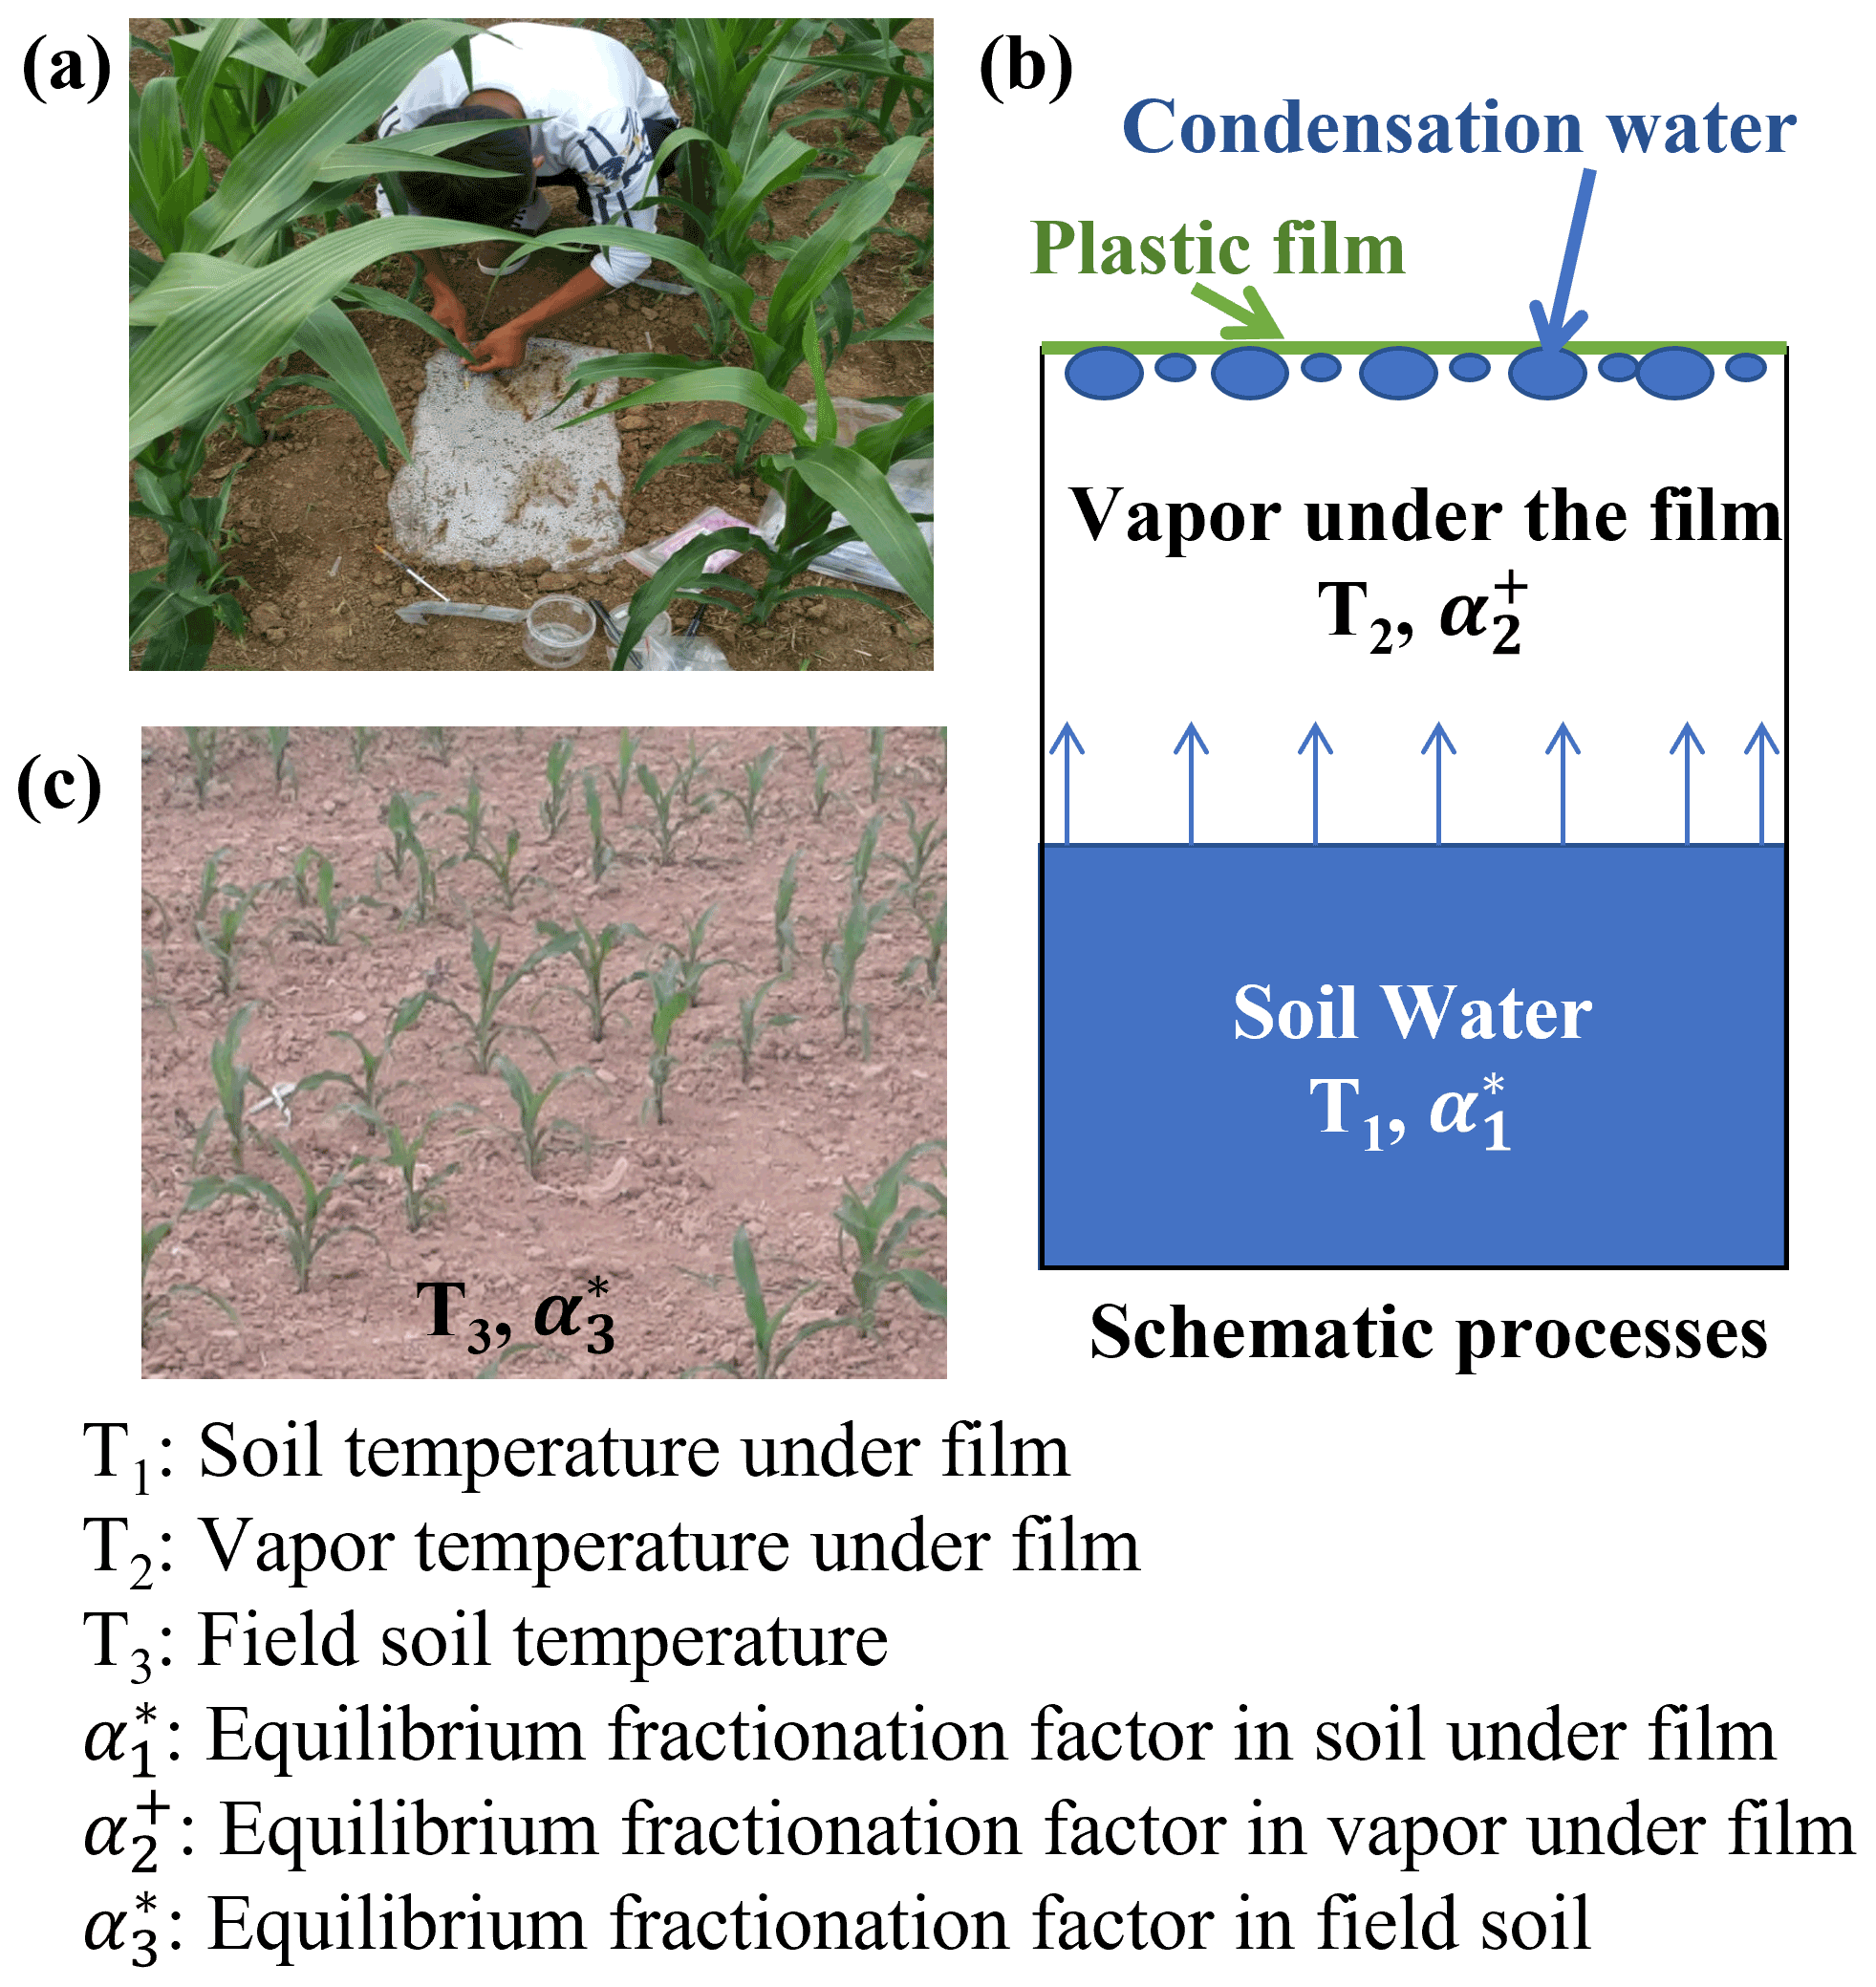
Figure 1Photograph of a new plastic film cover and condensation water collection using a syringe (a). Schematic of the condensation process (b). Photograph of the field soil condition (c).
In addition, BW was obtained from 0–5 cm surface soil water (Wen et al., 2016). The soil samples were collected using a soil auger every 3 d with three replicates, and each was mixed well and separated into two subsamples, i.e., one for determining the soil gravimetric water content and the other for water stable isotope analysis. The subsample for soil gravimetric water content was stored in an aluminum box and oven-dried for 24 h at 105 ∘C, while the water stable isotope analysis sample was stored in 150 mL high-density polyethylene bottles, sealed with Parafilm®, transported, and stored in a freezer at −20 ∘C at the laboratory until cryogenic liquid water extraction took place. To obtain bulk soil density, field capacity, and residual water content, three 70 cm deep pits were dug at the end of the growing season. Stainless rings with a volume of 100 cm3 (DIK-1801; Daiki Rika Kogyo Co., Ltd, Saitama, Japan) were pushed into the face of each soil pit at depths of 10, 20, 40, and 60 cm to obtain the soil samples. The soil samples were then saturated with distilled water, weighed, and placed in a high-speed centrifuge (CR21GII; Hitachi, Tokyo, Japan) with a centrifugation rotation velocity equivalent to a soil suction of 1 kPa for 10 min. The soil samples were weighed again to obtain the gravimetric water content at the aforementioned suction. This was repeated for suctions of 5, 10, 30, 50, 70, 100, 300, 500, and 700 kPa for 17, 26, 42, 49, 53, 58, 73, 81, and 85 min, respectively, to obtain the soil characteristic curve. After centrifugation, the soil samples were oven-dried and weighed to obtain the bulk soil density, which was used to convert gravimetric water content to volumetric water content.
A cryogenic vacuum distillation system (Li-2000; LICA United Technology Limited, Beijing, China) with a pressure of approximately 0.2 Pa and a heating temperature of 95 ∘C was used to extract soil water (Wang et al., 2020). The extraction time was at least 2 h until all the water evaporated from the soil and was deposited in the cryogenic tube. To calculate the extraction efficiency, samples were weighed before and after extraction and weighed again after oven-drying for 24 h, following extraction. Samples with an extraction efficiency of less than 98 % were discarded. In terms of weight, cryogenic vacuum distillation extracts all water from the soil. However, in terms of isotopic compositions, the extracted water is generally depleted in heavy isotopes relative to the reference water, and the extent of depletion is affected by soil clay content and water content due to incomplete soil water extraction (Orlowski et al., 2013, 2016). To extract all water from a soil sample, a higher extraction temperature (>200 ∘C) might be desirable, especially for soils with substantial clay particles such as in the present study (clay content of 0.24 g g−1; Gaj et al., 2017a, 7b; Orlowski et al., 2018). Therefore, the water isotopic compositions obtained from our distillation system were subsequently corrected by the following calibration equations: , and . The equations were obtained through a spiking experiment with 205 ∘C oven-dried soils.
In total, five deep soil profiles were collected on 17 July 2016 (pre-precipitation), 3 August 2016 (10 d after precipitation; 10 DAP), 17 August 2016 (24 DAP), 1 September 2016 (6 d after irrigation; 6 DAI), and 16 September 2016 (21 DAI), with increments of 0–5, 5–10, 10–20, 20–30, 30–40, and 40–60 cm. These soil samples were used to measure soil texture (Dane and Topp, 2020), soil water content, and soil water isotopic composition. Furthermore, the lc excess of the soil water before the 2H-enriched irrigation was calculated to infer the evaporation enrichment of soil water. A more negative lc-excess value indicates a stronger evaporation effect (Landwehr and Coplen, 2006).
where δ2H and δ18O are the soil water isotopic compositions; 7.81 and 10.42 are the slope and intercept of the local meteoric water line (LMWL), respectively.
Precipitation was collected during the entire growing season using three rainfall collectors (Wang et al., 2010) in the experimental field. The amount of rainfall was determined by weighing using a balance. Subsequently, subsamples of these rainfall samples were transferred to 15 mL glass vials, sealed immediately with Parafilm®, and placed in a refrigerator at 4 ∘C. To obtain the LMWL, we used 3 years of precipitation isotope data (Zhao et al., 2020), from 1 April 2015 to 19 March 2018. The equation for LMWL was .
Hourly air and 0–5 cm soil temperature under the newly covered plastic film from 10 to 28 September 2016, were measured using an E-type thermocouple (Omega Engineering Inc., Norwalk, CT, USA) controlled by a CR1000 data logger (Campbell Scientific, Inc., Logan, UT, USA). The 0–5 cm field soil temperature was measured during the whole field season using an iButton® device (DS1921G; Maxim Integrated, San Jose, CA, USA) at a frequency of 1 h. The 0–5 cm soil temperature and air temperature under the plastic film are required to calculate the evaporation ratios, but these measurements were not available before 10 September 2016. To obtain these temperature values, a regression equation was established between the measured 0–5 cm soil temperature values under the newly covered plastic film and those without plastic film covering from 10 to 28 September 2016. We then used the equation to estimate 0–5 cm soil temperature under the newly covered plastic film before 10 September 2016, based on the iButton®-measured temperature of the 0–5 cm soil without the plastic film covering in the same period. Subsequently, another regression equation was obtained between air temperature and 0–5 cm soil temperature from 10 to 28 September 2016, both of which were under the newly covered plastic film. Then the air temperature under the newly covered plastic film before 10 September 2016 was estimated from the estimated 0–5 cm soil temperature under the newly covered plastic film. The regression equations are presented in the Supplement. Moreover, the hourly ambient air relative humidity was recorded by an automatic weather station (HOBO event logger; Onset Computer Corporation, Bourne, MA, USA) located 3 km away.
A micro-lysimeter (Ding et al., 2013; Kool et al., 2014) replicated thrice and made of high-density polyethylene with a 10 cm in depth, 5.2 cm inner radius, and 3 mm thickness was used to obtain the soil evaporation amount. The micro-lysimeter was pushed into the soil surface between maize rows to retrieve an undisturbed soil sample. Subsequently, we sealed the bottom, weighed the micro-lysimeter, placed it back in the soil at the same level as the soil surface, and no other sensor was installed in the micro-lysimeter. After 2 d of evaporation, the lysimeter was weighed again. The mass difference was defined as the amount of soil evaporation. When evaporation occurs, unlike with soil outside the lysimeter, the soil within lysimeters is not replenished with water from deeper layers; thus, relative to soil outside the lysimeter, the soil water content within the lysimeters is generally smaller following continuous evaporation. Therefore, to represent the field soil conditions, the soil within the lysimeter was replaced every 4 d. In addition, after every rainfall or irrigation period, the inner soil was changed immediately.
All water samples were analyzed for δ2H and δ18O using isotopic ratio infrared spectroscopy (model IWA-45EP; Los Gatos Research, Inc., San Jose, CA, USA). The instrument's precision was 1.0 ‰ and 0.2 ‰ for δ2H and δ18O, respectively. A total of three liquid standards (LGR3C, LGR4C, and LGR5C and their respective values, i.e., ‰, −51.60 ‰, and −9.20 ‰; ‰, −7.94 ‰, and −2.69 ‰) were used sequentially for each of the three samples to remove the drift effect. To eliminate the memory effect, each sample was analyzed using six injections, of which only the last four injections were used to calculate the average value. To check the effect of extrapolation beyond the range of standards, we performed a comparative experiment. In the experiment, 10 liquid samples with δ2H, varying from 0.14 ‰ to 107 ‰ and δ18O from −1.75 ‰ to 12.24 ‰, were analyzed using LGR 3C, LGR 4C, and LGR 5C as standards (same with our former analysis) and were also analyzed using LGR 5C, GBW 04401 ( ‰; δ18O=0.32 ‰), and LGR E1 (δ2H=107 ‰; δ18O=12.24 ‰) as standards. The differences between the two sets of measurements were regressed with the sample isotope values obtained using LGR 5C, GBW 04401, and LGR E1 as standards, with a linear relationship of (with R2=1) and (with R2=1). We then applied the relationship and corrected the isotopic data that had δ2H larger than −9.26 ‰ and δ18O larger than −2.72 ‰. All the analyses in this study were based on the reanalyzed data.
The results are reported in δ notation as follows:
where Rsample denotes the ratio of the number of heavy isotopes to that of the light isotope in the sample water, and Rstandard is the ratio in the Vienna Standard Mean Ocean Water (VSMOW).
2.4 Equilibrium fractionation processes
The isotopic composition of EW was calculated using the condensation water that adhered to the underside of the newly covered plastic film. We assumed that the water vapor under the newly covered plastic film and above the surface soil constitutes a closed system. Within the system, two equilibrium fractionation processes are temperature dependent and occur independently, i.e., evaporation from surface soil water to air under the plastic film occurs during the day time (08:00 to 20:00 LT; Fig. 2), condensation from the water vapor under the plastic film to liquid water ensued at nighttime (20:00 to 08:00 LT), and the resulting dew (condensation water) adhered to the plastic film. The average temperatures from 08:00 to 20:00 LT and 20:00 to 08:00 LT on the day before water collection were used to calculate the equilibrium fractionation factor (α) (Horita and Wesolowski, 1994) for the evaporation and condensation processes, respectively.
where α+ and α* are the equilibrium fractionation factors during condensation and evaporation, respectively. δliquid is the isotopic composition in the liquid water, δvapor is the isotopic composition in the vapor, and T is the temperature presented in Kelvin.
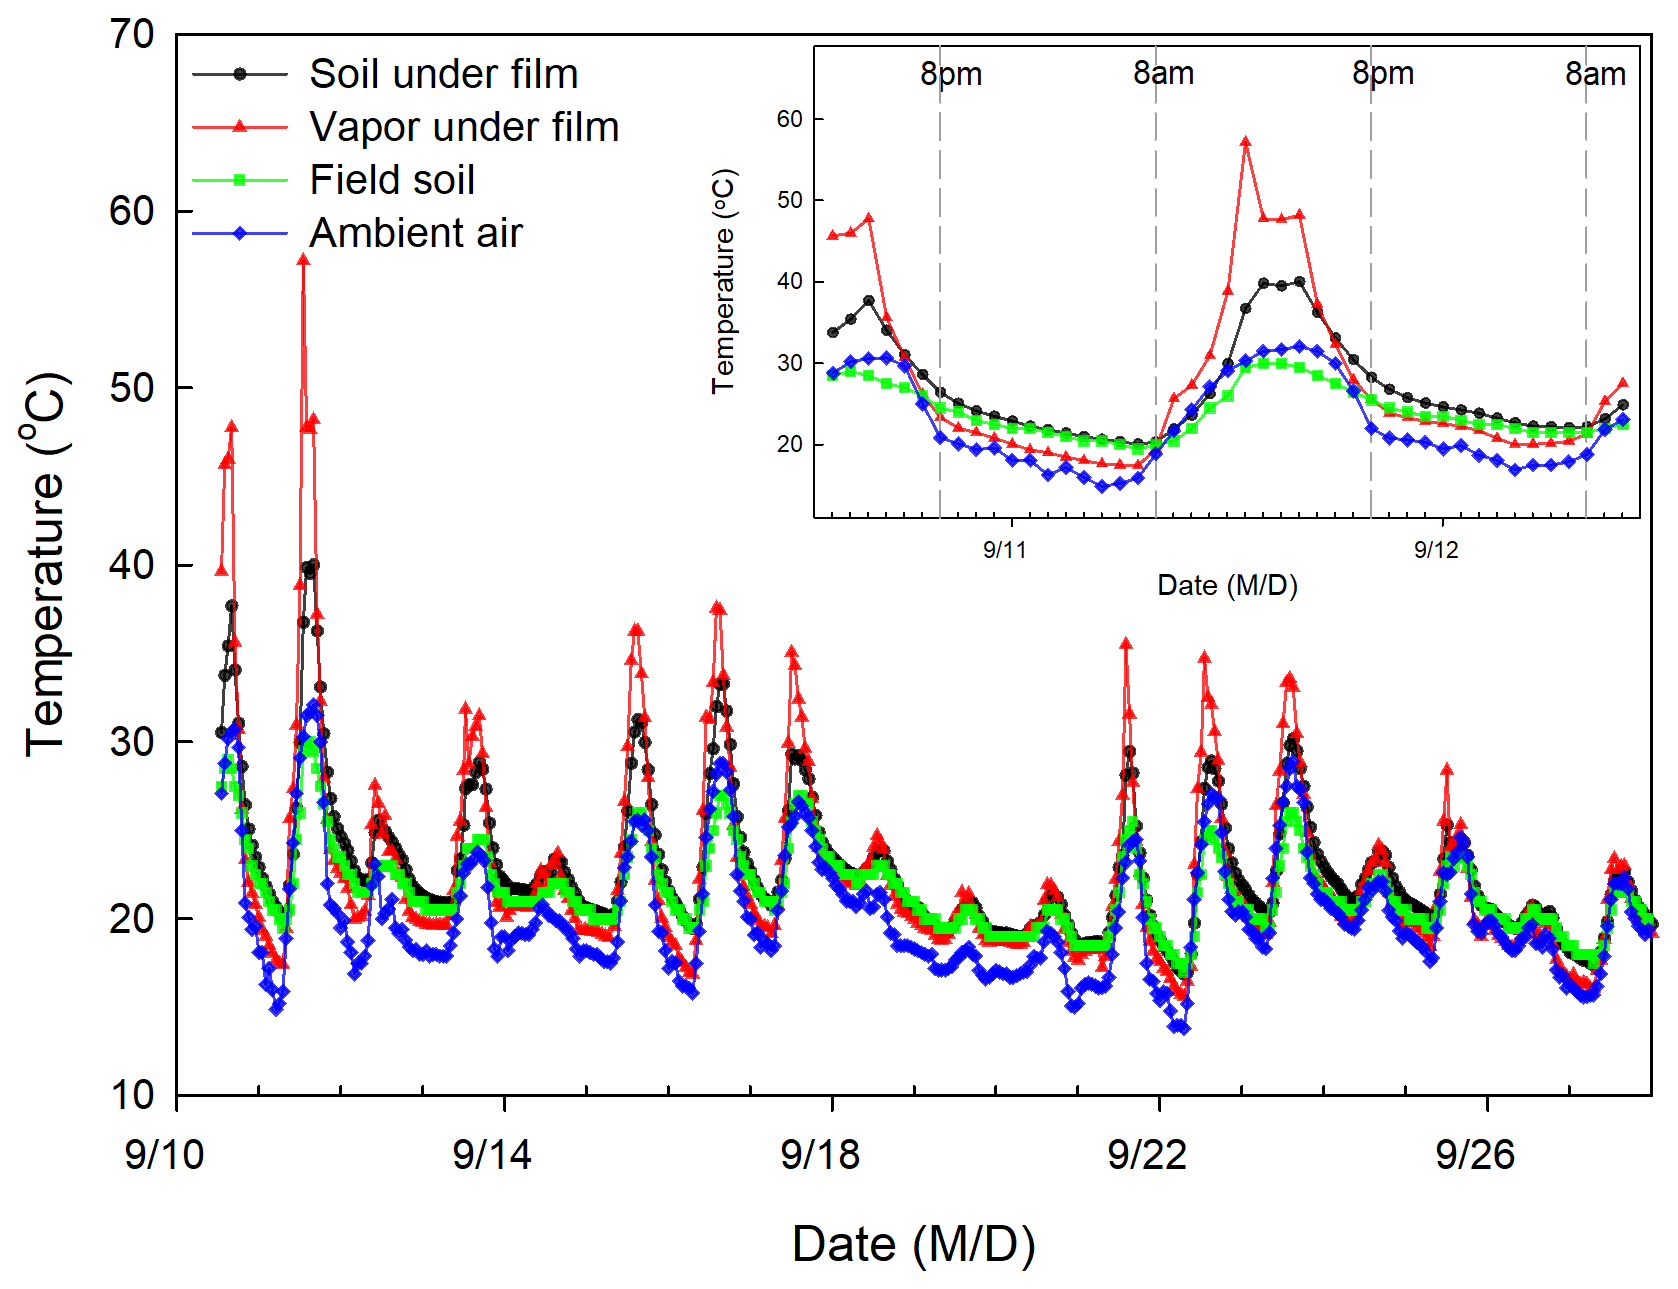
Figure 2Temporal variation in temperature of soil under film, vapor under film, field soil, and ambient air during the study period.
Based on Eqs. (3) to (6) and Fig. 1b, the fractionation factors for the two processes under the newly covered plastic film are expressed using Eqs. (7) and (8).
where δVp represents the isotope values of water vapor under the newly covered plastic film, δEW represents the isotope value in evaporating water, and δCW represents the isotope value in condensation water.
Combining Eqs. (7) and (8), we obtain the isotopic composition in the EW as follows:
2.5 Evaporative water losses
For an open system (field soil condition; Fig. 1c), evaporation from surface soil water to ambient air undergoes the following two processes: the equilibrium fractionation process from the surface soil to the saturated vapor layer above the soil surface and the kinetic fractionation process from the saturated vapor layer to ambient air. The isotopic composition of evaporation vapor is controlled by the isotope values of the evaporating soil water and ambient vapor, equilibrium, and kinetic fractionations. The kinetic fractionation can be described by the enrichment factors (εk) of 18O and 2H as a function of ambient air relative humidity (h) as follows (Gat, 1996):
The total enrichment factor, ε, can be obtained from the kinetic enrichment factor (εk) and equilibrium fractionation factor () as follows (Skrzypek et al., 2015):
The ambient vapor isotopic composition (δA) can be obtained as follows (Gibson et al., 2008):
where is the equilibrium fractionation factor in the ambient air, and δrain is the amount weighted isotopic composition in precipitation from 11 July to 16 September 2016.
The isotopic compositions of bulk soil water and evaporating water can be used to evaporating soil water in the Craig–Gordon model (Eq. 14) to calculate the isotope value of the evaporation vapor (δEV).
Based on the bulk soil water isotope mass balance, i.e., the change in bulk soil water isotopic composition multiplied by the soil water reduction equals the evaporation vapor isotopic composition multiplied by the evaporation amount (Hamilton et al., 2005; Skrzypek et al., 2015; Sprenger et al., 2017), we can calculate evaporative water loss to the total water source (f).
where δI is the isotopic signal of the original water source. δI is generally unknown and can be conveniently obtained by calculating the intersection between the regression line of the 0–5 cm bulk soil water isotope in period I and the LMWL in the dual-isotope plot (Fig. 3). m and δ* in Eq. (15) are given by the following:
In period II, the initial values (−9.52 ‰ and 11.50 ‰ for δ18O and δ2H, respectively) were calculated from the weighted average of the isotope values of irrigation water and period I original water described above. To calculate evaporative water loss from EW δ18O, we used BW to express EW and obtained the following formulas (Eqs. 18 and 19) for evaporative water loss.
where n is an intermediate variable and can be expressed as follows:
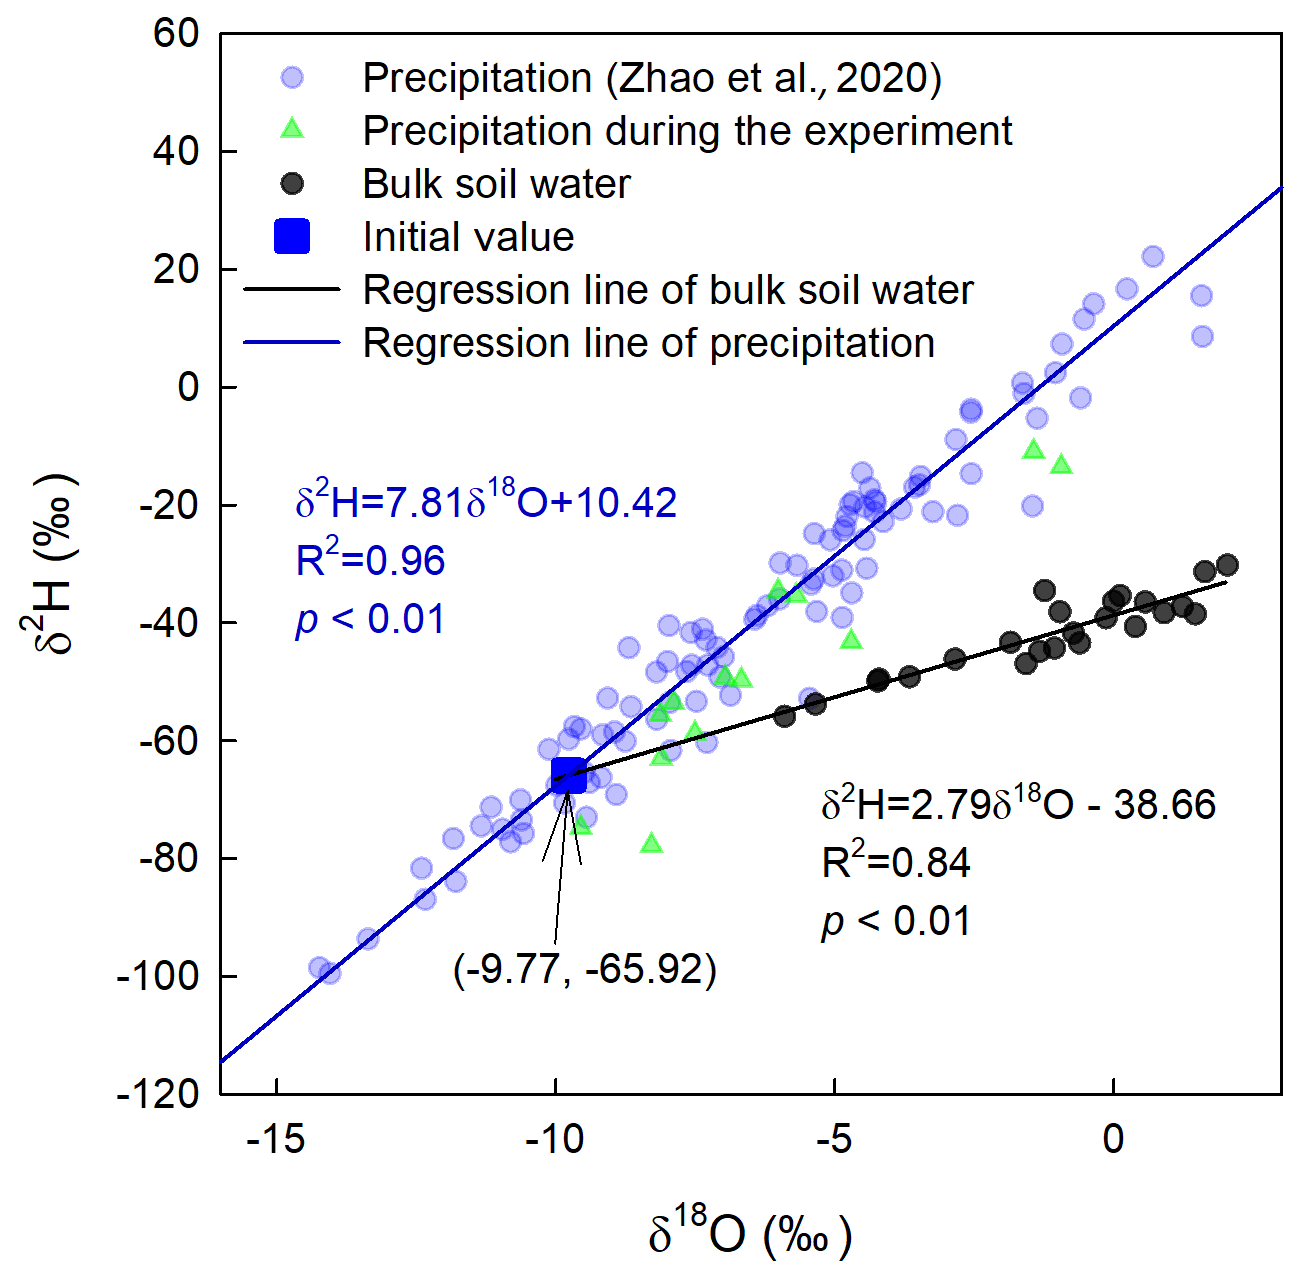
Figure 3The dual-isotope plot of precipitation and 0–5 cm bulk soil water from 25 July to 25 August 2016 (period I). The regression line of precipitation represents the local meteoric water line.
2.6 Statistical analysis
A general linear model (GLM) was used to test if the regression lines for isotopic composition/evaporative water loss of BW as a function of days after precipitation/irrigation (DAP/I) differ from those of EW. GLM was also used to compare the period I evaporative water loss derived from δ2H and δ18O of BW. The Shapiro–Wilk test was used to test the normality of the error structure of the model (p>0.05). Furthermore, Student's t test (Knezevic, 2008) was used to compare two corresponding mean values of three replicates.
3.1 Variation of 0–5 cm soil water content
Between the two large precipitation events on 24 July and 20 September 2016, there was no effective precipitation, except for an irrigation event of 30 mm on 26 August 2016 (Fig. 4a). Thus, two continuous evaporation periods can be identified, i.e., period I from 25 July to 25 August 2016 and period II from 27 August to 19 September 2016.

Figure 4The amount of precipitation, irrigation, and 0–5 cm bulk soil water content (a), δ2H and δ18O of precipitation and irrigation (b), δ2H of 0–5 cm bulk soil water and evaporating water (c), and δ18O of 0–5 cm bulk soil water and evaporating water (d) at different times of the experimental period. Black arrows in panel (a) indicate dates when deep soil sampling took place, and the corresponding days after precipitation (irrigation) are indicated above the arrows. The two evaporation periods, marked by colored shades, include period I from 25 July to 25 August 2016 (green) and period II from 27 August to 19 September 2016 (cyan). Within the green circle in period I, the mean ± standard error values were ‰ and ‰ for 0–5 cm bulk soil water and ‰ and ‰ for evaporating water.
Soil water content in 0–5 cm reached field capacity (0.30 cm3 cm−3), with a volumetric water content of 0.30±0.007 cm3 cm−3 and a porosity of 0.50±0.05 cm3 cm−3 right after the first large precipitation event (24 July 2016), and then decreased with evaporation time (gray bars in Fig. 4a). At the end of period I, 0–5 cm soil water content was 0.05±0.005 cm3 cm−3, close to the residual water content of 0.08±0.03 cm3 cm−3. Similarly, after the irrigation event (26 August 2016), 0–5 cm soil water content increased to a high value (0.24±0.03 cm3 cm−3) and then decreased with an increase in evaporation time (Fig. 4a). At the end of period II, 0–5 cm soil water content was 0.09±0.005 cm3 cm−3, also close to the residual water content. In total, there was a 12.73±0.58 and 7.51±1.24 mm reduction in soil water storage at 0–5 cm during periods I and II, respectively. However, from the micro-lysimeters, we obtained a total evaporation amount of 20.45±0.95 mm in period I and 9.56±1.18 mm in period II. Therefore, the evaporation amount in each of the two periods was greater than the soil water storage reduction at 0–5 cm, suggesting that soil water from below 5 cm moved up and participated in evaporation in each of the two periods, especially in period I.
3.2 δ2H and δ18O in evaporating water and bulk soil water
The precipitation on 24 July 2016, had a δ18O value of −8.11 ‰ and δ2H value of −62.97 ‰, which were smaller than the respective values of pre-event BW ( ‰ for δ18O and ‰ for δ2H; Fig. 4). The irrigation water – with a δ18O of ‰ and δ2H of 49.87±2.7 ‰ on 26 August 2016 – had a lower δ18O but a much higher δ2H than the pre-irrigation BW ( ‰ for δ18O and ‰ for δ2H). In summary, the event water in period I was more depleted in heavy isotopes than in pre-event BW (p<0.05). In period II, the event water had a lower δ18O but a higher δ2H than pre-event BW (p<0.05).
As expected, the δ2H and δ18O in BW increased as evaporation occurred during period I (p<0.05). The increase in δ2H and δ18O in BW had a significant linear relationship with evaporation time (p<0.05; Fig. 5), suggesting that evaporation favored the lighter water isotopes from BW, resulting in greater δ2H and δ18O in BW. In period II, BW δ18O also increased as evaporation progressed (p<0.05). The increase in BW δ18O also had a significant linear relationship with evaporation time (p<0.05; Fig. 5). In contrast, δ2H of BW decreased linearly with evaporation (p<0.01) in period II. The slope and intercept both significantly differed from zero (p<0.01), suggesting that, in period II, evaporation takes away the lighter O isotope and heavier H isotope from BW.
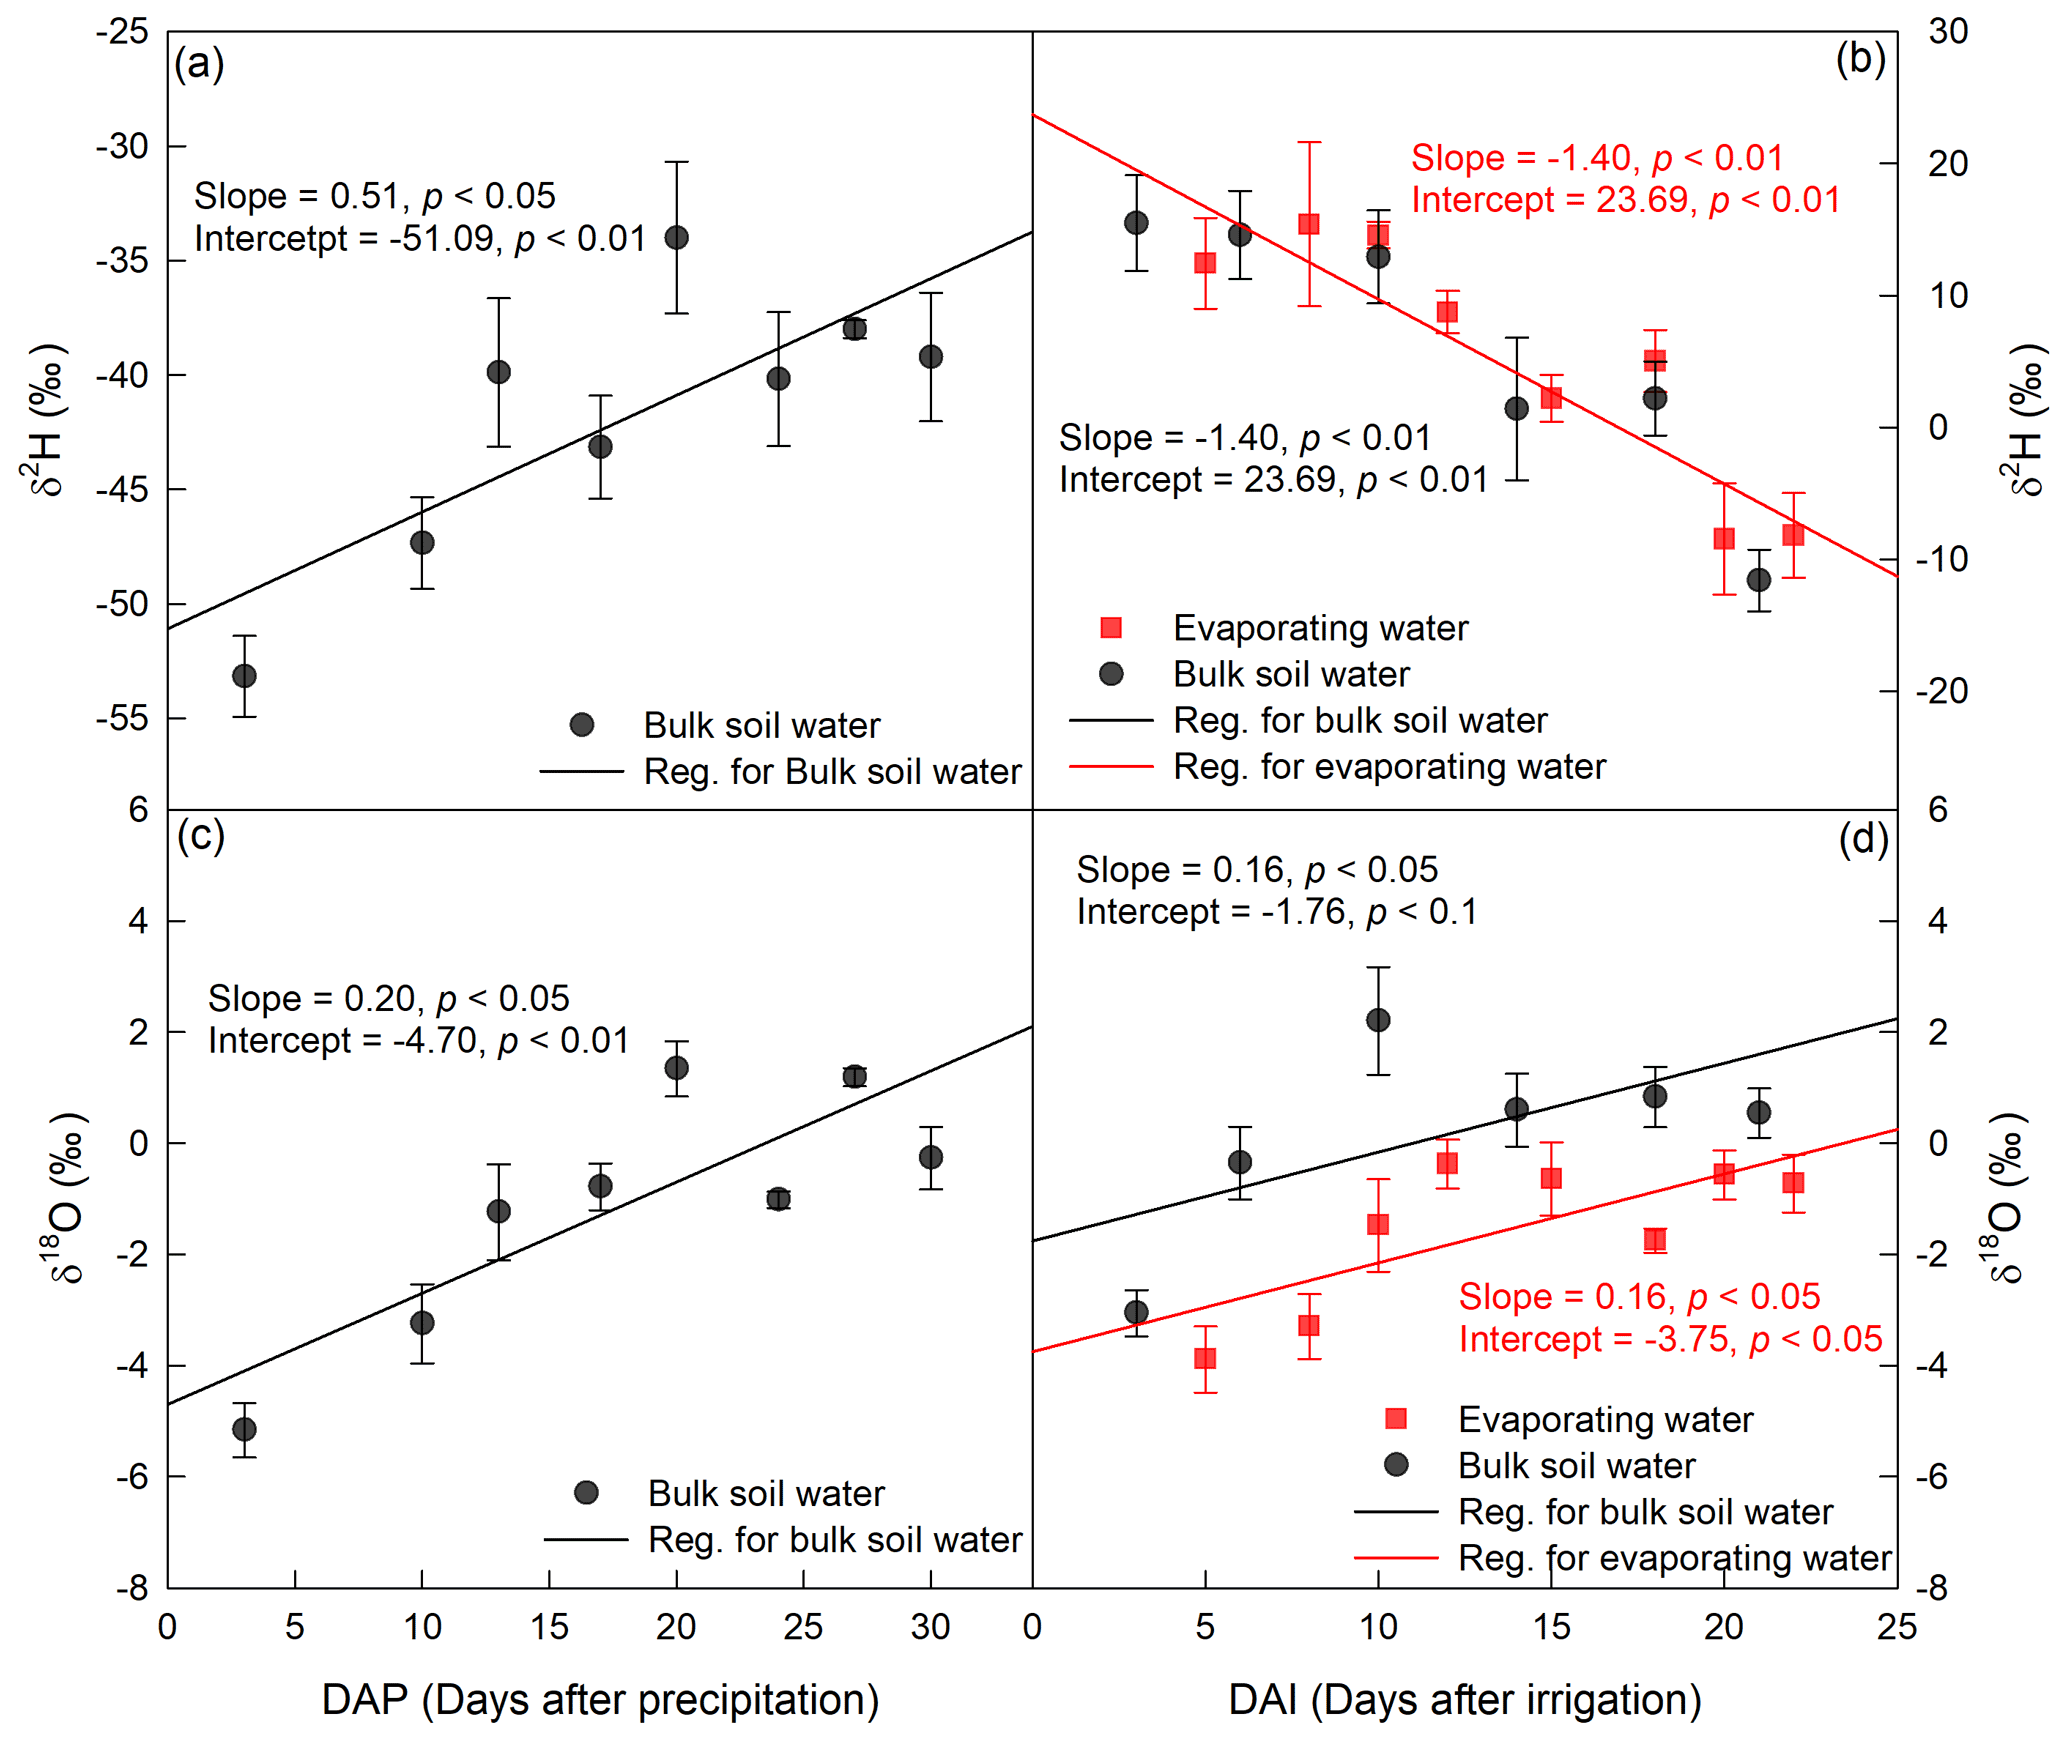
Figure 5Temporal variation in δ2H (a, b) and δ18O (c, d) in 0–5 cm bulk soil water and evaporating water during period I (a, c) and period II (b, d). The precipitation occurred on 24 July 2016, and the irrigation took place on 26 August 2016.
The evaporation line, defined as the change in water isotopes with evaporation time in EW, was remarkably similar to that for BW (Fig. 5). For example, in period II, δ2H in both EW and BW decreased as evaporation proceeded, and both lines had a slope significantly smaller than zero (p<0.05; Fig. 5b). This is contrary to our understanding that evaporation enriches 2H in EW and BW. Moreover, it seemed that EW had higher 2H vales than BW, but the slope and intercept of the EW evaporation line did not differ from that of the BW evaporation line (p>0.05; Fig. 5b).
In period II, δ18O in both EW and BW increased with evaporation time (Fig. 5d), and the slopes and intercepts significantly differed from zero (p<0.05), indicating that evaporation, as expected, significantly enriched 18O in EW and BW. However, there were some differences between EW and BW; δ18O was consistently more depleted in EW than in BW during this period. Further regression analyses of δ18O vs. time relationships in EW and BW in period II indicated that though δ18O vs. time in EW had the same slope as that in BW (p>0.05), it had significantly smaller intercept than BW (p<0.05). Thus, the linear relationship in δ18O between EW and BW was given as δ18O(EW) = δ18O(BW) − 1.99 (Fig. 5d). As is well known, the evaporation line (δ18O vs. time) reflects the evaporative demand and the source water isotopic signature. First, the slopes of the evaporation lines represent the evaporative demand of the atmosphere. Given that EW and BW are under the same evaporative demand, their evaporation lines should have identical slopes. Second, the intercept of the evaporation line represents the isotopic signature of the initial evaporation water source. Therefore, in period II, the intercepts of a δ18O value of −1.76 ‰ for BW and −3.75 ‰ for EW represent the initial water sources of BW and EW, respectively. In other words, the sources of water for BW and EW had different isotopic compositions during period II.
In period I, we compared the mean δ2H and δ18O values of all measurements within the green circle (Fig. 4) for both EW and BW. The mean δ2H and δ18O values for EW were significantly lower than those for BW (p<0.05). Unfortunately, there were only four data points for EW, so we could not obtain a reliable isotopic relationship between EW and BW.
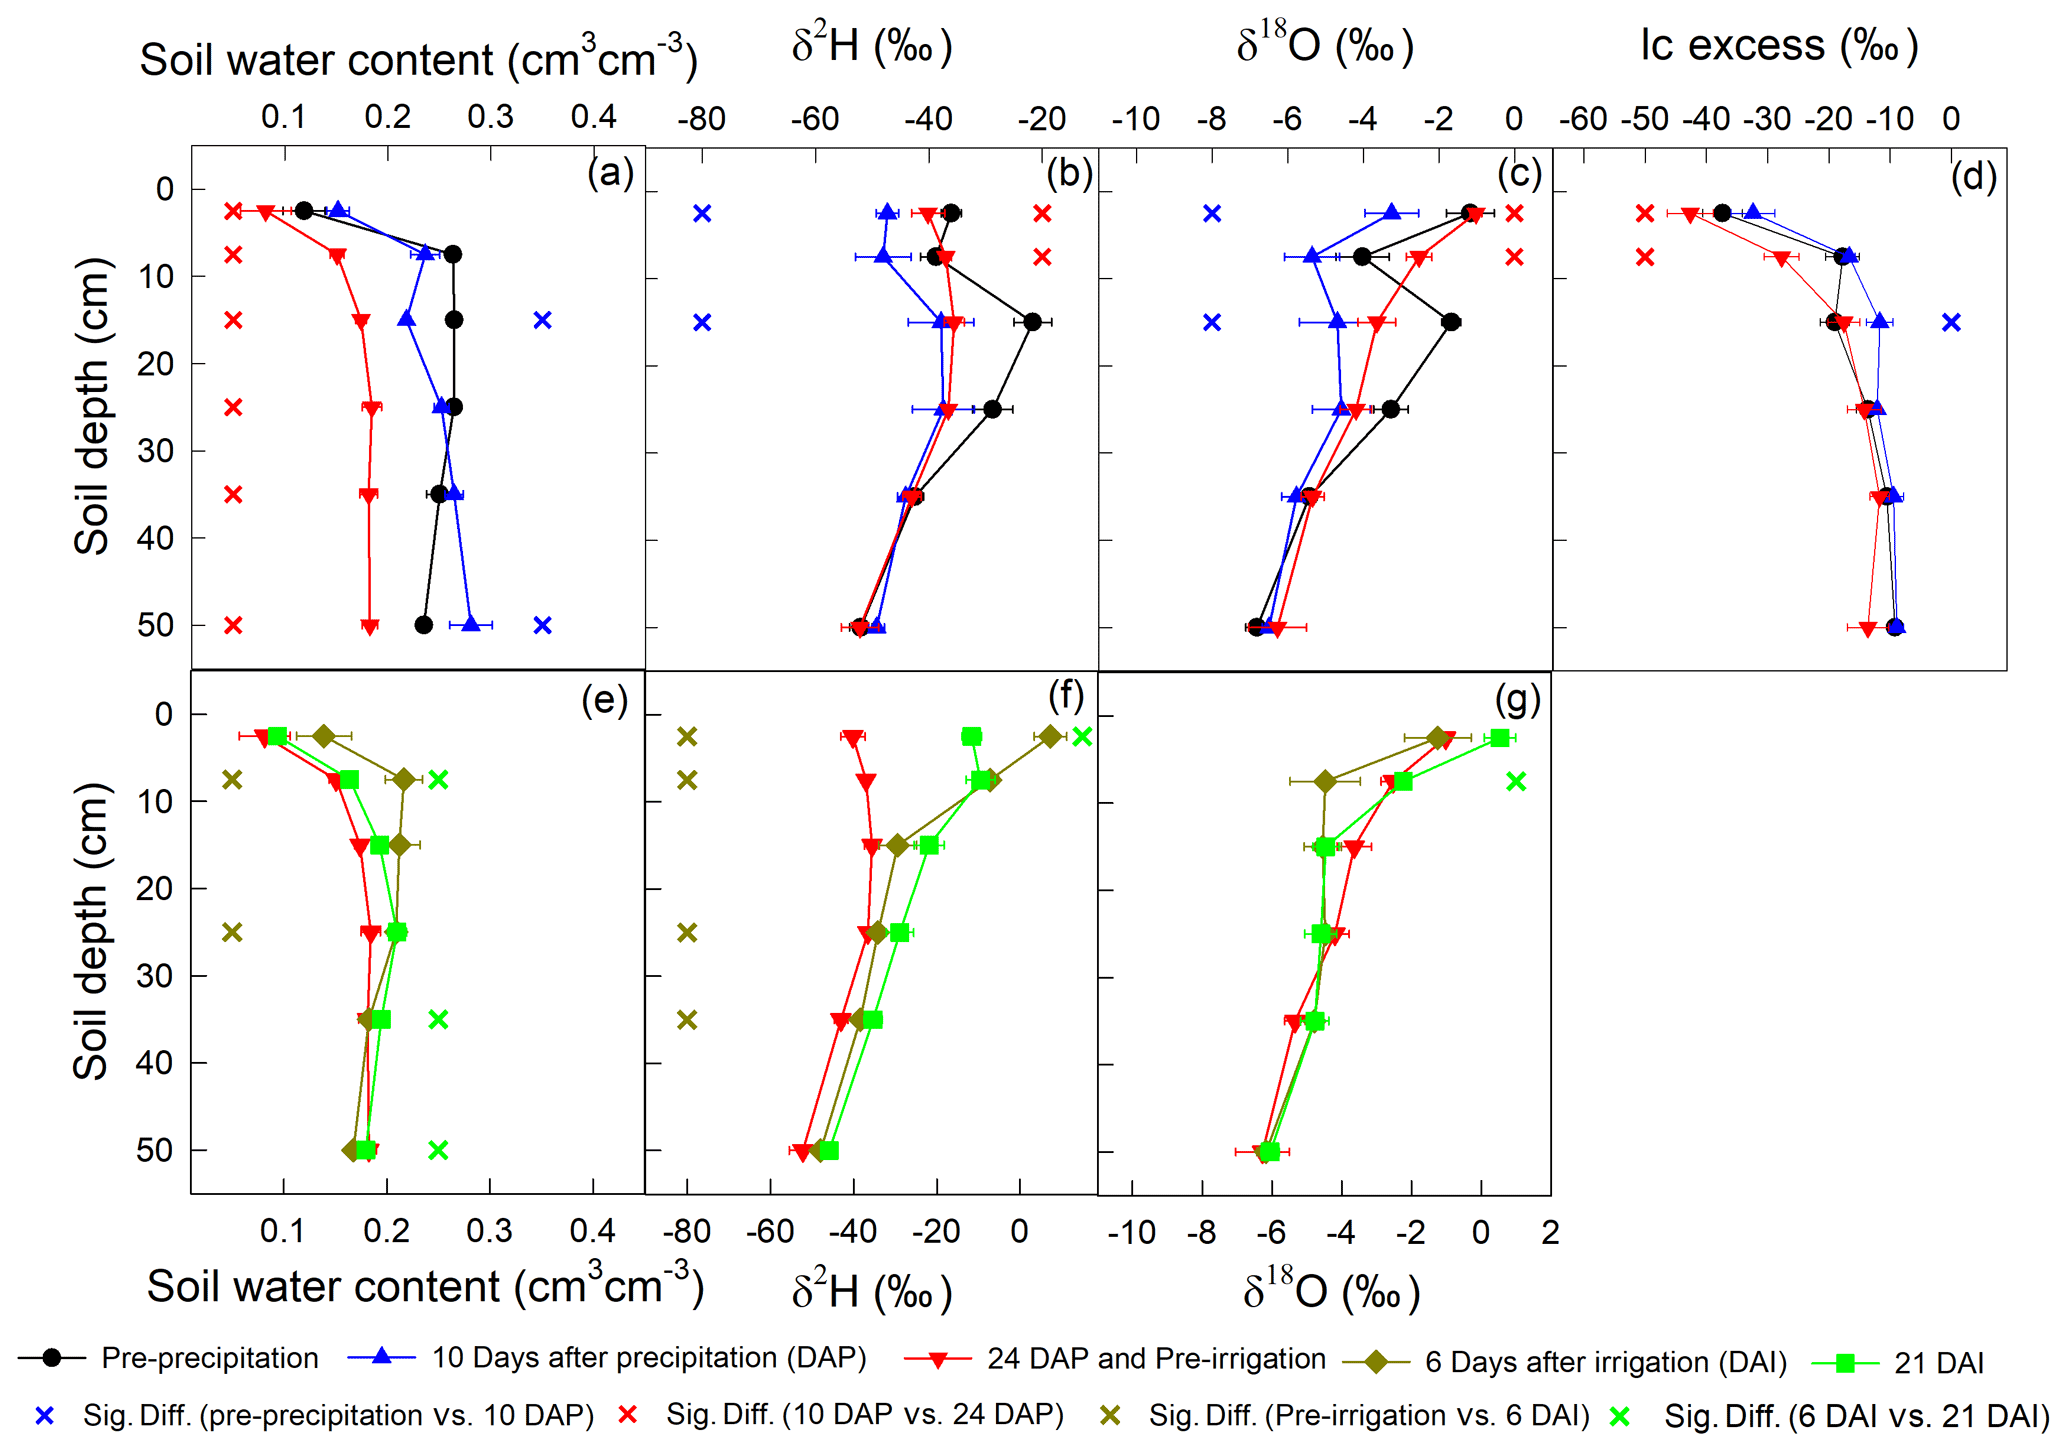
Figure 6Temporal variation in deep soil water content, δ2H, δ18O, and lc excess during period I (a–d) and period II (e–g). The precipitation event occurred on 24 July 2016, and the irrigation took place on 26 August 2016.
3.3 Variation in deep soil water content, δ2H, δ18O, and lc excess
The precipitation event on 24 July 2016 increased the soil water content in the top 60 cm and decreased soil water δ2H and δ18O in the top 20 cm (Fig. 6; upper panel). Therefore, the top 20 cm lc excess increased at 10 DAP. However, precipitation did not influence the deeper soil δ2H, δ18O, or lc excess. At the end of evaporation period I (24 DAP), the soil water content decreased in the top 60 cm. In the top 10 cm, soil water δ2H and δ18O increased and lc excess decreased.
Similar to precipitation on 24 July 2016, the irrigation on 26 August 2016 increased the soil water content and decreased the δ18O of the top 10 cm soil (Fig. 6; lower panel). However, the irrigation event increased the δ2H in the top 20 cm. At the end of evaporation period II, i.e., 21 DAI, the top 10 cm soil water δ18O became more enriched whereas δ2H became more depleted. Note that the δ2H at 5–10 cm was similar to that at 0–5 cm (Fig. 6f).
3.4 Evaporative water loss derived from bulk soil water and evaporating water
In period I, evaporative water loss (f) derived from either δ2H or δ18O in BW increased with increasing evaporation time (p<0.01), and there was no significant difference between them with the same slope and similar intercepts (p>0.05; Fig. 7). The average f values during the period were 0.27±0.004 and 0.23±0.002 for δ2H and δ18O, respectively. In period II, f derived from δ18O in BW and EW increased with evaporation time (p<0.05), and there was no significant difference between them with the same slope and similar intercepts (p>0.05). The average f was 0.27±0.01 and 0.24±0.01 for BW and EW, respectively. However, the evaporative water loss could not be calculated from δ2H in BW or EW, as δ2H decreased as evaporation progressed (Fig. 5), which was inconsistent with the evaporation theory that soil evaporation enriches heavier water isotopes in the residual soil water. Moreover, we could not calculate the evaporative water loss based on the isotopic composition of EW in period I, as a reliable linear isotopic relationship between EW and BW could not be obtained from the four data points we had during the period.
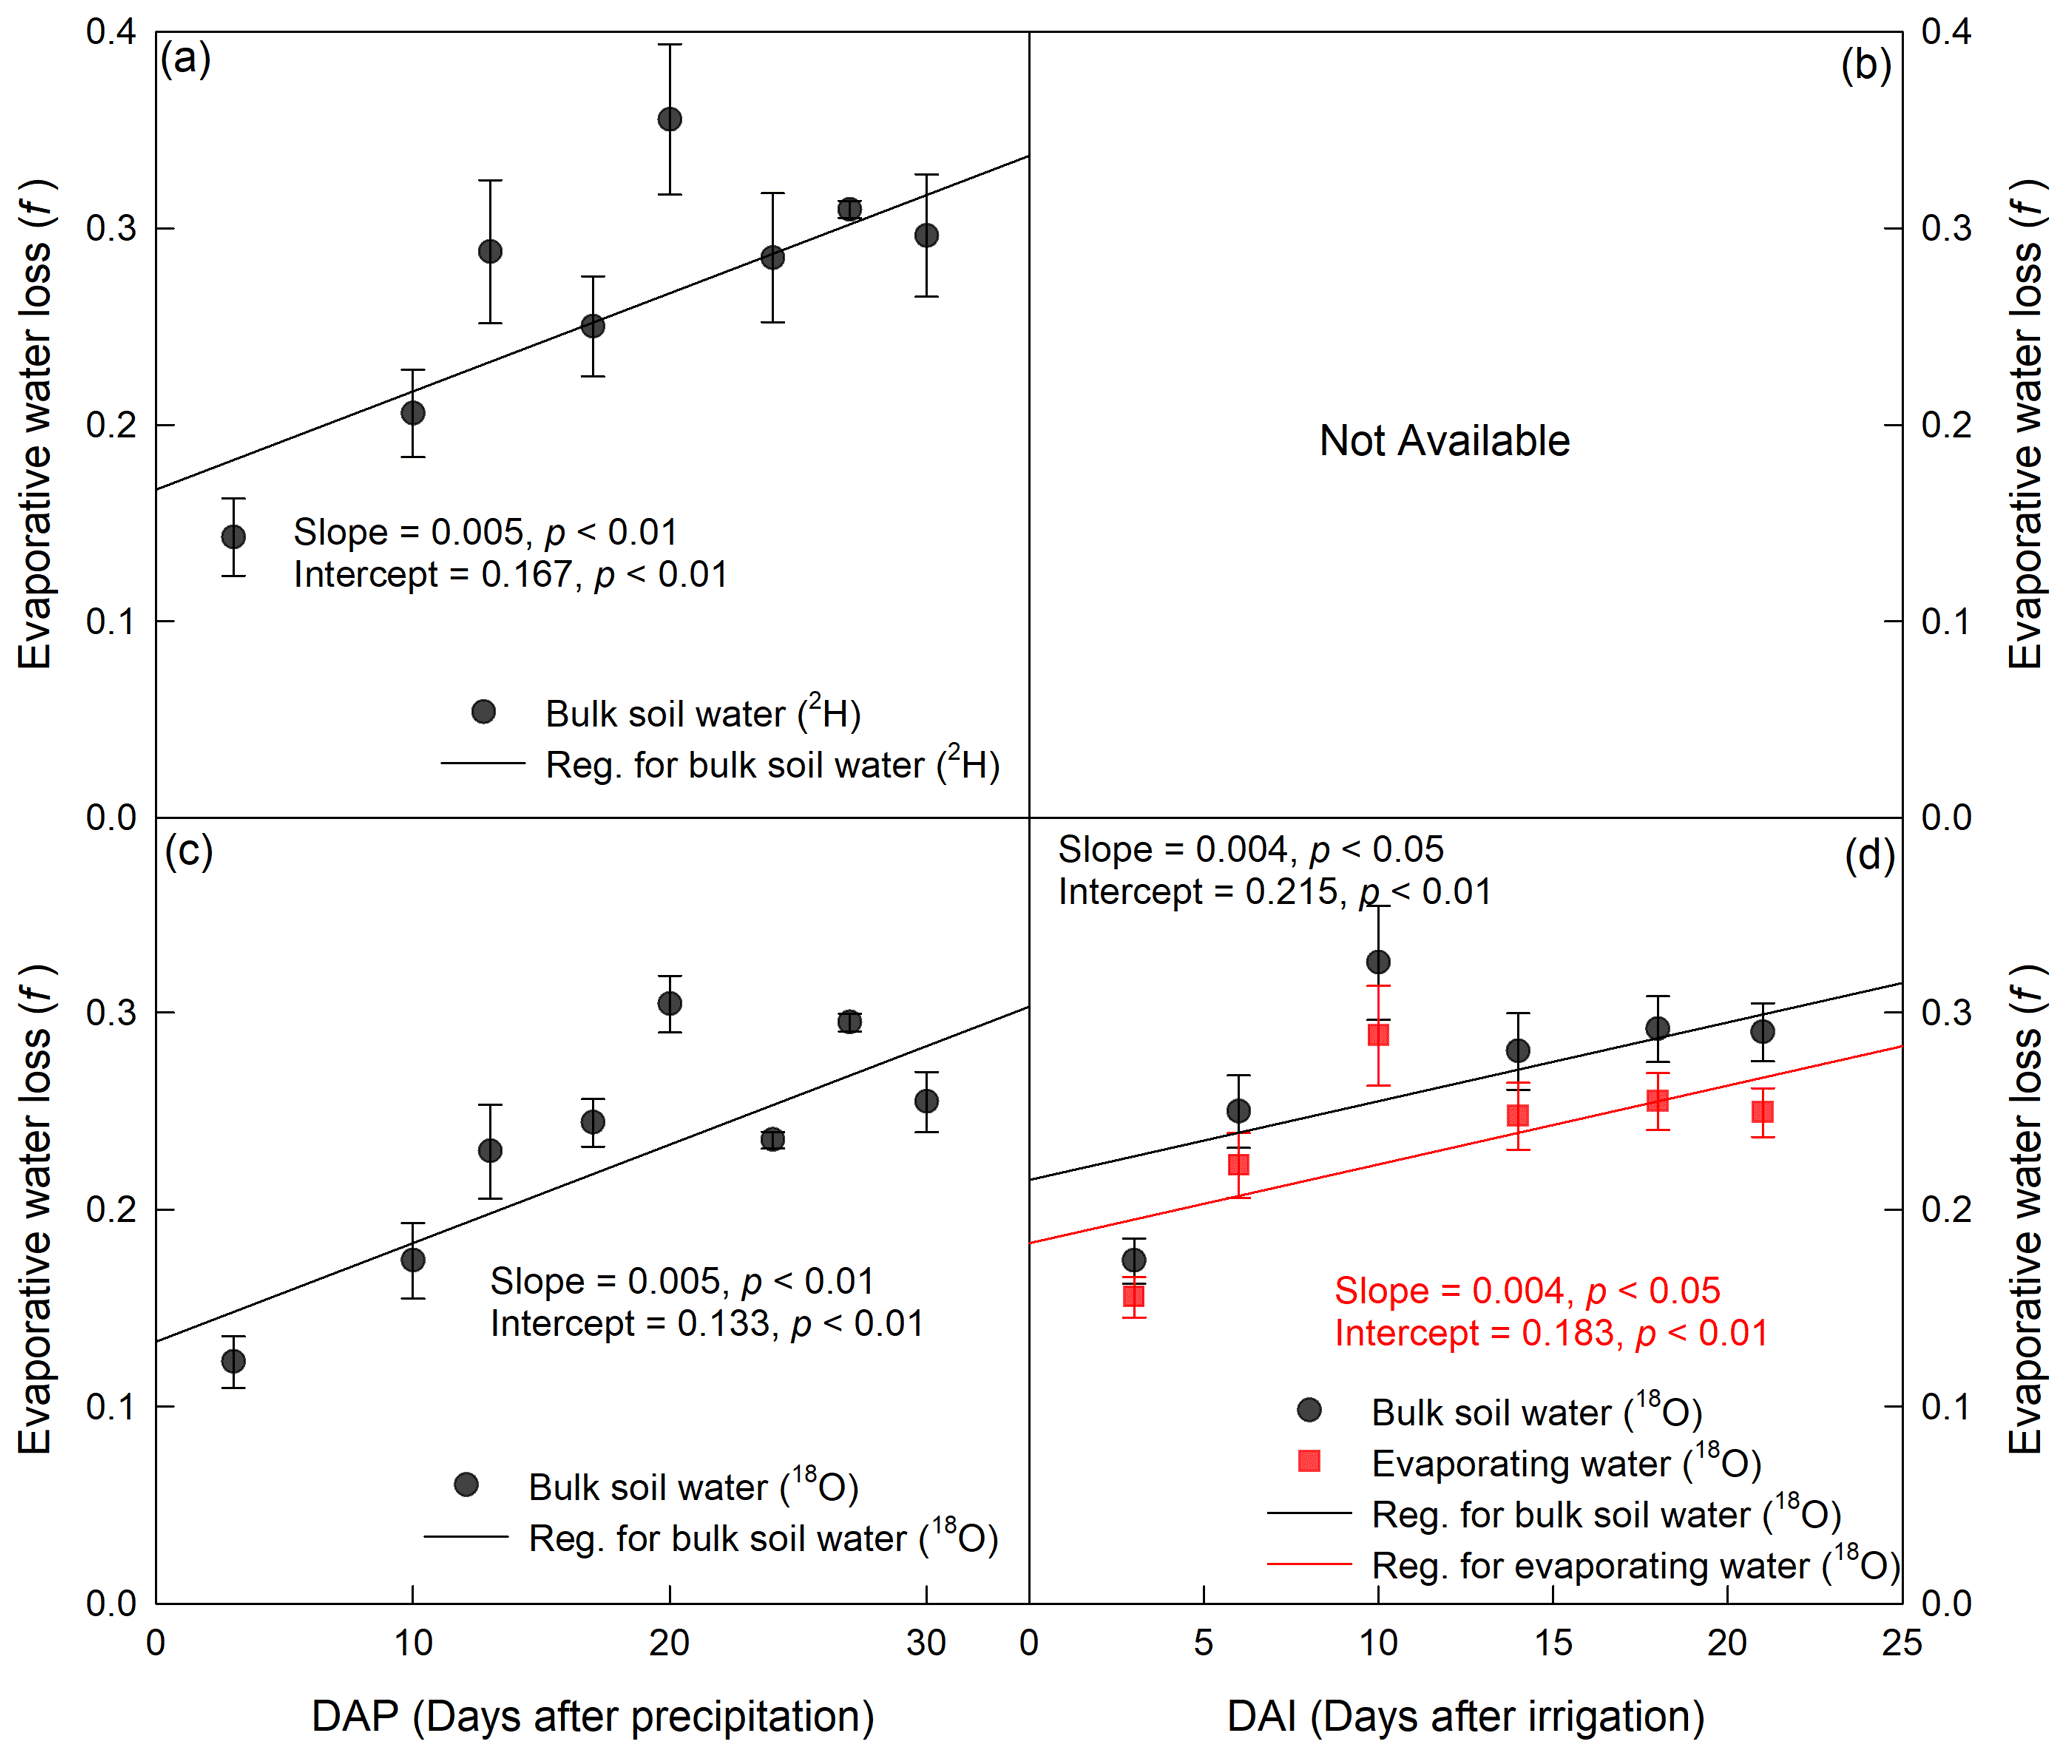
Figure 7Temporal variation in evaporative water loss (f) derived from isotope value (δ2H for a and b and δ18O for c and d) in bulk soil water and evaporating water during period I (a, c) and period II (b, d). The precipitation and irrigation events occurred on 24 July and 26 August 2016, respectively.
4.1 Why evaporating and bulk soil water have different isotopic compositions
During evaporation, light isotopes are preferentially evaporated, enriching the residual liquid water in heavy isotopes (Mook and De Vries, 2000). This could explain why, with increasing evaporation time, δ2H and δ18O in BW increased in period I. In period II, δ18O (Fig. 5) displayed a similar, increasing trend, whereas δ2H had an opposite, decreasing trend. The progressive decrease in δ2H with increasing evaporation time cannot be explained by the general notion that with evaporation, and residual soil water becomes more enriched with heavy water isotopes. Therefore, there must be a mechanism that preferentially removes 2H or dilutes 2H with 2H-depleted water.
For the latter, because there is negligible water input from the atmosphere (both in vapor and liquid form), the only water input could be from the soil below 5 cm. Indeed, because the evaporation amount was larger than the 0–5 cm soil water storage reduction (Sect. 3.1), the water below 5 cm must have moved upward as evaporation occurred. Consequently, due to evaporation, the order of the δ2H value should be 0–5 cm > the mixture of pre-evaporation 0–5 and 5–10 cm soil water > 5–10 cm. However, 0–5 cm δ2H at the end of the evaporation period (21 DAI) was similar to 5–10 cm δ2H (Fig. 6f). Moreover, if dilution occurred, the δ18O would also be diluted, which is not supported by the progressive increase in BW δ18O during evaporation in the same period and of both δ2H and δ18O in BW of period I, which should have a deeper soil water contribution (Sect. 3.1). Therefore, dilution does not substantially affect the isotopic signature of BW. This is further supported by the larger δ18O in BW in period II than that in EW (Figs. 4 and 5). By deduction, the possible cause of the depletion in 2H would be the preferential removal of 2H from the top 5 cm of soil.
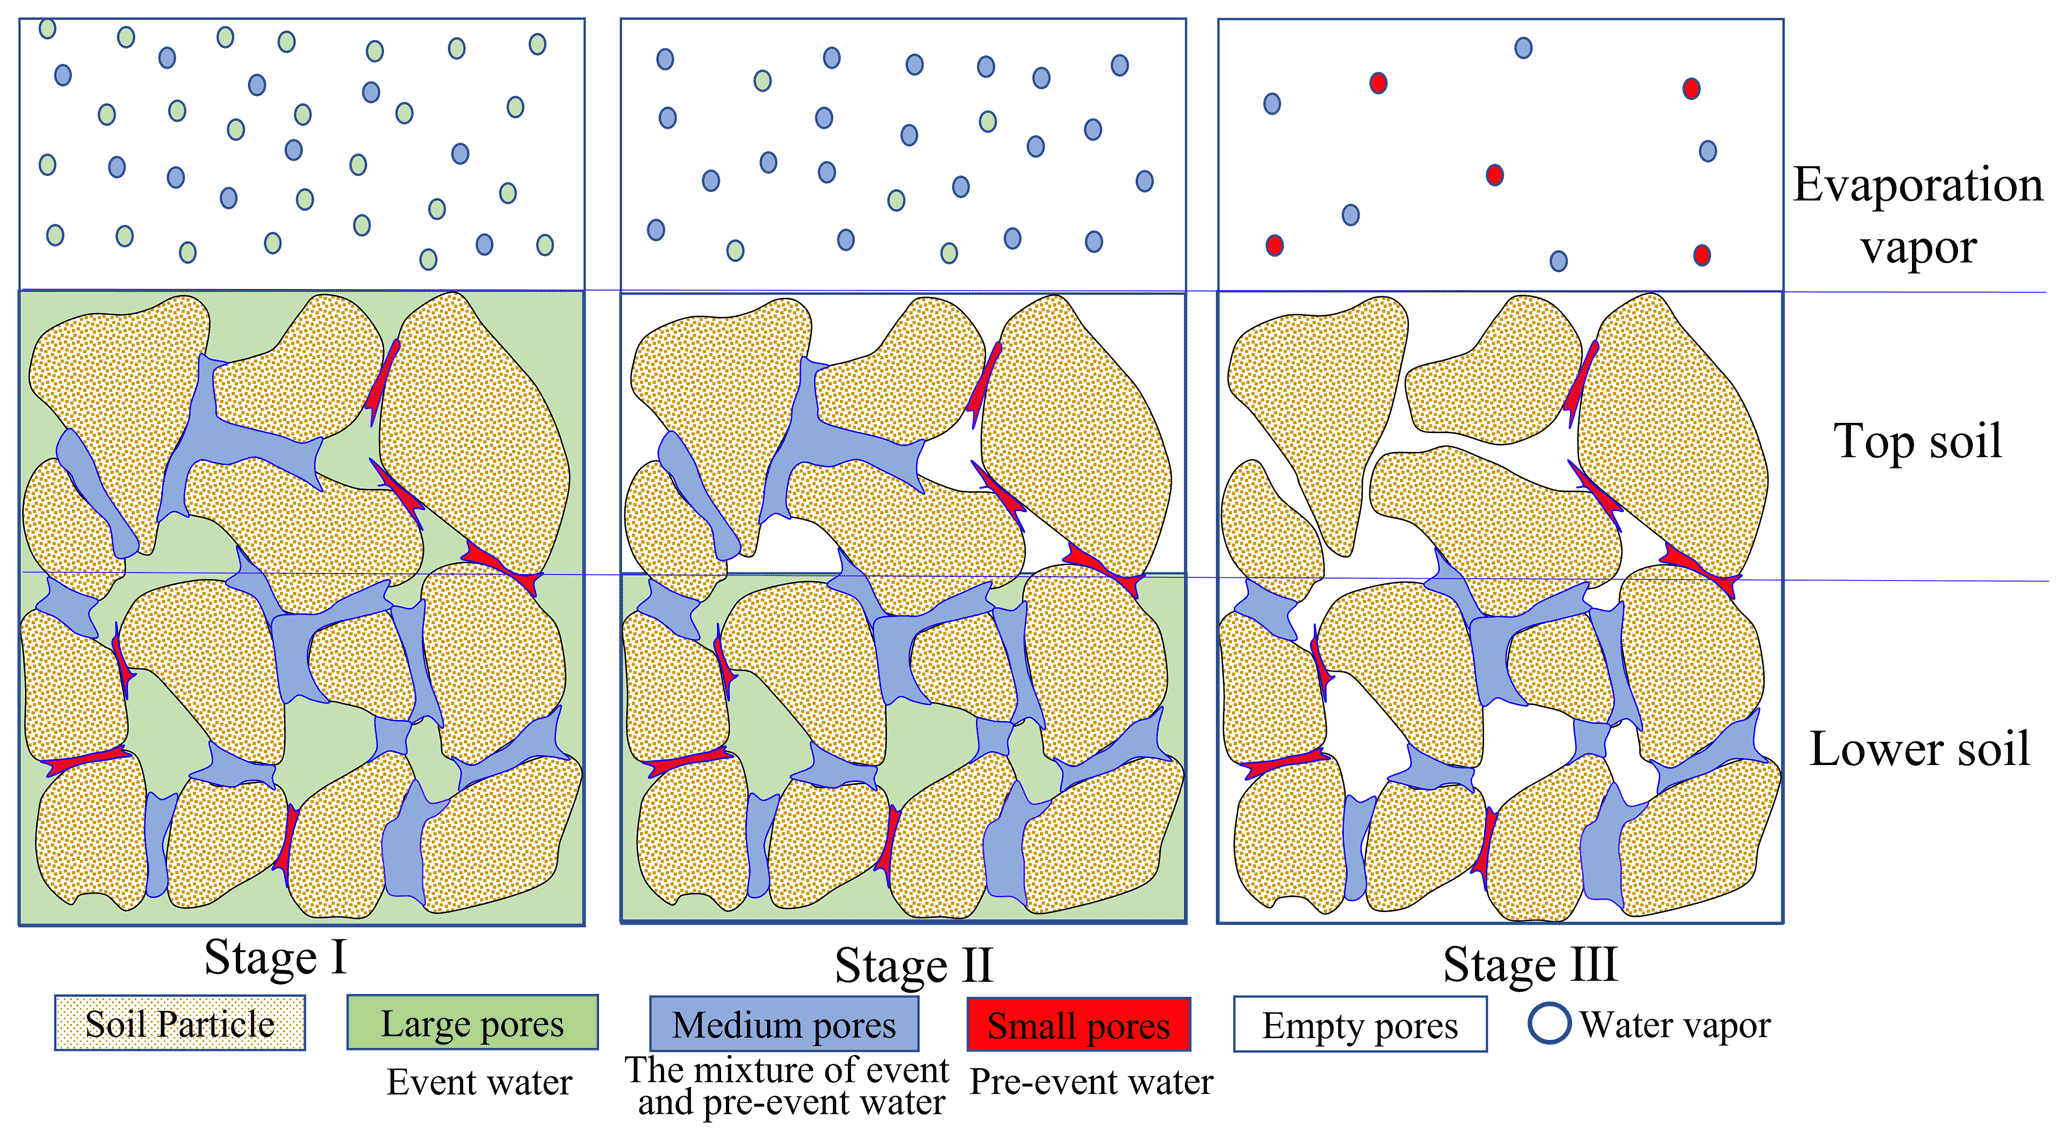
No significant δ2H differences were observed between EW and BW in period II (Fig. 5). However, there was a significant δ18O difference between EW and BW in period II, and both δ2H and δ18O in EW differed from the respective values in BW in period I (Figs. 4 and 5). The different isotopic signatures of BW and EW indicate that the water sources for BW and EW were different. Furthermore, the source of EW is closer to the event water than that of BW. This could be explained by a conceptual model of event water and pre-event water partitioning in the soil (Fig. 8).
4.2 Conceptual model for water partitioning in large and small pores during evaporation
For large and intense precipitation events, event water preferentially infiltrates into the empty large pores because of their high hydraulic conductivity. The infiltrated water may partially or fully transfer to the surrounding empty smaller pores, thus bypassing the small soil pores that are filled with pre-event water at the point of water entry and along the infiltration pathway (Beven and Germann, 1982; Booltink and Bouma, 1991; Šimůnek and van Genuchten, 2008; Weiler and Naef, 2003; Zhang et al., 2019). The bypass flow occurs universally (Lin, 2010) and has also been reported in our experimental site at the Chinese Loess Plateau (Xiang et al., 2018; Zhang et al., 2019). In our experiment, the precipitation event on 24 July 2016 was 31 mm, with the intensity of 10.3 mm h−1, the irrigation event on 26 August 2016 was 30 mm, with the intensity of 30 mm h−1, and both were sufficient to initiate bypass flow (>10 mm h−1; Beven and Germann, 1982; Kumar et al., 1997). The pre-event soil water content was close to residual water content (Sect. 3.1), indicating that small pores were prefilled with pre-event water. Thus, it is reasonable to assume that the new water filled large pores, and medium pores were likely filled by a mixture of pre-event and event water. Therefore, water in large pores was similar to the event water and water in the small pores was close to the pre-event water, i.e., old event water (Brooks et al., 2010; Sprenger et al., 2019a).
On the other hand, at the end of the evaporation period, lc excess of 0–5 cm soil at 24 DAP, which had a lower soil water content than in period II, was still the smallest compared with deeper soil (Fig. 6d). Therefore, the evaporation front was in the surface soil during both periods. Accordingly, the evaporation in our experiment was in evaporation stages I or II, as indicated in the Introduction. During evaporation stages I and II, small-pore water does not evaporate (Or and Lehmann, 2019; Zhang et al., 2015), and larger-pore water is the primary source of water for evaporation (Lehmann and Or, 2009; Or et al., 2013).
Therefore, EW is mainly from larger-pore water, similar to the event water in isotopic composition; BW contains EW and evaporation-insulated small-pore water, similar to the pre-event water. Compared with pre-event water, event water takes evaporation precedence. Therefore, the sequence of water in the evaporation layer can be analogically summarized as adhering to a “last-in-first-out” rule. Thus, when isotopic composition in the event water was smaller than that in pre-event BW, such as δ2H and δ18O in period I and δ18O in period II, the isotopic composition in EW was smaller than that in BW (Fig. 4). When the event water was enriched in heavy isotopes relative to pre-event BW, such as δ2H in period II, EW should be enriched in 2H compared with BW; however, a more precise analysis is needed.
Furthermore, evaporative enrichment and loss of larger-pore water both affect the temporal variation in δ2H and δ18O in EW and BW. When larger-pore water is depleted in heavy isotopes relative to pre-event water, the isotopic composition of EW and BW increases with time; when larger-pore water is enriched in heavy isotopes relative to pre-event water, the enriched water in larger pores empties first, leaving lighter water molecules in BW, which will decrease the isotopic composition in EW and BW with evaporation time.
4.3 Why the different isotopic compositions in evaporating water and bulk soil water did not make a difference in estimated evaporative water loss
There was a significant difference in the isotopic composition between EW and BW; however, the evaporative water loss derived from EW and BW did not differ (p>0.05). As discussed above, the difference between EW and BW is caused by the small-pore water, which does not experience evaporation. The difference in period II was 1.99 ‰ for δ18O. Nevertheless, the δ18O difference between EW and BW was too small to make a difference in the calculated evaporative water loss. However, hypothetically increasing the difference from 1.99 ‰ to 3.40 ‰resulted in a significant difference in the calculated evaporative water loss (p<0.05). The hypothetically calculated δ18O difference is highly likely in two adjacent precipitation events, based on the 3 years' precipitation isotope data with the largest difference of 16.46 ‰. Many factors could contribute to the differences in isotopic composition between EW and BW. The first is the relative amount of small-pore water that did not experience evaporation and its isotopic composition difference with EW. The higher the clay content, the greater the amount of small-pore water for the same bulk soil water content (Van Genuchten, 1980). The second is the amount of event water and its isotopic difference with pre-event water. As such, the greater the temporal isotopic variability in precipitation, and evaporation loss, the greater the isotopic difference between EW and BW. Finally, higher soil cations and clay contents also elevate the isotopic difference between EW and BW, as the cations hydrated water and water absorbed by clay particles undergo isotopic fractionation (Gaj et al., 2017a; Oerter et al., 2014). Therefore, an increased difference in isotopic composition between EW and BW may occur for soils with high clay content and salinity and when the amount and isotopic composition differ greatly between event water and pre-event soil water.
The event water was more enriched in heavy isotopes than pre-event soil water, as shown by our δ2H result in period II. However, this rarely occurs in nature. Normally, soil water experiences evaporation and, thus, has more heavy isotopes than precipitation. Nevertheless, when the subcloud evaporation effect in precipitation is strong (Salamalikis et al., 2016), precipitation can have more heavy isotopes than pre-event soil water. In this situation, it is impossible to calculate the evaporation ratio using current theories and methods. New theories or methods to precisely measure water evaporation are needed in this regard.
Larger-pore water, preferred by evaporation, also has a relatively higher matric potential and flows more rapidly and may, thus, be preferred by roots and dominate groundwater recharge (Sprenger et al., 2018). In other words, evaporation, transpiration, and groundwater preferentially tap the same pool of water, i.e., the water that resides in larger soil pores. This is inconsistent with Brooks et al. (2010), who separated soil water into the following two water worlds: mobile water, which eventually enters the stream, and tightly bound water, which is used by plants. In our study, soil water content was below field capacity, and thus, according to Brooks et al. (2010), all water in our soil is “tightly bound water”, including the large-pore water we discussed above. Therefore, in our study, the larger-pore water is still under the field capacity, i.e., the water that percolates into streams (groundwater) rather slowly and/or is adsorbed by plant roots, which has broad ecohydrological implications.
We performed an experiment in two continuous evaporation periods, namely a relatively depleted water input in period I and a more enriched 2H and depleted 18O water input in period II. We collected condensation water using a newly covered plastic film and subsequently calculated the evaporating water's isotopic composition.
The results showed that δ2H and δ18O in EW had a similar trend to that in BW. When event water was depleted in heavy isotopes relative to pre-event bulk soil water, isotopic composition in EW and BW increased with increasing evaporation time (p<0.05), and EW was depleted in heavy isotopes relative to BW (p<0.05). When event water was enriched in heavy isotopes relative to pre-event bulk soil water, the isotopic composition in EW and BW decreased with increasing evaporation time (p<0.01). Moreover, the average evaporative water loss derived from δ18O was 0.27±0.01 and 0.24±0.01 for BW and EW, respectively. The difference between evaporative water loss was negligible, owing to the small difference in δ18O between EW and BW. As δ2H in BW and EW decreased with evaporation, evaporative water loss could not be obtained using δ2H. Our results indicate that although the isotopic composition in BW was significantly different from that in EW, the difference was too small to affect evaporative water loss calculation. However, a larger isotopic difference between the event and pre-event water may do. Our research is important for improving our understanding of soil evaporation processes and using isotopes to study evaporation fluxes.
The data that support the findings of this study are provided in the Supplement.
The supplement related to this article is available online at: https://doi.org/10.5194/hess-25-5399-2021-supplement.
HW, JJ, BC, and BS designed the research, prepared and interpreted the data, and wrote the paper. MW offered constructive suggestions for the paper. HW and XM conducted the fieldwork.
The authors declare that they have no conflict of interest.
Publisher's note: Copernicus Publications remains neutral with regard to jurisdictional claims in published maps and institutional affiliations.
We thank Han Li, Wei Xiang, Eric Neil, and Huijie Li for the fruitful discussions.
This research has been supported by the National Natural Science Foundation of China (grant nos. 41630860 and 41371233), the Natural Sciences and Engineering Research Council of Canada (grant no. 11111111), the Major Scientific and Technological Innovation Projects of Shandong Key R & D Plan (grant no. 2019JZZY010710), and the China Scholarship Council (grant no. 201806300115).
This paper was edited by Natalie Orlowski and reviewed by two anonymous referees.
Allison, G. B. and Barnes, C. J.: Estimation of evaporation from non-vegetated surfaces using natural deuterium, Nature, 301, 143–145, https://doi.org/10.1038/301143a0, 1983.
Aminzadeh, M. and Or, D.: Energy partitioning dynamics of drying terrestrial surfaces, J. Hydrol., 519, 1257–1270, https://doi.org/10.1016/j.jhydrol.2014.08.037, 2014.
Beven, K. and Germann, P.: Macropores and water flow in soils, Water Resour. Res., 18, 1311–1325, https://doi.org/10.1029/WR018i005p01311, 1982.
Booltink, H. W. G. and Bouma, J.: Physical and morphological characterization of bypass flow in a well-structured clay soil, Soil Sci. Soc. Am. J., 55, 1249–1254, https://doi.org/10.2136/sssaj1991.03615995005500050009x, 1991.
Brooks, J. R., Barnard, H. R., Coulombe, R., and McDonnell, J. J.: Ecohydrologic separation of water between trees and streams in a Mediterranean climate, Nat. Geosci., 3, 100–104, https://doi.org/10.1038/NGEO722, 2010.
Chen, H., Zhao, Y., Feng, H., Li, H., and Sun, B.: Assessment of climate change impacts on soil organic carbon and crop yield based on long-term fertilization applications in Loess Plateau, China, Plant Soil, 390, 401–417, https://doi.org/10.1007/s11104-014-2332-1, 2015.
Dane, J. H. and Topp, C. G. (Eds.): Methods of soil analysis, in: Part 4: Physical methods, Vol. 20, John Wiley & Sons, Madison, 2020.
Ding, R., Kang, S., Li, F., Zhang, Y., and Tong, L.: Evapotranspiration measurement and estimation using modified Priestley–Taylor model in an irrigated maize field with mulching, Agr. Forest Meteorol., 168, 140–148, https://doi.org/10.1016/j.agrformet.2012.08.003, 2013.
Dubbert, M., Cuntz, M., Piayda, A., Maguás, C., and Werner, C.: Partitioning evapotranspiration–Testing the Craig and Gordon model with field measurements of oxygen isotope ratios of evaporative fluxes, J. Hydrol., 496, 142–153, https://doi.org/10.1016/j.jhydrol.2013.05.033, 2013.
Gaj, M. and McDonnell, J. J.: Possible soil tension controls on the isotopic equilibrium fractionation factor for evaporation from soil, Hydrol. Process., 33, 1629–1634, https://doi.org/10.1002/hyp.13418, 2019.
Gaj, M., Kaufhold, S., Koeniger, P., Beyer, M., Weiler, M., and Himmelsbach, T.: Mineral mediated isotope fractionation of soil water, Rapid Commun. Mass Spectrom., 31, 269–280, https://doi.org/10.1002/rcm.7787, 2017a.
Gaj, M., Kaufhold, S., and McDonnell, J. J.: Potential limitation of cryogenic vacuum extractions and spiked experiments, Rapid Commun. Mass Spectrom., 31, 821–823, https://doi.org/10.1002/rcm.7850, 2017b.
Gat, J. R.: Oxygen And Hydrogen Isotopes In The Hydrologic Cycle, Annu. Rev. Earth Planet. Sci., 24, 225–262, https://doi.org/10.1146/annurev.earth.24.1.225, 1996.
Gerke, H. H. and Van Genuchten, M. T.: A dual-porosity model for simulating the preferential movement of water and solutes in structured porous media, Water Resour. Res., 29, 305–319, https://doi.org/10.1029/92WR02339, 1993.
Gibson, J. J., Birks, S. J., and Edwards, T.: Global prediction of da and δ2H-δ18O evaporation slopes for lakes and soil water accounting for seasonality, Global Biogeochem. Cy., 22, GB2031, https://doi.org/10.1029/2007GB002997, 2008.
Goldsmith, G. R., Muñoz-Villers, L. E., Holwerda, F., McDonnell, J. J., Asbjornsen, H., and Dawson, T. E.: Stable isotopes reveal linkages among ecohydrological processes in a seasonally dry tropical montane cloud forest, Ecohydrology, 5, 779–790, https://doi.org/10.1002/eco.268, 2012.
Good, S. P., Soderberg, K., Guan, K., King, E. G., Scanlon, T. M., and Caylor, K. K.: δ2H isotopic flux partitioning of evapotranspiration over a grass field following a water pulse and subsequent dry down, Water Resour. Res., 50, 1410–1432, https://doi.org/10.1002/2013WR014333, 2014.
Good, S. P., Noone, D., and Bowen, G.: Hydrologic connectivity constrains partitioning of global terrestrial water fluxes, Science, 349, 175–177, https://doi.org/10.1126/science.aaa5931, 2015.
Hamilton, S. K., Bunn, S. E., Thoms, M. C., and Marshall, J. C.: Persistence of aquatic refugia between flow pulses in a dryland river system (Cooper Creek, Australia), Limnol. Oceanogr., 50, 743–754, https://doi.org/10.4319/lo.2005.50.3.0743, 2005.
Hillel, D.: Environmental Soil Physics, Academic Press, San Diego, 771 pp., 1998.
Horita, J. and Wesolowski, D. J.: Liquid-vapor fractionation of oxygen and hydrogen isotopes of water from the freezing to the critical temperature, Geochim. Cosmochim. Ac., 58, 3425–3437, https://doi.org/10.1016/0016-7037(94)90096-5, 1994.
Kendall, C. and McDonnell, J. J. (Eds.): Isotope tracers in catchment hydrology, Elsevier, Amsterdam, 2012.
Klaus, J., Zehe, E., Elsner, M., C Külls, and Mcdonnell, J. J.: Macropore flow of old water revisited: experimental insights from a tile-drained hillslope, Hydrol. Earth Syst. Sci., 17, 103–118, https://doi.org/10.5194/hess-17-103-2013, 2013.
Knezevic, A.: Overlapping confidence intervals and statistical significance, StatNews, 73, Cornell University Statistical Consulting Unit, 2008.
Kool, D., Agam, N., Lazarovitch, N., Heitman, J. L., Sauer, T. J., and Ben-Gal, A.: A review of approaches for evapotranspiration partitioning, Agr. Forest Meteorol., 184, 56–70, https://doi.org/10.1016/j.agrformet.2013.09.003, 2014.
Kumar, A., Kanwar, R. S., and Hallberg, G. R.: Separating preferential and matrix flows using subsurface tile flow data, J. Environ. Health Sci. Eng. Pt. A, 32, 1711–1729, https://doi.org/10.1080/10934529709376639, 1997.
Landwehr, J. M. and Coplen, T. B.: Line-conditioned excess: a new method for characterizing stable hydrogen and oxygen isotope ratios in hydrologic systems, in: International conference on isotopes in environmental studies, IAEA, Vienna, 132–135, 2006.
Lehmann, P. and Or, D.: Evaporation and capillary coupling across vertical textural contrasts in porous media, Phys. Rev. E, 80, 046318, https://doi.org/10.1103/PhysRevE.80.046318, 2009.
Levy, B. S. and Germann, P. F.: Kinematic wave approximation to solute transport along preferred flow paths in soils, J. Contam. Hydrol., 3, 263–276, https://doi.org/10.1016/0169-7722(88)90035-6, 1988.
Liang, B., Yang, X., He, X., Murphy, D. V., and Zhou, J.: Long-term combined application of manure and NPK fertilizers influenced nitrogen retention and stabilization of organic C in Loess soil, Plant Soil, 353, 249–260, https://doi.org/10.1007/s11104-011-1028-z, 2012.
Lin, H.: Linking principles of soil formation and flow regimes, J. Hydrol., 393, 3–19, https://doi.org/10.1016/j.jhydrol.2010.02.013, 2010.
Mook, W. G. and De Vries, J. J.: Volume I, Introduction: theory methods review, Environmental Isotopes in the Hydrological Cycle – Principles and Applications, International Hydrological Programme (IHP-V), Technical Documents in Hydrology No. 39, IAEA/UNESCO, Vienna, 75–76, 2000.
Oerter, E., Finstad, K., Schaefer, J., Goldsmith, G. R., Dawson, T., and Amundson, R.: Oxygen isotope fractionation effects in soil water via interaction with cations (Mg, Ca, K, Na) adsorbed to phyllosilicate clay minerals, J. Hydrol., 515, 1–9, https://doi.org/10.1016/j.jhydrol.2014.04.029, 2014.
Oki, T. and Kanae, S.: Global hydrological cycles and world water resources, Science, 313, 1068–1072, https://doi.org/10.1126/science.1128845, 2006.
Or, D. and Lehmann, P.: Surface evaporative capacitance: How soil type and rainfall characteristics affect global-scale surface evaporation, Water Resour. Res., 55, 519–539, https://doi.org/10.1029/2018WR024050, 2019.
Or, D., Lehmann, P., Shahraeeni, E., and Shokri, N.: Advances in soil evaporation physics – A review, Vadose Zone J., 12, 1–16, https://doi.org/10.2136/vzj2012.0163, 2013.
Orlowski, N. and Breuer, L.: Sampling soil water along the pF curve for δ2H and δ18O analysis, Hydrol. Process., 34, 4959–4972, https://doi.org/10.1002/hyp.13916, 2020.
Orlowski, N., Frede, H. G., Brüggemann, N., and Breuer, L.: Validation and application of a cryogenic vacuum extraction system for soil and plant water extraction for isotope analysis, J. Sens. Sens. Syst., 2, 179–193, https://doi.org/10.5194/jsss-2-179-2013, 2013.
Orlowski, N., Breuer, L., and McDonnell, J. J.: Critical issues with cryogenic extraction of soil water for stable isotope analysis, Ecohydrology, 9, 1–5, https://doi.org/10.1002/eco.1722, 2016.
Orlowski, N., Breuer, L., Angeli, N., Boeckx, P., Brumbt, C., Cook, C. S., Dubbert, M., Dyckmans, J., Gallagher, B., Gralher, B., Herbstritt, B., Hervé-Fernández, P., Hissler, C., Koeniger, P., Legout, A., Macdonald, C. J., Oyarzún, C., Redelstein, R., Seidler, C., Siegwolf, R., Stumpp, C., Thomsen, S., Weiler, M., Werner, C., and McDonnell, J. J.: Inter-laboratory comparison of cryogenic water extraction systems for stable isotope analysis of soil water, Hydrol. Earth Syst. Sci., 22, 3619–3637, https://doi.org/10.5194/hess-22-3619-2018, 2018.
Phillips, F. M.: Soil-water bypass, Nat. Geosci., 3, 77–78, https://doi.org/10.1038/ngeo762, 2010.
Radolinski, J., Pangle, L. A., Klaus, J., and Stewart, R. D.: Testing the `two water worlds' hypothesis under variable preferential flow conditions, Hydrol. Process., 35, e14252, https://doi.org/10.1002/hyp.14252, 2021.
Robertson, J. A. and Gazis, C. A.: An oxygen isotope study of seasonal trends in soil water fluxes at two sites along a climate gradient in Washington state (USA), J. Hydrol., 328, 375–387, https://doi.org/10.1016/j.jhydrol.2005.12.031, 2006.
Salamalikis, V., Argiriou, A. A., and Dotsika, E.: Isotopic modeling of the sub-cloud evaporation effect in precipitation, Sci. Total Environ., 544, 1059–1072, https://doi.org/10.1016/j.scitotenv.2015.11.072, 2016.
Si, B., Dyck, M., and Parkin, G.: Flow and transport in layered soils, Can. J. Soil Sci., 91, 127–132, https://doi.org/10.4141/cjss11501, 2017.
Šimůnek, J. and van Genuchten, M. T.: Modeling Nonequilibrium Flow and Transport Processes Using HYDRUS, Vadose Zone J., 7, 782–797, https://doi.org/10.2136/vzj2007.0074, 2008.
Sklash, M. G., Beven, K. J., Gilman, K., and Darling, W. G.: Isotope studies of pipe flow at Plynlimon, Wales, UK, Hydrol. Process., 10, 1–24, https://doi.org/10.1002/(SICI)1099-1085(199607)10:7<921::AID-HYP347>3.0.CO;2-B, 1996.
Skrzypek, G., Mydłowski, A., Dogramaci, S., Hedley, P., Gibson, J. J., and Grierson, P. F.: Estimation of evaporative loss based on the stable isotope composition of water using Hydrocalculator, J. Hydrol., 523, 781–789, https://doi.org/10.1016/j.jhydrol.2015.02.010, 2015.
Sprenger, M. and Allen, S. T.: What ecohydrologic separation is and where we can go with it, Water Resour. Res., 56, e2020WR027238, https://doi.org/10.1029/2020wr027238, 2020.
Sprenger, M., Tetzlaff, D., and Soulsby, C.: Soil water stable isotopes reveal evaporation dynamics at the soil–plant–atmosphere interface of the critical zone, Hydrol. Earth Syst. Sci., 21, 3839–3858, https://doi.org/10.5194/hess-21-3839-2017, 2017.
Sprenger, M., Tetzlaff, D., Buttle, J., Laudon, H., and Soulsby, C.: Water ages in the critical zone of long-term experimental sites in northern latitudes, Hydrol. Earth Syst. Sci., 22, 3965–3981, https://doi.org/10.5194/hess-22-3965-2018, 2018.
Sprenger, M., Llorens, P., Cayuela, C., Gallart, F., and Latron, J.: Mechanisms of consistently disjunct soil water pools over (pore) space and time, Hydrol. Earth Syst. Sci., 23, 2751–2762, https://doi.org/10.5194/hess-23-2751-2019, 2019a.
Sprenger, M., Stumpp, C., Weiler, M., Aeschbach, W., Allen, S., Benettin, P., Dubbert, M., Hartmann, A., Hrachowitz, M., Kirchner, J. W., McDonnell, J. J., Orlowski, N., Penna, D., Pfahl, S., Rinderer, M., Rodriguez, N., Schmidt, M., and Wemer, C.: The demographics of water: A review of water ages in the critical zone, Rev. Geophys., 57, 800–834, https://doi.org/10.1029/2018rg000633, 2019b.
Thielemann, L., Gerjets, R., and Dyckmans, J.: Effects of soil-bound water exchange on the recovery of spike water by cryogenic water extraction, Rapid Commun. Mass Spectrom., 33, 405–410, https://doi.org/10.1002/rcm.8348, 2019.
Trenberth, K. E., Fasullo, J. T., and Kiehl, J.: Earth's global energy budget, B. Am. Meteorol. Soc., 90, 311–324, https://doi.org/10.1175/2008BAMS2634.1, 2009.
Van Genuchten, M. T.: A closed-form equation for predicting the hydraulic conductivity of unsaturated soils, Soil Sci. Soc. Am. J., 44, 892–898, https://doi.org/10.2136/sssaj1980.03615995004400050002x, 1980.
Wang, H., Si, B., Pratt, D., Li, H., and Ma, X.: Calibration method affects the measured δ2H and δ18O in soil water by direct H2O liquid–H2O vapour equilibration with laser spectroscopy, Hydrol. Process., 34, 506–516, https://doi.org/10.1002/hyp.13606, 2020.
Wang, L., Good, S. P., and Caylor, K. K.: Global synthesis of vegetation control on evapotranspiration partitioning, Geophys. Res. Lett., 41, 6753–6757, https://doi.org/10.1002/2014gl061439, 2014.
Wang, P., Song, X., Han, D., Zhang, Y., and Liu, X.: A study of root water uptake of crops indicated by hydrogen and oxygen stable isotopes: A case in Shanxi Province, China, Agr. Water Manage., 97, 475–482, https://doi.org/10.1016/j.agwat.2009.11.008, 2010.
Weiler, M. and Naef, F.: An experimental tracer study of the role of macropores in infiltration in grassland soils, Hydrol. Process., 17, 477–493, https://doi.org/10.1002/hyp.1136, 2003.
Wen, X., Yang, B., Sun, X., and Lee, X.: Evapotranspiration partitioning through in-situ oxygen isotope measurements in an oasis cropland, Agr. Forest Meteorol., 230, 89–96, https://doi.org/10.1016/j.agrformet.2015.12.003, 2016.
Xiang, W., Si, B. C., Biswas, A., and Li, Z.: Quantifying dual recharge mechanisms in deep unsaturated zone of chinese loess plateau using stable isotopes, Geoderma, 337, 773–781, https://doi.org/10.1016/j.geoderma.2018.10.006, 2018.
Zhang, C., Li, L., and Lockington, D.: A physically based surface resistance model for evaporation from bare soils, Water Resour. Res., 51, 1084–1111, https://doi.org/10.1002/2014wr015490, 2015.
Zhang, Z., Si, B., Li, H., and Li, M.: Quantify piston and preferential water flow in deep soil using Cl and soil water profiles in deforested apple orchards on the loess plateau, China, Water, 11, 2183, https://doi.org/10.3390/w11102183, 2019.
Zhao, M. H., Lu, Y. W., Rachana, H., and Si, B. C.: Analysis of Hydrogen and Oxygen Stable Isotope Characteristics and Vapor Sources of Precipitation in the Guanzhong Plain, Chin. J. Huan Jing Ke Xue, 41, 3148–3156, https://doi.org/10.13227/j.hjkx.201911063, 2020.