the Creative Commons Attribution 4.0 License.
the Creative Commons Attribution 4.0 License.
 | 16 Sep 2021
Sequential data assimilation for real-time probabilistic flood inundation mapping
Keighobad Jafarzadegan
Peyman Abbaszadeh
Hamid Moradkhani
Real-time probabilistic flood inundation mapping is crucial for flood risk warning and decision-making during the emergency period before an upcoming flood event. Considering the high uncertainties involved in the modeling of a nonlinear and complex flood event, providing a deterministic flood inundation map can be erroneous and misleading for reliable and timely decision-making. The conventional flood hazard maps provided for different return periods cannot also represent the actual dynamics of flooding rivers. Therefore, a real-time modeling framework that forecasts the inundation areas before the onset of an upcoming flood is of paramount importance. Sequential data assimilation (DA) techniques are well known for real-time operation of physical models while accounting for existing uncertainties. In this study, we present a DA hydrodynamic modeling framework where multiple gauge observations are integrated into the LISFLOOD-FP model to improve its performance. This study utilizes the ensemble Kalman filter (EnKF) in a multivariate fashion for dual estimation of model state variables and parameters where the correlations among point source observations are taken into account. First, a synthetic experiment is designed to assess the performance of the proposed approach; then the method is used to simulate the Hurricane Harvey flood in 2017. Our results indicate that the multivariate assimilation of point source observations into hydrodynamic models can improve the accuracy and reliability of probabilistic flood inundation mapping by 5 %–7 %, while it also provides the basis for sequential updating and real-time flood inundation mapping.
- Article
(7565 KB) - Full-text XML
- BibTeX
- EndNote


The on-time, accurate, and reliable characterization of an upcoming flood event is imperative for proper decision-making and risk analysis. A well-calibrated hydrologic model coupled with reliable weather forecast models can be used to generate the streamflow forecast (Clark and Hay, 2004; Cuo et al., 2011; Habets et al., 2004). While streamflow forecasting during flood events is indispensable, the critical step for flood risk analysis is to estimate the flood inundation areas corresponding to the forecasted streamflow of a potential upcoming event. Hydrodynamic models are common tools used to simulate the physics of a river system and predict the spatiotemporal distribution of water surface elevation (WSE). The predicted WSE can be simply converted to water depth and inundation area by overlaying it with a high-resolution digital elevation model (DEM; Merwade et al., 2008; Teng et al., 2017). Since floods happen in a short period and at a certain location, it is often not possible to find an appropriate remote sensing image that covers those inundated areas during the flood period. This is the main reason that research on flood inundation mapping is mostly limited to post-event analysis where specific study areas with available remote sensing data are used as test beds.
The Federal Emergency Management Agency (FEMA) is the leading agency in the USA that provides flood hazard and risk maps over the Contiguous United States (CONUS). While these maps display flood-prone areas corresponding to specific return periods (e.g., 100- and 500-year events), they are not always reliable for an upcoming flood event. For example, FEMA 100- and 500-year flood hazard maps covered only one-third and half, respectively, of the inundated areas induced by Hurricane Harvey in Harris County, Texas (Pinter et al., 2017). The National Water Center Innovators Program proposed the idea of real-time flood inundation mapping across the USA in 2015 (Maidment, 2017). It highlighted the importance of event-based flood inundation mapping where a model uses the forecasted river discharge to estimate the inundation areas corresponding to a specific flood just before the onset of the event. Compared to the traditional flood hazard mapping, real-time flood inundation mapping is more informative and beneficial for emergency-response-related decision-making.
In real-time flood inundation mapping, the model takes advantage of forecasted forcing data and generates inundation areas corresponding to an upcoming flood event. Providing these maps ahead of time is extremely valuable for building a robust flood warning system. Data assimilation (DA) is an effective approach commonly used to improve the performance of real-time hydrologic forecasting by updating the model state variables and parameters when new observation becomes available (Moradkhani et al., 2019). The integration of DA with physical models is highly advantageous as it enables accounting for different sources of uncertainties involved in model predictions. These include (1) forcing data uncertainty due to the limitation of measurements and spatiotemporal representativeness of the data (Alemohammad et al., 2015; Kumar et al., 2017), (2) parameter uncertainty due to equifinality and non-uniqueness of parameters (Abbaszadeh et al., 2018; Leach et al., 2018), (3) model structural uncertainty due to the imperfect representation and conceptualization of a real system (Abbaszadeh et al., 2019; Pathiraja et al., 2018; Zhang et al., 2019), and (4) initial and boundary condition uncertainty (DeChant and Moradkhani, 2014; Lee et al., 2011).
Probabilistic forecasting and uncertainty quantification using DA have been the core of modeling in the atmospheric and oceanic sciences (e.g., Anderson and Anderson, 1999; Courtier et al., 1993). Later, the hydrologic community started to utilize this approach to account for the uncertainties involved in different layers of model predictions and provide a more accurate and reliable estimation of soil moisture (Gavahi et al., 2020; Pauwels et al., 2001; Reichle et al., 2002; Xu et al., 2020), streamflow (Moradkhani et al., 2005b), snow (Sheffield et al., 2003; Slater and Clark, 2006), and other hydrologic variables. Despite these advances in hydrologic studies, the application of data assimilation in conjunction with hydrodynamic models has received little attention in the literature. The characterization of uncertainty in hydrodynamic models for probabilistic flood inundation mapping has been mostly limited to Monte Carlo sampling (Ahmadisharaf et al., 2018; Aronica et al., 2012; Domeneghetti et al., 2013; Neal et al., 2013; Papaioannou et al., 2017; Pedrozo-Acuña et al., 2015; Purvis et al., 2008; Savage et al., 2016) and generalized likelihood uncertainty estimation (GLUE; Aronica et al., 2002a; Romanowicz and Beven, 2003).
The effectiveness and application of assimilating remotely sensed data (e.g., Soil Moisture Active Passive, SMAP) into hydrologic models have been vastly investigated in the literature (Abbaszadeh et al., 2020; Azimi et al., 2020; Lievens et al., 2017). However, given the small scale of the hydrodynamic modeling process, the spatiotemporal resolution of current satellite products is not adequate for assimilating into these models. Due to the short duration of floods, satellite data with a subdaily timescale and spatial resolution less than the river width (e.g., 100 m) is recommended. Since remote sensing products do not provide such high spatiotemporal resolution data for hydrodynamic models, the research on hydrodynamic data assimilation is limited in the literature. Some studies have limited their analyses to large rivers with a width of above 1 km (e.g., studies of the Nile and Amazon rivers; Brêda et al., 2019). However, since the width of the majority of rivers is less than 100 m, these studies cannot be practically used in many regions.
Several studies used higher-resolution synthetic Surface Water and Ocean Topography (SWOT) data to evaluate the performance of assimilation techniques (Durand et al., 2008; Munier et al., 2015; Pedinotti et al., 2014; Yoon et al., 2012). While these works provided important information about the assimilation of satellite data into hydrodynamic models, their applications are only limited to synthetic experiments, making them impractical for real case studies. Some studies have implemented indirect methods to estimate WSE from flood extents generated by high-resolution Synthetic Aperture Radar (SAR) satellite data (Giustarini et al., 2011; Hostache et al., 2010; Matgen et al., 2010a; Neal et al., 2009). This approach can provide high-resolution data that are suitable for the majority of rivers. However, the reliability of this data is concerning because the methods used to convert the flood extent to WSE pose additional errors that downgrade the quality of the final observed data for assimilation practices. Besides these issues, the major drawback of remote sensing data assimilation pertains to their coarse temporal resolutions. To efficiently monitor the flood dynamics, the assimilation process should be performed at a daily/hourly timescale; however, the revisit frequency of satellites used for capturing the WSE ranges from a week to a month. Therefore, there is a significantly low chance to capture multiple real-time remote sensing images for the majority of inundated catchments during flood events. In the most optimistic scenario, assimilation of satellite data is only limited to one/two updates during the simulation period, which may not be sufficient for reliable probabilistic flood inundation mapping.
Application of DA in hydrodynamic modeling can be either river monitoring or flood inundation mapping. The goal of hydrodynamic data assimilation for river monitoring is to track variations in the channel roughness and bathymetry in the long run. Therefore, the weekly/monthly satellite data can be well assimilated into the models as the channel characteristics do not change on a daily basis. On the other hand, flood inundation mapping needs an hourly/daily track of WSE because floods happen rapidly and affect the river dynamics on a short timescale. The literature indicates that those studies that assimilated data into hydrodynamic models have been mostly designed for river monitoring (Brêda et al., 2019; Durand et al., 2008; Yoon et al., 2012b). To capture the daily dynamics of the rivers for real-time flood inundation mapping, the discharge and water stage values measured at the gauge stations can be assimilated into the hydrodynamic models. Xu et al. (2017) performed a particle filtering (PF) approach to assimilate the water stage data from six gauges into a hydrodynamic model. In order to calculate the particle weights in the filtering process, they assumed that gauge observations are independent. In this study, however, we consider interconnections among the gauge stations and apply a multivariate ensemble Kalman filter (EnKF) to a two-dimensional (2D) hydrodynamic model for better characterization and quantification of uncertainty and further improving the accuracy of model simulations.
Advancing the probabilistic hydrodynamic modeling with DA techniques is a necessary step to fill the gap between hydrology and hydrodynamics. To address this problem, this study aims to explore the capability of a standard sequential DA technique, namely the EnKF, for real-time probabilistic flood inundation mapping. Past studies that used the DA in conjunction with hydrodynamic models, have mostly focused on the quantification of uncertainty in one or two hydrodynamic variables; e.g., Giustarini et al. (2011) and Hostache et al. (2018) only investigated the uncertainty in the upstream flow and rainfall, respectively, and Yoon et al. (2012) focused on the uncertainty of river bathymetry while ignoring the roughness parameter uncertainty. In addition, the main application of the DA hydrodynamic modeling framework has been in river monitoring at long-term or water stage forecasting during the flood events (Brêda et al., 2019; Matgen et al., 2010; Xu et al., 2017). However, this study takes one step further and proposes a DA hydrodynamic modeling framework for real-time probabilistic flood inundation mapping while accounting for major sources of uncertainties involved in the model simulations including hydrodynamic model parameters (channel roughness and river bathymetry), forcing data (river boundary conditions), and state variable (water depth). Additionally, unlike past works that assimilated either discharge or water stage into the hydrodynamic model, this study performs a multivariate DA to incorporate the observed values of both variables into the hydrodynamic model for a reliable simulation of inundation area.
In this study, we simulate the Hurricane Harvey flood, one of the worst natural disasters in the history of the USA that caused more than USD 120 billion (https://www.nhc.noaa.gov/data/tcr/AL092017_Harvey.pdf, last access: 30 August 2021) in damages. The Hurricane Harvey storm hit Texas on 25 August 2017, caused massive precipitation for 6 continuous days, and resulted in extreme flooding conditions in Houston and the surrounding areas. Given the considerable uncertainties in the hydrologic and hydrodynamic processes of such an extreme flood, a deterministic modeling approach with fixed inputs provides erroneous simulations that are highly different from observations. To account for the uncertainties involved in different layers of flood simulation, this study implements a DA hydrodynamic modeling framework and provides probabilistic flood inundation maps.

Figure 1(a) Study area with all gauges, rivers, and tributaries. (b) Geographic location of San Jacinto watershed within the state of Texas. (c) Geographic location of the study area within San Jacinto watershed (© NHDPlus and USGS).
Figure 1a shows the study area that consists of four main channels (blue lines) and eight tributaries (red lines). The study area is located in the state of Texas (Fig. 1b) in the middle of the San Jacinto watershed (Fig. 1c), a highly developed basin (USGS HUC 6 no. 120401) with an area of 10 400 km2. The main channels simulated in the study are around 106 km, draining into three HUC 8 watersheds; the spring (no. 12040102), West Fork San Jacinto River (no. 12040101) and East Fork San Jacinto River (no. 12040103). The drainage areas of the channels are relatively flat, with an average slope of 0.62 %, and the soil is mostly impermeable due to the high rate of recent developments in this region. The upstream and downstream boundary conditions (purple points) are provided from the daily streamflow in four United States Geological Survey (USGS) gauges (nos. 08068090, 08068500, 08068740, and 08068780) and water stage time series at the downstream gauge (no. 08069500). The daily streamflow discharge in two internal gauges (green points; nos. 08068800 and 08069000) and water stage time series in the second internal gauge are the observations that have been assimilated into the LISFLOOD-FP model. Internal gauges refer to those stations located between upstream and downstream of the simulated river system. Figure 1b and c presents the geographic location of the study area within the state of Texas and San Jacinto watershed, respectively. To set up the LISFLOOD-FP model, we use a DEM with 120 m spatial resolution resampled from one arc second (30 m) USGS National Elevation Dataset (NED). Such a coarse-resolution DEM alleviates the computational intensity of the proposed probabilistic hydrodynamic modeling framework. It should be noted that the subgrid solver used for simulation of flood has the advantage of accepting narrow rivers with a width of less than 120 m, while the cell sizes are 120 m. In this study, the DA hydrodynamic modeling framework is parallelized and performed on the University of Alabama High-Performance Computing cluster.
3.1 Flood inundation model
The flood inundation model used in this study is LISFLOOD-FP (Bates and De Roo, 2000), a raster-based 2D hydrodynamic model that simulates the spatiotemporal distribution of WSE over the study area. The model solves the momentum and continuity equations (Saint-Venant equations) as follows:
where Q is the flow rate at a given cross section with the area of A in the main channel, x denotes the location along the channel, t represents time, S0 and Sf are channel bed and friction slopes, and g is the gravitational acceleration.
We use the subgrid channel solver, the most recently developed numerical scheme that considers friction and water slope, as well as local acceleration components, in the shallow water equations (Neal et al., 2012). This solver is advantageous for large-scale and efficient modeling as it utilizes coarse-resolution DEMs along with channel widths that are smaller than DEM resolution. Since DA hydrodynamic modeling requires hundreds of model simulations, this solver helps reduce the computational burden of each simulation and enables the implementation of probabilistic flood inundation mapping within a DA framework. To set up the model, we assume rectangular cross-section areas and a uniform roughness for both channel and floodplain. Given the low sensitivity of LISFLOOD-FP to the floodplain roughness (Hall et al., 2005; Horritt and Bates, 2002), this parameter is assumed a constant value. However, the uncertainty of channel roughness is taken into account within the assimilation framework. We also consider the uncertainty of bathymetry by defining an offset parameter that uniformly lowers the DEM values of the river channels. In addition to model parameters (channel roughness and bathymetry), the upstream and lateral fluxes entered the river system as the boundary conditions of the model are other main sources of uncertainty in the assimilation framework.
The upstream boundary conditions are generated from four USGS gauge stations (Fig. 1). To estimate the lateral fluxes, we calculate the deficit in the system by subtracting the upstream from downstream flows and then distributing the deficit among river tributaries based on their drainage areas (Please refer to Jafarzadegan et al. (2021) for detailed information about the calculation of lateral flows in this study area). In Sect. 3.3, we will further discuss the procedure we used to initialize the model parameters and river boundary conditions.
3.2 Ensemble Kalman filter (EnKF)
Moradkhani et al. (2005a) provided a comprehensive description of the EnKF formulation for dual estimation of state and parameters in hydrologic models. Here we briefly describe the EnKF formulation for the multivariate assimilation of point source water stage and discharge data into a hydrodynamic model. For a more effective assimilation process, both types of interconnections between observations, namely the spatial correlation of a single observation (discharge or water stage) among different gauges and the correlation between both observations at a single gauge, are taken into account in the EnKF equations. The EnKF is used to simultaneously estimate model states and parameters. For this purpose, the parameters should be treated similarly to the state variables, with a difference that parameter evolution is generated artificially.
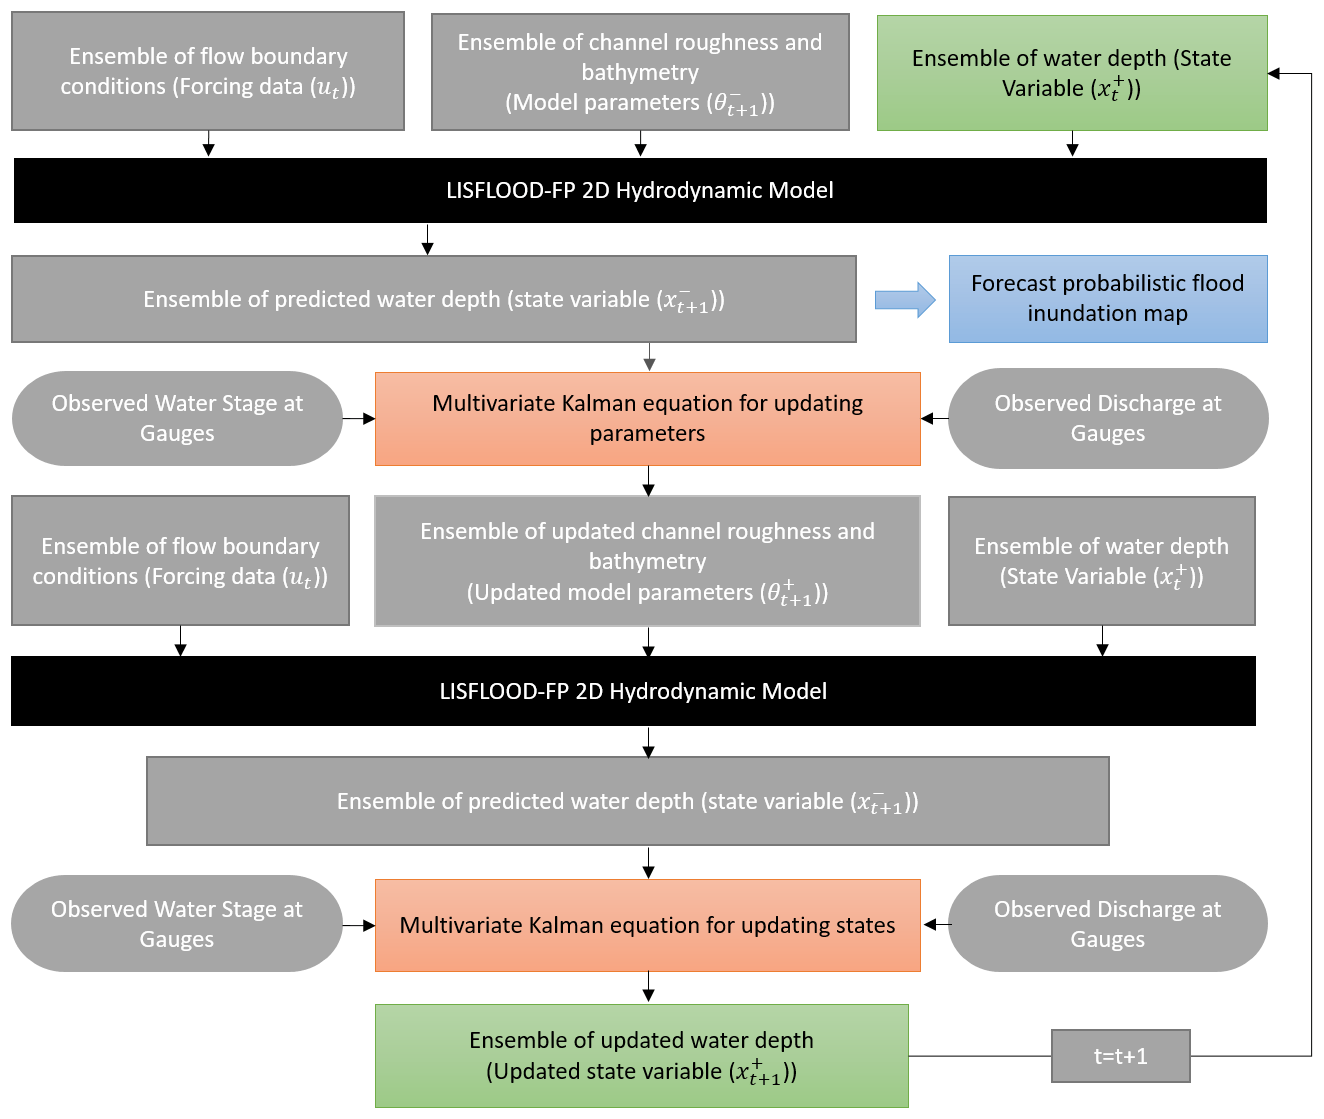
Figure 2Schematic of the DA hydrodynamic modeling framework for real-time probabilistic flood inundation mapping. The green boxes represent the state variables, where their updated values are fed into the LISFLOOD-FP model and provide a probabilistic flood inundation map at the forecast mode (blue box). The black boxes highlight the physical model, and the orange boxes represent the Kalman equations used for updating the parameter and state variables by the EnKF.
Let us assume a DA hydrodynamic modeling framework with l parameters (), m states (), and n observations (). The following EnKF equations are described in accordance with the flowchart shown in Fig. 2. In the EnKF, parameter samples can be generated by adding the noise of with covariance to the prescribed parameters.
Using and forcing data, a model state ensemble and predictions are generated, respectively.
where xt, ut, θt, and are the vector of the uncertain state variables, forcing data, model parameters, and model prediction at time step t, respectively. ωt and vt represent the model state and prediction errors due to the imperfect modeling. Most often, ωt and νt are assumed to be white noises with mean zero and covariance and , respectively. In addition, the two noises ωt and νt are assumed to be independent.
Then we update the parameter ensemble members using the standard Kalman filter equation as follows:
where and are the model prediction and observations, respectively, and is the Kalman gain matrix for correcting the parameter trajectories obtained by the following:
where is the cross-covariance matrix of the parameter ensemble and prediction ensemble (Eq. 6). Unlike other studies, and for more realistic characterization of observation and model errors, here the correlation between the errors associated with n observation data are accounted for during the assimilation process. Therefore, the covariance matrix is a nonzero matrix, such that the values in the diagonal represent the error variance associated with each observation data (Rt+1) and all elements below/above the main diagonal denote the cross-covariance between different observations (Eq. 9). is also a similar covariance matrix with the inclusion of error correlation between the model simulations (Eq. 8).
Now using the updated parameter, the new model state trajectories (state forecasts) and prediction trajectories are generated as follows:
The model states ensemble is similarly updated as follows:
where is the Kalman gain for correcting the state trajectories and is obtained by the following:
where is the cross-covariance matrix of states ensemble and prediction ensemble (Eq. 16).
In this study, the water depth along the channel is the only state variable (m=1). The channel roughness and bathymetry are two model parameters (l=2) and three point source observations, including water discharge at gauge 1 and 2, as well as water stage at gauge 2 (n=3), are assimilated into the LISFLOOD-FP model. Therefore, the Kalman gains used to update the model parameters and states (Eqs. 5 and 15) are 2×3 and 1×3 matrices that take advantage of a multivariate point source assimilation while considering the downstream correlation between discharge observations and the correlation between water stage and discharge at gauge 2.
3.3 DA hydrodynamic modeling framework
Figure 1 illustrates the flowchart of the proposed DA hydrodynamic modeling framework used for real-time probabilistic flood inundation mapping. In this study, the EnKF is performed based on an ensemble size of 100. The boundary conditions, including four upstream flows, seven lateral fluxes, and downstream flows, are perturbed with added white noises sampled from a normal distribution with a mean zero and relative error of 20 %. The errors are assumed to be heteroscedastic, meaning that their values are proportional to the flow magnitude. Pelletier (1988) conducted a literature review on the uncertainty of recorded flow at rivers and demonstrated that the error varies in the range 8 %–20 %. Later, Di Baldassarre and Montanari (2009) found that the uncertainty of extreme flows can exceed to 25 % due to extrapolating the rating curves. To characterize uncertainty in the initial condition, namely water depth, we add a white noise with a mean zero and standard deviation of 1 m. In this study, using the proposed EnKF-based multivariate assimilation approach, three point-scale observations, i.e., discharge at USGS gauges 1 and 2, as well as water stage at gauge 2, are incorporated into the LISFLOOD-FP model to rectify its state variables and parameters and, hence, provide more accurate and reliable flood inundation maps. First, the LISFLOOD-FP model is forced with the upstream, downstream, and lateral flow ensembles. To initialize the state variables in the system, the simulated water depth values at the ending day of the warm-up period (the initial condition for the first day of the model simulation) are perturbed by adding a white noise with a mean zero and standard deviation of 1 m. It is worth mentioning that the error terms used for the observed flows and the initial water depth are determined through a manual tuning to achieve the most reliable predictions during the simulation. The model parameters (i.e., channel roughness and bathymetry) are initialized using the Latin hypercube sampling method and evolved during the assimilation process. The ensemble of water depth values predicted by the model for the next time step, together with observations, namely water stage and discharge at gauges, are used in the multivariate Kalman equation to update the model parameters. The LISFLOOD-FP model is run for the second time with the updated parameters, and the second multivariate Kalman equation uses the predicted water depth with observations to update the ensemble of water depth in the system. The ensemble of updated water depth (state), bathymetry, and channel roughness (parameters) are used within the LISFLOOD-FP to predict an ensemble of water depth for the next time step. The predicted water depth is simply converted to a probabilistic flood inundation map. Using this data assimilation framework, we can generate 1 d forecast of probabilistic flood inundation maps which would be highly beneficial for real-time flood warning and decision-making.
The simulation period of the LISFLOOD-FP model is set up for 45 d from 30 July to 12 September 2017 and the entire month of July is used as a warm-up period. The model time step and the Courant number are set to 1 s and 0.7, respectively, and the model is simulated at a daily scale. The water depth generated for the end of July is used as the initial condition of the model. To account for the uncertainty of channel roughness and bathymetry, we sample these variables from uniform distributions ranging from [0, 0.1] and [39, 42] m, respectively. The bathymetry parameter is the elevation of the channel bed at the upper location of the channel. The offset parameter is calculated by subtracting this value from DEM at the upper location. Then, the bathymetry vector that includes the channel bed elevation for all channel cells is generated by subtracting the offset from DEM values along the channel. It should be noted that the range of uniform distribution for channel roughness is chosen based on previous studies (Aronica et al., 2002b; Bales and Wagner, 2009; Di Baldassarre et al., 2009; Horritt, 2006; Pappenberger et al., 2008), while the error range assumed for the bathymetry is mostly determined based on expert judgment and trial and error. Since the real magnitude and distribution of these errors have not been fully understood in the literature, their estimated values may not be physically correct terms, and their estimation is ill-posed, according to Renard et al. (2010).
3.4 Experimental design
To assess the effectiveness and robustness of the proposed assimilation framework for probabilistic flood inundation mapping, we design two experiments. In the first experiment, we perform DA hydrodynamic modeling on a synthetic case study where we assume the model is perfect and has no error. In this approach, we set the model parameters (channel roughness and bathymetry), initial state (water depth), and boundary condition flows to fixed values and run the model to generate discharge and WSE across the gauges within the study area. These predicted values are assumed as benchmark observations. This synthetic analysis ensures that the assimilation process performs well, and the model parameters end up converging to predefined values. In the second experiment, we implement the proposed assimilation framework on a real case study, where the observed discharge and WSE data that are recorded from the USGS gauges during Hurricane Harvey are assimilated into the model. In both experiments, we implement an open-loop (OL) simulation where the model is run without an assimilation. The WSE and flood extent maps generated by OL are compared with the results provided by the EnKF in the synthetic and real case studies. Considering the severe flood condition during the hurricane, we aim to investigate the extent to which the multivariate DA hydrodynamic modeling framework improves the model simulation and flood inundation mapping skill.
3.5 Validation strategy
As mentioned before, the convergence of uncertain model parameters toward truth in the synthetic experiment demonstrates the performance of DA hydrodynamic modeling framework. To provide a robust analysis of each assimilation run, it is necessary to assess the model performance through multiple deterministic, i.e., Kling–Gupta efficiency (KGE) and root mean square error (RMSE), and probabilistic, i.e., normalized root mean square error ratio (NRR) and reliability, measures. The four performance measures used in this study, namely KGE, RMSE, NRR, and reliability, are calculated using Eqs. (20)–(23), respectively.
where yt and are the observed and simulated values, respectively. The KGE varies from −∞ to 1, such that a value of 1 indicates a perfect fit between observed and simulated values. The pairs of (μ,σ) and represent the first two statistical moments (means and standard deviations) of yt and , respectively. RMSE is the square root of the mean of the square of all of the errors between the predicted and observed values.
NRR (DeChant and Moradkhani, 2012) is calculated to measure the ensemble spread and assess how confidently the ensemble mean is statistically distinguishable from the ensemble spread. Reliability (Renard et al., 2010b) is a measure of the fit of the Q–Q quantile plot to a uniform distribution. A value of 1 is exactly uniform, and a value of 0 is the farthest possibility from uniform. For the description of the zt and Ut calculation, we refer the reader to Renard et al. (2010b).
The above four performance measures assess the dynamic behavior of DA hydrodynamic modeling framework at two specific points. Moreover, to spatially evaluate the behavior of the proposed framework, we compare the maximum probabilistic flood inundation maps (union of probabilistic maps over the simulation period) with the observed floodplain map delineated aftermath of Hurricane Harvey. The receiver operating characteristic (ROC) graph is a common tool for validating probabilistic classifiers (Fawcett, 2006). Consider a deterministic flood map as a binary map where 1 and 0 represent flooded and non-flooded cells, respectively. First, a threshold in the range of [0, 1] is used to convert the probabilistic map to a binary deterministic map. This means all cells with the probability of inundation less than a given threshold are converted to 0 and other cells are set to 1. The binary map is compared with the reference map, and the rate of true positive (rtp) and false positive (rfp) are calculated using Eqs. (24) and (25) as follows (Jafarzadegan and Merwade, 2017):
where true and false positive instances represent the total number of flooded cells in the reference map that are predicted as flooded and non-flooded cells, respectively. Total positives and negatives are total flooded and non-flooded cells in the reference map. This process is repeated, and a set of points (rfp.rtp) is generated corresponding to different thresholds. The ROC graph connects the points in the rfp–rtp space, and the area under the curve (AUC) represents the performance of the probabilistic classifier (Fawcett, 2006). In this study, we use AUC to compare the performance of the OL simulation with the EnKF for probabilistic flood inundation mapping. The fit (F) index is another performance measure widely used to compare two deterministic flood extent maps in the literature (Alfieri et al., 2014; Bates and De Roo, 2000; Sangwan and Merwade, 2015; Tayefi et al., 2007).
In addition, we calculate the underprediction and overprediction flood indices (UFI and OFI, respectively) introduced by Jafarzadegan et al. (2018) to compare probabilistic flood maps against deterministic reference maps as follows:
where Fl and NFl denote the flooded and non-flooded regions in the reference map, and i and j are indicators of cells located within these regions. N and M are the total number of cells in the Fl and NFl regions, and Pi and Pj denote the probability of inundation for cells i and j derived from the probabilistic flood maps.
4.1 Experiment 1: synthetic case study
We conduct the synthetic experiment to ensure the usefulness and effectiveness of the proposed DA hydrodynamic modeling framework. Figure 3a presents uncertainty bound evolution of the parameters in the LISFLOOD-FP model (i.e., channel roughness and bathymetry) for 45 d assimilation of synthetic observations (i.e., discharge at gauges 1 and 2 and water stage at gauge 2). It is worth mentioning that the uncertainty of bathymetry shown in Fig. 3 corresponds to the channel bed elevation at the upper location of the channel. As seen, both parameters converge smoothly to the certain region in parameter space where the uncertainty bounds stabilize. While the uncertainty bound associated with the bathymetry becomes stabilized at the early stage of the assimilation process, for the channel roughness, the uncertainty bound is stabilized toward the end of the assimilation period. It is also evident from Fig. 3a that the bathymetry is a more identifiable parameter compared to the channel roughness as it shows the fastest convergence with a minimum degree of uncertainty. However, the channel roughness is less identifiable with the slowest convergence. In Fig. 3b, the first day (t=1) includes all 100 ensemble members of parameters, and day 30 corresponds to the highest discharge and water stage of flooding when the model parameters reach the highest improvement and come closer to the true value. Figure 3b shows that both model parameters are converging toward the true values as the assimilation proceeds. This indicates the efficacy and usefulness of the proposed DA hydrodynamic modeling framework developed in this study.
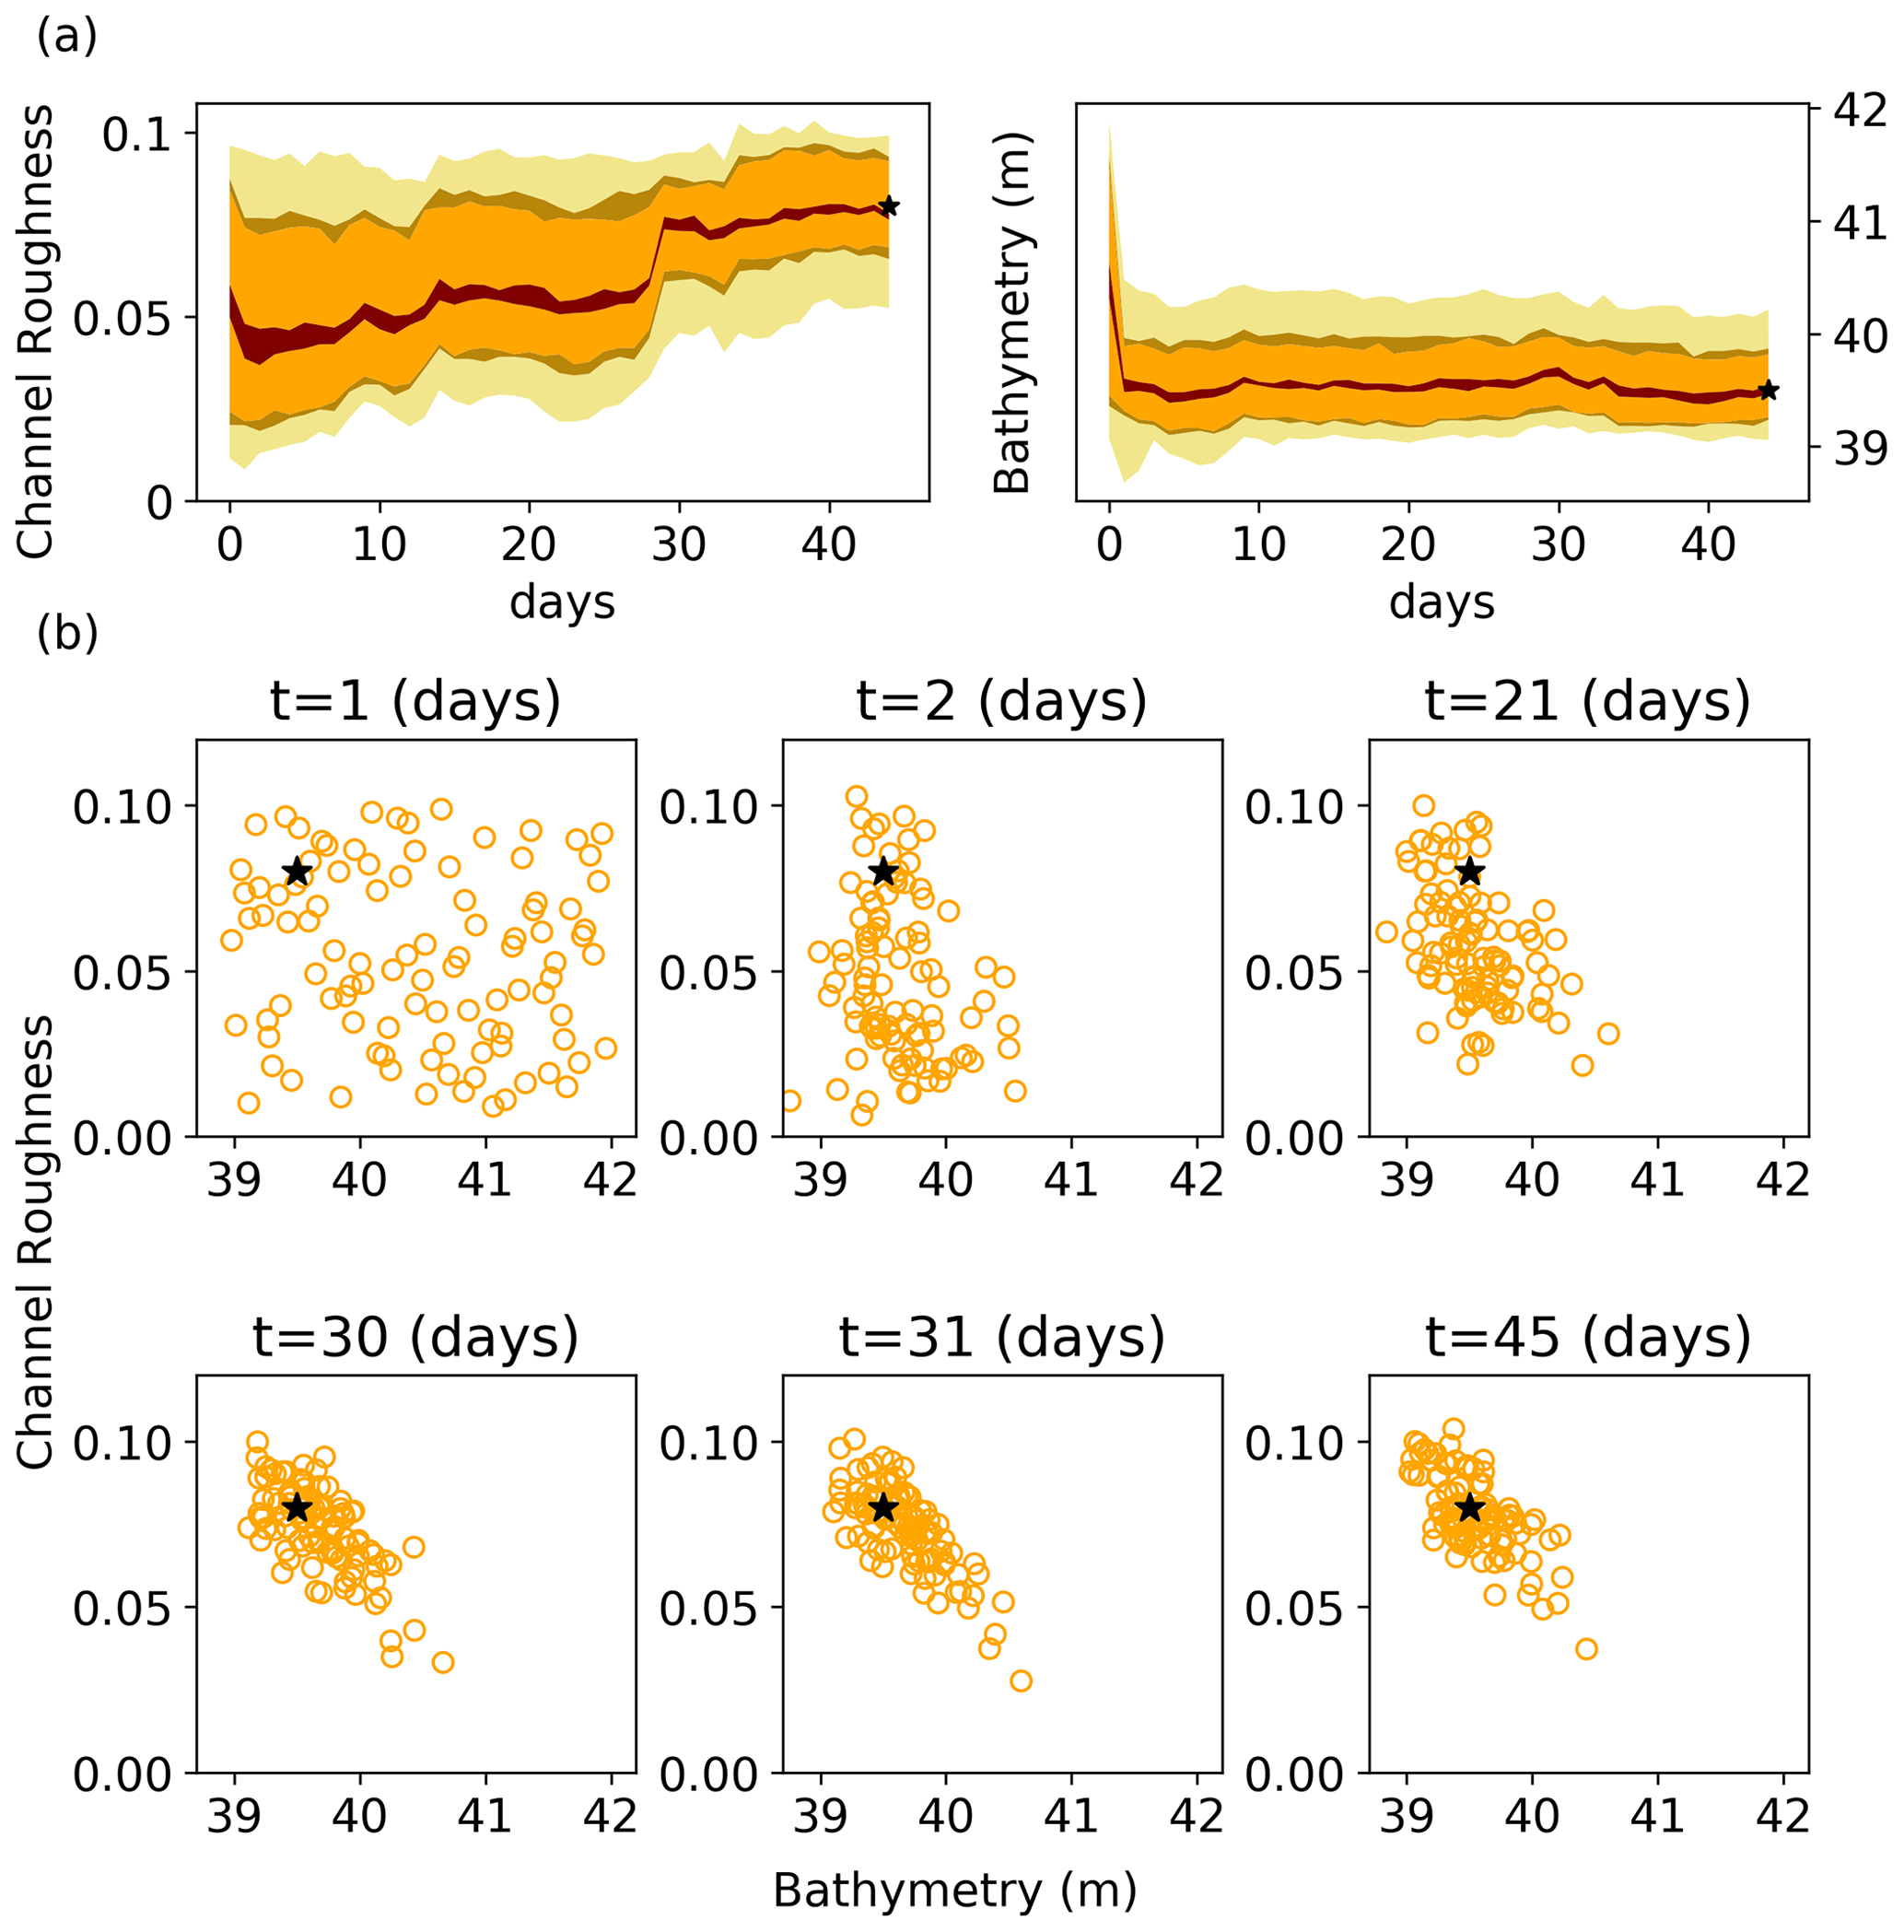
Figure 3Temporal evolution of the LISFLOOD parameters for the synthetic experiment during Hurricane Harvey using the EnKF. (a) Temporal evolution of model parameter predictive intervals (shaded areas) corresponding to the 95, 75, 68, and 10 percentile. (b) Temporal evolution of particle positions in the model parameter space at 6 different days during the hurricane. The black stars at the end of each parameter subplot represent the true parameter values.
4.2 Experiment 2: real case study
In the real experiment, we assimilate the discharge and water stage readings from two USGS gauges into the LISFLOOD-FP model. We also run the OL simulation and calculate the ensemble mean to predict the discharge and water stage at these two gauges. Figure 4 presents a comparison of simulated discharge (Fig. 4a and b) and water stage (Fig. 4c and d), with observations using both OL and our EnKF-based approach. Figure 4a and c are the prior estimates of discharge and water stage, while Fig. 4b and d show their posterior distributions that reflect the updated variables after assimilating the observations into the model. It is worth mentioning that, although prior distributions represent the results before assimilating new observations into the model, their values are dependent on the initial conditions updated from observations in the previous time step. Since forecasting (1 d lead time) is the main objective of DA hydrodynamic modeling framework, we specifically focus on the behavior of priors. As can be seen, the simulated peak discharge by the OL is highly overestimated by around 200 m3 s−1, while assimilating the observations improves the results so that their difference with the observation is less than 50 m3 s−1 at the peak of the flood (KGE=0.76 and RMSE=40.9 m3 s−1). In contrast, the simulated water stage in Fig. 4c and d is underestimated by OL by around 2 m at the peak. Compared to the OL, using the developed EnKF approach raises the peak of water stage at peak and reduces the errors significantly (KGE=0.96 and RMSE=0.5 m). The accurate estimates of prior discharge and water stage confirm the applicability of the proposed assimilation framework in the forecast mode when real-time flood warning and decision-making is the priority. The NRR measure for the prior discharge and water stage is 1.17 and 0.65, showing that the uncertainty bound is underestimated and overestimated, respectively. The reliability of both variables is above 70 % since the uncertainty bounds encompass the observations for almost the entire simulation period.
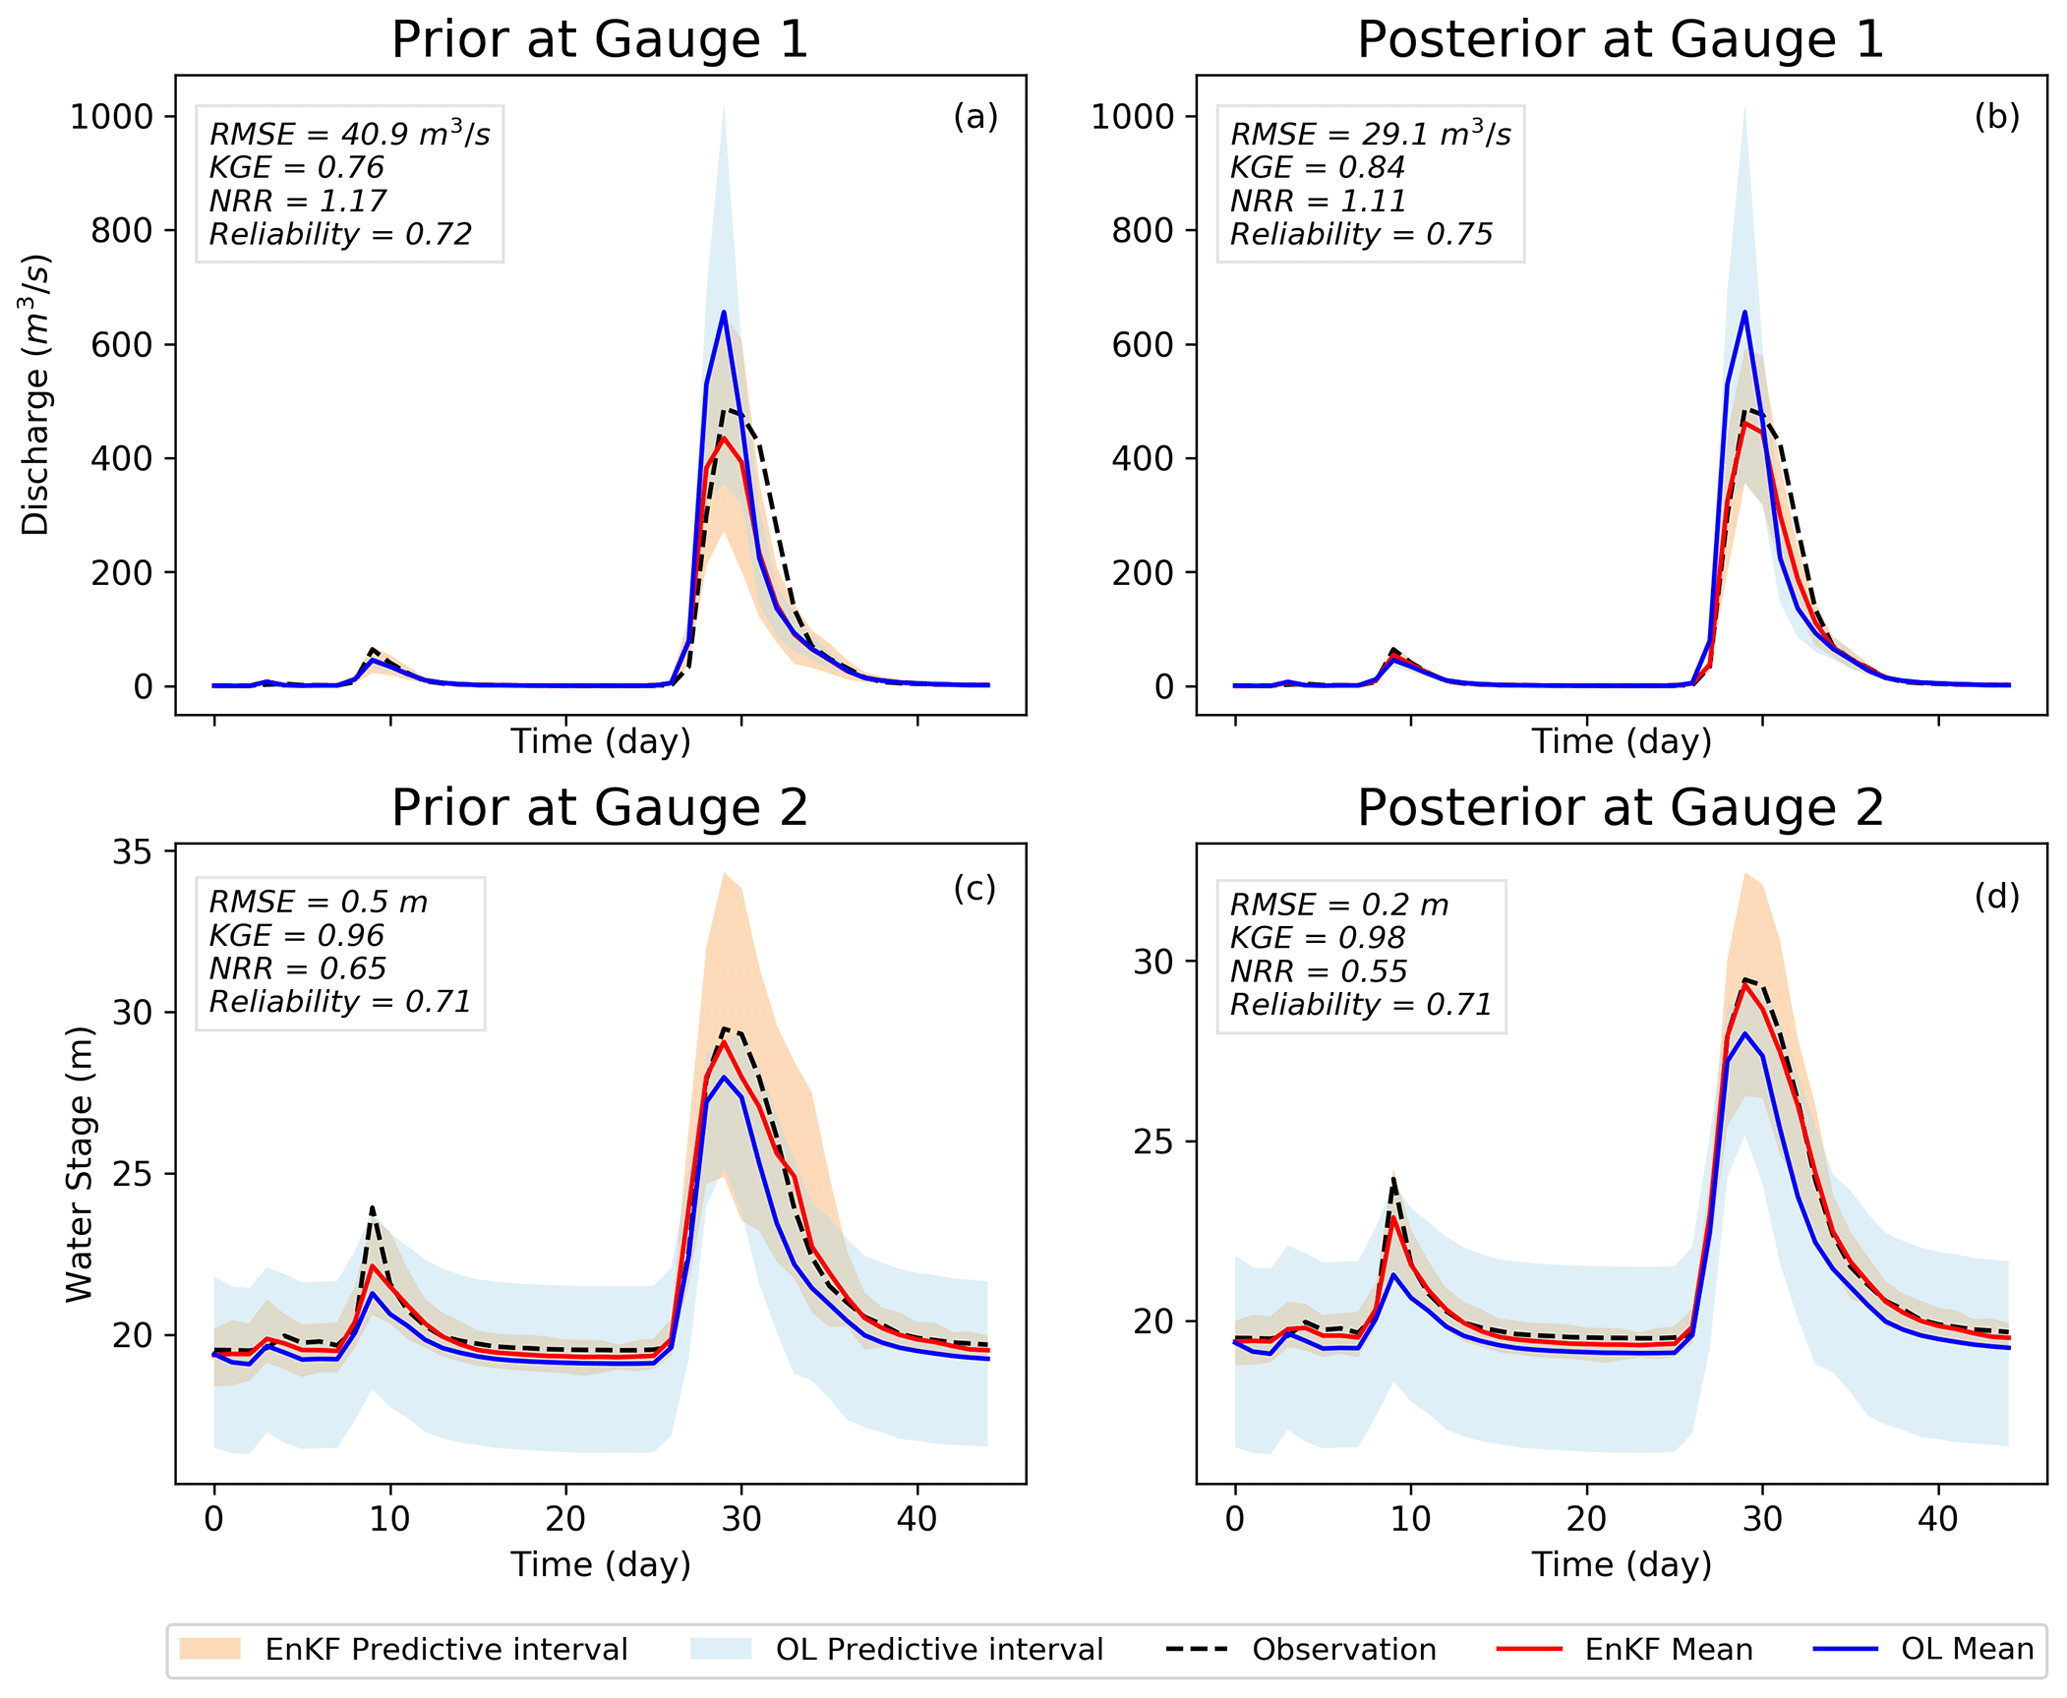
Figure 4Simulation results of LISFLOOD-FP for the real experiment during Hurricane Harvey using the EnKF and open loop. (a) Prior simulated discharge at gauge 1. (b) Posterior simulated discharge at gauge 1. (c) Prior simulated water stage at gauge 2. (d) Posterior simulated water stage at gauge 2. The shaded areas represent the predictive interval of simulated discharge and water stage by EnKF.
Figure 5 illustrates the prior and posterior distributions of discharge and water stage for the days at the beginning, peak, and end of the Hurricane Harvey flood. For all 3 d, the uncertainty bounds of both discharge and water stage are narrowed down by assimilating the observations so that posterior distributions are more precise compared to the priors. For the days at the beginning and end (26 August and 1 September), the mean of prior distributions is substantially shifted toward truth in the posterior distributions. Figure 5 reveals that our developed approach provides more accurate and reliable posterior discharge and water stage distributions compared to prior distributions where the simulations are either overestimated or underestimated. It is noted that, on 28 August (day of flood peak), although the prior distributions accurately represent the observation, they have a wide uncertainty bound. After correcting/updating the model state variables and parameters, as posterior distributions show, the uncertainty bound is reduced, while the ensemble mean remains closer to the observation.
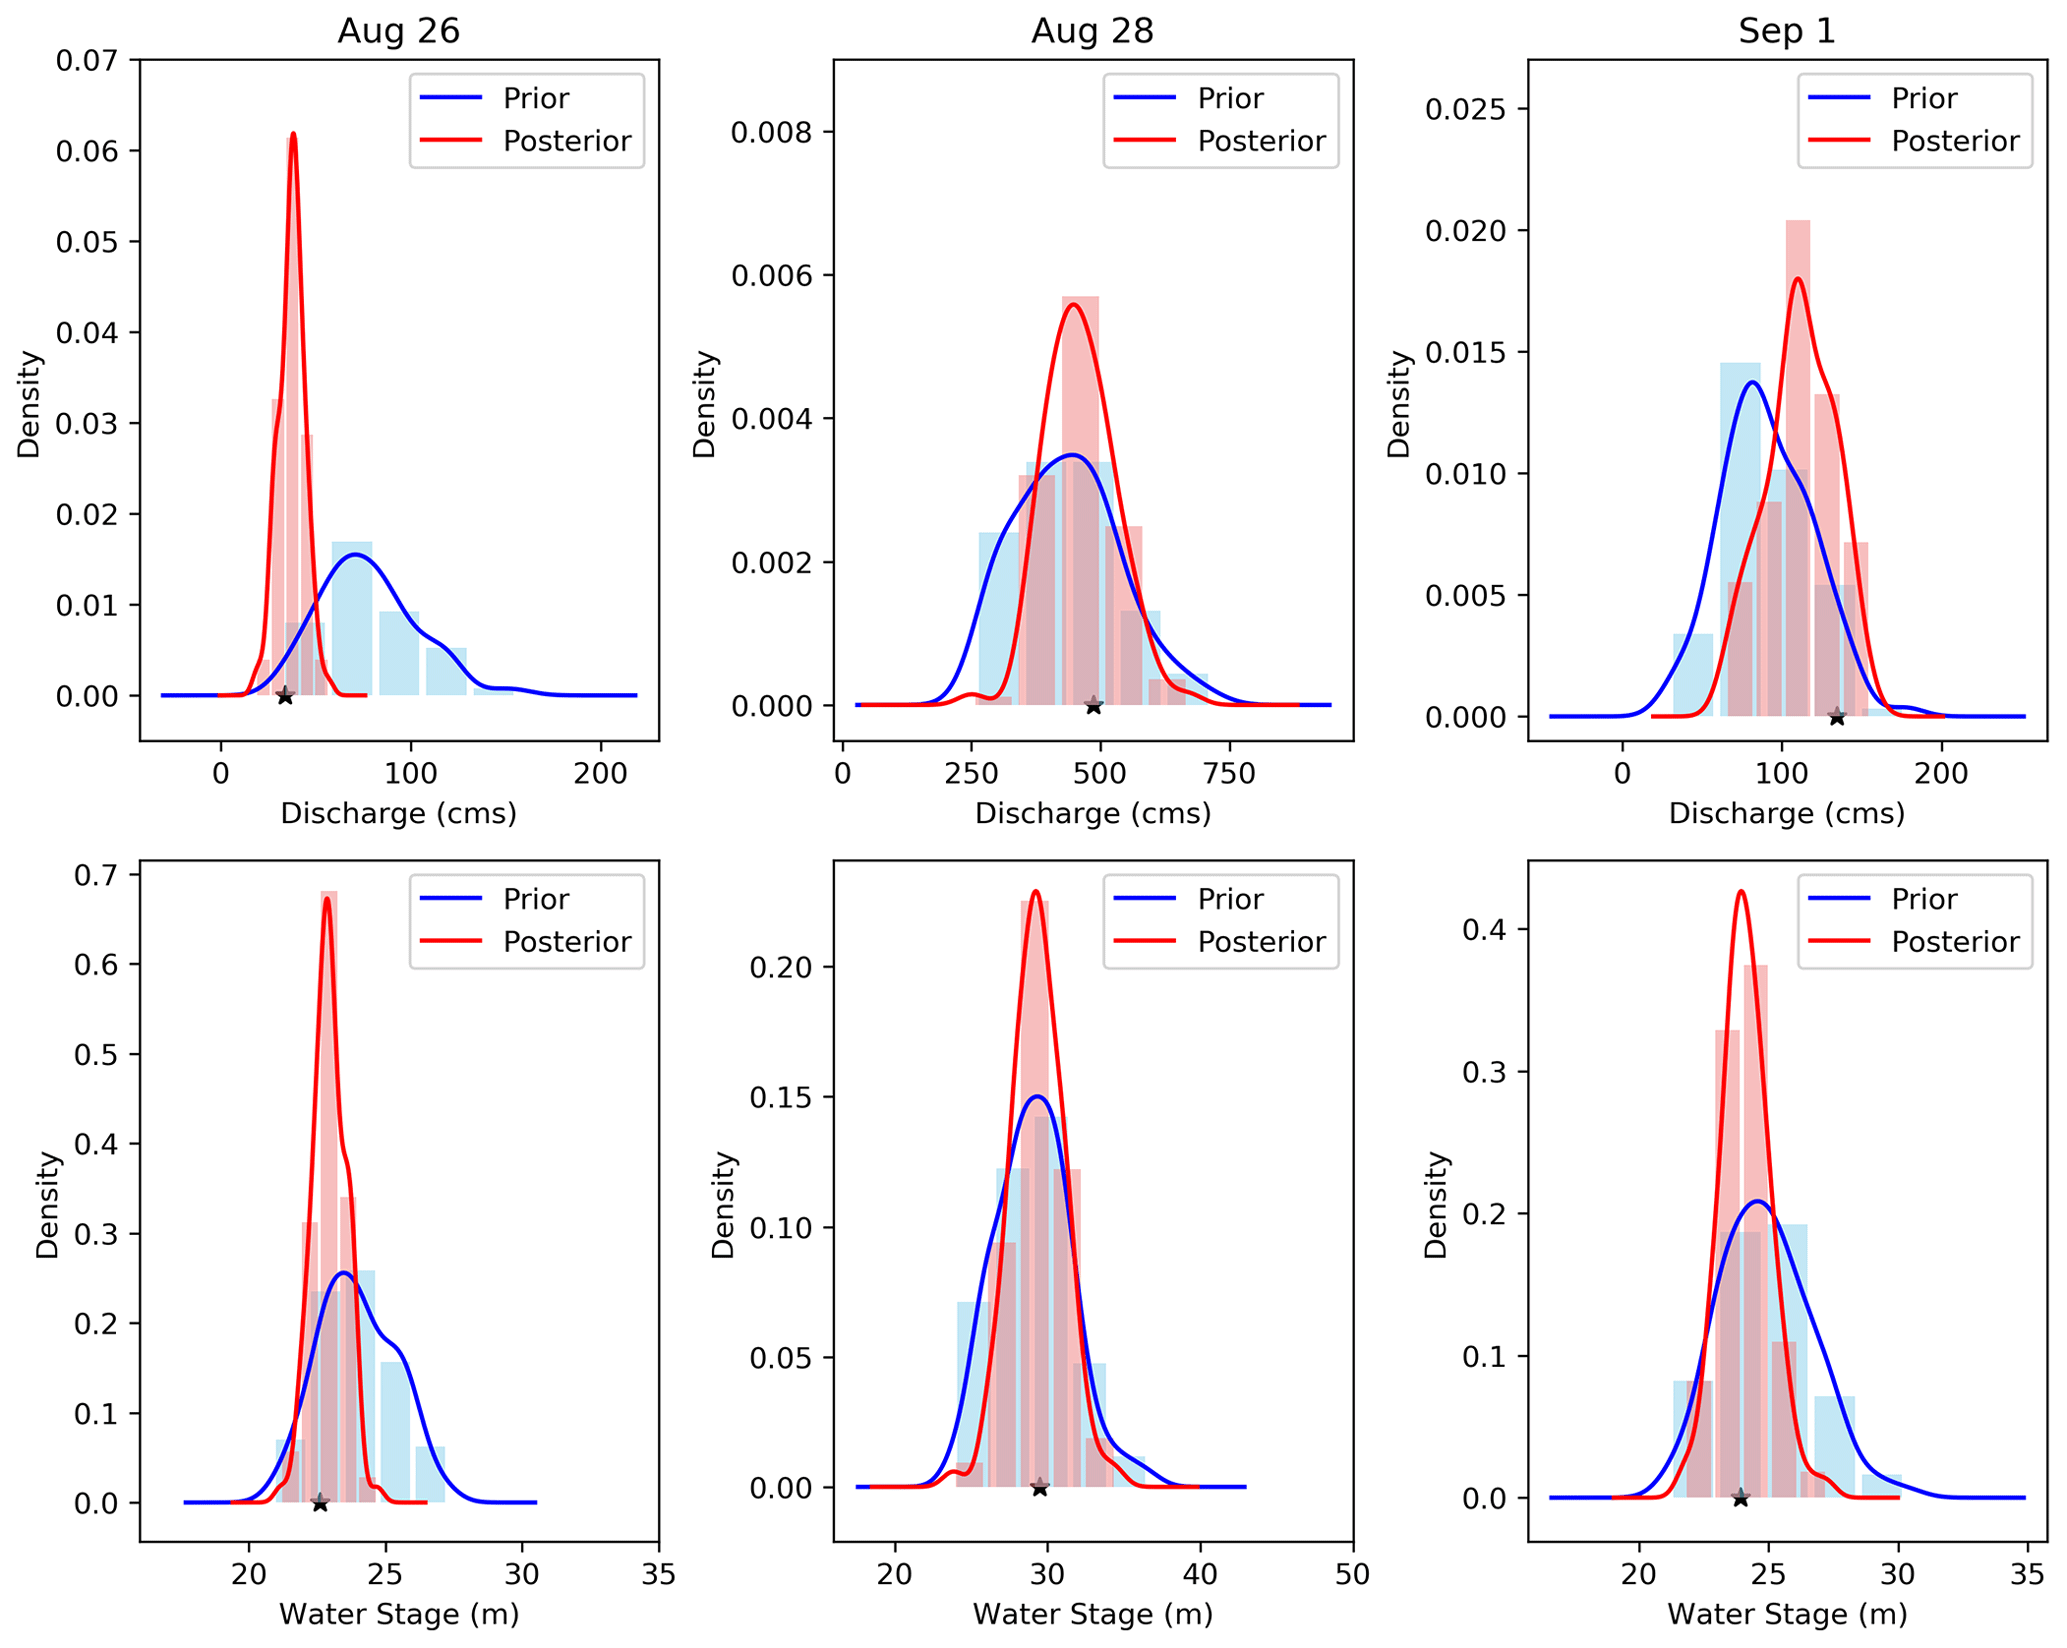
Figure 5Prior and posterior distribution of discharge (top row) and water stage (bottom row) for the days at the beginning (26 August), peak (28 August), and end (1 September) of Hurricane Harvey using the EnKF.
4.3 Probabilistic flood inundation mapping
In this section, we account for the uncertainties involved in flood modeling and generate real-time probabilistic flood inundation maps. Since the majority of flooding conditions occurred within 6 d, from 27 August–1 September, we display the spatial distribution of water depth in this period and provide probabilistic flood inundation maps using both OL and our developed approach (Figs. 6 and 7). Figure 6 represents the first 3 d of Hurricane Harvey, which corresponds to the upper limb of the flood hydrograph. On 27 August, the major difference between the OL and EnKF appears in the regions around the upstream of the lower channel, where the EnKF provides a more reliable prediction of the inundated area. Moving toward the peak of the flood on 29 August, the OL generates a large region of uncertain cells around the banks of the upper channel, while both the extent and density of uncertain values in the probabilistic maps generated by the EnKF is smaller during the peak of Hurricane Harvey.
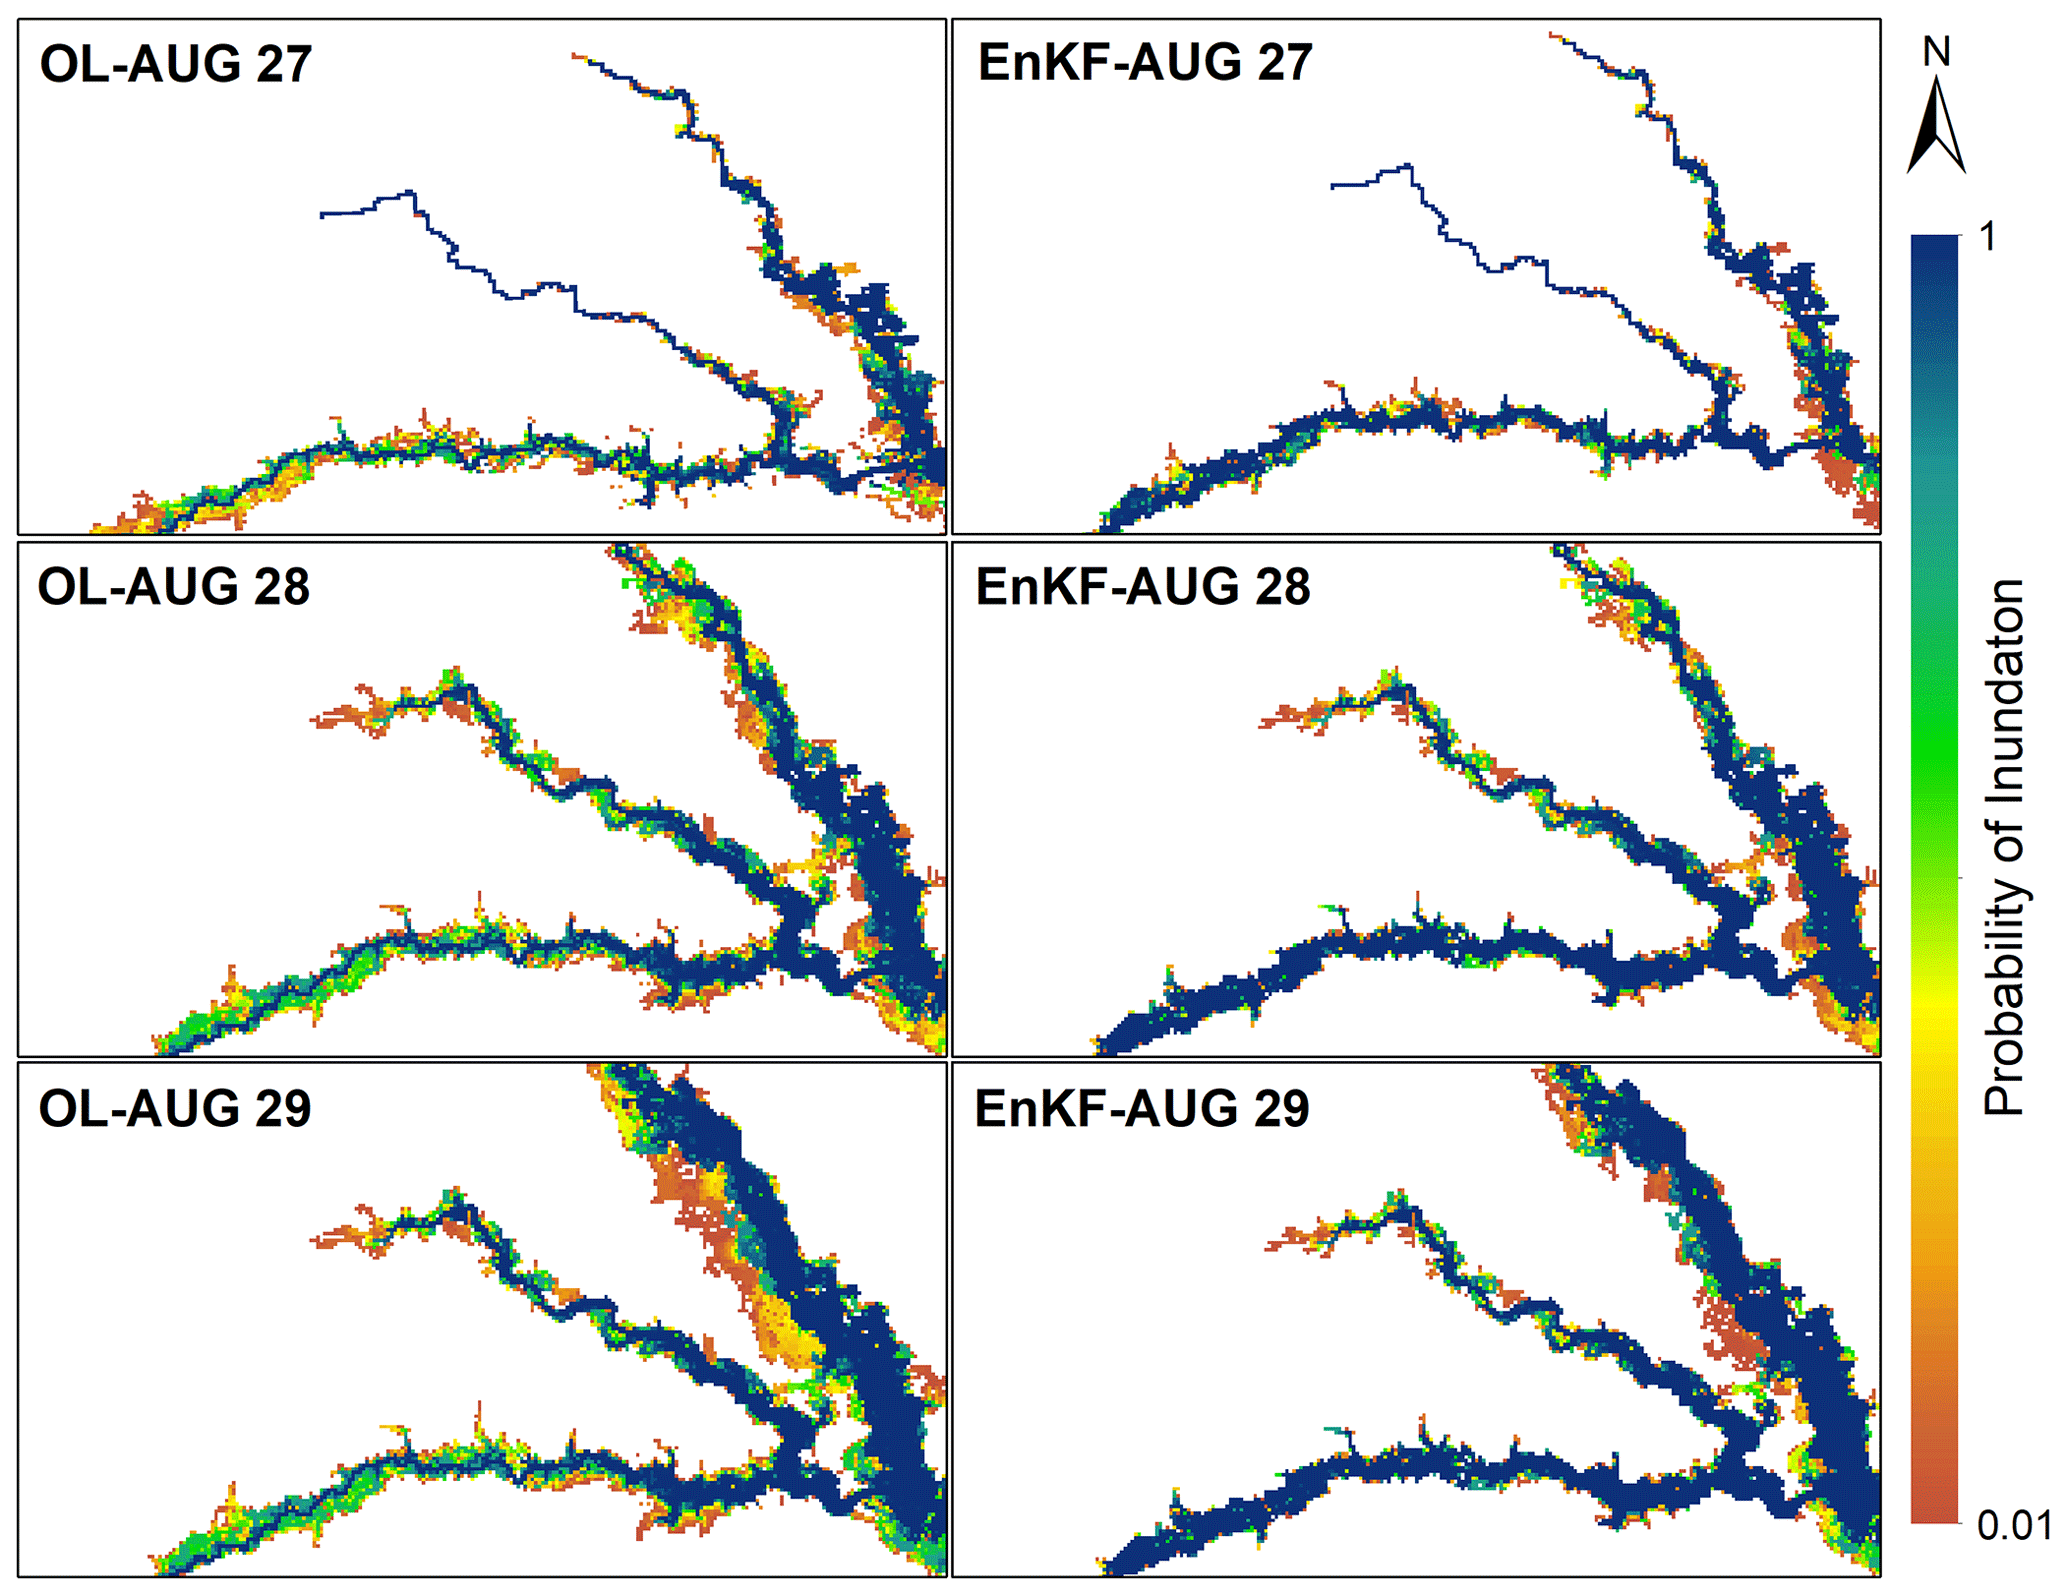
Figure 6Probabilistic flood inundation maps generated by OL and EnKF techniques to simulate the upper limb of the Hurricane Harvey flood hydrograph from 27 to 29 August.

Figure 7Probabilistic flood inundation maps generated by OL and EnKF techniques to simulate the lower limb of the Hurricane Harvey flood hydrograph from 30 August to 1 September.
Figure 7 shows the probabilistic inundation areas in the last 3 d corresponding to the lower limb of the flood hydrograph. The discrepancies between the OL and EnKF flood maps increase, showing that performing DA is more effective in improving the inundation mapping skill from peak to ending point of the flood hydrograph. A large number of inundated cells generated by the OL vanish after the peak of Hurricane Harvey, which results in a set of scattered discontinuous maps in 31 August and 1 September. On the other hand, the probabilistic maps generated by the EnKF maintain their continuous shapes so that the probability of inundation is reduced without changing the extent. The merit of the EnKF in improving the flood inundation areas at the lower limb of the flood hydrograph agrees with the results in Fig. 4c and d, where the EnKF widens the simulated water stage hydrographs and removes the lag difference that exists between the open loop and observations.
Finally, to quantify the performance of EnKF and OL for generating a spatial distribution of water depth over the domain, we illustrate the ROC graphs, the AUC values, and fit indices in Fig. 8. To calculate these measures, we ignore the temporal distributions and only report the maximum inundation maps that represent the union of flooded areas over the entire period of Hurricane Harvey. Comparing the EnKF and OL in Fig. 8a, the EnKF line (blue) is closer to the northwest of the rfp–rtp space, where its AUC is 5 % higher than the OL approach. In Fig. 8b, each point represents the F indices for the OL and the EnKF approaches corresponding to a given threshold. Using 100 thresholds that range from [0.01, 1], the probabilistic maps are converted to 100 deterministic maps, and the F indices are calculated. The position of scatters above the dashed line confirms that the EnKF outperforms the OL. In addition to these measures, the [UFI, OFI] indices calculated for OL and EnKF approaches are [30.3, 0.26] %, and [23.4, 0.4] %, respectively. The low values of OFI for both approaches (<1 %) show that the simulations mostly underestimate the flood inundation areas. In addition, comparing the indices of both approaches reveal that the EnKF reduces the overall underestimation by around 7 %.
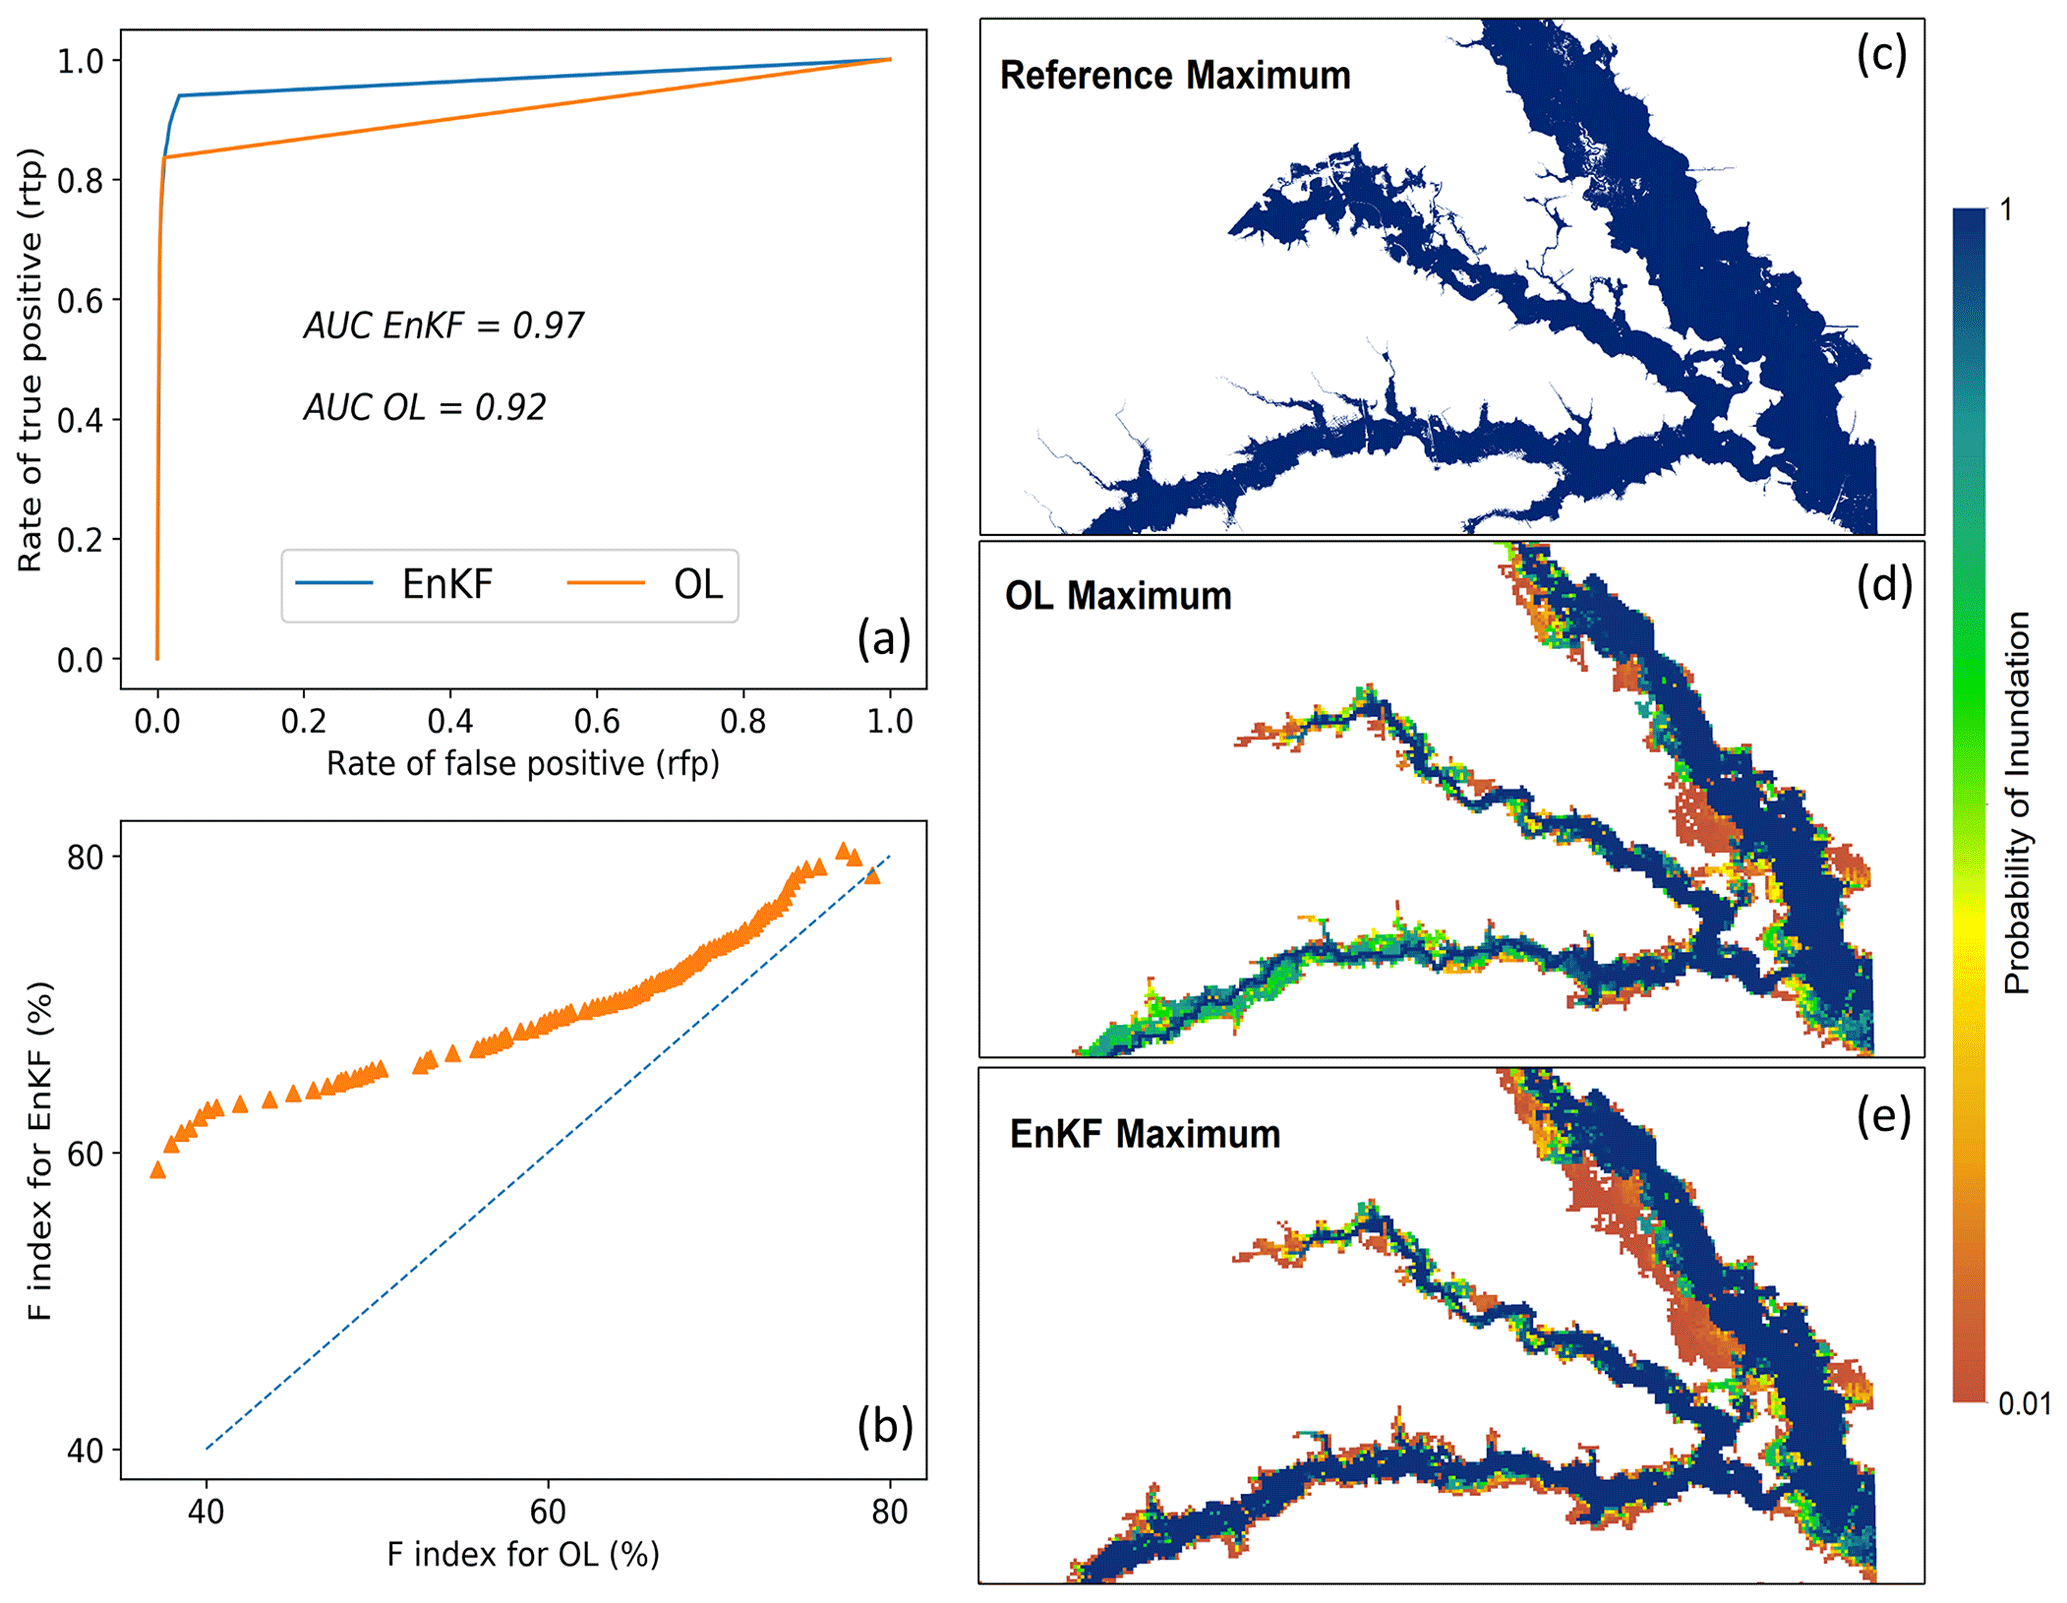
Figure 8The receiver operating curves (ROCs) indicating the performance of OL and EnKF techniques for probabilistic flood inundation mapping.
The main motivation in this study is to propose a DA hydrodynamic modeling framework for real-time probabilistic flood inundation mapping. Considering the coarse spatiotemporal resolution of satellite data for capturing the WSE, assimilating them into the hydrodynamic models may not be a practical solution for an upcoming flood event. On the other hand, the availability of daily discharge and WSE data at gauge stations is a great opportunity to establish a multivariate DA hydrodynamic modeling framework that updates the initial condition of modeling at daily scale and forecast the flood inundation areas at 1 d lead time. Here, we used the EnKF data assimilation method in conjunction with a hydrodynamic model to account for different sources of uncertainties involved in different layers of model simulations, including the boundary conditions, model parameters, and initial condition, and generate real-time probabilistic flood inundation maps. To further enhance the performance of the developed framework, the discharge and water stage at two different gauges are simultaneously assimilated into the LISFLOOD-FP model. The multivariate EnKF approach considers the correlation between discharge at two gauges and between discharge and WSE at one gauge using a modified covariance matrix and Kalman gain equation.
In the synthetic experiment, we examined the convergence of model parameters toward truth and found that the proposed DA hydrodynamic modeling framework can be successfully used to improve the accuracy and reliability of model predictions while accounting for uncertainties associated with model parameters. The channel roughness coefficient varied more rapidly than the bathymetry during the temporal evolutions of these parameters showing the better identifiability of this parameter. The validation results of the real experiment revealed that the assimilation with the EnKF approach improves the model predictions across temporal and spatial scales (i.e., discharge and water stage time series at gauges and flood maps showing the maximum water depth over the simulation period). These improvements are more pronounced during the falling limb of the flood hydrograph where the EnKF widens the simulated hydrograph and removes the existing lag compared to the observations. Similarly, the simulated flood inundation maps confirm that the OL provides discontinuous scattered maps during the flood recession period, while the EnKF provides a more accurate representation of the inundation areas. The validation results also demonstrate that the EnKF reduced the underestimation by 7 % and outperformed the OL approach by around 5 % for probabilistic flood inundation mapping.
For real-time flood inundation mapping, timely decision-making is of paramount importance. The time between the issuance of the warning and the occurrence of the flood is typically a short period of less than a day. Additionally, the flood waves propagate, inundate the affected regions, and cause damages rapidly. Thus, the main requirement for real-time probabilistic inundation mapping is to develop a fast and efficient modeling framework that is beneficial for decision-makers and emergency managers. Considering the high computational expense of hydrodynamic models and the need for generating a multitude of simulations in the probabilistic fashion, this study uses a coarse-resolution 120 m DEM to maintain the efficiency of the modeling and meet the requirements for practical benefits. In this study, the DA hydrodynamic modeling framework is executed on the University of Alabama High-Performance Computing (UAHPC) cluster. Considering the ensemble size of 100, we submit a job array with 100 cores, where each core is assigned to a specific member of the DA hydrodynamic modeling simulation. The efficient hydrodynamic model setup with coarse-resolution DEM helps simulate Hurricane Harvey and generate probabilistic results in 4–5 h (∼4 h for the hydrodynamic simulation and ∼20 min for the DA). Applying this computationally efficient framework is highly beneficial, especially for the emergency response agencies (e.g., FEMA), insurance companies, water centers, and other private companies that need to forecast the inundation areas and take timely decisions a few hours before the onset of floods.
The coarse DEM used in this study cannot perfectly represent the watershed topography and bathymetry and can be the main reason for underestimation of inundation areas (F index less than 80 %). Savage et al. (2016) investigated the impacts of DEM resolution on the accuracy and efficiency of probabilistic flood inundation maps generated with the LISFLOOD-FP model. They demonstrated that models with resolutions less than 50 offer little gain in performance yet are more than an order of magnitude computationally expensive, which can become infeasible when undertaking probabilistic analysis. They also found that the reliability of flood maps deteriorates at resolutions coarser than 100 m. Considering the medium scale of our study (>100 km river) compared to the reach scale (∼10 km river) of the work by Savage et al. (2016), here we slightly increased their suggested threshold for the DEM and demonstrated that the accuracy of results is still acceptable.
The simulation of an extreme flooding condition such as Hurricane Harvey with a simplified model setup (i.e., using a coarse DEM, assuming uniform roughness coefficient for channel and floodplain, and estimating bathymetry by lowering DEM with one parameter) is prone to lose accuracy. The results obtained from the simulation of the real experiment demonstrated that, despite using a simplified efficient modeling setup, we can still simulate the discharge, water stage, and inundation areas for an extreme flood event with an acceptable accuracy while accounting for uncertainties involved in model predictions. This shows that assimilating the gauge data into a simplified model setup improves the accuracy and provides an efficient probabilistic framework for real-time flood inundation mapping that considers potential sources of uncertainties in different layers of modeling.
The time dependency that exists between the upstream and downstream gauges along a channel can affect the performance of multivariate assimilation with those gauges. For future studies, using a more advanced DA technique that fully characterizes the model structural uncertainty (Abbaszadeh et al., 2019) and considering the time lag dependency between multiple gauges can improve the performance of modeling and provide more realistic assimilation of the hydrodynamic models. Another limitation of this study is the simple assumptions made for perturbing the initial condition (water depth), parameters (channel roughness and river bathymetry), and observations (WSE and discharge). More investigation on the physically meaningful distribution of these values can enhance the performance of the DA hydrodynamic modeling framework in future studies. A joint assimilation of the point source gauges and remotely sensed data can also improve the reliability and accuracy of the results. Finally, proposing a DA hydrodynamic modeling framework that considers the DEM and channel width uncertainty can provide a more comprehensive uncertainty quantification for probabilistic flood inundation mapping in future studies.
An advantage of the proposed DA hydrodynamic modeling framework is its generic format so that other studies can follow the flowchart in Fig. 2 and use the information in Sects. 3.2 and 3.3 to set up the hydrodynamic model and the EnKF algorithm, respectively. To properly apply this framework to other studies, first, the point source observations of WSE and discharge should be available at daily/subdaily scales. Second, the modeler should have access to high-performance computing facilities for parallel simulation of ensemble members. Third, the hydrodynamic model should be sequentially executed within the DA algorithm. The modeler should check the hydrodynamic model manual and make sure that the outputs and initial conditions can be updated in a sequential manner. Taking these three considerations into account, the proposed DA hydrodynamic modeling framework can be applied to any other study areas that are prone to frequent flooding and provide a robust and generic tool for real-time probabilistic flood inundation mapping.
All the data used in this study, including the gauge streamflow and water stage data and the DEMs, are publicly available from the USGS website and National Elevation Dataset (NED). The reference flood maps provided for Hurricane Harvey are available from the USGS report at https://doi.org/10.3133/sir20185070 (Watson et al., 2018).
KJ, PA, and HM conceptualized the study and designed the synthetic and real experiments. KJ developed, set up, evaluated, and implemented the DA hydrodynamic modeling framework for both experiments. PA and HM provided guidance on the assimilation experiments. KJ wrote the first draft of the paper. HM and PA provided comments and edited the paper.
The authors declare that they have no conflict of interest.
Publisher's note: Copernicus Publications remains neutral with regard to jurisdictional claims in published maps and institutional affiliations.
We would like to thank the anonymous reviewers for their constructive comments on the original version of the paper.
This research has partially been supported by the U.S. Army Corps of Engineers (grant no. W912HZ2020055).
This paper was edited by Dominic Mazvimavi and reviewed by two anonymous referees.
Abbaszadeh, P., Moradkhani, H., and Yan, H.: Enhancing hydrologic data assimilation by evolutionary Particle Filter and Markov Chain Monte Carlo, Adv. Water Resour., 111, 192–204, https://doi.org/10.1016/j.advwatres.2017.11.011, 2018.
Abbaszadeh, P., Moradkhani, H., and Daescu, D. N.: The Quest for Model Uncertainty Quantification: A Hybrid Ensemble and Variational Data Assimilation Framework, Water Resour. Res., 55, 2407–2431, https://doi.org/10.1029/2018WR023629, 2019.
Abbaszadeh, P., Gavahi, K., and Moradkhani, H.: Multivariate remotely sensed and in-situ data assimilation for enhancing community WRF-Hydro model forecasting, Adv. Water Resour., 145, 103721, https://doi.org/10.1016/j.advwatres.2020.103721, 2020.
Ahmadisharaf, E., Kalyanapu, A. J., and Bates, P. D.: A probabilistic framework for floodplain mapping using hydrological modeling and unsteady hydraulic modeling, Hydrolog. Sci. J., 63, 1759–1775, https://doi.org/10.1080/02626667.2018.1525615, 2018.
Alemohammad, S. H., McLaughlin, D. B., and Entekhabi, D.: Quantifying precipitation uncertainty for land data assimilation applications, Mon. Weather Rev., 143, 3276–3299, https://doi.org/10.1175/MWR-D-14-00337.1, 2015.
Alfieri, L., Salamon, P., Bianchi, A., Neal, J., Bates, P., and Feyen, L.: Advances in pan-European flood hazard mapping, Hydrol. Process., 28, 4067–4077, https://doi.org/10.1002/hyp.9947, 2014.
Anderson, J. L. and Anderson, S. L.: A Monte Carlo implementation of the nonlinear filtering problem to produce ensemble assimilations and forecasts, Mon. Weather Rev., 127, 2741–2758, https://doi.org/10.1175/1520-0493(1999)127<2741:AMCIOT>2.0.CO;2, 1999.
Aronica, G., Bates, P. D., and Horritt, M. S.: Assessing the uncertainty in distributed model predictions using observed binary pattern information within GLUE, Hydrol. Process., 16, 2001–2016, https://doi.org/10.1002/hyp.398, 2002.
Aronica, G. T., Franza, F., Bates, P. D., and Neal, J. C.: Probabilistic evaluation of flood hazard in urban areas using Monte Carlo simulation, Hydrol. Process., 26, 3962–3972, https://doi.org/10.1002/hyp.8370, 2012.
Azimi, S., Dariane, A. B., Modanesi, S., Bauer-Marschallinger, B., Bindlish, R., Wagner, W., and Massari, C.: Assimilation of Sentinel 1 and SMAP–based satellite soil moisture retrievals into SWAT hydrological model: The impact of satellite revisit time and product spatial resolution on flood simulations in small basins, J. Hydrol., 581, 124367, https://doi.org/10.1016/j.jhydrol.2019.124367, 2020.
Bales, J. D. and Wagner, C. R.: Sources of uncertainty in flood inundation maps, J. Flood Risk Manag., 2, 139–147, https://doi.org/10.1111/j.1753-318X.2009.01029.x, 2009.
Bates, P. D. and De Roo, A. P. J.: A simple raster-based model for flood inundation simulation, J. Hydrol., 236, 54–77, https://doi.org/10.1016/S0022-1694(00)00278-X, 2000.
Brêda, J. P. L. F., Paiva, R. C. D., Bravo, J. M., Passaia, O. A., and Moreira, D. M.: Assimilation of Satellite Altimetry Data for Effective River Bathymetry, Water Resour. Res., 55, 7441–7463, https://doi.org/10.1029/2018WR024010, 2019.
Clark, M. P. and Hay, L. E.: Use of Medium-Range Numerical Weather Prediction Model Output to Produce Forecasts of Streamflow, J. Hydrometeorol., 5, 15–32, https://doi.org/10.1175/1525-7541(2004)005<0015:UOMNWP>2.0.CO;2, 2004.
Courtier, P., Derber, J., Errico, R. O. N., Louis, J.-F., and VukiĆEviĆ, T.: Important literature on the use of adjoint, variational methods and the Kalman filter in meteorology, Tellus A, 45, 342–357, https://doi.org/10.3402/tellusa.v45i5.14898, 1993.
Cuo, L., Pagano, T. C., and Wang, Q. J.: A Review of Quantitative Precipitation Forecasts and Their Use in Short- to Medium-Range Streamflow Forecasting, J. Hydrometeorol., 12, 713–728, https://doi.org/10.1175/2011JHM1347.1, 2011.
DeChant, C. M. and Moradkhani, H.: Examining the effectiveness and robustness of sequential data assimilation methods for quantification of uncertainty in hydrologic forecasting, Water Resour. Res., 48, W04518, https://doi.org/10.1029/2011WR011011, 2012.
DeChant, C. M. and Moradkhani, H.: Toward a reliable prediction of seasonal forecast uncertainty: Addressing model and initial condition uncertainty with ensemble data assimilation and sequential Bayesian combination, J. Hydrol., 519, 2967–2977, https://doi.org/10.1016/j.jhydrol.2014.05.045, 2014.
Di Baldassarre, G. and Montanari, A.: Uncertainty in river discharge observations: a quantitative analysis, Hydrol. Earth Syst. Sci., 13, 913–921, https://doi.org/10.5194/hess-13-913-2009, 2009.
Di Baldassarre, G., Schumann, G., and Bates, P. D.: A technique for the calibration of hydraulic models using uncertain satellite observations of flood extent, J. Hydrol., 367, 276–282, https://doi.org/10.1016/j.jhydrol.2009.01.020, 2009.
Domeneghetti, A., Vorogushyn, S., Castellarin, A., Merz, B., and Brath, A.: Probabilistic flood hazard mapping: effects of uncertain boundary conditions, Hydrol. Earth Syst. Sci., 17, 3127–3140, https://doi.org/10.5194/hess-17-3127-2013, 2013.
Durand, M., Andreadis, K. M., Alsdorf, D. E., Lettenmaier, D. P., Moller, D., and Wilson, M.: Estimation of bathymetric depth and slope from data assimilation of swath altimetry into a hydrodynamic model, Geophys. Res. Lett., 35, L20401, https://doi.org/10.1029/2008GL034150, 2008.
Fawcett, T.: An introduction to ROC analysis, Pattern Recogn. Lett., 27, 861–874, https://doi.org/10.1016/j.patrec.2005.10.010, 2006.
Gavahi, K., Abbaszadeh, P., Moradkhani, H., Zhan, X., and Hain, C.: Multivariate Assimilation of Remotely Sensed Soil Moisture and Evapotranspiration for Drought Monitoring, J. Hydrometeorol., 21, 2293–2308, https://doi.org/10.1175/JHM-D-20-0057.1, 2020.
Giustarini, L., Matgen, P., Hostache, R., Montanari, M., Plaza, D., Pauwels, V. R. N., De Lannoy, G. J. M., De Keyser, R., Pfister, L., Hoffmann, L., and Savenije, H. H. G.: Assimilating SAR-derived water level data into a hydraulic model: a case study, Hydrol. Earth Syst. Sci., 15, 2349–2365, https://doi.org/10.5194/hess-15-2349-2011, 2011.
Habets, F., LeMoigne, P., and Noilhan, J.: On the utility of operational precipitation forecasts to served as input for streamflow forecasting, J. Hydrol., 293, 270–288, https://doi.org/10.1016/j.jhydrol.2004.02.004, 2004.
Hall, J. W., Tarantola, S., Bates, P. D., and Horritt, M. S.: Distributed Sensitivity Analysis of Flood Inundation Model Calibration, J. Hydraul. Eng., 131, 117–126, https://doi.org/10.1061/(ASCE)0733-9429(2005)131:2(117), 2005.
Horritt, M. S.: A methodology for the validation of uncertain flood inundation models, J. Hydrol., 326, 153–165, https://doi.org/10.1016/j.jhydrol.2005.10.027, 2006.
Horritt, M. S. and Bates, P. D.: Evaluation of 1D and 2D numerical models for predicting river flood inundation, J. Hydrol., 268, 87–99, https://doi.org/10.1016/S0022-1694(02)00121-X, 2002.
Hostache, R., Lai, X., Monnier, J., and Puech, C.: Assimilation of spatially distributed water levels into a shallow-water flood model. Part II: Use of a remote sensing image of Mosel River, J. Hydrol., 390, 257–268, https://doi.org/10.1016/j.jhydrol.2010.07.003, 2010.
Hostache, R., Chini, M., Giustarini, L., Neal, J., Kavetski, D., Wood, M., Corato, G., Pelich, R.-M., and Matgen, P.: Near-Real-Time Assimilation of SAR-Derived Flood Maps for Improving Flood Forecasts, Water Resour. Res., 54, 5516–5535, https://doi.org/10.1029/2017WR022205, 2018.
Jafarzadegan, K. and Merwade, V.: A DEM-based approach for large-scale floodplain mapping in ungauged watersheds, J. Hydrol., 550, 650–662, https://doi.org/10.1016/j.jhydrol.2017.04.053, 2017.
Jafarzadegan, K., Merwade, V., and Saksena, S.: A geomorphic approach to 100 year floodplain mapping for the Conterminous United States, J. Hydrol., 561, 43–58, https://doi.org/10.1016/j.jhydrol.2018.03.061, 2018.
Jafarzadegan, K., Alipour, A., Gavahi, K., Moftakhari, H., and Moradkhani, H.: Toward improved river boundary conditioning for simulation of extreme floods, Adv. Water Resour., in review, 2021.
Kumar, S. V., Dong, J., Peters-Lidard, C. D., Mocko, D., and Gómez, B.: Role of forcing uncertainty and background model error characterization in snow data assimilation, Hydrol. Earth Syst. Sci., 21, 2637–2647, https://doi.org/10.5194/hess-21-2637-2017, 2017.
Leach, J. M., Kornelsen, K. C., and Coulibaly, P.: Assimilation of near-real time data products into models of an urban basin, J. Hydrol., 563, 51–64, https://doi.org/10.1016/j.jhydrol.2018.05.064, 2018.
Lee, H., Seo, D.-J., and Koren, V.: Assimilation of streamflow and in situ soil moisture data into operational distributed hydrologic models: Effects of uncertainties in the data and initial model soil moisture states, Adv. Water Resour., 34, 1597–1615, https://doi.org/10.1016/j.advwatres.2011.08.012, 2011.
Lievens, H., Reichle, R. H., Liu, Q., De Lannoy, G. J., Dunbar, R. S., Kim, S. B., Das, N. N., Cosh, M., Walker, J. P., and Wagner, W.: Joint Sentinel-1 and SMAP data assimilation to improve soil moisture estimates, Geophys. Res. Lett., 44, 6145–6153, https://doi.org/10.1002/2017GL073904, 2017.
Maidment, D. R.: Conceptual Framework for the National Flood Interoperability Experiment, J. Am. Water Resour. As., 53, 245–257, https://doi.org/10.1111/1752-1688.12474, 2017.
Matgen, P., Montanari, M., Hostache, R., Pfister, L., Hoffmann, L., Plaza, D., Pauwels, V. R. N., De Lannoy, G. J. M., De Keyser, R., and Savenije, H. H. G.: Towards the sequential assimilation of SAR-derived water stages into hydraulic models using the Particle Filter: proof of concept, Hydrol. Earth Syst. Sci., 14, 1773–1785, https://doi.org/10.5194/hess-14-1773-2010, 2010.
Merwade, V., Cook, A., and Coonrod, J.: GIS techniques for creating river terrain models for hydrodynamic modeling and flood inundation mapping, Environ. Modell. Softw., 23, 1300–1311, https://doi.org/10.1016/j.envsoft.2008.03.005, 2008.
Moradkhani, H., Sorooshian, S., Gupta, H. V., and Houser, P. R.: Dual state–parameter estimation of hydrological models using ensemble Kalman filter, Adv. Water Resour., 28, 135–147, https://doi.org/10.1016/j.advwatres.2004.09.002, 2005a.
Moradkhani, H., Hsu, K.-L., Gupta, H., and Sorooshian, S.: Uncertainty assessment of hydrologic model states and parameters: Sequential data assimilation using the particle filter, Water Resour. Res., 41, W05012, https://doi.org/10.1029/2004WR003604, 2005b.
Moradkhani, H., Nearing, G. S., Abbaszadeh, P., and Pathiraja, S.: Fundamentals of data assimilation and theoretical advances, Handb. Hydrometeorol. Ensemble Forecast, Springer Berlin Heidelberg, Berlin, Heidelberg, 675–699, https://doi.org/10.1007/978-3-642-39925-1_30, 2019.
Munier, S., Polebistki, A., Brown, C., Belaud, G., and Lettenmaier, D. P.: SWOT data assimilation for operational reservoir management on the upper Niger River Basin, Water Resour. Res., 51, 554–575, https://doi.org/10.1002/2014WR016157, 2015.
Neal, J., Schumann, G., Bates, P., Buytaert, W., Matgen, P., and Pappenberger, F.: A data assimilation approach to discharge estimation from space, Hydrol. Process., 23, 3641–3649, https://doi.org/10.1002/hyp.7518, 2009.
Neal, J., Schumann, G., and Bates, P.: A subgrid channel model for simulating river hydraulics and floodplain inundation over large and data sparse areas, Water Resour. Res., 48, W11506, https://doi.org/10.1029/2012WR012514, 2012.
Neal, J., Keef, C., Bates, P., Beven, K., and Leedal, D.: Probabilistic flood risk mapping including spatial dependence, Hydrol. Process., 27, 1349–1363, https://doi.org/10.1002/hyp.9572, 2013.
Papaioannou, G., Vasiliades, L., Loukas, A., and Aronica, G. T.: Probabilistic flood inundation mapping at ungauged streams due to roughness coefficient uncertainty in hydraulic modelling, Adv. Geosci., 44, 23–34, https://doi.org/10.5194/adgeo-44-23-2017, 2017.
Pappenberger, F., Beven, K. J., Ratto, M., and Matgen, P.: Multi-method global sensitivity analysis of flood inundation models, Adv. Water Resour., 31, 1–14, https://doi.org/10.1016/j.advwatres.2007.04.009, 2008.
Pathiraja, S., Moradkhani, H., Marshall, L., Sharma, A., and Geenens, G.: Data-driven model uncertainty estimation in hydrologic data assimilation, Water Resour. Res., 54, 1252–1280, https://doi.org/10.1002/2018WR022627, 2018.
Pauwels, V. R., Hoeben, R., Verhoest, N. E., and De Troch, F. P.: The importance of the spatial patterns of remotely sensed soil moisture in the improvement of discharge predictions for small-scale basins through data assimilation, J. Hydrol., 251, 88–102, https://doi.org/10.1016/S0022-1694(01)00440-1, 2001.
Pedinotti, V., Boone, A., Ricci, S., Biancamaria, S., and Mognard, N.: Assimilation of satellite data to optimize large-scale hydrological model parameters: a case study for the SWOT mission, Hydrol. Earth Syst. Sci., 18, 4485–4507, https://doi.org/10.5194/hess-18-4485-2014, 2014.
Pedrozo-Acuña, A., Rodríguez-Rincón, J. P., Arganis-Juárez, M., Domínguez-Mora, R., and Villareal, F. J. G.: Estimation of probabilistic flood inundation maps for an extreme event: Pánuco River, México, J. Flood Risk Manag., 8, 177–192, https://doi.org/10.1111/jfr3.12067, 2015.
Pelletier, P. M.: Uncertainties in the single determination of river discharge: a literature review, Can. J. Civil Eng., 15, 834–850, https://doi.org/10.1139/l88-109, 1988.
Pinter, N., Santos, N., and Hui, R.: Preliminary analysis of Hurricane Harvey flooding in Harris County, Texas, Retrieved from UC Davis Center for Watershed Sciences, California WaterBlog, https://californiawaterblog.com/2017/09/01/preliminary-analysis-of-hurricane-harvey-flooding-in-harris-county-texas/ (last access: 1 September 2021), 2017.
Purvis, M. J., Bates, P. D., and Hayes, C. M.: A probabilistic methodology to estimate future coastal flood risk due to sea level rise, Coast. Eng., 55, 1062–1073, https://doi.org/10.1016/j.coastaleng.2008.04.008, 2008.
Reichle, R. H., McLaughlin, D. B., and Entekhabi, D.: Hydrologic data assimilation with the ensemble Kalman filter, Mon. Weather Rev., 130, 103–114, https://doi.org/10.1175/1520-0493(2002)130<0103:HDAWTE>2.0.CO;2, 2002.
Renard, B., Kavetski, D., Kuczera, G., Thyer, M., and Franks, S. W.: Understanding predictive uncertainty in hydrologic modeling: The challenge of identifying input and structural errors, Water Resour. Res., 46, W05521, https://doi.org/10.1029/2009WR008328, 2010.
Romanowicz, R. and Beven, K.: Estimation of flood inundation probabilities as conditioned on event inundation maps, Water Resour. Res., 39, 1073, https://doi.org/10.1029/2001WR001056, 2003.
Sangwan, N. and Merwade, V.: A Faster and Economical Approach to Floodplain Mapping Using Soil Information, J. Am. Water Resour. As., 51, 1286–1304, https://doi.org/10.1111/1752-1688.12306, 2015.
Savage, J. T. S., Bates, P., Freer, J., Neal, J., and Aronica, G.: When does spatial resolution become spurious in probabilistic flood inundation predictions?, Hydrol. Process., 30, 2014–2032, https://doi.org/10.1002/hyp.10749, 2016.
Sheffield, J., Pan, M., Wood, E. F., Mitchell, K. E., Houser, P. R., Schaake, J. C., Robock, A., Lohmann, D., Cosgrove, B., Duan, Q., Luo, L., Higgins, R. W., Pinker, R. T., Tarpley, J. D., and Ramsay, B. H.: Snow process modeling in the North American Land Data Assimilation System (NLDAS): 1. Evaluation of model-simulated snow cover extent, J. Geophys. Res.-Atmos., 108, 8849, https://doi.org/10.1029/2002JD003274, 2003.
Slater, A. G. and Clark, M. P.: Snow data assimilation via an ensemble Kalman filter, J. Hydrometeorol., 7, 478–493, https://doi.org/10.1175/JHM505.1, 2006.
Tayefi, V., Lane, S. N., Hardy, R. J., and Yu, D.: A comparison of one- and two-dimensional approaches to modelling flood inundation over complex upland floodplains, Hydrol. Process., 21, 3190–3202, https://doi.org/10.1002/hyp.6523, 2007.
Teng, J., Jakeman, A. J., Vaze, J., Croke, B. F. W., Dutta, D., and Kim, S.: Flood inundation modelling: A review of methods, recent advances and uncertainty analysis, Environ. Modell. Softw., 90, 201–216, https://doi.org/10.1016/j.envsoft.2017.01.006, 2017.
Watson, K. M., Harwell, G. R., Wallace, D. S., Welborn, T. L., Stengel, V. G., and McDowell, J. S.: Characterization of peak streamflows and flood inundation of selected areas in southeastern Texas and southwestern Louisiana from the August and September 2017 flood resulting from Hurricane Harvey: U.S. Geological Survey Scientific Investigations Report 2018–5070, 44 pp., https://doi.org/10.3133/sir20185070, 2018.
Xu, X., Zhang, X., Fang, H., Lai, R., Zhang, Y., Huang, L., and Liu, X.: A real-time probabilistic channel flood-forecasting model based on the Bayesian particle filter approach, Environ. Modell. Softw., 88, 151–167, https://doi.org/10.1016/j.envsoft.2016.11.010, 2017.
Xu, L., Abbaszadeh, P., Moradkhani, H., Chen, N., and Zhang, X.: Continental drought monitoring using satellite soil moisture, data assimilation and an integrated drought index, Remote Sens. Environ., 250, 112028, https://doi.org/10.1016/j.rse.2020.112028, 2020.
Yoon, Y., Durand, M., Merry, C. J., Clark, E. A., Andreadis, K. M., and Alsdorf, D. E.: Estimating river bathymetry from data assimilation of synthetic SWOT measurements, J. Hydrol., 464, 363–375, https://doi.org/10.1016/j.jhydrol.2012.07.028, 2012.
Zhang, Q., Shi, L., Holzman, M., Ye, M., Wang, Y., Carmona, F., and Zha, Y.: A dynamic data-driven method for dealing with model structural error in soil moisture data assimilation, Adv. Water Resour., 132, 103407, https://doi.org/10.1016/j.advwatres.2019.103407, 2019.