the Creative Commons Attribution 4.0 License.
the Creative Commons Attribution 4.0 License.
 | 07 Jul 2021
Influence of ENSO and tropical Atlantic climate variability on flood characteristics in the Amazon basin
Andrea Ficchí
Hannah L. Cloke
Juan Bazo
Erin Coughlan de Perez
Elisabeth M. Stephens
Flooding in the Amazon basin is frequently attributed to modes of large-scale climate variability, but little attention is paid to how these modes influence the timing and duration of floods despite their importance to early warning systems and the significant impacts that these flood characteristics can have on communities. In this study, river discharge data from the Global Flood Awareness System (GloFAS 2.1) and observed data at 58 gauging stations are used to examine whether positive or negative phases of several Pacific and Atlantic indices significantly alter the characteristics of river flows throughout the Amazon basin (1979–2015). Results show significant changes in both flood magnitude and duration, particularly in the north-eastern Amazon for negative El Niño–Southern Oscillation (ENSO) phases when the sea surface temperature (SST) anomaly is positioned in the central tropical Pacific. This response is not identified for the eastern Pacific index, highlighting how the response can differ between ENSO types. Although flood magnitude and duration were found to be highly correlated, the impacts of large-scale climate variability on these characteristics are non-linear; some increases in annual flood maxima coincide with decreases in flood duration. The impact of flood timing, however, does not follow any notable pattern for all indices analysed. Finally, observed and simulated changes are found to be much more highly correlated for negative ENSO phases compared to the positive phase, meaning that GloFAS struggles to accurately simulate the differences in flood characteristics between El Niño and neutral years. These results have important implications for both the social and physical sectors working towards the improvement of early warning action systems for floods.
- Article
(11660 KB) - Full-text XML
-
Supplement
(261 KB) - BibTeX
- EndNote


Flooding in the Amazon basin is frequently attributed to positive and negative phases of large-scale climate variability, such as the El Niño–Southern Oscillation (ENSO), and to anomalous sea surface temperatures (SSTs) in the tropical Atlantic Ocean (Richey et al., 1989; Ronchail et al., 2005a; Marengo et al., 2012, 2013; Satyamurty et al., 2013; Espinoza et al., 2013, 2014, 2019; Marengo and Espinoza, 2016; Barichivich et al., 2018). Such phases are considered to promote atmospheric anomalies (e.g. zonal winds, 850 hPa geopotential height and moisture transport flux), which enhance or weaken moisture and humidity fluxes over the Amazon basin affecting rainfall and river discharge regimes and, therefore, influencing flood likelihood (Espinoza et al., 2013, 2014). For instance, flooding is consistently linked to La Niña conditions and to a configuration of cold (warm) SST anomalies in the tropical north (south) Atlantic Ocean (Marengo and Espinoza, 2016). Conversely, droughts are commonly attributed to El Niño events and to warm SST anomalies in the tropical North Atlantic (TNA) and associated with a sustained northward position of the inter-tropical convergence zone (ITCZ; Zeng et al., 2008; Tomasella et al., 2011).
The impact of different climatic phases tends to cause a similar response for both rainfall and river discharge (Towner et al., 2020), though the relationship between flooding and rainfall can be non-linear (Stephens et al., 2015; Coughlan de Perez et al., 2017) with significant differences identified between the mean state of the two variables in response to the same climate phase (Dettinger and Diaz, 2000). An example of this for the Amazon is detailed by Marengo et al. (2012) in a comparison study of the 1989, 1999 and 2009 floods, whereby the worst flood event did not correspond with the largest rainfall anomaly (mm−1 d−1). It is therefore important to consider the effect of climate phases for river discharge specifically.
To date, the scientific community has mainly focused on how anomalous SST conditions affect the magnitude of rainfall or river discharge (Ronchail et al., 2002, 2005b; Espinoza et al., 2009; Yoon and Zeng, 2010; Yoon, 2016), despite the importance of other characteristics such as flood timing and duration. In early 2018, the Red Cross Climate Centre (RCCC) led an inter-agency assessment mission to establish how communities living within the Peruvian Amazon floodplain are affected by exceptional flood events. Impacts of flooding (e.g. lack of food, fresh water and medical supplies) have been associated with the duration of inundation as opposed to simply the magnitude of flood extent by community members. For example, a study by Langill and Abizaid (2019) provided direct feedback from community members within the Peruvian Amazon when classifying types of flood events and presented both positive and negative feedback for high, long, early and late flood events. These interviews provided real-life examples of the significance of each flood type. For instance, long floods were found to have a significant toll on agricultural and food security (e.g. manioc and plantains can only survive short flood periods), while also providing more food and income due to a longer fishing season. These works follow from previous studies demonstrating that the interannual variability of the Amazon wet season (e.g. precipitation onset date and timing of peak river flows) has important consequences for fisheries, hydroelectricity production and transport, with irregular inundation periods known to influence the length and productivity of the growing season (Marengo et al., 2001; Schöngart and Junk, 2007; Coomes et al., 2016; Ronchail et al., 2017; Langill and Abizaid, 2019). Finally, the timing of peak river flows in coinciding tributaries is known to control the magnitude of the travelling flood wave (Tomasella et al., 2010; Ronchail et al., 2006) and is commonly associated with exceptional flood events (e.g. 2012 in Peru; Tomasella et al., 2011; Marengo et al., 2012; Espinoza et al., 2013). Therefore, understanding how variations in large-scale climate features impact flood timing and duration is also of significant importance in the Amazon basin and for early warning system (EWS) protocols, such as forecast-based financing (FbF; Coughlan de Perez et al., 2017). An EWS is a procedure that utilises climate forecasts and observations to predict and provide early warning information of natural hazards before they materialise, allowing the implementation of humanitarian actions (e.g. earlier evacuation of people likely to be flooded) before rather than after an event has occurred (Coughlan de Perez et al., 2017).
Previous studies examining the seasonality of the Amazon wet season have found a link between the onset and end dates of rainfall and SST anomalies (e.g. Fu et al., 2001; Liebmann and Marengo, 2001; Marengo et al., 2001; Yin et al., 2014), though the period of analysis is often restricted to before the millennium, focuses only on rainfall and is predominately for the Brazilian Amazon. Using rainfall pentads, Marengo et al. (2001) found that when SSTs in the Pacific (south tropical Atlantic) are anomalously warm (cold) there is a delayed onset and early withdrawal of the Amazon wet season . This configuration of SSTs acts to delay the seasonal migration of convection from the Northern to the Southern hemisphere (i.e. the ITCZ migration). The relationship was found to be the strongest in the northern Amazon and towards the mouth of the Amazon River, with little association in the southern Amazon. This is supported by Fu et al. (1999) who found that land surface heating has a stronger influence on wet season length in southern catchments relative to SSTs. Finally, Liebmann and Marengo (2001) find that the association with SSTs is stronger during the transitional period between the wet and dry seasons and that for areas that exhibit strong correlations, SSTs influence the timing of rainfall in a similar fashion to the correlation with seasonal rainfall totals. Thus, the prediction of seasonal rainfall totals could potentially be used where SSTs are known to influence the onset of the wet season in global climate models (GCMs).
Objectives and research questions
The objective of this work is twofold. The first and main objective is to establish whether positive or negative phases of several climate indices significantly alters the magnitude, timing and duration of floods throughout the Amazon basin. To achieve this objective, we consider the following research questions.
Do positive or negative phases of different climate indices significantly alter
- a.
the magnitude of annual maximum river flows
- b.
the timing of annual maximum river flows and
- c.
the flood duration (i.e. days spent above the 95th percentile of the climatology)
relative to years in which the SSTs are considered neutral? The second objective is to examine and discuss in greater detail the results for particular areas of the basin to better understand the response of flood characteristics to climate variability and how the results from the two datasets compare (i.e. observations and GloFAS 2.1).
We first define the climatological baseline for the Amazon basin flow regime, calculating the average magnitude and timing of peak river flows in addition to the mean flood duration (i.e. the number of days that river flows exceed the 95th percentile of the climatology) over the entire 36-year period (Fig. 1). For the calculation of the average flood timing, circular statistics are used. We use both a hydrological reanalysis and observed gauged dataset to enable the comparison and evaluation of the ERA5 reanalysis dataset, which allows for complete coverage over the full period of analysis without gaps and focuses on the natural variability of river flow whereby human interventions (e.g. rapid land changes such as deforestation from forest to cropland and damming) that impact the observations are not modelled.
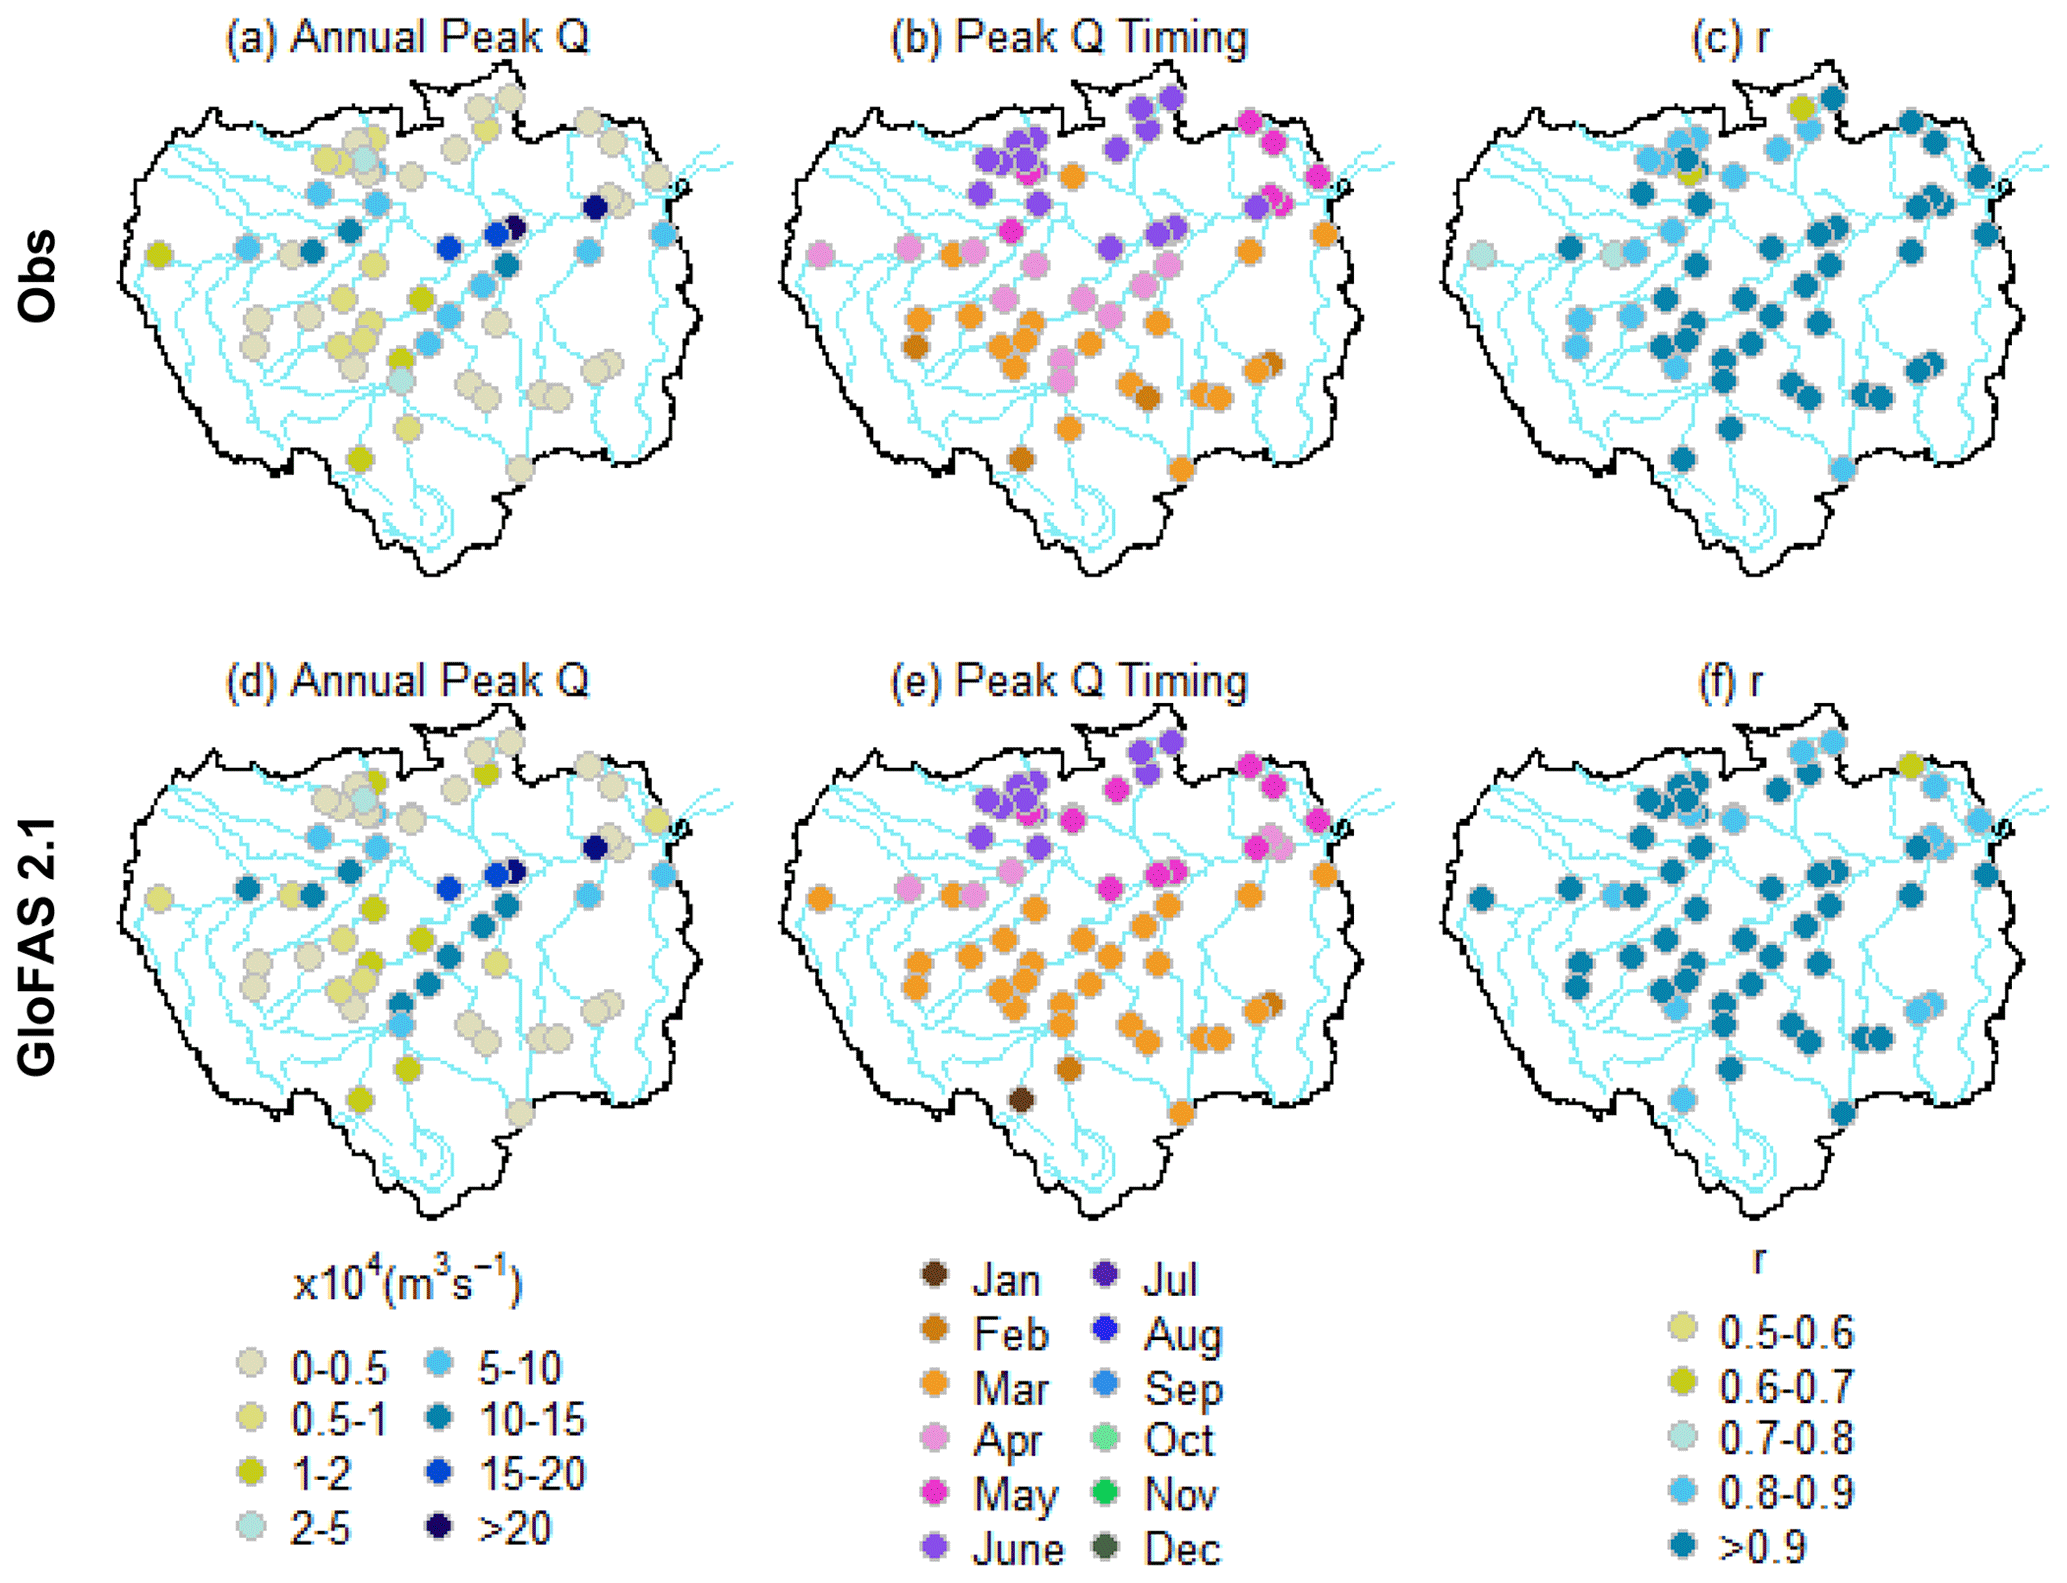
Figure 136-year climatology of observed (a–c) and GloFAS 2.1 streamflow reanalysis (d–f) datasets (1979–2015). (a, d) Mean annual maximum river flows. (b, e) Average timing of peak flow occurrences. (c, f) Interannual variability of peak flow timing (i.e. the consistency of when rivers reach their peaks. Values closer to 1 mean that rivers reach their peak at a similar time each hydrological year, whereas values closer to zero reflect a highly variable regime where flood peaks are spread through the year).
2.1 Observed streamflow
Fifty-eight station time series of observed river discharge throughout the Amazon basin are obtained from the national institutions responsible for the hydrological monitoring in countries situated within the Amazon basin. These data are sourced through the ORE-HYBAM observation service (see https://hybam.obs-mip.fr/; last access: 27 July 2020) in association with the Institute of Research and Development (IRD) or directly from the national services. Daily water levels are converted to river discharge using stage and rating curve measurements, determined using an acoustic Doppler current profiler (ADCP). The locations and details of each gauging station can be found in Fig. S1 and Table S1 in the Supplement, respectively. Stations are selected based on the following criteria:
-
at least 18 years' worth of data over the 36-year analysis period (1979–2015)
-
no more than 5 % of missing data in each hydrological year (i.e. October–September)
-
have at least 5 hydrological years per climate phase of ENSO and tropical Atlantic variability.
2.2 GloFAS 2.1 river flow reanalysis
A global daily reanalysis of river discharge is provided at a resolution of 0.1∘ (∼32 km) for the 36-year analysis period (1979–2015). The data are derived from the operational Global Flood Awareness System, version 2.1 (GloFAS; Alfieri et al., 2013; Harrigan et al., 2020), where runoff output from the H-TESSEL module of the European Centre for Medium-Range Weather Forecasts (ECMWF), integrated forecast system (IFS; cycle 41r2), is coupled to the calibrated LISFLOOD routing model (van Der Knijff et al. (2010); see Hirpa et al. (2018) for details on calibration) to produce deterministic estimates of historic river flows. All of the 58 stations were used within the calibration of Lisflood. Calibration was carried out on parameters controlling the time constants in the upper and lower zones, percolation rate, groundwater loss, channel Manning's coefficient, the lake outflow width, the balance between normal and flood storage of a reservoir, and the multiplier used to adjust the magnitude of the normal outflow from a reservoir (Towner et al., 2019). Meteorological input is provided by ERA5, the fifth generation of climate reanalysis at the ECMWF, succeeding ERA-Interim. ERA5 runs at a high spatial resolution (∼31 km) and covers the period from 1950 to present, providing a long and consistent record of discharge and meteorological variables at each grid cell (Hersbach et al., 2018; Zsoter et al., 2019). Towner et al. (2019) showed the potential benefits of using ERA5 to force global hydrological models (GHMs) to produce river discharge time series that accurately represent annual maximum river flows in the Amazon basin. Reanalysis data are extracted at the locations of the observed gauging stations for direct comparisons. For access to GloFAS datasets, see http://www.globalfloods.eu/ (last access: 17 July 2019).
2.3 Land and atmospheric data
Oceanic and atmospheric features are analysed using the ERA5 climate reanalysis product of the ECMWF, produced on latitude–longitude grids at resolution and is available from 1950 to present for the entire globe (Hersbach et al., 2020). To describe the average conditions during particular climate phases (e.g. negative ENSO), averaged monthly data on single levels are obtained for SST anomalies and total rainfall from 1979 to 2015 for the October–November–December (OND) season. These data were obtained from the Copernicus climate data store (see https://cds.climate.copernicus.eu/; last access: 12 October 2020).
2.4 Hydroclimatic drivers and modes of variability
Numerous hydroclimatic drivers have been identified to cause anomalous rainfall and river discharge conditions in the Amazon basin (Towner et al., 2020), with ENSO and tropical Atlantic SST variability considered to be the most influential (Marengo, 1992; Ronchail et al., 2005b; Yoon and Zeng, 2010; Espinoza et al., 2019; Jimenez et al., 2019). Several indices of ENSO are available, differing in spatial location, variable type and on the number of variables used. Wolter and Timlin (1998, 2011) express favour towards the use of indices that incorporate a range of atmospheric and oceanic variables over the tropical Pacific, such as the multi-variate ENSO index (MEI), which is described to provide a more complete and flexible description of ENSO. More recently, Takahashi et al. (2011) provided two new tropical Pacific SST indices, the central and eastern Pacific indices (hereafter CP and EP), estimated as the first two empirical orthogonal functions (EOFs) of monthly SST anomalies of the tropical Pacific. The CP and EP indices have the advantage of having a poor linear relationship amongst themselves and have been found to have different impacts on South American rainfall (Sulca et al., 2018). In this study, we investigate the influence of four different ENSO indices in addition to two tropical Atlantic SST modes (i.e. TNA and TSA; Enfield et al., 1999) on the magnitude, timing and duration of high river flows in the Amazon basin. The ENSO indices used include: the conventional ENSO index in the Niño 3.4 region (hereafter EN3.4), the CP and EP indices (Takahashi et al., 2011) and the MEI v.2 (Wolter and Timlin, 2011), which is based on the original MEI index (Wolter and Timlin, 1993). Correlations between most ENSO indices are strong, particularly for boreal winter (Wolter and Timlin, 2011), with the exception of the CP and EP indices (Sulca et al., 2018), but multiple options have been included to provide a more comprehensive evaluation. Other indices such as the Madden–Julian Oscillation (MJO), Pacific decadal oscillation (PDO), and Atlantic multidecadal oscillation (AMO) have been linked to wetter or drier conditions across South America (Shimizu et al., 2017; Towner et al., 2020), but have not been included in this study owing to the frequencies at which these indices operate (i.e. intraseasonal, decadal or multi-decadal for the MJO, PDO and AMO, respectively). The Pacific meridional mode (PMM), which has been linked to increased rainfall in June–July–August, has not been included due to its impact being significant only during the dry season (Zhang et al., 2017).
We use a quantile-based (tercile) approach as adopted by Ficchí and Stephens (2019) for Africa to categorise negative, neutral and positive modes of each climate index. Tercile categories are divided into positive (upper 33 %), neutral (middle 33 %) and negative (bottom 33 %) values and thus each tercile is represented by 12 years' worth of data. Conventional ENSO events (i.e. El Niño or La Niña) are classified using the Oceanic Niño Index (ONI) from the NOAA Climate Prediction Center (CPC). The dataset consists of monthly mean SST anomalies obtained from the NOAA ERSST.v5 dataset for the EN3.4 region (170 to 120∘ W, 5∘ N to 5∘ S; Huang et al., 2017). In this study an El Niño (La Niña) event is defined when the average August to February monthly SST anomaly is in the top (bottom) 12-year averages of the entire 36-year dataset. The classification of years for each phase for each index can be found in Tables S2–S7 in the Supplement. The period from August to February was chosen as ENSO events tend to span across 2 years, developing around boreal spring and typically peak in boreal winter (Emerton et al., 2017), thus aligning with the Amazon wet season and preceding peak river flows (Fig. 1b). Events for the CP and EP indices are categorised using monthly anomalies from the ERSST v3b dataset (see http://www.met.igp.gob.pe/datos/ EC.txt; last access: 6 August 2020) using the same methodology. The MEI index is classified using a bi-monthly time series of the leading combined empirical orthogonal function (EOF) of five variables (sea level pressure, SST, zonal and meridional components of the surface wind and outgoing longwave radiation (OLR)) over the tropical equatorial Pacific basin (30∘ S–30∘ N and 100∘ E–70∘ W), with events defined similarly to the EN3.4, CP and EP indices but using bi-monthly values (i.e. August/September to January/February).
Tropical Atlantic positive and negative phases are classified using the TNA and TSA indices (Enfield et al., 1999), which are based on monthly SST data from the HadISST and NOAA 1×1 datasets. SST data are averaged for the region from 5.5 to 23.5∘ N and 15 to 57.5∘ W (0∘ to 20∘ S and 10∘ E to 30∘ W) for the TNA (TSA). Positive and negative phases are defined as in the ENSO indices (i.e. top and bottom 12 August–February averages for the upper and lower terciles). TNA SST variability is known to be modulated by conditions in the tropical Pacific and lags by 4 to 6 months, usually peaking in boreal spring (Enfield, 1996; García-Serrano et al., 2017). Amazon rainfall and discharge peaks can appear to “lead” North Atlantic SSTs but were found to be “in phase” with the Amazon wet season when removing the influence of ENSO (Yoon and Zeng, 2010). Builes-Jaramillo et al. (2018) postulate that the relationship between streamflow and SSTs in TNA may be a two-way feedback system whereby hydrological conditions in the Amazon can influence future states of SSTs in the Atlantic Ocean, and thus the TNA-streamflow teleconnection is still of interest despite flood peaks preceding the development phase of a positive or negative event.
2.5 Flood peak magnitude
Owing to the Amazon spanning across both the Northern and Southern hemispheres, the seasonality of rainfall varies across the basin (Espinoza et al., 2009). Throughout the majority of the Amazon, the wet season typically spans between December and April (Yoon and Zeng, 2010), with flood peak occurrences generally taking place between February and July (Fig. 1b). Thus, for each gauging station or grid point we extract annual maximum river flows over a hydrological year starting from October to the following September. The difference between the mean of positive and negative phases (e.g. positive years of ENSO) relative to neutral conditions are calculated and expressed as a percentage to allow comparisons to be drawn between gauging stations.
2.6 Flood peak timing
From the set of extracted values of annual maximum river flows from each river point, we calculate the average seasonality of peak flows (i.e. the timing of peak river flow occurrence) and their variability using the Burn's vector (Burn, 1997), which is an index based on circular statistics (Mardia, 1972). The vector components represent the average timing of peak river flows (i.e. date of occurrence) and its variability (r) as polar coordinates on a unit circle (Burn, 1997). The date of occurrence is defined by converting the Julian date (where 1 January is day 1 and 31 December is day 365) of each flood peak i to an angular value in radians to then calculate the circular mean of all annual peaks. The variability of flood timing (r) ranges from 0 to 1, where r=0 represents a highly variable regime, with flood peaks occurring evenly throughout the year, while r=1 indicates a regime where flood peaks occur consistently at the same time of the year. Therefore, higher values of r represent lower variability, which is expected in larger rivers in the Amazon, as the delay between peaks in rainfall and river discharge is large. By contrast, lower values of r represent higher variability, which could be associated with rivers where climate phases are found to influence the timing between individual years (Ficchí and Stephens, 2019). We calculate the difference between the average timing of flood peaks for positive and negative phases against neutral conditions using circular statistics.
2.7 Flood duration
For each gauging station or grid point, we consider the duration of flooding as the number of days (not consecutive) spent above the 95th percentile of the climatology. Although the 95th percentile does not necessarily represent flooding, this threshold has been chosen to better understand how anomalous oceanic conditions can influence the length of high-water periods throughout the basin, which have been found to have both positive and adverse effects on community member livelihoods (Langill and Abizaid, 2019). Like for flood magnitude and timing, the average number of days spent above the 95th percentile each year for positive and negative phases are compared against neutral conditions.
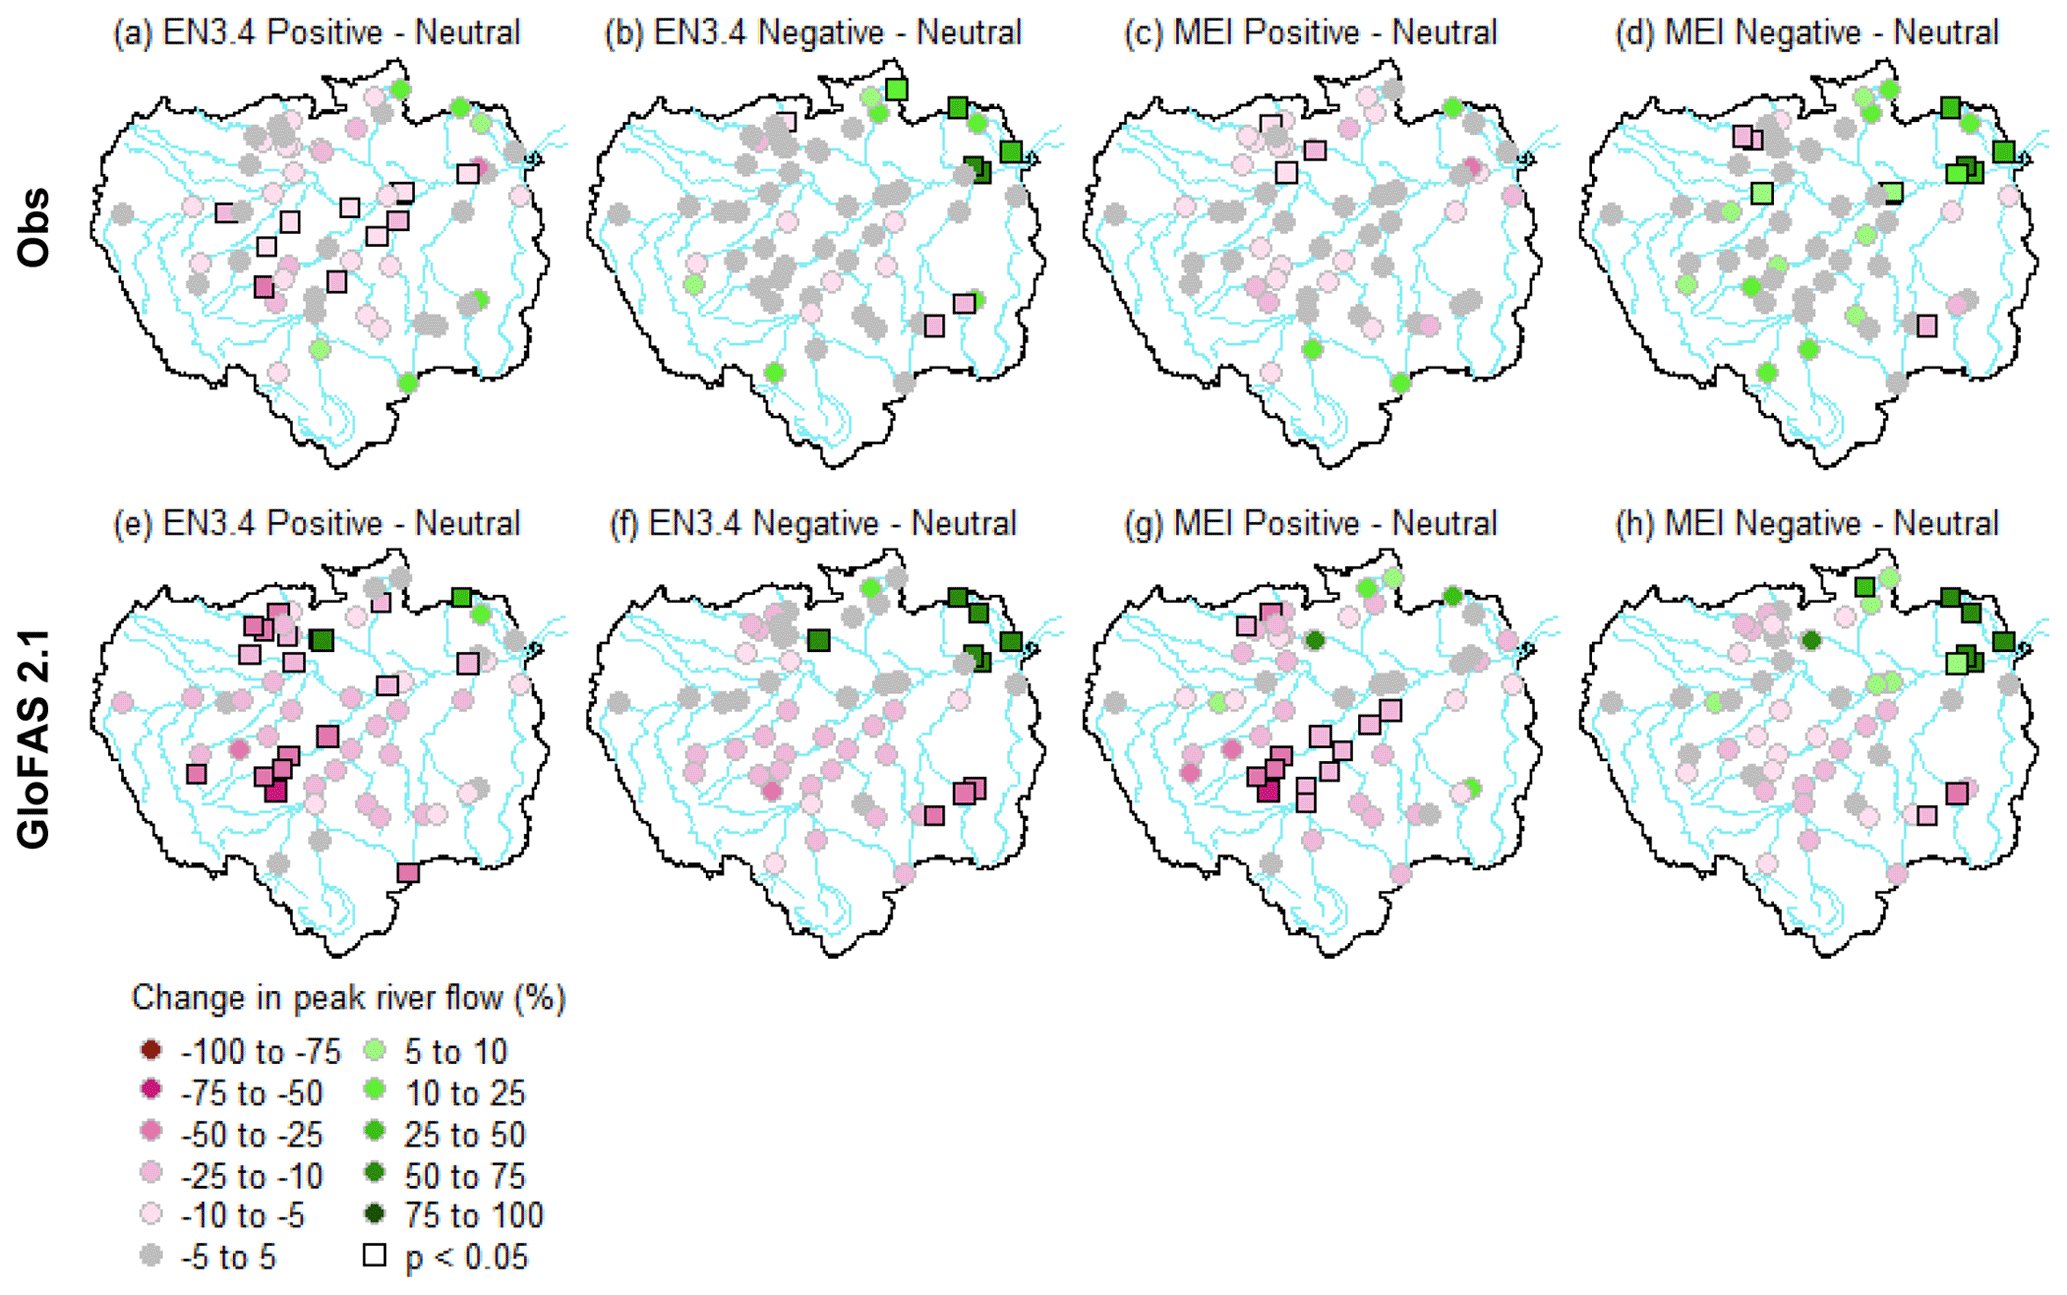
Figure 2Percentage change of observed and simulated mean annual peak river flows between different phases of the EN3.4 and MEI indices. (a, c, e, g) Positive with respect to neutral years. (b, d, f, h) Negative with respect to neutral years. Panels (a–d) represent changes for observations and panels (e–h) show changes for GloFAS 2.1 streamflow reanalysis data. Pink (green) points represent where the average annual peak flow decreases (increases). Significant results at the 95 % confidence level are denoted using a square (i.e. p<0.05).
2.8 Significance testing
To test for significance, we apply a non-parametric bootstrapping technique (10 000 replicates) to provide a distribution for the average magnitude, timing and duration of flood peaks in each climate phase. Here, each 12-year time series for each climate phase is resampled 10 000 times with replacement to provide a bootstrap distribution in which the mean is taken. The difference in the means of the distributions of each climate phase is then calculated, with significance determined using the 95 % confidence interval (i.e. if the confidence interval includes 0, then we can conclude that there is no significant change between the climate phases and we fail to reject the null hypothesis).
There is widespread agreement between the gauged and reanalysis climatology (i.e. 36 years) of annual maximum river flows, flood peak timings and its variability (Fig. 1). Annual means of peak river flows are similar between the two datasets (ρ=0.9), with the largest flows constrained to the main Amazon River and towards the junctions of its major tributaries, such as the Madeira River stemming from the south (Fig. 1a and d). A strong regional pattern in the timing of annual flood peaks is evident between the northern and southern halves of the basin owing to the differing precipitation regimes in association with the alternative warming between the Northern and Southern hemispheres (Espinoza et al., 2009). Stations situated in the southern Amazon typically experience peak river flows between February and April, while stations in the northern half generally peak between May and July (Fig. 1b and e).
Yearly annual maximums from the GloFAS 2.1 dataset tend to peak slightly earlier (9 d on circular average), particularly in southern tributaries where a large quantity of dams exist (Towner et al., 2019) and along parts of the main Amazon River (Fig. 1e). Not all dams and reservoirs across the globe have been included within GloFAS (see Fig. 2 in Zajac et al., 2017), meaning that the flood timing may differ from the observations in the simulated dataset (Ficchí and Stephens, 2019). In addition, GloFAS does not model floodplain–river interactions and instead mimics them by using a simple loss function. As such, floodplain storage and interactions are known to be one of the main sources of uncertainty in the model and is particularly prominent in large river basins like the Amazon causing flood peaks to occur too early (Alfieri et al., 2013). The timing of peak river flows is highly predictable at most stations, with a median Burn's vector variability component (r) of 0.92 and 0.93 across all stations for the observed and reanalysis dataset, respectively (Fig. 1c and f). However, flood timing variability is greater at two gauging stations (45 and 51) situated towards the north of the basin, with r values as low as 0.62 within the observed dataset.
Hereafter, the results are broken down to match the research questions outlined in Sect. 1, with reference to individual gauging stations denoted by the station numbers in italics as indicated in Fig. S1 and Table S1 in the Supplement.
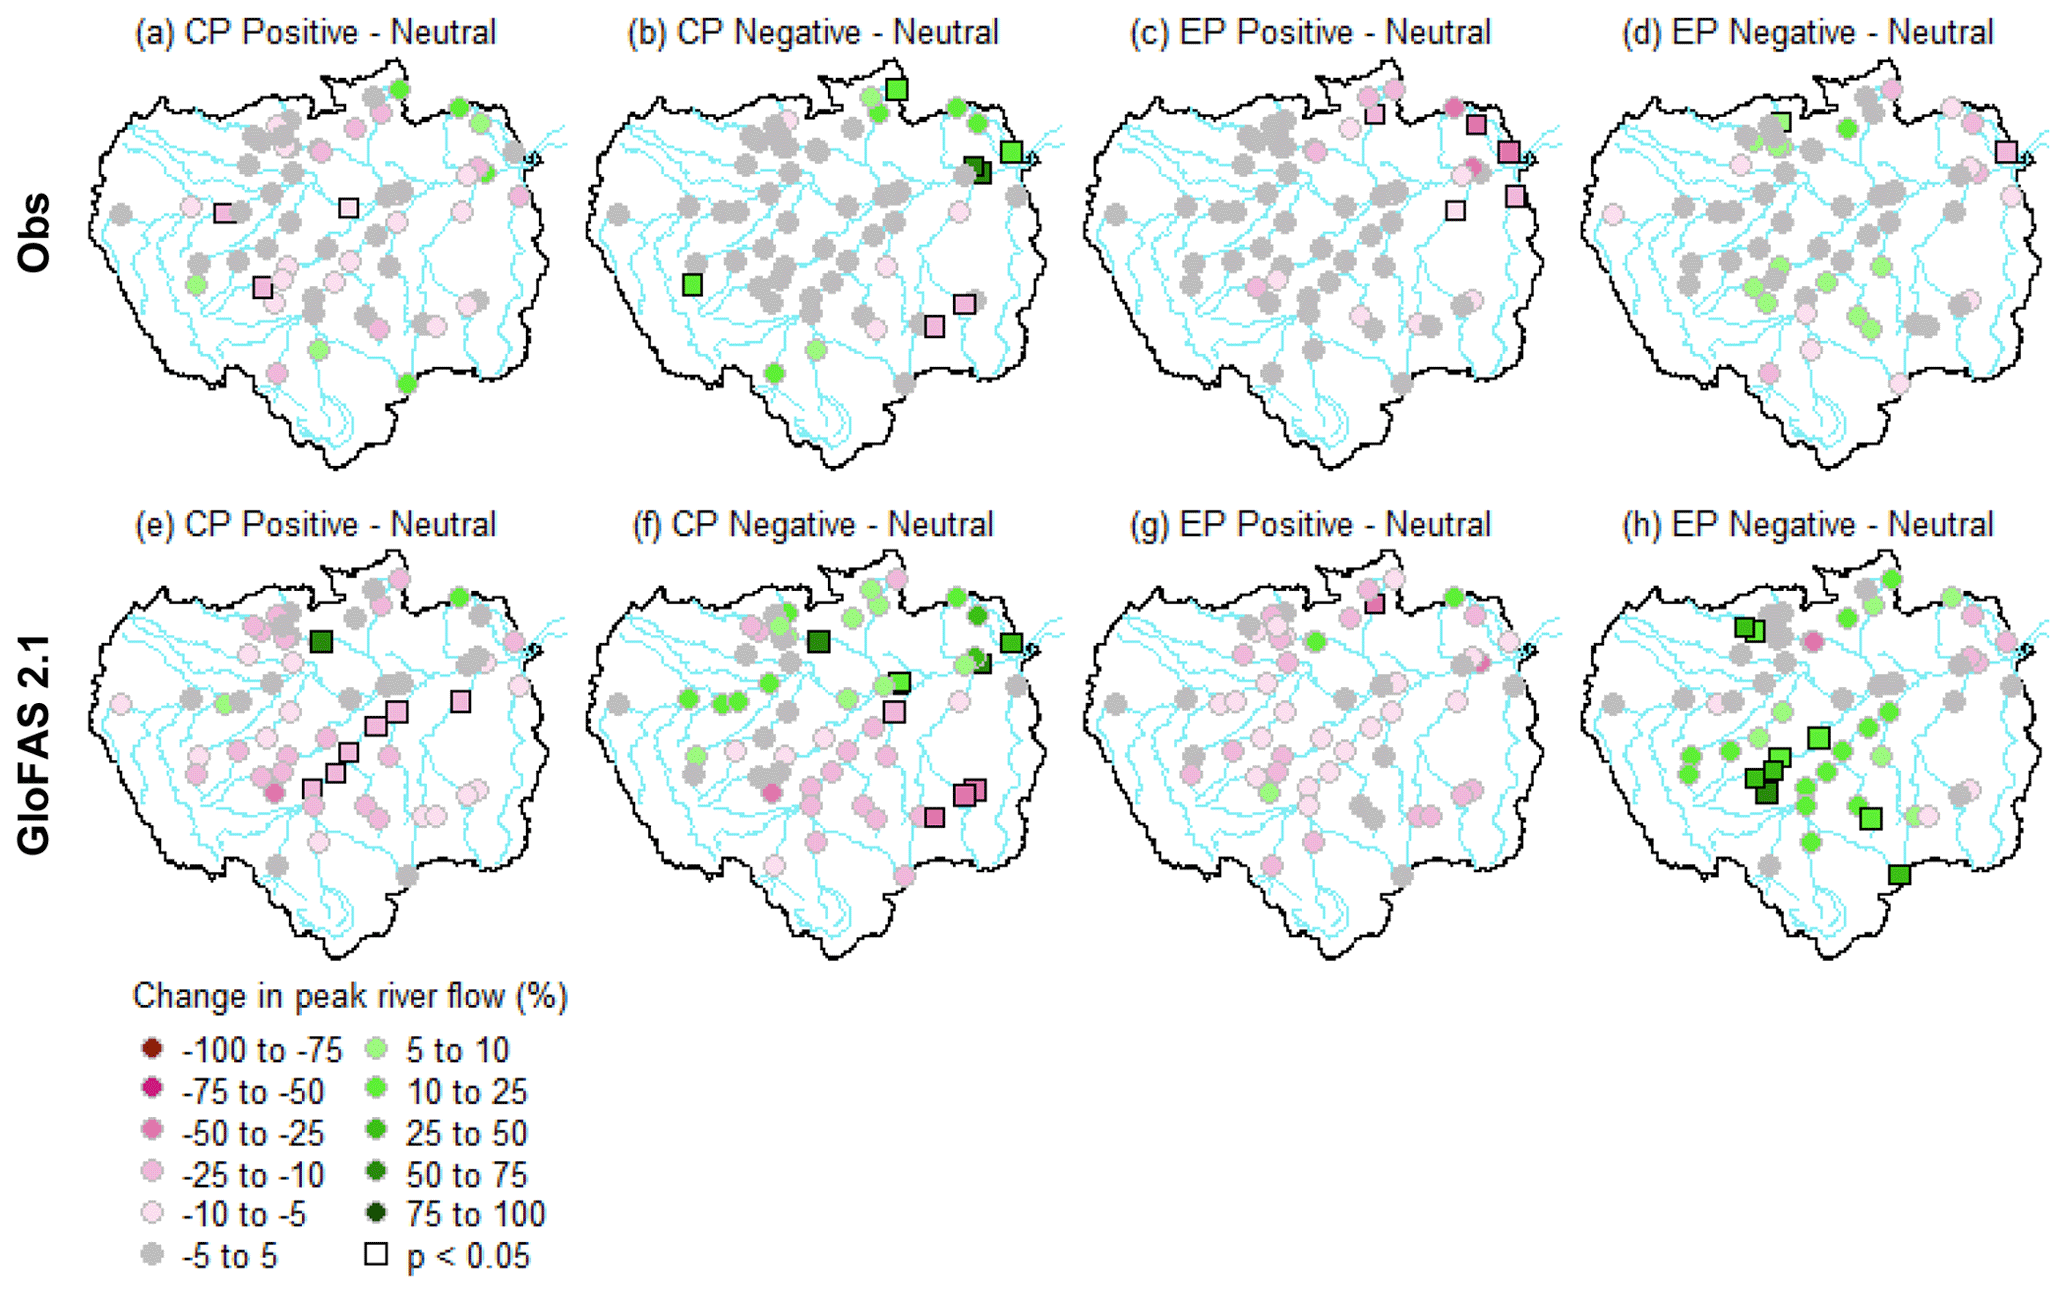
Figure 3Percentage change of observed and simulated mean annual peak river flows between different phases of the CP and EP indices. (a, c, e, g) Positive with respect to neutral years. (b, d, f, h) Negative with respect to neutral years. Panels (a–d) represent changes for observations and panels (e–h) show changes for GloFAS 2.1 streamflow reanalysis data. Pink (green) points represent where the average annual peak flow decreases (increases). Significant results at the 95 % confidence level are denoted using a square (i.e. p<0.05).
3.1 Flood magnitude
3.1.1 ENSO
Out of the 58 gauging stations, 48 (51) observe a decrease in annual maximum river flows during El Niño years relative to neutral conditions, with a median deficit of 7 % (13 %) across stations that acknowledged a reduction in peak river flows for the observed (GloFAS 2.1) dataset (Fig. 2a and e). Of these, 11 (17) are statistically significant for the observed (GloFAS 2.1) dataset, with GloFAS 2.1 observing more significant results in the north-west of the basin. Decreases in peak river flows are consistent with what has been previously identified in the literature, with drier conditions and droughts more common when SSTs in the equatorial Pacific are anomalously warm (Marengo, 1992; Foley et al., 2002; Ronchail et al., 2005b; Espinoza et al., 2009; Marengo et al., 2018; Jimenez et al., 2019). SST anomalies are created via the slowdown of the trade winds inducing anomalies in the east–west Walker circulation, whereby convection is more prominent over the central equatorial Pacific and subsidence that inhibits rainfall is found over most of central and eastern locations of the Amazon basin (Panisset et al., 2018). The largest decreases are acknowledged in central to south-western regions (Fig. 2a and e), particularly along the Purus River (13–15), where Ronchail et al. (2005b) previously noted decreases of river discharge up to 25 % during El Niño phases (based on the period 1981–2002). A similar pattern is observed for the MEI index (Fig. 2c and g), with the exception of several stations (2, 4, 5, 9, 11, 32 and 34) situated along and near to the main stem of the Solimões-Amazon River. Here, the percentage change is relatively small for MEI-based positive years (mainly between −5 % and 5 %; grey circles), with no significant findings despite the EN3.4 and MEI indices differing by just 2 years for their positive phases (see Tables S2 and S3 in the Supplement). The reasoning for this is due to peak river flows being higher for the neutral years of the EN3.4 index in comparison to neutral years of the MEI index. When taking the difference between MEI positive and EN3.4 neutral years, the median across the aforementioned stations goes from −1 % to −5 %, with slightly higher peak river flows found for the MEI positive index relative to the EN3.4 positive index.

Figure 4Percentage change of observed and simulated mean annual peak river flows between different phases of tropical Atlantic indices. (a, c, e, g) Positive with respect to neutral years. (b, d, f, h) Negative with respect to neutral years. Panels (a–d) represent changes for observations and panels (e–h) show changes for GloFAS 2.1 streamflow reanalysis data. Pink (green) points represent where the average annual peak flow decreases (increases). Significant results at the 95 % confidence level are denoted using a square (i.e. p<0.05).
The impact of La Niña on flood peaks is not symmetric nor as strong as El Niño at most gauging stations for all of the ENSO indices, including the CP and EP, particularly in central locations of the basin (Figs. 2b, d and 3b, d). Typically, above normal river flows and flooding in parts of the north-western Amazon are associated with cooler than usual SSTs in the equatorial Pacific Ocean (Marengo et al., 2012; Espinoza et al., 2013, 2014). These conditions favour a configuration of positive 850 hPa geopotential heights anomalies, which maintain a strong humidity flux convergence over the Amazon (see Espinoza et al., 2013) and a westward displacement of the Walker circulation, whereby its ascending limb is situated over the Amazon basin, as opposed to the Pacific Ocean, increasing rainfall totals (Satyamurty et al., 2013). However, a median deficit of 2 % (8 %) is observed for peak river flows during the cold phase of ENSO for the observed (GloFAS 2.1) dataset, with the majority of the basin witnessing a decrease relative to neutral years for GloFAS 2.1 (Fig. 2b and f). Tributaries in the north-eastern Amazon stand out for the negative ENSO phase, with significant increases in annual flood peaks for three out of four of the ENSO indices (EN3.4, MEI, and CP) for both datasets (Figs. 2 and 3). The most notable increases are observed at the Arapari (39) and Boca Do Inferno (40) gauging stations, with an average increase of >60 % at both stations for EN3.4 (Fig. 2b). These findings in the north-east have been previously identified for both rainfall (Ronchail et al., 2002) and river discharge (Ronchail et al., 2005b), where Ronchail et al. (2005b) also found lower discharge levels during La Niña throughout the south-eastern Amazon.
No wet signal is found in the north-eastern Amazon basin for observed negative EP phases (Fig. 3d), in contrast to what was identified for the negative phases of the other ENSO indices (i.e. EN3.4, MEI and CP). This response was also identified for rainfall (Fig. 12), indicating that the wet response in the north-east is restricted to years when the cooling of tropical Pacific SSTs is constrained to the central equatorial Pacific. Observing Fig. 3c (i.e. positive EP), the typical drying trend associated with warm SST anomalies in the tropical Pacific is shifted further towards the north-eastern Amazon showing the opposite pattern to the negative EN3.4 phase in this region. This could potentially be associated with the descending limb of the Walker circulation being displaced further east in response to the eastward shift of anomalously warm SSTs in EP El Niño years (Alizadeh-Choobari, 2017). The positive CP phase (Fig. 3a) shows a similar pattern to EN3.4 (Fig. 2a), as expected owing to them occupying similar spatial locations across the equatorial Pacific and differing by just one year for their warm phases (see Tables S2 and S4 in the Supplement). However, the number of significant values is notably less (3 compared to 11), with largest differences found along and near the Amazon River in Brazil. The negative CP phase (Fig. 3b) is almost identical to the negative EN3.4 index (Fig. 2b) with a handful of stations showing increased (decreased) peak flows in the north-eastern (south-eastern) basin, which is also shown for GloFAS 2.1 (Figs. 2f and 3f).

Figure 5Average change in the timing of observed and simulated annual peak river flows between different phases of the EN3.4 and MEI indices. (a, c, e, g) Positive with respect to neutral years. (b, d, f, h) Negative with respect to neutral years. Panels (a–d) represent changes for observations and panels (e–h) show changes for GloFAS 2.1 streamflow reanalysis data. Pink (green) points represent where flood peaks occur earlier (later) compared to neutral conditions. Significant results at the 95 % confidence level are denoted using a square (i.e. p<0.05).
3.1.2 Tropical Atlantic
For positive TNA years, 57 % of the stations experience a decrease relative to neutral conditions, with a minimal percentage change (median = −4 % for stations that observe a decrease and +5 % for stations observing an increase) (Fig. 4a). Of these decreases, both datasets have seven statistically significant results concentrated to the western and south-western Amazon. The decrease is stronger for GloFAS 2.1 (Fig. 4e) relative to the observed data, which is found to be true for several other climate indices (e.g. negative EP and TSA phases; Figs. 3h and 4h). The reasoning for these results could be associated with the lack of accurate representation of floodplain interactions and smaller-scale processes that occur in the observed data that could dampen or increase the magnitude of change in river flow (e.g. a lack of floodplain storage could result in increased river flow in the model). Therefore, the magnitude of the response to climate phases in GloFAS is more likely a direct reflection of the increase or decrease in rainfall witnessed during that particular climate phase.
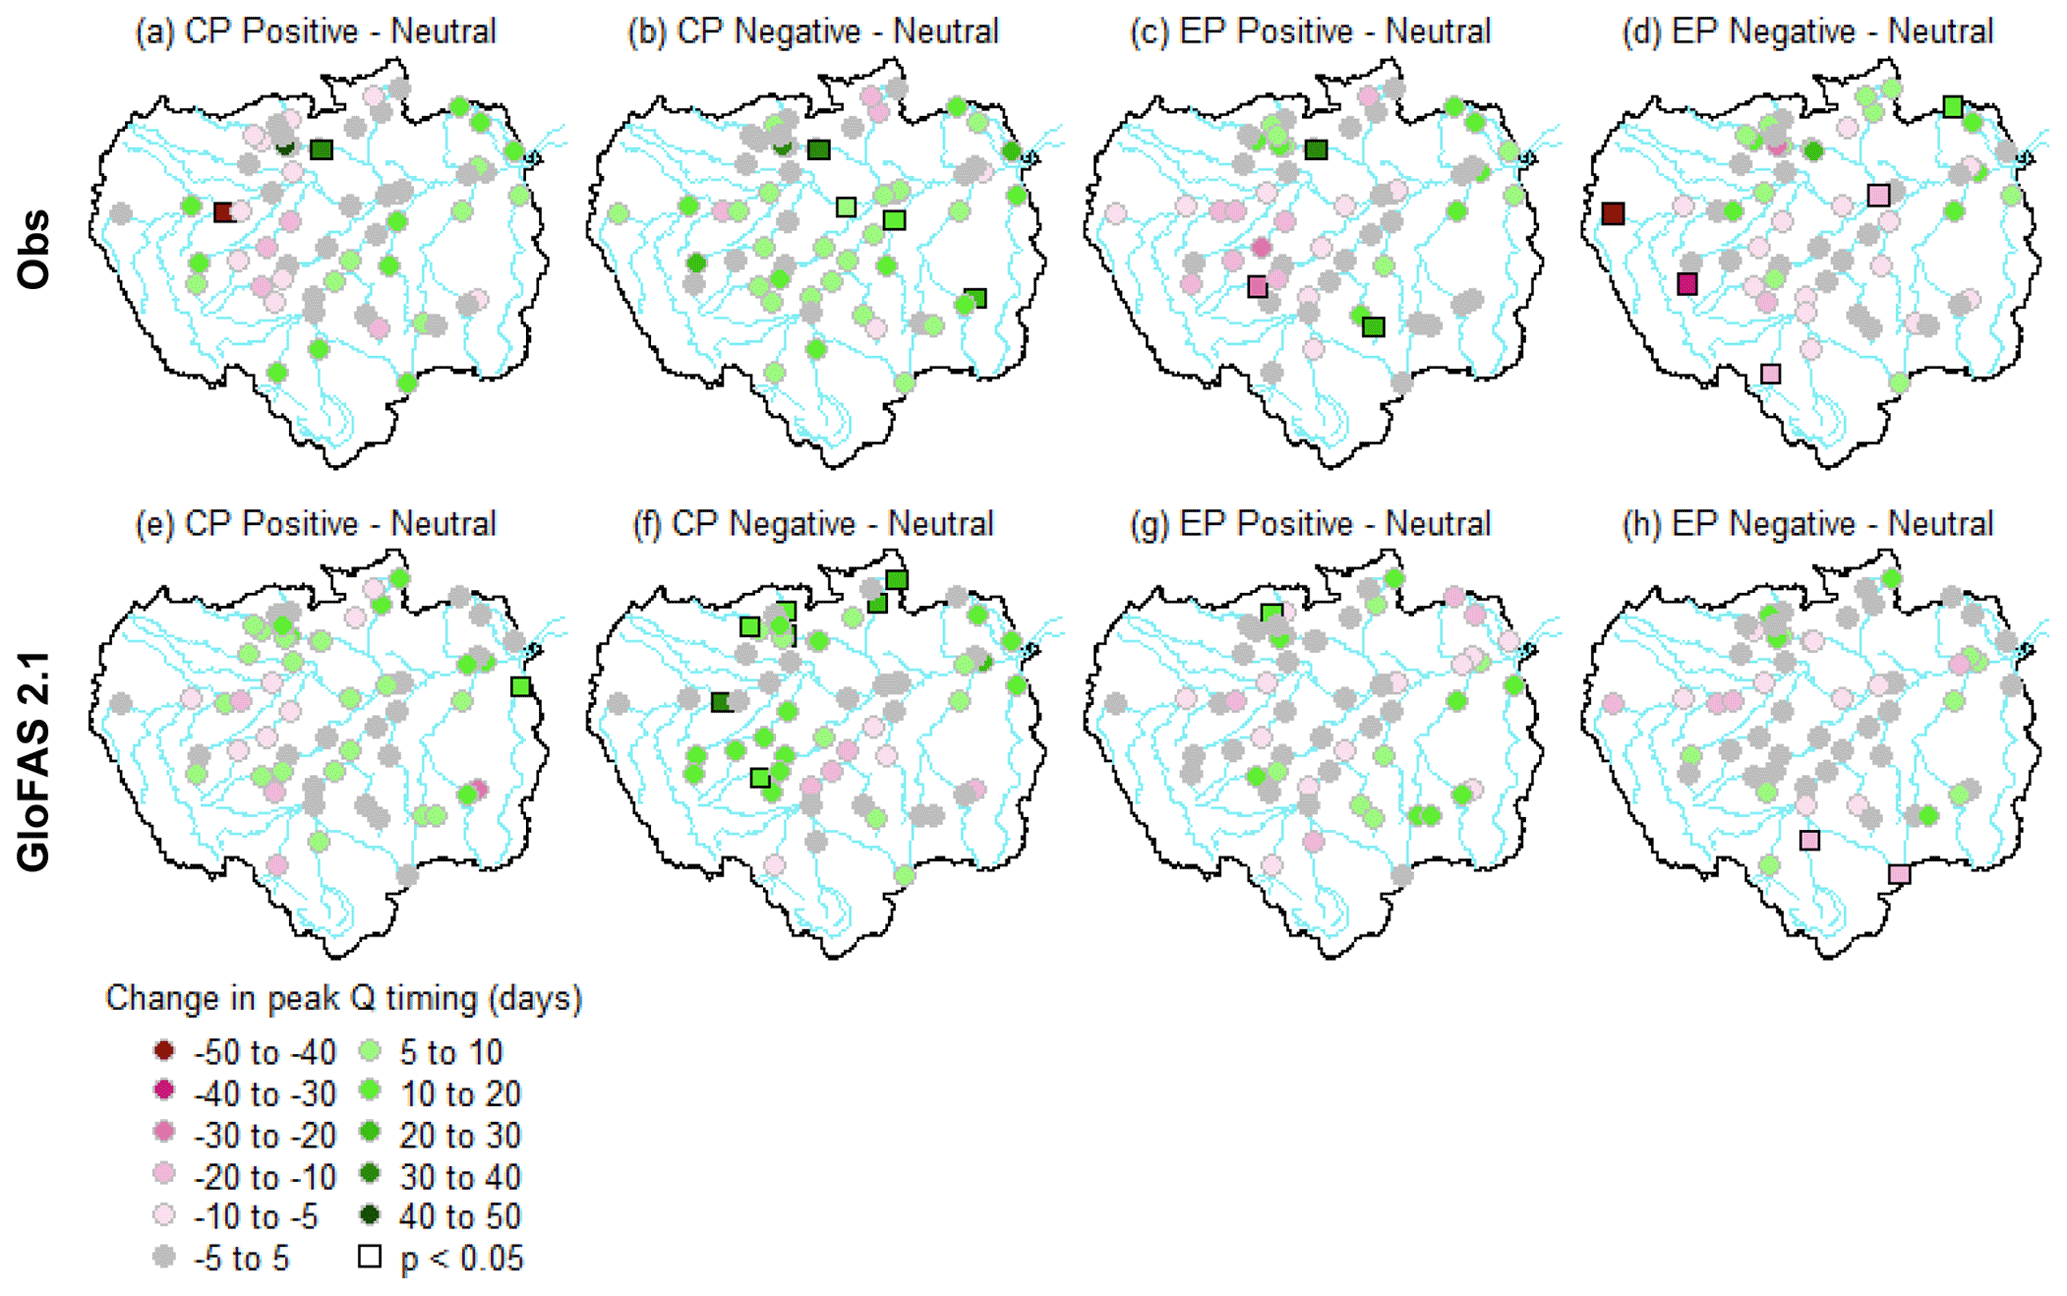
Figure 6Average change in the timing of observed and simulated annual peak river flows between different phases of the CP and EP indices. (a, c, e, g) Positive with respect to neutral years. (b, d, f, h) Negative with respect to neutral years. Panels (a–d) represent changes for observations and panels (e–h) show changes for GloFAS 2.1 streamflow reanalysis data. Pink (green) points represent where flood peaks occur earlier (later) compared to neutral conditions. Significant results at the 95 % confidence level are denoted using a square (i.e. p<0.05).
The contrast between positive and negative phases for both tropical Atlantic indices is far less apparent than for the Pacific indices, with a prevalence of grey circles for the observed dataset results (Fig. 4a–d), highlighting that the signal is weak for all phases (i.e. positive, neutral and negative). Decreases in river flow were to be expected for positive TNA years based on previous results for both rainfall and river discharge. For instance, Yoon and Zeng (2010) identified that warmer TNA SSTs were found to induce subsidence over the Amazon basin, resulting in reduced moisture convergence over the basin and thus less rainfall. The same was identified for abnormally low river discharge in the upper Solimões River, the headwaters to the Amazon River, where low-discharge years (i.e. 1995, 2005 and 2010) were associated with higher than usual SSTs in the North Atlantic Ocean (Espinoza et al., 2011).
The decrease observed in peak river flows from our results is not as strong as those found previously for rainfall and river discharge (e.g. Yoon and Zeng, 2010; Espinoza et al., 2011) due to the signal being stronger for the Amazon dry season (July–October), particularly for the southern Amazon when the influence of ENSO is more limited. A similar case was identified in the study by Ronchail et al. (2005b) where negative TNA years were found to cause higher than usual low flows in a large portion of the Amazon basin along the main stem during the dry season but not for the wet season. As we focus on floods, the period of analysis precedes and aligns with the Amazon wet season (i.e. August–February), where the influence is found to be less substantial, concluding that tropical Atlantic SSTs are less important at most locations with regards to peak river flow variability. Focusing on Fig. 4, notable results are prevalent in the western Amazon for positive TNA years (Fig. 4a) and along the Madeira River, the largest southern tributary, during positive TSA years (Fig. 4c). These results are replicated for modelled data (Fig. 4d and g).
3.2 Flood timing
3.2.1 ENSO
Results in changes to peak flow timing are less obvious with no clear spatial coherence (Figs. 5–7) and fewer stations reaching statistical significance relative to flood magnitude and duration. For instance, only four stations for the observed dataset reach statistical significance during the positive EN3.4 phase, compared to 11 and 15 stations for flood magnitude and duration, respectively. Of the total stations, 52 % and 48 % observe earlier (later) flood peaks for the positive EN3.4 phase for observed data, with a median change of −6 (8) d for stations that observe earlier (later) peaks. Only Estirao Do Repouso gauging station (3) shows changes in peak flow timing between positive and neutral phases (EN3.4) greater than 1 month (48 d earlier), while three stations (4, 31, 48) show changes greater than 1 month between the negative and neutral phase (EN3.4 and MEI). Sucunduri station (48) in the central north of the Amazon (Negro River) is of interest as the flood timing becomes significantly later relative to neutral years (between 21 and 42 d) for both positive and negative phases for all ENSO indices with the exception of the negative EP phase (Figs. 5a–d and 6a–d) and both tropical Atlantic indices (Fig. 7a–d). As was the case for changes to peak river flows (Figs. 2a, b and 3a, b), peak flow timing results are comparable between the two central equatorial Pacific indices (i.e. EN3.4 and CP) (Figs. 5a, b and 6a, b).
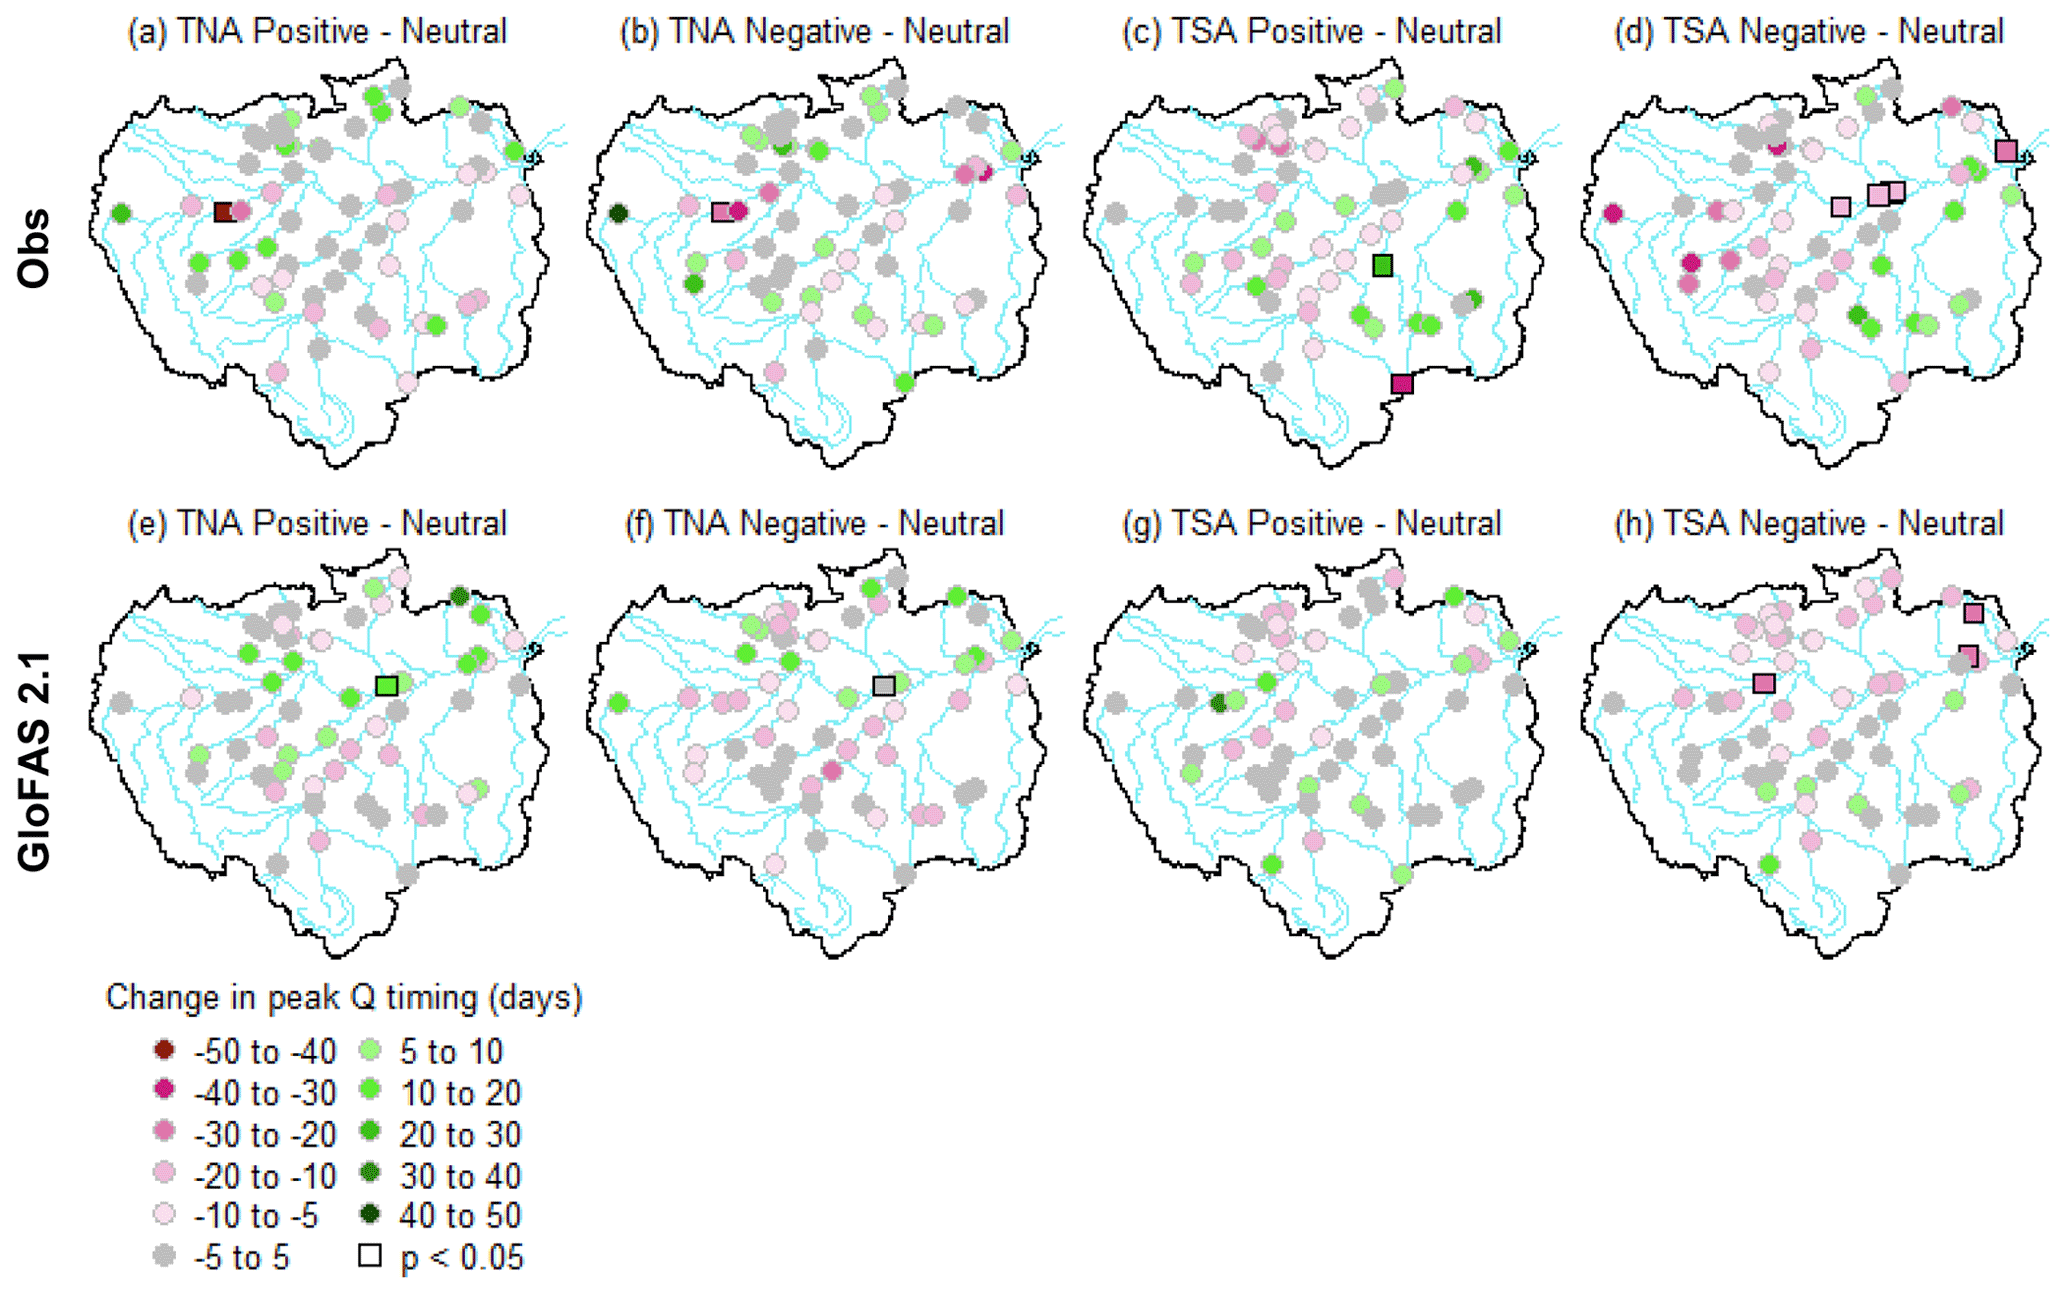
Figure 7Average change in the timing of observed and simulated annual peak river flows between different phases of tropical Atlantic indices. (a, c, e, g) Positive with respect to neutral years. (b, d, f, h) Negative with respect to neutral years. Panels (a–d) represent changes for observations and panels (e–h) show changes for GloFAS 2.1 streamflow reanalysis data. Pink (green) points represent where flood peaks occur earlier (later) compared to neutral conditions. Significant results at the 95 % confidence level are denoted using a square (i.e. p<0.05).
3.2.2 Tropical Atlantic
The largest and most consistent differences in flood timing are found for negative TSA years relative to neutral conditions (Fig. 7d and h), where 70 % of observed stations witness earlier flood peaks (median = 9 d early across stations observing earlier peaks). For GloFAS 2.1 modelled data, a consistent earlier peak is observed in northern sub-basins (Fig. 7h), while the observed data shows earlier flood peaks are more common along the main Amazon River and towards south-western tributaries in the Acre state (Fig. 7d). Here, flood peak timings are observed much earlier in the upper headwater of the Marañón River (34 d; 1), the main western Amazon River tributary, with significant results found along the Brazilian stretch of the Amazon River (11, 32 and 34). These significant results are likely due to earlier peaks found in and around the Negro, Madeira, Purus and Juruá rivers (6, 7, 8 and 10), where annual peaks are 20 d earlier on average.
3.3 Flood duration
3.3.1 ENSO
Decreases in flood duration (i.e. the number of days spent above the 95th percentile) are common throughout the basin during the EN3.4 phase relative to neutral conditions (Fig. 8a and e), consistent with reduced peak river flows during this phase (Fig. 2a and e) though with a higher number of significant stations (15 compared to 11). Out of 58 gauging stations, 47 (46) observe decreases in days over threshold (DOT), with a median decrease of 12 (8) d across stations that observed a decrease for EN3.4 (MEI). The largest and most significant decreases are concentrated within the central Amazon, where a decrease of 31 d is identified at the Fazenda Vista Alegre gauging station (35), situated near to the mouth of the southern Madeira River for EN3.4. The increase in peak river flows observed in the north-eastern Amazon for the negative ENSO phase (Fig. 2b, d, f and h) is replicated for flood duration for both EN3.4 and MEI indices (Fig. 8b, d, f and h).

Figure 8Changes in flood duration (i.e. mean number of days river flows exceed the 95th percentile of each station or grid point climatology) for different phases of the EN3.4 and MEI indices. (a, c, e, g) Positive with respect to neutral years. (b, d, f, h) Negative with respect to neutral years. Panels (a–d) represent changes for observations and panels (e–h) show changes for GloFAS 2.1 streamflow reanalysis data. Pink (green) points represent decreases (increases) in the number of days spent above the 95th percentile compared to neutral conditions. Significant results at the 95 % confidence level are denoted using a square (i.e. p<0.05).
The influence of La Niña is stronger in downstream tributaries of the Amazon River compared to tributaries upstream (Fig. 8b). At Óbidos (38), an average of 19 extra days are spent above the 95th percentile of the climatology relative to neutral years, while a decrease in DOT is observed at the start of the Solimões River in the Peruvian Amazon at Tamshiyacu (2). The additional flood days at Óbidos (38) could be explained by increased flood duration in northern rivers of the basin (i.e. Negro and Branco; Fig. 8b) and highlights how the hydrological regime between the upper and lower Amazon can respond differently to particular climate phases (e.g. La Niña). This has been previously highlighted for the extreme flooding in 2009, which affected central and eastern parts of the basin but not the upstream Peruvian Amazon (Espinoza et al., 2013). Similar results have previously been found in the southern Amazon basin for rainfall and river discharge (Ronchail et al., 2005b; Ronchail and Gallaire, 2006), where the effect of climate variability was found to be regionally specific and time dependent. Land use changes could also be a factor in the differences identified between different parts of the basin as regions of deforestation have previously been found to reduce latent heat and evapotranspiration, leading to a reduction in rainfall in the south-eastern Amazon (Silvério et al., 2015; Gutierrez-Cori et al., 2021).
A reduction in flood duration is common for both the positive and negative phases for the CP index, with a median reduction of seven days for each (Fig. 9a and b). Significant results are common at stations situated within or around the Amazon River for the CP index, similar to the positive EN3.4 phase, with 13 stations reaching the statistical threshold. The increase in peak river flow for the negative CP phase (Fig. 3b) in the north-east is not associated with flood duration (Fig. 9b) as it was for the EN3.4 and MEI indices, meaning that although the magnitude is more likely to increase when SSTs in the CP are colder than usual, the duration of higher flows does not increase. This could suggest that the increase in peak flow may be short-lived (i.e. higher peak flow but lower high flows over the wet season). For the EP, the most notable finding can be observed along the Madeira and Purus rivers, where several stations show a significant increase in flood duration for GloFAS 2.1 (Fig. 9h). This increase is also identified at a number of the stations for the observed dataset, although the results are not significant (Fig. 9d).
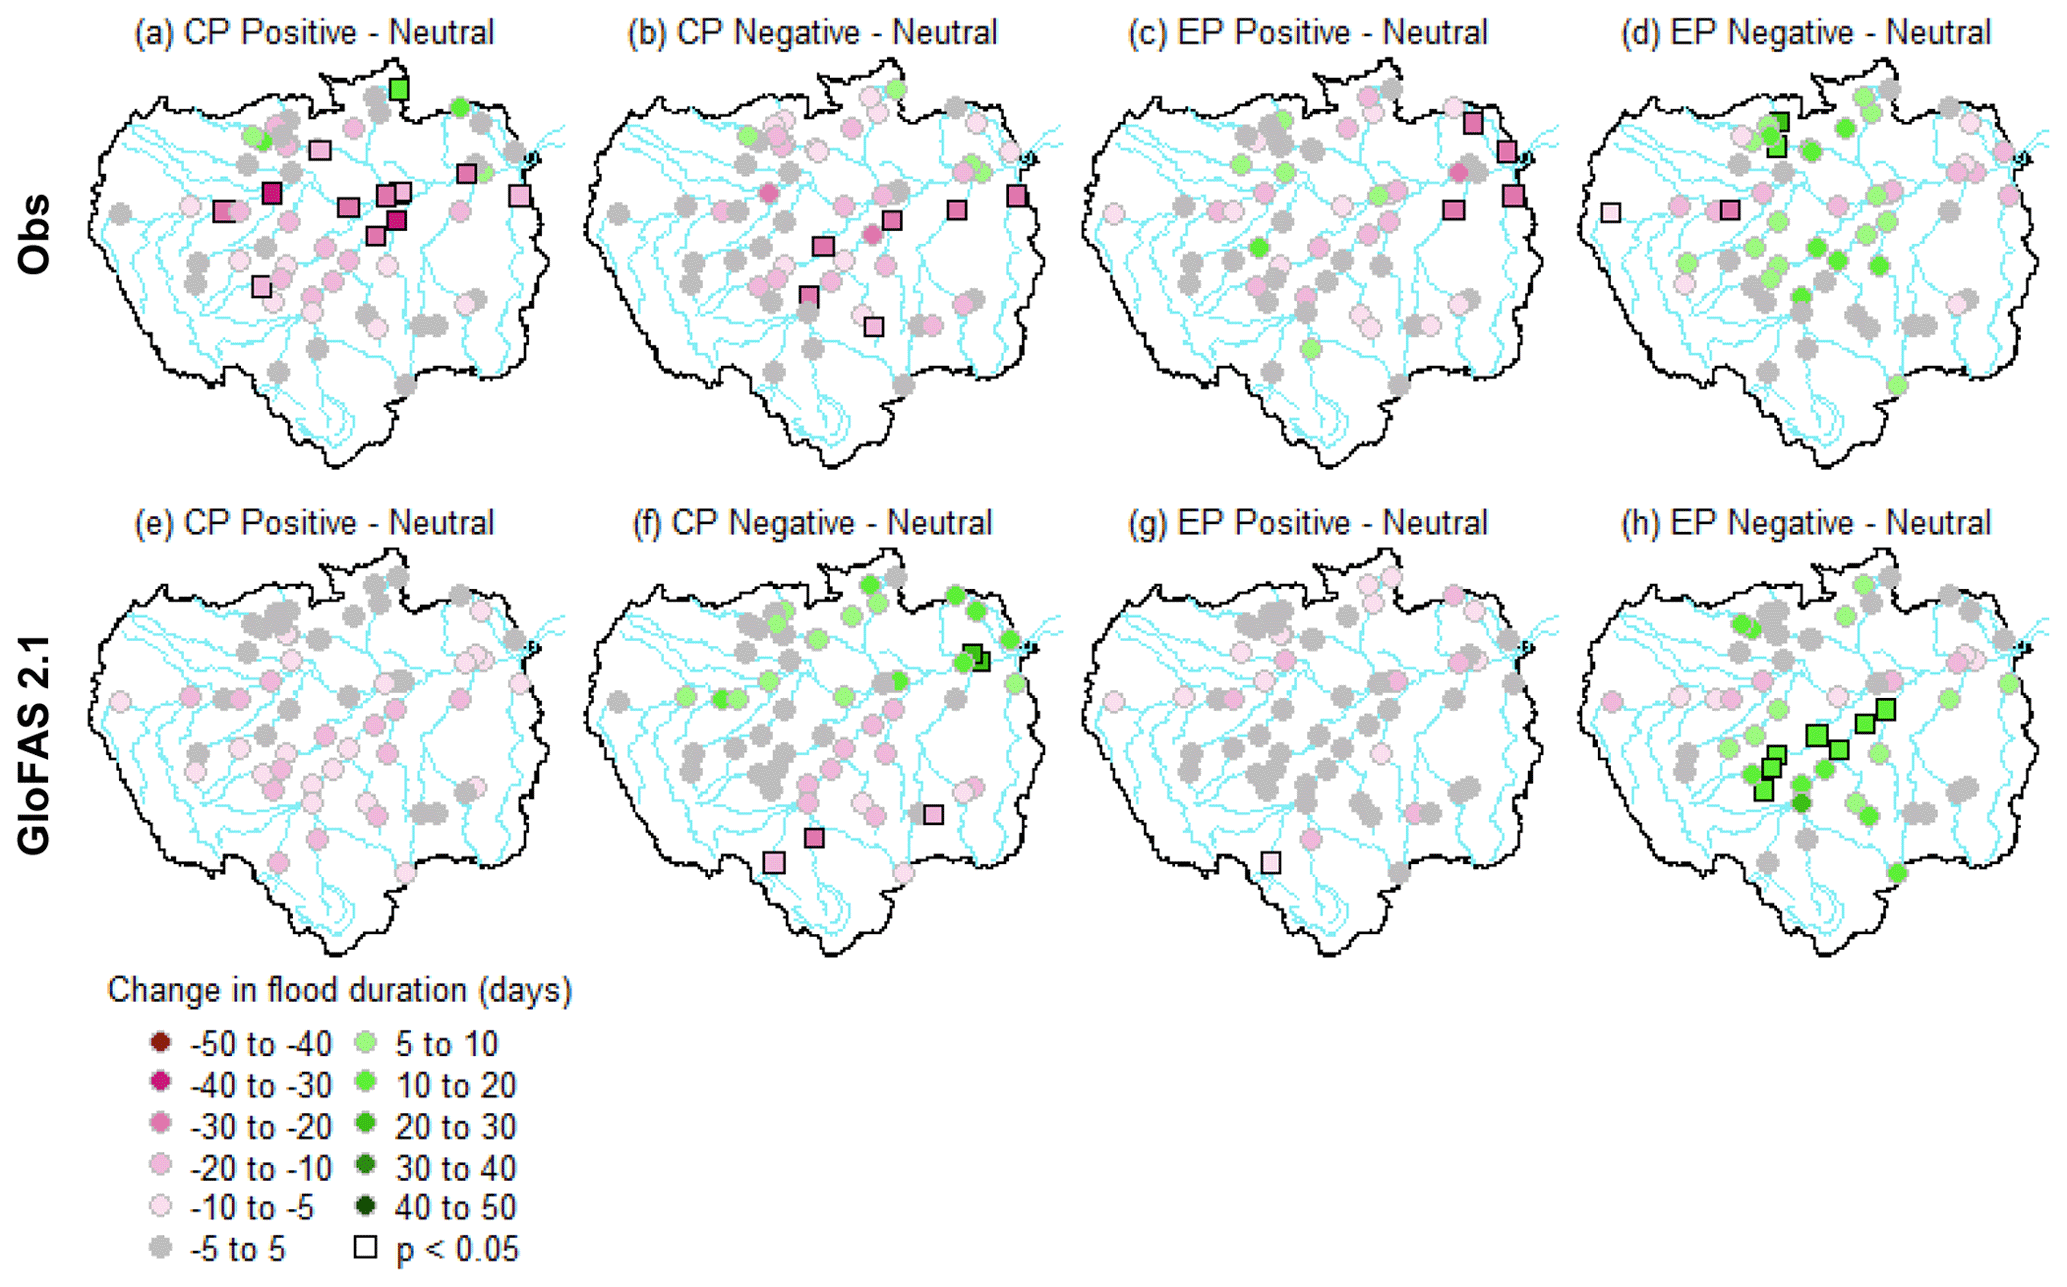
Figure 9Changes in flood duration (i.e. mean number of days river flows exceed the 95th percentile of each station or grid point climatology) for different phases of the CP and EP indices. (a, c, e, g) Positive with respect to neutral years. (b, d, f, h) Negative with respect to neutral years. Panels (a–d) represent changes for observations and panels (e–h) show changes for GloFAS 2.1 streamflow reanalysis data. Pink (green) points represent decreases (increases) in the number of days spent above the 95th percentile compared to neutral conditions. Significant results at the 95 % confidence level are denoted using a square (i.e. p<0.05).
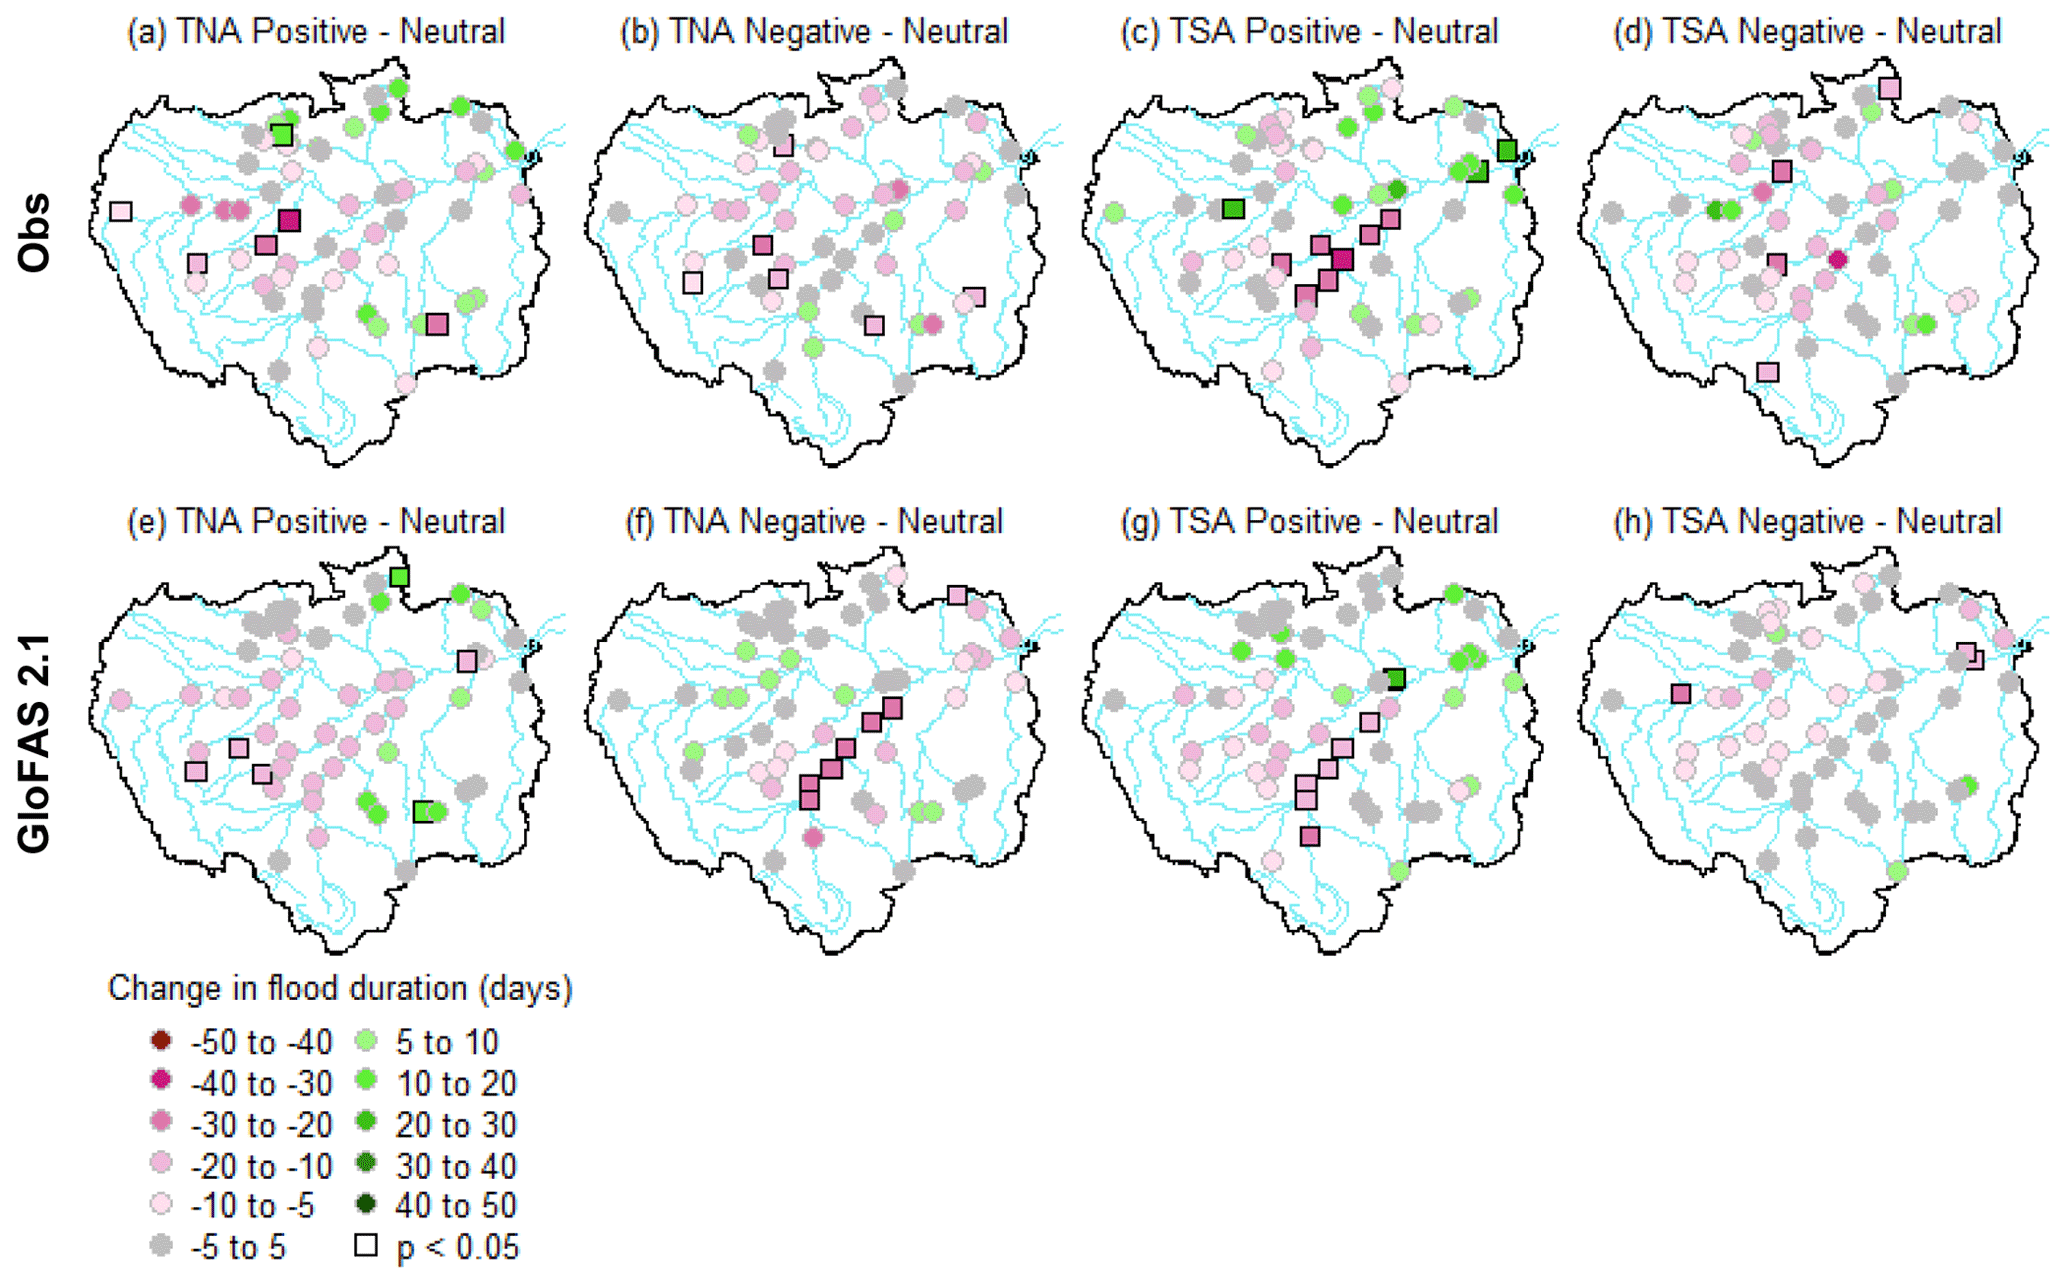
Figure 10Changes in flood duration (i.e. mean number of days river flows exceed the 95th percentile of each station or grid point climatology) for different phases of tropical Atlantic indices. (a, c, e, g) Positive with respect to neutral years. (b, d, f, h) Negative with respect to neutral years. Panels (a–d) represent changes for observations and panels (e–h) show changes for GloFAS 2.1 streamflow reanalysis data. Pink (green) points represent decreases (increases) in the number of days spent above the 95th percentile compared to neutral conditions. Significant results at the 95 % confidence levels are denoted using a square (i.e. p<0.05).
3.3.2 Tropical Atlantic
The most significant finding can be observed at stations situated along the Madeira River for positive TSA years for both datasets (Fig. 10c and g), where statistically significant decreases in flood duration are found, matching the results of significant decreases in annual flood peaks (Fig. 4c). Four out of the five gauging stations (23, 24, 25 and 35) along the Madeira River reach statistical significance and note at least a 21 d reduction in days over threshold, with the Humaita gauging station (25) seeing a reduction of over 1 month. Overall, decreases in flood duration are more common for both Atlantic indices regardless of whether the climate phase is positive or negative for the observed dataset (Fig. 10a–d).
3.4 Notable results
A few regions show distinctive changes to flood characteristics or discrepancies to what is expected relative to previous studies during certain climate phases. Three particular findings stand out: (a) the absence of significant change at the Tamshiyacu gauging station (2) in the Peruvian Amazon, where previous floods have been attributed to La Niña events (Espinoza et al., 2013); (b) the response to the negative ENSO phase in the north-eastern Amazon, where increases in peak flow magnitude and high flow duration are identified for EN3.4, MEI and CP but not for the EP index; and (c) the regional similarities and differences found between simulated GloFAS 2.1 flows and the observed data and how GloFAS performs for different phases of climate variability. This final topic is chosen as it can provide interesting insight to model developers as to whether model performance is better or worse during particular periods relating to climate modes.
3.4.1 Response to SST anomalies in the Peruvian Amazon
Tamshiyacu (2) is one of the key gauging stations for monitoring flooding in the Peruvian Amazon due to its location upstream from the city of Iquitos. Extreme floods in this region have been previously associated with La Niña SSTs in the equatorial Pacific (e.g. in 1999 and 2012, Espinoza et al., 2013). However, when using a tercile approach for the period 1979–2015, this station observes a small decrease (2–5 d) in the number of days above the 95th percentile of river flow for all ENSO indices during the cold phase (Fig. 8b and d), whilst the increase in peak river flow is minimal (+1 %; Fig. 2b and d). All 12 EN3.4 negative years in this study are classified as La Niña years when comparing the years identified to the classic NOAA ONI index classification of positive and negative ENSO phases (see Table S2 in the Supplement). These results suggest that although La Niña conditions have been shown to produce atmospheric anomalies responsible for extreme flooding (e.g. as in Espinoza et al., 2013), weak cold events (e.g. five consecutive 3-month running mean SSTs just below or at about −0.5 ∘C based on the ONI classification) may not be enough to produce high flood characteristics (e.g. increased high flow durations) in the Peruvian Amazon. It is therefore of interest to understand if a particular threshold of anomalous cooling in the central Pacific is needed to reproduce the atmospheric response witnessed in the buildup to the 2012 event.
In an attempt to better understand the response to tropical Pacific SSTs, we compare annual peak flow magnitude, timing and the duration of high flows for all years at Tamshiyacu (2) against the preceding OND averaged SSTs in the tropical Pacific EN3.4 region before the Peruvian Amazon flood season takes place (Fig. 11). Results show a modest but significant increase (Pearson's p<0.05) in annual peak river flows as SSTs become more negative, although high river flows exceeding 50 000 m3 s−1 are recorded regardless of whether SSTs are in a positive, neutral or negative phase (Fig. 11a). Regression analysis shows that only 17 % of the variance in peak flow magnitude can be explained by OND EN3.4 SSTs. Moreover, though a negative SST anomaly of −1.08 ∘C in OND 2011 (sixth largest SST anomaly) relates to the largest peak in 2012, a further five cases with larger negative SST anomalies note lower magnitude river flows indicating that the relationship is non-linear and multi-variate. Three years (1998, 1999 and 2007) with similar SST anomalies ( ∘C) are found to have differences in peak river flows of up to 7750 m3 s−1, meaning that other factors (e.g. SST temporal evolution, spatial complexities, local factors including topography, land cover changes, other land surface anomalies, response upstream and SSTs in the Atlantic) beyond the Pacific SSTs magnitude are likely responsible for the variability seen in annual flood maximums.
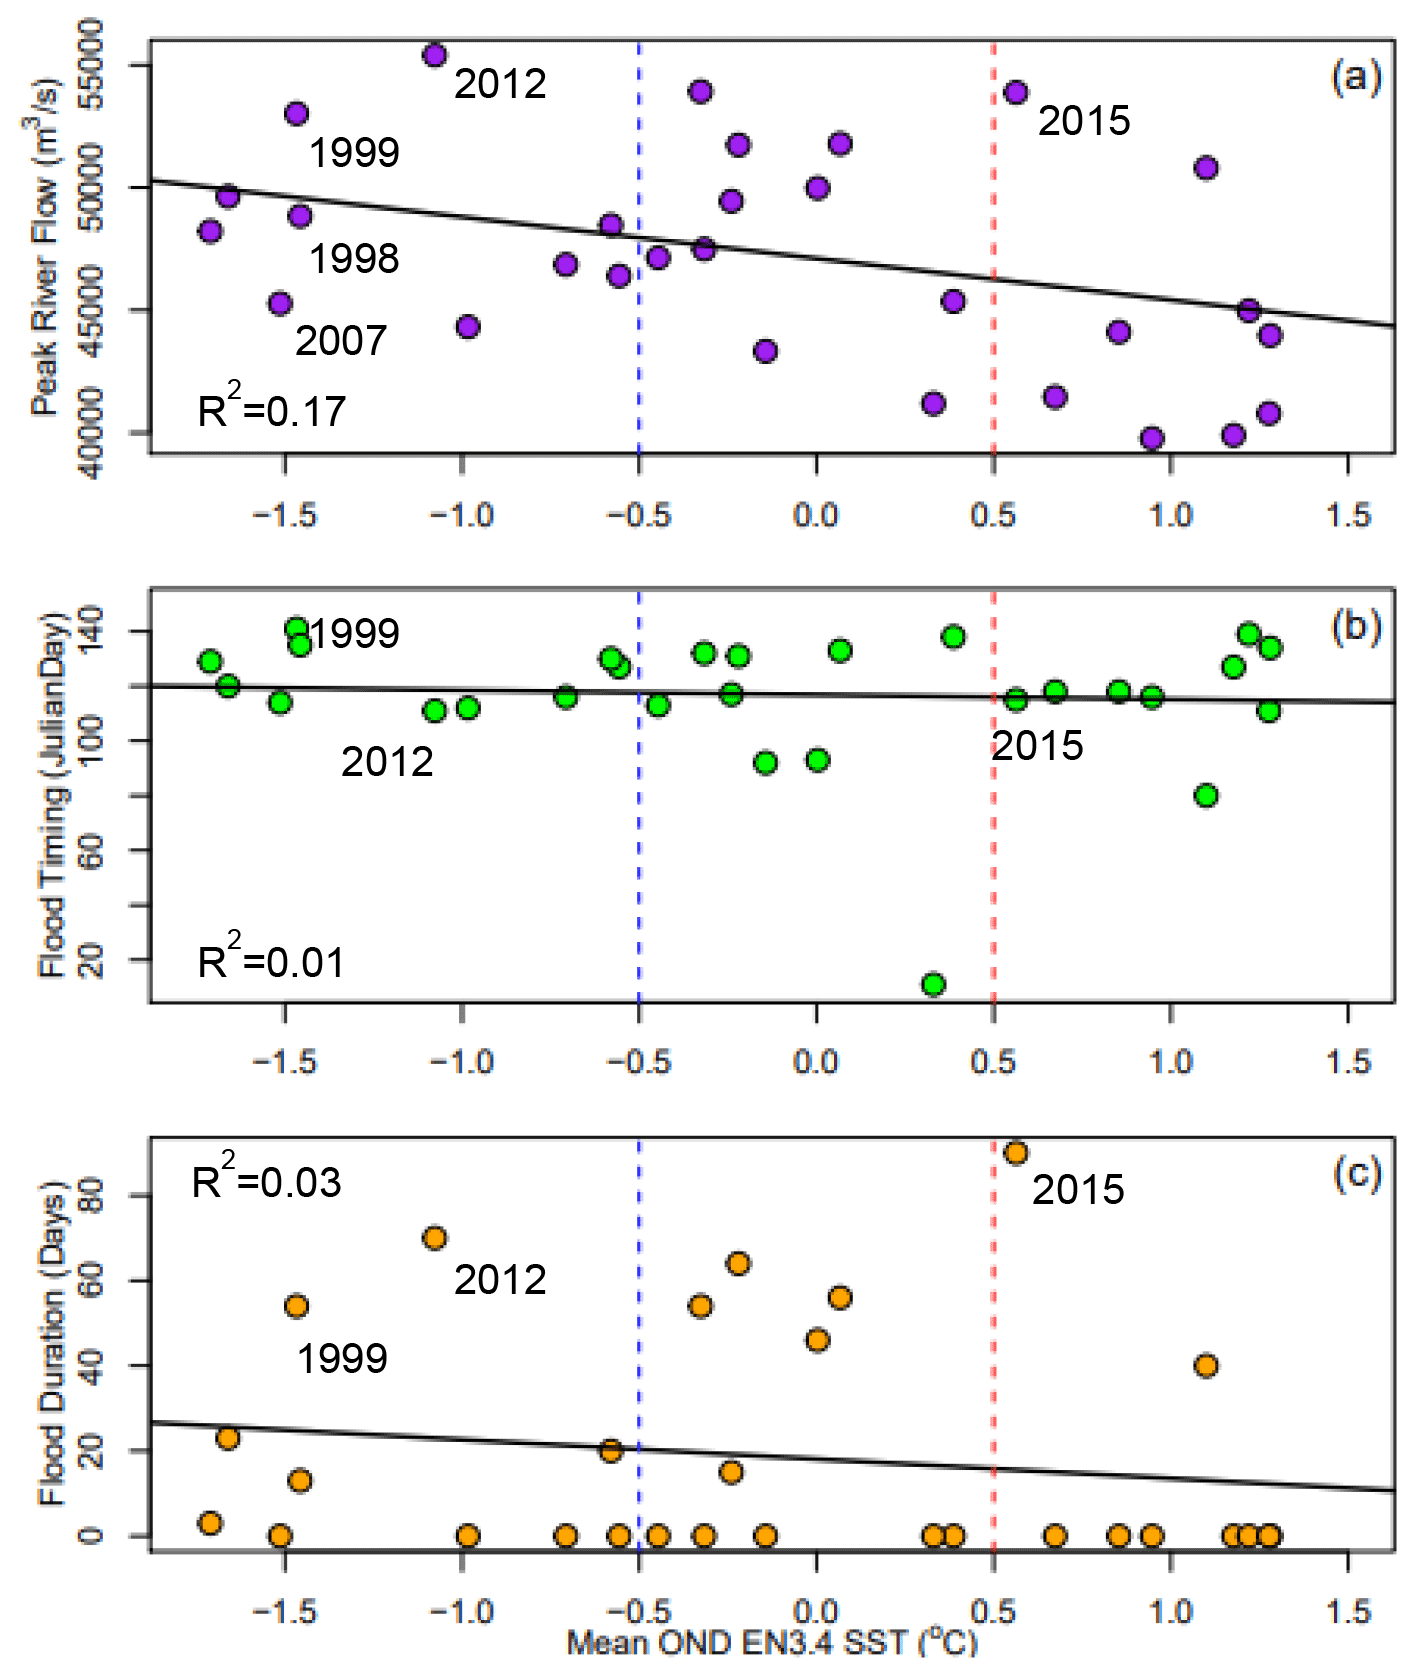
Figure 11Scatterplot of the mean OND SST anomaly in the EN3.4 region vs. (a) the annual river flow magnitude, (b) peak flow timing and (c) flood duration (i.e. days over the 95th percentile of flow) for the Tamshiyacu (2) gauging station for the period 1986–2015. Straight black lines represent the regression line, with the R2 value provided for each. Major flood events are highlighted by the respective year.
The regression line for flood timing (Fig. 11b) is flat, with no significant differences in peak flow timing with SST variability. In 2004 the peak river flow occurred significantly earlier than usual, taking place in January as opposed to late April (Fig. 1b), with neutral SST conditions present in the preceding months in the EN3.4 region. The reasoning behind this deserves further attention by investigating the antecedent and upstream conditions prior to the flood peak and considering variables including soil moisture, total rainfall and river levels. Finally, no notable relationship is acknowledged at the Tamshiyacu gauging (2) between DOT and SST anomalies, with the longest flood duration occurring during a weak El Niño event in 2014–2015 (Fig. 11c). Comparing the flood magnitude and duration, it shows that although they are closely linked (i.e. as the magnitude increases, the flood duration generally goes up), they do not have a linear relationship. For instance, in 2012, Tamshiyacu (2) recorded a flow of 55 400 m3 s−1, whilst in 2015 the value was slightly under at 53 880 m3 s−1. Despite the higher river flow, Tamshiyacu (2) records show that river flows were above the 95th percentile of the station's climatology for 70 d in 2012, with the 2015 event totalling 91 d. Examining results further downstream in Brazil at Óbidos (38), no DOT are observed in 2015. This suggests that the flooding was specific to upstream locations and that major tributaries joining the Amazon River after Peru could have been experiencing decreases in river flow. This agrees with the suggestion by Espinoza et al. (2013) that the mechanisms responsible for flooding can differ between upstream and downstream sub-basins of the Amazon River, with a previous flood in 2009 found to only affect central and eastern regions of the Amazon basin.
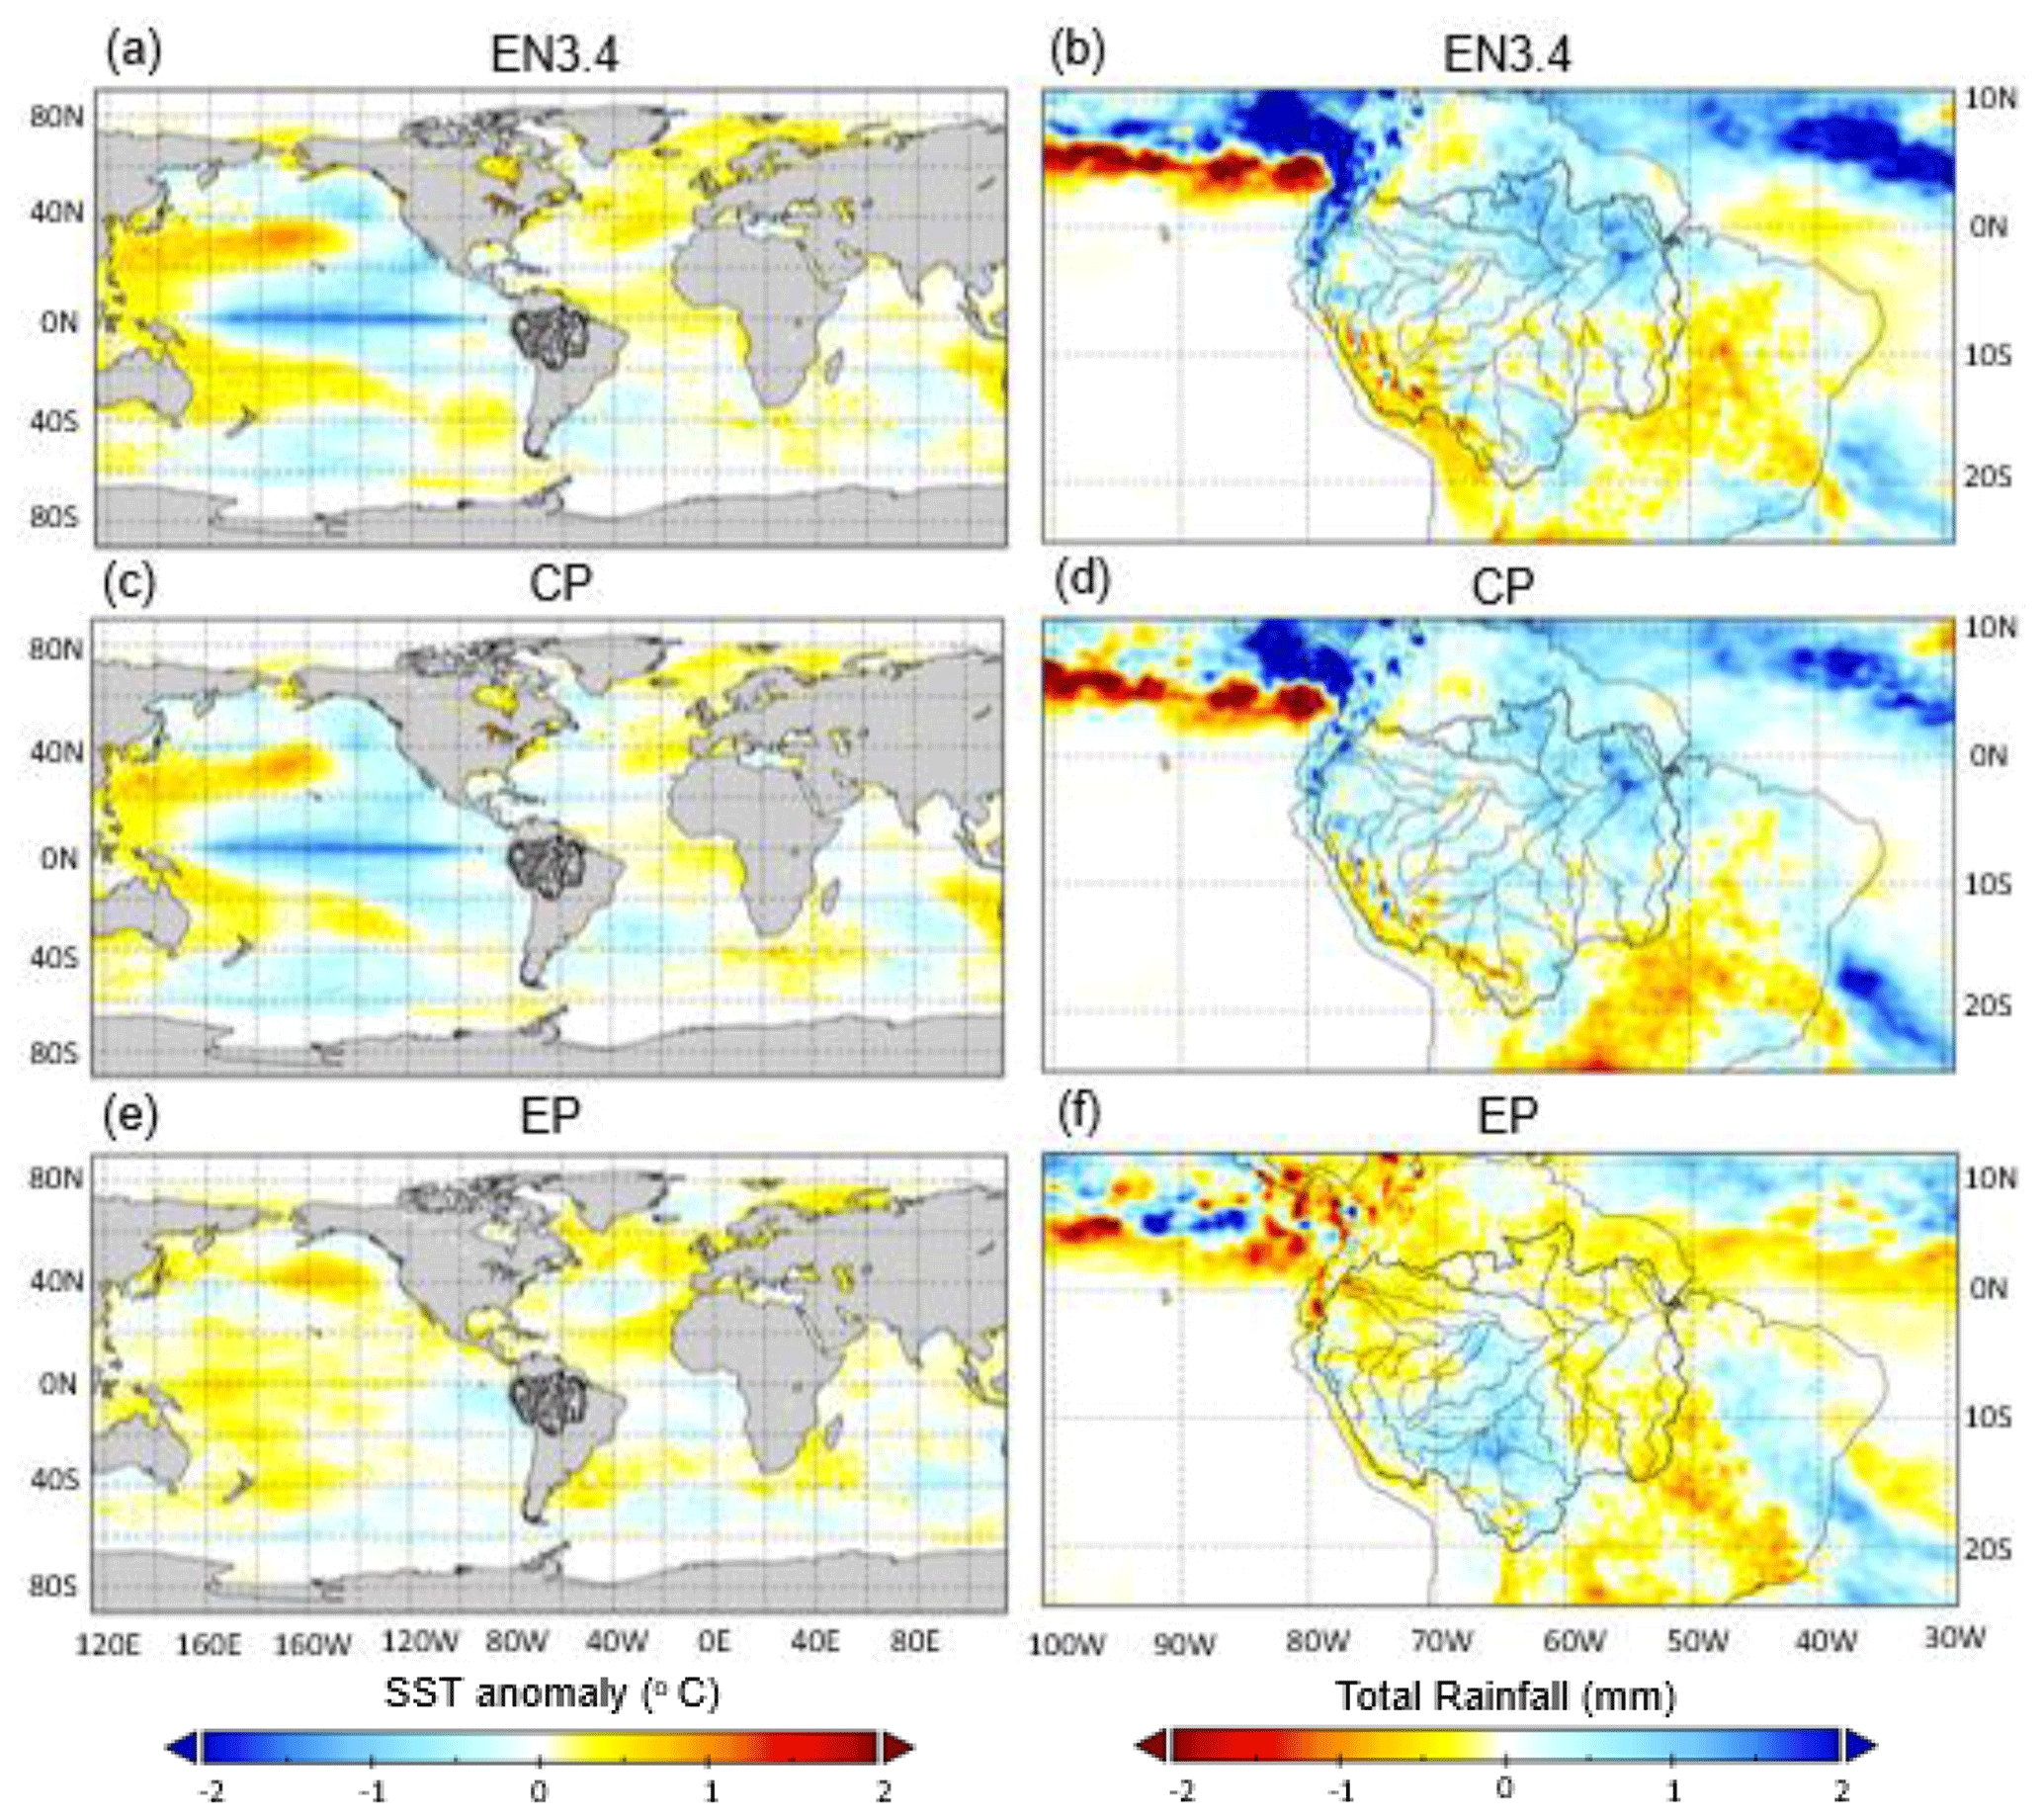
Figure 12Composite analysis of the difference between the preceding OND average SST (∘C) (a, c, e) and total rainfall (mm) (b, d, f) for the average of the 12 negative years and the average of the 12 neutral years. Panels (a, b): EN3.4 index; panels (c, d): CP index; and panels (e, f): EP index. A list of the negative and neutral years for each index can be found in Tables S2, S4 and S5 in the Supplement.
Owing to extreme flooding at Tamshiyacu (2) in the Peruvian Amazon commonly coinciding with negative SSTs in the tropical Pacific (Espinoza et al., 2013) and due to El Niño events on average producing a slight decrease in flood duration relative to neutral years at this station (Fig. 8a), an analysis that determines all possible drivers of the 2015 event where a weak El Niño features would be of interest. Such an analysis could help us understand the atmospheric response for this specific event and how it differs from previous floods already analysed in the literature (e.g. 2012; Espinoza et al., 2013). Ideally, such an analysis would incorporate stations both upstream and downstream to identify any regional differences and consider SSTs in all adjacent Oceans. Finally, though the results of this study do not replicate the wet signal associated with La Niña found previously (e.g. Espinoza et al., 2013), it could be worth investigating how the timing of La Niña events (i.e. timing of onset and peak) impacts river flows. This arises from the results of Espinoza et al. (2013) who identified that the intensity of the 2012 floods were likely related to an early La Niña event that caused earlier than usual rainfall resulting in simultaneous peak flows in combining tributaries of the Amazon River. Therefore, it raises the question as to whether the magnitude, timing, or location of ENSO events are more important for predicting flood events in the Amazon basin.
3.4.2 Response to La Niña in the north-eastern Amazon
Wetter conditions (i.e. increased annual peak magnitude and flood duration) was a common response in the north-eastern Amazon to negative SST years in the tropical Pacific for multiple ENSO indices and for both datasets. This response is likely owed to cooler than usual SSTs favouring an intensification of northern humidity fluxes in the Caribbean Sea, which are directed towards the north-western Amazon and then across to the northern-eastern Amazon (see Fig. 3c in Espinoza et al., 2013). The exception to this response, however, was identified for the negative EP phase where slight decreases in peak river flows and flood duration were identified (Figs. 3d and 9d). To better understand the similarities and differences between ENSO indices, Fig. 12 plots the average preceding OND SST anomalies and total precipitation over the Amazon basin for the negative years of the EN3.4, CP and EP indices relative to their associated neutral years (e.g. EN3.4 negative minus EN3.4 neutral). SST anomalies for negative EN3.4 and CP phases are found to be similar, with a concentration of negative SSTs ( ∘C) situated in a long stretch of the central equatorial Pacific and warmer SSTs common in coastal areas of Indonesia to the west of the Pacific (Fig. 12a and c). In contrast, preceding OND SST anomalies for the negative EP phase are in general weaker, with slightly negative ( ∘C) SSTs located off the coast of Peru in the eastern Pacific with warmer waters spreading further east into the central Pacific Ocean (Fig. 12e). Other notable differences between the two centrally focused indices (EN3.4 and CP) and the EP can be found in the sub-tropical to south Atlantic Ocean (20–50∘ S), where cooler (warmer) SSTs are situated for the central ENSO indices (EP index). For EN3.4 and CP negative years, rainfall totals from the ERA5 reanalysis (inputs to GloFAS 2.1) are greater relative to neutral conditions in the north-eastern Amazon (Fig. 12b and d), whereas a deficit in rainfall is acknowledged for the negative EP phase (Fig. 12f), explaining why flood magnitude and duration did not increase for this climate index.
3.4.3 Observed vs. GloFAS 2.1
Significant changes to flood characteristics are present in both datasets for the results presented in Sect. 3. For instance, the increased flood magnitude and duration witnessed during the negative ENSO phase are identified at locations in the north-eastern Amazon for both the observed and reanalysis data, as is the case for the decrease in flood duration witnessed during positive TSA years (Figs. 2b, f and 10c, g). River flow data produced from global hydrological models form an important role in the ability to forecast and mitigate floods (Alfieri et al., 2019). This is because observed data are often limited in time, with a downward trend in global data availability since the 1980s, and has a restricted coverage in many parts of the world (including sparse areas of the Ecuadorian and Colombian Amazon) (Lavers et al., 2020). Though simulated data can extend the period of analysis back in time and have a wide spatial coverage, the data needs to be sufficient and validated against observations regularly. Table 1 shows Pearson's correlation coefficients between the results for observation and GloFAS 2.1 in Sect. 3. It is important to note that both datasets will incur errors that need to be considered. For instance, many gauges in the Amazon basin are produced based on water levels that are converted to river flow based on the use of the stage–discharge relation, which has large uncertainties due to systematic errors such as sensor drift and calibration errors and does not take into account non-stationarities (Horner et al., 2018). Non-stationarities can include anthropogenic change, land use change (e.g. inclusion of a reservoir) and low frequency climate variability (e.g. PDO and AMO) and can therefore can cause gradual or sudden changes in river flow influencing the accuracy of the stage-to-discharge relation and produce uncertainties within the discharge time series. Extreme flows or flooding can result in changes to the morphology, which in turn could affect the accuracy of these measurements and thus conversion and affect both the archived observed time series and the forecasted product (Lavers et al., 2020).
Table 1Pearson's correlation coefficients between observed and GloFAS 2.1 results of the differences between climate phases for all indices (e.g. EN3.4 positive minus EN3.4 neutral) for flood magnitude, timing and duration. Values in bold are significant at the 95 % confidence level.
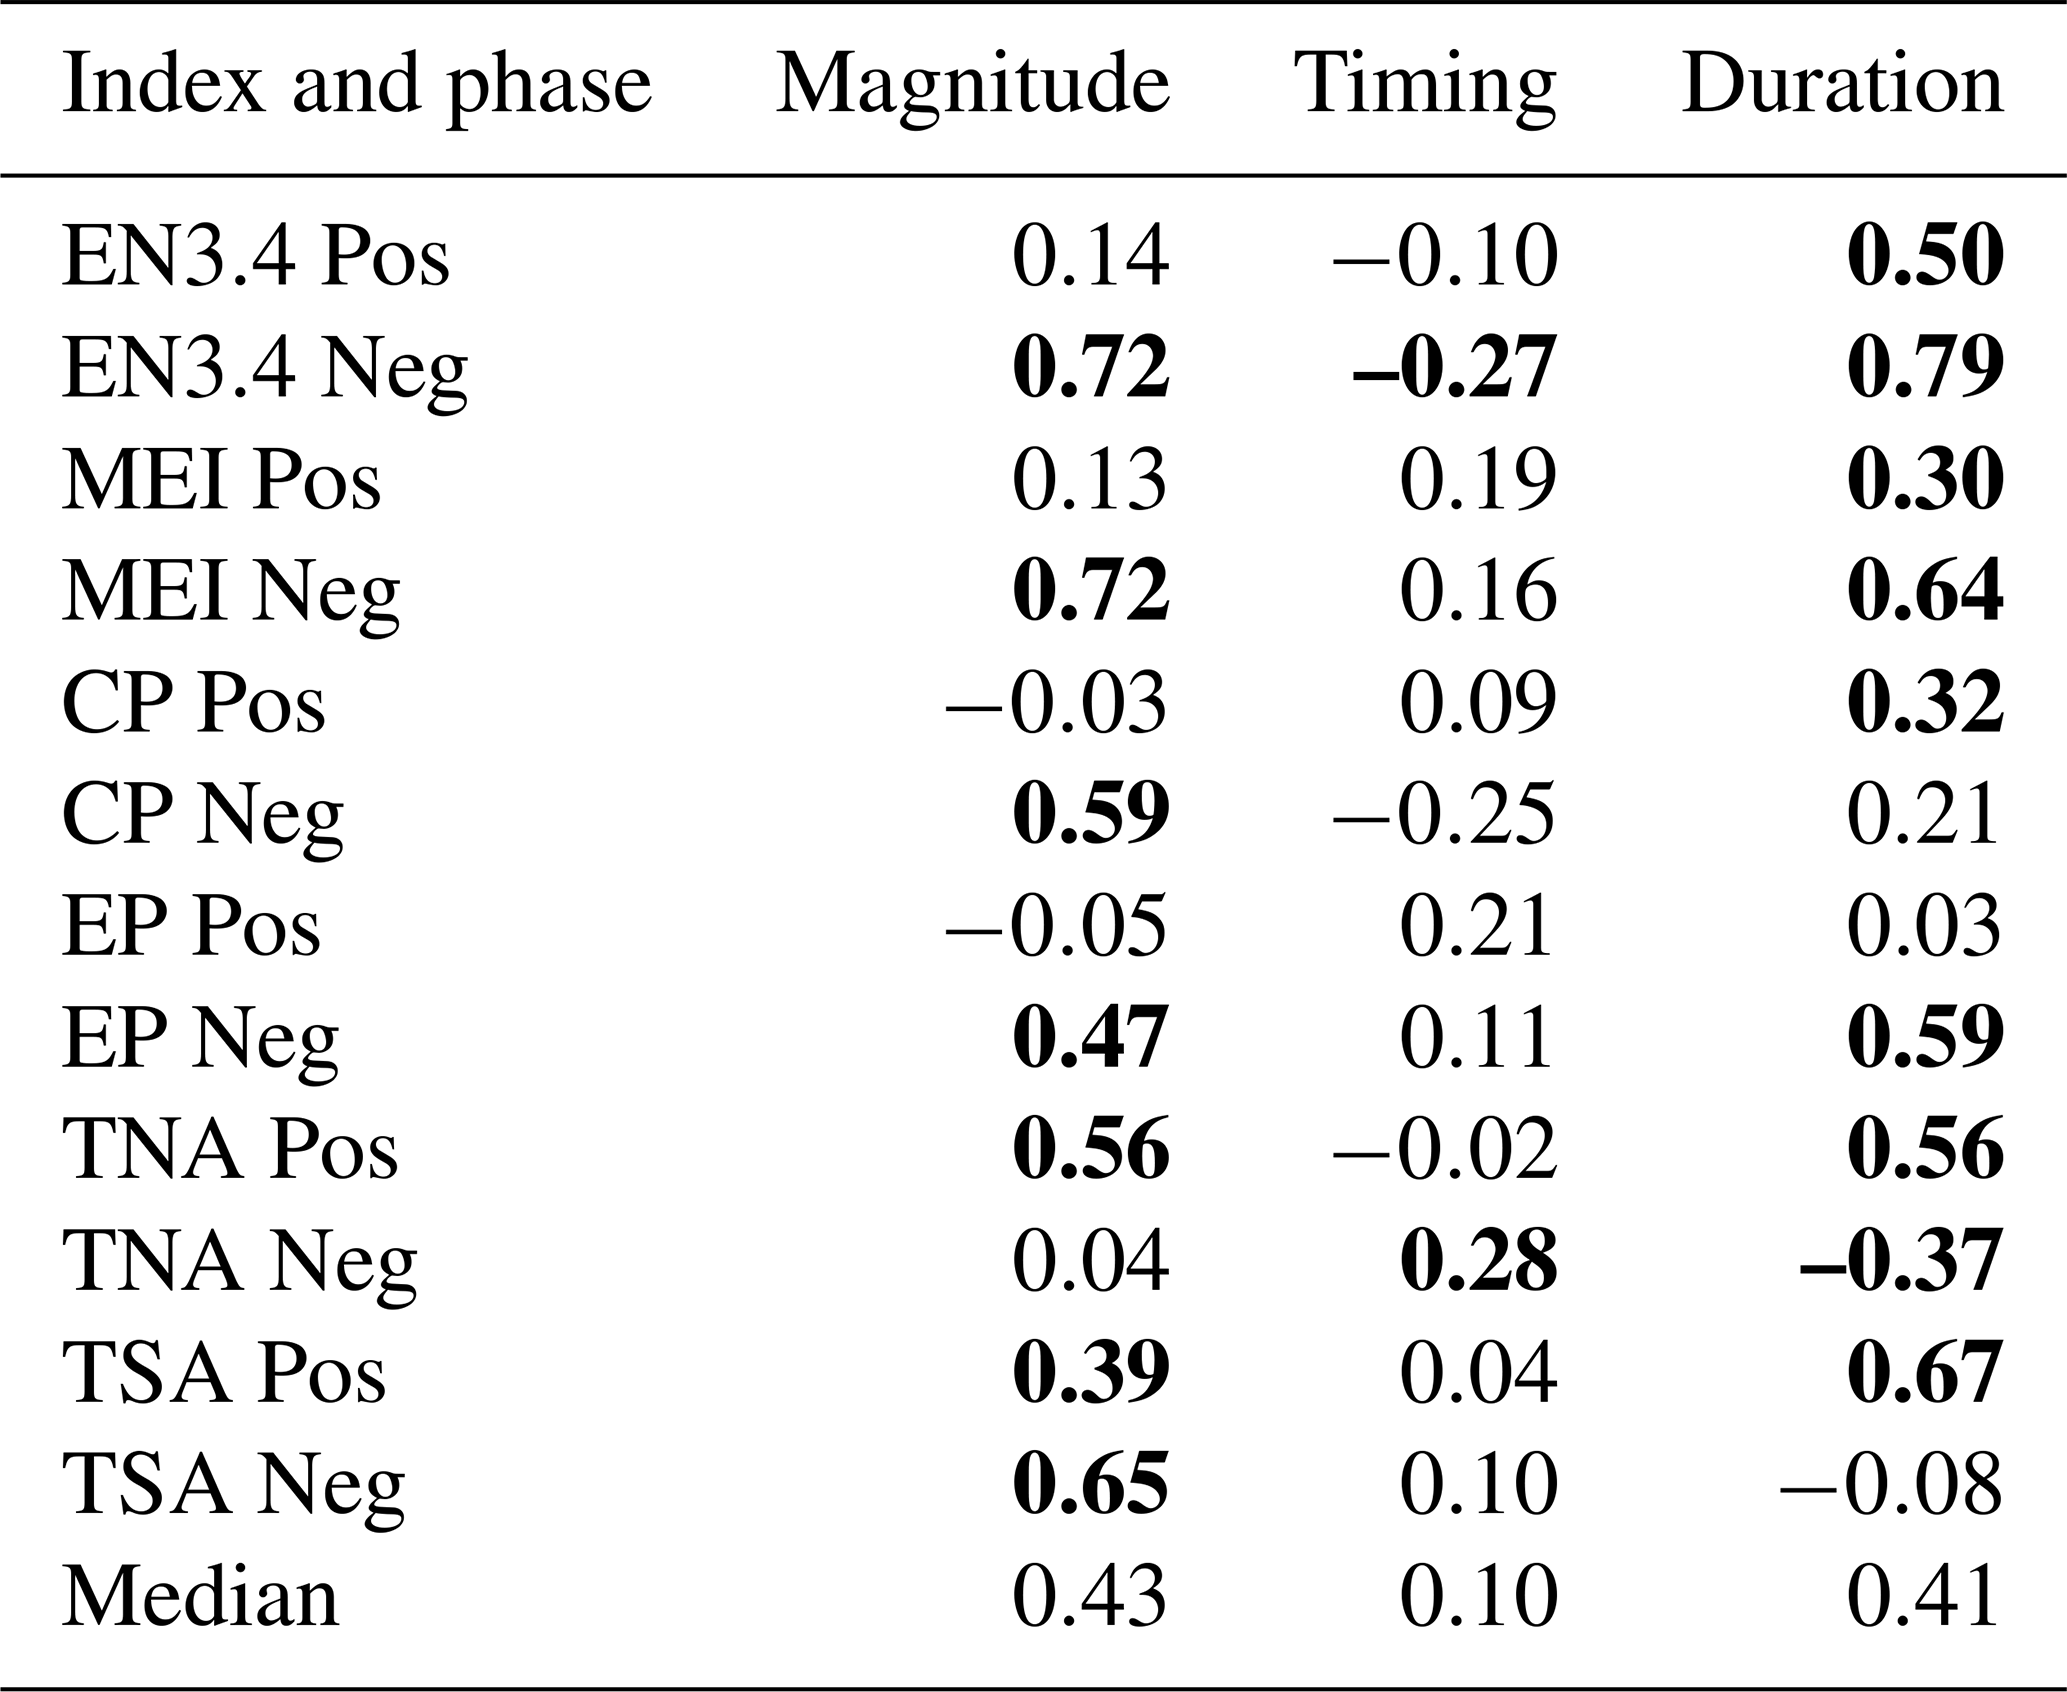
Flood magnitude and duration have the highest correlation between observed and simulated results, where median values of 0.43 and 0.41 (across all climate indices) are noted, respectively. In contrast, correlation for changes in flood timing are particularly weak (median = 0.10), with correlations for only two climate indices found to be significant (Table 1). As GloFAS struggles to capture changes to flood timing for most climate indices and phases, it indicates that the model suffers at capturing peak flow timing in general rather than in one specific climate phase. Though restricted to just 12 years for each climate phase, the correlation for flood magnitude and duration are much higher for the negative phases of the ENSO indices, particularly when compared to the positive phases of these indices. For instance, comparing the correlation values for the percentage changes of flood magnitude, a significant correlation value of 0.72 is identified for the EN3.4 negative, dropping to 0.14 for the warm phase. The reasoning for the poorer performance during the warm ENSO phase is not yet known but deserves further investigation. It is unlikely due to the number of missing years for the observed data, with a median of 2 missing years and 1 missing year across all stations for the positive and negative EN3.4 phases, respectively. When removing the stations in the north-east (39, 40, 41 and 43) that produce strong changes for both datasets during negative ENSO phases, the correlation is much lower but still remains higher than during the positive phase (r=0.41, p<0.05), indicating that GloFAS 2.1 can overall better simulate the response to negative ENSO phases relative to neutral conditions.
In this study the question of whether particular climatic drivers (e.g. ENSO) impact flood characteristics in the Amazon basin was addressed. The next step required would be to investigate how the climatic drivers found in this study increase the likelihood of flooding in particular areas and understanding the physical mechanisms behind a flood event. This is because floods are generated through a combination of climatic, meteorological, hydrological, and anthropogenic processes (Wyżga et al., 2016), which represent a cascading chain of events. For instance, flooding that is related to La Niña conditions stem from changes in temperature, altering pressure gradients and thus large-scale atmospheric circulation (e.g. zonal winds). In turn, this can move the location of moisture convection and divergence, and consequently rainfall patterns. Though a simplistic example, understanding these processes and how they link can allow us to determine how and why floods occur in certain areas and can provide a better understanding of past, present and future flood risk (Berghuijs et al., 2019).
A first step could follow studies such as Zhang et al. (2017) where they use moisture flux convergence and divergence to diagnose precipitation changes during phases of the PMM before describing the impact on other dynamical variables (e.g. 850 hPa velocity potential and divergent wind) for different phases of PMM. By analysing intermediate variables between the overall climatic driver (i.e. PMM) and the dependent variable (i.e. rainfall), a more robust picture of the relationship between a climatic driver and rainfall or river discharge can be built. Moreover, by investigating the underlying connections between the SST anomalies and floods for specific events, it allows a picture to be built of what the dominant processes (e.g. evaporation or convection) are and how the circulation may differ from neutral conditions or other types of events (e.g. how an EP event differs from a CP event). Knowing these dominant processes would give model developers insight on where to focus efforts to improve seasonal forecasting systems. For example, if evaporation is found to be particularly important, calibration of the land surface or hydrological component of a flood model could be a more important aspect to focus on.
This paper has investigated whether the differences between positive, negative and neutral phases of various climate indices in the tropical Pacific and Atlantic Oceans significantly impact flood characteristics (i.e. flood magnitude, timing and duration) in the Amazon basin for the period 1979–2015. Previous research and fieldwork had highlighted the need to consider flood timing and duration as opposed to simply the magnitude of river flows, with longer floods known to cause significant impacts to communities situated along rivers within the basin (Langill and Abizaid, 2019), and that the flood timing in coinciding tributaries is known to impact the magnitude of flow in the main travelling flood wave along the Amazon River (Tomasella et al., 2011; Marengo et al., 2012). While the results presented show regional differences and varying levels of significance among climate indices, we can draw the following conclusions to answer the research objectives outlined in Sect. 1.
-
Flood magnitude increases at stations situated in the north-eastern Amazon for climate indices where the cooling of SST anomalies is stronger in the central equatorial Pacific (i.e. EN3.4, CP and MEI) as identified for both the observed and reanalysis dataset. This response is not reproduced for years in which the SST cooling is more concentrated to the eastern Pacific.
-
Positive ENSO phases (EN3.4 and MEI) result in a reduction of peak river flows and flood duration throughout the majority of the basin, while the influence of negative ENSO phases (i.e. La Niña conditions) are found to be weak across much of the Amazon basin, with the exception of areas in north-east.
-
No significant increases are found in peak river flows in the Peruvian Amazon when comparing negative ENSO phases to neutral conditions, with decreases observed in DOT despite previous extreme floods being attributed to La Niña events.
-
Flood timing is the least impacted flood characteristic, with limited significant and notable changes across the basin for most climate indices.
-
Despite strong links between flood characteristics (e.g. flood magnitude and duration), the same climate phase can impact these characteristics differently. This is evident from the CP index, where flood magnitude increased in the north-eastern Amazon, with flood duration decreasing during negative years.
-
There is greater agreement between the observed and simulated GloFAS 2.1 changes to flood magnitude and duration in negative than positive ENSO phases, suggesting the reanalysis is better at representing La Niña teleconnections.
Insights into the understanding of how large-scale climate variability influences flood characteristics has the potential to help predict and prepare for different flood types (e.g. high, long, early and late; Langill and Abizaid, 2019). These findings are important for highlighting locations such as the north-eastern Amazon that are sensitive to particular oceanic anomalies and has the potential to help community members and local businesses (e.g. fisheries and agriculture) with decision making within the Amazon basin. For example, the results found for the Sao Francisco gauging station (41), located along the Jari River, showed that flood magnitude and duration significantly increase during negative ENSO phases. This gives humanitarian organisations and local authorities acting within areas such as Laranjal do Jari, located just downstream of this gauging station, the potential to use these results to better prepare and make decisions based on an increased probability of a longer high-water period. The next steps should consider specific case studies in locations such as the north-eastern Amazon that evaluate how certain sectors or livelihoods could be affected by certain climate phases and suggest adaptation measures such as examining the possible shifts in cropping patterns (i.e. sowing, growing and harvesting) during particular climate phases as in Ficchí and Stephens (2019) for rivers in Africa. Further exploratory analysis could consider breaking this study down further to consider the intensity of climate anomalies, for example, by comparing differences between weak, medium and strong El Niño events to neutral years. Such work could be extended to investigate the impact of co-occurring climatic phases (e.g. La Niña and a warm TSA) to understand if the probability of wetter or drier conditions changes. This is owed to previous flood events having been linked to more than one index. For instance, in 2014, floods in the Madeira basin were related to both warm conditions in the West Pacific–Indian Ocean and exceptionally warm SST conditions in the sub-tropical South Atlantic (Espinoza et al., 2014). Yoon and Zeng (2010) demonstrate a method to separate indices via linear regression, which can remove the issue of one climate index influencing another to determine if each index has a direct influence on the hydrology. Finally, a similar analysis would ideally be performed for observed precipitation, which could help confirm or further explain the results found in this work.
All of the datasets, with the exception of certain gauged data used in this study, are freely available and their sources can be found in Sect. 2. For gauges whose data are restricted please contact the Institute of Research and Development (IRD) for further information on potential access.
The supplement related to this article is available online at: https://doi.org/10.5194/hess-25-3875-2021-supplement.
AF, EMS, HLC and JT designed the analysis, with AF and EMS providing the original methodology and R scripts for the flood timing section of the analysis. JT produced all figures and undertook the research in addition to writing the manuscript. AF, EMS, HLC, JB and EC supervised the research and provided important advice. All of the authors were involved in discussions throughout the development of the manuscript.
The authors declare that they have no conflict of interest.
Publisher's note: Copernicus Publications remains neutral with regard to jurisdictional claims in published maps and institutional affiliations.
The first author is grateful for additional travel support and funding provided by the Red Cross Red Crescent Climate Centre. A special thanks goes to the observational and national services SO-HYBAM, IRD, SENAMHI, ANA, and INAMHI for providing observed river discharge data and advice throughout the preparation of the manuscript.
This research has been supported by the Natural Environment Research Council (grant no. NE/L002566/1), UK's Natural Environment Research Council (NERC) and the Foreign, Commonwealth & Development Office (FCDO) through FATHUM (Forecasts for AnTicipatory HUManitarian action; grant no. NE/P000525/1).
This paper was edited by Rohini Kumar and reviewed by three anonymous referees.
Alfieri, L., Burek, P., Dutra, E., Krzeminski, B., Muraro, D., Thielen, J., and Pappenberger, F.: GloFAS – global ensemble streamflow forecasting and flood early warning, Hydrol. Earth Syst. Sci., 17, 1161–1175, https://doi.org/10.5194/hess-17-1161-2013, 2013.
Alfieri, L., Zsoter, E., Harrigan, S., Hirpa, F. A., Lavaysse, C., Prudhomme, C., and Salamon, P.: Range-dependent thresholds for global flood early warning, J. Hydrol., 4, 100034, https://doi.org/10.1016/j.hydroa.2019.100034, 2019.
Alizadeh-Choobari, O.: Contrasting global teleconnection features of the eastern Pacific and central Pacific El Niño events, Dynam. Atmos. Oceans, 80, 139–154, https://doi.org/10.1016/j.dynatmoce.2017.10.004, 2017.
Barichivich, J., Gloor, E., Peylin, P., Brienen, R. J., Schöngart, J., Espinoza, J. C., and Pattnayak, K. C.: Recent intensification of Amazon flooding extremes driven by strengthened Walker circulation, Sci. Adv., 4, eaat8785, https://doi.org/10.1126/sciadv.aat8785, 2018.
Berghuijs, W. R., Harrigan, S., Molnar, P., Slater, L. J., and Kirchner, J. W.: The Relative Importance of Different Flood-Generating Mechanisms Across Europe, Water Resour. Res., 55, 4582–4593, https://doi.org/10.1029/2019WR024841, 2019.
Builes-Jaramillo, A., Marwan, N., Poveda, G., and Kurths, J.: Nonlinear interactions between the Amazon River basin and the Tropical North Atlantic at interannual timescales, Clim. Dynam., 50, 2951–2969, https://doi.org/10.1007/s00382-017-3785-8, 2018.
Burn, D. H.: Catchment similarity for regional flood frequency analysis using seasonality measures, J. Hydrol., 202, 212–230, https://doi.org/10.1016/S0022-1694(97)00068-1, 1997.
Coomes, O. T., Lapointe, M., Templeton, M., and List, G.: Amazon river flow regime and flood recessional agriculture: Flood stage reversals and risk of annual crop loss, J. Hydrol., 539, 214–222, https://doi.org/10.1016/j.jhydrol.2016.05.027, 2016.
Coughlan de Perez, E., Stephens, E., Bischiniotis, K., van Aalst, M., van den Hurk, B., Mason, S., Hissan, H., and Pappenberger, F.: Should seasonal rainfall forecasts be used for flood preparedness?, Hydrol. Earth. Syst. Sci., 21, 4517–4524, https://doi.org/10.5194/hess-21-4517-2017, 2017.
Dettinger, M. D. and Diaz, H. F.: Global characteristics of stream flow seasonality and variability, J. Hydrometeorol., 1, 289–310, https://doi.org/10.1175/1525-7541(2000)001<0289:GCOSFS>2.0.CO;2, 2000.
Emerton, R., Cloke, H. L., Stephens, E. M., Zsoter, E., Woolnough, S. J., and Pappenberger, F.: Complex picture for likelihood of ENSO-driven flood hazard, Nat. Commun., 8, 14796, https://doi.org/10.1038/ncomms14796, 2017.
Enfield, D. B.: Relationships of inter-American rainfall to tropical Atlantic and Pacific SST variability, Geophys. Res. Lett., 23, 3305–3308, https://doi.org/10.1029/96GL03231, 1996.
Enfield, D. B., Mestas-Nuñez, A. M., Mayer, D. A., and Cid-Serrano, L.: How ubiquitous is the dipole relationship in tropical Atlantic sea surface temperatures? J. Geophys. Res.-Oceans, 104, 7841–7848, https://doi.org/10.1029/1998JC900109, 1999.
Espinoza, J. C., Guyot, J. L., Ronchail, J., Cochonneau, G., Filizola, N., Fraizy, P., Labat, D., de Oliveira, E., Ordoñez, J. J., and Vauchel, P.: Contrasting regional discharge evolutions in the Amazon basin (1974–2004), J. Hydrol., 375, 297–311, https://doi.org/10.1016/j.jhydrol.2009.03.004, 2009.
Espinoza, J. C., Ronchail, J., Guyot, J. L., Junquas, C., Vauchel, P., Lavado, W., Drapeau, G., and Pombosa, R.: Climate variability and extreme drought in the upper Solimões River (western Amazon Basin): Understanding the exceptional 2010 drought, Geophys. Res. Lett., 38, L13406, https://doi.org/10.1029/2011GL047862, 2011.
Espinoza, J. C., Ronchail, J., Frappart, F., Lavado, W., Santini, W., and Guyot, J. L.: The major floods in the Amazonas River and tributaries (western Amazon basin) during the 1970–2012 period: A focus on the 2012 flood, J. Hydrometeorol., 14, 1000–1008, https://doi.org/10.1175/JHM-D-12-0100.1, 2013.
Espinoza, J. C., Marengo, J. A., Ronchail, J., Carpio, J. M., Flores, L. N., and Guyot, J. L.: The extreme 2014 flood in south-western Amazon basin: the role of tropical-subtropical South Atlantic SST gradient, Environ. Res. Lett., 9, 124007, https://doi.org/10.1088/1748-9326/9/12/124007, 2014.
Espinoza, J. C., Ronchail, J., Marengo, J. A., and Segura, H.: Contrasting North–South changes in Amazon wet-day and dry-day frequency and related atmospheric features (1981–2017), Clim. Dynam., 52, 5413–5430, https://doi.org/10.1007/s00382-018-4462-2, 2019.
Ficchì, A. and Stephens, L.: Climate variability alters flood timing across Africa, Geophys. Res. Lett., 46, 8809–8819, https://doi.org/10.1029/2019GL081988, 2019.
Foley, J. A., Botta, A., Coe, M. T., and Costa, M. H.: El Niño–Southern oscillation and the climate, ecosystems and rivers of Amazonia, Global Biogeochem. Cy., 16, 1132–1144, https://doi.org/10.1029/2002GB001872, 2002.
Fu, R., Zhu, B., and Dickinson, R. E.: How do atmosphere and land surface influence seasonal changes of convection in the tropical Amazon?, J. Climate, 12, 1306–1321, https://doi.org/10.1175/1520-0442(1999)012<1306:HDAALS>2.0.CO;2, 1999.
Fu, R., Dickinson, R. E., Chen, M., and Wang, H.: How do tropical sea surface temperatures influence the seasonal distribution of precipitation in the equatorial Amazon?, J. Climate, 14, 4003–4026, https://doi.org/10.1175/1520-0442(2001)014<4003:HDTSST>2.0.CO;2, 2001.
García-Serrano, J., Cassou, C., Douville, H., Giannini, A., and Doblas-Reyes, F. J.: Revisiting the ENSO teleconnection to the tropical North Atlantic, J. Climate, 30, 6945–6957, https://doi.org/10.1175/JCLI-D-16-0641.1, 2017.
Gutierrez-Cori, O., Espinoza, J. C., Li, L. Z., Wongchuig, S., Arias, P. A., Ronchail, J., and Segura, H.: On the Hydroclimate-Vegetation Relationship in the Southwestern Amazon During the 2000–2019 Period, Front. Water, 3, 648499, https://doi.org/10.3389/frwa.2021.648499, 2021.
Harrigan, S., Zsoter, E., Alfieri, L., Prudhomme, C., Salamon, P., Wetterhall, F., Barnard, C., Cloke, H., and Pappenberger, F.: GloFAS-ERA5 operational global river discharge reanalysis 1979–present, Earth Syst. Sci. Data, 12, 2043–2060, https://doi.org/10.5194/essd-12-2043-2020, 2020.
Hersbach, H., de Rosnay, P., Bell, B., Schepers, D., Simmons, A., Soci, C., Abdalla, S., Alonso-Balmaseda, M., Balsamo, G., Bechtold, P., Berrisford, P., Bidlot, J.-R., de Boisséson, E., Bonavita, M., Browne, P., Buizza, R., Dahlgren, P., Dee, D., Dragani, R., Diamantakis, M., Flemming, J., Forbes, R., Geer, A. J., Haiden, T., Hólm, E., Haimberger, L., Hogan, R., Horányi, A., Janiskova, M., Laloyaux, P., Lopez, P., Muñoz-Sabater, J., Peubey, C., Radu, R., Richardson, D., Thépaut, J.-N., Vitart, F., Yang, X., Zsótér, E., and Zuo, H.: Operational global reanalysis: progress, future directions and synergies with NWP, ERA Report Series 27, ECMWF, Reading, UK, 2018.
Hersbach, H., Bell, B., Berrisford, P., Hirahara, S., Horányi, A., Muñoz-Sabater, J., Nicolas, J., Peubey, C., Radu, R., Schepers, D., Simmons, A., Soci, C., Abdalla, S., Abellan, X., Balsamo, G., Bechtold, P., Biavati, G., Bidlot, J., Bonavita, 10 M., De Chiara, G., Dahlgren, P., Dee, D., Diamantakis, M., Dragani, R., Flemming, J., Forbes, R., Fuentes, M., Geer, A., Haimberger, L., Healy, S., Hogan, R.J., Hólm, E., Janisková, M., Keeley, S., Laloyaux, P., Lopez, P., Lupu, C., Radnoti, G., de Rosnay, P., Rozum, I., Vamborg, F., Villaume, S., and Thépaut, J.-N.: The ERA5 Global Reanalysis, Q. J. Roy. Meteorol. Soc., 146, 1999–2049, https://doi.org/10.1002/qj.3803, 2020.
Hirpa, F. A., Salamon, P., Beck, H. E., Lorini, V., Alfieri, L., Zsoter, E., and Dadson, S. J.: Calibration of the Global Flood Awareness System (GloFAS) using daily streamflow data, J. Hydrol., 566, 595–606, https://doi.org/10.1016/j.jhydrol.2018.09.052, 2018.
Horner, I., Renard, B., Le Coz, J., Branger, F., McMillan, H. K., and Pierrefeu, G.: Impact of stage measurement errors on streamflow uncertainty, Water Resour. Res., 54, 1952–1976, https://doi.org/10.1002/2017WR022039, 2018.
Huang, B., Thorne, P. W., Banzon, V. F., Boyer, T., Chepurin, G., Lawrimore, J. H., Menne, M. J., Smith, T. M., Vose, R. S., and Zhang, H. M.: Extended reconstructed sea surface temperature, version 5 (ERSSTv5): upgrades, validations, and intercomparisons, J. Climate, 30, 8179–8205, https://doi.org/10.1175/JCLI-D-16-0836.1, 2017.
Jimenez, J. C., Marengo, J. A., Alves, L. M., Sulca, J. C., Takahashi, K., Ferrett, S., and Collins, M.: The role of ENSO flavours and TNA on recent droughts over Amazon forests and the Northeast Brazil region, Int. J. Climatol., 41, 3761–3780, https://doi.org/10.1002/joc.6453, 2019.
Langill, J. C. and Abizaid, C. What is a bad flood? Local perspectives of extreme floods in the Peruvian Amazon, Ambio, 49, 1423–1436, https://doi.org/10.1007/s13280-019-01278-8, 2019.
Lavers, D. A., Ramos, M. H., Magnusson, L., Pechlivanidis, I., Klein, B., Prudhomme, C., Arnal, L., Crochemore, L., Van den Hurk, B., Weerts, A. H., Harrigan, S., Cloke, H. L., Richardson, D. S., and Pappenberger, F.: A vision for hydrological prediction, Atmosphere, 11, 237, https://doi.org/10.3390/atmos11030237, 2020.
Liebmann, B. and Marengo, J.: Interannual variability of the rainy season and rainfall in the Brazilian Amazon Basin, J. Climate, 14, 4308–4318, 2001.
Mardia, K. V.: Statistics of directional data, edited by: Birnbaum, E., Academic Press, New York, NY, 1972.
Marengo, J. A.: Interannual variability of surface climate in the Amazon basin, Int. J. Climatol., 12, 853–863, https://doi.org/10.1002/joc.3370120808, 1992.
Marengo, J. A. and Espinoza, J. C.: Extreme seasonal droughts and floods in Amazonia: causes, trends and impacts, Int. J. Climatol., 36, 1033–1050, https://doi.org/10.1002/joc.4420, 2016.
Marengo, J. A., Liebmann, B., Kousky, V. E., Filizola, N. P., and Wainer, I. C.: Onset and end of the rainy season in the Brazilian Amazon Basin, J. Climate, 14, 833–852, 2001.
Marengo, J. A., Tomasella, J., Soares, W. R., Alves, L. M., and Nobre, C. A.: Extreme climatic events in the Amazon basin, Theor. Appl. Climatol., 107, 73–85, https://doi.org/10.1007/s00704-011-0465-1, 2012.
Marengo, J. A., Alves, L. M., Soares, W. R., Rodriguez, D. A., Camargo, H., Riveros, M. P., and Pabló, A. D.: Two contrasting severe seasonal extremes in tropical South America in 2012: flood in Amazonia and drought in northeast Brazil, J. Climate, 26, 9137–9154, https://doi.org/10.1175/JCLI-D-12-00642.1, 2013.
Marengo, J. A., Souza Jr, C. M., Thonicke, K., Burton, C., Halladay, K., Betts, R. A., Alves, L. M., and Soares, W. R.: Changes in climate and land use over the Amazon region: current and future variability and trends, Front. Earth Sci., 6, 228, https://doi.org/10.3389/feart.2018.00228, 2018.
Panisset, J. S., Libonati, R., Gouveia, C. M. P., Machado-Silva, F., França, D. A., França, J. R. A., and Peres, L. F.: Contrasting patterns of the extreme drought episodes of 2005, 2010 and 2015 in the Amazon Basin, Int. J. Climatol., 38, 1096–1104, https://doi.org/10.1002/joc.5224, 2018.
Richey, J. E., Nobre, C., and Deser, C.: Amazon River discharge and climate variability: 1903 to 1985, Science, 246, 101–103, https://doi.org/10.1126/science.246.4926.101, 1989.
Ronchail, J. and Gallaire, R.: ENSO and rainfall along the Zongo valley (Bolivia) from the Altiplano to the Amazon basin, Int. J. Climatol., 26, 1223–1236, https://doi.org/10.1002/joc.1296, 2006.
Ronchail, J., Cochonneau, G., Molinier, M., Guyot, J. L., De Miranda Chaves, A. G., Guimarães, V., and De Oliveira, E.: Interannual rainfall variability in the Amazon basin and sea-surface temperatures in the equatorial Pacific and the tropical Atlantic Oceans, Int. J. Climatol., 22, 1663–1686, https://doi.org/10.1002/joc.815, 2002.
Ronchail, J., Bourrel, L., Cochonneau, G., Vauchel, P., Phillips, L., Castro, A., Guyot, J. L., and De Oliveira, E.: Inundations in the Mamore basin (south-western Amazon – Bolivia) and sea-surface temperature in the Pacific and Atlantic Oceans, J. Hydrol., 302, 223–238, https://doi.org/10.1016/j.jhydrol.2004.07.005, 2005a.
Ronchail, J., Labat, D., Callede, J., Cochonneau, G., Guyot, J. L., Filizola, N., and De Oliveira, E.: Discharge variability within the Amazon basin, Climate variability and Change Hydrological Impacts, IAHS Publ., 296, 21–29, 2005b.
Ronchail, J., Guyot, J. L., Villar, J. C. E., Fraizy, P., Cochonneau, G., and Ordenez, J.: Impact of the Amazon tributaries on major flood in Óbidos, in: Procceedings of the Fifth FRIEND World Conference held at Havana, Cuba, November 2006), IAHS Publ., 308, 220–225, 2006.
Ronchail, J., Espinoza, J. C., Drapeau, G., Sabot, M., Cochonneau, G., and Schor, T.: The flood recession period in Western Amazonia and its variability during the 1985–2015 period, J. Hydrol.: Reg. Stud., 15, 16–30, https://doi.org/10.1016/j.ejrh.2017.11.008, 2017.
Satyamurty, P., da Costa, C. P. W., Manzi, A. O., and Candido, L. A.: A quick look at the 2012 record flood in the Amazon Basin, Geophys. Res. Lett., 40, 1396–1401, https://doi.org/10.1002/grl.50245, 2013.
Schöngart, J. and Junk, W. J.: Forecasting the flood-pulse in Central Amazonia by ENSO-indices, J. Hydrol., 335, 124–132, https://doi.org/10.1016/j.jhydrol.2006.11.005, 2007.
Shimizu, M. H., Ambrizzi, T., and Liebmann, B.: Extreme precipitation events and their relationship with ENSO and MJO phases over northern South America, Int. J. Climatol., 37, 2977–2989, https://doi.org/10.1002/joc.4893, 2017.
Silvério, D. V., Brando, P. M., Macedo, M. N., Beck, P. S., Bustamante, M., and Coe, M. T.: Agricultural expansion dominates climate changes in southeastern Amazonia: the overlooked non-GHG forcing, Environ. Res. Lett., 10, 104015, https://doi.org/10.1088/1748-9326/10/10/104015, 2015.
Stephens, E., Day, J. J., Pappenberger, F., and Cloke, H.: Precipitation and floodiness, Geophys. Res. Lett., 42, 10316–10323, https://doi.org/10.1002/2015GL066779, 2015.
Sulca, J., Takahashi, K., Espinoza, J. C., Vuille, M., and Lavado‐Casimiro, W.: Impacts of different ENSO flavors and tropical Pacific convection variability (ITCZ, SPCZ) on austral summer rainfall in South America, with a focus on Peru, Int. J. Climatol., 38, 420–435, https://doi.org/10.1002/joc.5185, 2018.
Takahashi, K., Montecinos, A., Goubanova, K., and Dewitte, B.: ENSO regimes: Reinterpreting the canonical and Modoki El Niño, Geophys. Res. Lett., 38, 1–5, https://doi.org/10.1029/2011GL047364, 2011.
Tomasella, J., Borma, L. S., Marengo, J. A., Rodriguez, D. A., Cuartas, L. A., A Nobre, C., and Prado, M. C.: The droughts of 1996–1997 and 2004–2005 in Amazonia: hydrological response in the river main-stem, Hydrol. Process., 25, 1228–1242, https://doi.org/10.1002/hyp.7889, 2011.
Towner, J., Cloke, H. L., Zsoter, E., Flamig, Z., Hoch, J. M., Bazo, J., Coughlan de Perez, E., and Stephens, E. M.: Assessing the performance of global hydrological models for capturing peak river flows in the Amazon basin, Hydrol. Earth Syst. Sci., 23, 3057–3080, https://doi.org/10.5194/hess-23-3057-2019, 2019.
Towner, J., Cloke, H. L., Lavado, W., Santini, W., Bazo, J., Coughlan de Perez, E., and Stephens, E. M.: Attribution of Amazon floods to modes of climate variability: A review, Meteorol. Appl., 27, e1949, https://doi.org/10.1002/met.1949, 2020.
van Der Knijff, J. M., Younis, J., and De Roo, A. P. J.: LISFLOOD: a GIS-based distributed model for river basin scale water balance and flood simulation, Int. J. Geogr. Inf. Sci., 24, 189–212, https://doi.org/10.1080/13658810802549154, 2010.
Wolter, K. and Timlin, M.: Monitoring ENSO in COADS with a seasonally adjusted principal component index, in: Proc. of the 17th Climate Diagnostics Workshop, NOAA/N MC/CAC, NSSL, Oklahoma Clim. Survey, CIMMS and the School of Meteor., Univ. of Oklahoma, Norman, OK, 52–57, 1993.
Wolter, K. and Timlin, M. S.: Measuring the strength of ENSO events: How does 1997/98 rank?, Weather, 53, 315–324, https://doi.org/10.1002/j.1477-8696.1998.tb06408.x, 1998.
Wolter, K. and Timlin, M. S.: El Niño/Southern Oscillation behaviour since 1871 as diagnosed in an extended multivariate ENSO index (MEI. ext), Int. J. Climatol., 31, 1074–1087, https://doi.org/10.1002/joc.2336, 2011.
Wyżga, B., Kundzewicz, Z. W., Ruiz-Villanueva, V., and Zawiejska, J.: Flood generation mechanisms and changes in principal drivers, in: Flood Risk in the Upper Vistula Basin, Springer, Cham, Switzerland, 2016.
Yin, L., Fu, R., Zhang, Y. F., Arias, P. A., Fernando, D. N., Li, W., Fernandes, K., and Bowerman, A. R. What controls the interannual variation of the wet season onsets over the Amazon?, J. Geophys. Res.-Atmos., 119, 2314–2328, https://doi.org/10.1002/2013JD021349, 2014.
Yoon, J. H.: Multi-model analysis of the Atlantic influence on Southern Amazon rainfall, Atmos. Sci. Lett., 17, 122–127, https://doi.org/10.1002/asl.600, 2016.
Yoon, J. H. and Zeng, N.: An Atlantic influence on Amazon rainfall, Clim. Dynam., 34, 249–264, https://doi.org/10.1007/s00382-009-0551-6, 2010.
Zajac, Z., Revilla-Romero, B., Salamon, P., Burek, P., Hirpa, F. A., and Beck, H.: The impact of lake and reservoir parameterization on global streamflow simulation, J. Hydrol., 548, 552–568, https://doi.org/10.1016/j.jhydrol.2017.03.022, 2017.
Zeng, N., Yoon, J. H., Marengo, J. A., Subramaniam, A., Nobre, C. A., Mariotti, A., and Neelin, J. D.: Causes and impacts of the 2005 Amazon drought, Environ. Res. Lett., 3, 014002, https://doi.org/10.1088/1748-9326/3/1/014002, 2008.
Zhang, W., Villarini, G., and Vecchi, G. A.: Impacts of the Pacific meridional mode on June–August precipitation in the Amazon river basin, Q. J. Roy. Meteorol. Soc., 143, 1936–1945, https://doi.org/10.1002/qj.3053, 2017.
Zsoter, E., Cloke, H., Stephens, E., de Rosnay, P., Muñoz-Sabater, J., Prudhomme, C., and Pappenberger, F.: How well do operational Numerical Weather Prediction configurations represent hydrology?, J. Hydrometeorol., 20, 1533–1552, https://doi.org/10.1175/JHM-D-18-0086.1, 2019.