the Creative Commons Attribution 4.0 License.
the Creative Commons Attribution 4.0 License.
 | 02 Jul 2021
The evolution of stable silicon isotopes in a coastal carbonate aquifer on Rottnest Island, Western Australia
Ashley N. Martin
Karina Meredith
Andy Baker
Marc D. Norman
Eliza Bryan
Dissolved silicon (dSi) is a key nutrient in the oceans, but data regarding Si isotopes in coastal aquifers are not widely available. Here we investigate the Si isotopic composition of 12 fresh and 16 saline groundwater samples from Rottnest Island, Western Australia, which forms part of the world's most extensive aeolianite deposit (the Tamala Limestone formation). In total, two bedrock samples were also collected from Rottnest Island for Si isotope analysis. The δ30Si values of groundwater samples ranged from −0.4 ‰ to +3.6 ‰ with an average +1.6 ‰, and the rock samples were −0.8 ‰ and −0.1 ‰. The increase in δ30Si values in fresh groundwater is attributed to the removal of the lighter Si isotopes into secondary minerals and potentially also adsorption onto Fe (oxy)hydroxides. The positive correlations between δ30Si values and dSi concentrations (ρ = 0.59; p = 0.02) and δ30Si values and Cl, but not dSi and Cl concentrations, are consistent with vertical mixing between the younger fresh groundwater and the deeper groundwater, which have undergone a greater degree of water–rock interactions. This has produced a spatial pattern in δ30Si across the aquifer due to the local hydrogeology, resulting in a correlation between δ30Si and tritium activities when considering all groundwater types (ρ = −0.68; p = 0.0002). In the deeper aquifer, the inverse correlation between dSi and Cl concentrations (ρ = −0.79; p = 0.04) for the more saline groundwater is attributed to groundwater mixing with local seawater that is depleted in dSi (< 3.6 µM). Our results from this well-constrained island aquifer system demonstrate that stable Si isotopes usefully reflect the degree of water–aquifer interactions, which is related to groundwater residence time and local hydrogeology. Our finding that lithogenic Si dissolution occurs in the freshwater lens and the freshwater–seawater transition zone on Rottnest Island appears to supports the recent inclusion of a marine–submarine groundwater discharge term in the global dSi mass balance. Geologically young carbonate aquifers, such as Rottnest Island, may be an important source of dSi in coastal regions with low riverine input and low oceanic dSi concentrations.
- Article
(4039 KB) - Full-text XML
-
Supplement
(49 KB) - BibTeX
- EndNote


Dissolved silicon (Si(OH)4; dSi) is a key nutrient in global biogeochemical cycles that is sourced primarily from continental silicate weathering (Tréguer et al., 1995; Tréguer and De La Rocha, 2013; Rahman et al., 2017; Rahman et al., 2019; Frings et al., 2016). Thus, the dSi flux from the continents is a key control on primary productivity in the global biogeochemical cycles of the oceans (Falkowski et al., 1998). Stable silicon isotopes (28Si, 29Si and 30Si) are useful for tracing the rate and extent of silicate weathering reactions due to the preferential incorporation of lighter Si isotopes into during clay mineral formation (Frings et al., 2015; Pogge von Strandmann et al., 2012; Hughes et al., 2013; Georg et al., 2009a, 2007), silica precipitation (Geilert et al., 2014; Oelze et al., 2015) and the adsorption of Si onto Fe–Al (oxy)hydroxides (Opfergelt et al., 2009, 2017). Biological processes also fractionate Si isotopes as dSi is utilised by organisms such as diatoms and vascular plants (Ding et al., 2008; De La Rocha et al., 1998; Meyerink et al., 2017). Moreover, Si isotopes are not fractionated during congruent mineral dissolution, and there is a narrow range of 30Si values for the upper continental crust (UCC), i.e. −0.3 ± 0.2 ‰ (2 standard deviations – SDs; Savage et al., 2013). Therefore, dSi isotopic ratios may reflect the balance between congruent silicate dissolution and secondary mineral formation such that, if the global Si budget is well constrained, marine Si isotope records may be used to reconstruct past changes in continental weathering and primary productivity (Frings et al., 2016; De La Rocha et al., 1998; Christina et al., 2000).
The global dSi isotopic budget is poorly constrained for groundwater systems (Frings et al., 2016), despite around half of the total dissolved solids (TDSs) flux to the oceans deriving from submarine groundwater discharge (SGD; Zektser and Loaiciga, 1993). Globally, average dissolved δ30Si values in low-temperature groundwater systems (+0.2 ± 0.8 ‰) are lower than those in rivers (+1.3 ± 0.7 ‰; 1 SD; Frings et al., 2016). Similarly, groundwater fluxes from other key marine weathering proxies such as Mg, Ca and Sr also exhibit distinct isotopic compositions from global riverine averages (Mayfield et al., 2021). The lower δ30Si values in some groundwater systems may be due to the greater extent of water–rock interactions compared to surface waters and the dissolution of 30Si-depleted secondary minerals (Basile-Doelsch et al., 2005; Georg et al., 2009b; Pogge von Strandmann et al., 2014). The δ30Si values reported for groundwater dSi are highly variable even within a single system, e.g. ranging from −0.15 ‰ to +1.34 ‰ at various depths in the alluvial Bengal Basin aquifer in India (Georg et al., 2009a), +0.4 ‰ to +1.0 ‰ for volcanic springs in Iceland (Opfergelt et al., 2011), −1.4 ‰ to +0.6 ‰ in a sandstone aquifer in Arizona, USA (Georg et al., 2009b) and −1.5 ‰ to −0.9 ‰ in the sedimentary Great Artesian Basin, Australia (Pogge von Strandmann et al., 2014). In a sandy coastal aquifer, a large gradient was found between the δ30Si values of the fresh groundwater (+1.0 ‰) and seawater (+3.0 ‰; Ehlert et al., 2016). Although ∼ 12 % of the global SGD flux flows through carbonate aquifers (Beck et al., 2013), these systems have received little attention thus far. This is because carbonates are not expected to contain much Si; however, some carbonate-dominated aquifers contain copious amounts of silica-bearing material of various origins, e.g. alluvial, aeolian, pedogenic, etc. (Muhs, 2017).
Here we present Si isotopic compositions of groundwater from a coastal carbonate aquifer, Rottnest Island (RI), Australia. There is a freshwater lens on RI located above a ∼ 10 m freshwater–seawater transition zone (Playford et al., 1977). Conventional stable isotope data (2H, 13C and 18O), tritium (3H) and radiocarbon (14C) measurements show that the freshwater lens aquifer on RI is recharged by modern rainfall, which fluctuates due to climatic variations, and that the residence time for fresh groundwater ranges from ∼ 12 to 36 years (Bryan et al., 2020). The stable isotope and major element (Mg and Ca) geochemistry of fresh RI groundwater is dominated by carbonate weathering reactions (Bryan et al., 2017). Carbonate weathering processes are not expected to affect groundwater δ30Si values due to the low Si incorporation into the carbonate minerals, e.g. the dSi partition coefficient for precipitated calcite is ∼ 0.001 (Hu et al., 2005), and the low ratio for the acid-soluble component of the aquifer bedrock (Martin et al., 2020). A biological influence on groundwater δ30Si values is probably not important for the RI fresh groundwater because (1) the area above the freshwater lens is sparsely vegetated due to land clearing and contains no surface water features, (2) the salt lakes (located to the east of the freshwater lens) that host diatom communities are not hydrologically connected to the groundwater system (Bryan et al., 2016), and (3) there is no reported occurrence of biogenic opal in the Tamala Limestone (Semeniuk and Semeniuk, 2006; Hearty and O'Leary, 2008). In contrast, trace elements, such as strontium (Sr) and lithium (Li), are derived mainly from the dissolution of silicate minerals found within carbonate aeolianite matrix of the RI aquifer (Martin et al., 2020). Moreover, this fresh groundwater on RI is saturated with respect to quartz, and its Li isotopic composition suggests that water–aquifer interactions with secondary minerals occur in the shallow aquifer (Martin et al., 2020). Deeper in the aquifer on RI, there is saline groundwater that has undergone a greater degree of seawater mixing Bryan et al. (2017). This saline RI groundwater has lower δ7Li values relative to fresh RI groundwater, suggesting that it is interacting with the silicate basement rocks (Martin et al., 2020). Here we assess the application of Si isotopes as a weathering proxy in a carbonate-dominated aquifer with well-constrained hydrogeochemical parameters for fresh and saline groundwater combined with bedrock data. This study presents the first Si isotope measurements in a carbonate island aquifer system and provides insights into subsurface weathering processes on a high spatial resolution scale. We also assess the potential contributions of carbonate-dominated aquifers to the global Si isotope budget of the oceans.
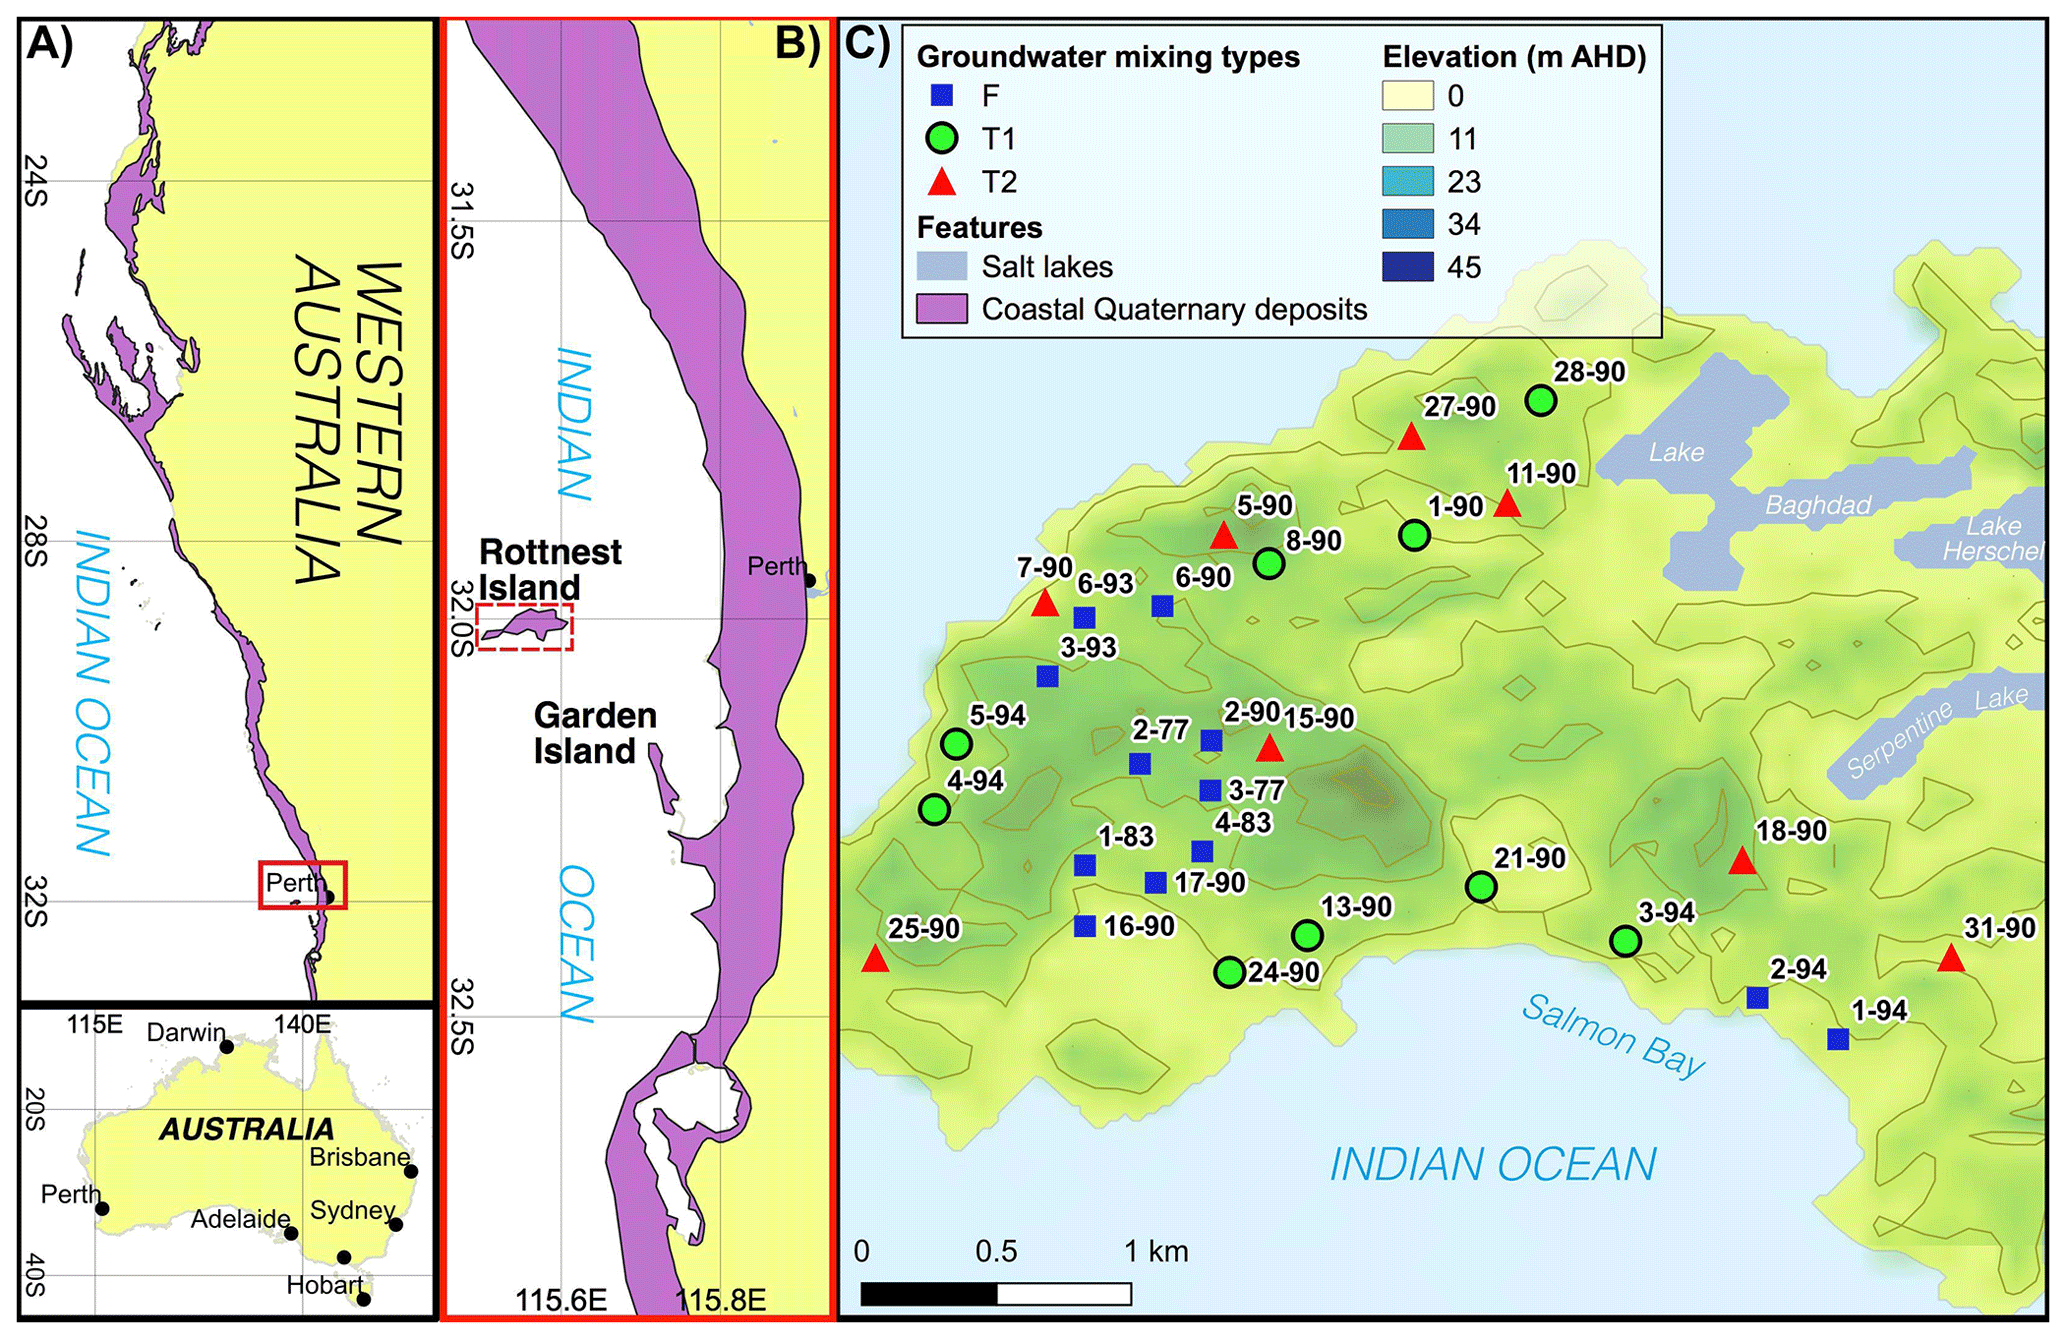
Figure 1(a, b) Maps showing the locations of coastal Quaternary deposits in Western Australia (Stewart et al., 2008). (c) A digital elevation model of RI, Australia, showing sampling locations and IDs (modified from Martin et al., 2020). Groundwater classification types are defined according to Bryan et al. (2017), and underlined sample IDs represent bores with available groundwater residence times modelled by Bryan et al. (2020). The red dashed line in C shows the location of the cross section shown in Fig. 2.
The surface features, hydrogeology, climate and geology of Rottnest Island (RI) have been characterised by Bryan et al. (2016, 2017, 2020) and are summarised here. Briefly, RI is a ∼ 19 km2 island located 18 km from Perth, Australia. The maximum elevation on RI is ∼ 45 m according to the Australian Height Datum (AHD; Fig. 1). European settlement on RI in the 1830s reduced the native vegetation cover, but revegetation has commenced on the island, except for the area above a freshwater lens located in the central part of the island to increase the groundwater recharge there. Sand dunes are a common feature on RI, and there is an absence of water courses. There are a number of hypersaline lakes at sea level (Playford and Leech, 1977) and lower-salinity waterbodies in inter-dunal wetlands on RI (Gouramanis et al., 2012).
The main lithology on RI is the Tamala Limestone, which is a ∼ 115 m thick Late Quaternary carbonate aeolianite that lies unconformably upon Cretaceous fluvial sandstone beds (Playford et al., 1976). The Tamala Limestone deposit on RI forms part of the world's longest (∼ 1000 km) carbonate aeolianite formation along the western Australian coastline (Brooke, 2001). The silicate content of Tamala Limestone on RI ranges from 1 wt % to 6 wt % and mostly comprises quartz sand grains, which is representative of other aeolianites globally (Muhs, 2017). The carbonate minerals present in Tamala Limestone include aragonite, pure calcite, low-Mg calcite and high-Mg calcite (Martin et al., 2020).
The climate on RI is Mediterranean with hot–dry summers, and mild–wet winters. The annual average rainfall (1880–2015 CE) is 691 mm, and the annual reference evapotranspiration is 1694 mm, but rainfall on RI has been below average since the 1960s. The majority of groundwater recharge occurs during large precipitation events in winter. The freshwater lens on RI is located above a ∼ 10 m freshwater–seawater transition zone within the upper section of the Tamala Limestone (Playford et al., 1977). Since the late 1970s, the extent of the freshwater lens has decreased due to a decrease in rainfall, resulting in seawater intrusion into the freshwater lens (Bryan et al., 2016). Sea level high stands (∼ 2 m higher than at present) at ∼ 7 ka (Coshell and Rosen, 1994) and 4.4 ka (Gouramanis et al., 2012) would have probably intruded seawater into the groundwater system. Cations adsorbed onto the aquifer matrix during previous or ongoing seawater intrusion episodes may, therefore, be a source of dissolved solids to groundwater wells through cation exchange processes.
The studied groundwater were grouped into three mixing types on the basis of their depth and hydrogeochemical properties, namely fresh, transition zone 1 (T1) and transition zone 2 (T2; Table A.1; Bryan et al., 2017). Fresh groundwater is shallow (above −1 m AHD), has low TDS values (< 1 g L−1), Cl concentrations from ∼ 3 to 8 mM and is expected to be younger (ca. < 0.5 ka), with tritium (3H) and radiocarbon (14CDOC) values of > 0.6 TU (tritium units) and > 89 pMC (percent modern carbon), respectively; moreover, lumped parameter modelling suggests that the mean residence time for fresh groundwater ranges from ∼ 12 to 36 years (Bryan et al., 2020). In contrast, the T2 groundwater is the deepest studied here (−5 to −15 m AHD), has higher TDS (7 to 30 g L−1), Cl concentrations from ∼ 97 to 561 mM and is estimated to be older (ca. 3–7 ka), with 3H and 14CDOC values of < 0.3 TU and < 67 pMC, respectively. The T1 groundwater is located at depths between the fresh groundwater and T2 groundwater (−1 to −5 m AHD) and has an intermediate composition due to mixing between fresh groundwater and T2 groundwater caused by seasonal groundwater-level fluctuations.
3.1 Sample collection
The groundwater sampling protocols are described in detail by Martin et al. (2020). Briefly, 28 groundwater samples were collected from RI during two field campaigns in September 2014 and March 2015 (Fig. 1). Samples were collected at, or just above, the well screen at the bottom of each well (maximum length = 1.5 m). Prior to sample collection, the monitoring and production wells were purged until the in-field parameters stabilised. A seawater sample was collected from the shoreline using a peristaltic pump (Masterflex E/S portable sampler).
The rock and soil samples were collected from RI in March 2017. The rock sample (RI-B01) was sampled from an outcrop at Salmon Bay (32∘00′46′′ S, 115∘30′33′′ E). Only visibly unweathered material was sampled after removing weathered material using a geological hammer. The soil (RI-S01) was sampled from an unvegetated ridge with an actively forming dune in the centre of RI, corresponding to the area above the freshwater lens (32∘00′19′′ S, 115∘29′48′′ E; Fig. 1).
3.2 Analytical techniques
The concentrations of Si, other major elements and selected trace elements used in this paper were determined by Bryan et al. (2016) and Martin et al. (2020) at the Australian Nuclear Science and Technology Organisation (ANSTO) by ion chromatography and inductively coupled plasma–atomic emission spectroscopy. The accuracy of cations and anions measurements was evaluated using the charge balance error, with 80 % of the samples falling within ± 5 % and all samples falling within ± 6.2 %, which is much greater than the uncertainty than the analytical precision of measurements.
Silicon isotope column chromatography procedures were conducted in clean laboratories at ANSTO. Acids used in all procedures were high-purity SEASTAR™ instrument quality (IQ) grade hydrochloric acid (HCl) and nitric acid (HNO3). These were further purified prior to use by sub-boiling, using Savillex PFA distillation apparatus, and were stored in Nalgene® FEP bottles. Dilutions were conducted using > 18.2 MΩ cm (at 25 ∘C) Milli-Q water. Acid concentrations were determined by titration with sodium hydroxide. Column chromatography was conducted using 1.8 mL Bio-Rad Laboratories, Inc. 50W-X8 (100–200) cation exchange resin packed in Bio-Rad 0.8 cm × 4 cm polypropylene microcolumns based on the one-step procedure from Georg et al. (2006). Prior to loading the samples on columns, the resin and columns were cleaned with 3 mL of 3 M HCl, 6 M HCl, 7 M HNO3, 10 M HCl, 6 M HCl and 3 M HCl (18 mL acid in total) and conditioned with 6 mL of Milli-Q water. An appropriate volume of sample containing 7.2 µg of Si was loaded and eluted using Milli-Q water. Column calibration experiments ensured 100 % Si yield, which was accomplished by elution with 4 mL of Milli-Q water. The Si fractions were collected in Savillex PFA vials, evaporated to incipient dryness on a hotplate at 80 ∘C and then redissolved in 2 mL of 2 % () HNO3 whilst monitoring for the formation of insoluble precipitates, which was not observed. This method yielded samples with a Si concentration of 3.6 ppm (parts per million) for isotopic analysis. As a secondary check on the column yield, the columns were eluted with a further 2 mL of Milli-Q water after collecting the Si fraction and acidified for screening during multicollector–inductively coupled plasma mass spectrometer (MC-ICP-MS) analyses. Solid samples (RI-B01 and RI-S01) and isotopic reference materials NBS-28 (quartz sand) and IRMM-018a (silica sand) were dissolved by alkali fusion to avoid using hydrofluoric acid. Approximately 10 mg of material was added to a platinum (Pt) crucible, and the following reagents were added: 40 mg of LiBO2 (Sigma Aldrich; American Chemical Society reagent, > 98.0 % purity) as a fluxing agent and 100 mg of NaNO3 (Sigma Aldrich; ReagentPlus®, > 99.0 %) as an oxidising agent. A procedural blank for the alkali fusion method was also prepared. This mixture was then placed in a preheated muffle furnace at 950∘C using Pt-clad tongs for 40 min before switching off the furnace and leaving it to cool overnight. The fusion cakes were then dissolved in 3 mL of 6 M HNO3 and transferred to 50 mL centrifuge tubes and diluted to a Si concentration of ∼ 100 ppm. The dissolved reference materials and blank solution were then processed through the column chemistry in the same manner as for samples.
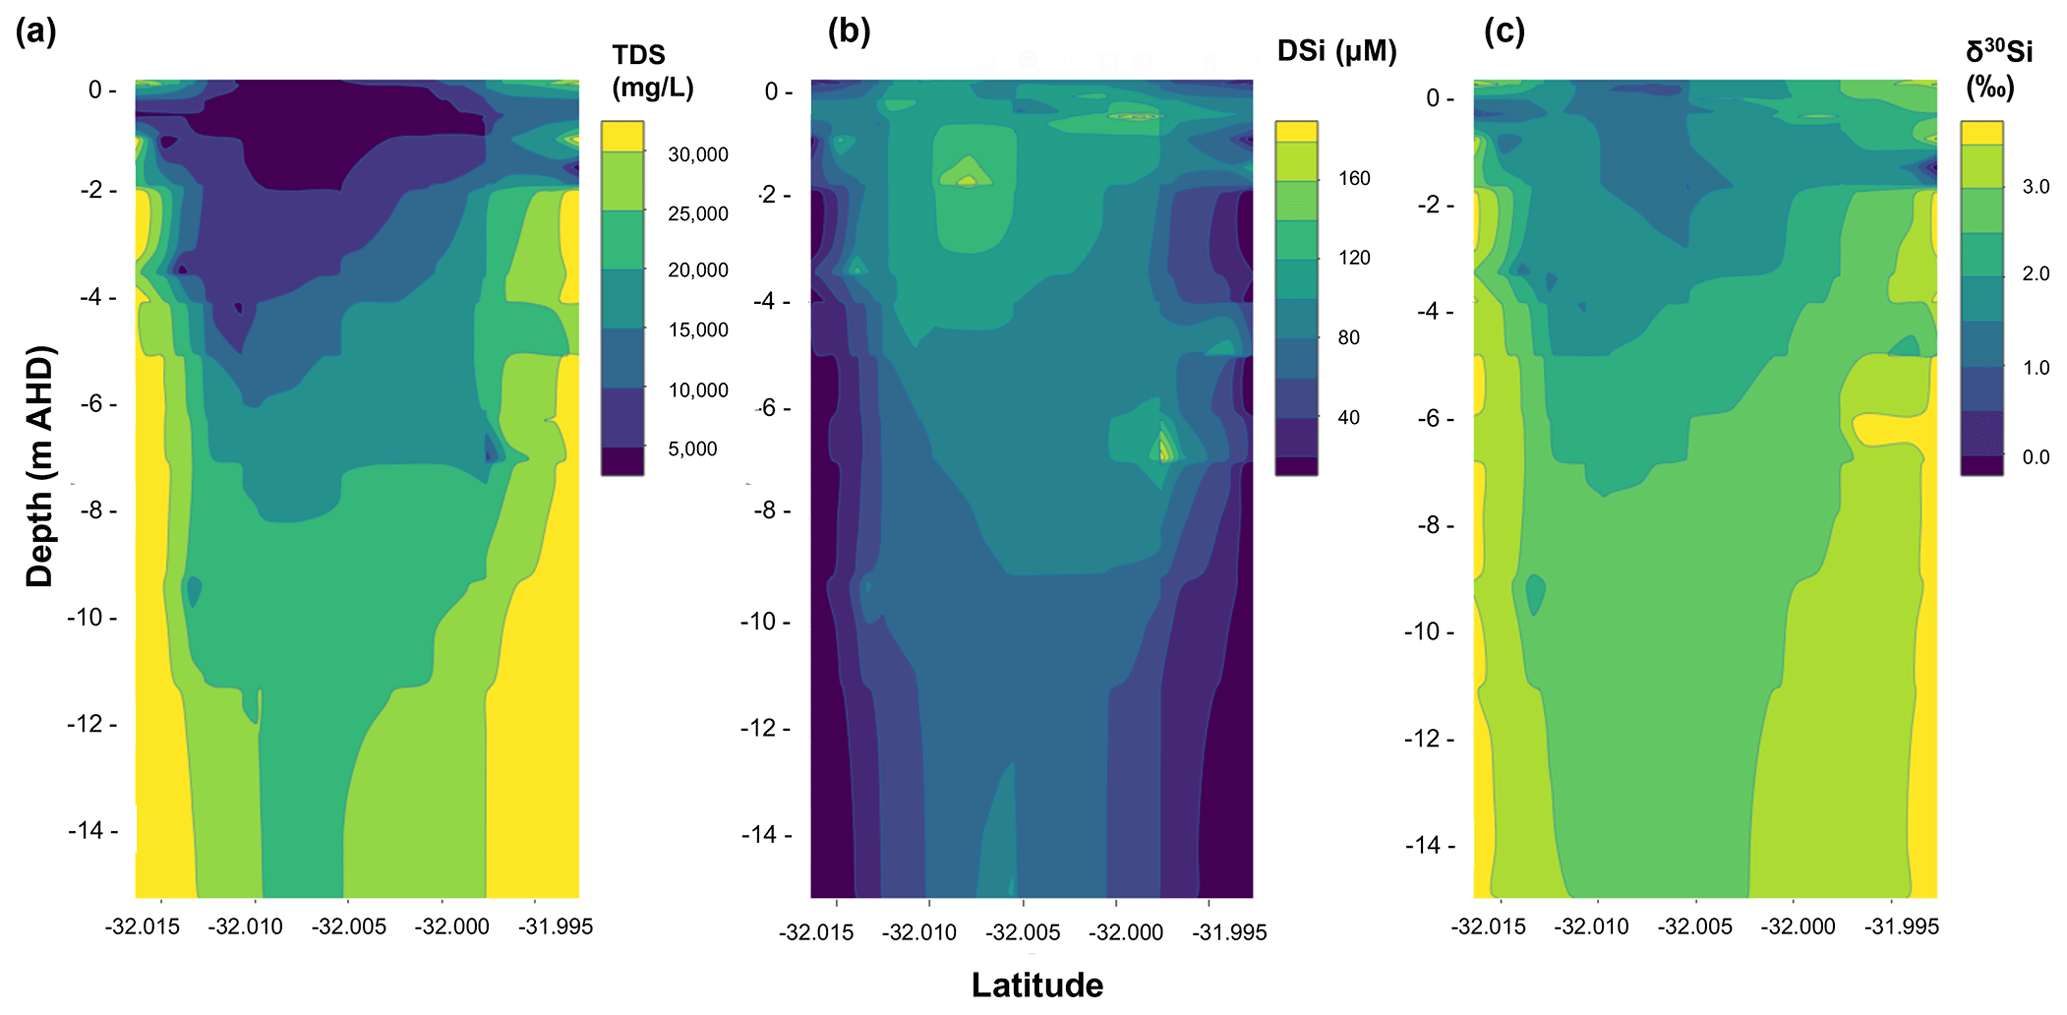
Figure 2Gridded contour maps for a north–south transect of the aquifer on Rottnest Island, including data from all groundwater samples showing (a) TDS (total dissolved solids) values, (b) dSi concentrations and (c) δ30Si values for groundwater as a function of depth and latitude in decimal degrees. The grids were created by interpolating groundwater data from their coordinates and depth using the loess function in the base package of the statistical programming language R, which is a non-parametric approach that fits multiple regressions within a given range.
The intensities of 28Si, 29Si and 30Si were analysed by MC-ICP-MS, using a Thermo Scientific Neptune Plus™ in medium-resolution mode (M/ΔM ≈ 2000) at the Research School of Earth Sciences (RSES), Australian National University (ANU), following the analytical setup of Wille et al. (2010). Briefly, the MC-ICP-MS was operated in dry plasma mode using an ESI Apex nebuliser with a Teflon inlet system, a demountable torch fitted with an alumina injector and standard Ni sampler and skimmer cones. Prior to commencing sample measurements in each analytical session, the instrument was left to stabilise for 2–3 h, and the instrument tuning settings were optimised for signal stability and sensitivity (typically ∼ 7 V ppm−1). An external standard–sample–standard bracketing approach was employed to correct measured isotopic ratios for the mass-dependent sensitivity of Si isotopes during the MC-ICP-MS analyses (Albarède and Beard, 2004). Corrected Si isotopic ratios of samples are presented in per mille as variations of quartz sand isotopic reference material NBS 28 ( = +0.02), where δ29Si = [] × 1000 and δ30Si = [] × 1000. Silica sand IRMM-018a was analysed as an unknown standard and had a δ30Si value of −1.52 ± 0.12 ‰ (n = 5, 2 SD), which is within error of previously measured values (Ziegler et al., 2010; Baronas et al., 2018; Geilert et al., 2020). A plot of δ30Si vs. δ29Si confirms that all samples plot on the mass-dependent fractionation line to yield a fractionation factor (β) of 0.516 ± 0.010 (Fig. A.1). Unfortunately, the uncertainty on β does not permit us to discriminate between kinetic and equilibrium fractionation, which have β values of 0.509 and 0.518, respectively (Frings et al., 2016). The total procedural blanks from alkali fusion and column chemistry and acidified Milli-Q water samples eluted after collecting the Si fraction during column chemistry (to assess column yield) were assessed during the MC-ICP-MS analyses. The 30Si signal intensities for these solutions could not be distinguished for the background measured in 2 % () HNO3, which is typically < 130 mV compared to standard and sample intensities of ∼ 25 V. Thus, the blank contribution was less than 0.3 %, and all Si loaded onto the columns was eluted in the Si fraction.
The groundwater sampling (e.g. pH, TDS and DO), geochemical (e.g. Ca, Mg and Cl concentrations; δ18O and δ13C) and radiometric data (3H, 14CDIC and 14CDOC) for our samples were described in detail by Bryan et al. (2016, 2017) and are provided in Table S1. Samples were classified as either fresh groundwater or T1- or T2-type groundwater (Bryan et al., 2017) on the basis of their hydrogeochemical properties, and these definitions are used throughout this paper. Isotopic compositions are phrased in terms of δ30Si, acknowledging that this is a mass-dependent effect on all Si isotopes.
Table 1The dSi concentrations and isotopic ratios and for groundwater and a seawater sample from Rottnest Island.
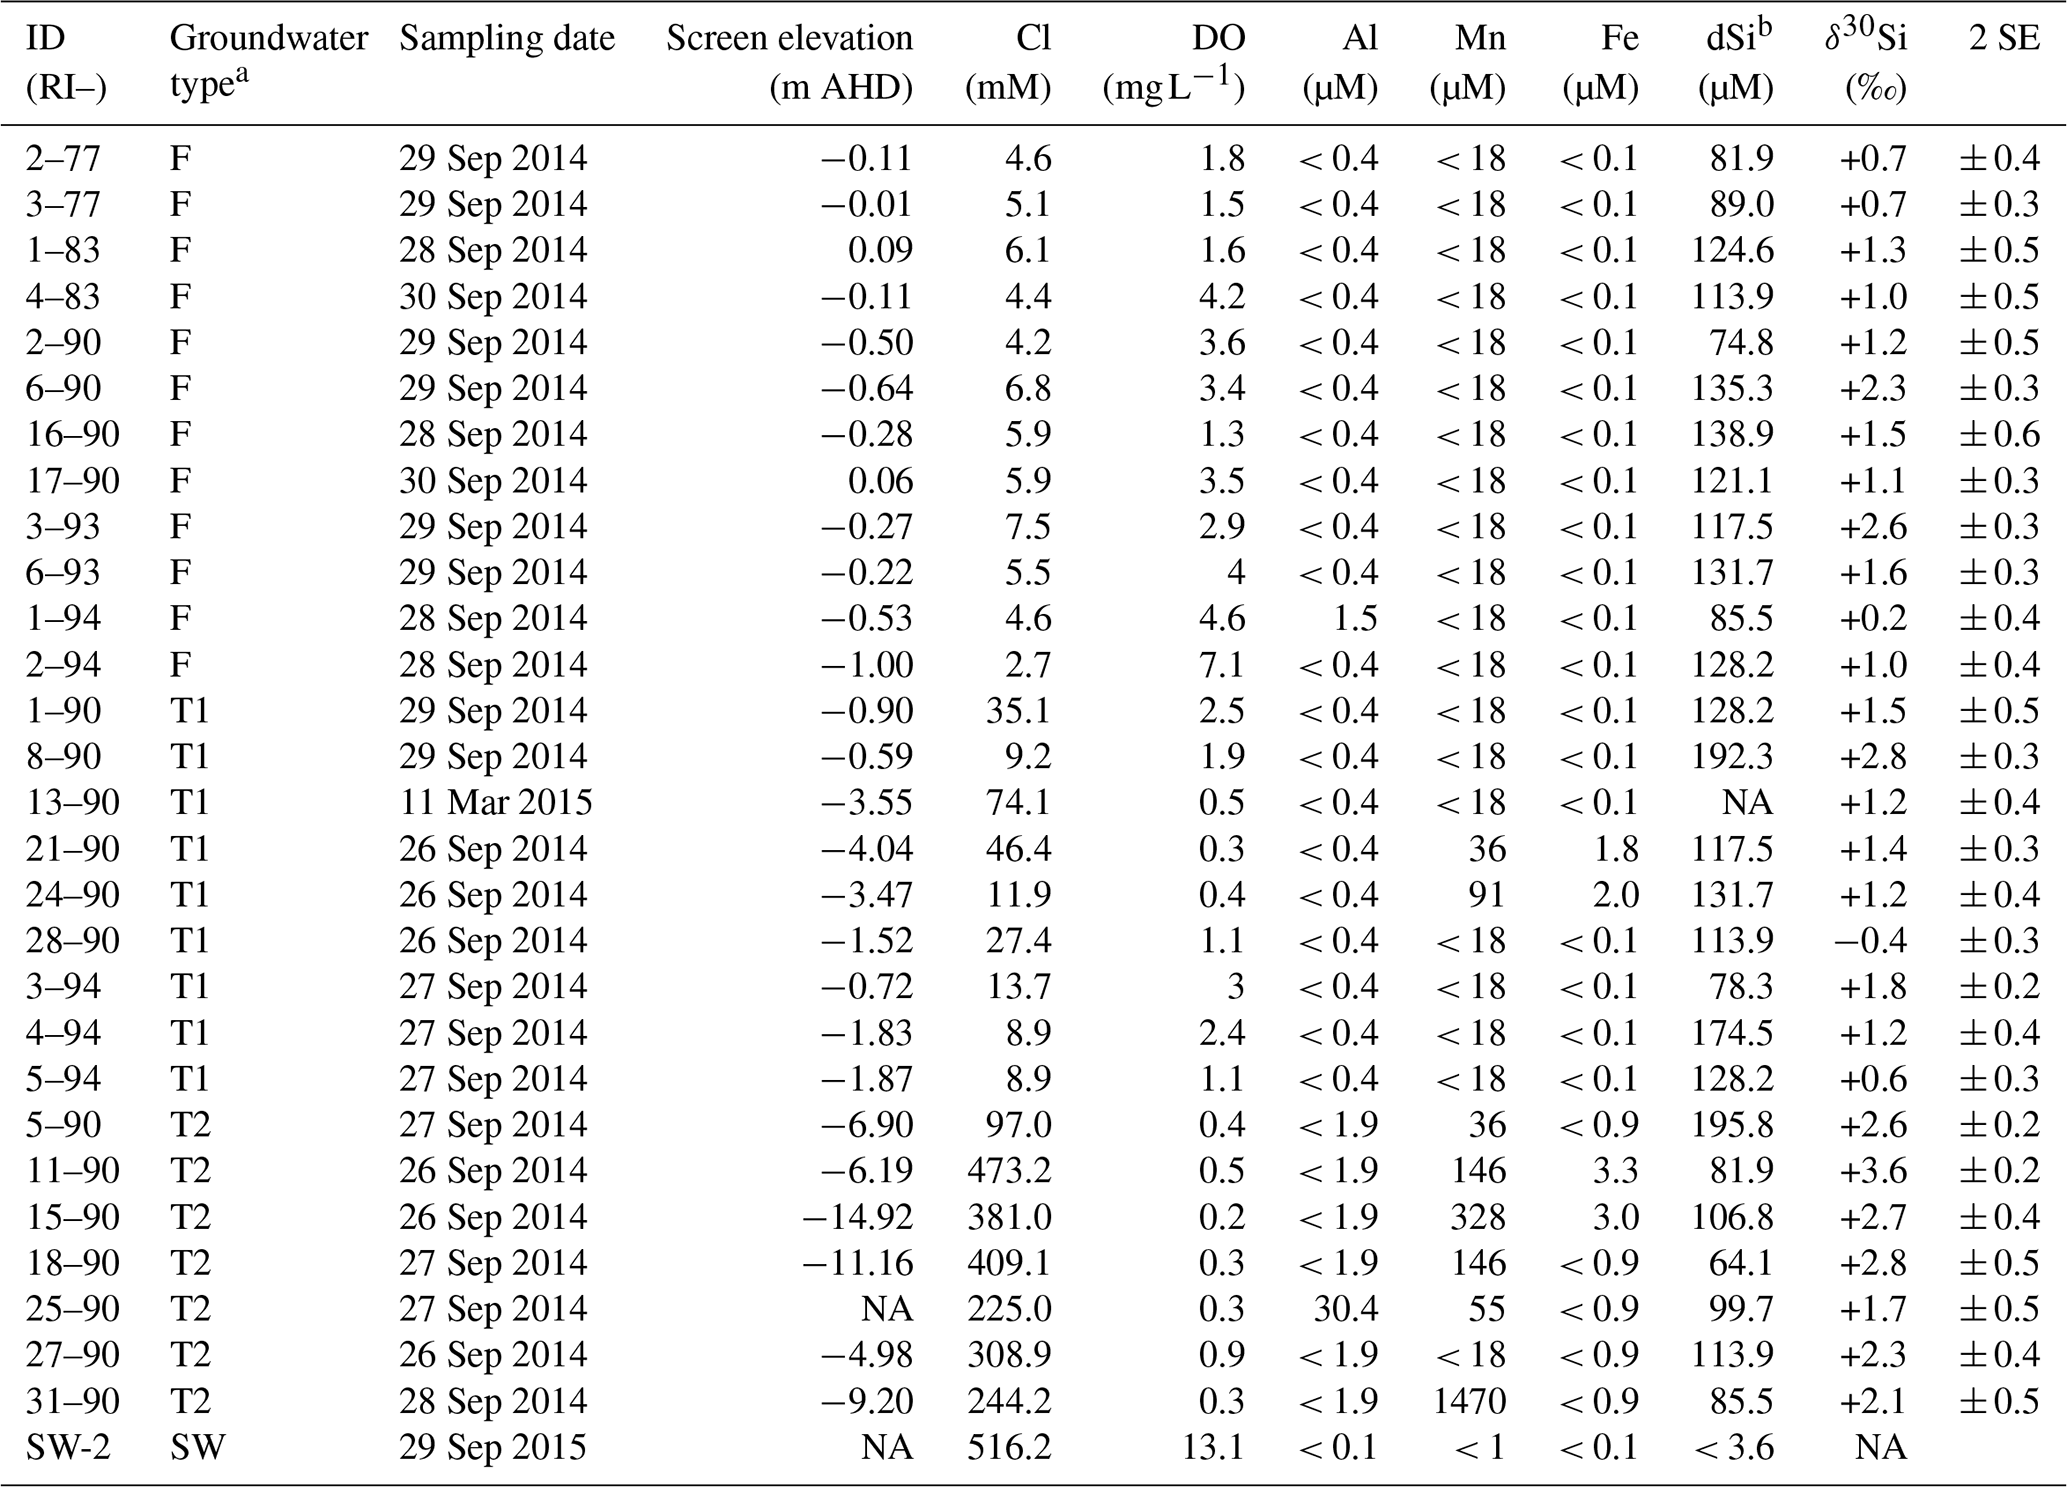
a Defined by Bryan et al. (2017; see Table A.1). b Measured by Martin et al. (2020). Note: SE – standard error; NA – not available.
The dSi concentrations of the RI groundwater ranged from 64 to 196 µM (Table 1), with an average value of 117 µM. The average value on RI is slightly higher than the average for coastal carbonate aquifers globally (80 ± 63 µM; 1 SD; Rahman et al., 2019) but much lower than the average values for other coastal aquifers, e.g. igneous (604 ± 192 µM; 1 SD) and complex mixed lithology aquifers (288 ± 245 µM; 1 SD; Rahman et al., 2019). Although the groundwater TDS values broadly increased with depth for the fresh (< 1 g L−1), T1 (1 to 5 g L−1) and T2 groundwater (> 5 g L−1; Fig. 2a), there was no correlation between dSi concentrations and depth or salinity for the fresh groundwater and T1 groundwater (Fig. 2b). However, when adopting a significance level threshold of p = 0.05, the deeper T2 groundwater exhibited a significant inverse correlation between dSi concentrations and Cl concentrations (ρ = −0.79, p = 0.04 and n = 5; Fig. 3a). Moreover, the dSi concentrations of the T1 groundwater (133 ± 36 µM – average; 1 SD) were higher (p = 0.0002) than those of the fresh groundwater (112 ± 23 µM – average; 1 SD) and the T2 groundwater (107 ± 43 µM – average; 1 SD; p = 0.001) according to the Mann–Whitney U test, which is a non-parametric test suitable for comparing for independent variables with small sample sizes. Although 13-90 was collected in a different field campaign (March 2015), there is no clear effect of seasonality on the Si data, and this is not discussed further in the paper. Moreover, lumped parameter modelling by Bryan et al. (2020) showed that the mean residence times of fresh groundwater is ∼ 40 years, and no seasonal variations in groundwater geochemistry are to be expected.
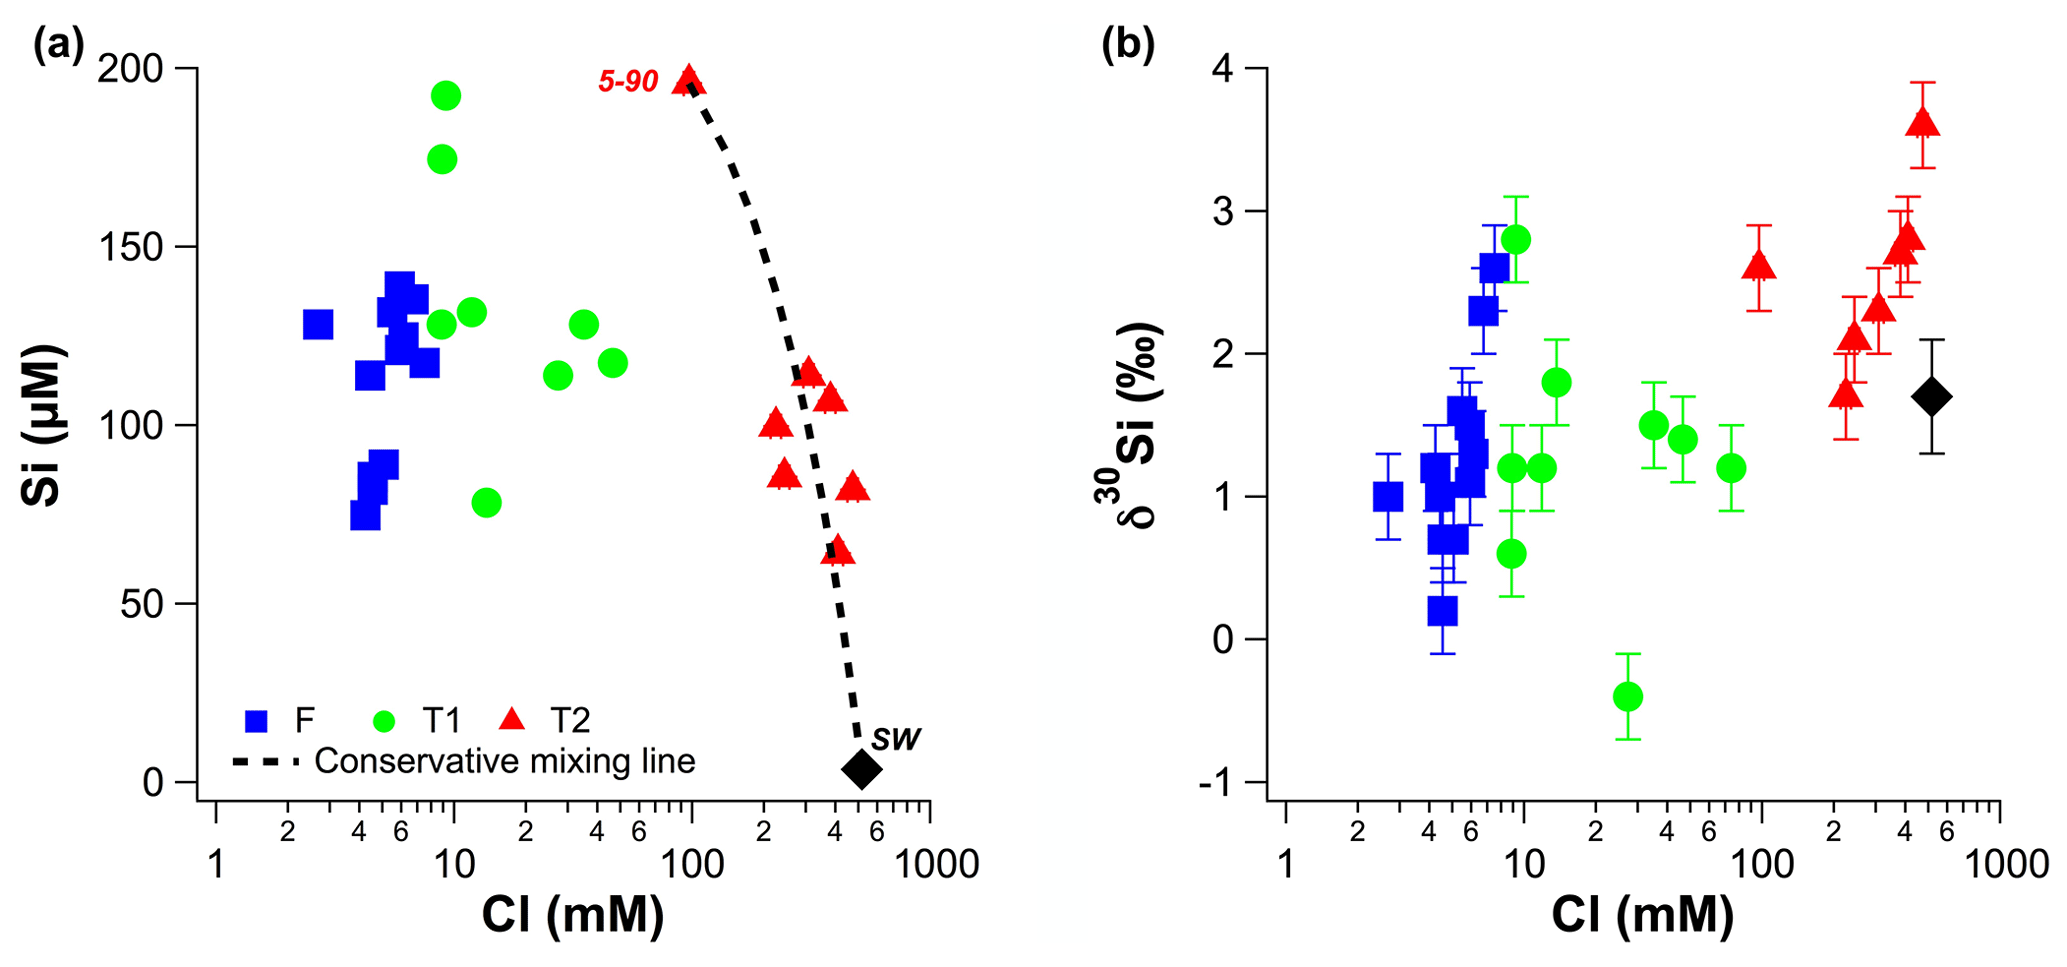
Figure 3(a) Molar dSi concentrations as a function of molar Cl concentrations. (b) δ30Si values as a function of molar Cl concentrations. The dashed line in (a) represents theoretical mixing between local seawater and the T2 groundwater with the highest dSi concentration (well 5–90).
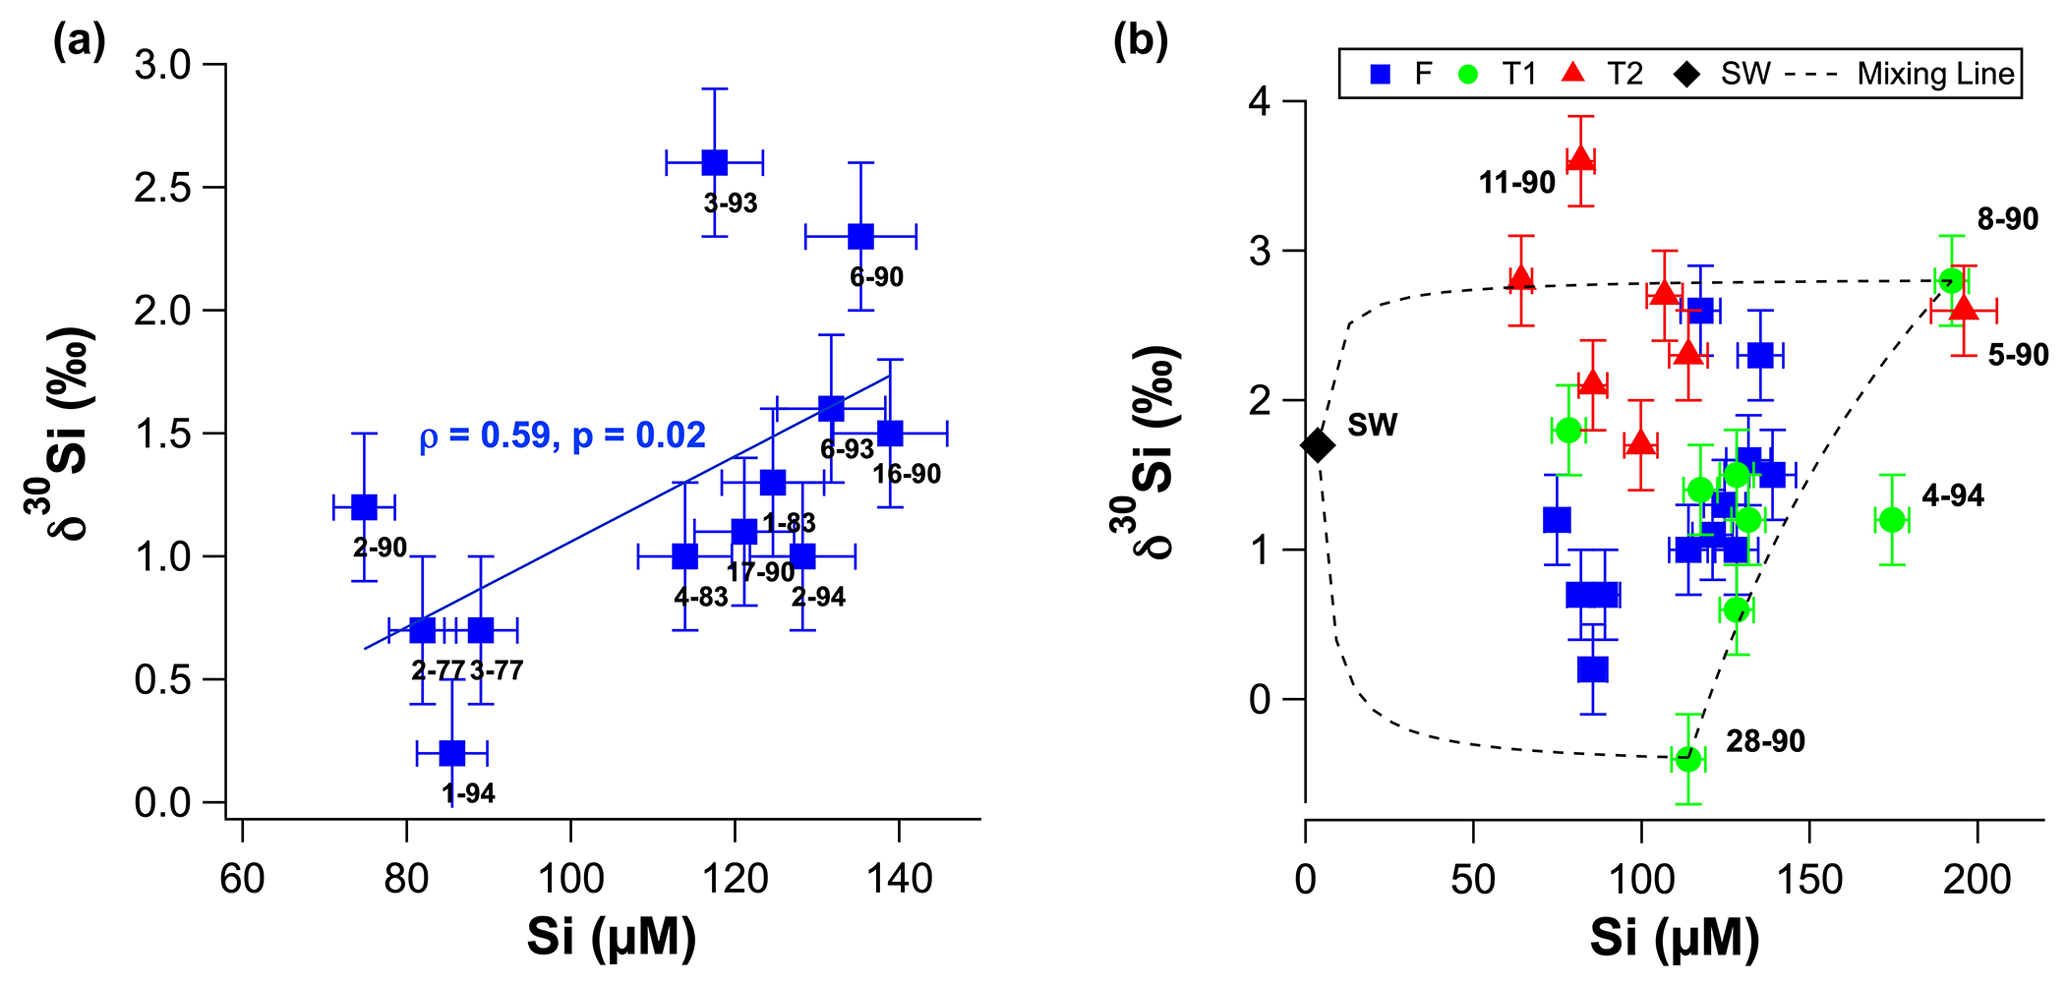
Figure 4(a) Groundwater δ30Si values as a function of molar dSi concentrations for fresh groundwater. (b) Groundwater δ30Si values as a function of molar dSi concentrations T1 (green circles) and T2 groundwater (red triangles). Black dashed lines represent theoretical mixing between seawater, well 8–90 and well 28–90. The seawater δ30Si value was assumed to be +1.7 ‰, based on the average value for the low-concentration seawater sample from Grasse et al. (2017). Sample IDs are shown next to markers for all samples in (a) and selected samples in (b).
The groundwater Al concentrations were < 0.4 or < 1.9 µM, except for 1–94 and 25–90 (1.5 and 30.4 µM, respectively; Table 1). Similarly, Fe concentrations were < 0.9 µM for most groundwater, except some T1- (21–90 and 24–90) and T2 groundwater (11–90 and 15–90; Table 1). The groundwater Mn concentrations were < 18 µM) for all fresh groundwater and most T1 groundwater (except 21–90 and 24–90) but higher Mn concentrations were found for the deeper T2 groundwater (36 to 1470 µM), except for 27–90 (< 18 µM). The high Mn concentration for T2 groundwater 31–90 (1470 µM) greatly differs from the average groundwater Mn concentration (98 ± 282 µM; 1 SD) and may be considered as an outlier. When excluding 31–90 as an outlier and fresh groundwater with low Fe and Mn concentrations, there is a significant correlation between Mn and Fe concentrations (ρ = 0.82, p = .0004 and n = 14).
The δ30Si values of RI groundwater ranged from −0.4 ± 0.3 ‰ to +3.6 ± 0.2 ‰, with an average of +1.6 ± 0.9 ‰ (1 SD; n = 28; Table 1). The δ30Si values in the fresh RI groundwater (+0.2 ± 0.4 ‰ to +2.6 ± 0.3 ‰) extended to a slightly higher range than those of some continental aquifers (+0.1 ‰ to +1.7 ‰; Georg et al., 2009a; Opfergelt et al., 2011), and there was an absence of very low δ30Si values (less than −1.0 ‰), which have been found in some continental aquifers (Georg et al., 2009b; Pogge von Strandmann et al., 2014). In contrast to the wide range of δ30Si values measured for the fresh RI groundwater, fresh groundwater from the quartz-rich, sandy barrier island aquifer of Spiekeroog, northern Germany, exhibited homogeneous δ30Si values of +1.0 ± 0.2 ‰ (Ehlert et al., 2016). The δ30Si values for the shallower fresh groundwater (+1.3 ± 0.7 ‰ – average; 1 SD) and T1 groundwater (+1.3 ± 0.9 ‰ – average; 1 SD) could not be distinguished according to a Mann–Whitney U test (p = 0.749); however, the δ30Si values for the deeper T2 groundwater (+2.6 ± 0.6 ‰ – average; 1 SD) were resolvedly higher than both the fresh groundwater (p = 0.003) and the T1 groundwater (p = 0.009). There was a statistically significant correlation between δ30Si values and Cl concentrations for the fresh RI groundwater (ρ = 0.73, p = 0.008 and n = 10) but not for the T1 and T2 groundwater (ρ = −0.64, p = 0.11 and n = 5; Fig. 3b). For the fresh groundwater, δ30Si values correlated with dSi concentration (ρ = 0.59, p = 0.02 and n = 9; Fig. 4a), but this correlation was not found for the T1 or T2 groundwater (Fig. 4b). Interestingly, the fresh groundwater with the lowest δ30Si value (1–94; +0.2 ‰) also exhibited the highest Al concentration (1.5 µM), and similarly, the T2 groundwater with the highest Al concentration (25–90; 30 µM) also had the lowest δ30Si value (+1.7 ‰). There were no correlations between the dSi and δ30Si values of RI groundwater with Mn or Fe concentrations, respectively.
A previous study measured the ratios and δ7Li values of the RI groundwater (Martin et al. 2020). These values ranged from 0.709167 to 0.709258 (0.709192 – average; n = 19) and +14.5 ‰ to +36.3 ‰ (+29.8 ± 5.9 ‰ – average; 1 SD; n = 23; see Table S1 for individual values), respectively. No correlations were found between the δ30Si values, ratios and δ7Li values of the RI groundwater
Table 2Silicon concentrations, Si isotope ratios and XRD data* for bulk rock samples from Rottnest Island.
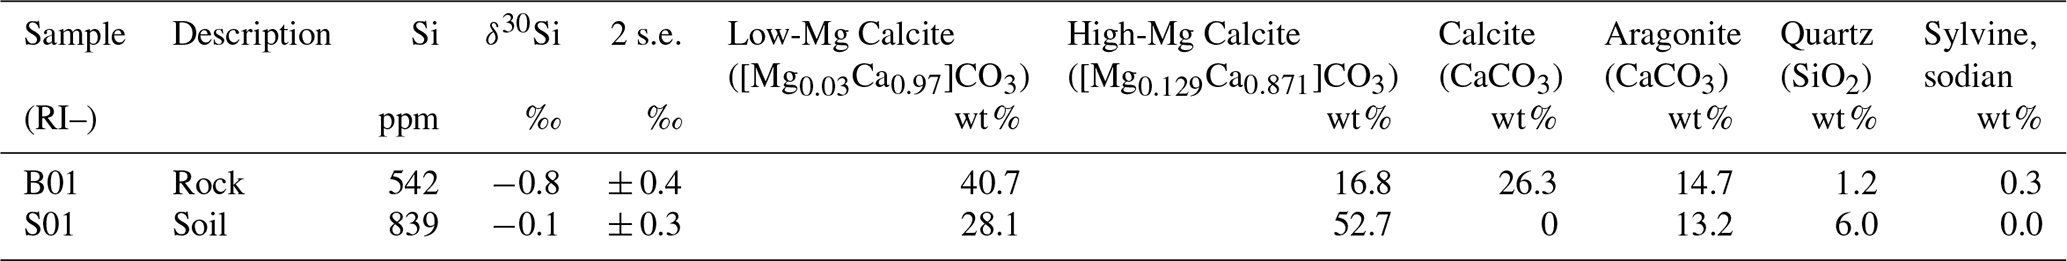
* XRD data from Martin et al. (2020).
The Si concentrations of the rock (RI-B01) and soil (RI-S01) samples were 542 and 839 ppm, respectively, and their δ30Si values were −0.8 ± 0.4 ‰ and −0.1 ± 0.3 ‰, respectively (Table 2). The δ30Si value of RI-S01 is close to the average for the upper continental crust (UCC; −0.3 ± 0.3 ‰; 2 SD; Savage et al., 2013), whereas RI-B01 was slightly below the average UCC value.
To understand the processes fractionating Si isotopes in the coastal aquifer on RI, we first attempt to identify the sources of dSi in the unsaturated zone for fresh meteoric groundwater and then consider the effect of water–rock interactions on their dSi isotope composition. The effect of mixing processes in the deeper, older and more saline T1 and T2 groundwater is then considered.
5.1 Identifying the source of dSi in meteoric groundwater at Rottnest Island
The primary source of dSi in groundwater systems is often the dissolution of silicate minerals in the aquifer, i.e. lithogenic silica, but the positive relationship between dSi and δ30Si (ρ = 0.59; p = 0.02) in fresh RI groundwater suggests physical mixing and/or diffusion processes must also be considered. An inverse relationship is typically found in hydrological systems in which dSi is derived from silicate mineral dissolution and removed by secondary mineral formation (Ehlert et al., 2016; Opfergelt et al., 2011; Georg et al., 2009a). The unusual positive relationship between dSi and δ30Si on RI could be explained by a two-component mixing model, but this requires the low-dSi/low-δ30Si and a high-dSi/highδ30Si end-members to be identified.
The low-dSi/low-δ30Si end-member can be identified by the intercept of the regression line between dSi concentrations and δ30Si (−0.7 ± 0.9 ‰; 1 SD), which is similar to the δ30Si values of the aquifer bedrock, Tamala Limestone (−0.8 ± 0.4 ‰ to −0.1 ± 0.3 ‰; Table 2). The primary host of dSi is likely the aquifer bedrock (Tamala Limestone), which has a quartz content ranging from 1.2 wt % to 6.0 wt % (Martin et al., 2020). The fresh groundwater with the highest Al concentration (1–94; 1.5 µM) also had the lowest δ30Si value (+0.2 ‰), providing evidence for the dissolution of silicates other than quartz in the shallow aquifer. Another possibility is that dSi is supplied from the dissolution of secondary minerals, e.g. clay minerals and silcrete. Although it is difficult to distinguish detrital phases from secondary weathering products produced in situ, lower δ30Si values (less than −1 ‰) would be expected if the dissolution of secondary minerals was occurring on RI, as measured in the Navajo sandstone aquifer (Georg et al., 2009b) and the mixed sedimentary aquifer (alternating layers of sandstone, siltstone and mudstone) of the Great Artesian Basin, Australia (Pogge von Strandmann et al., 2014). On this basis, we conclude that the dissolution of silicate minerals is the primary source of dSi in fresh RI groundwater.
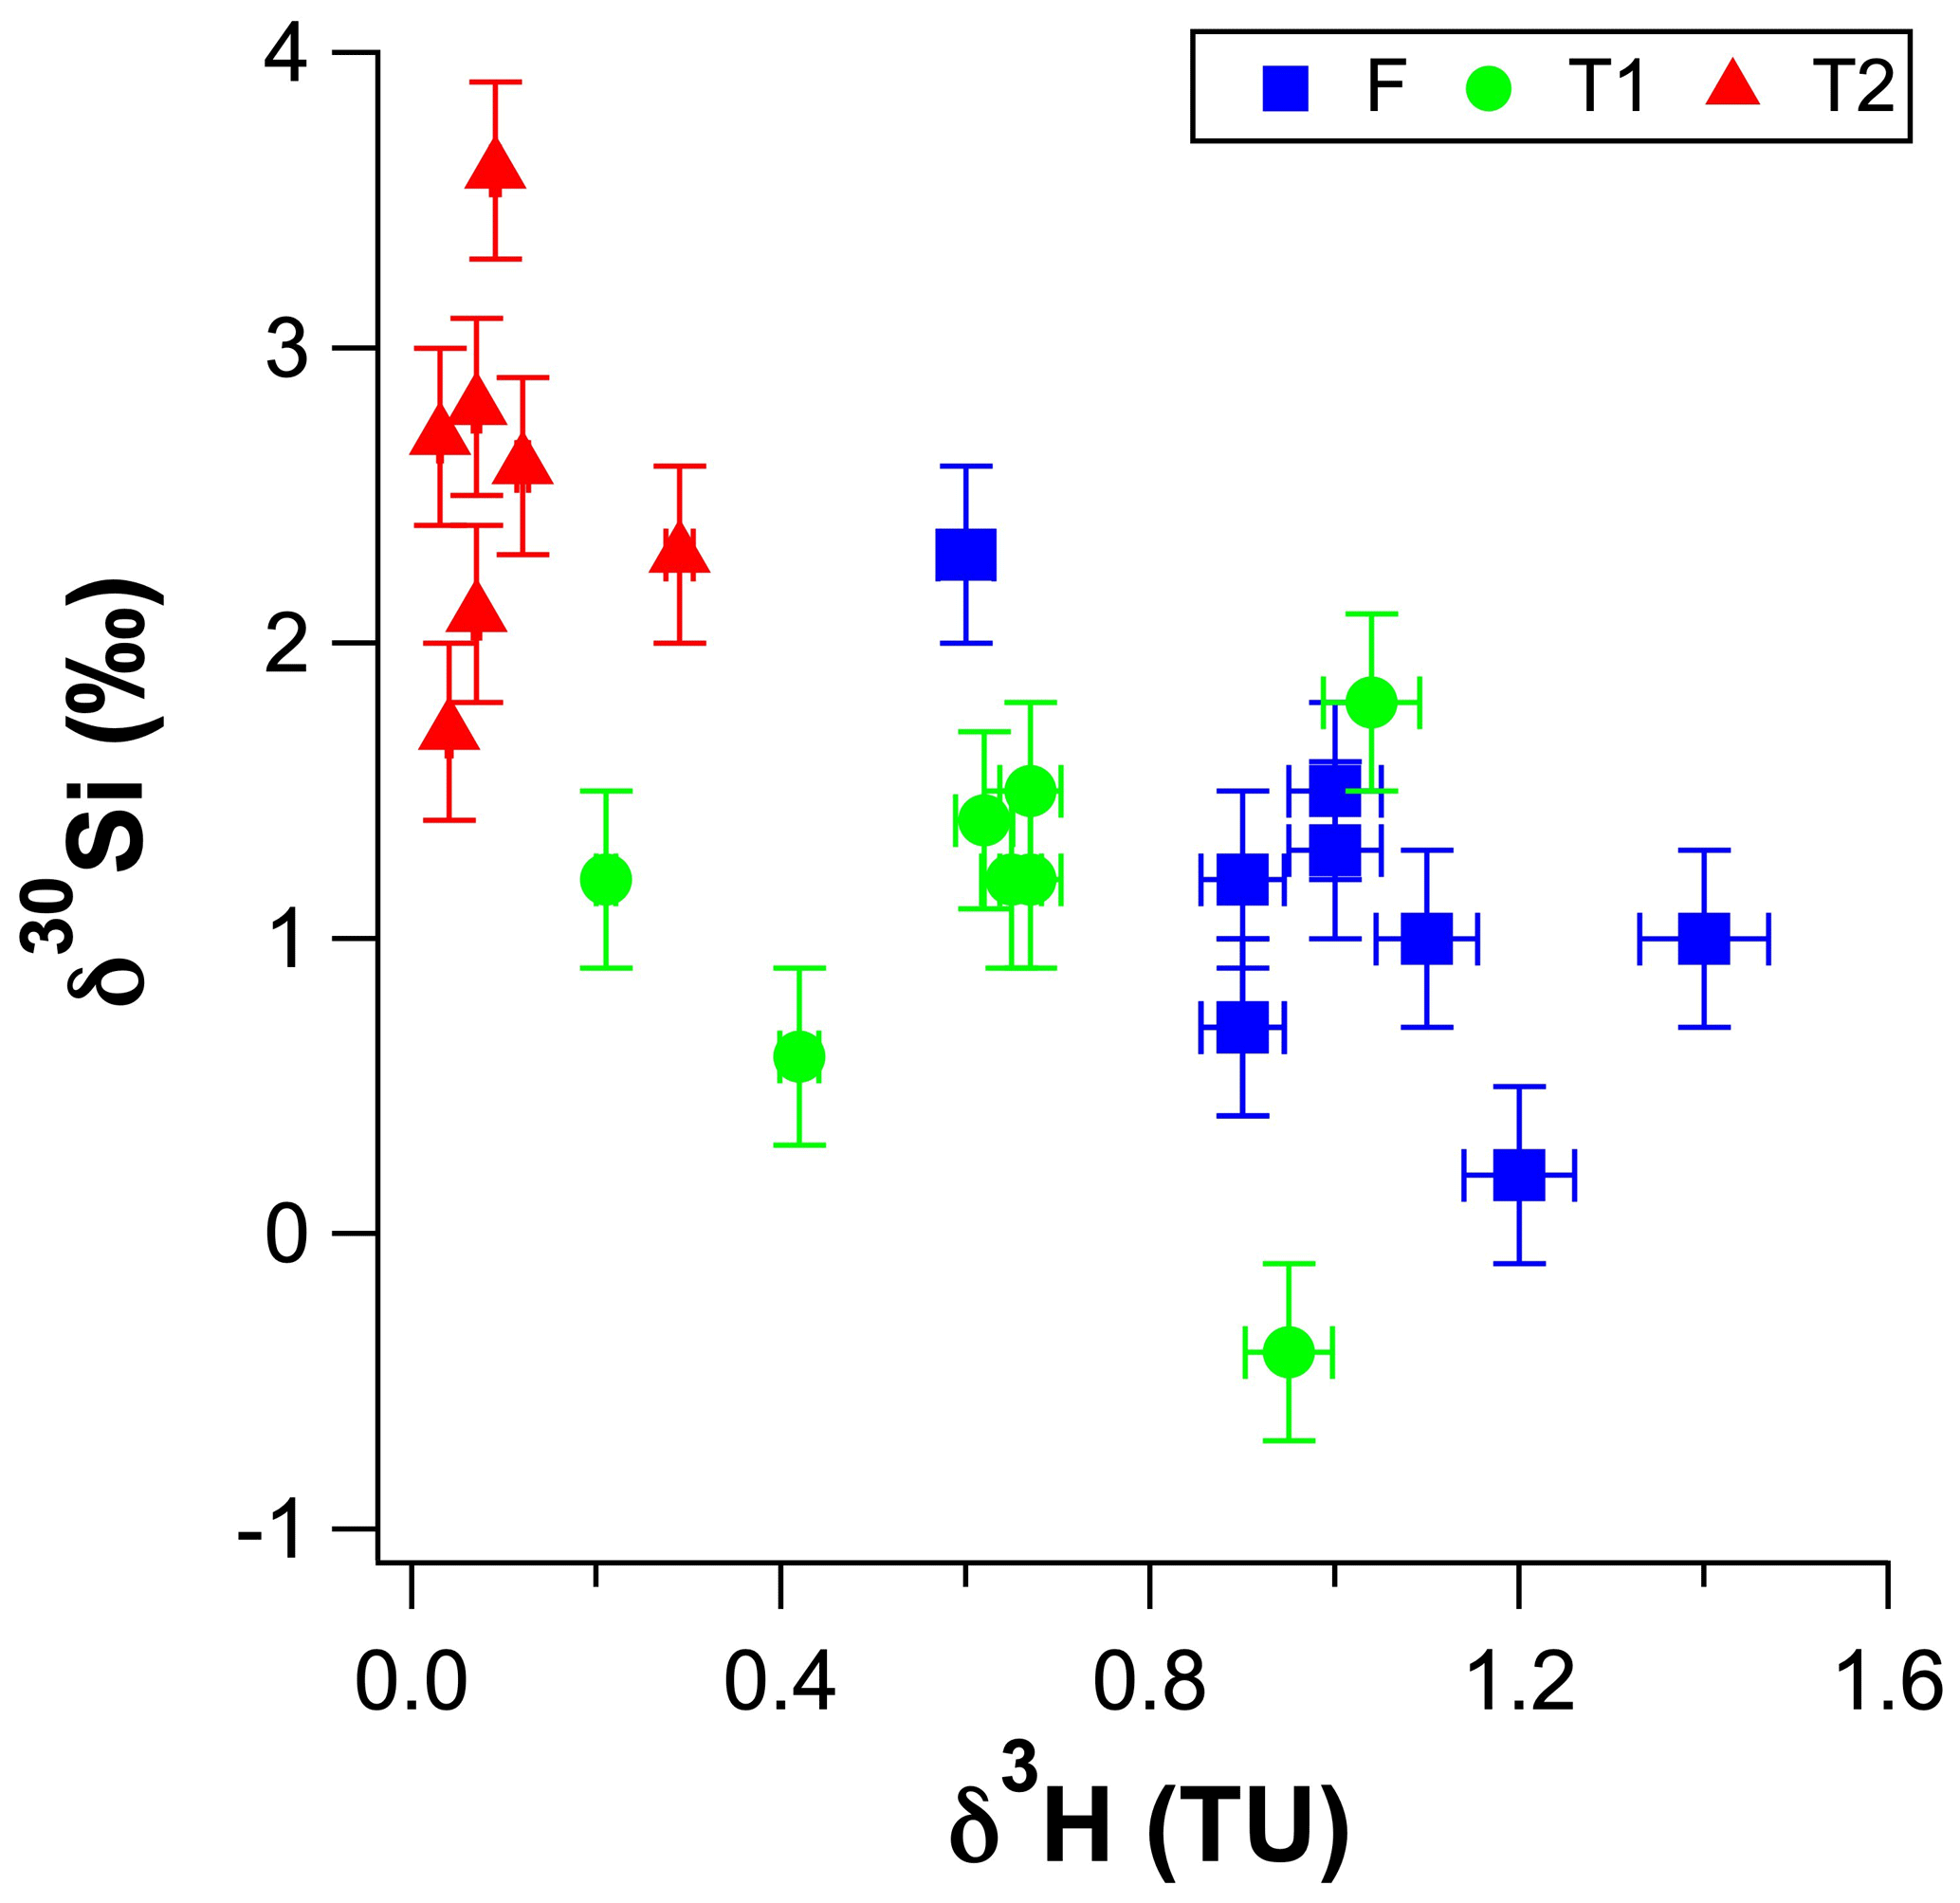
Figure 5The δ30Si values for RI groundwater as a function of their 3H concentrations (in tritium units – TU).
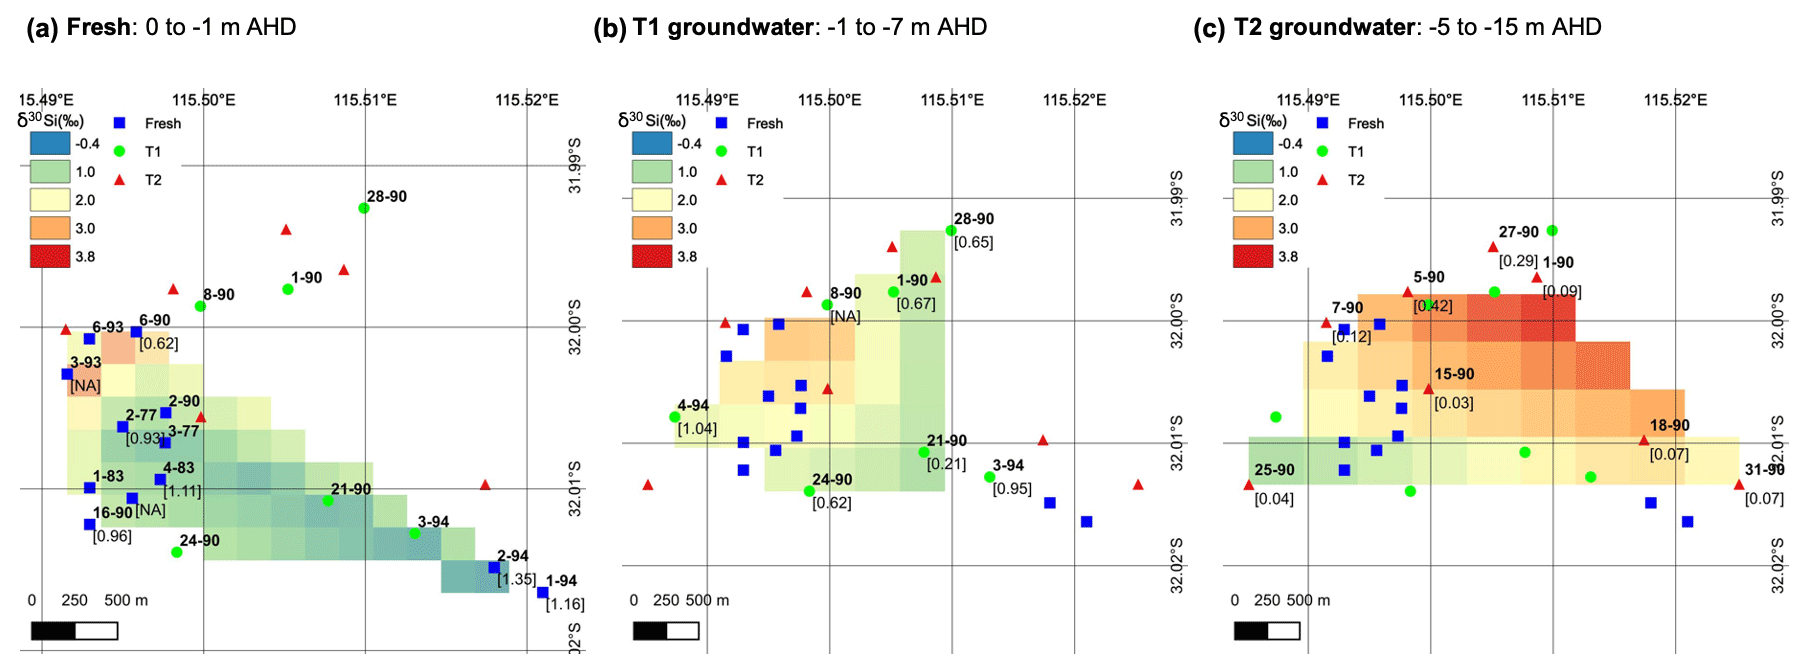
Figure 6Interpolated spatial plots of δ30Si values for groundwater at RI for the (a) fresh, (b) T1 and (c) T2 groundwater. The data were created using a TIN interpolation function (cubic interpolation method) with a pixel size of ca. 0.002 (a) to 0.003∘ (b, c), depending on the sample density per unit area. Sample IDs are shown in bold text next to markers, and values in square brackets show 3H values from Bryan et al. (2016).
The high-dSi/high-δ30Si end-member could reasonably be expected to be seawater or the numerous hypersaline salt lakes on RI, but a saline source is unlikely, and a better candidate may be the T1 groundwater. First, both local seawater and the hypersaline lakes have very low dSi concentrations (< 3.6 µM; Martin et al., 2020) compared to the fresh RI groundwater (> 64 µM; Table 1). Moreover, the Cl contents of the fresh groundwater are low and correspond to estimated seawater fractions of less than 1 % (Bryan et al., 2016). The similarly low dSi concentrations in rainfall (< 3.6 µM; Martin et al., 2020) also render the evapoconcentration of rainfall as an important source of dSi in groundwater as unlikely, especially considering the episodic nature of rainfall events on RI that recharge the aquifer and the resulting low effective rates of evaporation of rainfall (Bryan et al., 2020). Rather, we propose that the δ30Si values of fresh groundwater may broadly reflect the degree to which they have undergone vertical mixing with older, more evolved T1 groundwater from intermediate depths. This is supported by (1) the overlap in the distribution of dSi and δ30Si values for the fresh and T1 groundwater, i.e. most T1 groundwater lies within 1 SD of the average δ30Si value for fresh groundwater (Fig. 4b), (2) the correlation between the δ30Si values and Cl concentrations of fresh groundwater (Fig. 3b) and (3) the correlation between δ30Si values and 3H activities when considering all groundwater types (Fig. 5). Vertical mixing processes may explain the spatial pattern of groundwater δ30Si and dSi values; for instance, the highest δ30Si values are found in the northeastern portions of the freshwater lens (wells 6–90 and 3–93). Although these groundwater are defined as fresh in terms of their TDS concentrations (< 1 g L−1), there is a greater degree of upward mixing of older, more saline groundwater from the freshwater–seawater transition zone in these wells (Bryan et al., 2020). In contrast, the lowest δ30Si values are found in the central area of the freshwater lens (wells 2–77, 2–90 and 3–77) and southwestern areas of the freshwater lens (wells 1–94 and 2–94; Fig. 6). These groundwater wells typically receive more rainfall recharge and have the shortest groundwater residence times according to their 3H activities (Bryan et al., 2020). Therefore, the high-dSi/high-δ30Si end-member is identified as older groundwater, which is more evolved in terms of its dSi and δ30Si composition. The specific role of water–rock interactions in meteoric groundwater is discussed in Sect. 5.2.
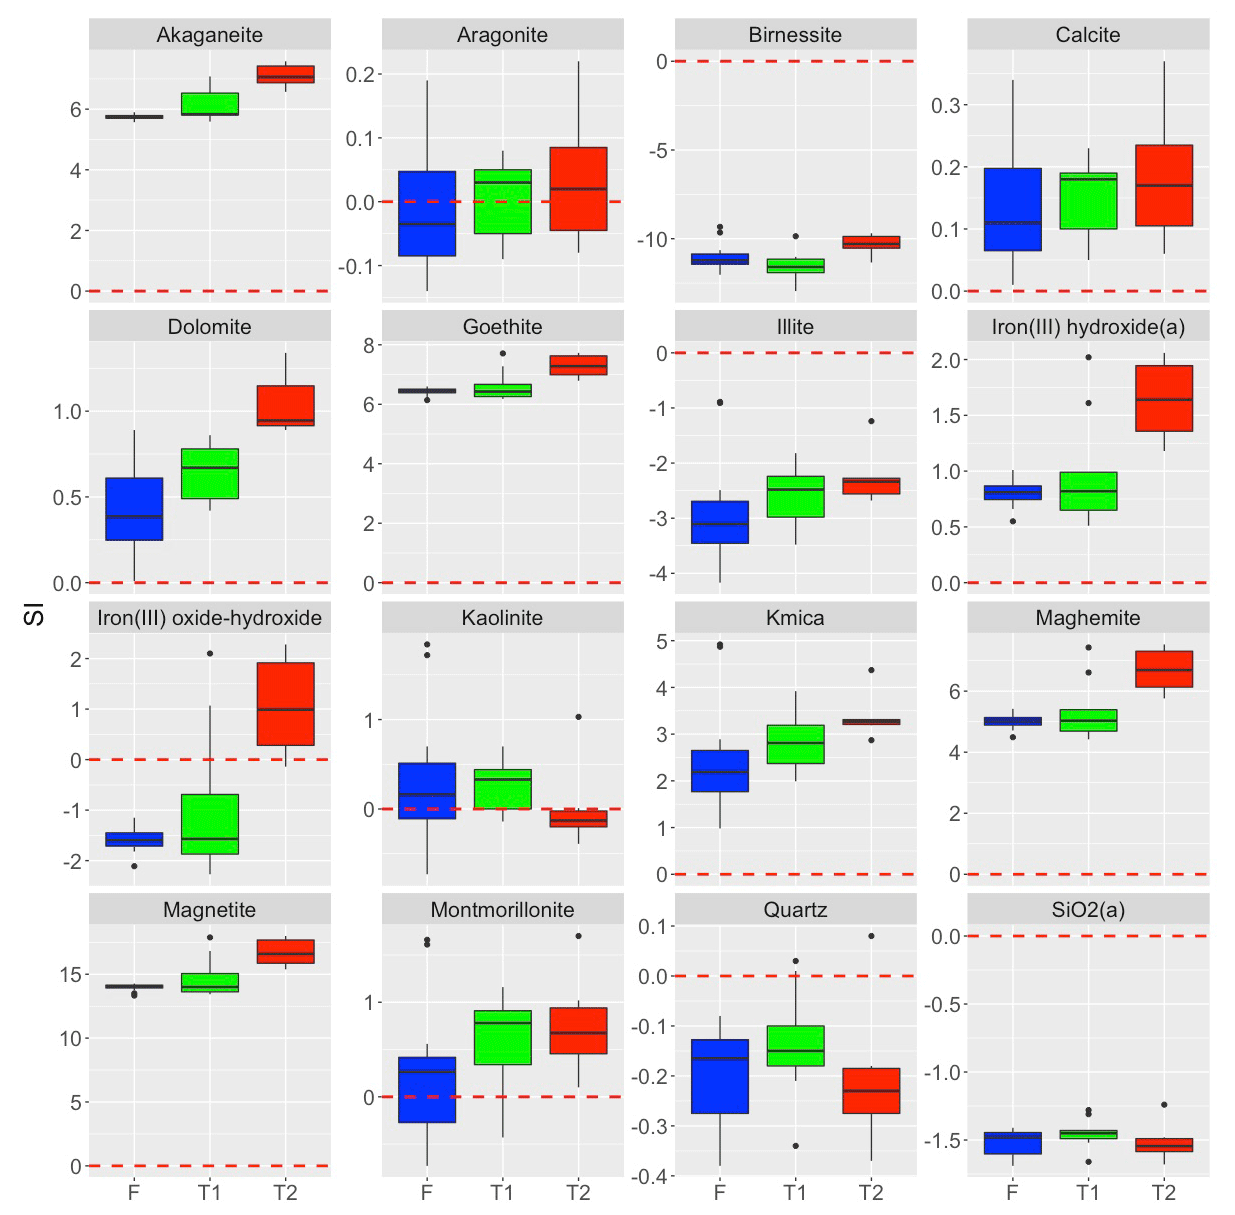
Figure 7Box plots showing the saturation indices of selected minerals grouped by groundwater mixing type (F – fresh; T1 and T2). Dashed red lines show SI = 0, and black dots represent outliers (1.5 times greater than the interquartile range).
5.2 The role of water–rock interactions in meteoric groundwater at Rottnest Island
The increase in δ30Si in fresh RI groundwater from +0.2 ± 0.4 ‰ to +2.6 ± 0.3 ‰ may occur due to the following mechanisms: (1) the incorporation of Si into neo-formed clay minerals (Frings et al., 2015; Georg et al., 2007; Hughes et al., 2013; Opfergelt et al., 2017; Pogge von Strandmann et al., 2012), (2) amorphous silica precipitation (Oelze et al., 2015; Geilert et al., 2014; Opfergelt et al., 2017) and/or (3) the adsorption of Si onto Fe-Al (oxy)hydroxides (Opfergelt et al., 2009; Oelze et al., 2014). The enrichment of the heavier Si isotopes in fresh RI groundwater by secondary mineral formation associated with incongruent weathering conditions is supported by PHREEQC modelling employing the water4f.dat database (Parkhurst and Appelo, 2013). These results indicate that most fresh RI groundwater are saturated with respect to secondary minerals, such as kaolinite and montmorillonite (Fig. 7), and the increase in δ30Si may, therefore, be attributed to the precipitation of clay minerals. This is supported by the high δ7Li values of fresh RI groundwater (> 23 ‰), whereby 6Li is preferentially incorporated into secondary phases (Martin et al., 2020). Although Si and Li isotopes are both useful tracers of silicate weathering processes, there is no correlation between δ7Li and δ30Si in RI groundwater, possibly highlighting that different processes control the isotopic fractionation of these elements in coastal aquifers. One key difference might be the high Li content of seawater relative to meteoric groundwater, whereas dSi is a nutrient and depleted in local seawater. This is an important distinction on RI since modern seawater intrusion (Bryan et al., 2016) and past sea level high stands (∼ 2 m higher than the present), e.g. events at ∼ 4 and 7 ka (Coshell and Rosen, 1994; and Gouramanis et al., 2012), would have probably intruded seawater into the shallow groundwater system. Such seawater intrusion episodes would be expected to adsorb Li, but not Si, onto the aquifer matrix during previous or ongoing intrusion events and provide Li to groundwater through cation exchange processes. The importance of ion exchange in fresh RI groundwater is supported by a Mg excess and a deficit of Na and Ca relative to theoretical mixing with seawater (Bryan et al., 2017).
Fresh RI groundwater is also saturated with respect to common Fe (oxy)hydroxide minerals, such as iron(III) hydroxide and goethite (Fig. 7). These minerals may bind dSi over a wide range of pH conditions (Fein et al., 2002) and preferentially adsorb the lighter Si isotopes (Oelze et al., 2014; Opfergelt et al., 2009), thereby increasing the δ30Si values of fresh RI groundwater. In addition to freshly precipitated Fe minerals, a pre-existing source of Fe–Al (oxy)hydroxide minerals in the aquifer may be the terra rossa Late Quaternary palaeosol units that occur throughout the Tamala Limestone (Smith et al., 2012; Hearty and O'Leary, 2008), and similar materials could be distributed through the aquifer rather than being specifically the palaeosols themselves. These palaeosol units may be particularly important for determining preferential groundwater flow paths, as they can act as inception horizons in the Tamala Limestone, and it is likely that groundwater will flow through or along palaeosol units on RI (Hearty and O'Leary, 2008). As the enrichment of heavier Si isotopes in the aqueous phase depends on the degree of soil weathering, the Fe oxide content and the proportion of short-range ordered Fe oxides (Opfergelt et al., 2009). The extent of Si isotopic fractionation in fresh RI groundwater may depend on the specific geochemical properties of the palaeosol units through which they flow and produce spatial variations in Si isotopic compositions.
Finally, amorphous silica precipitation appears to be unimportant on RI as many fresh groundwater are undersaturated with respect to amorphous silica (Fig. 7). This is reasonable considering that amorphous silica is very soluble under ambient temperature and pressure conditions and only precipitates at dSi concentrations in excess of 2 mM (Gunnarsson and Arnórsson, 2000). As this threshold concentration is an order of magnitude higher than those in fresh RI groundwater (Table 1), it is unlikely that amorphous silica precipitation occurs in fresh RI groundwater.
5.3 Mixing processes in the freshwater–seawater transition zone at Rottnest Island
Groundwater in the freshwater–seawater transition zone on RI can be divided into two water types on the basis of their chemical and isotopic composition as T1 or T2 groundwater (Bryan et al., 2017). The T2 groundwater are the deeper, older, and more saline, whereas the T1 groundwater have compositions that are dominated by mixing between the fresh groundwater and the more saline T2 groundwater. This mixing is driven by tidal and groundwater level fluctuations within the transition zone and variable meteoric recharge (Bryan et al., 2016).
The δ30Si values of T1 groundwater may be used to establish a three-component end-member mixing model between seawater (low dSi, high δ30Si), groundwater that have undergone less extensive water–aquifer interactions (low dSi, low δ30Si; e.g. well 28–90), and groundwater that have undergone more extensive water–aquifer interactions (high dSi, high δ30Si; e.g. well 8–90). The low δ30Si value well 28–90 (−0.4 ± 0.3 ‰, Table 1) could be explained by the dissolution of Tamala Limestone (−0.8 ‰ to −0.1 ‰, Table 2) in this groundwater whilst not undergoing secondary mineral formation, or interacting with palaeosol units, or any other phases that may preferentially adsorb Si. In contrast, the high δ30Si value for well 8–90 (+2.8 ‰) is associated with the highest dSi concentration of all T1 groundwater (192 µM) suggesting that, at this location in the freshwater–seawater transition zone, the dissolution of silicate minerals is accompanied by enhanced secondary mineral formation, or Si adsorption onto secondary phases, e.g. with palaeosol units.
The more saline T2 groundwater in the deeper aquifer on RI have high seawater fractions (> 17 %; Bryan et al., 2017), whereby their Si isotopic composition is primarily controlled by mixing with local seawater that is depleted in dSi (< 3.6 µM; Table 1). This mixing process dilutes the dSi concentrations in the T2 groundwater and explains the negative correlation between dSi and Cl (ρ = −0.79, p = 0.04, n = 7). The higher δ30Si values for the deeper T2 groundwater compared to the fresh and T1 groundwater may be attributed to the high δ30Si value of local seawater. Although this was not measured in our study, the groundwater with the highest seawater fraction (84 %, well 11–90) also has the highest δ30Si value (+3.6 ± 0.2 ‰, Table 1). Although the δ30Si value of local seawater was not measured, it's dSi concentration was very low and a value of around +1.7 ‰ is expected according to the well-established, inverse relationship between dSi and δ30Si in seawater (Singh et al., 2015; Grasse et al., 2013, 2017). Although all T2 groundwater plot broadly on a mixing line between seawater (< 3.6 µM dSi) and the well with highest groundwater dSi concentration (well 5–90, Fig. 3a), there is also evidence for lithogenic silica dissolution in the deeper aquifer. For instance, the T2 groundwater with the lowest δ30Si (25–90; +1.7 ‰), also has a much lower 3H value (0.04 TU). Such low groundwater 3H are consistent 14C data indicating that there is older (> 3 ka) seawater “trapped” under RI in the deeper aquifer (Bryan et al., 2017). Additional evidence for ongoing weathering reactions in the deeper aquifer is the δ7Li value of the T2 groundwater from the deepest well exhibiting the lowest δ7Li value measured on RI (Martin et al., 2020). Lower δ7Li (and δ30Si) values relative to fresh RI groundwater are consistent with either continued lithogenic silica dissolution of the aquifer bedrock (Tamala Limestone) or interactions with the silicate basement rocks (Martin et al., 2020). Thus, the extent of δ30Si variations is primary controlled by mixing with seawater but there is clear evidence for continued dissolution of silicate minerals in the deeper aquifer on RI.
5.4 Implications for the global dSi isotope mass balance
Our finding that the dissolution of lithogenic silica is occurring in the freshwater–seawater transition zone supports the inclusion of a marine SGD term in the global dSi mass balance that represents the dissolution of lithogenic silica coastal sediments by recirculated seawater (Rahman et al., 2019; Cho et al., 2018). This is consistent with the findings from the quartz-rich, sandy barrier island aquifer of Spiekeroog, northern Germany (Ehlert et al., 2016), and is supported by the significantly higher dSi concentrations of the T1 groundwater than both fresh groundwater (p = 0.0002) and T2 groundwater (p = 0.001; Table 1). Marine SGD accounts for the marine-derived component of dSi in SGD that is supplied from the lithogenic dissolution of coastal sediments by recirculated seawater. Previous mass balance models only considered terrestrial SGD inputs (fresh SGD) with a dSi flux of ∼ 0.7 Tmol a−1 (Frings et al., 2016; Tréguer and De La Rocha, 2013), which equates to ∼ 10 % of the riverine dSi flux. Marine SGD is estimated to supply ∼ 3.1 Tmol a−1 of dSi globally (Rahman et al., 2019). The total SGD flux (fresh SGD + marine SGD) is ∼ 3.8 Tmol a−1, representing ∼ 60 % of the riverine dSi input (∼ 6.3 Tmol a−1), and is six-fold higher than previously recognised. As highlighted by Rahman et al. (2019), the major effect of the revised dSi global mass balance is the large decrease in the estimated dSi oceanic residence time from ∼ 10 to ∼ 8 ka.
The Si isotopic composition of the fresh SGD flux is poorly constrained, and our data provide one of the few direct estimates of this component. This is because RI is a coastal island aquifer that receives no terrestrial runoff, and the contribution of dSi from lithogenic silica dissolution in the more saline RI groundwater can be estimated using our data from the fresh RI groundwater. As the average δ30Si values for the fresh groundwater and T1 groundwater were similar (+1.3 ± 0.7 ‰ and +1.3 ± 0.9 ‰, respectively; 1 SD; Table 1), a value of +1.3 ‰ may be adopted for the fresh SGD flux. Adopting this value for the fresh SGD flux in a revised dSi mass balance decreases the estimated ocean average δ30Si value from +0.8 ‰ to +0.1 ‰. A value of around +2.6 ‰ for the marine SGD term is required to be consistent with the current estimate of the ocean average δ30Si value, which corresponds to the δ30Si value of the saline groundwater with the highest dSi concentrations on RI (well 5–90). These estimates are highly uncertain and highlight the need for additional Si isotopic measurements of saline groundwater to obtain a representative estimate of the marine SGD term and better constrain the global Si isotopic budget.
Our measurements may also be used to estimate the continental dSi flux in Western Australia as Rottnest Island forms part of the longest carbonate aeolianite unit in the world, the Tamala Limestone. The terrestrial SGD flux from Western Australia is estimated to be 3.2 km3 a−1, with carbonate aquifers comprising 50 % of the coastline (Zekster et al. 2007; Rahman et al., 2019). By adopting the average dSi concentration of the fresh groundwater (112 ± 23 µM), we estimate that the dSi flux from the Tamala Limestone is 1.79 × 10⁸ ± 0.37 × 10⁸ mol a−1 of dSi, corresponding to ∼ 27 % of the dSi flux from Western Australia. While this value is insignificant relative to the estimated global dSi flux of 7.1 × 10¹¹ mol a−1, it is significant on a continental scale. Moreover, carbonate aeolianite aquifers are an important feature of many coastlines globally, e.g. the Yucatán Peninsula, South Australia and The Bahamas, and should be considered as important sources of dSi in these regions.
The Si isotopic composition of groundwater was utilised to trace groundwater processes on RI. We find that the main source of dSi in fresh RI groundwater is the dissolution of primary silicate minerals present within the aquifer bedrock, the Tamala Limestone. The δ30Si values of fresh groundwater on RI appear to be related to the incorporation of the lighter Si isotopes into secondary minerals formed in the aquifer, but amorphous silica precipitation does not appear to be important. Higher δ30Si values were found for wells with a greater degree of upward mixing with older, more saline groundwater from the freshwater–seawater transition zone, whereas lower δ30Si values were found in groundwater wells that typically receive more rainfall recharge and have the shortest groundwater residence times. Thus, the local hydrogeology of RI may explain the spatial pattern in groundwater δ30Si values across the freshwater lens. Therefore, the stable Si isotopic composition of groundwater provides useful information on the degree of water–aquifer interactions, which is expected to increase with the time elapsed since meteoric recharge.
The main source of dSi in shallow, fresh groundwater on RI was the dissolution of lithogenic silica found within the carbonate matrix of the aquifer rock. Moreover, this process appears to continue in more saline groundwater in the freshwater–seawater transition zone, which has been termed the marine SGD flux. Constraining the Si isotopic composition of this flux from key areas, such as volcanic island aquifers, should be a goal of future studies to better constrain the global Si isotopic budget. Although not important on a global scale, the dissolution of lithogenic silica in coastal carbonate aeolianite aquifers may be an important source of oceanic dSi regionally. For instance, the local seawater around RI is depleted in dSi and 2 orders of magnitude lower than fresh RI groundwater. Thus, we propose that the coastal carbonate aeolianite aquifers may be an important source of oceanic dSi in other coastal regions with carbonate aquifers where there is no large dSi riverine flux and the oceanic concentration of dSi is low, e.g. The Bahamas or the Yucatán Peninsula, Mexico.
A1 Potential effects of anions during Si isotopic measurements
Our Si column chromatography procedure utilised a cation exchange resin, following Georg et al. (2006), which is effective for separating Si from cations but has the disadvantage that anions such as may be eluted with the Si fraction. This could cause matrix effects between SO4-free bracketing standards and SO4-containing samples during MC-ICP-MS measurements, due to mass bias, and induce an offset to measured Si isotopic ratios (Hughes et al., 2011; van den Boorn et al., 2009), which is also shown by the positive correlation between the measured intensities of the Si isotopes with and δ30Si (van den Boorn et al., 2009). This effect does not appear to be important for fresh meteoric samples with lower contents (Georg et al., 2006) but may be important for highly saline samples. As a brucite co-precipitation method was not adopted for our samples, it should be assessed whether the SO4 present in groundwater affected our Si isotopic measurements; however, it should also be noted that we only processed meteoric groundwater that had sufficiently high dSi and low TDS so as to not exceed 10 % of the resin capacity; thus, the molar ratios of analysed groundwater were at least ∼ 30-fold lower than for local seawater, which had a molar ratio of ∼ 9000.
In our groundwater analyses, there was no correlation between the molar ratios and the measured signal intensity for 29Si (before dilution to match bracketing standards) during MC-ICP-MS measurements (Fig. A.2A) or δ30Si values and molar ratios (Fig. A.2B). Although it might be argued that there is a weak correlation for the T2 groundwater between the molar ratios and signal intensity for 29Si (R2 = 0.33; Fig. A.2A) and δ30Si values (R2 = 0.27; Fig. A.2B), these weak correlations are not statistically significant (p values < 0.05). Moreover, there was no correlation between the measured signal intensity for 29Si and δ30Si values for all samples (Fig. A.2C). We, therefore, conclude that matrix effects caused by anions in Si solutions did not induce a detectable offset for δ30Si values. As noted by Hughes et al. (2011), the importance of the anionic matrix effect is likely laboratory specific due to the various combinations of different instruments, sample matrices, analytical settings and/or Si column chromatography.
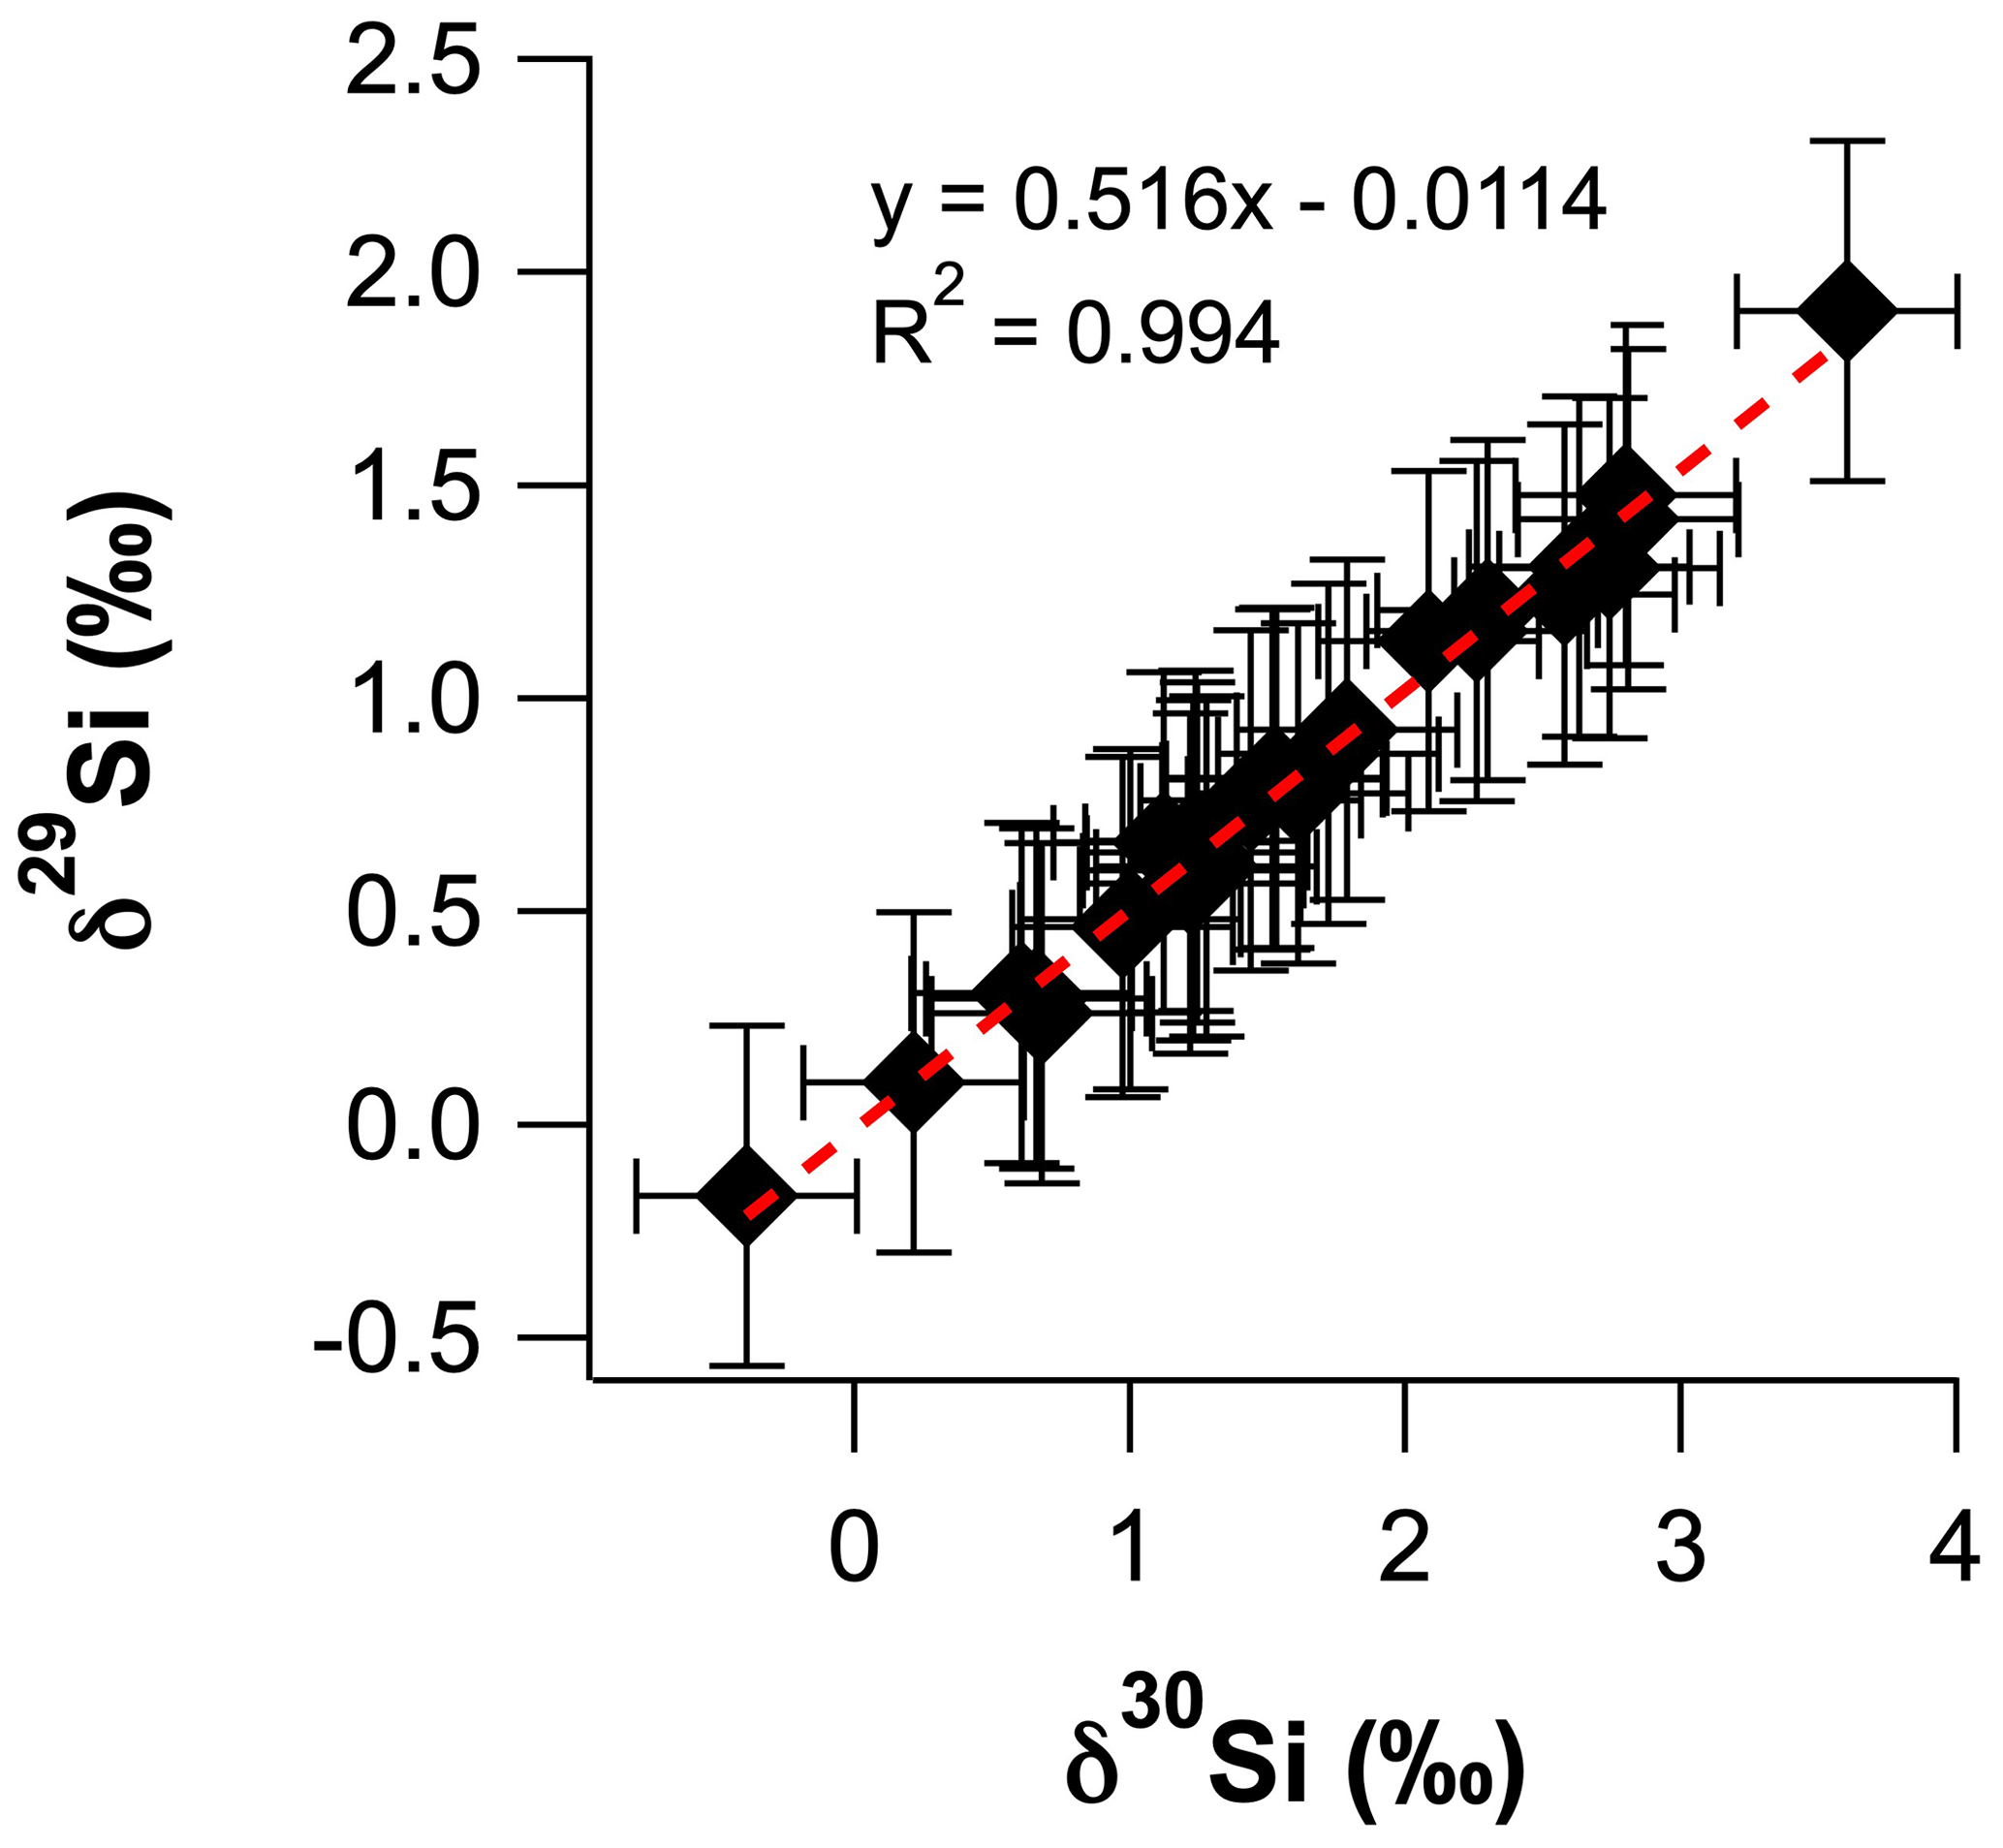
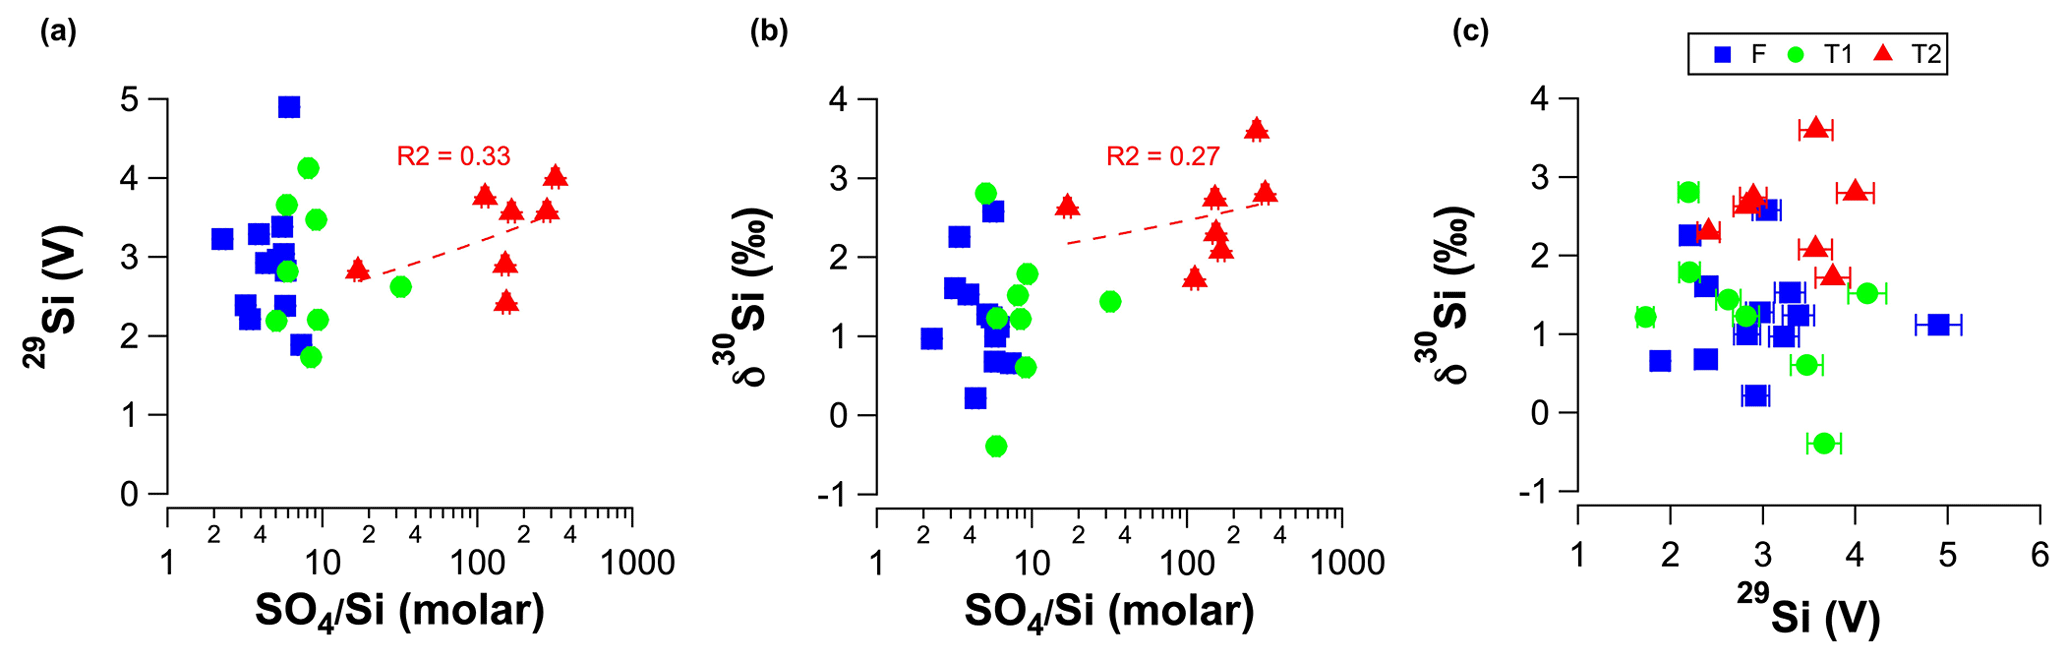
Figure A2 Linear plots for RI groundwater samples showing (a) signal intensity for 29Si measured during MC-ICP-MS measurements (before dilution to match bracketing standards) as a function of molar ratios. (b) δ30Si as a function of molar ratios and (c) δ30Si as a function of signal intensity for 29Si measured during MC-ICP-MS measurements (before dilution to match bracketing standards). The dashed red lines in panels (a) and (b) show the regression lines for the T2 groundwater.

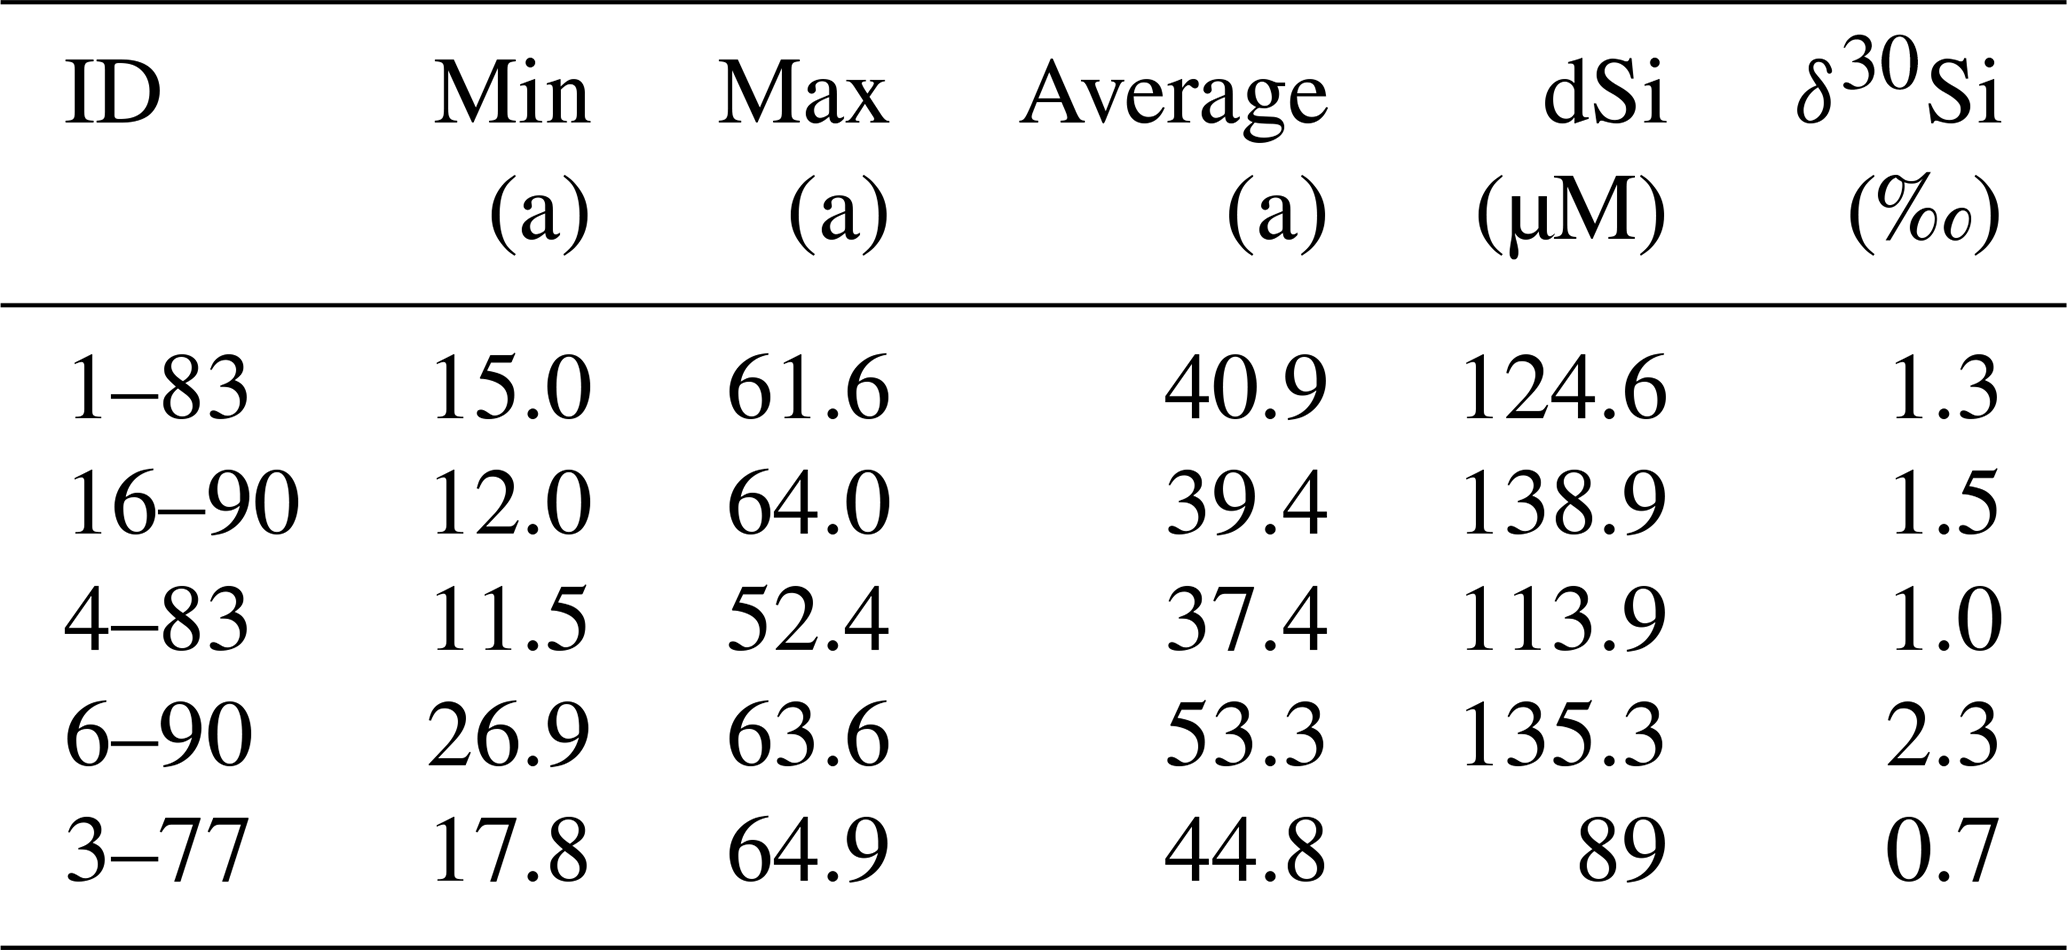
Table A2Groundwater residence times from Bryan et al. (2020) and corresponding Si isotope data.
The data are this paper are available from the authors upon request.
The supplement related to this article is available online at: https://doi.org/10.5194/hess-25-3837-2021-supplement.
AB, KM and MDN conceptualised the research. KM and EB collected the water samples, and ANM and AB collected the rock and soil samples. ANM conducted the analytical work, with assistance from MDN. ANM prepared the paper, with contributions from all co-authors.
The authors declare that they have no conflict of interest.
Publisher's note: Copernicus Publications remains neutral with regard to jurisdictional claims in published maps and institutional affiliations.
The Rottnest Island Authority (RIA) is thanked for supporting this project, especially Cassyanna Thomas, Luke Wheat and Shane Kearney. We also recognise the enduring backing of Suzanne Hollins, head of research at ANSTO, in addition to Henri Wong and Chris Vardanega, for supporting ICP-MS and ICP-OES analyses, Chris Dimovski and Stuart Hankin, for field trip preparations, and Krista Simon and David Child, for usage of the clean laboratory facilities. Les Kinsley at ANU is acknowledged for sharing his wisdom and support in MC-ICP-MS analyses. This study was supported by an ARC Linkage grant (grant no. LP150100144).
This research has been supported by the Australian Research Council (grant no. LP150100144).
The publication of this article was funded by the open-access fund of Leibniz Universität Hannover.
This paper was edited by Brian Berkowitz and reviewed by three anonymous referees.
Albarède, F. and Beard, B.: Analytical methods for non-traditional isotopes, Rev. Mineral. Geochem., 55, 113–152, 2004.
Baronas, J. J., Torres, M. A., West, A. J., Rouxel, O., Georg, B., Bouchez, J., Gaillardet, J., and Hammond, D. E.: Ge and Si isotope signatures in rivers: A quantitative multi-proxy approach, Earth Planet. Sc. Lett., 503, 194–215, 2018.
Basile-Doelsch, I., Meunier, J. D., and Parron, C.: Another continental pool in the terrestrial silicon cycle, Nature, 433, 399–402, 2005.
Beck, A. J., Charette, M. A., Cochran, J. K., Gonneea, M. E., and Peucker-Ehrenbrink, B.: Dissolved strontium in the subterranean estuary–Implications for the marine strontium isotope budget, Geochim. Cosmochim. Ac., 117, 33–52, 2013.
Brooke, B.: The distribution of carbonate eolianite, Earth-Sci. Rev., 55, 135–164, https://doi.org/10.1016/S0012-8252(01)00054-X, 2001.
Bryan, E., Meredith, K. T., Baker, A., Post, V. E., and Andersen, M. S.: Island groundwater resources, impacts of abstraction and a drying climate: Rottnest Island, Western Australia, J. Hydrol., 542, 704–718, 2016.
Bryan, E., Meredith, K. T., Baker, A., Andersen, M. S., and Post, V. E. A.: Carbon dynamics in a Late Quaternary-age coastal limestone aquifer system undergoing saltwater intrusion, Sci. Total Environ., 607–608, 771–785, https://doi.org/10.1016/j.scitotenv.2017.06.094, 2017.
Bryan, E., Meredith, K. T., Baker, A., Andersen, M. S., Post, V. E., and Treble, P. C.: How water isotopes (18O, 2H, 3H) within an island freshwater lens respond to changes in rainfall, Water Res., 170, 115301, https://doi.org/10.1016/j.watres.2019.115301, 2020.
Cho, H.-M., Kim, G., Kwon, E. Y., Moosdorf, N., Garcia-Orellana, J., and Santos, I. R.: Radium tracing nutrient inputs through submarine groundwater discharge in the global ocean, Sci. Rep.-UK, 8, 1–7, 2018.
Christina, L., Brzezinski, M. A., and DeNiro, M. J.: A first look at the distribution of the stable isotopes of silicon in natural waters, Geochim. Cosmochim. Ac., 64, 2467–2477, 2000.
Coshell, L. and Rosen, M. R.: Stratigraphy and Holocene history of lake Hayward, Swan coastal plain wetlands, western Australia, 1994.
De La Rocha, C., Brzezinski, M. A., DeNiro, M., and Shemesh, A.: Silicon-isotope composition of diatoms as an indicator of past oceanic change, Nature, 395, 680–683, 1998.
Ding, T., Zhou, J., Wan, D., Chen, Z., Wang, C., and Zhang, F.: Silicon isotope fractionation in bamboo and its significance to the biogeochemical cycle of silicon, Geochim. Cosmochim. Ac., 72, 1381–1395, 2008.
Ehlert, C., Reckhardt, A., Greskowiak, J., Liguori, B. T., Böning, P., Paffrath, R., Brumsack, H.-J., and Pahnke, K.: Transformation of silicon in a sandy beach ecosystem: insights from stable silicon isotopes from fresh and saline groundwaters, Chem. Geol., 440, 207–218, 2016.
Falkowski, P. G., Barber, R. T., and Smetacek, V.: Biogeochemical controls and feedbacks on ocean primary production, Science, 281, 200–206, 1998.
Fein, J. B., Scott, S., and Rivera, N.: The effect of Fe on Si adsorption by Bacillus subtilis cell walls: insights into non-metabolic bacterial precipitation of silicate minerals, Chem. Geol., 182, 265–273, 2002.
Frings, P. J., Clymans, W., Fontorbe, G., Gray, W., Chakrapani, G. J., Conley, D. J., and De La Rocha, C.: Silicate weathering in the Ganges alluvial plain, Earth Planet. Sc. Lett., 427, 136–148, https://doi.org/10.1016/j.epsl.2015.06.049, 2015.
Frings, P. J., Clymans, W., Fontorbe, G., Christina, L., and Conley, D. J.: The continental Si cycle and its impact on the ocean Si isotope budget, Chem. Geol., 425, 12–36, 2016.
Geilert, S., Vroon, P. Z., Roerdink, D. L., Van Cappellen, P., and van Bergen, M. J.: Silicon isotope fractionation during abiotic silica precipitation at low temperatures: Inferences from flow-through experiments, Geochim. Cosmochim. Ac., 142, 95–114, https://doi.org/10.1016/j.gca.2014.07.003, 2014.
Geilert, S., Grasse, P., Wallmann, K., Liebetrau, V., and Menzies, C. D.: Serpentine alteration as source of high dissolved silicon and elevated δ30Si values to the marine Si cycle, Nat. Commun., 11, 1–11, 2020.
Georg, R. B., Reynolds, B. C., Frank, M., and Halliday, A. N.: New sample preparation techniques for the determination of Si isotopic compositions using MC-ICPMS, Chem. Geol., 235, 95–104, 2006.
Georg, R., West, A., Basu, A., and Halliday, A.: Silicon fluxes and isotope composition of direct groundwater discharge into the Bay of Bengal and the effect on the global ocean silicon isotope budget, Earth Planet. Sc. Lett., 283, 67–74, 2009a.
Georg, R., Zhu, C., Reynolds, B., and Halliday, A.: Stable silicon isotopes of groundwater, feldspars, and clay coatings in the Navajo Sandstone aquifer, Black Mesa, Arizona, USA, Geochim. Cosmochim. Ac., 73, 2229–2241, 2009b.
Georg, R. B., Reynolds, B. C., West, A. J., Burton, K. W., and Halliday, A. N.: Silicon isotope variations accompanying basalt weathering in Iceland, Earth Planet. Sc. Lett., 261, 476–490, https://doi.org/10.1016/j.epsl.2007.07.004, 2007.
Grasse, P., Ehlert, C., and Frank, M.: The influence of water mass mixing on the dissolved Si isotope composition in the Eastern Equatorial Pacific, Earth Planet. Sc. Lett., 380, 60–71, 2013.
Grasse, P., Brzezinski, M. A., Cardinal, D., De Souza, G. F., Andersson, P., Closset, I., Cao, Z., Dai, M., Ehlert, C., and Estrade, N.: GEOTRACES inter-calibration of the stable silicon isotope composition of dissolved silicic acid in seawater, J. Anal. Atom. Spectrom., 32, 562–578, 2017.
Gouramanis, C., Dodson, J., Wilkins, D., De Deckker, P., and Chase, B. M.: . Holocene palaeoclimate and sea level fluctuation recorded from the coastal Barker Swamp, Rottnest Island, south-western Western Australia, Quaternary Sci. Rev., 54, 40–57, 2012.
Gunnarsson, I. and Arnórsson, S.: Amorphous silica solubility and the thermodynamic properties of in the range of 0∘ to 350 ∘C at Psat, Geochim. Cosmochim. Ac., 64, 2295–2307, 2000.
Hearty, P. J. and O'Leary, M. J.: Carbonate eolianites, quartz sands, and Quaternary sea-level cycles, Western Australia: a chronostratigraphic approach, Quat. Geochronol., 3, 26–55, 2008.
Hu, C., Huang, J., Fang, N., Xie, S., Henderson, G. M., and Cai, Y.: Adsorbed silica in stalagmite carbonate and its relationship to past rainfall, Geochim. Cosmochim. Ac., 69, 2285–2292, 2005.
Hughes, H., Sondag, F., Santos, R., André, L., and Cardinal, D.: The riverine silicon isotope composition of the Amazon Basin, Geochim. Cosmochim. Ac., 121, 637–651, 2013.
Hughes, H. J., Delvigne, C., Korntheuer, M., de Jong, J., André, L., and Cardinal, D.: Controlling the mass bias introduced by anionic and organic matrices in silicon isotopic measurements by MC-ICP-MS, J. Anal. Atom. Spectrom., 26, 1892–1896, 2011.
Martin, A. N., Meredith, K., Norman, M. D., Bryan, E., and Baker, A.: Lithium and strontium isotope dynamics in a carbonate island aquifer, Rottnest Island, Western Australia, Sci. Total Environ., 715, 136906, https://doi.org/10.1016/j.scitotenv.2020.136906, 2020.
Mayfield, K. K., Eisenhauer, A., Santiago Ramos, D. P., Higgins, J. A., Horner, T. J., Auro, M., Magna, T., Moosdorf, N., Charette, M. A., Gonneea, M. E., Brady, C. E., Komar, N., Peucker-Ehrenbrink, B., and Paytan, A.: Groundwater discharge impacts marine isotope budgets of Li, Mg, Ca, Sr, and Ba, Nat. Commun., 12, 148, https://doi.org/10.1038/s41467-020-20248-3, 2021.
Meyerink, S., Ellwood, M. J., Maher, W. A., and Strzepek, R.: Iron Availability Influences Silicon Isotope Fractionation in Two Southern Ocean Diatoms (Proboscia inermis and Eucampia antarctica) and a Coastal Diatom (Thalassiosira pseudonana), Frontiers in Marine Science, 4, 217, https://doi.org/10.3389/fmars.2017.00217, 2017.
Muhs, D. R.: Evaluation of simple geochemical indicators of aeolian sand provenance: Late Quaternary dune fields of North America revisited, Quaternary Sci. Rev., 171, 260–296, https://doi.org/10.1016/j.quascirev.2017.07.007, 2017.
Oelze, M., von Blanckenburg, F., Hoellen, D., Dietzel, M., and Bouchez, J.: Si stable isotope fractionation during adsorption and the competition between kinetic and equilibrium isotope fractionation: Implications for weathering systems, Chem. Geol., 380, 161–171, https://doi.org/10.1016/j.chemgeo.2014.04.027, 2014.
Oelze, M., von Blanckenburg, F., Bouchez, J., Hoellen, D., and Dietzel, M.: The effect of Al on Si isotope fractionation investigated by silica precipitation experiments, Chem. Geol., 397, 94–105, 2015.
Opfergelt, S., de Bournonville, G., Cardinal, D., André, L., Delstanche, S., and Delvaux, B.: Impact of soil weathering degree on silicon isotopic fractionation during adsorption onto iron oxides in basaltic ash soils, Cameroon, Geochim. Cosmochim. Ac., 73, 7226–7240, https://doi.org/10.1016/j.gca.2009.09.003, 2009.
Opfergelt, S., Eiriksdottir, E., Burton, K., Einarsson, A., Siebert, C., Gislason, S., and Halliday, A.: Quantifying the impact of freshwater diatom productivity on silicon isotopes and silicon fluxes: Lake Myvatn, Iceland, Earth Planet. Sc. Lett., 305, 73–82, 2011.
Opfergelt, S., Williams, H., Cornelis, J.-T., Guicharnaud, R., Georg, R., Siebert, C., Gislason, S., Halliday, A., and Burton, K.: Iron and silicon isotope behaviour accompanying weathering in Icelandic soils, and the implications for iron export from peatlands, Geochim. Cosmochim. Ac., 217, 273–291, 2017.
Parkhurst, D. L. and Appelo, C. A. J.: Description of input and examples for PHREEQC version 3—A computer program for speciation, batch-reaction, one-dimensional transport, and inverse geochemical calculations: U.S. Geological Survey Techniques and Methods, book 6, chap. A43, 497 pp., https://doi.org/10.3133/tm6A43, 2013.
Playford, P. E., Low, G., and Cockbain, A. E.: Geology of the Perth Basin, Western Australia, Geological Survey of Western Australia Bulletin, Perth, 1976.
Playford, P. E.: Geology and groundwater potential, in: Geology and Hydrology of Rottnest Island, edited by: PE Playford and REJ Leech, Geol. Surv. West. Aust. Rep, 6, 1977.
Playford, P. E., Leech, R., and Kendrick, G. W.: Geology and hydrology of Rottnest Island, Geological Survey of Western Australia, Geological Survey of Western Australia, Perth, Volume 6, ISSN 0508-4741, 1977.
Pogge von Strandmann, P. A., Porcelli, D., James, R. H., van Calsteren, P., Schaefer, B., Cartwright, I., Reynolds, B. C., and Burton, K. W.: Chemical weathering processes in the Great Artesian Basin: Evidence from lithium and silicon isotopes, Earth Planet. Sc. Lett., 406, 24–36, 2014.
Pogge von Strandmann, P. A. E., Opfergelt, S., Lai, Y.-J., Sigfússon, B., Gislason, S. R., and Burton, K. W.: Lithium, magnesium and silicon isotope behaviour accompanying weathering in a basaltic soil and pore water profile in Iceland, Earth Planet. Sc. Lett., 339–340, 11–23, https://doi.org/10.1016/j.epsl.2012.05.035, 2012.
Rahman, S., Aller, R., and Cochran, J.: The missing silica sink: Revisiting the marine sedimentary Si cycle using cosmogenic 32Si, Global Biogeochem. Cy., 31, 1559–1578, 2017.
Rahman, S., Tamborski, J. J., Charette, M. A., and Cochran, J. K.: Dissolved silica in the subterranean estuary and the impact of submarine groundwater discharge on the global marine silica budget, Mar. Chem., 208, 29–42, 2019.
Savage, P. S., Georg, R. B., Williams, H. M., and Halliday, A. N.: The silicon isotope composition of the upper continental crust, Geochim. Cosmochim. Ac., 109, 384–399, https://doi.org/10.1016/j.gca.2013.02.004, 2013.
Semeniuk, V. and Semeniuk, C.: Sedimentary fill of basin wetlands, central Swan Coastal Plain, southwestern Australia. Part 2: distribution of sediment types and their stratigraphy, Journal of the Royal Society of Western Australia, 89, .185–220, 2006.
Singh, S. P., Singh, S. K., Bhushan, R., and Rai, V. K.: Dissolved silicon and its isotopes in the water column of the Bay of Bengal: Internal cycling versus lateral transport, Geochim. Cosmochim. Ac., 151, 172–191, 2015.
Smith, A., Massuel, S., Pollock, D., and Dillon, P.: Geohydrology of the Tamala Limestone Formation in the Perth region: Origin and role of secondary porosity, Water for a Healthy Country Flagship Report series, ISSN: 1835-095X, CSIRO, Australia, 2012.
Stewart, A., Sweet, I., Needham, R., Raymond, O., Whitaker, A., Liu, S., Phillips, D., Retter, A., Connolly, D., and Stewart, G.: Surface geology of Australia 1 : 1,000,000 scale, Western Australia (digital dataset), Geoscience Australia: Canberra, ACT, Australia, 2008.
Tréguer, P., Nelson, D. M., Van Bennekom, A. J., DeMaster, D. J., Leynaert, A., and Queguiner, B.: The silica balance in the world ocean: a reestimate, Science, 268, 375–379, 1995.
Tréguer, P. J. and De La Rocha, C. L.: The world ocean silica cycle, Annu. Rev. Mar. Sci., 5, 477–501, 2013.
van den Boorn, S. H., Vroon, P. Z., and van Bergen, M. J.: Sulfur-induced offsets in MC-ICP-MS silicon-isotope measurements, J. Anal. Atom. Spectrom., 24, 1111–1114, 2009.
Wille, M., Sutton, J., Ellwood, M. J., Sambridge, M., Maher, W., Eggins, S., and Kelly, M.: Silicon isotopic fractionation in marine sponges: A new model for understanding silicon isotopic variations in sponges, Earth Planet. Sc. Lett., 292, 281–289, 2010.
Zektser, I. and Loaiciga, H. A.: Groundwater fluxes in the global hydrologic cycle: past, present and future, J. Hydrol., 144, 405–427, 1993.
Zektser, I. S., Everett, L. G., and Dzhamalov, R. G.: Submarine groundwater, CRC Press, ISBN-10: 0-8493-3576-0 (Hardcover), 2006.
Ziegler, K., Young, E. D., Schauble, E. A., and Wasson, J. T.: Metal–silicate silicon isotope fractionation in enstatite meteorites and constraints on Earth's core formation, Earth Planet. Sc. Lett., 295, 487–496, 2010.
- Abstract
- Introduction
- Study area
- Methods
- Results
- Discussion
- Conclusions
- Appendix A: Supporting tables and figures are provided in this Appendix. All geochemical parameters presented in this paper are given in Table S1
- Code availability
- Author contributions
- Competing interests
- Disclaimer
- Acknowledgements
- Financial support
- Review statement
- References
- Supplement