the Creative Commons Attribution 4.0 License.
the Creative Commons Attribution 4.0 License.
 | 16 Jun 2021
Satellite rainfall products outperform ground observations for landslide prediction in India
Maria Teresa Brunetti
Massimo Melillo
Stefano Luigi Gariano
Luca Ciabatta
Luca Brocca
Giriraj Amarnath
Silvia Peruccacci
Landslides are among the most dangerous natural hazards, particularly in developing countries, where ground observations for operative early warning systems are lacking. In these areas, remote sensing can represent an important detection and monitoring process to predict landslide occurrence in space and time, particularly satellite rainfall products that have improved in terms of accuracy and resolution in recent times. Surprisingly, only a few studies have investigated the capability and effectiveness of these products in landslide prediction in reducing the impact of this hazard on the population.
We have performed a comparative study of ground- and satellite-based rainfall products for landslide prediction in India by using empirical rainfall thresholds derived from the analysis of historical landslide events. Specifically, we have tested Global Precipitation Measurement (GPM) and SM2RAIN-ASCAT satellite rainfall products, and their merging, at daily and hourly temporal resolution, and Indian Meteorological Department (IMD) daily rain gauge observations. A catalogue of 197 rainfall-induced landslides that occurred throughout India in the 13-year period between April 2007 and October 2019 has been used.
Results indicate that satellite rainfall products outperform ground observations thanks to their better spatial (0.1∘ vs. 0.25∘) and temporal (hourly vs. daily) resolutions. The better performance is obtained through the merged GPM and SM2RAIN-ASCAT products, even though improvements in reproducing the daily rainfall (e.g. overestimation of the number of rainy days) are likely needed. These findings open a new avenue for using such satellite products in landslide early warning systems, particularly in poorly gauged areas.
- Article
(6036 KB) - Full-text XML
- BibTeX
- EndNote


In India, the annual toll in terms of human lives and loss of property, due to landslides and floods, urgently demands the implementation of long-term strategies to prevent hydrogeological instability. India is the country with the highest number of non-seismically triggered disastrous landslides as per the global dataset published by Froude and Petley (2018), with more than 600 records and 16 % of catalogued rainfall-induced landslides. According to the EM-DAT disaster database (Guha-Sapir et al., 2021), a total of 51 fatal landslide events have been recorded since 1950, with 4671 deaths and more than 400 000 people affected. In recent years, regional and local early warning systems were adopted in various countries to forecast rainfall-induced landslides and to mitigate the associated risk (Guzzetti et al., 2020). When heavy and/or abundant rainfall combines with a high landslide susceptibility, an operational warning system is the best solution to mitigate the impact of the event. The use of rainfall thresholds, combined with susceptibility maps, makes it possible to estimate the probability of landslide triggering (Rossi et al., 2018). Rainfall thresholds all over the world are derived from the statistical analysis of rainfall conditions that have resulted in past landslides (e.g. Guzzetti et al., 2007, 2008; Cepeda et al., 2010; Sengupta et al., 2010; Berti et al., 2012; Staley et al., 2013; Zêzere et al., 2015; Segoni et al., 2018; Gariano et al., 2019; Valenzuela et al., 2019; Jordanova et al., 2020; Leonarduzzi and Molnar, 2020; Salinas-Jasso et al., 2020; Uwihirwe et al., 2020). Defining rainfall thresholds over large and diverse areas needs statistically significant information on the occurrence of past landslides and a large amount of rainfall data. On the other hand, India with diverse geographical regions, varied climate, and complex topography and geomorphology does not allow such a density of rainfall stations as to accurately reconstruct the rainfall that caused the landslides. To make a comparison, in Italy the average density of rain gauges is about km2 (Peruccacci et al., 2017), while in India it is about km2 (6995 stations over 3 287 000 km2) (Pai et al., 2014). In addition, in remote areas (e.g. mountainous terrain) of India the low density of rain gauges penalizes the representativeness of the measurements. Hence, the use of satellite rainfall products is a valid option for measuring precipitation over such large areas, provided that performance analysis and assessment in capturing reliable rainfall measurements are carried out, even in areas characterized by complex orography and severe weather systems (e.g. Gupta et al., 2020; Thakur et al., 2019; Tang et al., 2020).
So far, only a few works have studied the relationship between rainfall and landslides in India, and mainly for limited areas or individual states. The analysis of the rainfall conditions responsible for slope failures was conducted using both data from rain gauges and satellite data. Authors using ground-based measurements include Jaiswal and van Westen (2009), who calculated rainfall thresholds based on the daily rainfall vs. the 5 d antecedent rainfall along two sections of a historic railway and of a national highway in the state of Tamil Nadu, southern India. Kanungo and Sharma (2014) derived intensity–duration (ID) thresholds based on daily rainfall measured by rain gauges along a stretch of a national highway of the Garhwal Himalayas in the state of Uttarakhand, northern India. More recently, Naidu et al. (2018) identified a rainfall threshold based on the daily rainfall vs. the 2, 3, and 5 d antecedent rainfall and in a small hamlet in Kerala, south-western India. One-dimensional probabilistic thresholds were defined by Dikshit and Satym (2019) for a small (∼5 km2) area in the Darjeeling Himalayas, north-eastern India. In the same area, Dikshit et al. (2020a) identified their best threshold based on the daily rainfall vs. the 20 d antecedent rainfall. ID regional and local rainfall was derived by Geethu et al. (2019) in north-eastern India for the Sikkim region and the Gangtok area, respectively. Mandal and Sarkar (2021) estimated rainfall thresholds along a vulnerable section of the NH10 road in the Darjeeling Himalayas.
In a recent work, Dikshit et al. (2020b) argued the necessity of using satellite-based products in the Indian Himalayan region. A few authors used satellite-based data to explore the correlation between rain and the occurrence of landslides. Mathew et al. (2014) obtained and validated ID thresholds using the Tropical Rainfall Measurement Mission (TRMM) precipitation estimates in a small area of the Garhwal Himalayas in the state of Uttarakhand, northern India. They also applied a logistic regression model to assess the effect of the antecedent rainfall using rain gauge data. Thakur et al. (2020) analysed the rainfall triggering three large landslides over the Western Ghats, south-western India. They used TMPA (a product of TRMM) and IMERG (Integrated Multi-satellitE Retrievals for GPM, Global Precipitation Measurement)-derived rainfall data. In particular, the performance of IMERG V5 was assessed during the awful Malin landslide, which occurred in 2014, at the initial stage of the GPM product.
The above review shows that the prediction of rainfall-induced landslides in India relies mostly upon custom approaches applied to local areas, a comprehensive method still being missing at a larger regional scale. Conversely, at the global scale, Hong et al. (2006) evaluated the potential of the real-time TMPA product to assess its predictive ability for rainfall-triggered landslides. Kirschbaum and Stanley (2018) proposed a model to provide the potential landslide activity combining satellite-based precipitation estimates (IMERG from GPM) with a landslide susceptibility map. Moreover, examples of application of various satellite-based rainfall estimations for the definition of rainfall thresholds for landslide prediction at a national scale were proposed by Robbins (2016) in Papua New Guinea, Brunetti et al. (2018a) in Italy, He et al. (2020) in China, and Monsieurs et al. (2019) over the East African Rift.
However, a more in-depth and dedicated focus on the use of the available rainfall products at the regional scale is required to best predict the spatial and temporal occurrence of landslides in India. For this purpose, we collected information on rainfall-induced landslides in a new catalogue. We investigated the role of the rainfall in the occurrence of landslides using empirical rainfall thresholds (Peruccacci et al., 2017, and references therein), and we compared the performance of satellite-based and ground-based rainfall products. Comparing the thresholds with rainfall measures, estimates, and forecasts is the basis of most current operational landslide early warning systems (Guzzetti et al., 2020).
India is the seventh largest country in the world and forms a well-defined peninsula of Asia, bounded to the north by the imposing mountain chain of the Himalayas and surrounded by the Arabian Sea to the west and the Bay of Bengal to the east, respectively (Fig. 1).

Figure 1Map of India with the location of landslides triggered by rainfall. Red and white dots highlight the slope failures with and without associated fatalities, respectively. Background image from Bing © Microsoft.
Three basic structural units are usually recognized in the land: the Himalayas in the north, the peninsular Deccan plateau in the south, and the Indo-Gangetic Plain between the two. The country also includes two groups of islands, Lakshadweep, in the Arabian Sea, and the Andaman and Nicobar Islands, between the Bay of Bengal and the Andaman Sea. Apart from the highest mountains in the Himalayas, the main reliefs of the Deccan plateau region are the Western Ghats, a north–south chain of mountains or hills on the western edge, and the Eastern Ghats, running mostly in a north-east–south-west direction. The steep topography of the diverse regions and their geological complexity produce an intense landslide activity, especially during the monsoon season.
The climate of Southeast Asia is dominated by the monsoon for over one-third of the year (Annamalai et al., 1999). Neal et al. (2019) identified seven broad-scale weather regimes in India. Among them, the main monsoon season occurs from June to September, being mostly active during July and August. The monsoon is associated with heavy and persistent rain starting generally on 1 or 2 June from the south-western coast of India (Mooley and Shukla, 1987; Rao et al., 2005) and extending across the central and northern areas, reaching Mumbai around 10 June (Adamson and Nash, 2013) and north-western India by 15 July on average (Tyagi et al., 2011). The large amount of rain in this period makes this the part of the year when the most landslides occur in India. Additionally, non-monsoonal precipitation patterns, the western disturbances, may occur even in January and February, bringing rain or snow to the north-western parts of India later, moving to the north-eastern parts in early spring.
In order to study the relationship between landslides and rainfall, it is necessary to find information on a statistically significant number of slope failures (Peruccacci et al., 2012). It is necessary, as well, to have sufficiently long and continuous series of rainfall data from ground- and/or satellite-based observations. Landslides have to be geo-localized with adequate accuracy, and at least the occurrence day must be known (Brunetti et al., 2018b). Similarly, the rainfall series should have sufficient temporal resolution and range for the measurements to be representative of the rainfall conditions that have presumably triggered the slope failures. Generally, the availability of data for such events depends on the availability and accessibility of local information sources. In India, given the vastness and ecological diversity of the territory, the collection of accurate landslide information is often a challenge. The lack of detailed information associated with the rapid evolution of the landscape due to the high intensity and extreme rainfall often makes it difficult if not impossible to locate the slope failures. In case of incomplete or missing data, a landslide event cannot be included in the analysis, and it is therefore not included in the catalogue. Following these criteria, we discarded nearly 50 % of the collected rainfall-induced landslide events.
3.1 Landslide data
We compiled a new catalogue of 197 rainfall-induced landslides that occurred in India in the 13-year period between April 2007 and October 2019. The geographical distribution of the slope failures is shown in Fig. 1, which reveals how landslides are basically clustered in four main areas corresponding to the main mountain reliefs. One area is in the north-eastern part of India and includes West Bengal (30 landslides), Sikkim (12), Assam (21), Manipur (10), Arunachal Pradesh (5), Meghalaya (3), Nagaland (2), and Mizoram (2); another area in the north-western part encompasses Uttarakhand (9), Himachal Pradesh (8), Jammu and Kashmir (7), and Rajasthan (1); the third area on the western coast encompasses Kerala (50), Karnataka (18), Maharashtra (6), Tamil Nadu (6), and Goa (1); finally, two landslides are located near the eastern coast in Andhra Pradesh.
Landslides collected in the catalogue are mainly located in inhabited areas and along transportation routes. Likely for this reason, about 25 % of them caused one or more fatalities (see pie chart in Fig. 1), confirming how the population impact of this type of hazard is significant in India. A more in-depth analysis shows that the monthly distribution of the slope failures (Fig. 2a) peaks in June, whilst the highest number of fatalities are in August (Fig. 2b). The 2010 Ladakh (Jammu and Kashmir) debris flows and mudflows and the 2014 Malin (Maharashtra) landslides substantially contribute to the two peaks in Fig. 2b.
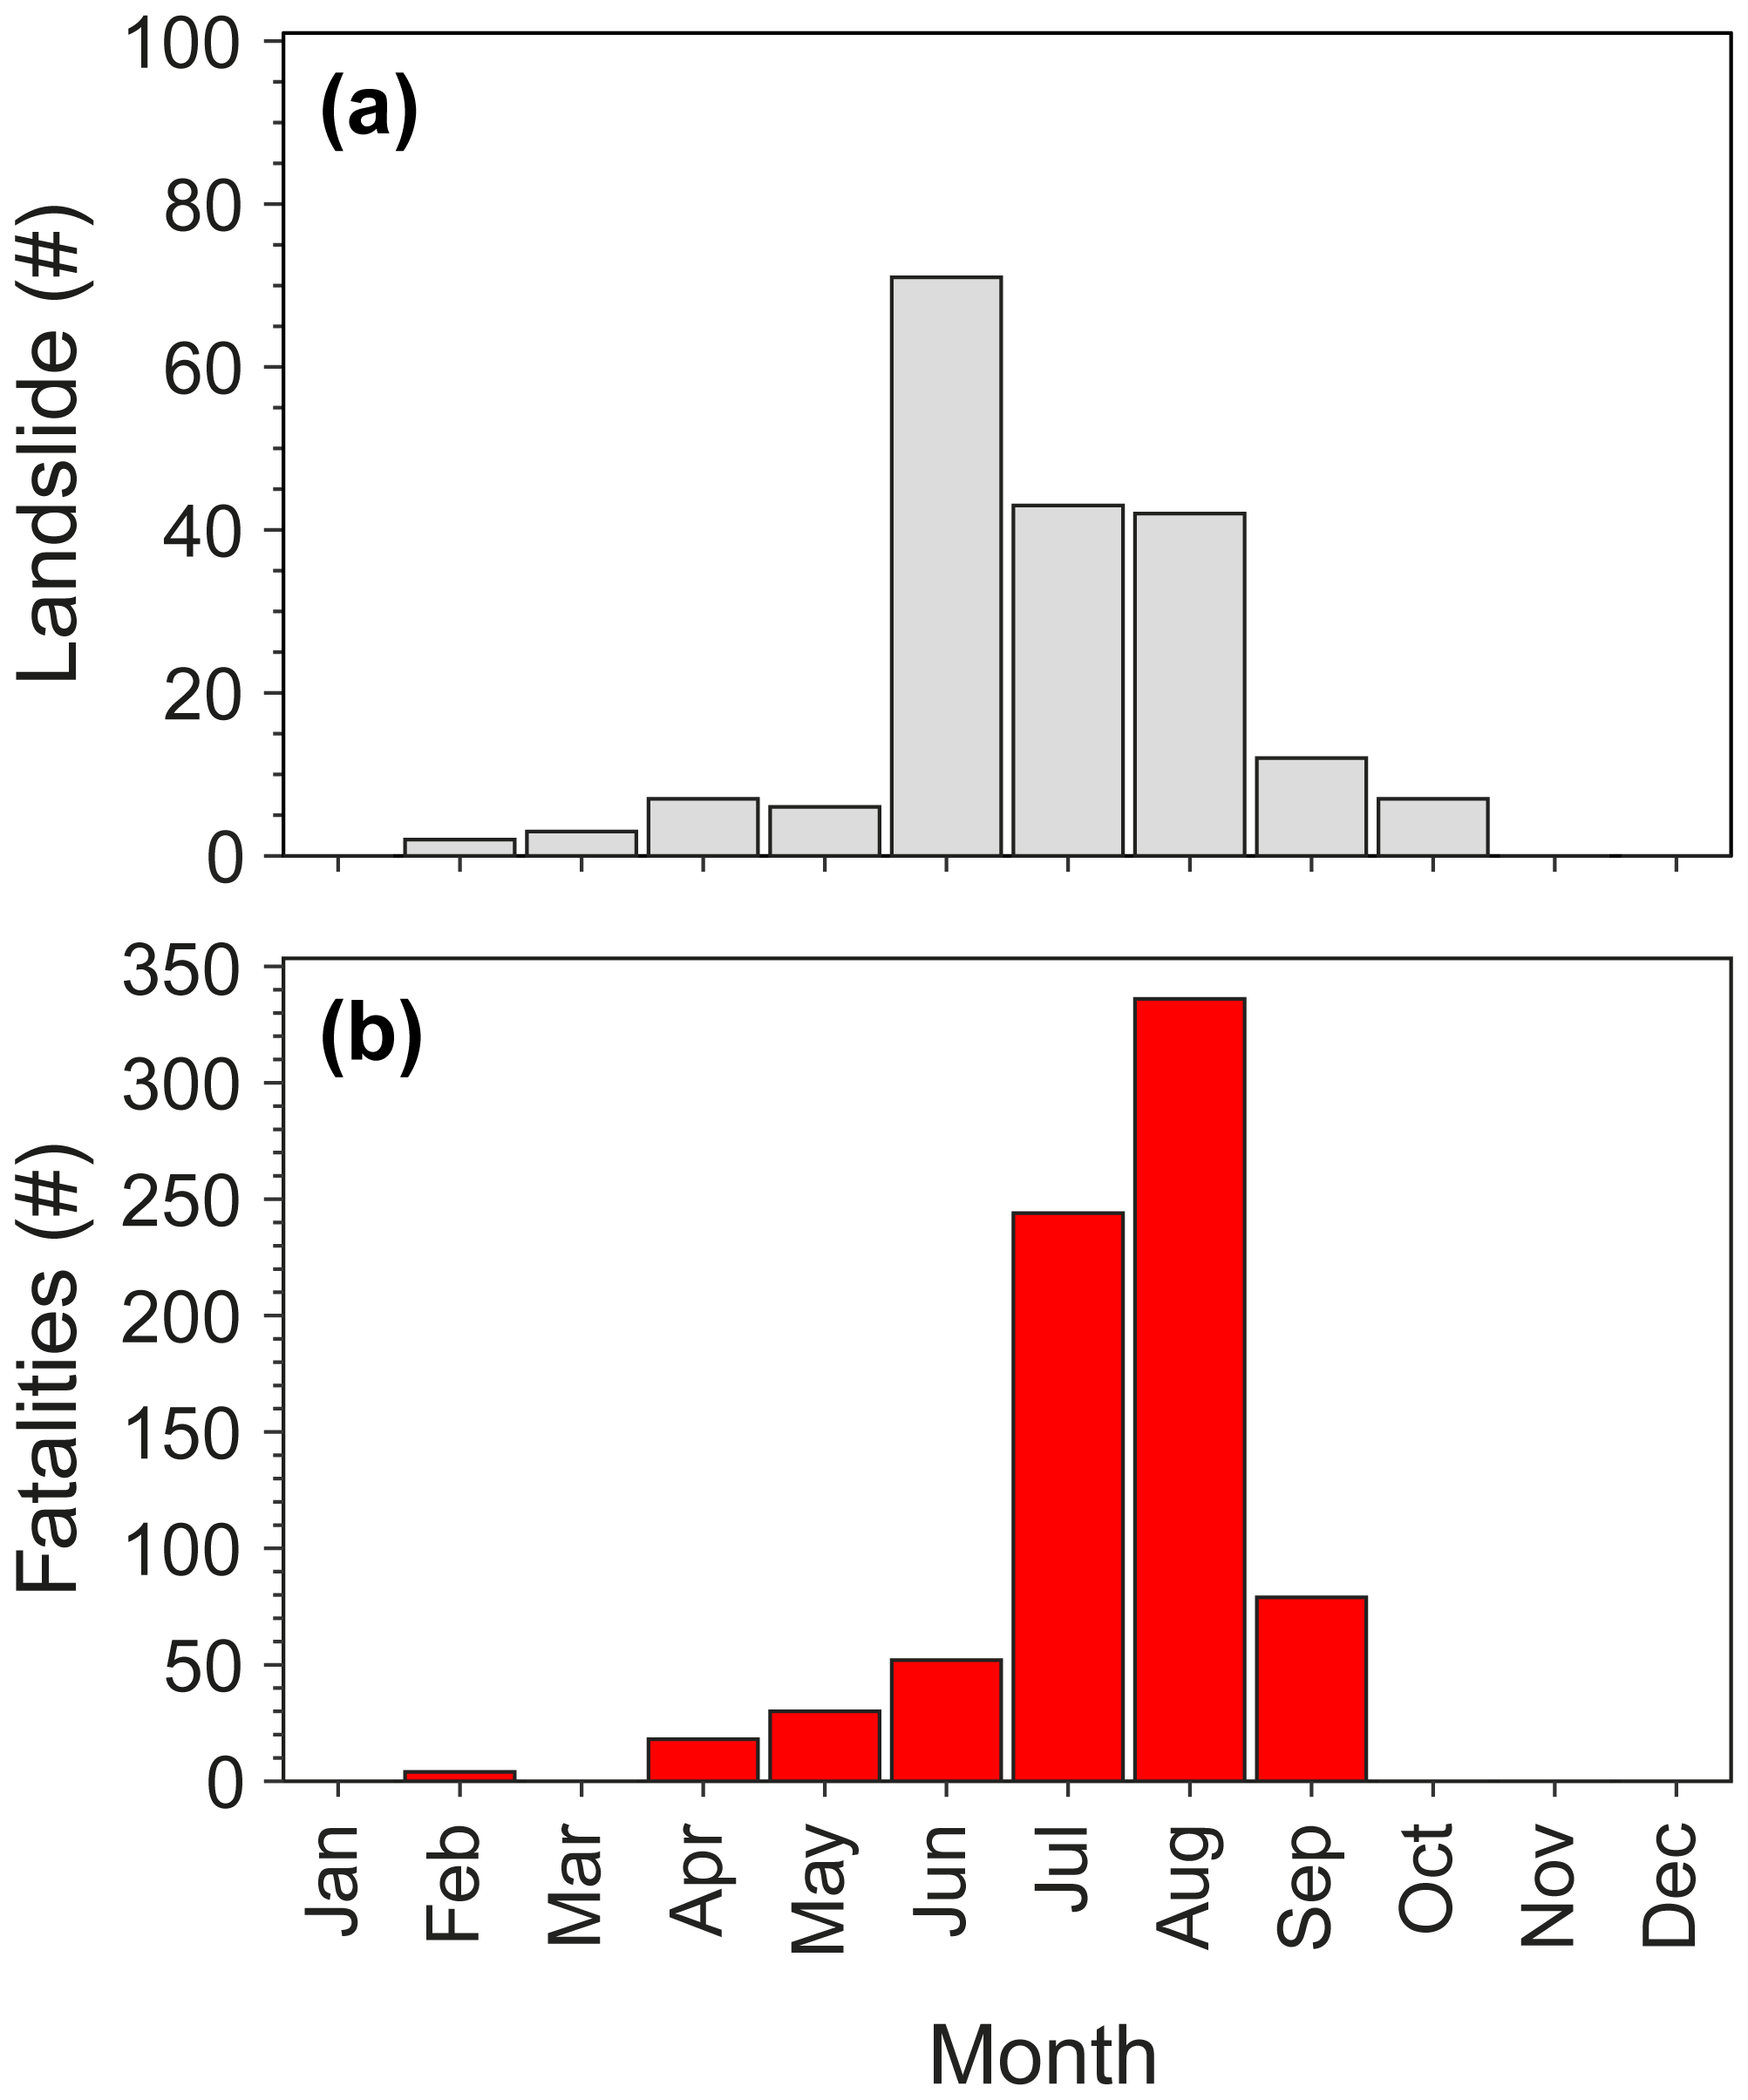
Figure 2Monthly distribution of (a) landslides and (b) landslide fatalities in the catalogue for the period 2007–2019.
We gathered information from multiple sources (Fig. 3a), such as online newspapers and magazines (ON), blogs (BG), technical reports (TR) made available by the Geological Survey of India, scientific journals (SJ), and social media (SM), e.g. Twitter, Facebook. Most of the data (53.4 %) in the catalogue are found in TR. When the information is proven accurate in terms of spatial and temporal location, the landslide is included in the catalogue and is represented as a point on the map (white and red dots in Fig. 1). Each landslide in the catalogue is assigned a position accuracy level in four classes (Fig. 3b): P1 < 1 km2 (high), 1 km2 ≤ P2 < 10 km2 (medium), 10 km2 ≤ P3 < 100 km2 (low), and 100 km2 ≤ P4 < 300 km2 (very low). Similarly, a decreasing temporal accuracy in three classes is associated with each landslide (Fig. 3c). The first class (T1) collects the events for which the time of occurrence is known with an accuracy of 1 h, while for the second (T2) and third (T3) classes the part of the day is inferred or the day of occurrence is known (Peruccacci et al., 2012).
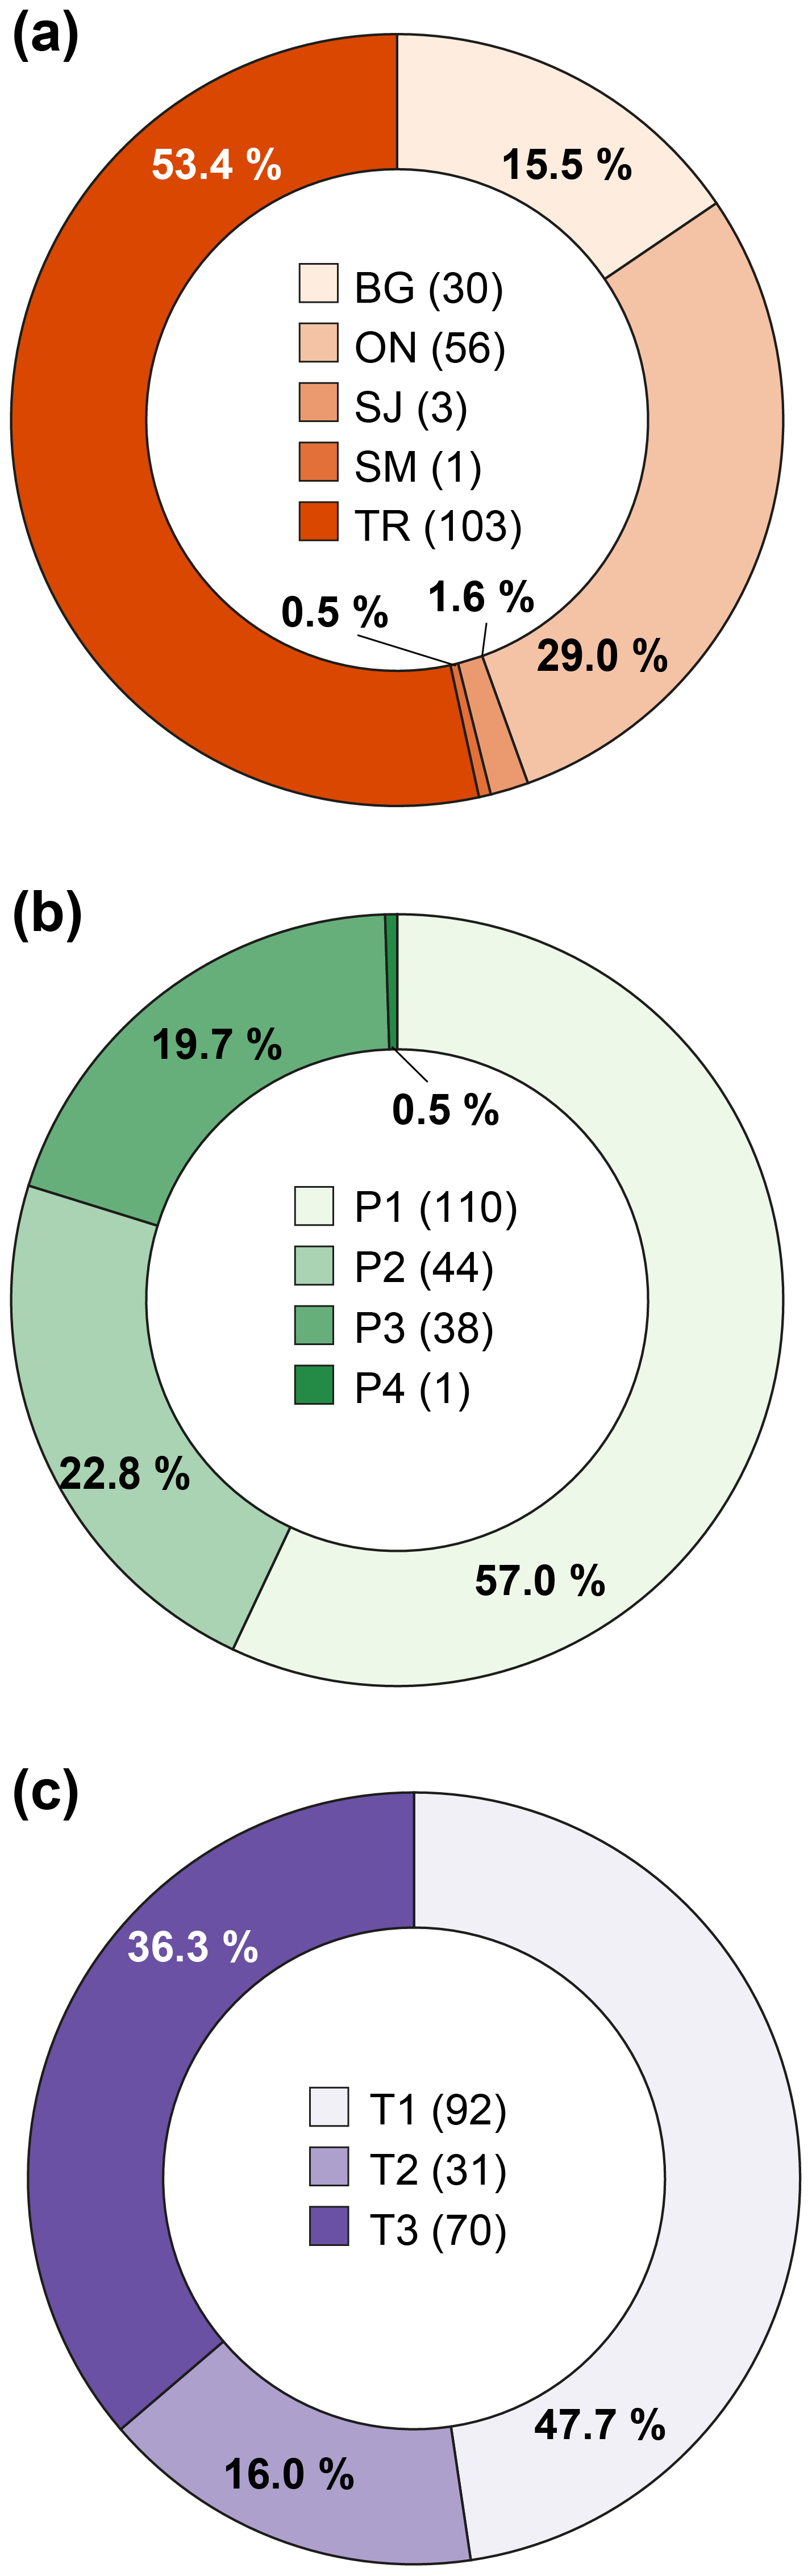
Figure 3Donut charts with statistics of the landslide catalogue. (a) Number and percentage of landslide information source; key: ON, online newspapers and magazines; BG, blogs; TR, technical reports; SJ, scientific journals; SM, social media; (b) number and percentage of landslides with decreasing mapping accuracy; key: P1 < 1 km2 (high), 1 km2 ≤ P2 < 10 km2 (medium), 10 km2 ≤ P3 < 100 km2 (low), 100 km2 ≤ P4 < 300 km2 (very low); (c) number and percentage of landslides with decreasing temporal accuracy; key: T1, hour of occurrence known; T2, part of the day known; T3, only day of occurrence known.
In about half of the cases the lack of data on the landslide type or the non-technical language used by the source of information make it difficult to determine the type of movement and the involved material, and the landslide is generically classified as “not specified” (NS). In other cases, the identification of the landslide type is allowed by photographs or by the assessments of technical personnel (as for surveys carried out by the GSI). As a result, the collected information on the landslide type has been grouped into five classes: complex landslide (CL), debris flow (DF), earth or mudflow/mudslide (EF), rockfall/rockslide (RF), and deep-seated landslide (DL). Here it is stated that this classification follows a criterion that gives greater priority to the type of material (earth/mud or rock) rather than the type of movement (flow, slide, or fall). Figure 4 shows the spatial distribution of landslides classified by type and reveals that about half of the landslides are not specified (NS, 49.7 %), whereas the rest are mostly EF (24.4 %), RF (17.1 %), and DF (5.7 %). CL and DL account each for a smaller percentage (≤2.1 %). In particular, most of the RFs are located in the Himalayas, and the rest are scattered throughout the rest of the territory.
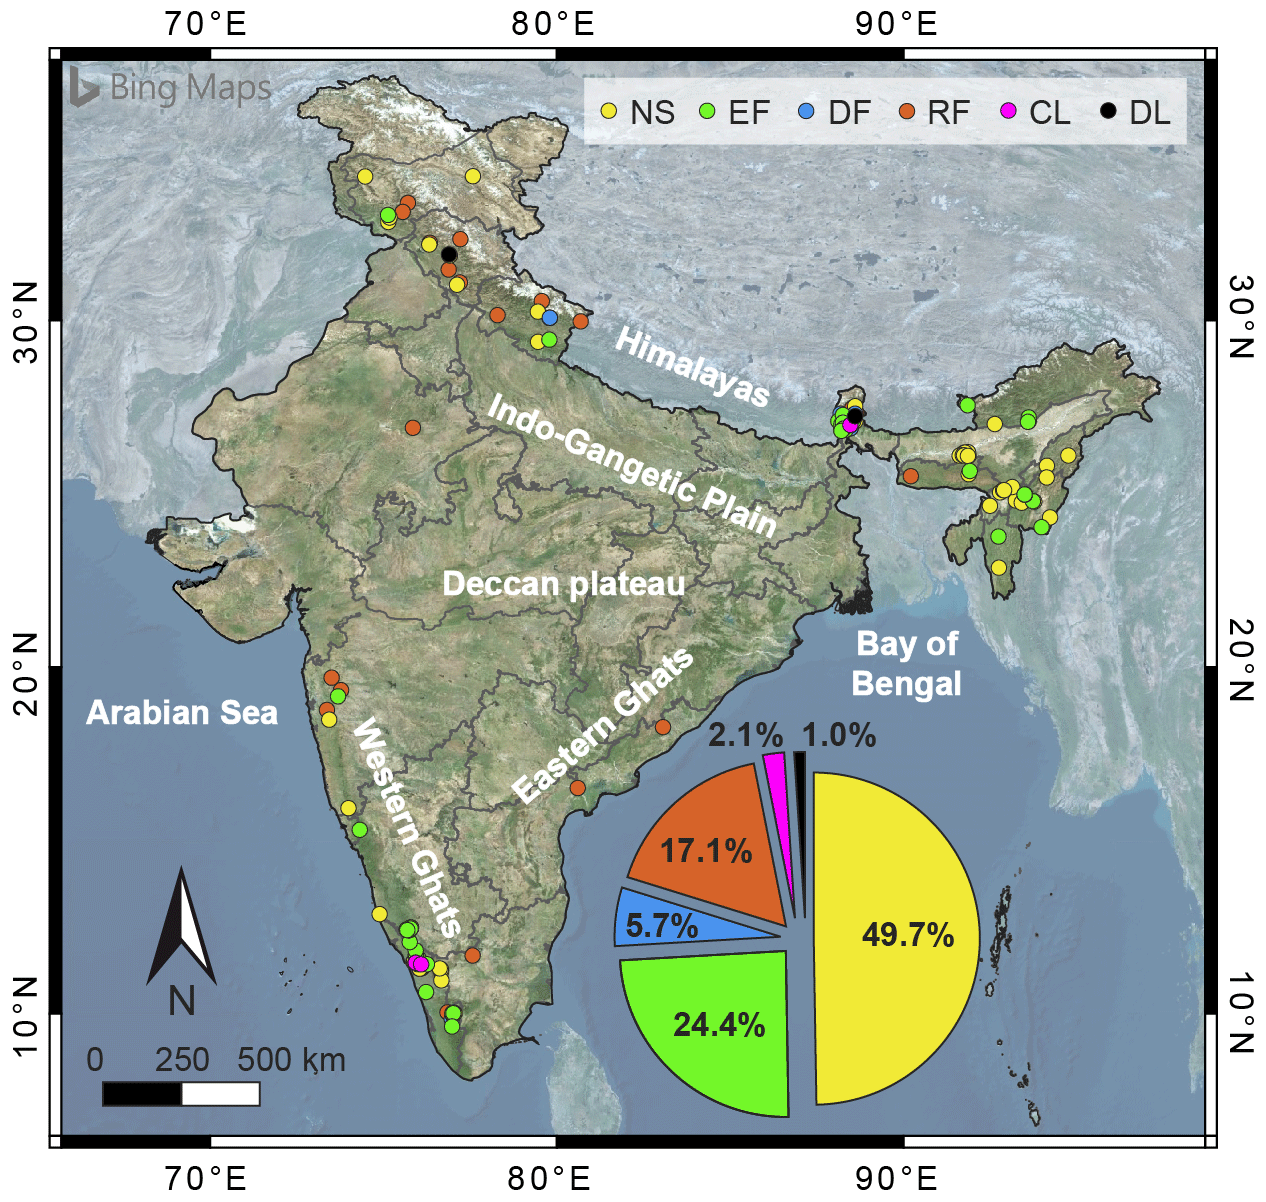
Figure 4Map of the location of the six types of landslide and the relative percentages. Key: CL, complex landslides; DF, debris flow; EF, earth or mudflow/mudslide; RF, rockfall/rockslide; DL, unspecified deep-seated landslide; NS, non-specified landslide. Background image from Bing © Microsoft.
3.2 Rainfall data
The rainfall measurements are obtained through three datasets available over the study area. In order to provide a robust and thorough analysis, we used observations obtained from ground stations as well as satellite sensors. The following assumptions apply to each of the considered datasets:
-
the rainfall estimate is used at its own native spatial resolution;
-
the analysis has been carried out at hourly and daily temporal scales; if the resolution was higher, the data have been summed up in order to obtain hourly rainfall.
The Indian Meteorological Department (IMD) dataset is based on ground observations coming from more than 6900 rain gauges (Pai et al., 2014). The rainfall recorded at each station is interpolated in space by using an inverse distance-weighted algorithm, providing a daily gridded dataset with a spatial resolution of 0.25∘ over the territory of India. Hereinafter this dataset is referred to as IMD.
SM2RAIN-derived rainfall is obtained by applying the SM2RAIN algorithm (Brocca et al., 2014) to satellite-based soil moisture data. By inverting the soil water balance equation, the algorithm allows us to estimate rainfall directly from soil moisture observations. The algorithm has been proven to provide accurate and reliable rainfall estimates that have already been used for natural hazard evaluation studies (Ciabatta et al., 2017; Brunetti et al., 2018a; Camici et al., 2020), ensuring satisfactory results in Europe. In this study, rainfall data obtained through the application of SM2RAIN to the ASCAT satellite soil moisture product (Wagner et al., 2013) provided by H SAF (the EUMETSAT Satellite Application Facility on Support to Operational Hydrology and Water Management) as product H117 are used. The product, hereinafter referred to as SM2R, has a spatial resolution of 0.1∘ and a daily temporal resolution.
The Integrated Multi-satellitE Retrievals for GPM (IMERG, Huffman et al., 2018) Early Run is used in this study as a state-of-the-art satellite rainfall product. The dataset is obtained by running the algorithm at 0.1∘ spatial and half-hourly temporal resolution from a constellation of microwave and infrared satellites. The Early Run version is characterized by a latency of 4–6 h after sensing. In order to achieve the hourly temporal resolution used for the analysis, two subsequent rainfall data are summed up. Hereinafter this dataset is referred to as IMERG-ER.
The satellite rainfall products here considered allow us to test the capabilities of two different retrieval algorithms, i.e. a state-of-the-art classical satellite rainfall product and a novel technique that estimates rainfall through soil moisture observations. Other reanalysis data were not considered as we wanted to investigate the use of near-real-time satellite products for a possible future operational application.
In order to test and highlight the added value of integrating rainfall estimates obtained through different approaches for landslide prediction, two additional merged products obtained through the merging of SM2R and IMERG-ER are created and used as input for determining the rainfall thresholds. The integration between these two different products has already been tested satisfactorily (Ciabatta et al., 2017; Massari et al., 2020). The integration allows us to take advantage of the capabilities of each approach and to limit the drawbacks, i.e. underestimation of rainfall by SM2RAIN when the soil is close to saturation or the overestimation by IMERG-ER for low-intensity rainfall events. The integration has been performed by following the approach proposed in Ciabatta et al. (2017). For the first merged product, IMERG-ER is summed up in order to obtain a daily temporal resolution. The merging between the two products is obtained by using Eq. (1):
where wi is the integration weight, ranging from 0 to 1, and it is estimated for each pixel using Eq. (2) (Kim et al., 2015):
where ρS1,S2 is the correlation between two generic datasets S1 and S2 and R is a reference rainfall product. In this analysis, ERA5 (Hersbach et al., 2020) is chosen as a reference rainfall product for estimating the integration weights. The integration between IMERG-ER and SM2R is the PMERG-D (daily) dataset.
The second merged product is obtained taking the total amount of rainfall estimated by PMERG-D and distributing it within each day by considering the hourly temporal distribution of IMERG-ER. In this way, the SM2R rainfall at the hourly temporal resolution is obtained. Hereinafter this dataset is referred to as PMERG-H.
Both PMERG-D and PMERG-H have the native spatial resolution of SM2R, i.e. 0.1∘.
3.3 Reconstruction of the triggering rainfall
The quantitative reconstruction of the rainfall conditions that likely caused the observed landslides is the first step in the identification of effective rainfall thresholds. We used CTRL-T software tool proposed by Melillo et al. (2018a) to single out rainfall events starting from continuous rainfall series. For each landslide, the tool (1) selects automatically the representative pixel, (2) identifies the most probable duration and cumulated rainfall (D, E) conditions assumed to have caused the landslides collected in the catalogue, and (3) calculates empirical cumulated event rainfall–rainfall duration (ED) thresholds at various non-exceedance probability (NEP) adopting the frequentist approach and a bootstrap technique (Brunetti et al., 2010; Peruccacci et al., 2012).
CTRL-T works on a continuous series of hourly or daily rainfall measurements or estimates for each pixel. We found that rainfall records for both the ground-based and satellite-based products contain some spurious values that prevent the reconstruction of the individual rainfall events by the CTRL-T tool (Melillo et al., 2015). To recognize and remove spurious events, we calibrated the cumulated rainfall in each pixel at the proper temporal resolution (hourly or daily) using the rainfall series of the Darjeeling district in the driest January and February months as a reference. The comparison between hyetographs from ground-based and satellite-based products highlighted that the remote-sensing signal was found even though it was not actually raining, and it was independent of the satellite product and of its temporal resolution. Therefore, we set heuristically a filter that removes 2 mm h−1 for IMERG-ER and PMERG-H and 2 mm d−1 for IMD, SM2R, and PMERG-D. We verified that the filter removes a small percentage (5 mm as a median) of the daily cumulated rainfall; nonetheless, this amount is nearly irrelevant for the landslide triggering.
Each landslide is associated with a single pixel of each product. Figure 5a shows a nested view of the cell grids for the ground-based (IMD) and two satellite-based (IMERG-ER and SM2R) products. To increase the reliability of the rainfall estimates, all the pixels whose centre falls into a circular buffer of 20 km radius from the landslide are enclosed in the analysis (Fig. 5b).
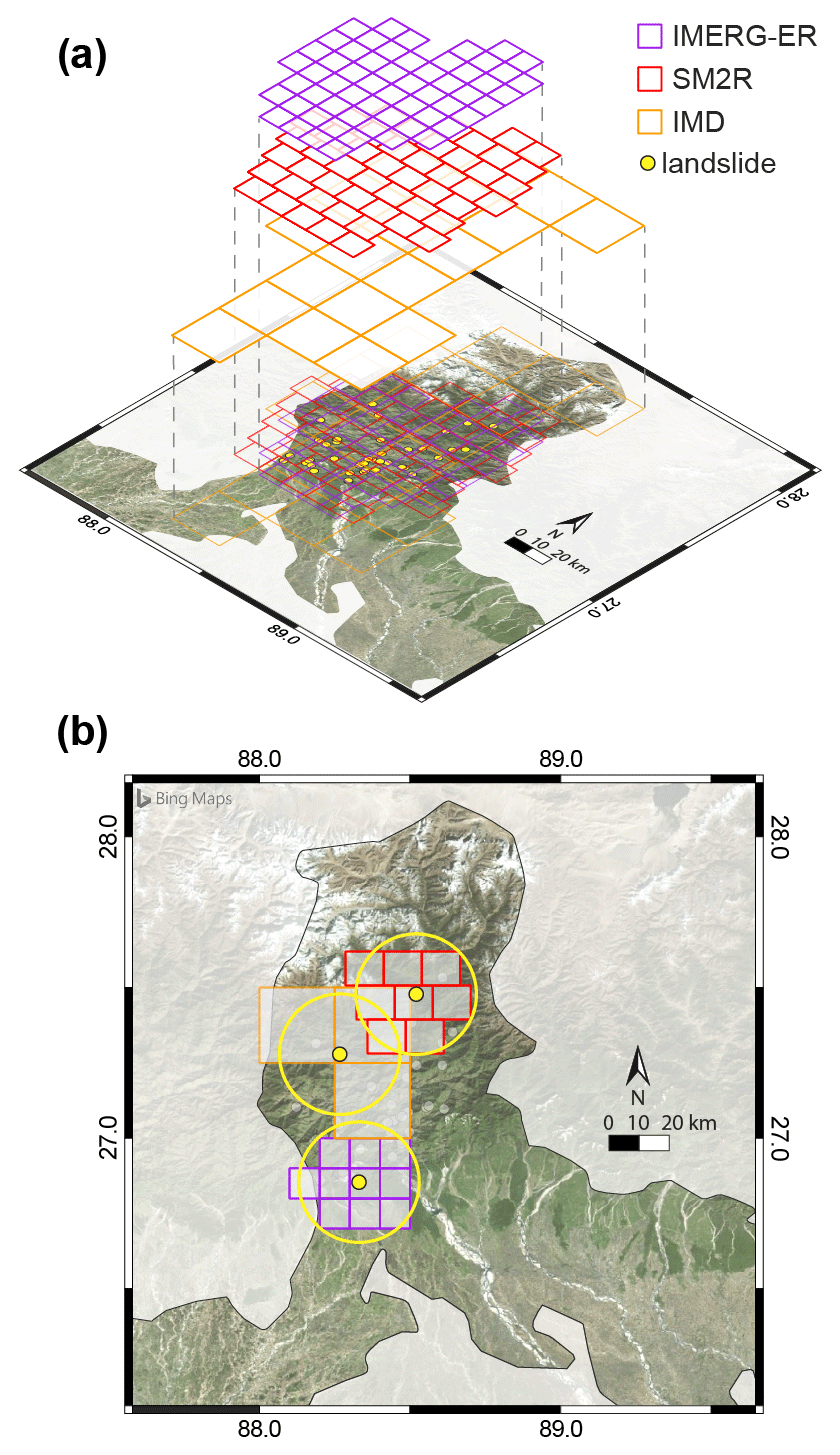
Figure 5(a) Comparison of the pixel resolution for the satellite-based IMERG, SM2RAIN and the ground-based IMD rainfall products. (b) Example of the pixel selection for three landslides using a 20 km buffer (yellow circle) for the state of Assam. Background image from Bing © Microsoft.
The reason for this choice is that often the pixel where the landslide falls may not faithfully measure the triggering rainfall. Possible causes of this are (i) malfunctioning of the sensor, (ii) the spatial averaging in the grid cell (e.g. an intense precipitation limited to a small area around the landslide), (iii) the case of landslides with medium (P2) to low (P4) position accuracy, and/or (iv) low temporal accuracy (T2 and T3). For one or more of the above reasons, CTRL-T is generally not able to reconstruct the triggering rainfall for all the landslides in the catalogue.
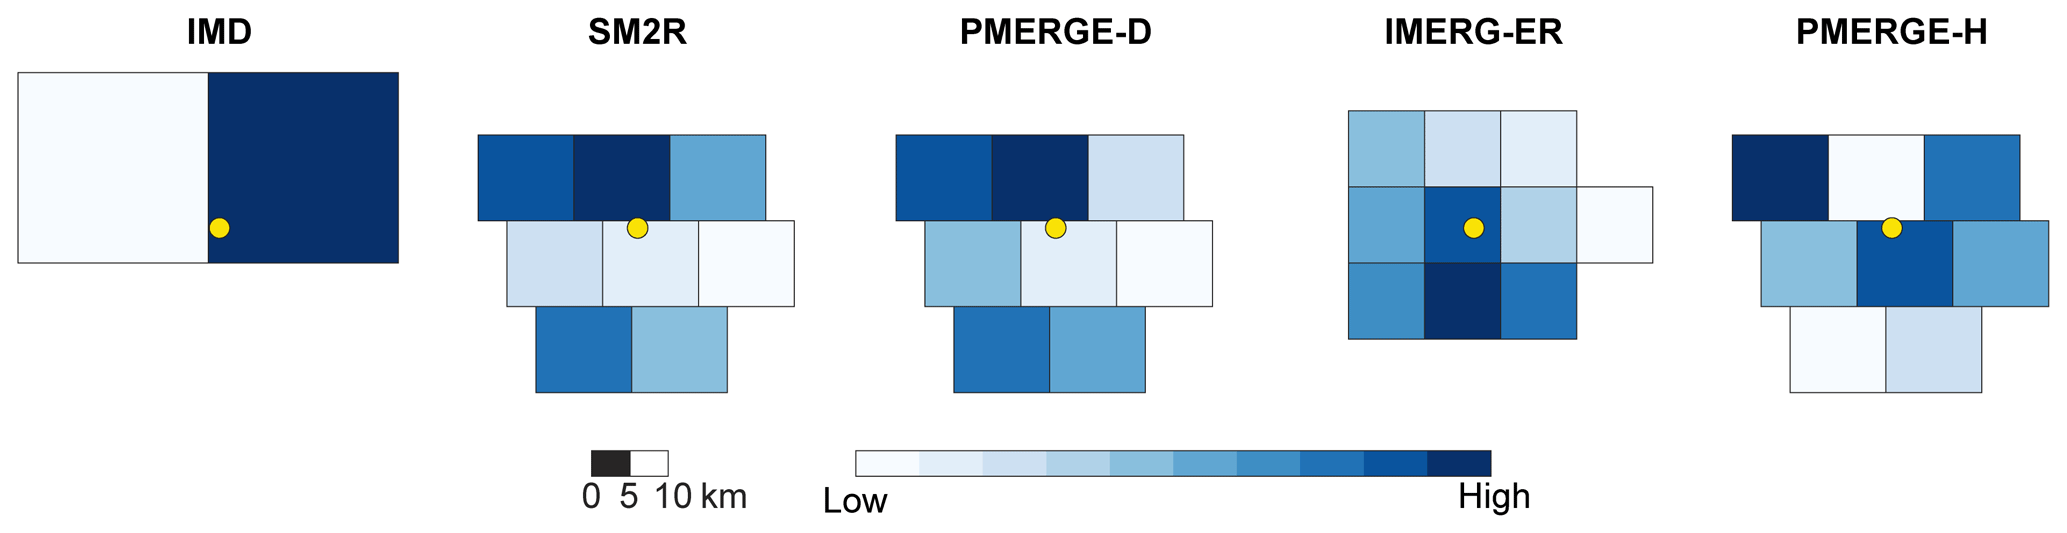
Figure 6Pixels enclosed in the buffer of a landslide (yellow dot) for each rainfall product coloured based on the weight. The representative pixel is the darkest one. The colour scale is qualitative, since it is different for each product.
To identify the representative pixel to be analysed, we used a weight, (modified after Melillo et al., 2018a). For the pool of pixels enclosed in the 20 km buffer centred on the landslide, the representative pixel is the one for which the (D, E) pair provides the highest weight. For a given landslide in the catalogue, Fig. 6 portrays the colour associated with the pixels selected for the reconstruction of the triggering rainfall for each product. The darker the colour, the higher the weight and hence the expected representativeness of the pixel. It can be observed that in many cases, the representative pixel (the darkest one) is not necessarily the one containing the landslide (yellow dot).
Once rainfall conditions have been reconstructed, CTRL-T calculates the rainfall thresholds. Empirical ED thresholds are power-law curves with the form
where E is in millimetres, D is in hours (or in days), α and γ are the scale and the slope parameters of the curve, respectively, and Δα and Δγ are the associated uncertainties (Peruccacci et al., 2012). It is worth noticing that the two temporal scales for daily and hourly datasets have to be expressed in days and hours, respectively (Gariano et al., 2020).
In order to assess the performance of the ground- and satellite-based rainfall products in predicting landslides in India, a validation of the thresholds has been carried out, following Brunetti et al. (2018a). For each product, we sampled randomly without repetition 70 % of the reconstructed (D, E) pairs to obtain 100 new datasets. Then, for each dataset we calculated rainfall thresholds at varying NEP. The remaining 30 % of (D, E) pairs were used to evaluate the threshold performance by means of a contingency table (reporting binary classifiers of rainfall conditions that triggered or did not trigger landslides), skill scores, and ROC (receiver operating characteristic) analysis, following Gariano et al. (2015) and Brunetti et al. (2018a). In particular, POD (probability of detection) and POFD (probability of false detection) are calculated as follows: POD = TP/(TP + FN) and POFD = FP/(FP + TN), where TP is a true positive and FN is a false negative, i.e. a landslide-triggering rainfall condition located above and below the threshold, respectively, while FP is a false positive and TN is a true negative, i.e. a rainfall condition without landslides located above and below the threshold, respectively. POD and POFD are used as y and x values of the ROC space, respectively (Fawcett, 2006). Each (POFD, POD) pair represents the prediction performance of a threshold, and the Euclidean distance of the pair from the upper left corner in the ROC plane (POD = 1, POFD = 0) is used as a measure of the goodness of the threshold. The ROC curve for each rainfall product is drawn by varying the NEP of the threshold, and the area under curve (AUC) is used as a measure of the goodness of each product.
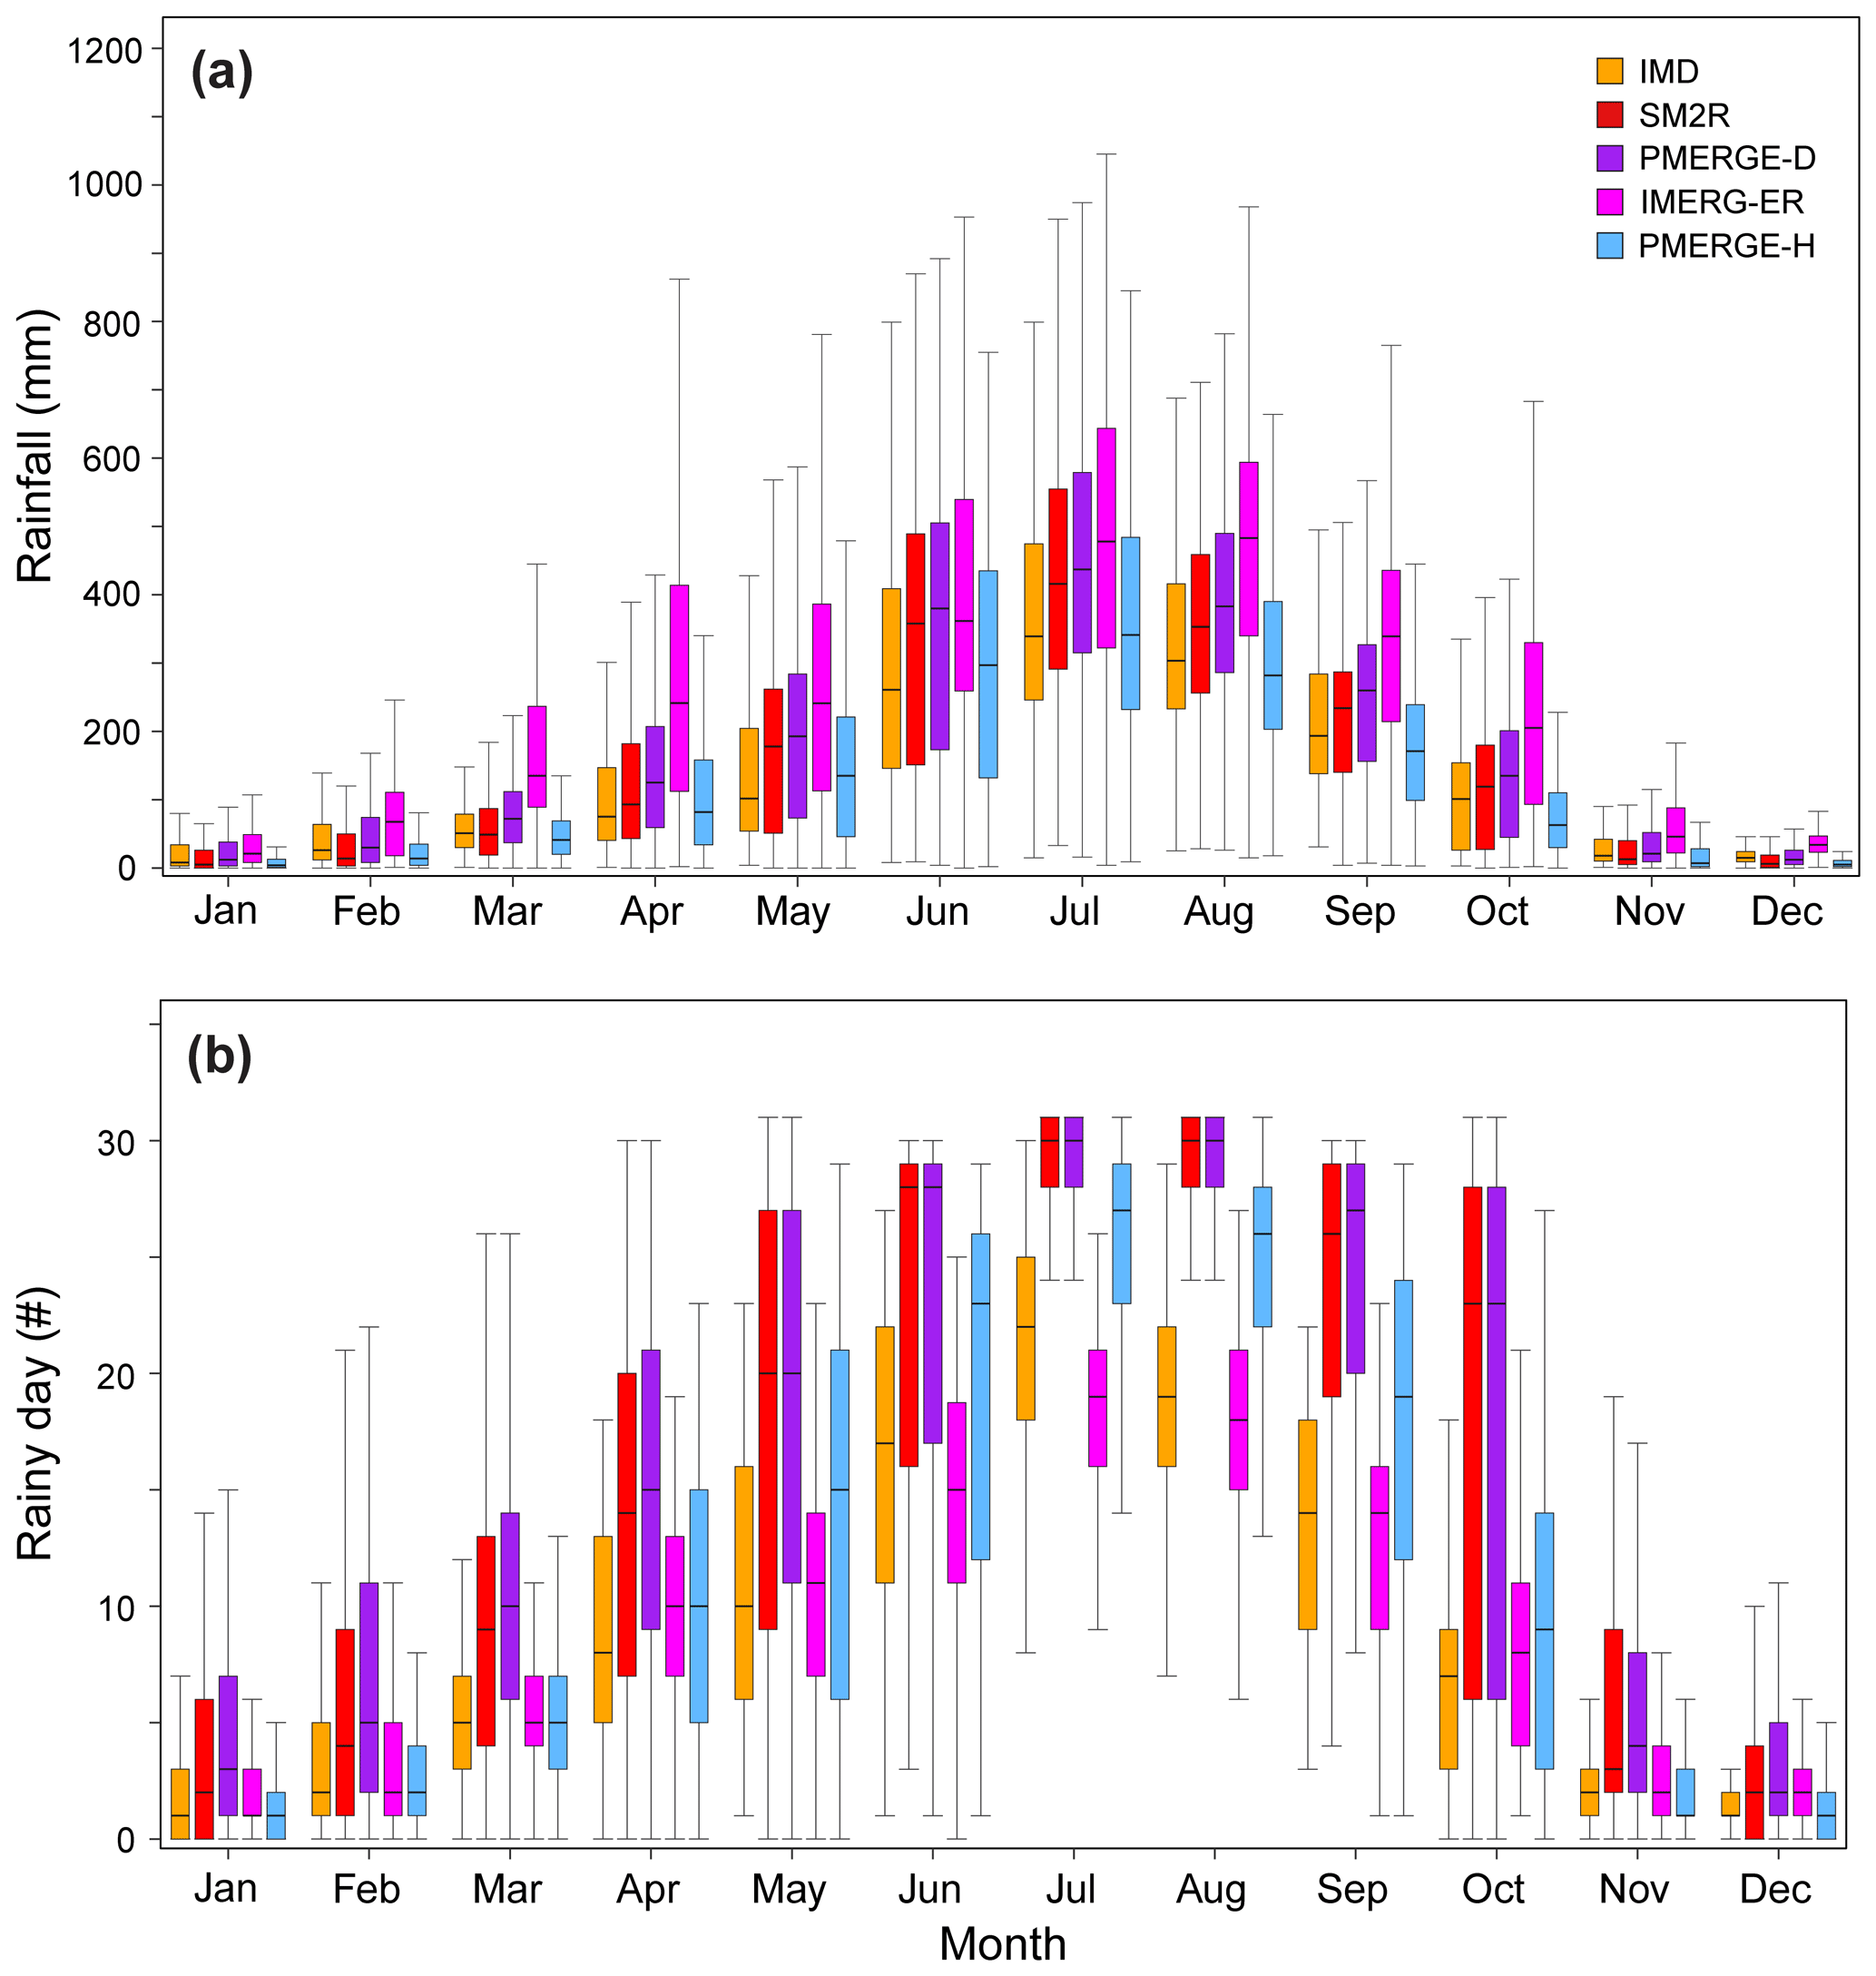
Figure 7Box-and-whisker plots showing the distribution of (a) the monthly amount of rainfall as estimated by the satellite-based and measured ground-based products in the selected pixels and (b) the monthly number of rainy days.
In the following, we report the analyses of the rainfall measurements and rainfall estimates of the five products to compare their capability to capture the rainfall over India.
Figure 7a shows the box-and-whisker plots of the monthly rainfall for each product in the analysed time period (2007–2019) for the selected pixels with landslides. With regard to the daily temporal resolution, Fig. 7a reveals that the rainfall estimated by PMERG-D is comparable to that of SM2R, as expected for a derived product. The two exhibit median values similar to or higher than the ground-based IMD product, especially during the rainy season. At the hourly temporal resolution, the two IMERG-ER and PMERG-H products look noticeably different, the rainfall from IMERG-ER being steadily higher over time. As an example, in the two peak monsoon months of July and August the median value is nearly constant and amounts to about 480 mm for IMERG-ER, while it decreases from 340 to 280 mm for PMERG-H. Overall for the 2 months, the median of IMERG-ER is 1.4 to 1.6 times higher than that of PMERG-H, while in the dry period this proportion is even more than 6 (e.g. November and December). The PMERG-H merged product is comparable to IMD, whereas on average the median value of IMERG-ER is about 1.5 and 2.5 times higher than IMD in the rainy and dry seasons, respectively. In order to investigate how the rainfall is distributed over a daily scale, we calculated the number of rainy days per month for each product (Fig. 7b).
A variable number of rainy days is observed among the various datasets, except for SM2R and PMERG-D, which are very similar. These two products exhibit the highest number of rainy days along the whole year, and they show a kind of saturation in July and August when the rainfall turns out to be uninterrupted for the whole month (30 d). Among the satellite-based datasets, IMERG-ER is the one with the lowest number of rainy days, nearly comparable to that of IMD, even though IMERG-ER has the most abundant rainfall (Fig. 7a). Overall, Fig. 7b highlights that SM2R and PMERG-D likely overestimate the number of rainy days, especially from May to October. In particular, in October we obtain median values of 7 rainy days for IMD, 9 for IMERG-ER, 12 for PMERG-H, and 23 for SM2R and PMERG-D.
Once we have reconstructed for each product the rainfall (D, E) conditions that have triggered the landslides in the catalogue, we calculated ED rainfall thresholds at varying NEP for the daily and hourly datasets. As an example, Fig. 8a shows the comparison between rainfall (D, E) pairs and relative thresholds at 5 % NEP for SM2R and PMERGE-D. From the figure it is evident that SM2R and PMERGE-D (D, E) pairs are shifted towards longer durations than those associated with IMD. The T5,SM2R threshold is the lowest one and is parallel to T5,IMD. For rainfall durations shorter than 12 d, T5,PMERGE-D is the highest one. Figure 8b compares the thresholds of the 2-hourly datasets and shows that rainfall (D, E) conditions from IMERG-ER are on average more severe than those reconstructed using PMERG-H data. As a consequence, T5,IMERG-ER turns out to be higher than T5,PMERG-H.
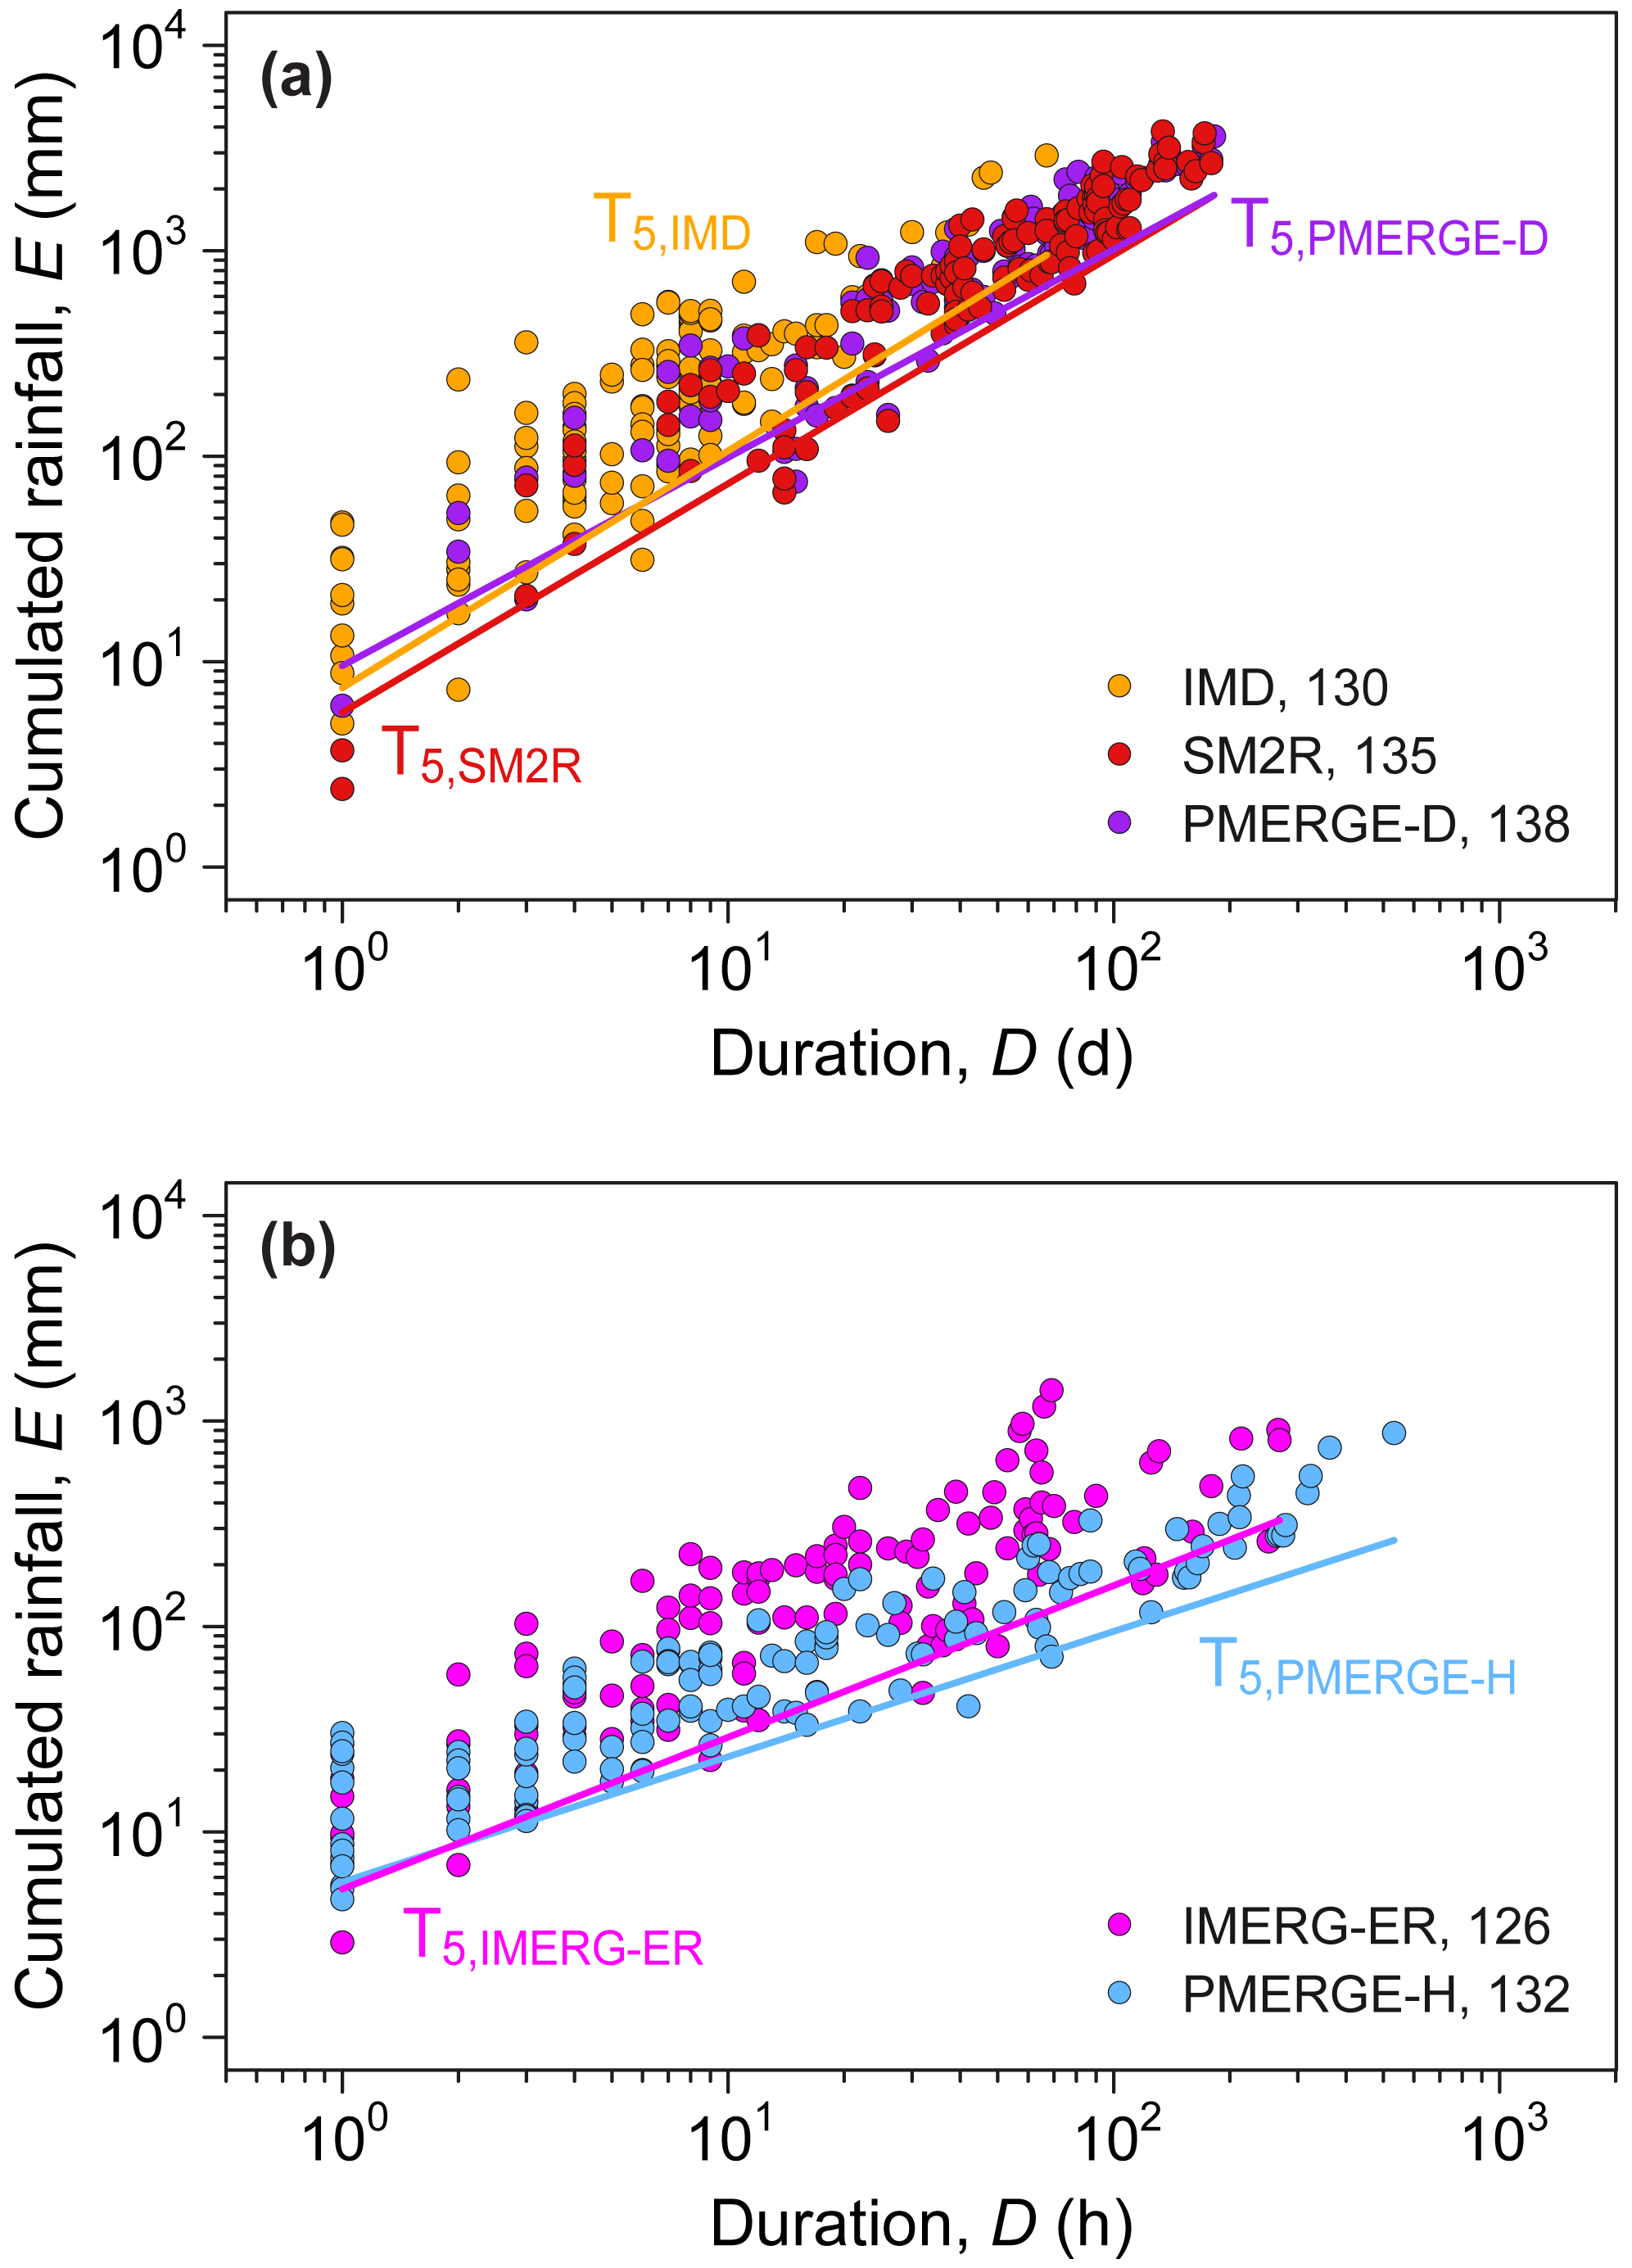
Figure 8Rainfall (D, E) conditions and rainfall thresholds at 5 % NEP level for (a) the daily resolution products IMD, SM2RASC and PMERGE-D and (b) the hourly resolution products IMERG and PMERGE-D.
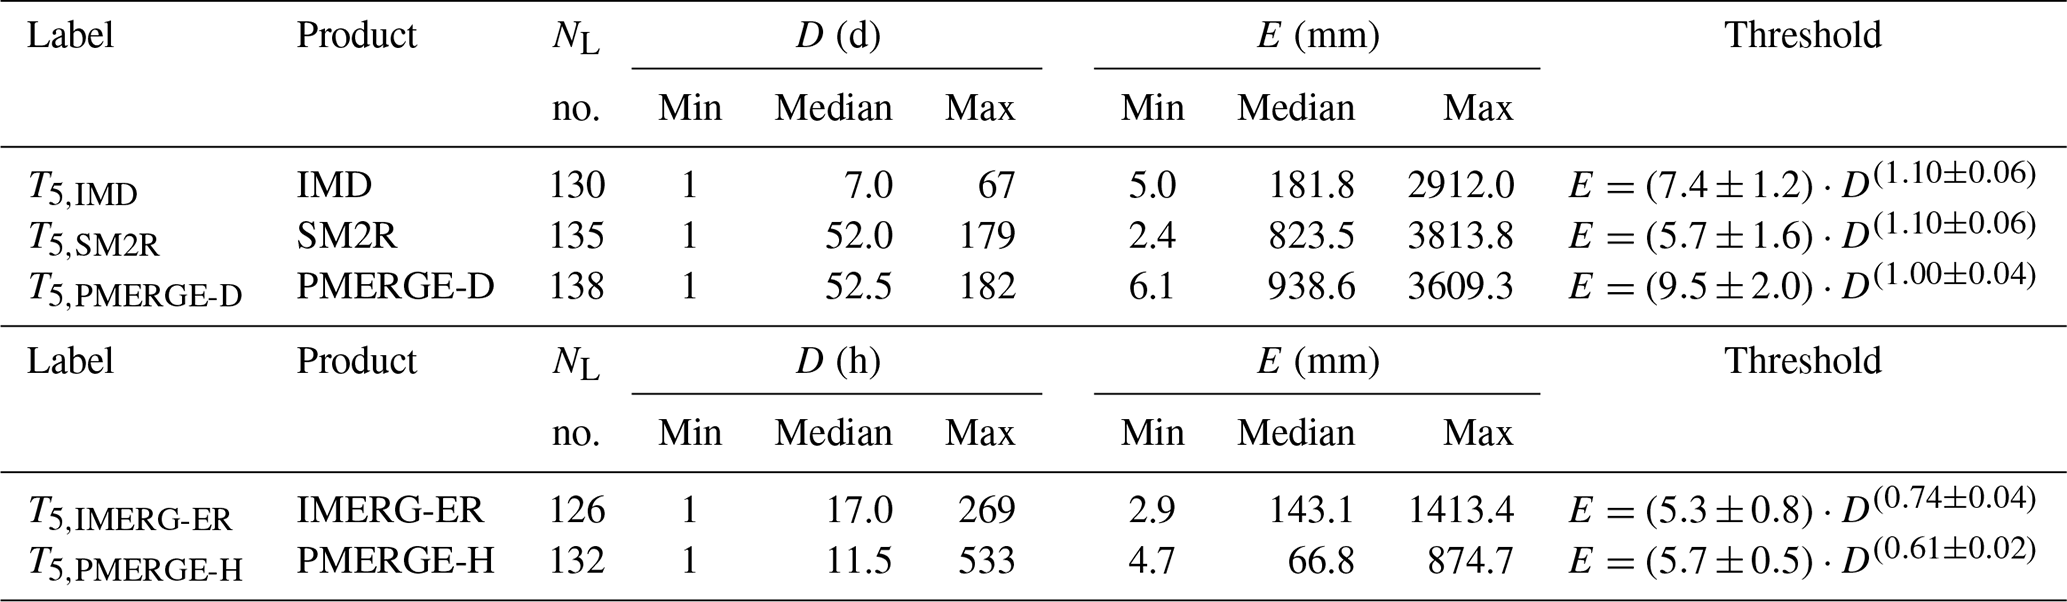
Table 1 lists for each product the number of landslides and the descriptive statistics of the rainfall (D, E) conditions used to define the thresholds and the equations of the curves, with their uncertainties. For the daily-based satellite data, the median duration (D) of the triggering rainfall is more than 7 times longer than that of IMD, and the maximum duration is about 3 times, confirming what is observed in Fig. 8a. Consequently, the median value of the cumulated rainfall for SM2R and PMERG-D is 4.5 to 5.2 times higher than that of IMD. For the hourly-based data, the duration median value for IMERG-ER is higher than that of PMERG-H, whereas the maximum value is about one-half. According to Fig. 7a, the median and the maximum cumulated rainfall (E) for IMERG-ER are largely higher than those of PMERG-H. For an easier comparison between the thresholds, the uncertainties have not been drawn in Fig. 8a and b but are shown in Table 1.
Table 1ED thresholds for possible landslide occurrence in India. Label identifies the thresholds established in this work for the listed product. NL, number of landslides with reconstructed rainfall conditions. D and E, the rainfall duration (in days or hours) and cumulated event rainfall (in millimetres). The threshold column lists the equations for the 5 % ED thresholds.
The performance of the ground- and satellite-based rainfall products in predicting landslides in India is evaluated through the ROC analysis. Figure 9 portrays the comparison between the rainfall products varying the NEP of the threshold, where error bars represent their uncertainties. For a quantitative analysis, the inset graph in the figure shows the AUC for each product. Based on this outcome, the 2-hourly PMERGE-H and IMERG-ER perform best in predicting landslides in India, whereas the ground-based IMD is the less-performing product. We acknowledge that the comparison may be biased by the different temporal and spatial resolution of the data.
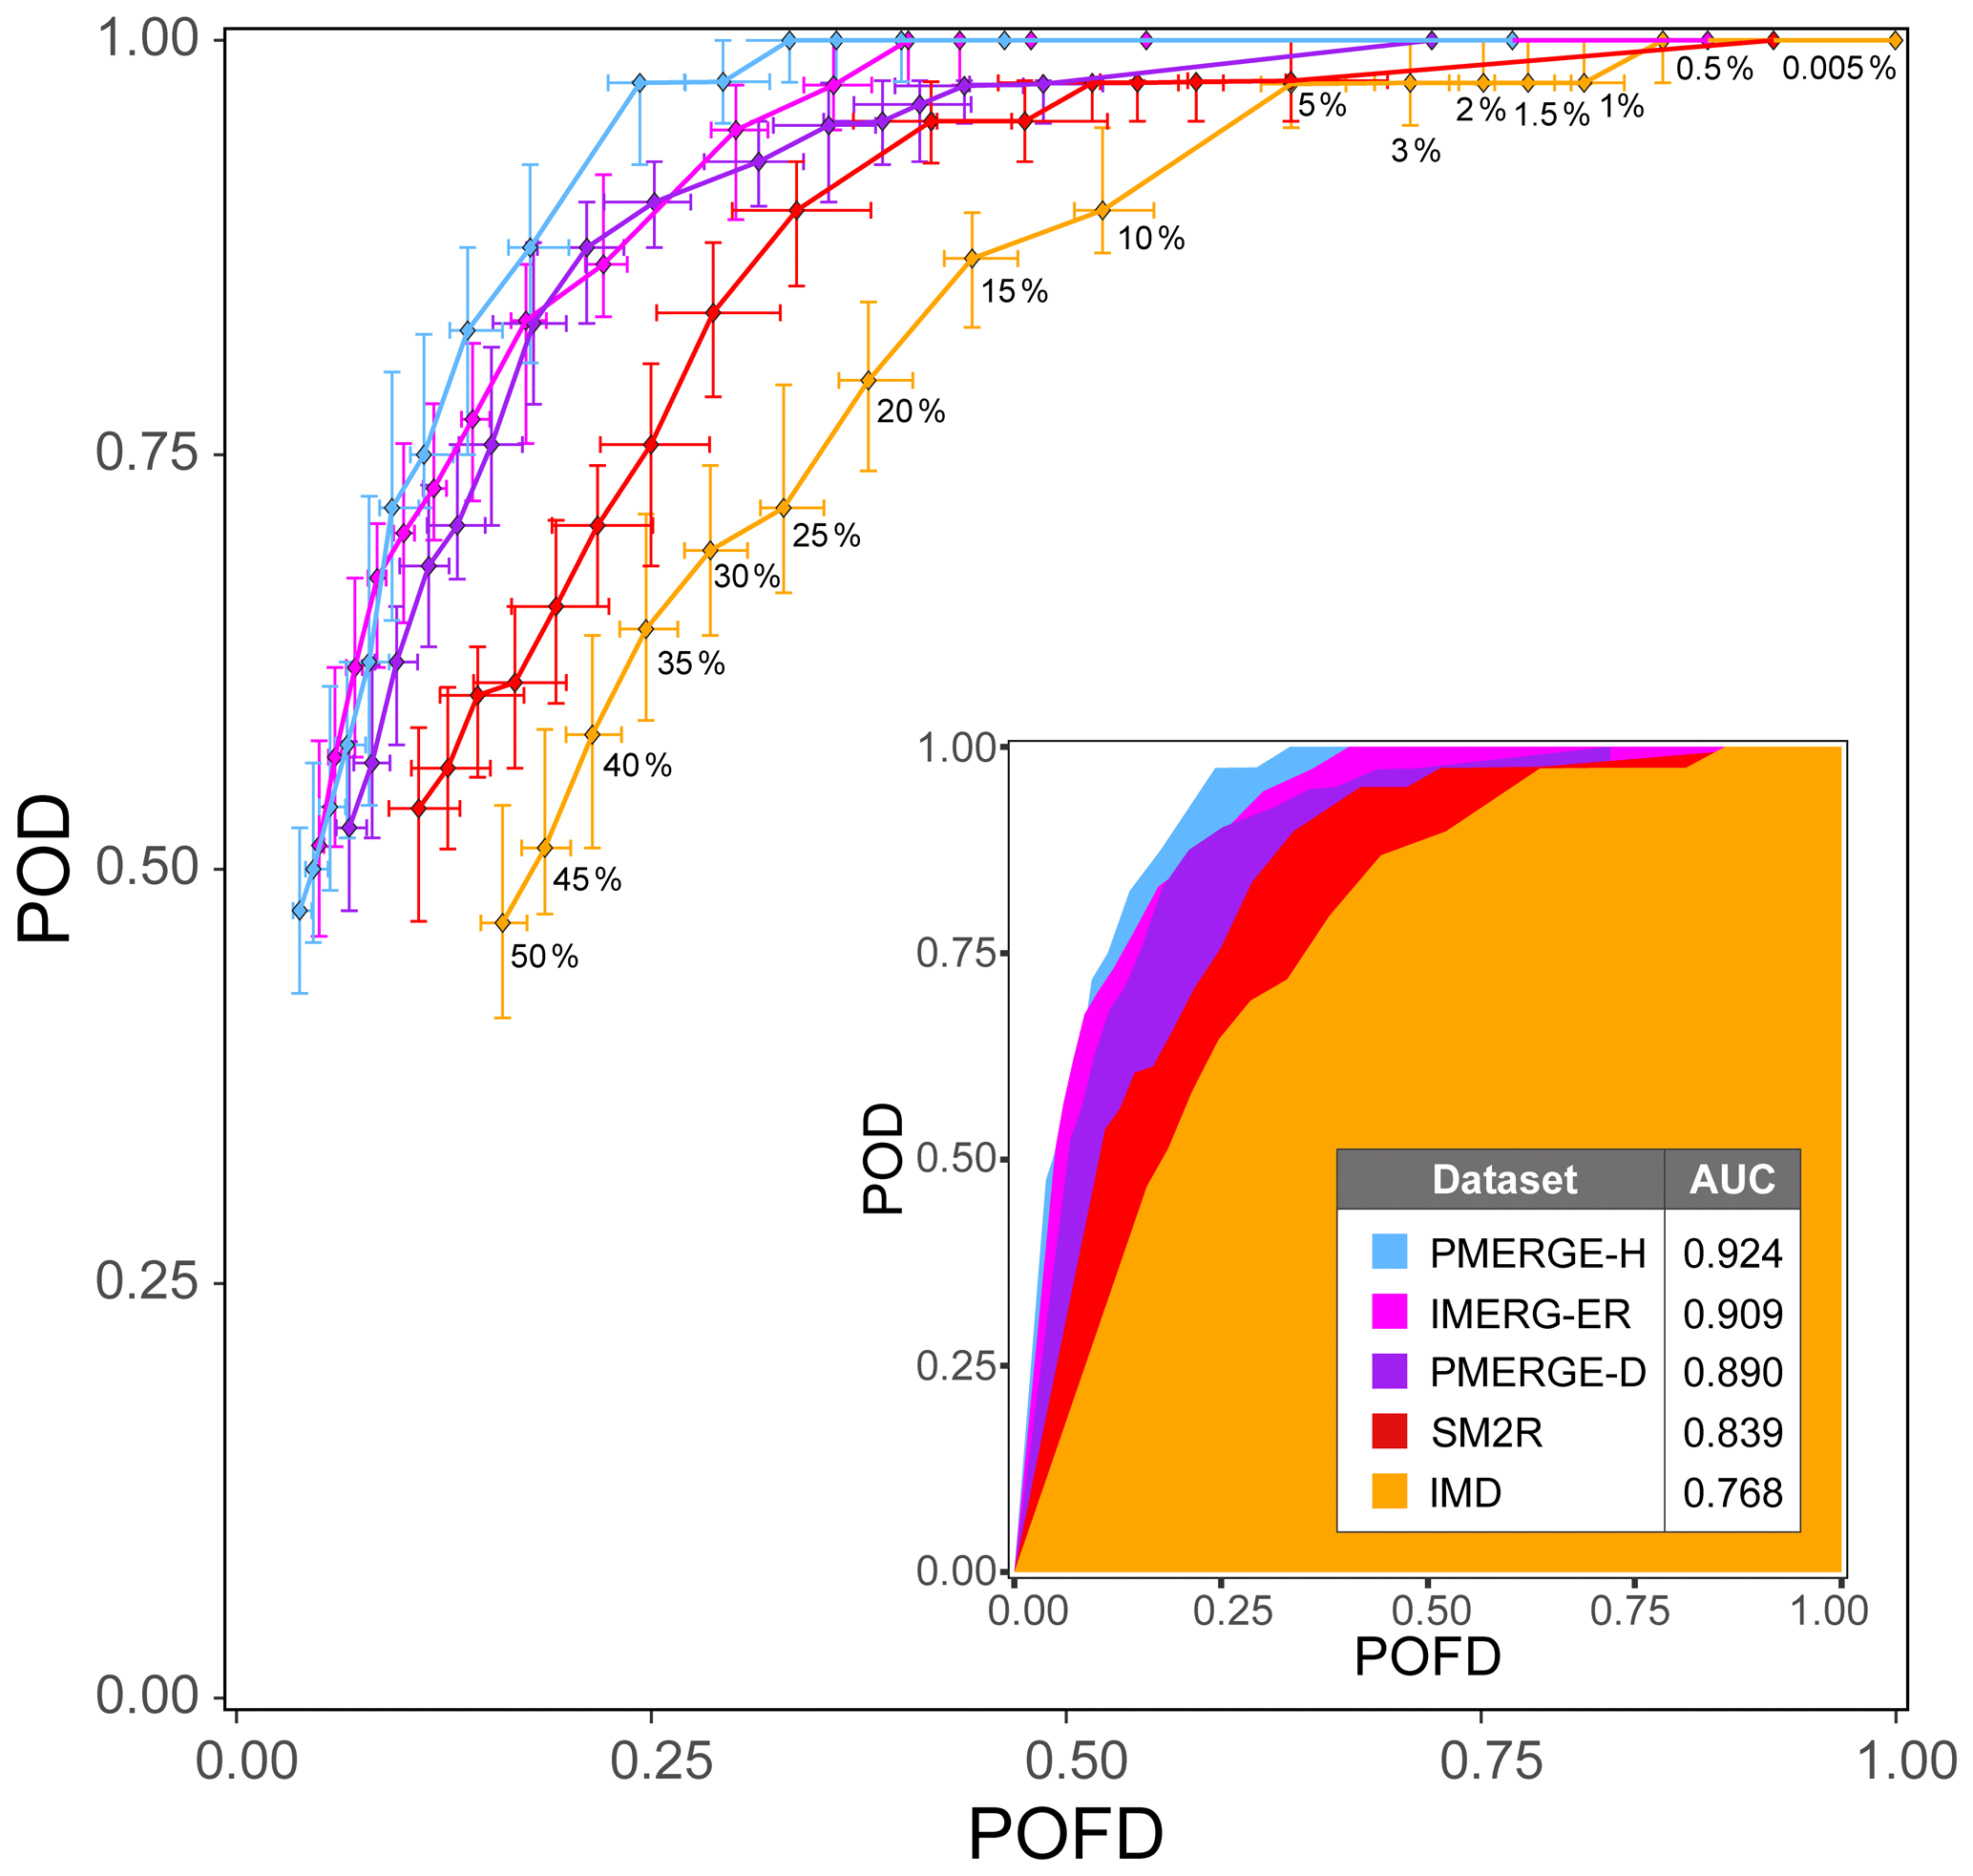
Figure 9ROC analysis derived by varying the NEP for the IMD (orange), SM2R (red), PMERGE-D (purple), IMERG (magenta), and PMERGE-H (blue) datasets. Error bars depict the interval of variation of POFD and POD. Inset graph shows the AUC for each product.
The comparative study among different rainfall products in predicting rainfall-induced landslides has shown the outperformance of satellite products over ground-based observations in India (Fig. 9). Nevertheless, a detailed analysis of the procedure used and the results obtained is mandatory to infer the actual potential of the satellite rainfall estimations to predict the rainfall conditions that may initiate future landslides. First, we acknowledge that the landslides gathered in the catalogue are a limited sample of the analysed time period for which we found detailed spatial and temporal information (Fig. 3b and c). Nevertheless, we maintain that the dataset is a good sample, most of the information being found in technical reports (Fig. 3a) that usually meet reliability requirements.
Analysing the impact of landslides on the population, Fig. 2b shows that the highest numbers of deaths is reported in July and August, while instead the highest number of slope failures occurred in June (Fig. 2a). The lack of a proportion could be ascribed to the abundant and intense rainfall of July and August throughout the territory (Fig. 7a) that is able to initiate extensive, fast landslides (e.g. mudflows) so severe as to destroy homes and villages, causing human losses. We observed that the landslides in the catalogue for which we know the type and that have caused more victims (82 %) are earth or mudflows/mudslides (EF).
In order to reconstruct the individual rainfall events with the CTRL-T tool, we removed a sort of white noise from data by using the rainfall series of the Darjeeling district in January and February. We acknowledge that such calibration could be dependent on the location where it was performed and may also be dependent on the amount of rain (e.g. in monsoon months).
The rainfall estimated by SM2R and PMERGE-D is almost continuous in the monsoon months, as shown by the number of rainy days, considerably higher than that of IMD and of the hourly IMERG-ER and PMERG-H products (Fig. 7b). This is in spite of the median monthly rainfall, which is in the same range of that measured or estimated by the other products. Overall, the rainfall (D, E) conditions reconstructed by SM2R and PMERGE-D are by far longer than those obtained from IMD (Fig. 8a, Table 1).
Given the vastness and variety of the Indian territory, the thresholds defined in this work (Fig. 8a and b) do not claim to be used in local landslide early warning systems. To calculate trigger thresholds based on local homogeneous sub-areas would require a larger amount of data (Peruccacci et al., 2012). Here, the use of thresholds at a wider regional scale aims at comparing the performance of satellite- and ground-based rainfall data in order to identify those products, which are suited to giving a robust landslide prediction. A further improvement would be the same analysis at local scale in order to highlight which product works better or worse in a given sub-area. As stated above, this also requires enrichment of the landslide catalogue.
The ROC analysis (Fig. 9) shows that in India the products that work best are the hourly-based PMERG-H and IMERG-ER. A similar performance is also achieved with PMERG-D, while among satellite products, SM2R is the least performing. Overall, the efficiency of the ground-based IMD is the lowest in predicting the rainfall-induced slope failures. This outcome could be somewhat unexpected since IMD is obtained by the interpolation of point rainfall measurements from rain gauges and, hence, we would expect more precise rainfall data than the spatially averaged (pixel-scale) estimates of the satellite rainfall products. As an example, Brunetti et al. (2018a) in Italy found a better performance of the ground-based rainfall data compared to satellite data. Thomas et al. (2019) in the San Francisco Bay Area, using a network of 96 tipping buckets (∼2.5 km spacing), found that the ground-based dataset was able to capture the orographic influence on rainfall intensity and cumulated amounts more accurately than the IMERG dataset. In our case, we hypothesize that the 0.25∘ grid spacing (Fig. 6) is able to explain a possible underestimation of the rainfall in many areas of India where the rain gauge density is low or even the stations are not working properly. Moreover, the degree to which ground-based measurements outperform or underperform relative to satellite products may depend on where the in situ measurements are placed within the landscape, especially in steep, landslide-prone terrain. The above considerations would also explain the larger dispersion of the IMD rainfall (D, E) conditions with respect to SM2R and PMERG-D (Fig. 8a). Conversely, the other products have significantly finer spatial resolutions, i.e. 0.1∘ for IMERG-ER, SM2R, PMERG-D, and PMERG-H. In addition to the spatial resolution issues, Marra (2019) and Gariano et al. (2020) observed that the use of daily resolution data leads to a general worsening of the predicting capability compared to hourly data.
Inspection of Fig. 8b reveals that the rainfall (D, E) conditions that have triggered the majority of the landslides listed in the catalogue (58 % and 64 % for IMERG-ER and PMERGE-H, respectively) have a rainfall duration of less than 24 h. As a consequence, the use of daily resolution data alters the actual triggering rainfall of those landslides. For the SM2R and PMERG-D datasets, only 7 % of rainfall (D, E) conditions have a duration D<7 d (IMD median value) and only 1 % equal 1 d. This is ascribed to the nearly continuous rainfall detected by SM2R and PMERG-D, especially in the monsoon months (Fig. 7b). For this reason, it would eventually be more appropriate to implement landslide early warning systems that use rainfall thresholds defined with hourly data.
This work represents a first attempt to ascertain at the regional (sub-continental) scale of India which are the best products for the prediction of rainfall-induced landslides. The results suggest that among the available satellite and ground-based products, the best-performing ones are those meeting an hourly temporal resolution with an adequate spatial sampling.
The CTRL-T software tool was written using the R open-source software and can be freely downloaded at https://doi.org/10.5281/zenodo.4533719 (Melillo et al., 2018b).
The SM2RAIN-ASCAT rainfall dataset is available for free at https://doi.org/10.5281/zenodo.3972958 (Brocca et al., 2019).
The GPM IMERG Early Run dataset is available after registration at https://search.earthdata.nasa.gov/search?q=GPM_3IMERGHHE_06 (last access: 20 January 2021) (NASA, 2021).
The IMD dataset is provided by the Indian Meteorological Department.
MTB, MM, SLG and SP designed the experiment and carried it out. LC, LB and GA provided the rainfall data, MTB and SP collected the landslide information, and MM performed the simulations. MTB, MM, SLG, LB and SP analysed the results and MTB, MM, SLG and SP prepared the figures. All the authors wrote and revised the text.
The authors declare that they have no conflict of interest.
We thank the Indian Meteorological Department (IMD) for providing the ground-based data and the Geological Survey of India for making landslide information accessible on their official website (https://www.gsi.gov.in/webcenter/portal/OCBIS, last access: 21 January 2021). We also thank Ben Mirus and the anonymous reviewer for their helpful suggestions.
We are grateful for support from EUMETSAT through the Global SM2RAIN project (contract no. EUM/CO/17/4600001981/BBo) and the “Satellite Application 80 Facility on Support to Operational Hydrology and Water Management (H SAF)” CDOP 3 (grant no. EUM/C/85/16/DOC/15). Giriraj Amarnath would like to thank CGIAR Research Program (CRP) on Water, Land and Ecosystems (WLE) for the funding support (grant no. D-0212-M-1101).
This paper was edited by Roberto Greco and reviewed by Ben Mirus and one anonymous referee.
Adamson, G. C. D. and Nash, D. J.: Long-term variability in the date of monsoon onset over western India, Clim. Dynam., 40, 2589–2603, https://doi.org/10.1007/s00382-012-1494-x, 2013.
Annamalai, H., Slingo, J. M., Sperber, K. R., and Hodges, K.: The mean evolution and variability of the Asian summer monsoon: comparison of ECMWF and NCEP–NCAR reanalyses, Mon. Weather Rev., 127, 1157–1186, https://doi.org/10.1175/1520-0493(1999)127<1157:TMEAVO>2.0.CO;2, 1999.
Berti, M., Martina, M. L. V., Franceschini, S., Pignone, S., Simoni, A., and Pizziolo, M.: Probabilistic rainfall thresholds for landslide occurrence using a Bayesian approach, J. Geophys. Res., 117, F04006, https://doi.org/10.1029/2012JF002367, 2012.
Brocca, L., Ciabatta, L., Massari, C., Moramarco, T., Hahn, S., Hasenauer, S., Kidd, R., Dorigo, W., Wagner, W., and Levizzani, V.: Soil as a natural rain gauge: estimating global rainfall from satellite soil moisture data, J. Geophys. Res., 119, 5128–5141, https://doi.org/10.1002/2014JD021489, 2014.
Brocca, L., Filippucci, P., Hahn, S., Ciabatta, L., Massari, C., Camici, S., Schüller, L., Bojkov, B., and Wagner, W.: SM2RAIN-ASCAT (2007–June 2020): global daily satellite rainfall from ASCAT soil moisture (Version 1.3) [Data set], Zenodo, https://doi.org/10.5281/zenodo.3972958, 2019.
Brunetti, M. T., Peruccacci, S., Rossi, M., Luciani, S., Valigi, D., and Guzzetti, F.: Rainfall thresholds for the possible occurrence of landslides in Italy, Nat. Hazards Earth Syst. Sci., 10, 447–458, https://doi.org/10.5194/nhess-10-447-2010, 2010.
Brunetti, M. T., Melillo, M., Peruccacci, S., Ciabatta, L., and Brocca, L.: How far are we from the use of satellite rainfall products in landslide forecasting?, Remote Sens. Environ., 210, 65–75, https://doi.org/10.1016/j.rse.2018.03.016, 2018a.
Brunetti, M. T., Peruccacci, S., Palladino, M. R., Viero, A., and Guzzetti, F.: TXT-tool 2.039-1.2: Rainfall Thresholds for the Possible Initiation of Landslides in the Italian Alps, in: Landslide Dynamics: ISDR-ICL Landslide Interactive Teaching Tools, Vol. 1: Fundamentals, Mapping and Monitoring, edited by: Sassa, K., Guzzetti, F., Yamagishi, H., Arbanas, Ž., and Casagli, N., Springer, Cham, 361–369, https://doi.org/10.1007/978-3-319-57774-6_26, 2018b.
Camici, S., Massari, C., Ciabatta, L., Marchesini, I., and Brocca, L.: Which rainfall metric is more informative about the flood simulation performance? A comprehensive assessment on 1318 basins over Europe, Hydrol. Earth Syst. Sci., 24, 4869–4885, https://doi.org/10.5194/hess-24-4869-2020, 2020.
Cepeda, J., Höeg, K., and Nadim, F.: Landslide-triggering rainfall thresholds: a conceptual framework, Q. J. Eng. Geol. Hydroge., 43, 69–84, https://doi.org/10.1144/1470-9236/08-066, 2010.
Ciabatta, L., Marra, A. C., Panegrossi, G., Casella, D., Sanò, P., Dietrich, S., Massari, C., and Brocca, L.: Daily precipitation estimation through different microwave sensors: Verification study over Italy, J. Hydrol., 545, 436–450, https://doi.org/10.1016/j.jhydrol.2016.12.057, 2017.
Dikshit, A. and Satym, N.: Probabilistic rainfall thresholds in Chibo, India: estimation and validation using monitoring system, J. Mt. Sci., 16, 870–883, https://doi.org/10.1007/s11629-018-5189-6, 2019.
Dikshit, A., Satym, N., Pradhan, B., and Kushal, S.: Estimating rainfall threshold and temporal probability for landslide occurrences in Darjeeling Himalayas, Geosci. J., 24, 225–233, https://doi.org/10.1007/s12303-020-0001-3, 2020a.
Dikshit, A., Sarkar, R., Pradhan, B., Segoni, S., and Alamri, A. M.: Rainfall induced landslide studies in Indian Himalayan region: a critical review, Appl. Sci., 10, 2466, https://doi.org/10.3390/app10072466, 2020b.
Fawcett, T.: An introduction to ROC analysis, Pattern Recogn. Lett., 27, 861–874, https://doi.org/10.1016/j.patrec.2005.10.010, 2006.
Froude, M. J. and Petley, D. N.: Global fatal landslide occurrence from 2004 to 2016, Nat. Hazards Earth Syst. Sci., 18, 2161–2181, https://doi.org/10.5194/nhess-18-2161-2018, 2018.
Gariano, S. L., Brunetti, M. T., Iovine, G., Melillo, M., Peruccacci, S., Terranova, O., Vennari, C., and Guzzetti, F.: Calibration and validation of rainfall thresholds for shallow landslide forecasting in Sicily, southern Italy, Geomorphology, 228, 653–665, https://doi.org/10.1016/j.geomorph.2014.10.019, 2015.
Gariano, S. L., Sarkar, R., Dikshit, A., Dorji, K., Brunetti, M. T., Peruccacci, S., and Melillo, M.: Automatic calculation of rainfall thresholds for landslide occurrence in Chukha Dzongkhag, Bhutan, Bull. Eng. Geol. Environ., 78, 4325–4332, https://doi.org/10.1007/s10064-018-1415-2, 2019.
Gariano, S. L., Melillo, M., Peruccacci, S., and Brunetti, M. T.: How much does the rainfall temporal resolution affect rainfall thresholds for landslide triggering?, Nat. Hazards, 100, 655–670, https://doi.org/10.1007/s11069-019-03830-x, 2020.
Geethu, T. H., Madhu, D., Ramesh, M. V., and Pullarkatt, D.: Towards establishing rainfall thresholds for a real-time landslide early warning system in Sikkim, India, Landslides, 16, 2395–2408, https://doi.org/10.1007/s10346-019-01244-1, 2019.
Guha-Sapir, D., Below, R., and Hoyois, P. H.: EM-DAT: International Disaster Database, Université Catholique de Louvain, Brussels, Belgium, available at: http://www.emdat.be, last access: 19 April 2021.
Gupta, V., Jain, M. K., Singh, P. K., and Singh, V.: An assessment of global satellite-based precipitation datasets in capturing precipitation extremes: A comparison with observed precipitation dataset in India, Int. J. Climatol., 40, 3667–3688, https://doi.org/10.1002/joc.6419, 2020.
Guzzetti, F., Peruccacci, S., Rossi, M., and Stark, C. P.: Rainfall thresholds for the initiation of landslides in central and southern Europe, Meteorol. Atmos. Phys., 98, 239–267, https://doi.org/10.1007/s00703-007-0262-7, 2007.
Guzzetti, F., Peruccacci, S., Rossi, M., and Stark, C. P.: The rainfall intensity–duration control of shallow landslides and debris flows: an update, Landslides, 5, 3–17, https://doi.org/10.1007/s10346-007-0112-1, 2008.
Guzzetti, F., Gariano, S. L., Peruccacci, S., Brunetti, M. T., Marchesini, I., Rossi, M., and Melillo, M.: Geographical landslide early warning systems, Earth-Sci. Rev., 200, 102973, https://doi.org/10.1016/j.earscirev.2019.102973, 2020.
He, S., Wang, J., and Liu, S.: Rainfall Event–Duration Thresholds for Landslide Occurrences in China, Water, 12, 494, https://doi.org/10.3390/w12020494, 2020.
Hersbach, H., Bell, B., Berrisford, P., Hirahara, S., Horányi, A., Muñoz-Sabater, J., Nicolas, J., Peubey, C., Radu, R., Schepers, D., Simmons, A., Soci, C., Abdalla, S., Abellan, X., Balsamo, G., Bechtold, P., Biavati, G., Bidlot, J., Bonavita, M., De Chiara, G., Dahlgren, P., Dee, D., Diamantakis, M., Dragani, R., Flemming, J., Forbes, R., Fuentes, M., Geer, A., Haimberger, L., Healy, S., Hogan, R.J., Hólm, E., Janisková, M., Keeley, S., Laloyaux, P., Lopez, P., Lupu, C., Radnoti, G., de Rosnay, P., Rozum, I., Vamborg, F., Villaume, S., and Thépaut, J.-N.: The ERA5 Global Reanalysis, Q. J. Roy. Meteorol. Soc., 146, 1999–2049, https://doi.org/10.1002/qj.3803, 2020.
Hong, Y., Adler, R. F., and Huffman, G. J.: Evaluation of the potential of NASA multi-satellite precipitation analysis in global landslide hazard assessment, Geophys. Res. Lett., 33, L22402, https://doi.org/10.1029/2006GL028010, 2006.
Huffman, G., Bolvin, D., Braithwaite, D., Hsu, K., Joyce, R., Kidd, C., Nelkin, E., and Xie, P.: Algorithm Theoretical Basis Document (ATBD) Version 4.5, NASA Global Precipitation Measurement (GPM) Integrated Multi-satellitE Retrievals for GPM (IMERG), NASA, Greenbelt, MD, USA, 2018.
Jaiswal, P. and van Westen, C. J.: Estimating temporal probability for landslide initiation along transportation routes based on rainfall thresholds, Geomorphology, 112, 96–10, https://doi.org/10.1016/j.geomorph.2009.05.008, 2009.
Jordanova, G., Gariano, S. L., Melillo, M., Peruccacci, S., Brunetti, M. T., and Jemec Auflič, M.: Determination of empirical rainfall thresholds for shallow landslides in Slovenia using an automatic tool, Water, 12, 1449, https://doi.org/10.3390/w12051449, 2020.
Kanungo, D. and Sharma, S.: Rainfall thresholds for prediction of shallow landslides around Chamoli-Joshimath region, Garhwal Himalayas, India, Landslides, 11, 629–638, https://doi.org/10.1007/s10346-013-0438-9, 2014.
Kim, S., Parinussa, R. M., Liu, Y. Y., Johnson, F. M., and Sharma, A.: A framework for combining multiple soil moisture retrievals based on maximizing temporal correlation, Geophys. Res. Lett., 42, 6662–6670, https://doi.org/10.1002/2015GL064981, 2015.
Kirschbaum, D. and Stanley, T.: Satellite-based assessment of rainfall-triggered landslide hazard for situational awareness, Earth's Future, 6, 505–523, https://doi.org/10.1002/2017EF000715, 2018.
Leonarduzzi, E. and Molnar, P.: Deriving rainfall thresholds for landsliding at the regional scale: daily and hourly resolutions, normalisation, and antecedent rainfall, Nat. Hazards Earth Syst. Sci., 20, 2905–2919, https://doi.org/10.5194/nhess-20-2905-2020, 2020.
Mandal, P. and Sarkar, S.: Estimation of rainfall threshold for the early warning of shallow landslides along National Highway-10 in Darjeeling Himalayas, Nat. Hazards, 105, 2455–2480, https://doi.org/10.1007/s11069-020-04407-9, 2021.
Marra, F.: Rainfall thresholds for landslide occurrence: systematic underestimation using coarse temporal resolution data, Nat. Hazards, 95, 83–890, https://doi.org/10.1007/s11069-018-3508-4, 2019.
Massari, C., Brocca, L., Pellarin, T., Abramowitz, G., Filippucci, P., Ciabatta, L., Maggioni, V., Kerr, Y., and Fernández-Prieto, D: A daily/25 km short-latency rainfall product for data scarce regions based on the integration of the GPM IMERG Early Run with multiple satellite soil moisture products, Hydrol. Earth Syst. Sci., 24, 2687–2710, https://doi.org/10.5194/hess-24-2687-2020, 2020.
Mathew, J., Giri Babu, D., Kundu, S., Vinod Kumar, K., and Pant, C. C.: Integrating intensity–duration-based rainfall threshold and antecedent rainfall-based probability estimate towards generating early warning for rainfall-induced landslides in parts of the Garhwal Himalaya, India, Landslides, 11, 575–588, https://doi.org/10.1007/s10346-013-0408-2, 2014.
Melillo, M., Brunetti, M. T., Peruccacci, S., Gariano, S. L., and Guzzetti, F.: An algorithm for the objective reconstruction of rainfall events responsible for landslides, Landslides, 12, 311–320, https://doi.org/10.1007/s10346-014-0471-3, 2015.
Melillo, M., Brunetti, M. T., Peruccacci, S., Gariano, S. L., Roccati, A., and Guzzetti, F.: A tool for the automatic calculation of rainfall thresholds for landslide occurrence, Environ. Model. Softw., 105, 230–243, https://doi.org/10.1016/j.envsoft.2018.03.024, 2018a.
Melillo, M., Brunetti, M. T., Peruccacci, S., Gariano, S. L., and Guzzetti, F.: CTRL–T (Calculation of Thresholds for Rainfall-induced Landslides – Tool), Zenodo, https://doi.org/10.5281/zenodo.4533719, 2018b.
Monsieurs, E., Dewitte, O., and Demoulin, A.: A susceptibility-based rainfall threshold approach for landslide occurrence, Nat. Hazards Earth Syst. Sci., 19, 775–789, https://doi.org/10.5194/nhess-19-775-2019, 2019.
Mooley, D. A. and Shukla, J.: Variability and forecasting of the summer monsoon rainfall over India, in: Monsoon Meteorology, edited by: Chang, C.-P. and Krishnamurti, T. N., Clarendon Press, Oxford, UK, 26–59, 1987.
Naidu, S., Sajinkumar, K. S., Oommen, T., Anuja, V. J., Samual, R. A., and Muraleedharan, C.: Early warning system for shallow landslides using rainfall threshold and slope stability analysis, Geosci. Front., 9, 1871–1882, https://doi.org/10.1016/j.gsf.2017.10.008, 2018.
NASA: GPM IMERG Early Precipitation L3 Half Hourly 0.1 degree × 0.1 degree V06 (GPM_3IMERGHHE) at GES DISC, available at: https://search.earthdata.nasa.gov/search?q=GPM_3IMERGHHE_06, last access: 20 January 2021.
Neal, R., Robbins, J., Dankers, R., Mitra, A., Jayakumar, A., Rajagopal, E. N., and Adamson, G.: Deriving optimal weather pattern definitions for the representation of precipitation variability over India, Int. J. Climatol., 40, 342–360, https://doi.org/10.1002/joc.6215, 2019.
Pai, D. S., Sridhar, L., Rajeevan, M., Sreejith, O. P., Satbhai, N. S., and Mukhopadyay, B.: Development of a new high spatial resolution () Long Period (1901–2010) daily gridded rainfall data set over India and its comparison with existing data sets over the region, Q. J. Meteorol. Hydrol. Geophys., 65, 1–18, 2014.
Peruccacci, S., Brunetti, M. T., Luciani, S., Vennari, C., and Guzzetti, F.: Lithological and seasonal control of rainfall thresholds for the possible initiation of landslides in central Italy, Geomorphology, 139–140, 79–90, https://doi.org/10.1016/j.geomorph.2011.10.005, 2012.
Peruccacci, S., Brunetti, M. T., Gariano, S. L., Melillo, M., Rossi, M., and Guzzetti, F.: Rainfall thresholds for possible landslide occurrence in Italy, Geomorphology, 290, 39–57, https://doi.org/10.1016/j.geomorph.2017.03.031, 2017.
Rao, P. L. S., Mohanty, U. C., and Ramesh, K. J.: The evolution and retreat features of the summer monsoon over India, Meteorol. Appl., 12, 241–255, 2005.
Robbins, J. C.: A probabilistic approach for assessing landslide triggering event rainfall in Papua New Guinea, using TRMM satellite precipitation estimates, J. Hydrol., 541, 296–309, https://doi.org/10.1016/j.jhydrol.2016.06.052, 2016.
Rossi, M., Marchesini, I., Tonelli, G., Peruccacci, S., Brunetti, M. T., Luciani, S., Ardizzone, F., Balducci, V., Bianchi, C., Cardinali, M., Fiorucci, F., Mondini, A. C., Reichenbach, P., Salvati, P., Santangelo, M., and Guzzetti, F.: TXT-tool 2.039-1.1 Italian National Early Warning System, in: Landslide Dynamics: ISDR-ICL Landslide Interactive Teaching Tools, edited by: Sassa, K., Guzzetti, F., Yamagishi, H., Arbanas, Ž., and Casagli, N., Springer, Cham, 341–349, https://doi.org/10.1007/978-3-319-57774-6_24, 2018.
Salinas-Jasso, J. A., Velasco-Tapia, F., Navarro De León, I., Salinas-Jasso, R. A., and Alva-Niño, E.: Estimation of rainfall thresholds for shallow landslides in the Sierra Madre Oriental, northeastern Mexico, J. Mt. Sci., 17, 1565–1580, https://doi.org/10.1007/s11629-020-6050-2, 2020.
Segoni, S., Piciullo, L., and Gariano, S. L.: A review of the recent literature on rainfall thresholds for landslide occurrence, Landslides, 15, 1483–1501, https://doi.org/10.1007/s10346-018-0966-4, 2018.
Sengupta, A., Gupta, S., and Anbarasu, K.: Rainfall thresholds for the initiation of landslide at Lanta Khola in north Sikkim, India, Nat. Hazards, 52, 31–42, https://doi.org/10.1007/s11069-009-9352-9, 2010.
Staley, D. M., Kean, J. W., Cannon, S. H., Schmidt, K. M., and Laber, J. L.: Objective definition of rainfall intensity–duration thresholds for the initiation of post-fire debris flows in southern California, Landslides, 10, 547–562, https://doi.org/10.1007/s10346-012-0341-9, 2013.
Tang, G. Q., Clark, M. P., Papalexiou, S. M., Ma, Z. Q., and Hong, Y.: Have satellite precipitation products improved over last two decades? A comprehensive comparison of GPM IMERG with nine satellite and reanalysis datasets, Remote Sens. Environ., 240, 111697, https://doi.org/10.1016/j.rse.2020.111697, 2020.
Thakur, M. K., Lakshmi Kumar, T. V., Koteswara Rao, K., Barbosa, H., and Rao, V. B.: A new perspective in understanding rainfall from satellites over a complex topographic region of India, Sci. Rep., 9, 15610, https://doi.org/10.1038/s41598-019-52075-y, 2019.
Thakur, M. K., Lakshmi Kumar, T. V., Narayanan, M. S., Kundeti, K. R., and Barbosa, H.: Analytical study of the performance of the IMERG over the Indian landmass, Meteorol. Appl., 27, 1908, https://doi.org/10.1002/met.1908, 2020.
Thomas, M. A., Collins, B. D., and Mirus, B. B.: Assessing the feasibility of satellite-based thresholds for hydrologically driven landsliding, Water Resour. Res., 55, 9006–9023, https://doi.org/10.1029/2019WR025577, 2019.
Tyagi, A., Mazumdar, A. B., Khole, M., Gaonkar, S. B., and Devi, S.: Re-determination of normal dates of onset of southwest monsoon over India, Mausam, 62, 321–328, 2011.
Uwihirwe, J., Hrachowitz, M., and Bogaard, T. A.: Landslide precipitation thresholds in Rwanda, Landslides, 17, 2469–2481, https://doi.org/10.1007/s10346-020-01457-9, 2020.
Valenzuela, P., Zêzere, J. L., Domínguez-Cuesta, M. J., and Mora García, M. A.: Empirical rainfall thresholds for the triggering of landslides in Asturias (NW Spain), Landslides, 16, 1285–1300, https://doi.org/10.1007/s10346-019-01170-2, 2019.
Wagner, W., Hahn, S., Kidd, R., Melzer, T., Bartalis, Z., Hasenauer, S., Figa, J., de Rosnay, P., Jann, A., Schneider, S., Komma, J., Kubu, G., Brugger, K., Aubrecht, C., Zuger, J., Gangkofner, U., Kienberger, S., Brocca, L., Wang, Y., Bloeschl, G., Eitzinger, J., Steinnocher, K., Zeil, P., and Rubel, F.: The ASCAT soil moisture product: a review of its specifications, validation results, and emerging applications, Meteorol. Z., 22, 5–33, https://doi.org/10.1127/0941-2948/2013/0399, 2013.
Zêzere, J. L., Vaz, T., Pereira, S., Oliveira, S. C., Marques, R., and Garcia, R. A. C.: Rainfall thresholds for landslide activity in Portugal: a state of the art, Environ. Earth Sci., 73, 2917–2936, https://doi.org/10.1007/s12665-014-3672-0, 2015.