the Creative Commons Attribution 4.0 License.
the Creative Commons Attribution 4.0 License.
 | 09 Jun 2021
CABra: a novel large-sample dataset for Brazilian catchments
Paulo Tarso S. Oliveira
Antônio Alves Meira Neto
Tirthankar Roy
Peter Troch
In this paper, we present the Catchments Attributes for Brazil (CABra), which is a large-sample dataset for Brazilian catchments that includes long-term data (30 years) for 735 catchments in eight main catchment attribute classes (climate, streamflow, groundwater, geology, soil, topography, land cover, and hydrologic disturbance). We have collected and synthesized data from multiple sources (ground stations, remote sensing, and gridded datasets). To prepare the dataset, we delineated all the catchments using the Multi-Error-Removed Improved-Terrain Digital Elevation Model (MERIT DEM) and the coordinates of the streamflow stations provided by the Brazilian Water Agency, where only the stations with 30 years (1980–2010) of data and less than 10 % of missing records were included. Catchment areas range from 9 to 4 800 000 km2, and the mean daily streamflow varies from 0.02 to 9 mm d−1. Several signatures and indices were calculated based on the climate and streamflow data. Additionally, our dataset includes boundary shapefiles, geographic coordinates, and drainage area for each catchment, aside from more than 100 attributes within the attribute classes. The collection and processing methods are discussed, along with the limitations for each of our multiple data sources. CABra intends to improve the hydrology-related data collection in Brazil and pave the way for a better understanding of different hydrologic drivers related to climate, landscape, and hydrology, which is particularly important in Brazil, having continental-scale river basins and widely heterogeneous landscape characteristics. In addition to benefitting catchment hydrology investigations, CABra will expand the exploration of novel hydrologic hypotheses and thereby advance our understanding of Brazilian catchments' behavior. The dataset is freely available at https://doi.org/10.5281/zenodo.4070146 and https://thecabradataset.shinyapps.io/CABra/ (last access: 7 June 2021).
- Article
(13211 KB) - Full-text XML
- BibTeX
- EndNote


The integrated assessment of large-sample catchment attributes is fundamental for the description and classification of landscape properties, leading to an improved understanding of similarities (or dissimilarities) between catchments. Large-sample catchment hydrology is essential in terms of understanding hydrological processes (Addor et al., 2020; Beven et al., 2020). It provides an attractive venue for general inferences that would otherwise be impossible to study based on individual or small groups of catchments, aside from allowing for the testing of new and existing hypotheses in hydrologic sciences (Addor et al., 2017; Gupta et al., 2014; Lyon and Troch, 2010; Wagener et al., 2007).
A classic example of a large catchment-scale dataset is the Model Parameter Estimation Experiment (MOPEX) (Duan et al., 2006; Schaake et al., 2006), with hydrologic time series from 438 catchments located within the continental US (CONUS). The MOPEX dataset has been used in several studies supporting theoretic and modeling advances in hydrologic sciences (Ao et al., 2006; Ren et al., 2016; Sawicz et al., 2011). A more recent example is the Catchment Attributes and MEteorological for Large-sample Studies (CAMELS; Addor et al., 2017), consisting of a set of daily hydrometeorological time series data for 671 small- to medium-sized catchments for the CONUS, aside from several landscape- and climate-related attributes. The CAMELS initiative has been widely used, and other large-sample datasets have been recently developed following the CAMELS format, such as CAMELS-GB for Great Britain, covering 671 catchments, CAMELS-CL for Chile, covering 516 catchments, and CAMELS-BR for Brazil, covering 897 catchments. A list of available large-sample datasets can be found in Addor et al. (2020).
Brazil is a country with continental dimensions, hosting a wide range of climates, soils, geology, and land-cover types. Despite covering almost 50 % of South America and hosting between 12 % and 18 % of the world's renewable freshwater (Rodrigues et al., 2015; UNEP and ANA, 2007), Brazil suffers from scarce allocation of funds for hydrological monitoring services, which creates great challenges for the proper monitoring of the quality and quantity of its water resources. While the density of streamflow gauges falls below the standards recommended by the World Meteorological Organization (WMO) of one station for each 1000 km2, hydrologic observations are often discontinued and lack proper length (ANA, 2019a; WMO, 2010). An integrated dataset containing multiple levels of environmental information can be of extreme importance to leverage investigations in hydrology and related disciplines within the Brazilian territory.
Recently, two large-sample datasets for catchment attributes were developed for Brazil: the Catchment Attributes for Brazil (CABra) (first introduced in Oliveira et al., 2020) and the Catchment Attributes and MEteorology for Large-sample Studies (CAMELS-BR) (Chagas et al., 2020). Even though both datasets aim to fill the lack of hydrological data access in Brazil, the data sources, quality control, number, and types of attributes differ significantly. To address the similarities and differences between both datasets, an extensive discussion comparing CAMELS-BR and CABra is also presented in our study.
In this paper, we present the CABra dataset, which is a comprehensive, large-sample dataset for catchment attributes in Brazil. We have synthesized several multi-source data from eight main attribute classes (topography, climate, streamflow, groundwater, soil, geology, land use and land cover, and hydrologic disturbance) for 735 catchments in Brazil. Our dataset covers all Brazilian administrative and hydrographic regions, as well as its biomes. We have delimited all the catchments using an error-corrected digital elevation model employing automatic drainage area delineation methods. For the area-averaged attributes, we have used national datasets from the Brazilian Water Agency (ANA), Brazilian Agricultural Research Corporation (EMBRAPA), and Xavier et al. (2016), and widely used global datasets, such as ERA5, SoilGrids250, Global Land Evaporation Amsterdam Model (GLEAM), Global Lithologic Map (GLiM), and GLobal HYdrogeology MaPS (GLHYMPS). Additionally, a hydrologic disturbance index was created to indicate the most human-impacted catchments. Finally, we discuss the spatial variabilities of the attributes and their limitations of application.
2.1 Overview
The CABra dataset is a multi-source, multi-temporal, and multi-spatial resolution large-sample dataset for catchment attributes for Brazilian catchments. Using an extensive local and global high-quality data collection, we developed CABra, considering eight main classes of attributes: topography, climate, streamflow, groundwater, soil, geology, land cover, and hydrological disturbance. Gridded datasets of various kinds were averaged onto the selected catchments located over Brazil and neighboring countries, in the case of transboundary catchments. Moreover, we provide daily time series from climate and streamflow variables for a 30-year period, covering the hydrological years from 1980 to 2010, as described in Fig. 1.
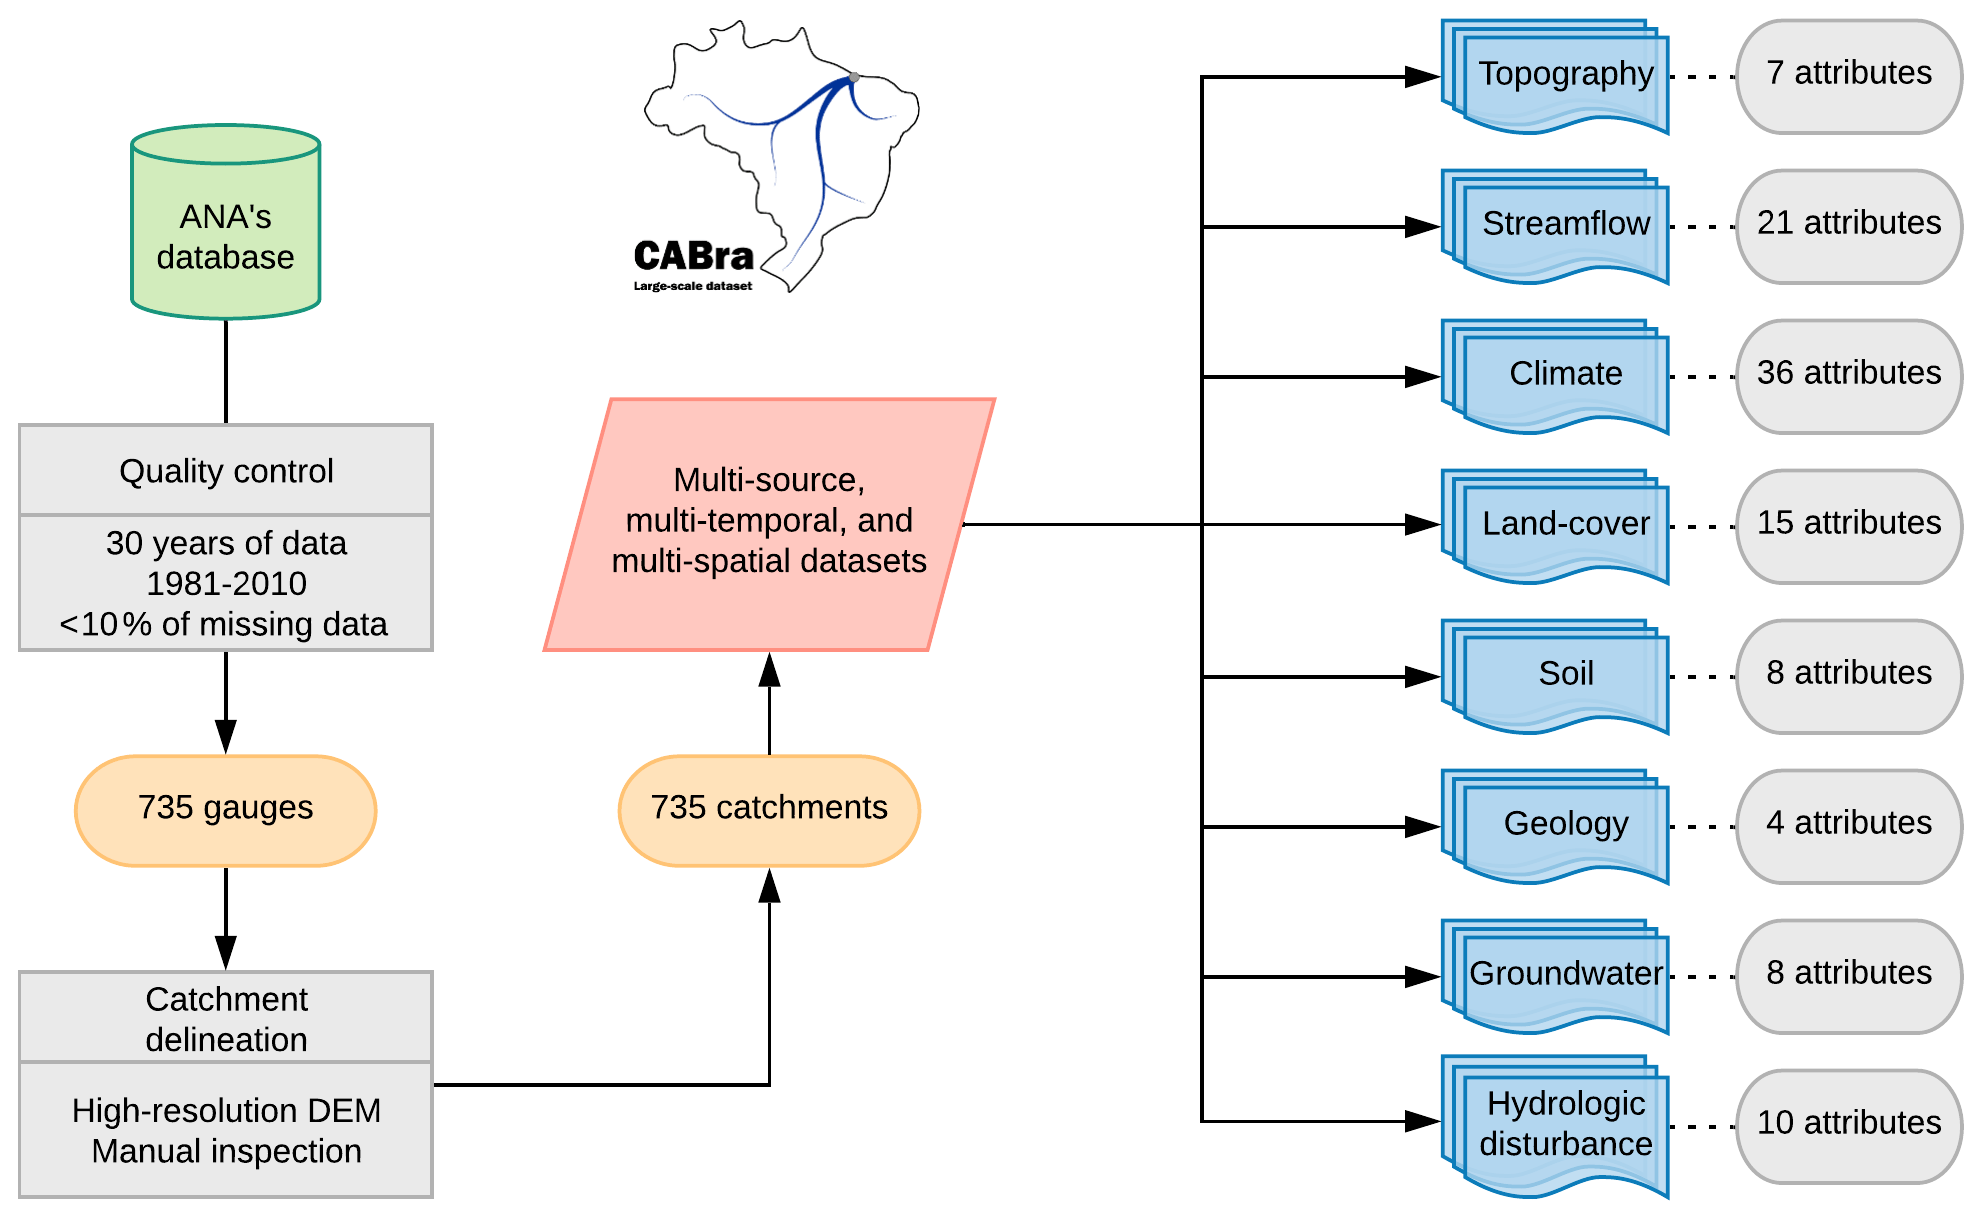
Figure 1Study delineation for the CABra dataset organization. From ANA's database, 735 gauges were selected to integrate into our dataset due to their high consistency and long time series of streamflow.
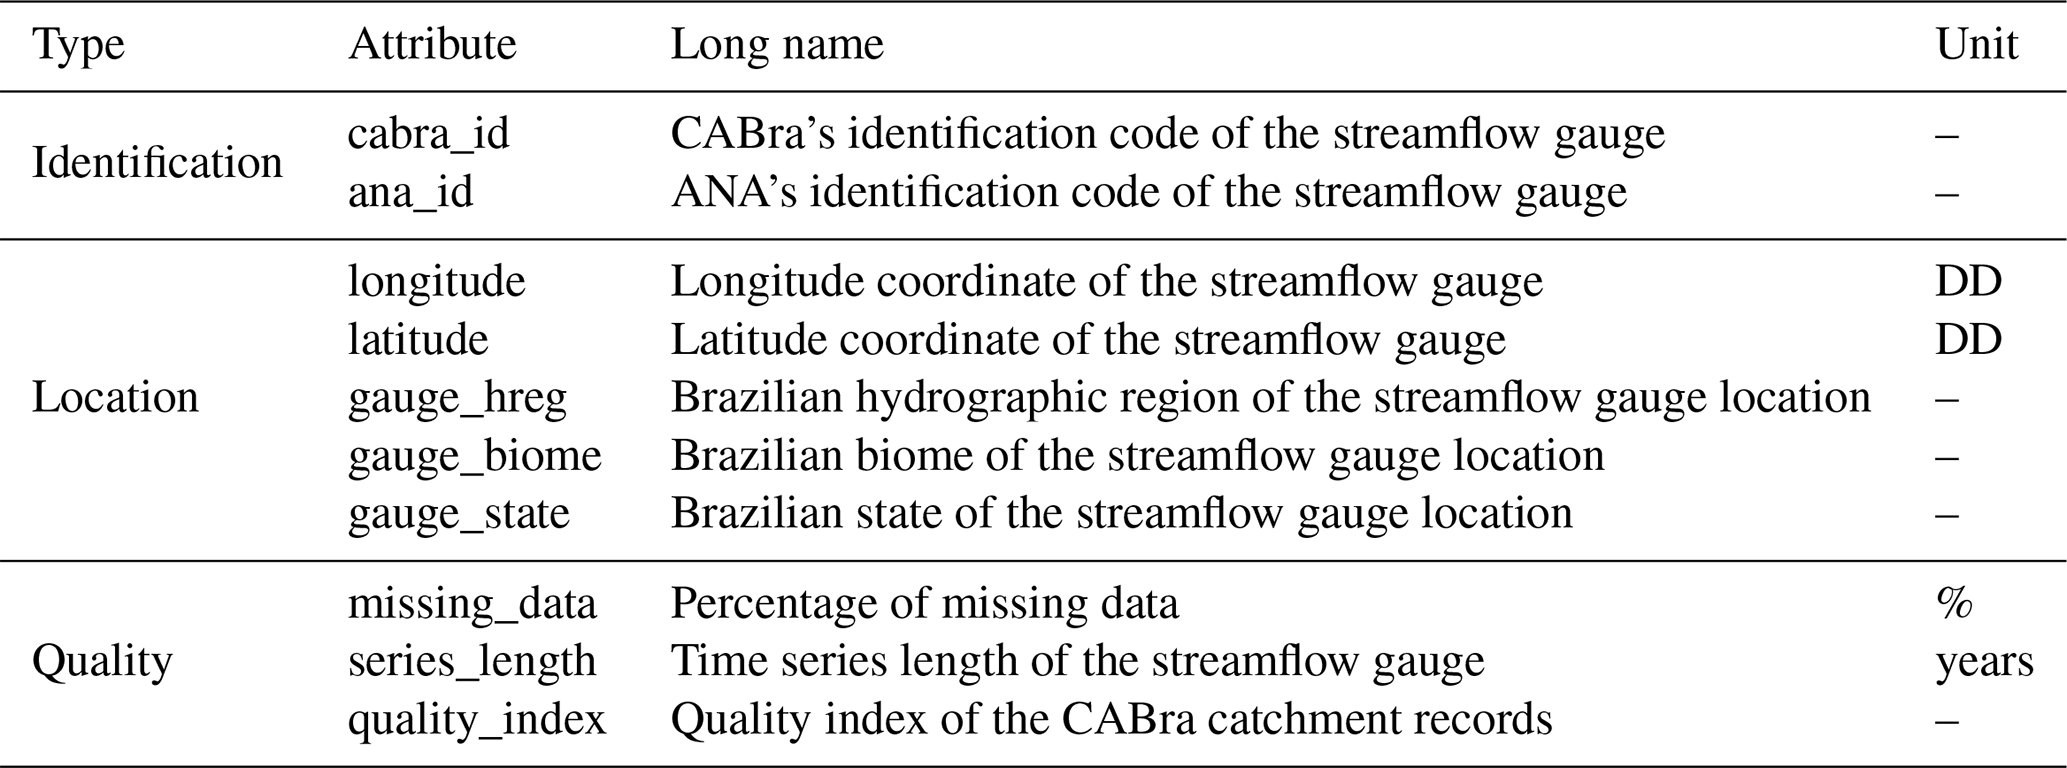
The CABra dataset is recommended for a wide range of users for decision-making at multiple scales – local, national, or regional – covering all Brazilian biomes (Amazon, Cerrado, Atlantic Forest, Pantanal, Caatinga, and Pampa). CABra was created to ensure easy access to its information and provide high-quality data, with attributes useful for a variety of hydrometeorological modeling and assessments. Each catchment presents several attributes, ranging from the file information described in Table 1 to the attributes described throughout this article. Moreover, we made all the geospatial data (shapefile of the boundaries) available to users.
Table 1General attributes of the CABra catchments.
– means dimensionless.
2.2 Catchment delineation and topography
Brazil does not have an official database for the national catchments boundaries, and the Brazilian Water Agency (ANA) does not make its geospatial database available. Because of this and to avoid uncertainties in the existing datasets for South America, we freshly generated all the CABra catchments boundaries used in this study. Digital elevation model (DEM) quality and resolution are crucial at this stage since all the post-analyses with the multi-source information utilized in the CABra dataset are area-averaged. For example, it is well known that errors in topographic indices, e.g., slope, catchment area, and boundary, are dependent on and highly sensitive to DEM resolution and accuracy, and it is suggested that, if available, a high-resolution DEM should be used instead of a low-resolution DEM due to the negative effects of terrain generalization caused by them (Mukherjee et al., 2012; Vaze et al., 2010; Wechsler, 2007; Zhou and Liu, 2004). We delineated the CABra catchments following the procedure described in Maidment (2002), using streamflow gauges' location information from ANA's database and a high-resolution elevation product, i.e., the Multi-Error-Removed Improved-Terrain Digital Elevation Model (MERIT DEM) with a 90 m spatial resolution at the Equator (Yamazaki et al., 2017) (Fig. 2).
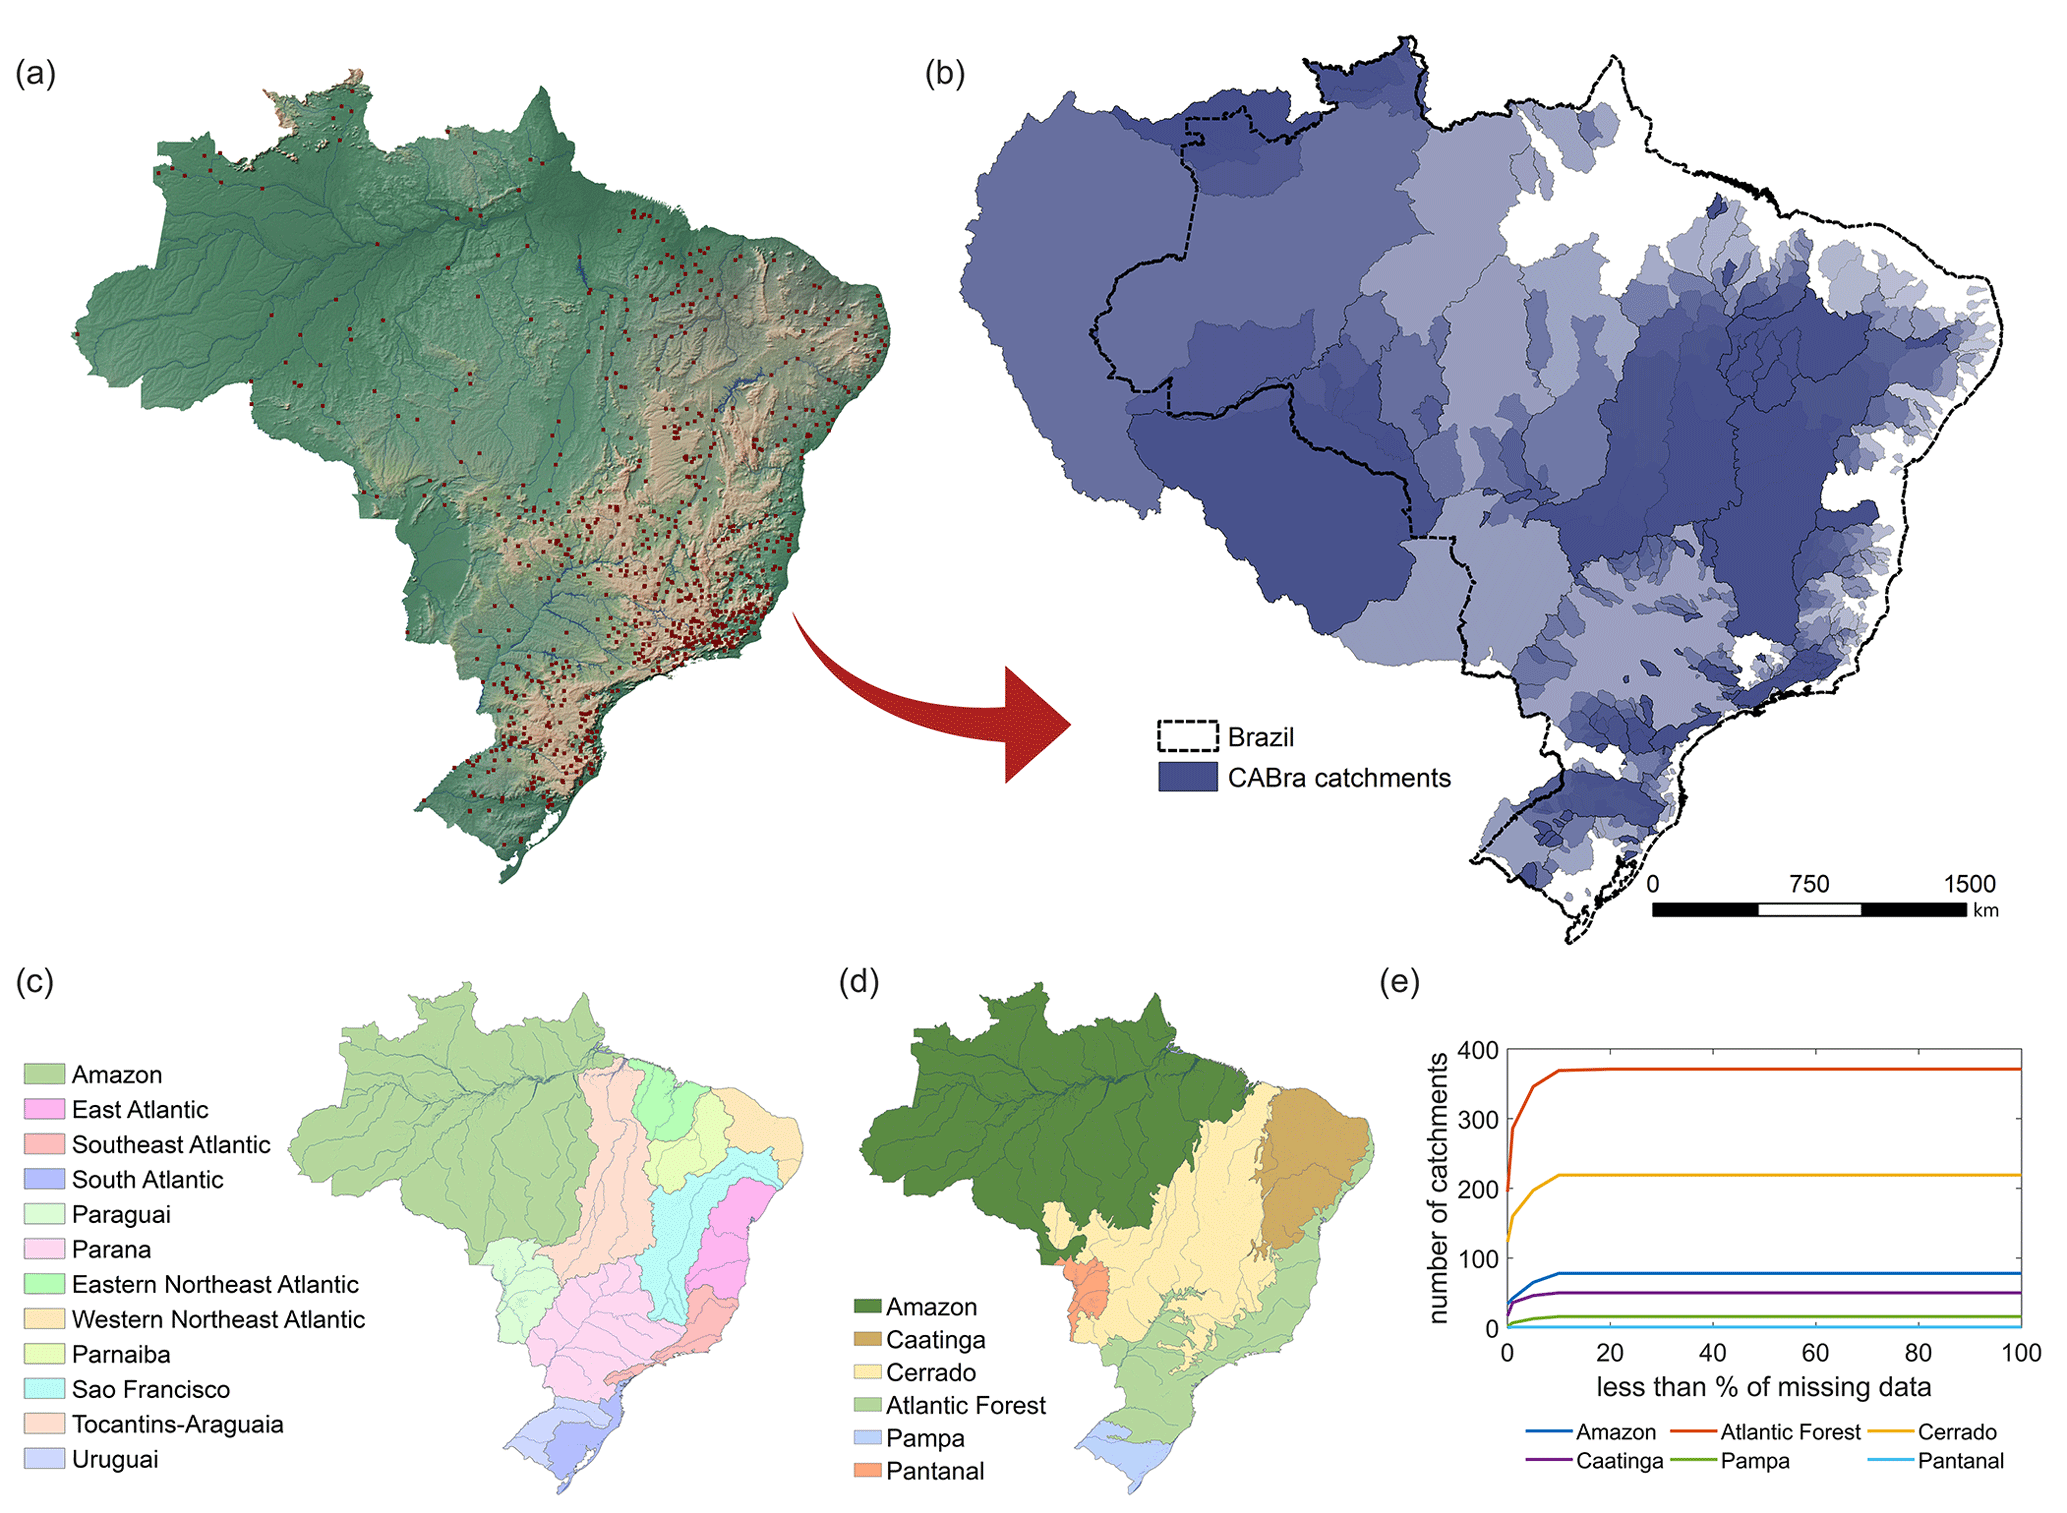
Figure 2Location map of the streamflow gauges and CABra catchments. (a) Streamflow gauge coordinates of CABra catchments, (b) the 735 CABra catchment boundaries, (c) the 12 hydrographic regions of Brazil, (d) the six main biomes of Brazil, and (e) level of consistency of the streamflow gauge records for each biome.
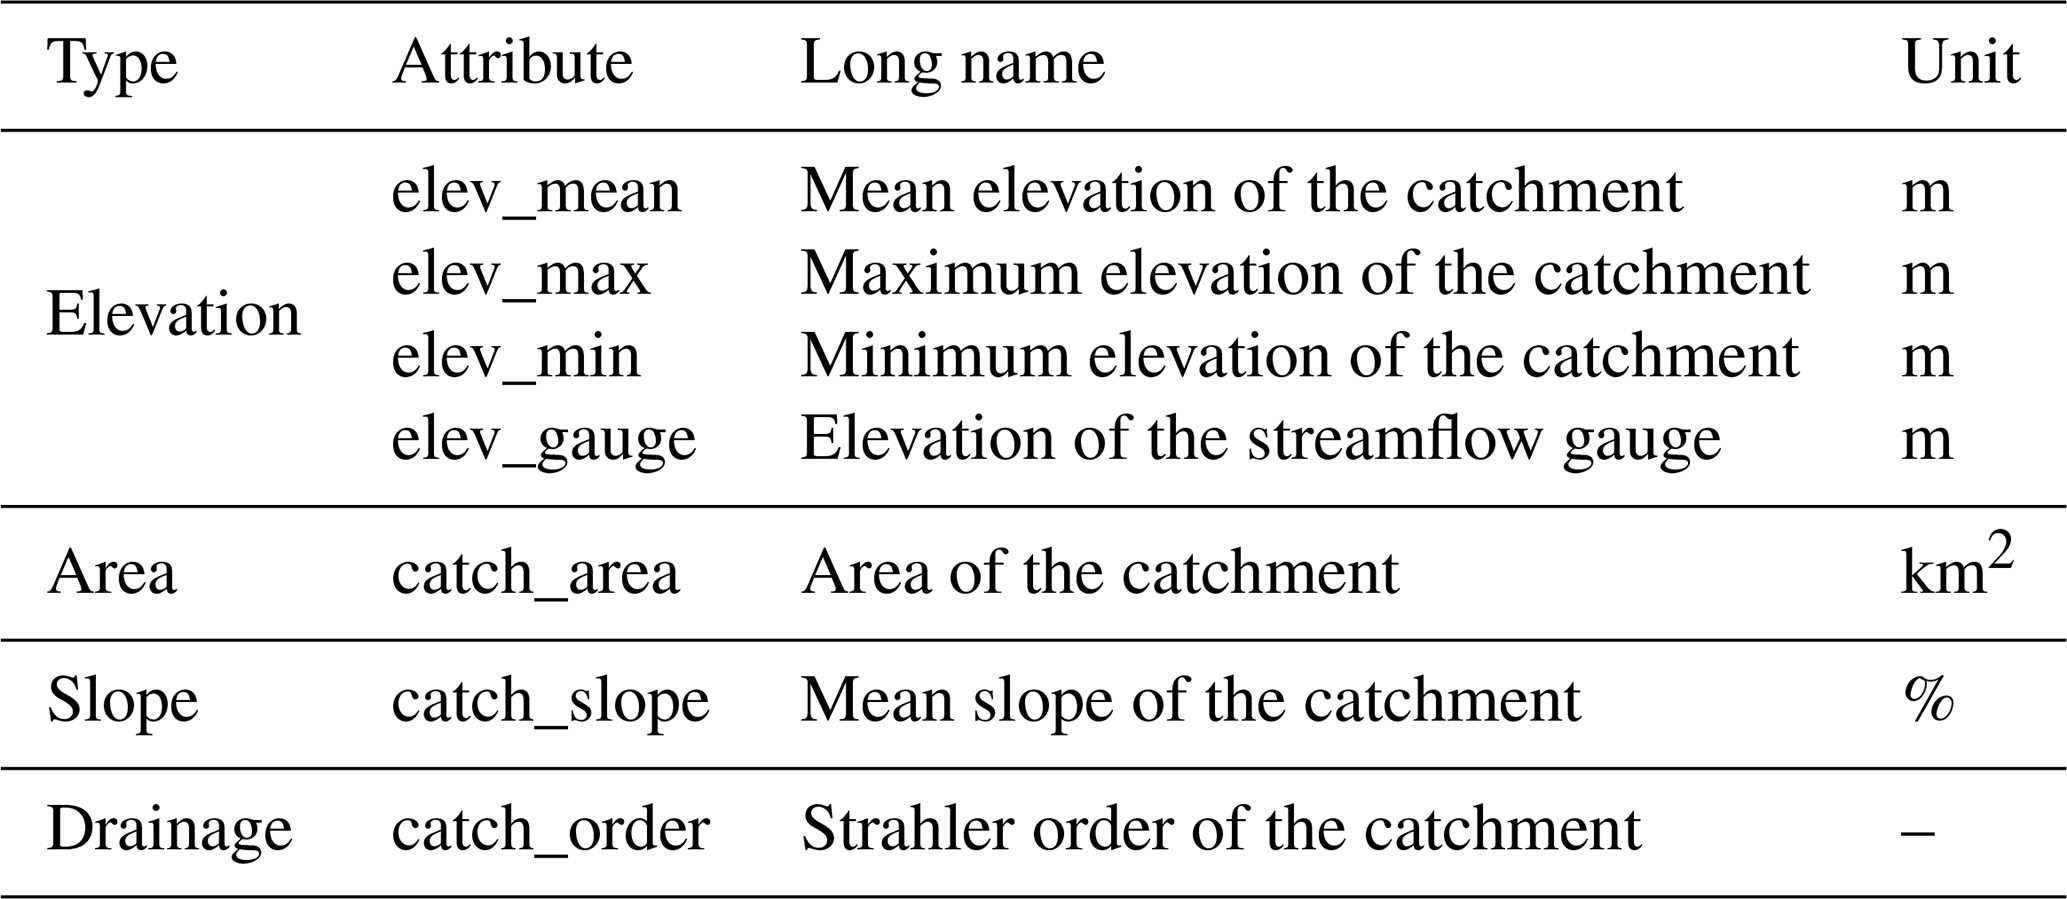
In the first stage, which we call “terrain processing”, the DEM was sink-filled to avoid possible errors due to peaks or depressions. Then, the flow direction and flow accumulation were calculated, which indicate the direction and accumulation of flow, respectively, in each grid cell within the catchment. The next step was to define the stream network in the catchment. For the definition of a river stream, we considered a threshold of 100 cells accumulating water, and this value was chosen considering the DEM spatial resolution and the range of the size of the catchments. All the previous steps were run for the South America extension. Even though all outlets are located in the Brazilian territory, some of the drainage areas include larger areas outside of it. The second step was catchment delineation, for which the products generated in the previous step and the coordinates of the streamflow gauges were used. Each streamflow gauge coordinate was first plotted as a point, and the position of it in relation to the stream network was checked and corrected, if necessary. The correction procedure was performed for 132 of the CABra catchments. Then, each corrected point was used as an outlet of the catchment, and the delineation of the drainage area was performed using the ArcHydro tool. Aside from the catchments limits, perimeters, and areas, we also extracted the stream information, such as the stream network and hierarchy (Strahler, 1952, 1957). It is important to highlight that we manually inspected each catchment outlet and area to overcome the limitation of unchecked boundaries of another existing catchment dataset, such as Do et al. (2018), which is based on a DEM with a spatial resolution of 500 m. Moreover, this presented itself as a crucial procedure for an accurate delineation since several outlets' positions needed to be corrected to represent the real expected catchment boundary. Once the catchment boundaries were delimited, we calculated seven attributes related to the topography of each catchment: area; slope; maximum, minimum, and mean elevation; streamflow gauge elevation; and catchment order. The catchment boundaries and drainage network are also provided in the CABra dataset.
Table 2Topography attributes of the CABra catchments.
– means dimensionless.
Figure 3 summarizes the topographic attributes for the CABra catchments. Catchment areas ranged from 9 to 4.8×10⁶ km2 (Fig. 3a). This large range of areas shows how Brazilian hydrology can be, at the same time, local and continental, necessitating a better understanding of hydrologic processes on different scales. Many of the largest catchments are in the main streams of 1 of the 12 hydrologic regions of Brazil, especially in the Amazon, Tocantins–Araguaia, São Francisco, Paraguay, and Paraná. The mean elevation of CABra catchments ranges from close to zero to up to 2000 m, with the highest values found in the southern and southeastern portions. In turn, steep areas can be found in the coastal and mountainous areas of the southeast and south (Fig. 3b and c). Most of the Brazilian catchments have a flat topography though, with a mean slope of up to 10 %. Figure 3d shows the gauge elevation. Note the difference between the gauge elevation and the mean catchment elevation in Fig. 3b. The gauge elevation considers only the elevation at the gauge position in the landscape, thereby proving only the local information, while the mean catchment elevation considers the average elevation for the entire catchment. An example of this difference is the largest CABra catchment, i.e., the Amazon. The mean elevation in the Amazon basin would be low; however, the western part of the basin has some of the highest peaks of the Andes, where the gauge elevation would be much higher.

Figure 3Spatial distribution of the topography attributes of the CABra catchments. (a) Stream order of Brazilian rivers; (b) area of the catchments (in km2); (c) mean elevation of the catchments (in m); (d) mean slope of the catchments (in percent); (e) elevation of the streamflow gauge (in m).
Uncertainty and limitations
The uncertainties related to the topography attributes are mainly related to the model terrain and streamflow gauge coordinates. The digital elevation model adopted for CABra catchments, developed by Yamazaki et al. (2017), is an improved product based on the composition of another baseline terrain products, such as the SRTM3 DEM, AW3D-30 m DEM, and Viewfinder Panoramas DEM. Moreover, there are gaps in high-relief mountains and water bodies that were filled manually for the final MERIT-DEM product, leading to 72 % of mapped area with a height accuracy better than 2 m when slope < 10 %. Regarding streamflow gauge coordinates, there were inconsistences between the location provided by ANA and the stream network generated using the MERIT-DEM. We corrected the pair of coordinates, by matching the point to the nearest stream network, in a way that the area error against ANA's area was minimized. Regarding the catchment delineation, the uncertainty related to the automatic procedure conducted in the GIS environment is mainly dependent on the accuracy, but some authors found that channel heads (first-order catchments) are the most subject to the greatest uncertainties (Zandbergen, 2011).
2.3 Climate
2.3.1 Methodology
We present daily time series of area-averaged precipitation, minimum, maximum, and mean temperatures, solar radiation, relative humidity, wind speed, evapotranspiration, and potential evapotranspiration (calculated by Penman–Monteith, Priestley–Taylor, and Hargreaves methods). Moreover, we calculated several core climate indices, defined by the Climate and Ocean: Variability, Predictability, and Change (CLIVAR) project from the World Climate Research Programme (WCRP). Two main climate datasets were used in CABra. The first one, a high-resolution meteorological gridded dataset (), developed by Xavier et al. (2016) (referred to here as “REF”), is based on the spatial interpolation of meteorological data from ∼4000 rain gauges and wheatear stations in Brazil, from the ANA, Brazilian Institute for Meteorology (INMET, in Portuguese), and Water and Power Department of São Paulo (DAEE/SP, in Portuguese), covering the period from 1980 to 2015. From these sets of meteorological gauges, 2890 are limited to precipitation data. This dataset is available at http://careyking.com/data-downloads/ (last access: 21 January 2020). This product has a much finer spatial resolution and is based on a higher number of rain gauge stations than other widely used products (∼4000 stations for Brazil, in comparison to ∼600 stations for South America in the CRU TS3.1 product). However, the REF dataset only covers the Brazilian territory, while the CABra dataset has 20 catchments with upstream areas outside Brazil. To overcome this, we incorporated the ERA5 (Hersbach et al., 2020) climate data into the CABra dataset (referred to here as “ERA5”).
ERA5 is the most recent version of climate reanalysis from the European Centre for Medium-Range Weather Forecasts (ECMWF) and provides hourly, daily, and monthly data on several atmospheric, sea, and land variables in a spatial resolution grid, from 1950 to the present. As a reanalysis dataset, the ERA5 uses past observations and models to generate accurate and consistent time series of climate variables and parameters and is one of the most widely used datasets in geosciences (Hersbach et al., 2020). To incorporate and produce a more reliable product for all the CABra catchments, we have generated an ensemble mean product (referred to here as “ENS”) using both aforementioned datasets, i.e., REF and ERA5 climate products. The procedure was conducted in the Climate Data Operators (CDO; Schulzweida, 2019) and aimed at a better characterization and representation of the climate based on the two independent estimations, which generally imply a more robust reproducibility of the phenomenon than in a single-member analysis (Abramowitz et al., 2019). Newman et al. (2015) also found that the ensemble product of precipitation and temperature still captures the main features of the variables and, moreover, improves the identification of extreme event frequency, and it is known that an ensemble usually outperforms individual forecasts (Bellucci et al., 2015; Solman et al., 2013; Tebaldi et al., 2005), being capable of detecting internal variability and seasonal patterns. The ENS dataset generated here can be useful for climate-related analysis through the Brazilian territory, since it merges two high-resolution and high-quality products.
The precipitation seasonality (Woods, 2009), which indicates the timing of the precipitation seasonal cycle and the temperature seasonal cycle, was calculated for the ensemble product; values close to +1 indicate summer precipitation, and values close to −1 indicate winter precipitation.
The actual evapotranspiration adopted in CABra is derived from the Global Land Evaporation Amsterdam Model version 3 (GLEAM v3; Martens et al., 2017), which is a set of algorithms that estimate the many components of land evaporation based on satellite observations of climatic and environmental variables. The calculations of the actual evapotranspiration by GLEAM v3 take into account a potential evapotranspiration module (with the Priestley and Taylor method), an interception loss module (with the Gash analytical model), and a stress module (with a semi-empirical relationship to root-zone moisture and vegetation optical depth). The GLEAM dataset is one of the most commonly used datasets in evapotranspiration applications (Forzieri et al., 2018; Schumacher et al., 2019; Zhang et al., 2016).
Even though the REF dataset presents a reference evapotranspiration product (calculated using the Penman–Monteith method following FAO-56 guidelines), it only includes the Brazilian territory and did not comprise all the areas of the catchments included in the CABra dataset. To overcome this limitation, we calculated the daily potential evapotranspiration (PET) using three different widely used methods based on energy balance and transfer mass, radiation, and temperature, using meteorological variables from the ERA5 and the ensemble products as inputs. These three newly products are, to the best of our knowledge, the most extent datasets of potential evapotranspiration for Brazil, covering a larger period than existent products, such as the one introduced in Althoff et al. (2020) and Xavier et al. (2016).
The first method was the FAO-56 Penman–Monteith equation (Allen et al., 1998), which is the standard for reference evapotranspiration and assumes a hypothetical crop similar to the surface of small grass and uniform grass, actively growing and sufficiently watered. The FAO Penman–Monteith (PM) equation considers the energy budget and the aerodynamic and surface resistances of the crop and uses as inputs the solar radiation, air temperature, humidity, and 2 m wind speed data (Eq. 1).
where PETPM is the reference evapotranspiration (in mm d−1), Rn is the net radiation (in MJ m−2 d−1), G is the soil heat flux (in MJ m−2 d−1), T is the mean daily temperature at 2 m height (in ∘C), u2 is the wind speed at 2 m height (in m s−1), es is saturation vapor pressure (in kPa), ea is the actual vapor pressure (in kPa), Δ is the slope vapor pressure curve (in kPa ∘C−1), and γ is the psychrometric constant (in kPa ∘C−1).
The radiation-based method chosen for the CABra dataset is the Priestley–Taylor equation (PT) (Priestley and Taylor, 1972). The PT considers that when large areas, such as catchments, are saturated, the main force that governs the evaporation is the net radiation, and under certain conditions, the knowledge of net radiation and the ground dryness is enough to determine the vapor and sensible heat fluxes at the surface. Moreover, it is one of the most commonly used models to estimate evapotranspiration due to its requirement of a low number of inputs (Maes et al., 2019; McMahon et al., 2013; Shuttleworth, 1996). The PT equation takes the following form:
where PETPT is the potential evapotranspiration (in mm d−1), α is the Priestley–Taylor constant (dimensionless), Rn is the net radiation (in MJ m−2 d−1), G is the soil heat flux (in MJ m−2 d−1), Δ is the slope vapor pressure curve (in kPa ∘C−1), and γ is the psychrometric constant (in kPa ∘C−1). Considering that PT only considers daytime evapotranspiration, and G is negligible during the daytime, we used G=0 in our calculations.
Priestley and Taylor (1972) empirically determined α for many locations and conditions in the world, ranging between 1.08 and 1.34. The authors concluded the best estimation for α should be an overall mean of 1.26. However, it is known that the α value is scenario-dependent, and its variability is not taken into account when using the mean value proposed in its development (Guo et al., 2007).
The third method adopted here is the Hargreaves equation. The method was developed by Hargreaves (1975) for irrigation planning and design, and it is a temperature-based equation widely used to calculate the potential evapotranspiration due to its easy application and low input requirement (Eq. 3).
where PETHG is the potential evapotranspiration (in mm d−1), Rs is the solar radiation ( in MJ m−2 d−1), and Ta is the daily mean temperature ( in ∘C).
From the climatic variables and attributes, we carried out an analysis of the annual water balance in the Budyko space, an empirical approach applied to the study of the hydrological behavior of catchments. The Budyko hypothesis (Budyko, 1948, 1974) considers that the ratio between the long-term annual actual evapotranspiration (ET) and precipitation (P) is a function of the ratio between the long-term potential evapotranspiration (PET) and precipitation (P). The Budyko framework has been used to assess global impacts of climate change on water resources (Berghuijs et al., 2017; Roderick et al., 2014) and to gain further insight into the water balance controls at mean annual timescales (Donohue et al., 2007; Berghuijs et al., 2017; Meira Neto et al., 2020).
Table 3Daily series of meteorological variables and climate indices for the CABra catchments.
– means dimensionless.
2.3.2 Results and discussion
Figure 4 shows some of the climate attributes for the CABra dataset. Regarding the precipitation derived from our ensemble of Xavier et al. (2016) and ERA5 (Fig. 4a), we found the highest values, reaching up to 10 mm d−1, in the northern portion, and the lowest values, below 1 mm d−1, in the northeastern portion. Despite the wide range in the daily precipitation, most of the catchments (∼80 %) presented area-averaged precipitation between 3 and 6 mm d−1.

Figure 4Spatial distribution of climate indices of the CABra catchments. (a) Mean daily precipitation (in mm d−1); (b) precipitation seasonality (dimensionless); (c) aridity index (dimensionless); (d) mean daily solar radiation (in MJ m2 d−1); (e) mean daily minimum temperature (in ∘C); (f) mean daily maximum temperature (in ∘C).
Figure 4d shows the area-averaged solar radiation reaching the surface, ranging from 10 to 20 MJ m2 d−1, with most of the catchments with daily values higher than 15 MJ m2 d−1. The spatial distribution of solar radiation is reflected in the temperature values in CABra catchments (Fig. 4e and f). The southern and southeastern portions present the lowest values of both the maximum and minimum temperatures. This is due to the lower values of solar radiation and high altitudes found in these regions of Brazil. Other areas of Brazil are located in higher latitudes and are subject to higher solar radiation, and due to its flat relief, the temperatures are higher than in the south. Figure 4b indicates that, in most of the CABra catchments (∼85 %), the precipitation seasonal cycle coincides with the temperature seasonal dynamics, which means that most of the precipitation occurs in the summer (seas > 0). There are only a few catchments in the northern portion of Brazil that have precipitation in the winter (seas < 0), and this can be explained by the high influence of sea breeze on convective precipitation in this region. According to Ahrens (2010) and Kousky et al. (1984), the Amazonian coastal area is highly influenced by the sea breeze, which can occur in 3 out of every 4 d, with the formation of convective activity inland.
Our results of the computed potential evapotranspiration are presented in Fig. 5a–c. They are related to three different methods for PET calculation, being potential evapotranspiration for a reference crop using the Penman–Monteith equation, potential evapotranspiration using the Priestley–Taylor equation, and potential evapotranspiration using the Hargreaves equation. All the equations generated similar results of PET ranging from 3 to 6 mm d−1, with similar spatial variability. The highest values were found for the northeastern portion of Brazil, with the Penman–Monteith results being slightly higher than the other equations. This could be related to the wind component in the method, which is not taken into account in the Priestley–Taylor and Hargreaves methods.
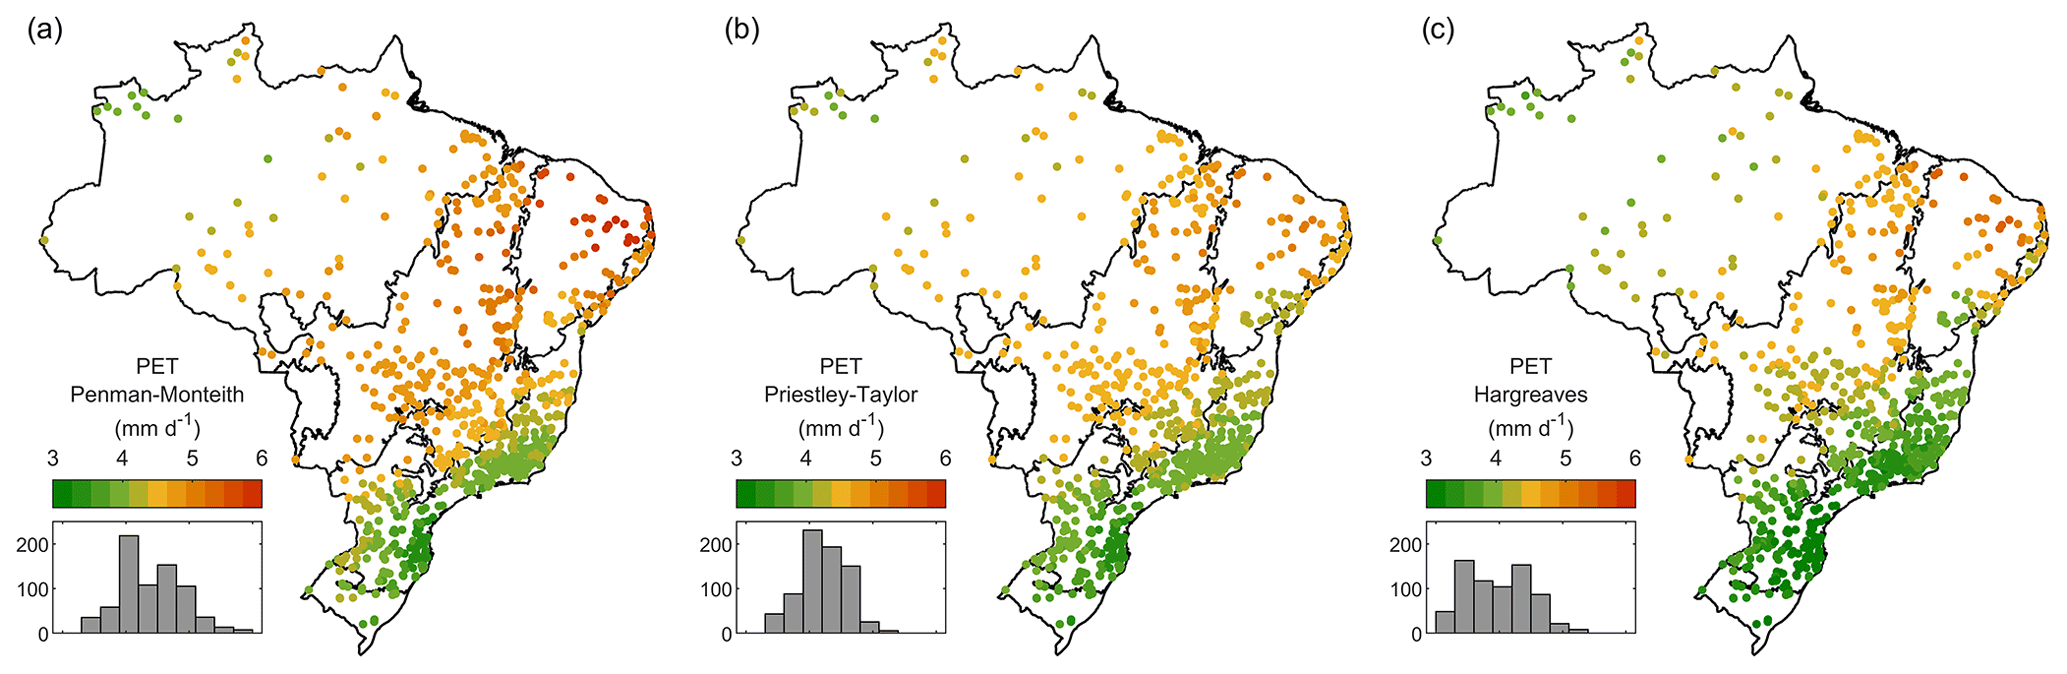
Figure 5Spatial distribution of the PET calculated from three different methods of the CABra catchments. (a) Penman–Monteith method, (b) Priestley and Taylor method, and (c) Hargreaves method.
The Budyko framework (Budyko, 1948, 1974) shows that half of CABra catchments are water-limited, and the other half are energy-limited (Fig. 6). The lowest aridity index values are found in the Amazon and the Atlantic Forest, while a warmer and drier climate can be found in the Cerrado and Caatinga biomes. This may be correlated with the physiognomies of vegetation found in these biomes, i.e., tropical forests for the first group and grass and shrub for the second one, and, especially, with the water availability and radiation incidence of these above-mentioned biomes. Although we have found some outliers which are not explained by the Budyko hypothesis, most of the CABra catchments follow the expected behavior of the long-term mean water balance proposed by Budyko (1948, 1974). Moreover, we can note that the main climate features are captured by all the datasets, with catchments in Caatinga being more arid, followed by the Cerrado. The Atlantic Forest is in the same location at the Budyko space, while some catchments in the Amazon only appear in the ERA5 and ENS dataset, due to their extension outside REF. This shows the consistency between all datasets adopted in CABra.
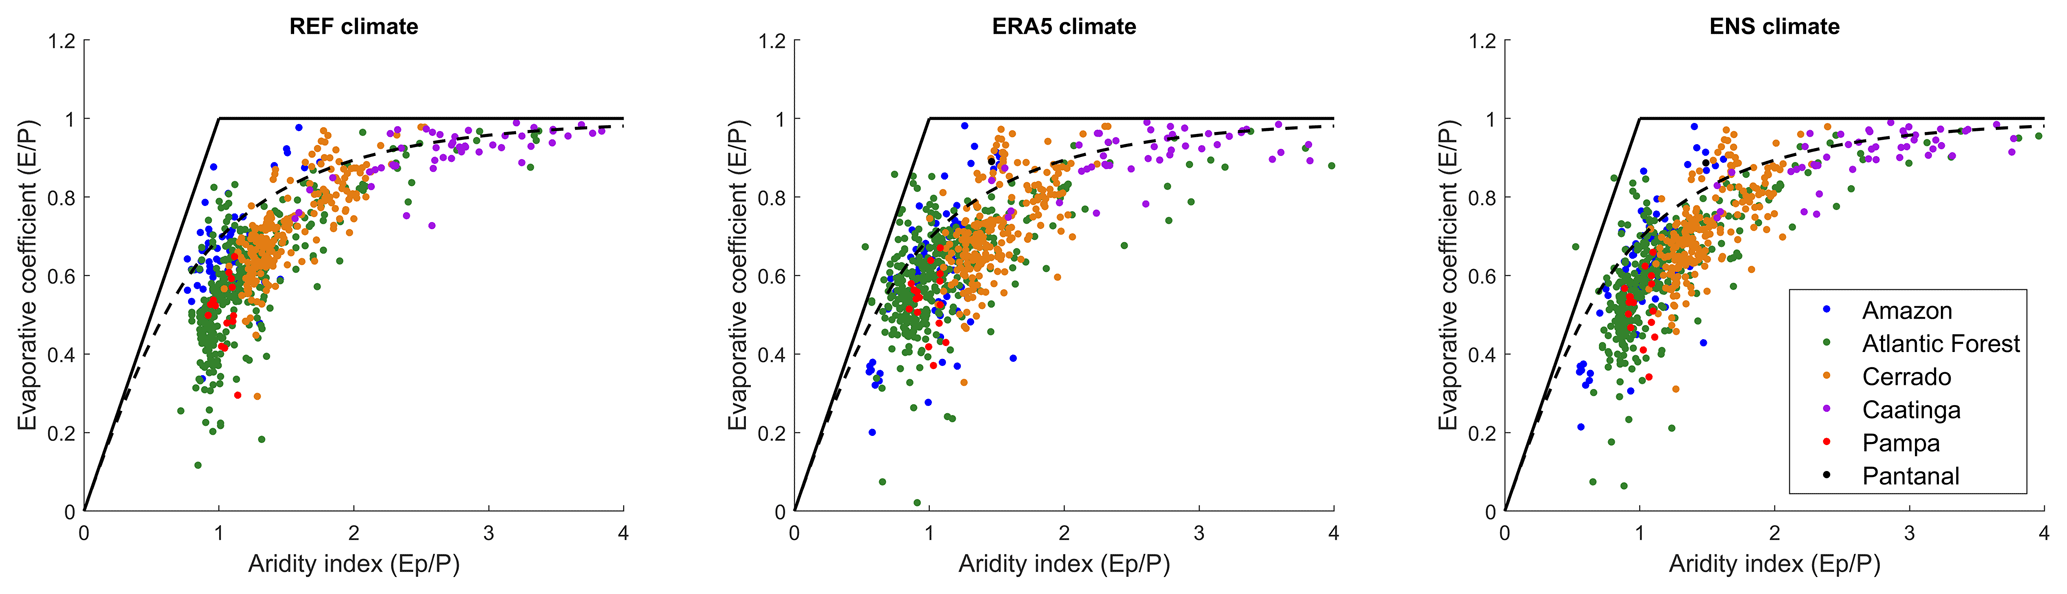
Figure 6Distribution of the CABra catchments in the Budyko framework from the three different climate datasets of CABra: REF, ERA5, and ENS. Values of E were estimated from the relation , considering long-term means.
2.3.3 Uncertainty and limitations
The climate data provided by the CABra dataset have limitations related to the number and spatial distribution of rainfall gauges in Brazilian territory that must be pointed out. Since REF and ERA5 datasets are, respectively, ground-based and reanalysis gridded data, they are subject to uncertainties of the density of the rainfall gauge network and in its post-processing procedures, which include geospatial interpolation and data modeling and assimilation. In addition, the REF dataset is not present in all of the 735 catchments due to its spatial extent, which only covers the Brazilian territory. The quality of the data is presented for users with flags though.
The potential evapotranspiration calculated for the CABra catchments is also subject to uncertainties related to the equations chosen for the study and propagation of errors of input variables from climatic data. The golden standard for reference potential evapotranspiration is the Penman–Monteith method, and the main limitations are related to the other two methods: on the application of the Priestley and Taylor method, the requirement of the Priestley–Taylor constant α, which is related to the ratio between the actual evapotranspiration and the equilibrium evaporation rate (Eichinger et al., 1996), is one of the greatest sources of uncertainty because it is scenario-dependent, and its variability is not considered using the mean value (α=1.26) proposed in its development (Guo et al., 2007). On the other hand, the main limitation of the Hargreaves equation for potential evapotranspiration is that the estimations are subject to error due to a large range of temperatures caused by weather fronts on a daily scale. On the other hand, it is a less biased model, when compared to other methods, when applied to small and not well-watered catchments (Hargreaves and Allen, 2003).
2.4 Streamflow and hydrologic signatures
2.4.1 Methodology
The CABra dataset provides daily streamflow records for 735 catchments in Brazil. We used data from streamflow gauges of ANA, where each gauge is related to one of the above-mentioned catchments. This dataset is available in the HIDROWEB database (see http://www.snirh.gov.br/hidroweb/, last access: 8 January 2020). ANA's database contains raw time series of dozens of thousands of gauges of streamflow, precipitation, water quality, and sediment discharge, with a consistency level for each observation. Due to the inconsistencies and missing records in the streamflow data provided by ANA, we implemented filters to take into account only the reliable data for the CABra dataset.
During our analysis, we found four main issues with ANA's database collected from HIDROWEB: (a) missing streamflow values for a period of the time series; (b) duplicate streamflow values with different consistency levels; (c) duplicate values with the same consistency level; and (d) duplicate dates with different values and consistent levels. In the first filter step, we overcame the last three issues by picking up only one of the duplicated values/dates based on the best level of consistency. The first issue is more complex and difficult to overcome as in some cases the missing data reach almost 100 % for some gauges. Since a long time series of streamflow is needed for reliable hydrologic investigations, we defined a threshold for the selection of the streamflow gauges considered in the CABra dataset based on the following conditions: at least 30 years of data, comprising the hydrologic years from 1980 to 2010, with up to 10 % of missing data. The application of these filters led to 735 streamflow gauges and, consequently, 735 catchments. During the analysis, we also noted inconsistencies in streamflow gauge data, such as extremely high values (up to 1000 mm d−1) and unexpected changes in daily streamflow values. Such inconsistencies can lead to an under-/overestimation of signatures based on mean values (e.g., mean daily flow, aridity index, runoff ratio), and, when repeated for a long time, they can modify signatures based on the frequency and dynamics of streamflow (e.g., flow duration curve, high and low flows frequency and duration). To avoid carrying these issues to the signature calculation, we checked for outliers in the streamflow data by comparing each value to its neighbors. Elements with a value larger than 5 times the median of a sliding 10-element window (centered in “x”) were considered to be an invalid value (NaN).
After the employment of the filters, we calculated, for the 735 selected catchments, a variety of hydrological signatures, which can provide a better understanding of the patterns of functionality and behavior of the catchments. From the quantification of hydrological characteristics, it is possible to explain the variability in responses to climate forcings. We selected hydrological signatures obtained from widely available hydrological series (see Table 4), as well as from Sawicz et al. (2011) and Westerberg and McMillan (2015). A list with more hydrological signatures can be found in Yadav et al. (2007). All the hydrological signatures were calculated considering the hydrological years (1 October–30 September) from 1980 to 2010, as adopted by the Brazilian Water Agency in their annual reports (ANA, 2020a).
Table 4Hydrological signatures of the CABra dataset.
– means dimensionless.
The hydrological signatures were based on the distribution of the streamflow. We have used the daily streamflow and its quantiles to define the mean daily streamflow, very low, low, high, and very high flows. For the calculation of frequency and duration of the streamflow, besides the number of days with no flow, the number of days with 0.2 and 9 times the mean daily streamflow was identified (low flows and high flows) as well as the number of days in sequence. The half-flow date corresponds to the day of the year in which the cumulated annual streamflow reaches half of the annual totals. The baseflow index was calculated using a recursive digital filter proposed by Lyne and Hollick (1979), presented in Ladson et al. (2013). Additionally, regarding the dynamics of streamflow, we calculated the coefficients of variation of the streamflow (mean, low, and high), the streamflow elasticity proposed by Sankarasubramanian et al. (2001), which indicates the impact of changes in precipitation to the streamflow, and the slope of the flow duration curve between 33rd and 66th quantiles, which is a good indicator of the perennial and non-perennial condition of the catchment. We also calculated the runoff coefficient for each catchment, which indicates how much of the precipitated water becomes streamflow using the simple ratio between the mean daily streamflow and mean daily precipitation.
2.4.2 Results and discussion
Figure 7 shows the hydrologic signatures calculated for the CABra catchments for the period between the hydrologic years 1980 and 2010. The mean daily flow for the Brazilian catchments ranges from less than 1 mm d−1 to up to 9 mm d−1, with an overall mean of 2 mm d−1. The highest values were found in the extreme north of Amazon, where the daily flows reached 8 mm d−1 due to high amounts of precipitation through the year, and in the Atlantic Forest, in the southeast, where we also have steepness relief with higher values of the slope, providing the runoff instead of the infiltration process. This can be seen in Fig. 7b, related to the runoff coefficient, where we noted the high values in the southern and northwestern portions of Brazil. Most of the CABra catchments presented a runoff coefficient of up to 0.5 though.
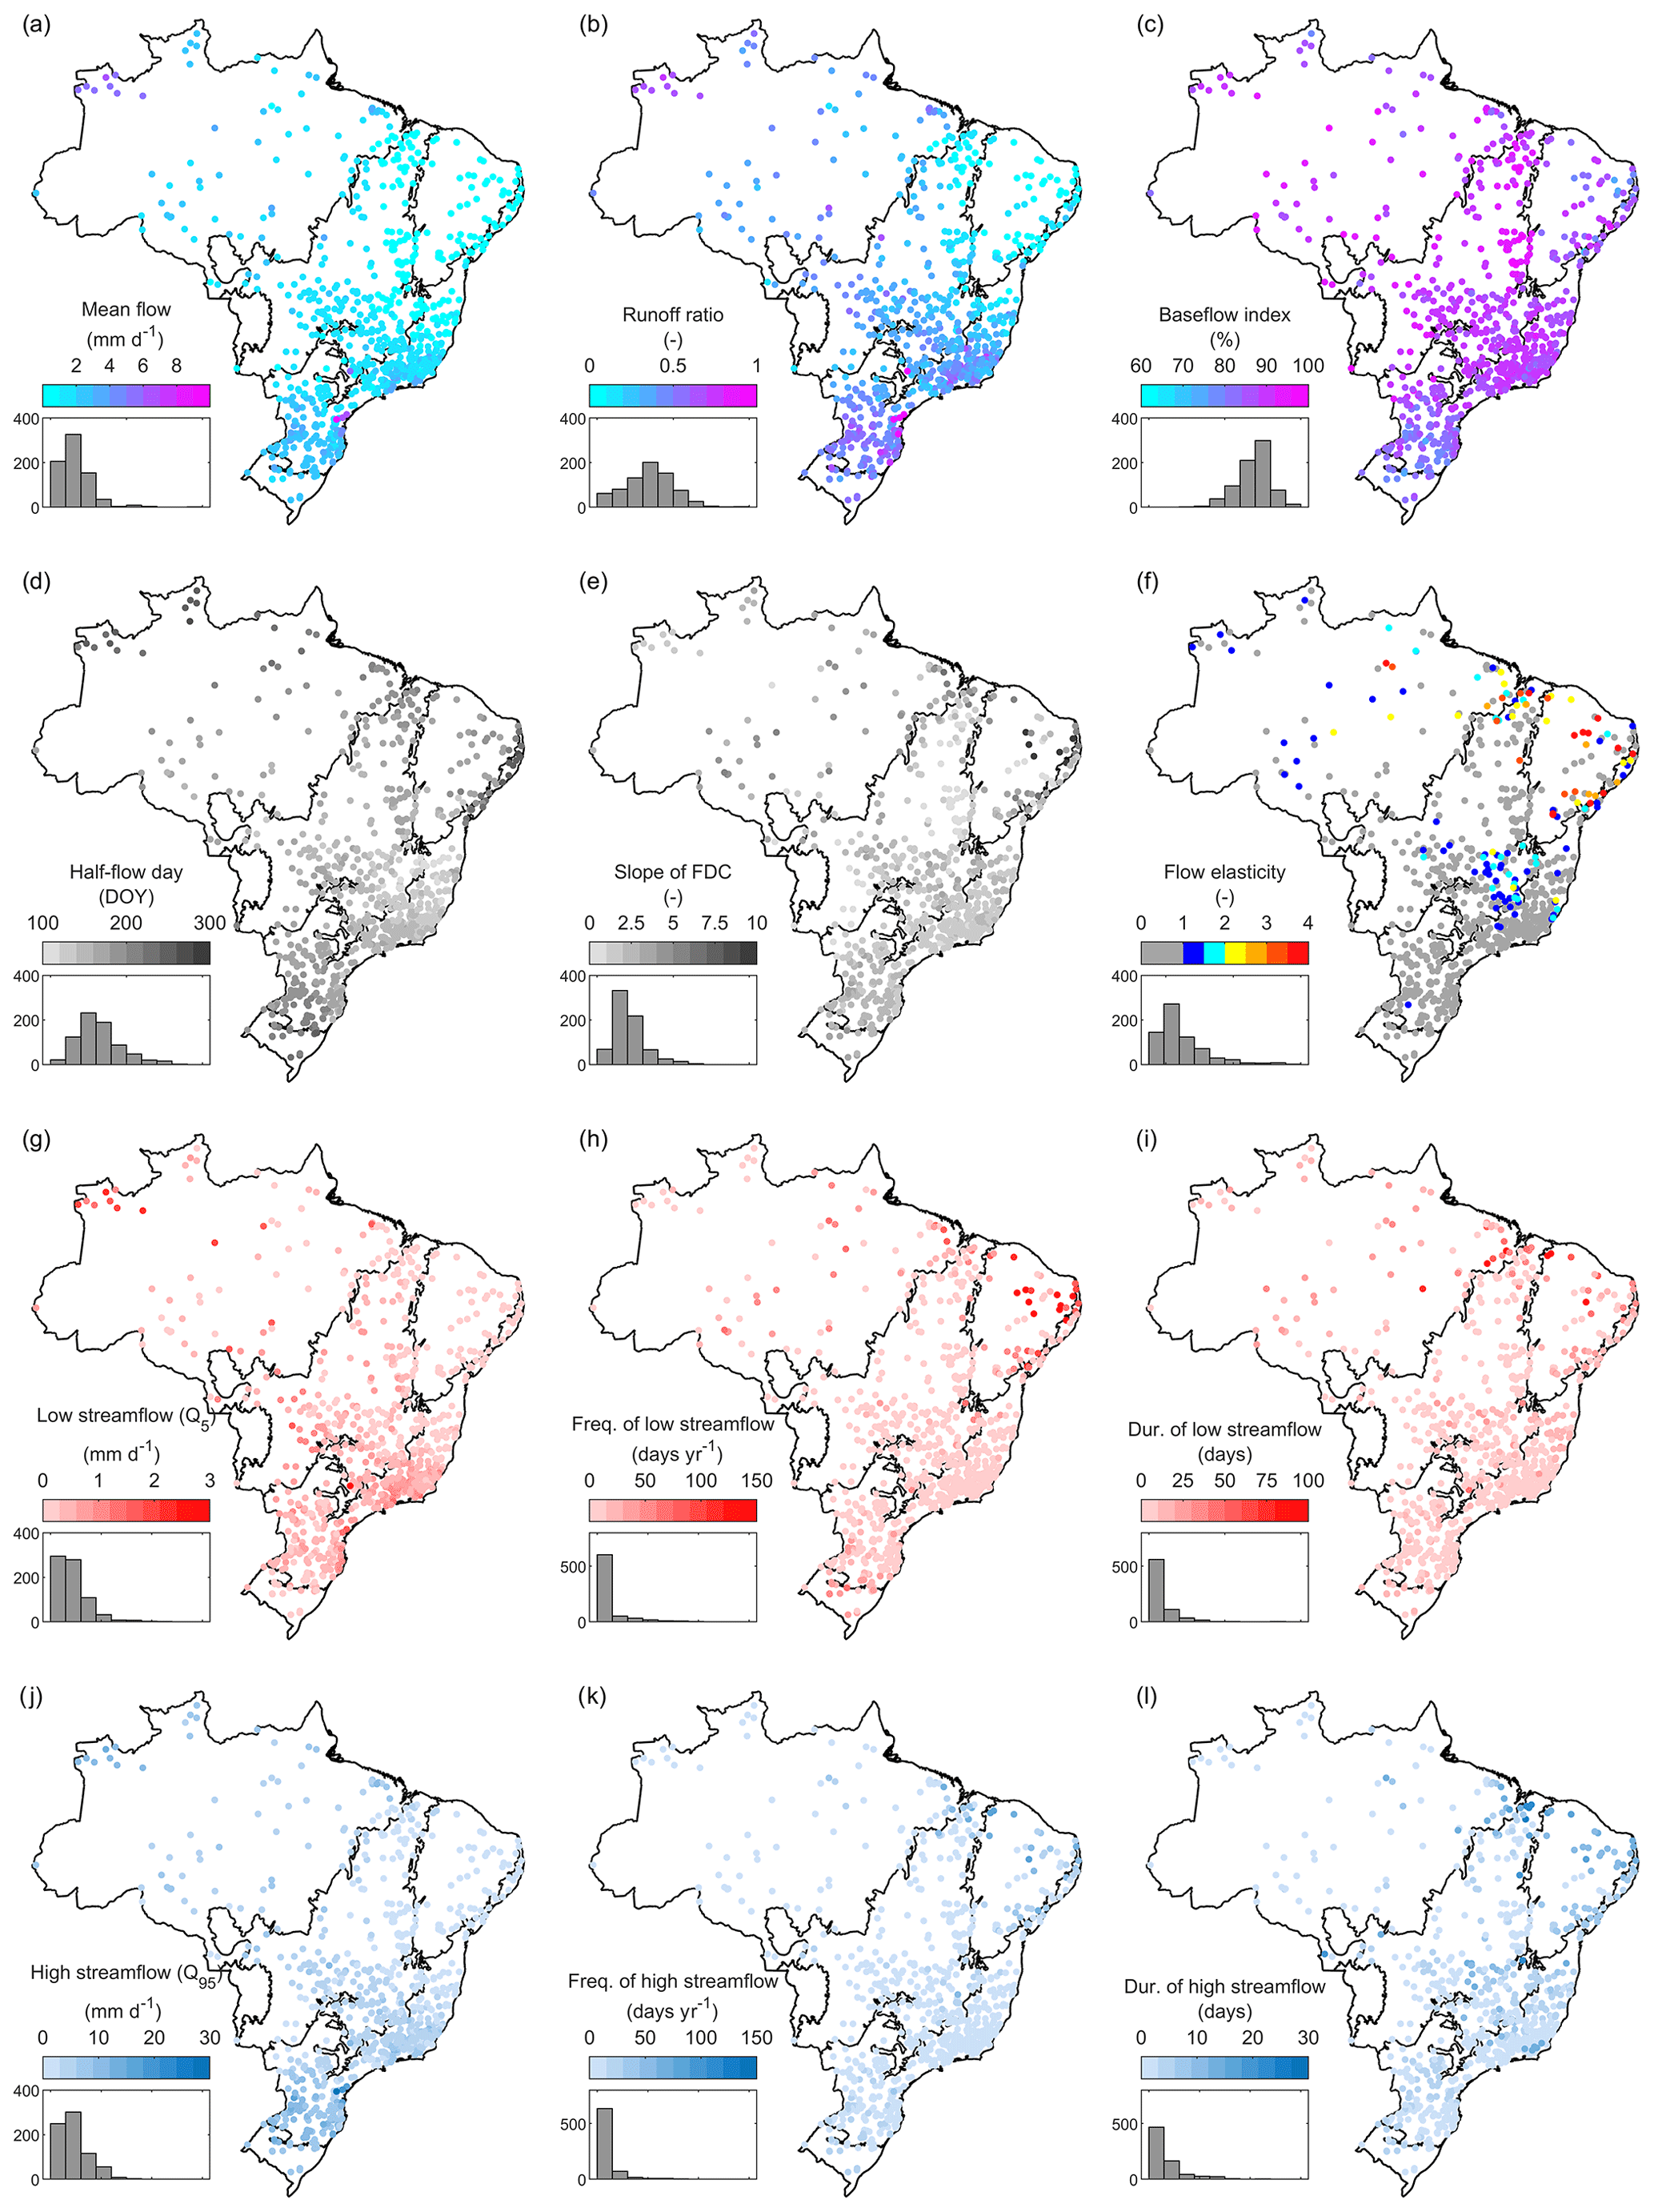
Figure 7Spatial distribution of the hydrological signatures of the CABra catchments. (a) Mean daily streamflow (in mm d−1); (b) runoff ratio (dimensionless); (c) baseflow index (dimensionless); (d) half-flow day (in day of the year); (e) the slope of the flow duration curve (dimensionless); (f) elasticity of daily streamflow (dimensionless); (g) low streamflow (in mm d−1); (h) frequency of low-streamflow events (in d yr−1); (i) duration of low-streamflow events (in d); (j) high streamflow (in mm d−1); (k) frequency of high-streamflow events (in d yr−1); (l) duration of high-streamflow events (in d).
Our results also revealed the Brazilian catchments to be mainly dependent on the baseflow since all of them presented a baseflow index greater than 70 %. The lowest values were found in the Caatinga biome, where we also found the lowest mean daily flows. The half-flow date (considering 1 October as the beginning of the hydrologic year) indicates that ∼80 % of Brazilian catchments reach the half of total accumulated annual flow in fewer than 200 d (Fig. 7d), showing the high correlation with the seasonal cycle of precipitation. The catchments with later dates of the half-flow day can be found in the Pampa biome, where there is no well-defined rainy/dry season, and in the Amazon, where the amounts of accumulated annual streamflow are too high, and the peak of precipitation is near the end of the hydrologic year (Almagro et al., 2020). The analysis of the slope of the flow duration curve, in Fig. 7e, shows the lowest values in a great portion of Brazil, ranging from the Cerrado to the Atlantic Forest and Pampa biomes.
In our analyses, we also found zero values between the 33rd and 66th percentiles of the slope of flow duration curve in the northeastern portion of Brazil, in the Caatinga biome, which indicates the existence of catchments with non-perennial rivers in that region, which are mainly dependent on direct runoff of rainfall. This can be also seen when analyzing Fig. 7f, related to the streamflow elasticity. The highest values, up to 4, are located in catchments within the same above-mentioned region, indicating the strong dependence of those catchments on precipitation events to generate its streamflow. Moreover, we can note that most Brazilian catchments are inelastic to changes in precipitation. This fact can be explained by the high values of the baseflow index, which maintain the streamflow through the year. Figure 7g–i show the results related to the low flows of CABra catchments.
In general, Brazilian catchments present a low flow (fifth quantile) lower than 1 mm d−1, up to 50 d through the year, with a mean duration of up to 25 following days. Despite the mean values, we can note high values (up to 3 mm d−1) in the Amazon. Additionally, higher values of frequency and duration of low flows can be found in the northeastern portion of Brazil, with the mean frequency reaching 150 d and mean duration reaching 100 d for some catchments. In turn, Fig. 7j–l show the information about high flows in CABra catchments. Most CABra catchments present high flows up to 10 mm d−1, but in some catchments, this value can reach 30 mm d−1. As seen in the low flow analyses, the mean frequency of high flow does not exceed 50 d yr−1 for most of the catchments. The frequency, instead, lasts for a lower time, up to 10 d.
2.4.3 Uncertainty and limitations
Uncertainties in the hydrologic signatures are mainly related to the daily streamflow data, which are, in turn, mainly related to the river discharge measurements and database maintenance by the ANA. Data collection and streamflow measurements are not the same in all catchments, varying from using current meters to the most advanced acoustic Doppler profilers. The daily discharge of sections, with well-established beds and long enough series of measurements, is estimated by rating curves, which are more susceptible to errors than direct measurements (Tomkins, 2014). Despite this, daily streamflow records are provided with a consistence level which can be “raw”, meaning that data were not quality-checked, or “consistent”, meaning that data were quality-checked. The consistence level is provided along with each daily record in the CABra dataset, allowing the user to identify the best and worst periods of streamflow measurements in each catchment. Although it is impossible to accurately measure the uncertainties (as much as eliminate them) in a large-sample dataset such as the CABra dataset, it is important to indicate the possible sources of them, since they are widespread in any hydrological modeling. This way we can indicate best periods for calibration and validation, increasing the reliability of the dataset and its application.
2.5 Groundwater
2.5.1 Methodology
The CABra dataset presents eight attributes regarding the groundwater at the catchments (Table 5). They are related to the water table (water table depth and height above the nearest drainage) and to the aquifer in which the catchment is located (aquifer name and rock type). The first attribute is the area-averaged water table depth. This information was extracted from Fan et al. (2013), who generated a global water table depth map using a climate–sea–terrain coupled model. The results were validated against observations and show the global patterns of shallow groundwater, making the understanding of how groundwater affects terrestrial ecosystems, such as the soil moisture and land hydrology, in a deficiency of rain (Fan et al., 2013; Lo et al., 2010) possible.
Table 5Groundwater attributes of the CABra catchments.
– means dimensionless.
The second attribute is the height above the nearest drainage (HAND), also related to the water table but is an indirect way to infer the water table depth. The HAND is a normalized drainage version of a digital elevation model, where the height is defined as the vertical distance from a hillslope (at the surface cell) to a respective “outlet-to-the-drainage” cell, as defined by Nobre et al. (2011). Considering the local gravitational potential, the HAND model shows robust correlations between soil water conditions and its values. Additionally, the authors created three classes to easily infer information about the water table depth (if at the surface, shallow or deep) only using a digital elevation model, which is commonly a piece of difficult and scarce information on a large scale. We also present the aquifer in which the catchment is located (most of the area) and the most common type of rock of the aquifer. This information was provided by the ANA database, and it is important for the knowledge of the aquifer geology and its implications for the groundwater storage and recharge. We also have included data from experimental wells on the CABra catchments, when available. The data were provided by the Integrated Groundwater Monitoring Network (RIMAS) from the Geological Survey of Brazil (CPRM) and include the location of each well and its static and dynamic levels.
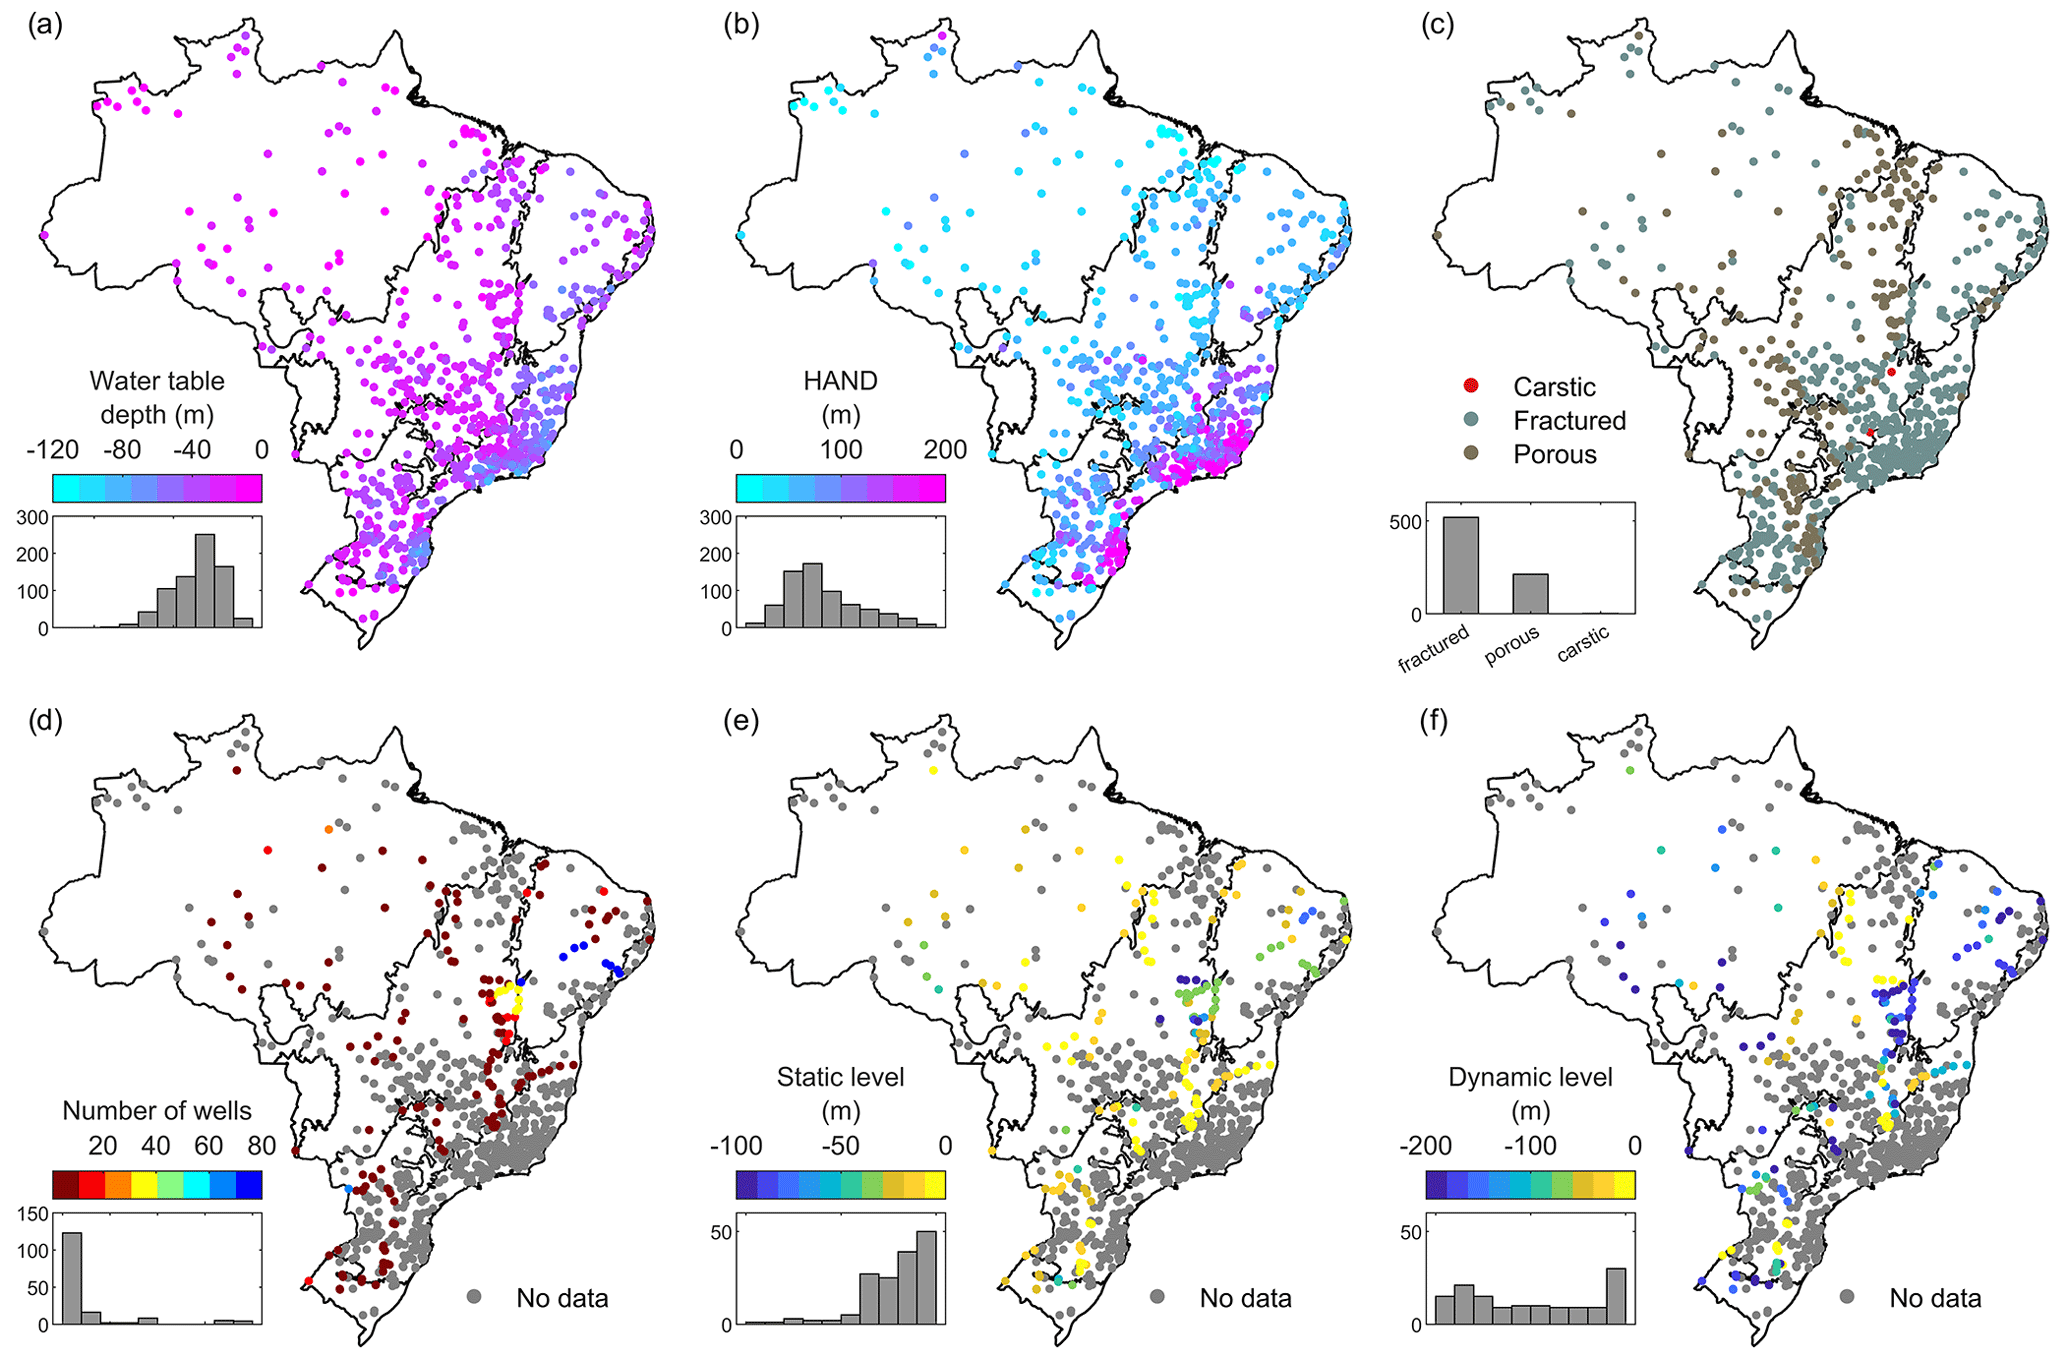
Figure 8Spatial distribution of the groundwater attributes of the CABra catchments. (a) Water table depth (in m); (b) height above the nearest drainage (in m); (c) type of aquifer bedrock; (d) number of experimental wells; (e) static level (in m); (f) dynamic level (in m).
2.5.2 Results and discussion
Our analyses showed a close relationship between the water table depth from Fan et al. (2013) and the HAND. In the northern portion of Brazil, especially in the Amazon, we can find shallow water table depths, while in the southeastern portion, especially in the Atlantic Forest, we noted the deepest values for the water table depths (see Fig. 8a and b). This could be related to the altitudes of each catchment since the HAND is a product derived from a digital elevation model. If a catchment lies at a high elevation, the water table depth is deeper than the other catchments in low elevations. This is particularly noted in the coastal area of the Atlantic Forest, which presents high altitudes and, at the same time, is close to the sea level. Values of water table depth and HAND are also in accordance with the experimental wells for catchments where it was possible for this analysis to be carried out. Despite this, the low density of experimental wells shows the lack of field data about groundwater in Brazil.
Figure 8c shows that most of the CABra catchments are dominated by fractured and porous rocks. The fractured rocks store the water in fractures, creating large pockets of water. The porous rocks store water in the soil pores (especially in sandy soils originated by sedimentary rocks), and it is common to find large amounts of water in them. Two of the world's largest aquifers are in Brazil and are porous, the Guarani Aquifer in the Cerrado biome and the Alter do Chão Aquifer in the Amazon biome. The third aquifer type found in CABra catchments is the karstic one. This can be found in the São Francisco River basin.
Table 6Soil attributes of the CABra catchments.
– means dimensionless.
2.5.3 Uncertainty and limitations
Due to the lack of a robust monitoring network for groundwater resources in Brazil, most of the data for covering the Brazilian territory are based on in situ observations of water table depth and groundwater model forced by climate, terrain, and sea level, only up the year 2013 (Fan et al., 2013). For South America, there were 34 508 observation sites, most of them in Brazil, but they are concentrated in the Atlantic coastal area, with few observations in most of the Brazilian area. Moreover, the global dataset provided by Fan et al. (2013) neglects local perched aquifers, groundwater pumping, irrigation, drainage, and any other complexity of human interaction. The HAND product, in turn, is not based on observations, but it is a simplified way to correlate the water table depth with terrain elevation, and it is mainly subject to errors in the digital elevation model used as input, especially in flat areas, where there are uncertainties during the flow direction determination (Nobre et al., 2011). The information of aquifers presented in the CABra dataset, provided by the Brazilian Water Agency, was developed with a previous and rigorous consistency analysis of geological and hydrogeological studies in Brazil, followed by the classification in three main classes, as fractured, karstic, or porous. The mapping of aquifers systems was based on the analysis of consistency, adequacy, and reclassification of existing geological and hydrogeological information. The reclassification of polygons from geological units and their groupings was conducted according to their hydrogeological characteristics. Data sources had different scales, which might be a source of uncertainty for the aquifer data. The sources and spatial map of the aquifers are not available through the CABra dataset, in which we only present the most common aquifer in each catchment.
2.6 Soil
2.6.1 Methodology
The CABra dataset has eight attributes related to the soil type, properties, and texture (Table 6). The soil type of the catchment presented here is the most common type for each catchment (bigger percentage of the different types) derived from the Brazilian soil map developed by the Brazilian Agricultural Research Corporation (EMBRAPA, in Portuguese) (Santos et al., 2011). To meet with the international standards for soil classification, we converted the classes to the widely used World Reference Base (WRB) (FAO, 2014). Due to the high importance of the knowledge of the soil depth, density, texture, and organic matter to the understanding of soil-water dynamics and root growth (Dexter, 2004; Saxton et al., 1986; Saxton and Rawls, 2006; Shirazi and Boersma, 1984), we also present the mean areal attributes for them. These fields were taken from the SoilGrids250m, a global high-resolution gridded soil information database based on field measurements, data assimilation, and machine learning. This is the most detailed and accurate global soil product and is crucial for the development of large-scale studies in many fields (ecology, climate, hydrology). However, despite all the improvements brought by SoilGrids250m, the data still have limitations, and one of the biggest is the high uncertainty levels for some of its products, such as the depth to bedrock and coarse fragments. In addition, we also employed the United States Department of Agriculture (USDA) soil texture classification, which is a widely used method for soil definition based on the mechanical limits of soil particles. Previous studies have shown that the USDA soil texture classification can potentially reflect other soil parameters and characteristics (Groenendyk et al., 2015; Twarakavi et al., 2010), making it a powerful tool with a low input requirement.
2.6.2 Results and discussion
The catchments presented 12 main soil classes, with Ferrasols, Acrisols, and Nitisols being the most common soil types in more than 90 % of the CABra catchments (Fig. 9a). Ferrasols were the dominant soil type in approximately 75 % of the catchments, typical of equatorial and tropical regions, which have an advanced stage of weathering of their constitutive material, being normally deep (>1 m), well-drained, and acidic soils (high pH levels can occur in areas with a strong dry season, such as that observed in the Caatinga biome). Acrisols are formed mainly by minerals, with an evident increase in the clay content from the surface to horizon B, with variable depth and drainage but always with high acidity. The third most common soil type is the Nitisols, which have a clay texture, with a well-developed B horizon structure, and are usually deep and well-drained with moderate acidity (EMBRAPA, 2018).
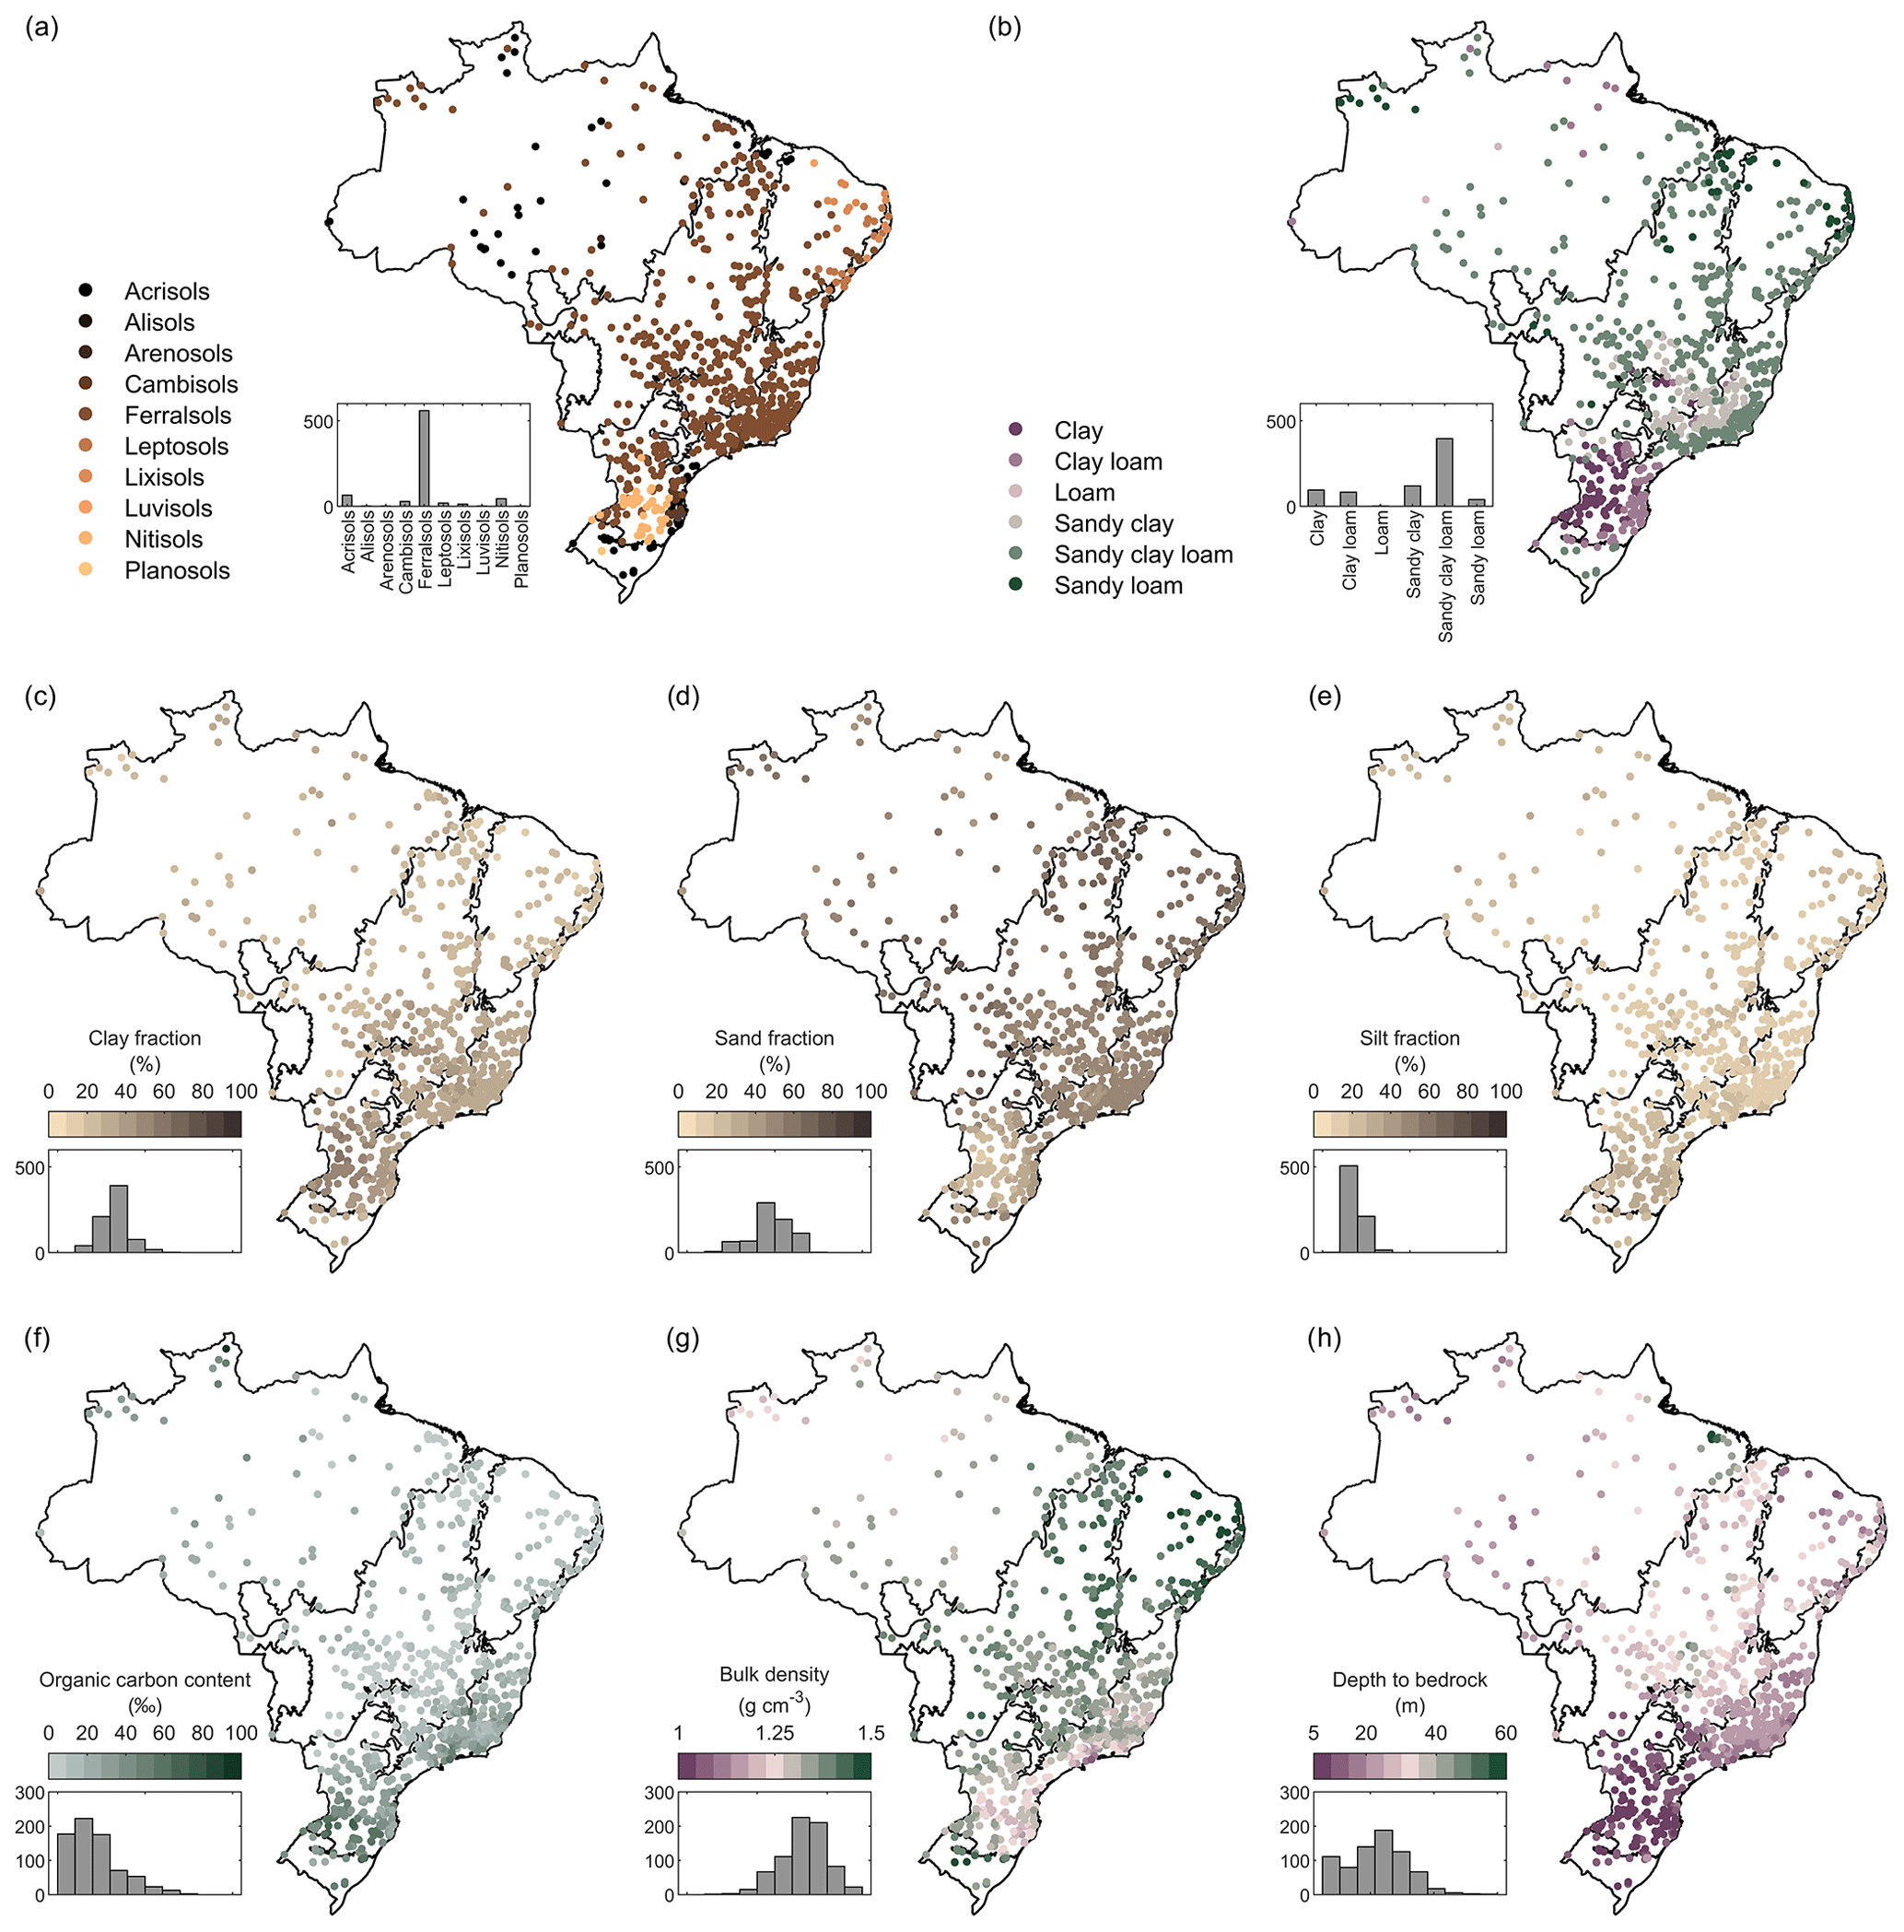
Figure 9Spatial distribution of the soil attributes of the CABra catchments. (a) The most common type of soil in the catchment; (b) the class of texture based on USDA classification; (c) the clay fraction of the soil (in percent); (d) the sand fraction of the soil (in percent); (e) the silt fraction of the soil (in percent); (f) the organic carbon content of the soil (in per mill); (g) the bulk density of the soil (in g cm−3); (h) the depth to soil bedrock (in m).
We noted that most of the catchments present soil texture dominated by sand and clay (Fig. 9c–e). Southeastern, northern, and central regions of Brazil are dominated by sandy clay loam soils, while the southern portion is dominated by clay, which can reach up to 80 %, making this region one of the most productive in terms of agriculture in Brazil. Through the employment of the USDA texture triangle, we found six classes: clay, clay loam, loam, sandy clay, sandy clay loam, and sandy loam (see Fig. 9b). The soils presenting a clay and clay loam texture are in the southern portion, especially where the Nitisols occur, which is also the region with a significant portion of Brazilian agricultural production.
Most of the catchments present a mix of texture, the sandy clay loam, which covers an area from the south through the central to the northern regions of Brazil. There is a spatial correlation between the soil organic carbon, bulk density, and the distance to the bedrock, as we can see in Fig. 9f–h. In the southern and southeastern portions, especially in the Atlantic Forest biome, there is a combination of high soil organic carbon, low bulk density, and low distance to the bedrock. These characteristics, combined with the favorable climate, made this region attractive to agriculture. Conversely, other Brazilian regions present the opposite.
2.6.3 Uncertainty and limitations
The main limitation of the database used in the CABra dataset as the source for soil attributes, the SoilGrids250 (Hengl et al., 2017), is related to the interpolation of predicted data (through machine learning algorithms), which are based on data observed by soil profiles. In this aspect, Brazil has a good starting point, with a dense and uniform distribution of in situ samples. However, authors state that, although most properties are unbiased, coarse fragments and depth to bedrock present relatively high uncertainties, as well as overestimations in low values of organic carbon content. Uncertainties are also related to the need of translation from the Brazilian classification system to the World Reference Base and USDA classification systems, where some information could be missed or misunderstood.
2.7 Geology
2.7.1 Methodology
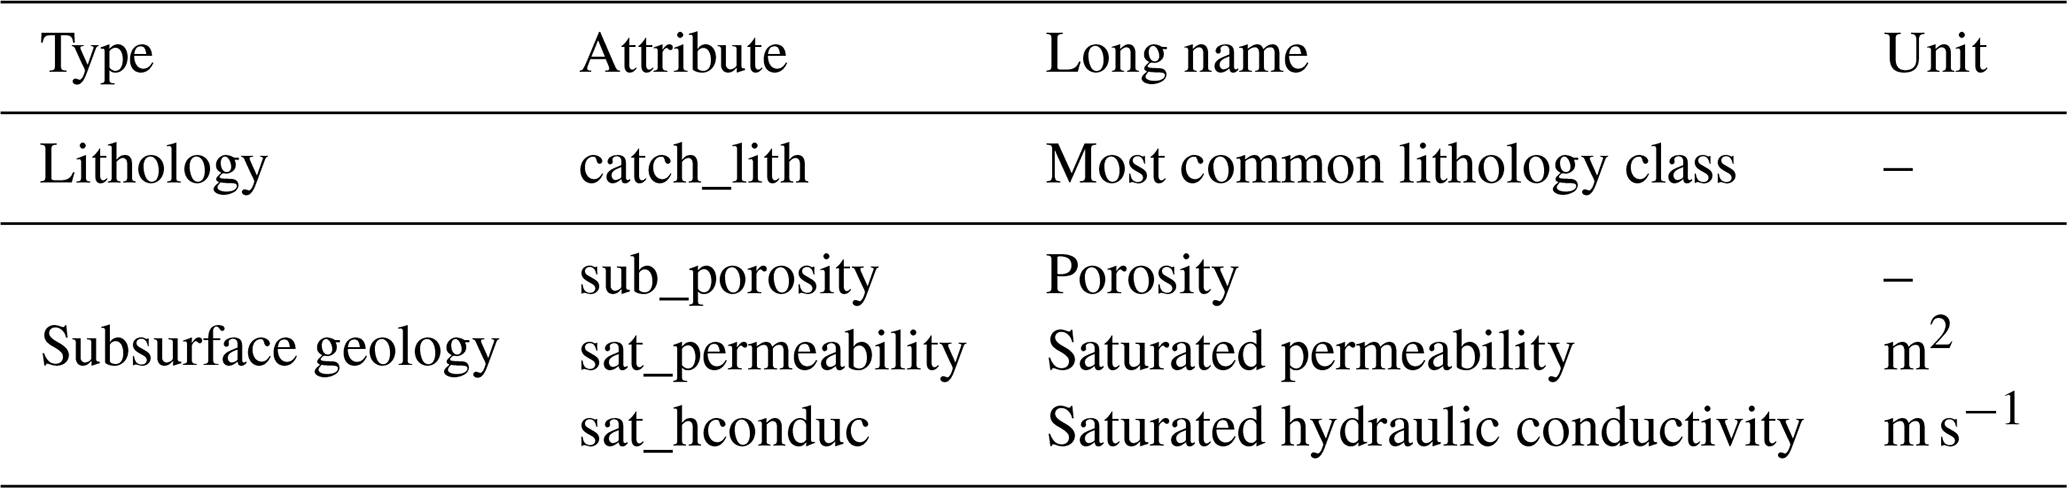
The CABra dataset presents four attributes related to the geology of the catchments (Table 7), being the predominant lithology class, the porosity, the saturated permeability, and the saturated hydraulic conductivity. The lithology class is derived from the Global Lithologic Map (GLiM) (Hartmann and Moosdorf, 2012). The GLiM is a high-resolution global dataset that describes the geochemical, mineralogical, and physical properties of the rocks in 16 main lithological classes. Moreover, GLiM allows us to better understand the geology of smaller areas, such as our CABra catchments. Also, we are using a GLiM-derivate product of porosity and permeability named GLobal HYdrogeology MaPS (GLHYMPS), developed by Gleeson et al. (2014). The GLHYMPS is the first large-scale high-resolution mapping tool of porosity and permeability and fills the gap caused by the lack of a robust and spatially distributed subsurface geology map.
Table 7Geological attributes of CABra catchments.
– means dimensionless.
The porosity is how the void spaces in a material (soil in our case) control how much fluid (water) can be stored in this material or in the soil subsurface. The movement of the stored water in the soil is controlled by the permeability, which is the capacity of a porous material (again, soil) to transmit fluids. Both parameters are fundamental to the knowledge of the fluid rate and its impacts on Earth's subsurface. When using this kind of high-resolution data for large-scale studies, we can improve our understanding of the dynamics between groundwater and land surface. Considering the saturated hydraulic conductivity to be one of the most important physical properties for the quantitative and qualitative assessment of the water movement in the soil, we presented its values in the CABra dataset. Following the assumption that the hydraulic conductivity is separable into the contributions of the porous matrix of the soil and the density and viscosity of the fluid, we also estimated the saturated hydraulic conductivity of the CABra catchments using its relation to the permeability (Eq. 4), as described in Grant (2005).
where K is the saturated hydraulic conductivity, k is the saturated permeability, ρ is the density of the fluid, g is the gravitational constant (9.8 m s−2), and μ is the viscosity of the fluid. In our study, we have considered the water as the fluid, so we have used ρ=999.97 kg m−3 and μ=0.001 kg m−1 s−1.
Figure 10Spatial distribution of geology attributes of the CABra catchments. (a) Most common lithology class in the catchment; (b) porosity (dimensionless); (c) saturated permeability (in m2); (d) saturated hydraulic conductivity (in m s−1).
2.7.2 Results and discussion
Related to the lithology class, the catchments present 10 different classes according to the GLiM dataset: siliciclastic sedimentary rocks, acid volcanic rocks, unconsolidated sediments, acid plutonic rocks, metamorphic rock, mixed sedimentary rocks, basic volcanic rocks, carbonate sedimentary rocks, intermediate volcanic rocks, and pyroclastic rocks (Fig. 10). We found that 35 % of the catchments have metamorphic rocks as the most common lithologic class, a result of continuous weathering on the original rock. These catchments are located especially in the southern portion of Brazil, in mountainous areas. Approximately 39 % of CABra catchments are formed by sedimentary rocks, considering its subdivision in siliciclastic, unconsolidated, and mixed resulted from sediment deposition. They are mostly located in flat areas, such as in the Paraná River basin and São Francisco River basin, in the central and northeastern portion of Brazil. A portion of 25 % of catchments present igneous rocks (plutonic and volcanic) as the most common lithology class, resulted from volcanic eruptions. These catchments are located mainly in the Atlantic Forest biome, although we can find some catchments in the Amazon.
In respect to the porosity, most CABra catchments presented values lower than 20 %, with a mean value of 10 %. Catchments in the Atlantic Forest presented the lowest values of the catchment set. Results regarding the saturated permeability and hydraulic conductivity reinforce the heterogeneity and random occurrence of these soil properties. As we can see in Fig. 10 and d, there is no well-defined spatial behavior for them. Saturated permeability ranges from −14 to −12 m2 in log scale, with a mean of −13.4 m2, while the saturated hydraulic conductivity, which presented a mean value of −6.4 m s−1 on the log scale, varies between −10 and −4 m s−1 on the log scale.
Table 8Land-cover attributes of CABra catchments.

– means dimensionless.
2.7.3 Uncertainty and limitations
The geological map of the CABra dataset is derived from the GLiM dataset (Hartmann and Moosdorf, 2012), which is, in turn, the main source for the development of the hydrogeological map used in the CABra dataset, the GLHYMPS (Gleeson et al., 2014). Authors state that the global lithological map is still subject to significant uncertainty in rock properties in some of its lithological classes, mainly because of the scale of the maps. About 14.6 % of the map's area is covered by mixed sediments, explicating the large amount of area subject to undistinguishable properties. In addition, the quality of literature used to identify lithology in rare locations may have introduced some uncertainty level on GLiM. As mentioned before, the GLiM map was employed as a basemap for the GLHYMPS permeability product, implying that all uncertainty associated to GLiM might be propagated to it. Moreover, Gleeson et al. (2014) present an uncertainty map of permeability, showing high standard deviation values for central portions of Brazil, especially in the Tocantins—Araguaia catchment. Finally, authors also recommend a careful use of the dataset where unsaturated zone processes are dominant, since GLHYMPS only takes saturated permeability into account.
2.8 Land cover
2.8.1 Methodology
The CABra dataset presents 15 attributes regarding the land cover and land use of the Brazilian catchments (Table 8). They are related to the area-averaged land cover and land use itself (dominant cover type and the cover fractions of nine main classes of use: bare soil, forest, grass, shrub, moss, crops, urban, snow, and water) and to the area-averaged intra-annual variability of the vegetation biomass, represented here by the normalized difference vegetation index. The land-cover and land-use map used in the CABra dataset is the Copernicus Global Land Cover, which has 100 m spatial resolution, is a result of a classification of the PROBA-V satellite observations of the year 2015, and follows the UN FAO Land Cover Classification System (Buchhorn et al., 2019) available at https://land.copernicus.eu/global/lcviewer (last access: 21 May 2020).
As an indicator for the vegetation biomass of the land cover through the year, we are using the seasonal NDVI for each CABra catchment. The NDVI is widely used, is easily accessible, and has high-temporal availability, which can be useful for many purposes in hydrology, from an annual precipitation cycle indicator to input for soil erosion assessments. We adopted a product derived from the Long Term Statistics (LTS) based on the normalized difference vegetation index (NDVI) from the Copernicus Global Land services. This dataset is an NDVI mean for each month of the year during the 1999–2017 period, obtained from the SPOT-VGT and PROBA-V sensors in a 1 km spatial resolution, available at https://land.copernicus.eu/global/products/ndvi (last access: 27 May 2020). The NDVI is obtained by calculating the spectral reflectance difference between red and near-infrared bands of the satellite image (Tucker, 1979) (Eq. 5) and ranges from −1 to +1, with the highest values attributed to areas with greater vegetation cover.
where NIR is the surface spectral reflectance in the near-infrared band, and RED is the surface spectral reflectance in the red band.

Figure 11Spatial distribution of the land-cover and land-use attributes of the CABra catchments. (a) The most common land-cover type in the catchment; (b) forest fraction of land cover (in percent); (c) grass fraction of land cover (in percent); (d) shrub fraction of land cover (in percent); (e) crops fraction of land cover (in percent); (f) urban fraction of land cover (in percent).
2.8.2 Results and discussion
We observed that most of the Brazilian catchments are covered by forest and grassland (Fig. 11). The shrub is the dominant cover for most of Caatinga catchments, while the grass is the dominant one in the Cerrado (tropical savannah). The forest cover is dominant, especially in the Amazon and Atlantic Forest, as these two biomes are known for tropical forest occurrence, but even though the forest cover is not the most common for all the CABra catchments, ∼85 % of them present at least 20 % of it (Fig. 11b). The grass cover fraction presented values up to 40 % of the area for most of the catchments but reached 60 % in some cases (Fig. 11c). The highest values were found in the Cerrado and Atlantic Forest biomes, in central and southeastern portions of Brazil.
Large areas of natural cover were converted to agricultural lands (including crops and pasture) in past years (Gibbs et al., 2010, 2014), and satellite sensors and classifiers algorithms cannot separate natural grassland and pasture/managed grasslands, as described in the PROBA-V documentation. Figure 11d gives us a better idea of this. The fraction of the shrub cover of the Cerrado is probably the natural cover remaining for this biome since this is the expected type of vegetation. As seen in Fig. 11e, a few numbers of catchments present the crops as the dominant cover type, mostly in the central and southern region, but we can also see a great fraction of crop cover in the Matopiba region, one of the largest agriculture frontiers in Brazil (Gibbs et al., 2014; Pires et al., 2016; Spera et al., 2016). Figure 11f shows that there are only a few cases of urban catchments, within or close to major Brazilian cities that present this type of cover, showing that the CABra dataset is mainly composed of either natural or minimally (hydrologically) modified catchments.
The seasonal variability of the NDVI can be seen in Fig. 12. Although the mean seasonal values for the entire country are similar (0.65 for DJF, 0.69 for MAM, 0.64 for JJA, and 0.56 for SON), the spatial variability of the NDVI values is noticeable. There is a clear relationship with the annual cycle of precipitation, and that is why it is so important to consider the seasons to analyze the NDVI. Higher values of NDVI occur in accordance with the seasonal cycle of precipitation in all the biomes, especially in DJF and MAM months. Even in the Amazon, we can see a considerable decrease in the NDVI values for the catchments in the dry seasons (JJA and SON), as well as the other biomes and regions of Brazil. NDVI reaches the lowest values at the end of the hydrological year, and the values only start to increase at the beginning of the rainy season, i.e., DJF. Intermediate values in the central portion of Brazil are very likely to be linked to agricultural production, leading the values to be lower than the natural cover.
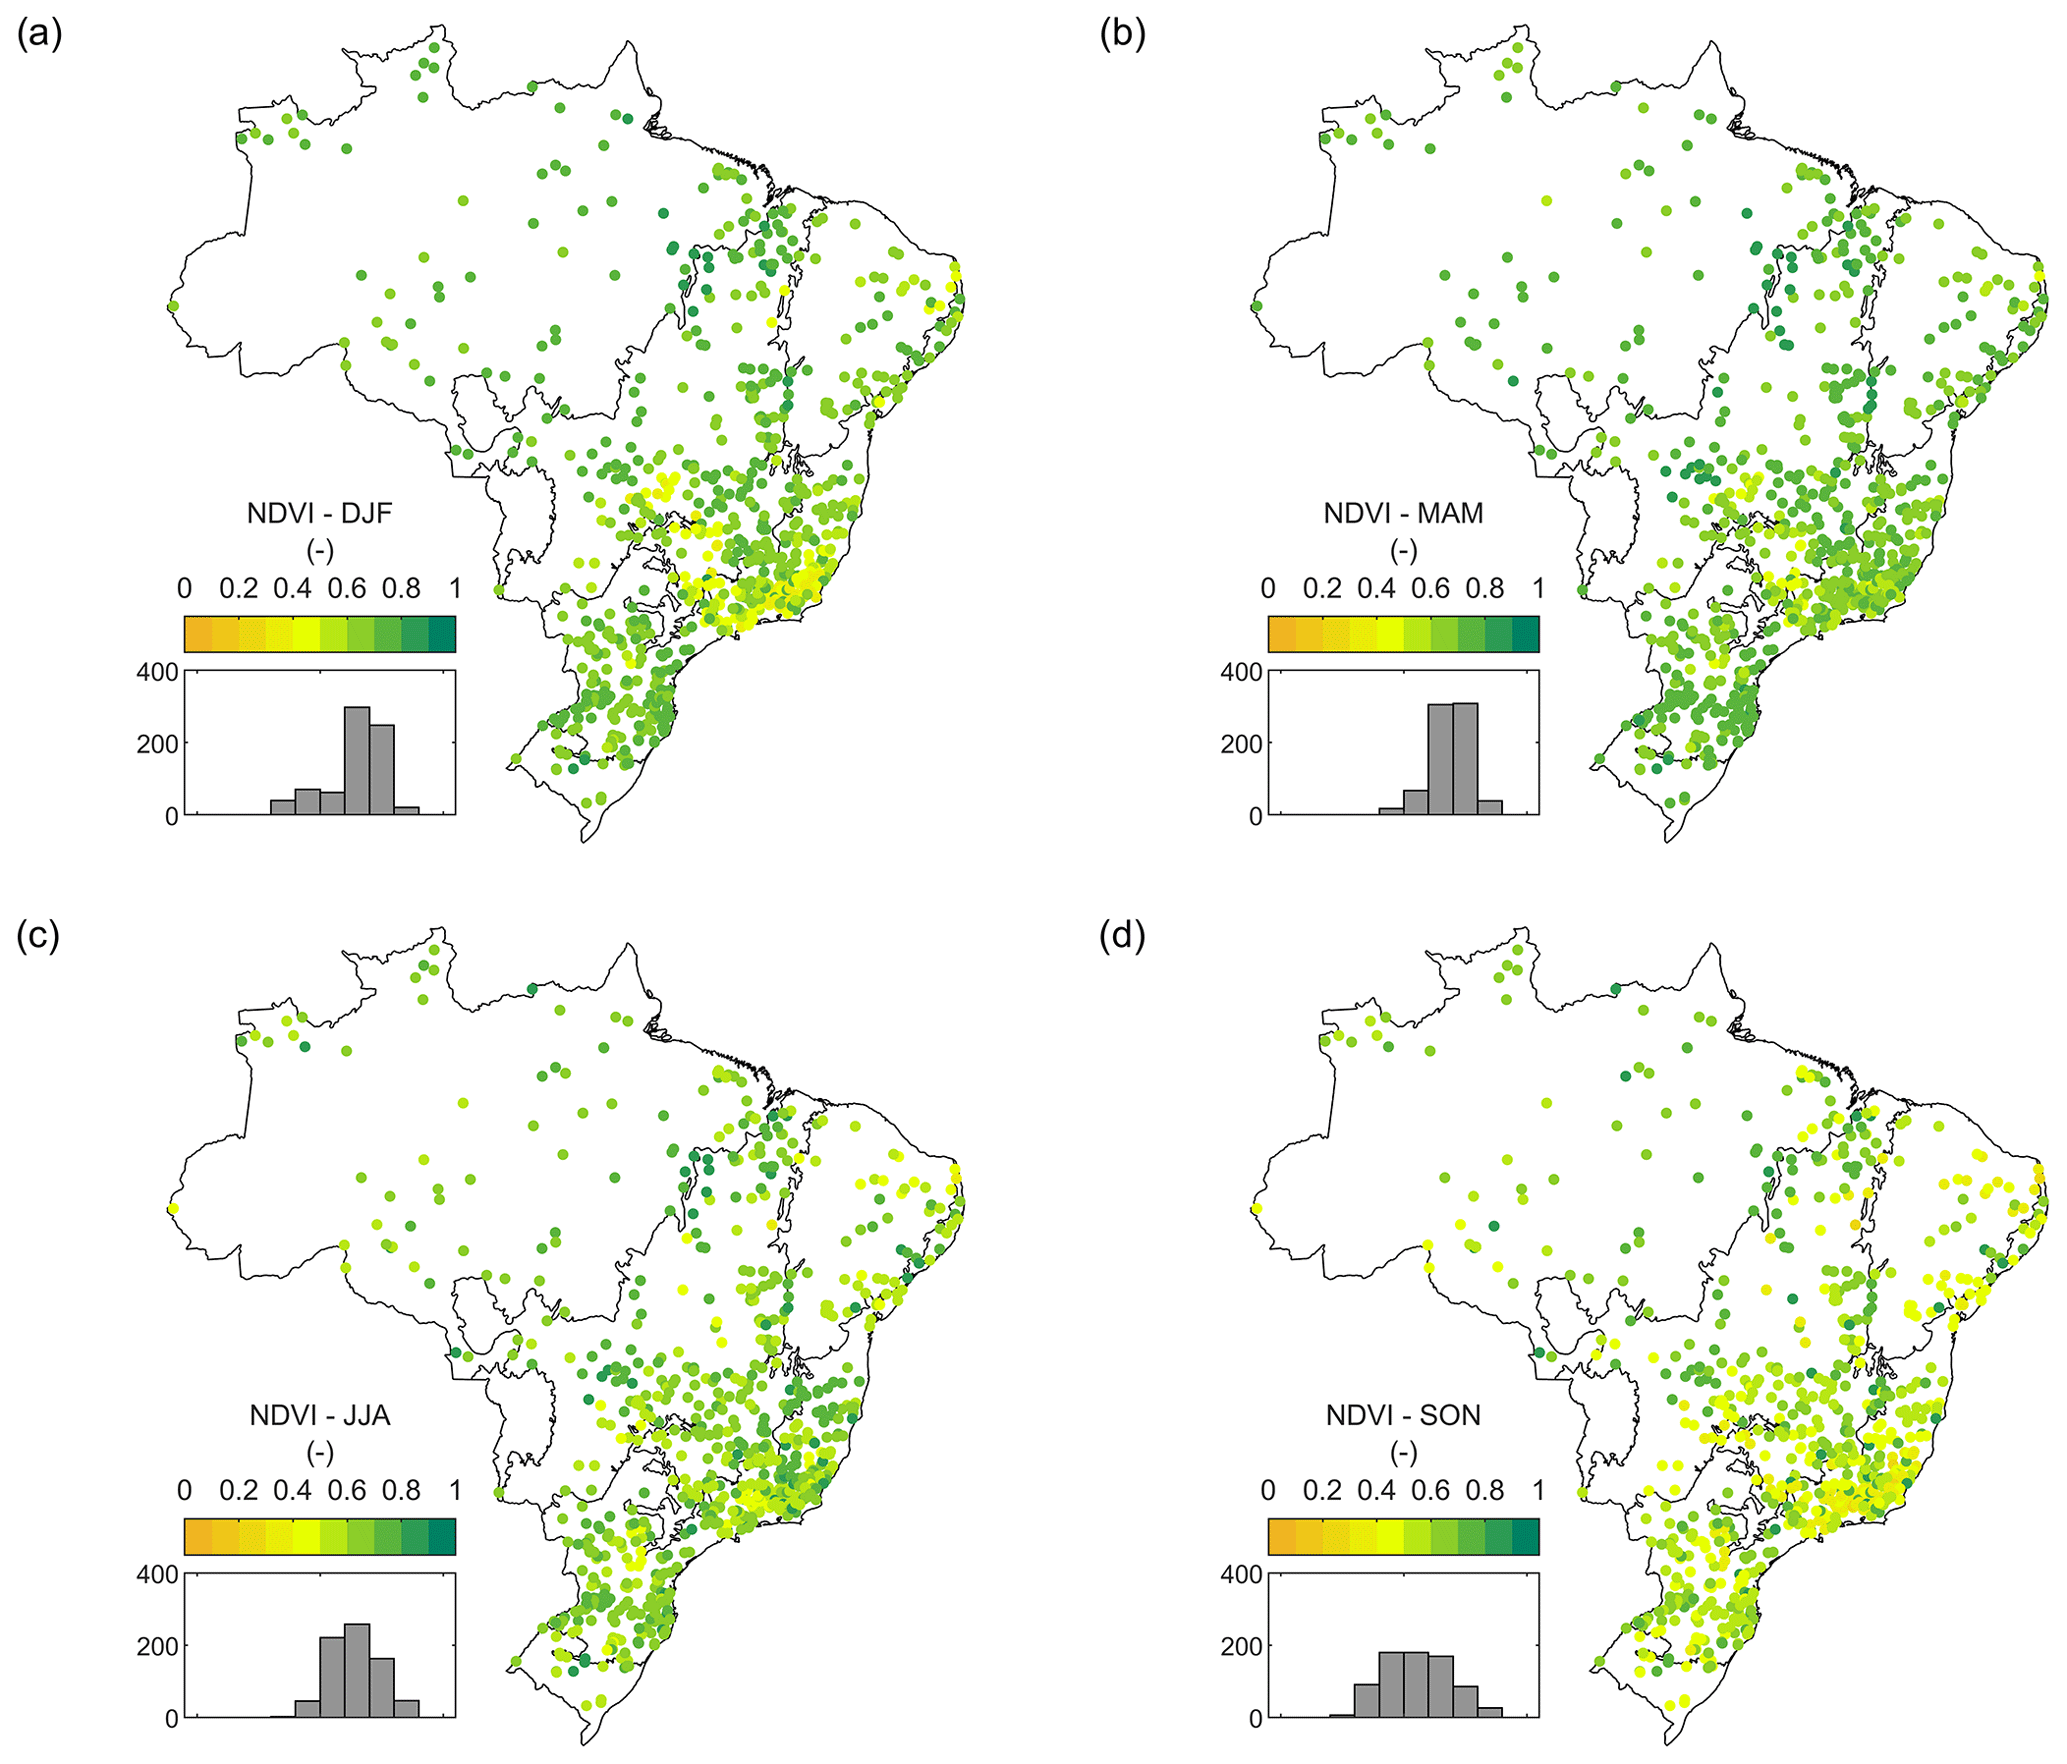
Figure 12Spatial distribution of the seasonal NDVI of the CABra catchments. (a) NDVI in the summer season (DJF); (b) NDVI in the autumn season (MAM); (c) NDVI in the winter season (JJA); (d) NDVI in the spring season (SON).
2.8.3 Uncertainty and limitations
Although the CABra dataset presents one of the most high-accuracy spatial resolutions on a global scale, the data are related to the year 2015, which is not within the 1980–2010 period adopted in the hydrological analyses.
As authors from the Copernicus Global Land Cover (Buchhorn et al., 2019) state, the global land-cover data should be used with confidence but with careful and critical analysis by the users, due to the land change commissions and omissions. Uncertainty analyses conducted in three aggregated classes (forest, crops, and natural vegetation) showed high accuracy in all regions of the world, when compared with more than 200 000 sample points, even though there is some level of overestimation in the forest class, leading to a careful assessment of land cover in Amazon and Atlantic forest catchments. At the same time, due to the 100 m spatial resolution, small villages and highly fragmented landscapes might be indistinguishable and/or mixed with different classes.
The NDVI dataset, also provided by Copernicus Global Land Cover, should be used as a qualitative indication of the biomass in the catchment, due to it relatively low spatial resolution (300 m). There are also uncertainties related to the radiometric calibration of the images and anisotropic surfaces, aside from the fact that the products did not consider adjacency effects and slope correction.
Table 9Hydrologic disturbance attributes of CABra catchments.

– means dimensionless.
2.9 Hydrologic disturbance
2.9.1 Methodology
The CABra dataset presents 10 attributes related to the hydrologic disturbances on catchment water fluxes (Table 9). Anthropic changes in water flux patterns, which happen outside the range of natural flow and climate extremes, can directly impact the water availability and quality, stream channel geometry and sedimentation, and the equilibrium of ecosystems (Boulton et al., 1992; Coleman et al., 2011; Whited et al., 2007). Natural conditions of catchments are constantly modified by human interactions such as land-cover and land-use changes, flow regulation, water abstraction, soil impermeability, and many others, which can drastically alter the way hydrologic fluxes in the catchments respond. Therefore, our goal was to create a simple index, with easily accessible inputs, that is capable of measuring how disturbed a catchment is in relation to its hydrology. Since the beginning of CABra development, it was known that most of the catchments were minimally urbanized but some of them with changes in the original land cover (conversion of natural vegetation to cropland/pasture). Some studies conducted in Brazil found that, in addition to the interference by the conversion of natural vegetation to pasture, this led to minimal changes in the surface hydrology of the catchment, being more relevant to groundwater recharge and soil chemistry (de Bacellar, 2005; Lanza, 2015; Nepstad et al., 1994; Salemi et al., 2012). Additionally, it has been seen that the human-induced impact of the reservoirs can be more relevant than the natural ones and can significantly alter natural hydrological processes (Zhao et al., 2016), leading to an increase/decrease of streamflow and hydrological drought characteristics (Wanders and Wada, 2015; Ye et al., 2003; Zhang et al., 2015). Moreover, Zhang et al. (2015) found that hydrologic vulnerability is also directly related to human water abstraction, but this can be compensated for by streamflow regulation of the reservoirs. This led us to an integrated analysis of the reservoir regulation and human water abstraction to reach the optimal balance on our index.
Based on the above-mentioned information, we have decided to use weighted information about the land cover, reservoirs, and water demand of each catchment. We considered the reservoir-based information with more impact: regulation capacity with 40 % and number of reservoirs and its percentage of catchment area each with 5 %. The second most impacting factor of the index is the non-natural land cover in the catchment, which can lead to modification of hydrological surface and subsurface processes, with 40 % of the weight. Finally, the water abstraction of the catchment was considered to have 10 % weight.
In the development of this index, we have considered the fraction of urban cover in each catchment, the distance to the nearest urban area of each catchment (considering any pixel of urban area), the number of reservoirs in each catchment (ANA, 2020b), the total volume of reservoirs in each catchment (ANA, 2020b), and its flow regulation capacity, the fraction of reservoir area of each catchment area (ANA, 2020b), and the annual water demand (ANA, 2019b). The equation related to the hydrologic disturbance index can be found in the following Eq. (6):
where HDindex is the hydrologic disturbance index (dimensionless); UC is the normalized fraction of urban cover; UD is the normalized distance to the nearest urban area; CRC is the normalized fraction of crops cover; RN is the normalized number of reservoirs; R%A is the normalized percentage of catchment's area covered by reservoirs; RR is the normalized reservoirs' regulation capacity of catchment's mean annual flow; and WD is the normalized catchment's annual water demand.
The result is the hydrologic disturbance index (HDI), which will easily provide the degree of human interactions that can modify water fluxes in each catchment for CABra users. Additionally, we also applied a random forest algorithm for a regression analysis to show if and how the hydrological signatures are captured by the HDI.
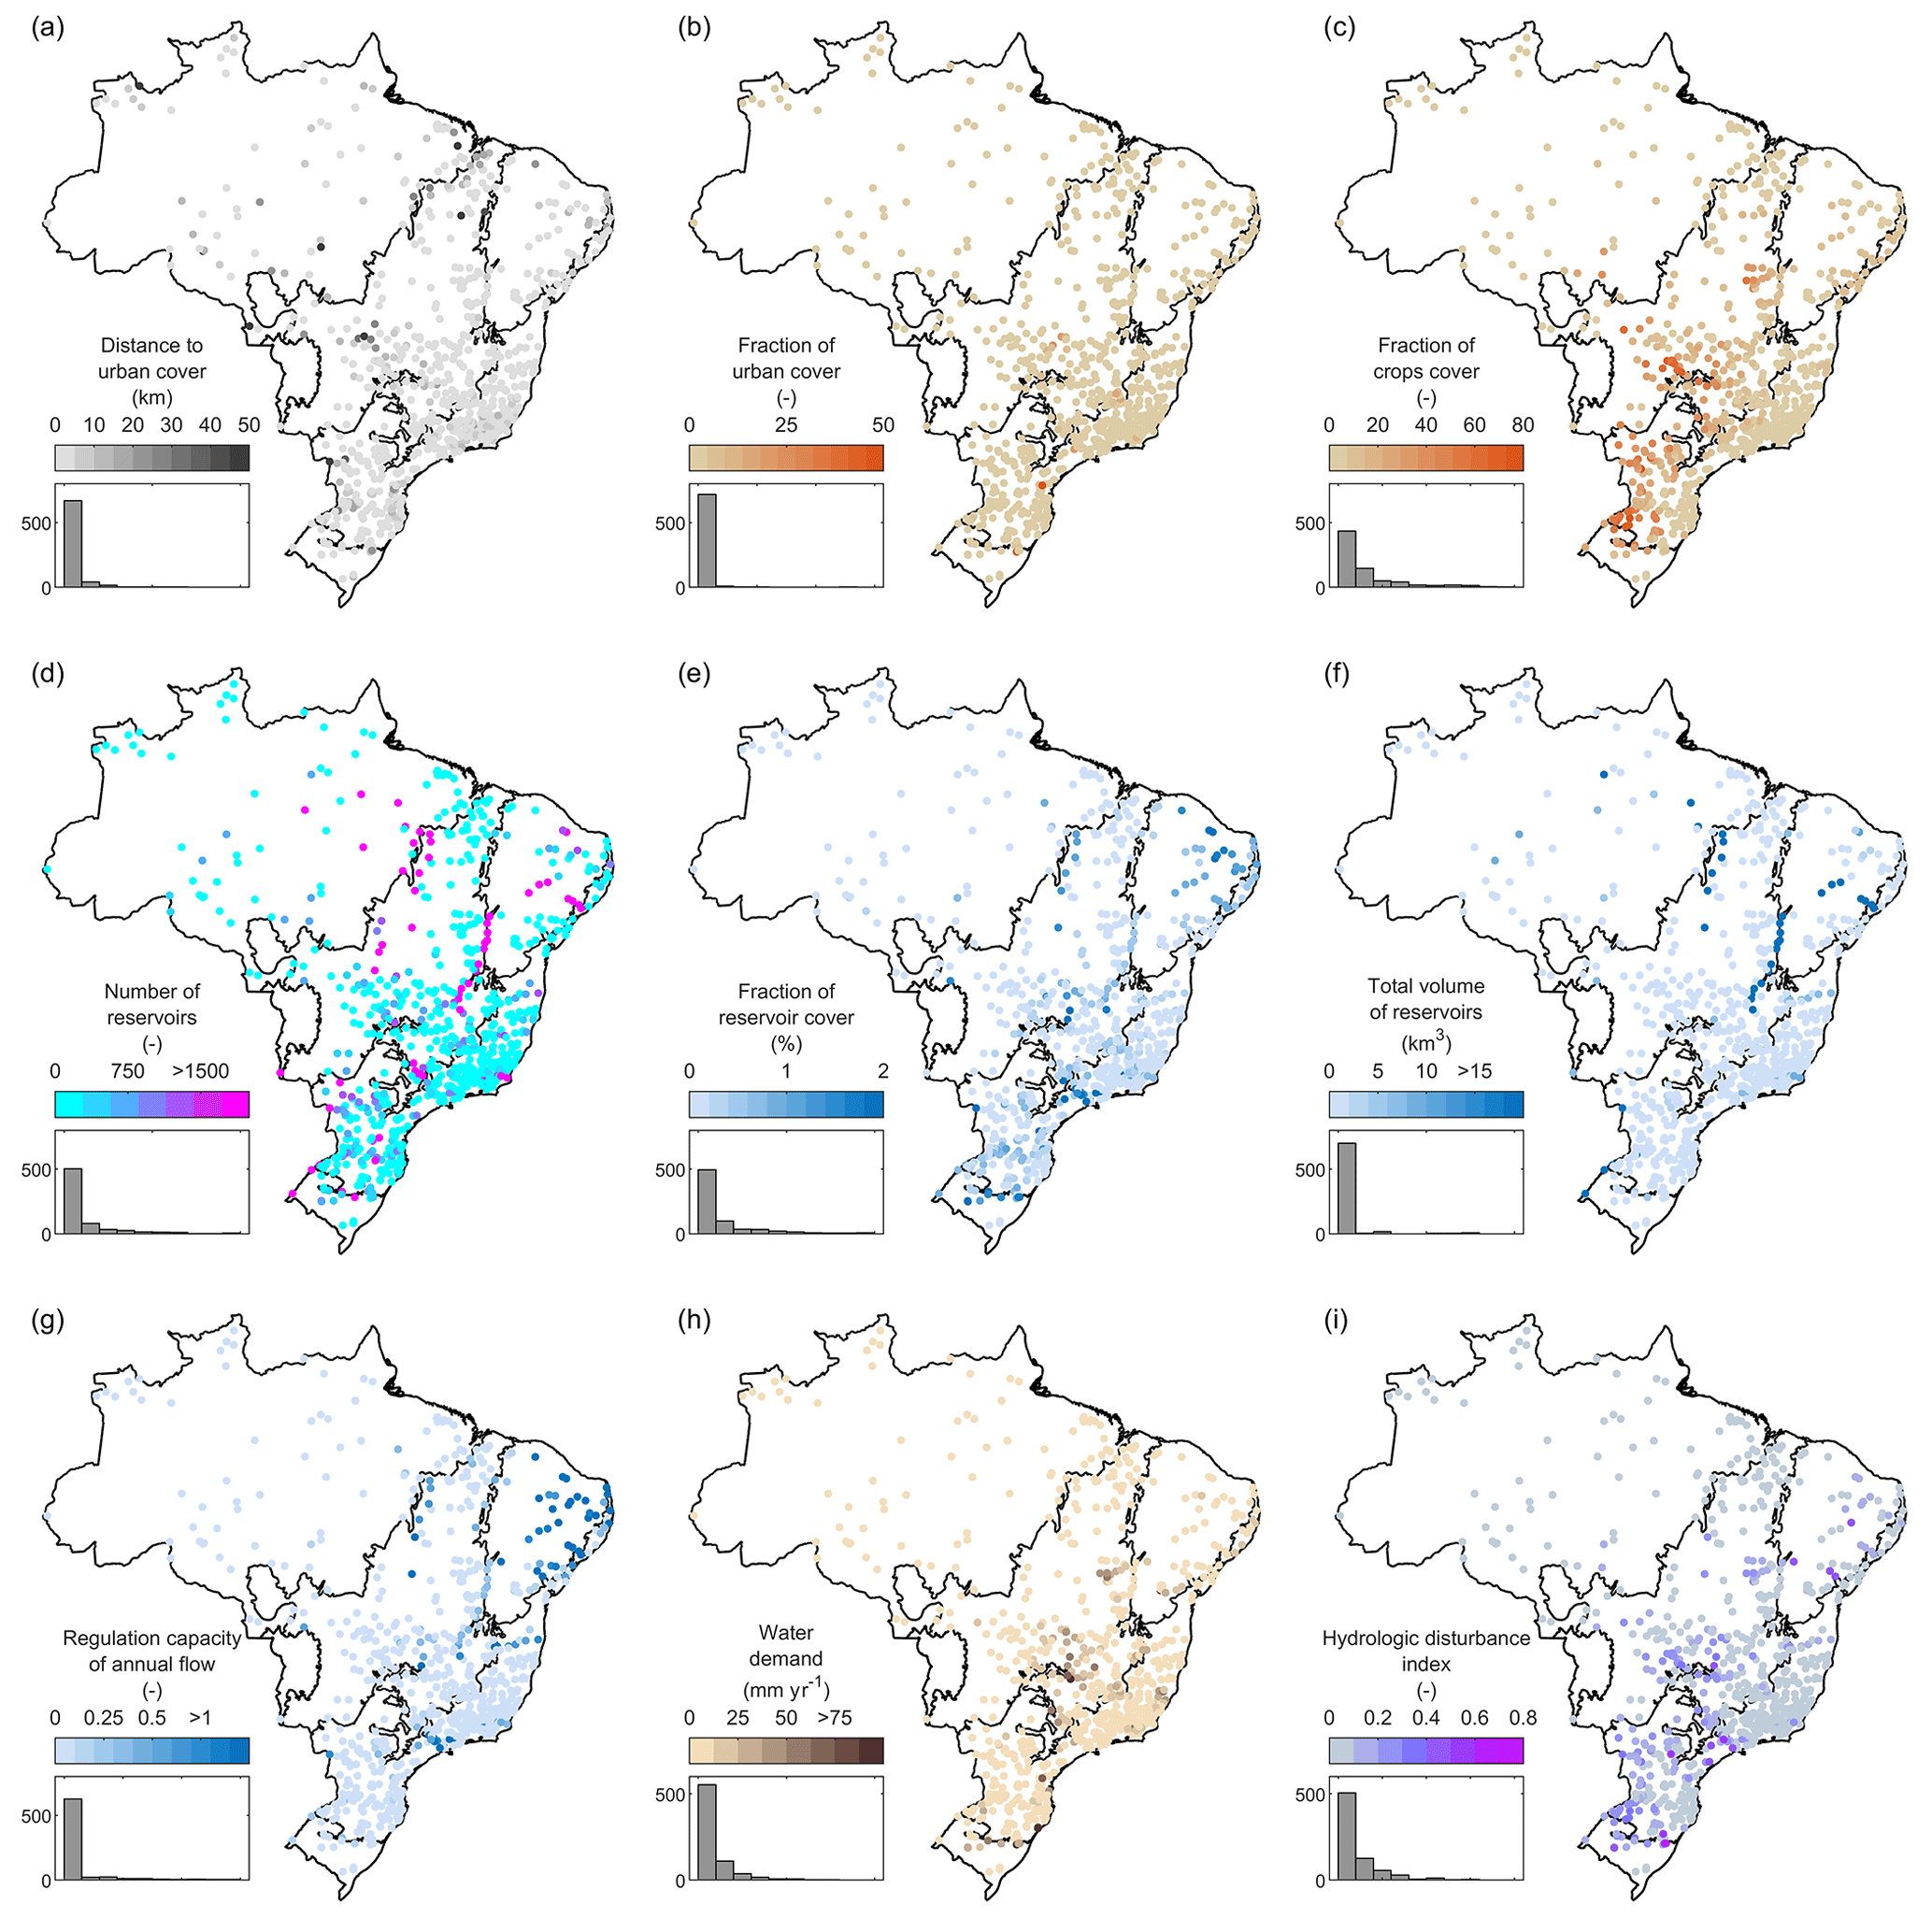
Figure 13Spatial distribution of the hydrologic disturbance attributes of CABra catchments. (a) Distance from urban cover to the streamflow gauge (in km); (b) urban fraction of land cover (in percent); (c) crops fraction of land cover (in percent); (d) the number of reservoirs in the catchment; (e) reservoir fraction of land cover (in percent); (f) the total volume of the reservoirs in the catchment (in km3); (g) the capacity of the reservoirs in the catchment to regulate the mean annual streamflow (dimensionless); (h) multi-purpose water demand in the catchment (in mm yr−1); (i) hydrologic disturbance index (HDI) of the catchment (dimensionless). The HDI is a weighted relationship between all the anthropogenic factors of the catchments.
2.9.2 Results and discussion
The results of the spatial distribution of the hydrological disturbance index and its components are shown in Fig. 13. Most CABra catchments are close to urban cover (it can be a large city or a small village), with a distance of up to 10 km. However, we also could find catchments with up to 100 km of distance to the urban cover. As seen in Fig. 13b and c, most CABra catchments present a fraction of urban cover of up to 10 %, with the highest values close to large cities, and a fraction of crop cover of up to 40 %, with the highest values in central and southern portions. As these factors present a high weight on the hydrological disturbance index, they are a good clue for the most disturbed catchments.
Results from the reservoirs in CABra catchments are shown in Fig. 13d–g. The number of reservoirs in the catchment ranges from zero to 48 404. Even though we found the largest number of reservoirs in a large catchment, this relationship is not linear. There are some catchments, especially in the São Francisco River basin, which present an extremely high number of reservoirs due to the low amounts of annual precipitation and intensive drought in the region. Moreover, catchments in the São Francisco River basin present the highest values of the total volume of reservoirs. These reservoirs are used for many anthropogenic purposes, such as hydroelectric power plants, irrigation, drinking water supply, fish farming, and recreation. These high values of the total volume of reservoirs, especially in the drier regions, could lead to a strong streamflow regulation, as seen in Fig. 13g. In most of the CABra catchments, reservoirs can regulate up to 25 % of the annual flow, but there are some cases in the Caatinga biome where the regulation capacity reaches up to 10 times the annual flow, making these catchments susceptible to non-natural events.
The water demand on CABra catchments ranges from zero (in Amazon) to 171 mm yr−1 (in Caatinga), and it is related to drinking water supply and irrigation of agricultural areas (Fig. 13h). The integrated analysis of the above-mentioned attributes is shown in Fig. 13i as the new hydrological disturbance index. Most of the CABra catchments present an index value of up to 0.2, indicating a low anthropic interference on water fluxes. Higher values, above 0.4, indicate catchments with some significant interference on water fluxes, which may be related to one or more terms of the equation. High values of the hydrological disturbance index in the central and southern portion of Brazil may be related to agriculture development, while in the southeastern part, they may be related to urbanization, and in the northeastern part, they may be related to the presence of numerous voluminous reservoirs. As expected, in the Amazon and mountainous areas of Atlantic Forest, low values were found. The creation of the hydrological disturbance index can be especially useful for the users of the CABra dataset, allowing them to quickly view the general state of the anthropogenic interferences on water fluxes, which is an important consideration in a wide range of studies.
The random forest regressor algorithm (Fig. 14) showed us the most relevant hydrological signatures captured by the hydrologic disturbance index. About 25 % of the variance of the HDI is explained by the half-flow day and the streamflow elasticity, which are two signatures extremely sensitive to streamflow regulation and to the generation of runoff in the catchment. Our results show us that the index is capable of capturing what it was intended to: catchments with higher values present a large number or high regulation capacity of reservoirs or a great percentage of non-natural areas. Medium values present some level of non-natural areas (pasture or crops), but there is not a high hydrological disturbance. Finally, lower values of HDI indicate minimally human-impacted catchments.
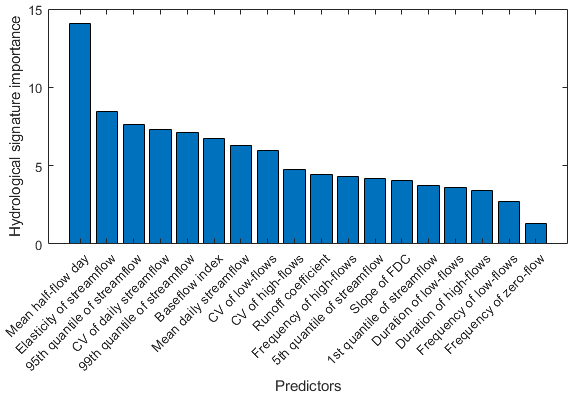
Figure 14Hydrological signatures as predictors of the hydrologic disturbance index. The random forest regressor algorithm assesses how much each signature increases the error of an HDI prediction when randomly sorted. The higher the deviation caused by a predictor, the higher the influence of the hydrological signature on the HDI.
2.9.3 Uncertainty and limitations
Uncertainties in hydrological disturbance are mainly related to the components of the index. As mentioned before, there is a limitation of use in the land-cover maps for small villages, urban areas, fragmented areas, and transitional areas of croplands, due to the spatial resolution of the land-cover maps. Because of this, small areas of urban fraction (UC), and consequently the distance to the urban area (UD), and crop area (CRC) might be undetected and this fraction of the index – representing 40 % – disconsidered or underestimated. Another 50 % of the HDI is derived from reservoir data, from the ANA database. Although the reservoir data have been extensively improved through the years, there are still uncertainties related to the many sources of them. Different sources do not use the same satellite products or methodology to identify and catalog the reservoirs. Additionally, the latest inclusions of reservoirs were automatically made, and there was no quality check of these data. Due to the crucial importance of reservoirs to the HDI, unrealistic number, areas, and volumes of reservoirs can lead to unrealistic values of the index. The last component considered here is the water demand (WD), which is an area-averaged estimation that accounts for both consumptive and non-consumptive water abstraction, possible leading to higher values than real abstraction. Even though it represents 10 % of the HDI composition, it should be taken into account in post-processing.
The CABra and the CAMELS-BR (Chagas et al., 2020) both contain large samples of hydroclimatic, landscape, and other attributes for Brazilian catchments. Their striking similarities in concept and goals highlight nothing but the urgent need for the creation of such a database for Brazilian catchments. However, it is important to notice that multiple differences between both datasets exist, as we will discuss below.
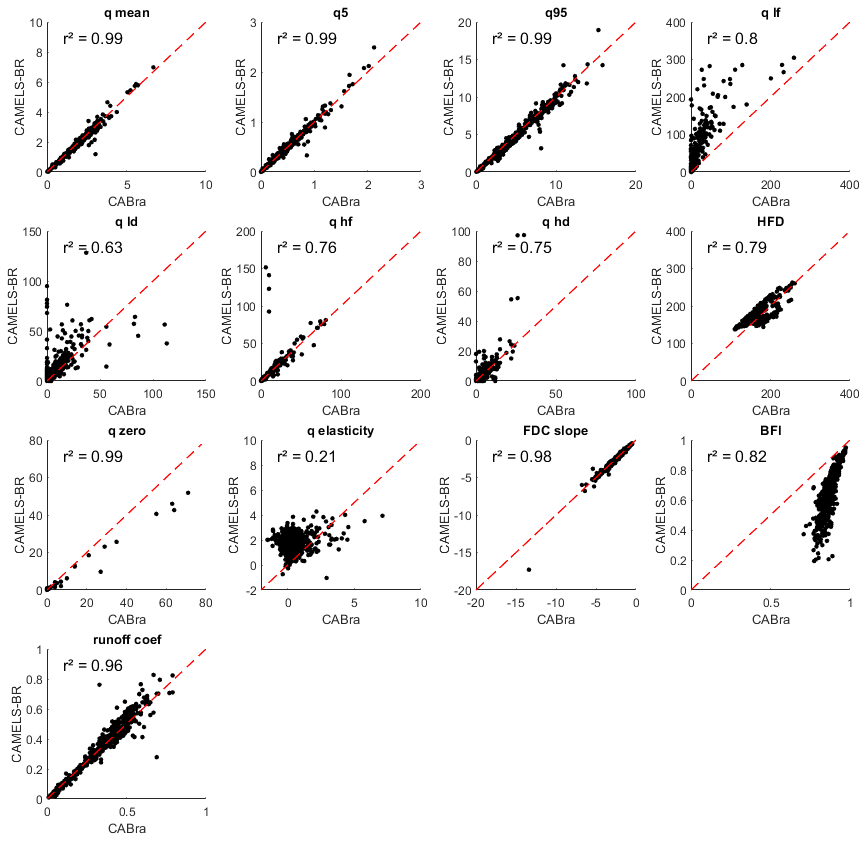
Figure 15Scatter plots and correlation coefficients between hydrological signatures of CABra and CAMELS-BR catchments. There were 607 catchments and 13 hydrological signatures that overlapped in both datasets.
The first main difference between CABra and CAMELS-BR is related to the catchment delineation procedures adopted. CAMELS-BR uses the basin masks from the GSIM (Do et al., 2018) product, where a 500 m digital elevation model was used for the delineation of catchment boundaries and extraction of topographic indices. GSIM has a quality filter allowing for up to 50 % of error in the catchment area when compared with ANA's value, as described in Do et al. (2018). As previously explained, the CABra catchment boundaries (delineated using streamflow gauge location from ANA) uses a high-definition (90 m) elevation product. We have manually inspected each of the 735 catchments to minimize further errors, correcting the geographic position of the outlet to coincide with the stream network, achieving a mean error of 2 % against ANA's areas. It is important to highlight that a suitable watershed delineation is of paramount importance for catchment hydrology studies because errors in these processes are further propagated for all computed attributes dependent on area and location. In addition, we provide the drainage network or CABra catchments.
Related to the daily streamflow data, in the CABra dataset we have retained catchments with less than 10 % missing streamflow records over 30 hydrologic years (1980–2010), which resulted in the final selection of 735 catchments. On the other hand, CAMELS-BR contains 897 catchments with less than 5 % missing data, while considering 20 hydrologic years (1990–2009). Additionally, CAMELS-BR also provides longer time series when available for the gauge. Our choice for a longer time series was predicated on the commonly adopted rationale which assumes 30 years as the basis for establishing long-term climatology as well as hydrologic indices (Huntingford et al., 2014; Tetzlaff et al., 2017), which we in turn believe will lead to better characterization of hydrological and climatological processes taking place. A correlation test between hydrological signatures of 607 overlapping catchments in CABra and CAMELS-BR datasets is shown in Fig. 15. The signatures based only on daily streamflow values, such as daily mean streamflow (q_mean) and 5th and 95th quantiles of daily streamflow (q_5 and q_95), are quite similar between CABra and CAMELS-BR, showing that both periods of analysis were capable of capturing the streamflow patterns of the catchments. When comparing signatures related to frequency and duration of low- and high-streamflow events, we can note little variation but still good agreement between datasets. In this case, the distinct period for hydrological signature calculation (1980–2010 in CABra and 1990–2009 in CAMELS-BR) might be the cause of deviations. The slope of the flow duration curve and the runoff coefficient are in a very good agreement (r2>0.95), demonstrating that both datasets are using precipitation products with good reliability. The streamflow elasticity and baseflow index have presented notable differences between CABra and CAMELS-BR. This might be due to the different components adopted in the equations of Woods (2009) and Ladson et al. (2013), which were implemented for elasticity and baseflow index calculations.
Another important difference between both datasets is related to the choice of databases used for providing the daily meteorological time series and estimating the related indices. While CAMELS-BR uses three widely used gridded datasets (based on remote sensing/reanalysis/gauge blends of rainfall), i.e., the CHIRPS v2.0, CPC, and MSWEP v2.2, the first one being chosen for the climatic indices (because of its spatial resolution of ), the CABra uses the Xavier et al. (2016) dataset and the ERA5 reanalysis. The Xavier et al. (2016) dataset was produced based on observations from 3625 rain gauges and 735 wheatear stations in the Brazilian territory and is extensively used as the ground-truth reference for the validation of precipitation products, including the CHIRPS, MSWEP, and the soil moisture satellite-corrected estimates (SM2RAIN; Brocca et al., 2014; Paredes-Trejo et al., 2018), the Global Precipitation Measurement (GPM; Hou et al., 2014); Gadelha et al., 2019), and the Tropical Rainfall Measuring Mission (TRMM; Huffman et al., 2007; Melo et al., 2015). Other uses of this dataset include the evaluation of precipitation from downscaled global circulation models (Almagro et al., 2020), as well as other meteorological variables used in regional studies (Battisti et al., 2019; Bender and Sentelhas, 2018; Monteiro et al., 2018), aside from being widely used for hydrological studies (Almagro et al., 2017; Avila-Diaz et al., 2020; Lima and AghaKouchak, 2017; Souza et al., 2016). The main limitation of Xavier's dataset it that it only covers Brazil.
Additional differences belonging to the meteorological time series section are also worth noting. CAMELS-BR provides the model-based PET estimates extracted from the GLEAM product (Martens et al., 2017), while daily temperatures (maximum, minimum, and average) are the only PET-related variable provided in a daily time series format. The CABra dataset provides the computed PET following three widely used methods, along with all necessary variables for its computation, such as solar radiation, wind speed, temperature, and relative humidity. Our choice for the computation of PET instead of using model-based estimates should allow for more transparency and reproducibility of results obtained using our dataset. Also, the choice of providing a wider range of meteorological variables allows the user to estimate PET based on different methods while enhancing the reach of our dataset for studies that might benefit from additional meteorological variables.
While the soil and geology attributes of both CABra and CAMELS-BR are derived from the same data sources, (i.e., the SoilGrids250, the GLiM, and the GLHYMPS v2.0), CABra provides the following additional variables not available in CAMELS-BR: saturated permeability (saturated hydraulic conductivity for geology attribute), soil type, textural class, and soil bulk density – which can be used to estimate soil porosity. Regarding groundwater attributes, CABra contains the rock type and name of the aquifer and water table depths from Fan et al. (2013) and the HAND estimates, while CAMELS-BR only contains the water table depth estimates from Fan et al. (2013).
In terms of land-cover attributes, CABra and CAMELS-BR present similar attributes, but the data source is different. CABra adopted a product with a higher spatial resolution (100 m against 300 m) and more recent observation (2015 against 2009) than in CAMELS-BR. Due to this better spatial resolution. we chose to use the most recent land cover, even though it is outside of the time span of hydrologic time series. CABra also brings information about the seasonal vegetation biomass of the catchment, in terms of NDVI, which is not present in CAMELS-BR.
Finally, both datasets take into account the human influence within each catchment, which is essential to a holistic understanding of the catchment behavior due to anthropogenic interactions and a lack of most of the large-sample datasets (Addor et al., 2020). CAMELS-BR presents data about water use, the volume of reservoirs, and the degree of regulation of the reservoirs. However, there is no combination or integration of these attributes in a specific index or approach. On the other hand, CABra presents eight attributes, i.e., distance to urbanization, the fraction of non-natural land cover (crops and urban areas), water demand, reservoirs' count, area, volume, and streamflow regulation capacity (the last two are also found in CAMELS-BR), which can affect the hydrologic behavior of the catchment in terms of water quantity, quality and regulation. Additionally, we developed a new hydrologic disturbance index (HDI), which considers all of these above-mentioned eight attributes. The HDI is a quantitative index of the level of anthropization that is reproducible and practical to identify a more or less human-impacted catchment.
In this study, we have collected, synthesized, organized, and made available more than 100 topography, climate, streamflow, groundwater, soil, geology, land use and land cover, and hydrologic disturbance attributes for 735 catchments in Brazil. To do so, we have used several sources, such as observed time series, observed and modeled gridded data, remote sensing data, and reanalysis data. Moreover, we have calculated some attributes for providing more accurate data than those available in the literature, including potential evapotranspiration, and for providing data that have not existed until now, such as the hydrological disturbance index. As this dataset deals with catchment-scale averaged attributes, we have paid particular attention to DEM resolution and catchment delineation while also manually inspecting each of the CABra catchments.
The development of the CABra dataset opens up several opportunities to test and develop a hypothesis in a unique environment like Brazil, with its vast and rich diversity in hydrology and landscapes. Finding relationships between the catchments' attributes will enable hydrologists to identify the drivers of the water fluxes in the catchment. We hope our dataset will aid catchment classification efforts that will ultimately unravel the underlying dominant controls of Brazilian regional hydrology across space and time. At the same time, the CABra dataset covers fundamentally different hydroclimatologic and ecologic regions than those covered by other similar large-sample datasets (United States, Great Britain, Chile, etc.) and so is a complement for global assessments and expands the possibility of the use of our dataset for multiple scientific areas, such as geology, agronomy, and ecohydrology.
We intend to expand the CABra dataset in the future. Information and attributes related to relevant fields of work, such as soil erosion, ecology, biology, and chemistry, as well as climate change projections, will be added to the CABra dataset in future update releases. Thus, CABra represents a robust multi-source data collection effort for Brazil and is intended to play a key role in advancing the scientific understanding of climate–landscape–hydrology interactions. As such, we hope it will guide large-sample hydrology investigations and pave the way for testing novel hypotheses by both the Brazilian and the international scientific community.
The datasets underlying the CABra dataset are available at https://doi.org/10.5281/zenodo.4070146 (Almagro et al., 2021a). We also developed a website with a user-friendly interface for easy access: https://thecabradataset.shinyapps.io/CABra/ (last access: 7 June 2021 (Almagro et al., 2021b).
AA, PTSO, AAMN, and PT conceived the ideas and designed the methodology for the study. AA collected, processed, and analyzed the data. AA, PTSO, and AAMN led the writing of the initial draft. TR and PT edited and reviewed the manuscript. All authors contributed and gave final approval for publication.
The contact author has declared that neither they nor their co-authors have any competing interests.
This study was supported by grants from the Ministry of Science, Technology, and Innovation – MCTI and National Council for Scientific and Technological Development – CNPq (grants nos. 441289/2017-7, 306830/2017-5, and 309752/2020-5). This study was also financed in part by the Coordenação de Aperfeiçoamento de Pessoal de Nível Superior – Brasil (CAPES) (Finance Code 001 and CAPES Print).
This research has been supported by the Ministry of Science, Technology and Innovation – MCTI and National Council for Scientific and Technological Development – CNPq (grant nos. 441289/2017-7 and 306830/2017-5), the Coordenação de Aperfeiçoamento de Pessoal de Nível Superior – Brasil (CAPES) (grant nos. Finance Code 001 and CAPES Print), and the Ministry of Science, Technology and Innovation – MCTI and National Council for Scientific and Technological Development – CNPq (grant no. 309752/2020-5).
This paper was edited by Alberto Guadagnini and reviewed by Pedro Luiz Borges Chaffe and one anonymous referee.
Abramowitz, G., Herger, N., Gutmann, E., Hammerling, D., Knutti, R., Leduc, M., Lorenz, R., Pincus, R., and Schmidt, G. A.: ESD Reviews: Model dependence in multi-model climate ensembles: weighting, sub-selection and out-of-sample testing, Earth Syst. Dynam., 10, 91–105, https://doi.org/10.5194/esd-10-91-2019, 2019.
Addor, N., Newman, A. J., Mizukami, N., and Clark, M. P.: The CAMELS data set: catchment attributes and meteorology for large-sample studies, Hydrol. Earth Syst. Sci., 21, 5293–5313, https://doi.org/10.5194/hess-21-5293-2017, 2017.
Addor, N., Do, H. X., Alvarez-Garreton, C., Coxon, G., Fowler, K., and Mendoza, P. A.: Large-sample hydrology: recent progress, guidelines for new datasets and grand challenges, Hydrolog. Sci. J., 65, 712–725, https://doi.org/10.1080/02626667.2019.1683182, 2020.
Ahrens, C. D.: Essentials of meteorology: an invitation to the atmosphere, 6th Edn., Brooks/Cole, Belmont, CA, p. 506, 2010.
Allen, R. G., Pereira, L. S., Raes, D., and Smith, M.: FAO Irrigation and Drainage Paper No. 56 – Crop Evapotranspiration, FAO, Rome, Italy, 1998.
Almagro, A., Oliveira, P. T. S., Nearing, M. A., and Hagemann, S.: Projected climate change impacts in rainfall erosivity over Brazil, Sci. Rep., 7, 1–12, https://doi.org/10.1038/s41598-017-08298-y, 2017.
Almagro, A., Oliveira, P. T. S., Rosolem, R., and Hagemann, S.: Performance evaluation of Eta/HadGEM2-ES and Eta/MIROC5 precipitation simulations over Brazil, Atmos. Res., 244, 105053, https://doi.org/10.1016/j.atmosres.2020.105053, 2020.
Almagro, A., Oliveira, P. T. S., Meira Neto, A. A., Roy, T., and Troch, P.: CABra: a novel large-sample dataset for Brazilian catchments (Version 4) [Data set], Zenodo, https://doi.org/10.5281/zenodo.4655204, 2021a.
Almagro, A., Oliveira, P. T. S., Meira Neto, A. A., Roy, T., and Troch, P.: CABra: a novel large-sample dataset for Brazilian catchments, available at: https://thecabradataset.shinyapps.io/CABra/, last access: 7 June 2021.
Althoff, D., Dias, S. H. B., Filgueiras, R., and Rodrigues, L. N.: ETo-Brazil: A Daily Gridded Reference Evapotranspiration Data Set for Brazil (2000–2018), Water Resour. Res., 56, e2020WR027562, https://doi.org/10.1029/2020WR027562, 2020.
ANA: Conjuntura dos recursos hídricos no Brasil 2019: informe anual, Agência Nacional de Águas, Brasília, 2019a.
ANA: Manual dos Usos Consuntivos de Água do Brasil, Brasília, 2019b.
ANA: Conjuntura dos recursos hídricos no Brasil 2020: informe anual, Brasília, available at: http://conjuntura.ana.gov.br/static/media/conjuntura-completo.23309814.pdf (last access: 17 July 2020), 2020a.
ANA: Technical Note N. 52/2020/SPR, Brasília, 2020b.
Ao, T., Ishidaira, H., Takeuchi, K., Kiem, A. S., Yoshitari, J., Fukami, K., and Magome, J.: Relating BTOPMC model parameters to physical features of MOPEX basins, J. Hydrol., 320, 84–102, https://doi.org/10.1016/j.jhydrol.2005.07.006, 2006.
Avila-Diaz, A., Benezoli, V., Justino, F., Torres, R., and Wilson, A.: Assessing current and future trends of climate extremes across Brazil based on reanalyses and earth system model projections, Clim. Dynam., 55, 1403–1426, https://doi.org/10.1007/s00382-020-05333-z, 2020.
Battisti, R., Bender, F. D., and Sentelhas, P. C.: Assessment of different gridded weather data for soybean yield simulations in Brazil, Theor. Appl. Climatol., 135, 237–247, https://doi.org/10.1007/s00704-018-2383-y, 2019.
Bellucci, A., Haarsma, R., Gualdi, S., Athanasiadis, P. J., Caian, M., Cassou, C., Fernandez, E., Germe, A., Jungclaus, J., Kröger, J., Matei, D., Müller, W., Pohlmann, H., Salas y Melia, D., Sanchez, E., Smith, D., Terray, L., Wyser, K., and Yang, S.: An assessment of a multi-model ensemble of decadal climate predictions, Clim. Dynam., 44, 2787–2806, https://doi.org/10.1007/s00382-014-2164-y, 2015.
Bender, F. D. and Sentelhas, P. C.: Solar radiation models and gridded databases to fill gaps in weather series and to project climate change in Brazil, Adv. Meteorol., 2018, 6204382, https://doi.org/10.1155/2018/6204382, 2018.
Berghuijs, W. R., Larsen, J. R., van Emmerik, T. H. M., and Woods, R. A.: A Global Assessment of Runoff Sensitivity to Changes in Precipitation, Potential Evaporation, and Other Factors, Water Resour. Res., 53, 8475–8486, https://doi.org/10.1002/2017WR021593, 2017.
Beven, K., Asadullah, A., Bates, P., Blyth, E., Chappell, N., Child, S., Cloke, H., Dadson, S., Everard, N., Fowler, H. J., Freer, J., Hannah, D. M., Heppell, K., Holden, J., Lamb, R., Lewis, H., Morgan, G., Parry, L., and Wagener, T.: Developing observational methods to drive future hydrological science: Can we make a start as a community?, Hydrol. Process., 34, 868–873, https://doi.org/10.1002/hyp.13622, 2020.
Boulton, A. J., Peterson, C. G., Grimm, N. B., and Fisher, S. G.: Stability of an aquatic macroinvertebrate community in a multiyear hydrologic disturbance regime, Ecology, 73, 2192–2207, https://doi.org/10.2307/1941467, 1992.
Brocca, L., Ciabatta, L., Massari, C., Moramarco, T., Hahn, S., Hasenauer, S., Kidd, R., Dorigo, W., Wagner, W., and Levizzani, V.: Soil as a natural rain gauge: Estimating global rainfall from satellite soil moisture data, J. Geophys. Res.-Atmos., 119, 5128–5141, https://doi.org/10.1002/2014JD021489, 2014.
Buchhorn, M., Smets, B., Bertels, L., Lesiv, M., Tsendbazar, N.-E., Herold, M., and Fritz, S.: Copernicus Global Land Service: Land Cover 100 m: epoch 2015: Globe, Zenodo, https://doi.org/10.5281/ZENODO.3243509, 2019.
Budyko, M. I.: Evaporation under natural conditions, IPST – Israel Program for Scientific Translations, Jerusalem, 1948.
Budyko, M. I.: Climate and Life, Elsevier, New York, 1974.
Chagas, V. B. P., Chaffe, P. L. B., Addor, N., Fan, F. M., Fleischmann, A. S., Paiva, R. C. D., and Siqueira, V. A.: CAMELS-BR: hydrometeorological time series and landscape attributes for 897 catchments in Brazil, Earth Syst. Sci. Data, 12, 2075–2096, https://doi.org/10.5194/essd-12-2075-2020, 2020.
Coleman, J. C., Miller, M. C., and Mink, F. L.: Hydrologic disturbance reduces biological integrity in urban streams, Environ. Monit. Assess., 172, 663–687, https://doi.org/10.1007/s10661-010-1363-1, 2011.
de Bacellar, L. A. P.: O papel das florestas no regime hidrológico de bacias hidrográficas, Geo.br, 1, 1–39, 2005.
Dexter, A. R.: Soil physical quality Part I. Theory, effects of soil texture, density, and organic matter, and effects on root growth, Geoderma, 120, 201–214, https://doi.org/10.1016/j.geoderma.2003.09.004, 2004.
Do, H. X., Gudmundsson, L., Leonard, M., and Westra, S.: The Global Streamflow Indices and Metadata Archive (GSIM) – Part 1: The production of a daily streamflow archive and metadata, Earth Syst. Sci. Data, 10, 765–785, https://doi.org/10.5194/essd-10-765-2018, 2018.
Donohue, R. J., Roderick, M. L., and McVicar, T. R.: On the importance of including vegetation dynamics in Budyko's hydrological model, Hydrol. Earth Syst. Sci., 11, 983–995, https://doi.org/10.5194/hess-11-983-2007, 2007.
Duan, Q., Schaake, J., Andréassian, V., Franks, S., Goteti, G., Gupta, H. V., Gusev, Y. M., Habets, F., Hall, a., Hay, L., Hogue, T., Huang, M., Leavesley, G., Liang, X., Nasonova, O. N., Noilhan, J., Oudin, L., Sorooshian, S., Wagener, T., and Wood, E. F.: Model Parameter Estimation Experiment (MOPEX): An overview of science strategy and major results from the second and third workshops, J. Hydrol., 320, 3–17, https://doi.org/10.1016/j.jhydrol.2005.07.031, 2006.
Eichinger, W. E., Parlange, M. B., and Stricker, H.: On the concept of equilibrium evaporation and the value of the Priestley–Taylor coefficient, Water Resour. Res., 32, 161–164, https://doi.org/10.1029/95WR02920, 1996.
EMBRAPA: Sistema brasileiro de classificação de solos, 5th Edn., Embrapa Solos, Brasília, p. 356, 2018.
Fan, Y., Li, H., and Miguez-Macho, G.: Global patterns of groundwater table depth, Science, 339, 940–943, https://doi.org/10.1126/science.1229881, 2013.
FAO: World reference base for soil resources 2014, International soil classification system for naming soils and creating legends for soil maps, Rome, Italy, 2014.
Forzieri, G., Alkama, R., Miralles, D. G., and Cescatti, A.: Response to Comment on “Satellites reveal contrasting responses of regional climate to the widespread greening of Earth”, Science, 360, 1180–1184, https://doi.org/10.1126/science.aap9664, 2018.
Gadelha, A. N., Coelho, V. H. R., Xavier, A. C., Barbosa, L. R., Melo, D. C. D., Xuan, Y., Huffman, G. J., Petersen, W. A., and das Almeida, C. N.: Grid box-level evaluation of IMERG over Brazil at various space and time scales, Atmos. Res., 218, 231–244, https://doi.org/10.1016/j.atmosres.2018.12.001, 2019.
Gibbs, H. K., Ruesch, A. S., Achard, F., Clayton, M. K., Holmgren, P., Ramankutty, N., and Foley, J. A.: Tropical forests were the primary sources of new agricultural land in the 1980s and 1990s, P. Natl. Acad. Sci. USA, 107, 16732–16737, https://doi.org/10.1073/PNAS.0910275107, 2010.
Gibbs, H. K., Rausch, L., Munger, J., Schelly, I., Morton, D. C., Noojipady, P., Barreto, P., Micol, L., Walker, N. F., Gibbs, B. H. K., Rausch, L., Munger, J., Schelly, I., Morton, D. C., Noojipady, P., Barreto, P., Micol, L., Walker, N. F., Amazon, B., and Cerrado, E.: Brazil's Soy Moratorium, Sci. - Policy Forum Environ. Dev., 347, 377–378, https://doi.org/10.1126/science.aaa0181, 2014.
Gleeson, T., Moosdorf, N., Hartmann, J., and van Beek, L. P. H.: A glimpse beneath earth's surface: GLobal HYdrogeology MaPS (GLHYMPS) of permeability and porosity, Geophys. Res. Lett., 41, 3891–3898, https://doi.org/10.1002/2014GL059856, 2014.
Grant, S. A.: Hydraulic Properties, Temperature Effects, Encycl. Soils Environ., 4, 207–211, https://doi.org/10.1016/B0-12-348530-4/00379-9, 2005.
Groenendyk, D. G., Ferré, T. P. A., Thorp, K. R., and Rice, A. K.: Hydrologic-process-based soil texture classifications for improved visualization of landscape function, PLoS One, 10, 1–17, https://doi.org/10.1371/journal.pone.0131299, 2015.
Guo, X., Zhang, H., Kang, L., Du, J., Li, W., and Zhu, Y.: Quality control and flux gap filling strategy for Bowen ratio method: Revisiting the Priestley–Taylor evaporation model, Environ. Fluid Mech., 7, 421–437, https://doi.org/10.1007/s10652-007-9033-8, 2007.
Gupta, H. V., Perrin, C., Blöschl, G., Montanari, A., Kumar, R., Clark, M., and Andréassian, V.: Large-sample hydrology: A need to balance depth with breadth, Hydrol. Earth Syst. Sci., 18, 463–477, https://doi.org/10.5194/hess-18-463-2014, 2014.
Hargreaves, G. H.: Moisture Availability and Crop Production, T. ASAE, 18, 0980–0984, https://doi.org/10.13031/2013.36722, 1975.
Hargreaves, G. H. and Allen, R. G.: History and evaluation of Hargreaves evapotranspiration equation, J. Irrig. Drain. Eng., 129, 53–63, https://doi.org/10.1061/(ASCE)0733-9437(2004)130:5(447.2), 2003.
Hartmann, J. and Moosdorf, N.: The new global lithological map database GLiM: A representation of rock properties at the Earth surface, Geochem. Geoph. Geosy., 13, 1–37, https://doi.org/10.1029/2012GC004370, 2012.
Hengl, T., De Jesus, J. M., Heuvelink, G. B. M., Gonzalez, M. R., Kilibarda, M., Blagotić, A., Shangguan, W., Wright, M. N., Geng, X., Bauer-Marschallinger, B., Guevara, M. A., Vargas, R., MacMillan, R. A., Batjes, N. H., Leenaars, J. G. B., Ribeiro, E., Wheeler, I., Mantel, S., and Kempen, B.: SoilGrids250m: Global gridded soil information based on machine learning, PLoS One, 12, e0169748, https://doi.org/10.1371/journal.pone.0169748, 2017.
Hersbach, H., Bell, B., Berrisford, P., Hirahara, S., Horányi, A., Muñoz-Sabater, J., Nicolas, J., Peubey, C., Radu, R., Schepers, D., Simmons, A., Soci, C., Abdalla, S., Abellan, X., Balsamo, G., Bechtold, P., Biavati, G., Bidlot, J., Bonavita, M., De Chiara, G., Dahlgren, P., Dee, D., Diamantakis, M., Dragani, R., Flemming, J., Forbes, R., Fuentes, M., Geer, A., Haimberger, L., Healy, S., Hogan, R. J., Hólm, E., Janisková, M., Keeley, S., Laloyaux, P., Lopez, P., Lupu, C., Radnoti, G., de Rosnay, P., Rozum, I., Vamborg, F., Villaume, S., and Thépaut, J. N.: The ERA5 global reanalysis, Q. J. Roy. Meteorol. Soc., 146, 1999–2049, https://doi.org/10.1002/qj.3803, 2020.
Hou, A. Y., Kakar, R. K., Neeck, S., Azarbarzin, A. A., Kummerow, C. D., Kojima, M., Oki, R., Nakamura, K., and Iguchi, T.: The global precipitation measurement mission, B. Am. Meteorol. Soc., 95, 701–722, https://doi.org/10.1175/BAMS-D-13-00164.1, 2014.
Huffman, G. J., Adler, R. F., Bolvin, D. T., Gu, G., Nelkin, E. J., Bowman, K. P., Hong, Y., Stocker, E. F., and Wolff, D. B.: The TRMM Multisatellite Precipitation Analysis (TMPA): Quasi-global, multiyear, combined-sensor precipitation estimates at fine scales, J. Hydrometeorol., 8, 38–55, https://doi.org/10.1175/JHM560.1, 2007.
Huntingford, C., Marsh, T., Scaife, A. A., Kendon, E. J., Hannaford, J., Kay, A. L., Lockwood, M., Prudhomme, C., Reynard, N. S., Parry, S., Lowe, J. A., Screen, J. A., Ward, H. C., Roberts, M., Stott, P. A., Bell, V. A., Bailey, M., Jenkins, A., Legg, T., Otto, F. E. L., Massey, N., Schaller, N., Slingo, J., and Allen, M. R.: Potential influences on the United Kingdom's floods of winter 2013/14, Nat. Clim. Change, 4, 769–777, https://doi.org/10.1038/nclimate2314, 2014.
Kousky, V. E., Kagano, M. T., and Cavalcanti, I. F. a: A review of the Southern Oscillation: oceanic-atmospheric circulation changes and related rainfall anomalies, Tellus A, 36, 490–504, https://doi.org/10.1111/j.1600-0870.1984.tb00264.x, 1984.
Ladson, A. R., Brown, R., Neal, B., and Nathan, R.: A standard approach to baseflow separation using the Lyne and Hollick filter, Aust. J. Water Resour., 17, 25–34, https://doi.org/10.7158/W12-028.2013.17.1, 2013.
Lanza, R.: Hidrologia comparativa e perda de solo e água em bacias hidrográficas cultivadas com eucalipto e campo nativo com pastagem manejada, MS Thesis, Santa Maria, 150 pp., 2015.
Lima, C. H. R. and AghaKouchak, A.: Droughts in Amazonia: Spatiotemporal Variability, Teleconnections, and Seasonal Predictions, Water Resour. Res., 53, 10824–10840, https://doi.org/10.1002/2016WR020086, 2017.
Lo, M. H., Famiglietti, J. S., Yeh, P. J. F., and Syed, T. H.: Improving parameter estimation and water table depth simulation in a land surface model using GRACE water storage and estimated base flow data, Water Resour. Res., 46, 1–15, https://doi.org/10.1029/2009WR007855, 2010.
Lyne, V. and Hollick, M.: Stochastic Time-Variable Rainfall-Runoff Modeling, in: Hydrology and Water Resources Symposium, Institution of Engineers National Conference Publication, Perth, 89–92, 1979.
Lyon, S. W. and Troch, P. A.: Development and application of a catchment similarity index for subsurface flow, Water Resour. Res., 46, 1–13, https://doi.org/10.1029/2009WR008500, 2010.
Maes, W. H., Gentine, P., Verhoest, N. E. C., and Miralles, D. G.: Potential evaporation at eddy-covariance sites across the globe, Hydrol. Earth Syst. Sci., 23, 925–948, https://doi.org/10.5194/hess-23-925-2019, 2019.
Maidment, D. R.: Arc Hydro: GIS for Water Resources, ESRI, Inc., Redlands, CA, 203 pp., 2002.
Martens, B., Miralles, D. G., Lievens, H., Van Der Schalie, R., De Jeu, R. A. M., Fernández-Prieto, D., Beck, H. E., Dorigo, W. A., and Verhoest, N. E. C.: GLEAM v3: Satellite-based land evaporation and root-zone soil moisture, Geosci. Model Dev., 10, 1903–1925, https://doi.org/10.5194/gmd-10-1903-2017, 2017.
McMahon, T. A., Peel, M. C., Lowe, L., Srikanthan, R., and McVicar, T. R.: Estimating actual, potential, reference crop and pan evaporation using standard meteorological data: A pragmatic synthesis, Hydrol. Earth Syst. Sci., 17, 1331–1363, https://doi.org/10.5194/hess-17-1331-2013, 2013.
Meira Neto, A. A., Roy, T., de Oliveira, P. T. S., and Troch, P. A.: An Aridity Index-Based Formulation of Streamflow Components, Water Resour. Res., 56, 1–14, https://doi.org/10.1029/2020WR027123, 2020.
Melo, D. D. C. D., Xavier, A. C., Bianchi, T., Oliveira, P. T. S., Scanlon, B. R., Lucas, M. C., and Wendland, E.: Performance evaluation of rainfall estimates by TRMM Multi-satellite Precipitation Analysis 3B42V6 and V7 over Brazil, J. Geophys. Res.-Atmos., 120, 9426–9436, https://doi.org/10.1002/2015JD023797, 2015.
Monteiro, L. A., Sentelhas, P. C., and Pedra, G. U.: Assessment of NASA/POWER satellite-based weather system for Brazilian conditions and its impact on sugarcane yield simulation, Int. J. Climatol., 38, 1571–1581, https://doi.org/10.1002/joc.5282, 2018.
Mukherjee, S., Joshi, P. K., Mukherjee, S., Ghosh, A., Garg, R. D., and Mukhopadhyay, A.: Evaluation of vertical accuracy of open source Digital Elevation Model (DEM), Int. J. Appl. Earth Obs. Geoinf., 21, 205–217, https://doi.org/10.1016/j.jag.2012.09.004, 2012.
Nepstad, D. C., Carvalho, C. R. De, Davidson, E. A., Jipp, P. H., Lefebvre, P. A., Negrelros, G. H., Sllva, E. D., Stone, T. A., Trumbore, S. E., and Vieira, S.: The role of deep roots in the hydrological and carbon cycles of Amazonian forests and pastures, Nature, 372, 666–669, 1994.
Newman, A. J., Clark, M. P., Craig, J., Nijssen, B., Wood, A., Gutmann, E., Mizukami, N., Brekke, L., and Arnold, J. R.: Gridded ensemble precipitation and temperature estimates for the contiguous United States, J. Hydrometeorol., 16, 2481–2500, https://doi.org/10.1175/JHM-D-15-0026.1, 2015.
Nobre, A. D., Cuartas, L. A., Hodnett, M., Rennó, C. D., Rodrigues, G., Silveira, A., Waterloo, M., and Saleska, S.: Height Above the Nearest Drainage – a hydrologically relevant new terrain model, J. Hydrol., 404, 13–29, https://doi.org/10.1016/j.jhydrol.2011.03.051, 2011.
Oliveira, P. T. S., Almagro, A., Pitaluga, F., Meira Neto, A. A., Durcik, M., and Troch, P. A.: CABra: a novel large-scale dataset for Brazilian catchments, in: EGU General Assembly, Vienna, 4–8 May 2020, https://doi.org/10.5194/egusphere-egu2020-12138, 2020.
Paredes-Trejo, F., Barbosa, H. A., and Spatafora, L. R.: Assessment of SM2RAIN-derived and state-of-the-art satellite rainfall products over Northeastern Brazil, Remote Sens., 10, 1093, https://doi.org/10.3390/rs10071093, 2018.
Pires, G. F., Abrahão, G. M., Brumatti, L. M., Oliveira, L. J. C., Costa, M. H., Liddicoat, S., Kato, E., and Ladle, R. J.: Increased climate risk in Brazilian double cropping agriculture systems: Implications for land use in Northern Brazil, Agr. Forest Meteorol., 228–229, 286–298, https://doi.org/10.1016/j.agrformet.2016.07.005, 2016.
Priestley, C. H. B. and Taylor, R. J.: On the Assessment of Surface Heat Flux and Evaporation Using Large-Scale Parameters, Mon. Weather Rev., 100, 81–92, https://doi.org/10.1175/1520-0493(1972)100<0081:otaosh>2.3.co;2, 1972.
Ren, H., Hou, Z., Huang, M., Bao, J., Sun, Y., Tesfa, T., and Ruby Leung, L.: Classification of hydrological parameter sensitivity and evaluation of parameter transferability across 431 US MOPEX basins, J. Hydrol., 536, 92–108, https://doi.org/10.1016/j.jhydrol.2016.02.042, 2016.
Roderick, M. L., Sun, F., Lim, W. H., and Farquhar, G. D.: A general framework for understanding the response of the water cycle to global warming over land and ocean, Hydrol. Earth Syst. Sci., 18, 1575–1589, https://doi.org/10.5194/hess-18-1575-2014, 2014.
Rodrigues, D. B. B., Gupta, H. V., Serrat-Capdevila, A., Oliveira, P. T. S., Mario Mendiondo, E., Maddock, T., and Mahmoud, M.: Contrasting American and Brazilian systems for water allocation and transfers, J. Water Resour. Plan. Manage., 141, 1–11, https://doi.org/10.1061/(ASCE)WR.1943-5452.0000483, 2015.
Salemi, L. F., Groppo, J. D., Trevisan, R., Seghesi, G. B., Moraes, J. M., Ferraz, S. F. B., and Martinelli, L. A.: Consequências hidrológicas da mudança de uso da terra de floresta para pastagem na região da floresta tropical pluvial Atlântica, Ambient. e Agua – An Interdiscip. J. Appl. Sci., 7, 127–140, https://doi.org/10.4136/ambi-agua.927, 2012.
Sankarasubramanian, A., Vogel, R. M., and Limbrunner, J. F.: Climate elasticity of streamflow in the United States, Water Resour. Res., 37, 1771–1781, https://doi.org/10.1029/2000WR900330, 2001.
Santos, H. G., Carvalho Júnior, W., Dart, R. O., Áglio, M. L. D., Sousa, J. S., Pares, J. G., Fontana, A., Martins, A. L. S., and Oliveira, A. P. O.: O novo mapa de solos do Brasil: legenda atualizada, Embrapa Solos, availableat: https://www.embrapa.br/busca-de-publicacoes/-/publicacao/920267/o-novo-mapa-de-solos-do-brasil-legenda-atualizada (last access: 15 March 2020), 2011.
Sawicz, K., Wagener, T., Sivapalan, M., Troch, P. A., and Carrillo, G.: Catchment classification: empirical analysis of hydrologic similarity based on catchment function in the eastern USA, Hydrol. Earth Syst. Sci., 15, 2895–2911, https://doi.org/10.5194/hess-15-2895-2011, 2011.
Saxton, K. E. and Rawls, W. J.: Soil Water Characteristic Estimates by Texture and Organic Matter for Hydrologic Solutions, Soil Sci. Soc. Am. J., 70, 1569–1578, https://doi.org/10.2136/sssaj2005.0117, 2006.
Saxton, K. E., Rawls, W. J., Romberger, J. S., and Papendick, R. I.: Estimating Generalized Soil-water Characteristics from Texture, Soil Sci. Soc. Am. J., 50, 1031–1036, https://doi.org/10.2136/sssaj1986.03615995005000040039x, 1986.
Schaake, J., Cong, S., and Duan, Q.: The US mopex data set, IAHS-AISH Publ., 307, 9–28, 2006.
Schulzweida, U.: CDO User guide (1.9.6), 2015, Zenodo, https://doi.org/10.5281/zenodo.2558193, 2019.
Schumacher, D. L., Keune, J., van Heerwaarden, C. C., Vilà-Guerau de Arellano, J., Teuling, A. J., and Miralles, D. G.: Amplification of mega-heatwaves through heat torrents fuelled by upwind drought, Nat. Geosci., 12, 712–717, https://doi.org/10.1038/s41561-019-0431-6, 2019.
Shirazi, M. A. and Boersma, L.: A Unifying Quantitative Analysis of Soil Texture, Soil Sci. Soc. Am. J., 48, 142–147, https://doi.org/10.2136/sssaj1984.03615995004800010026x, 1984.
Shuttleworth, W. J.: Evaporation, in: Handbook of Hydrology, edited by: Maidment, D. R., McGraw-Hill Education, New York, p. 824, 1996.
Solman, S. A., Sanchez, E., Samuelsson, P., da Rocha, R. P., Li, L., Marengo, J., Pessacg, N. L., Remedio, A. R. C., Chou, S. C., Berbery, H., Le Treut, H., de Castro, M., and Jacob, D.: Evaluation of an ensemble of regional climate model simulations over South America driven by the ERA-Interim reanalysis: Model performance and uncertainties, Clim. Dynam., 41, 1139–1157, https://doi.org/10.1007/s00382-013-1667-2, 2013.
Souza, R., Feng, X., Antonino, A., Montenegro, S., Souza, E., and Porporato, A.: Vegetation response to rainfall seasonality and interannual variability in tropical dry forests, Hydrol. Process., 30, 3583–3595, https://doi.org/10.1002/hyp.10953, 2016.
Spera, S. A., Galford, G. L., Coe, M. T., Macedo, M. N., and Mustard, J. F.: Land-use change affects water recycling in Brazil's last agricultural frontier, Global Change Biol., 22, 3405–3413, https://doi.org/10.1111/gcb.13298, 2016.
Strahler, A. N.: Hypsometric Area-Altitude Analysis of Erosional Topography, Bull. Geol. Soc. Am., 63, 1117–1142, https://doi.org/10.1130/0016-7606(1952)63[1117:HAAOET]2.0.CO;2, 1952.
Strahler, A. N.: Quantitative Analysis of Watershed Geomorphology, T. ASAE, 38, 913–920, 1957.
Tebaldi, C., Smith, R. L., Nychka, D., and Mearns, L. O.: Quantifying uncertainty in projections of regional climate change: A Bayesian approach to the analysis of multimodel ensembles, J. Climate, 18, 1524–1540, https://doi.org/10.1175/JCLI3363.1, 2005.
Tetzlaff, D., Carey, S. K., McNamara, J. P., Laudon, H., and Soulsby, C.: The essential value of long-term experimental data for hydrology and water management, Water Resour. Res., 53, 2598–2604, https://doi.org/10.1002/2017WR020838, 2017.
Tomkins, K. M.: Uncertainty in streamflow rating curves: Methods, controls and consequences, Hydrol. Process., 28, 464–481, https://doi.org/10.1002/hyp.9567, 2014.
Tucker, C. J.: Red and Photographic Infrared, near Combinations for Monitoring Vegetation, Remote Sens. Environ., 8, 127–150, 1979.
Twarakavi, N. K. C., Šimůnek, J., and Schaap, M. G.: Can texture-based classification optimally classify soils with respect to soil hydraulics?, Water Resour. Res., 46, W01501, https://doi.org/10.1029/2009WR007939, 2010.
UNEP and ANA: GEO Brazil Water Resources, ANA, Brasília, 2007.
Vaze, J., Teng, J., and Spencer, G.: Impact of DEM accuracy and resolution on topographic indices, Environ. Model. Softw., 25, 1086–1098, https://doi.org/10.1016/j.envsoft.2010.03.014, 2010.
Wagener, T., Sivapalan, M., Troch, P., and Woods, R.: Catchment Classification and Hydrologic Similarity, Geogr. Compass, 1, 901–931, 2007.
Wanders, N. and Wada, Y.: Human and climate impacts on the 21st century hydrological drought, J. Hydrol., 526, 208–220, https://doi.org/10.1016/j.jhydrol.2014.10.047, 2015.
Wechsler, S. P.: Uncertainties associated with digital elevation models for hydrologic applications: a review, Hydrol. Earth Syst. Sci., 11, 1481–1500, https://doi.org/10.5194/hess-11-1481-2007, 2007.
Westerberg, I. K. and McMillan, H. K.: Uncertainty in hydrological signatures, Hydrol. Earth Syst. Sci., 19, 3951–3968, https://doi.org/10.5194/hess-19-3951-2015, 2015.
Whited, D. C., Lorang, M. S., Harner, M. J., Hauer, F. R., Kimball, J. S., and Stanford, J. A.: Climate, hydrologic disturbance, and succession: Drivers of floodplain pattern, Ecology, 88, 940–953, https://doi.org/10.1890/05-1149, 2007.
WMO: Guide to the Global Observing System, Geneva, Switzerland, 2010.
Woods, R. A.: Analytical model of seasonal climate impacts on snow hydrology: Continuous snowpacks, Adv. Water Resour., 32, 1465–1481, https://doi.org/10.1016/j.advwatres.2009.06.011, 2009.
Xavier, A. C., King, C. W., and Scanlon, B. R.: Daily gridded meteorological variables in Brazil (1980–2013), Int. J. Climatol., 2659, 2644–2659, https://doi.org/10.1002/joc.4518, 2016.
Yadav, M., Wagener, T., and Gupta, H. V.: Regionalization of constraints on expected watershed response behavior for improved predictions in ungauged basins, Adv. Water Resour., 30, 1756–1774, https://doi.org/10.1016/j.advwatres.2007.01.005, 2007.
Yamazaki, D., Ikeshima, D., Tawatari, R., Yamaguchi, T., O'Loughlin, F., Neal, J. C., Sampson, C. C., Kanae, S., and Bates, P. D.: A high-accuracy map of global terrain elevations, Geophys. Res. Lett., 44, 5844–5853, https://doi.org/10.1002/2017GL072874, 2017.
Ye, B., Yang, D., and Kane, D. L.: Changes in Lena River streamflow hydrology: Human impacts versus natural variations, Water Resour. Res., 39, 1–14, https://doi.org/10.1029/2003WR001991, 2003.
Zandbergen, P. A.: Error propagation modeling for terrain analysis using dynamic simulation tools in ArcGIS Modelbuilder, in: Geomorphometry 2011, Redlands, California, USA, 57–60, 2011.
Zhang, R., Chen, X., Zhang, Z., and Shi, P.: Evolution of hydrological drought under the regulation of two reservoirs in the headwater basin of the Huaihe River, China, Stoch. Environ. Res. Risk A., 29, 487–499, https://doi.org/10.1007/s00477-014-0987-z, 2015.
Zhang, Y., Peña-Arancibia, J. L., McVicar, T. R., Chiew, F. H. S., Vaze, J., Liu, C., Lu, X., Zheng, H., Wang, Y., Liu, Y. Y., Miralles, D. G., and Pan, M.: Multi-decadal trends in global terrestrial evapotranspiration and its components, Sci. Rep., 6, 1–12, https://doi.org/10.1038/srep19124, 2016.
Zhao, G., Gao, H., Naz, B. S., Kao, S. C., and Voisin, N.: Integrating a reservoir regulation scheme into a spatially distributed hydrological model, Adv. Water Resour., 98, 16–31, https://doi.org/10.1016/j.advwatres.2016.10.014, 2016.
Zhou, Q. and Liu, X.: Analysis of errors of derived slope and aspect related to DEM data properties, Comput. Geosci., 30, 369–378, https://doi.org/10.1016/j.cageo.2003.07.005, 2004.