the Creative Commons Attribution 4.0 License.
the Creative Commons Attribution 4.0 License.
 | 20 May 2021
Causal effects of dams and land cover changes on flood changes in mainland China
Wencong Yang
Dawen Yang
Aizhong Hou
Quantifying the effects of human activities on floods is challenging because of limited knowledge and observations. Many previous methods fail to isolate different effects and reduce the uncertainty caused by small samples. We use panel regressions to derive the sensitivity of annual maximum discharges (Q) to the changing values of three human factors: urban areas, cropland areas, and reservoir indexes for large and medium dams. We also test whether the effects increase or decrease with increasing initial values of human factors. This method is applied in 757 non-nested catchments in China. Results show that a 1 % point increase in urban areas causes around a 3.9 % increase in Q with a confidence interval CI = [1.9 %, 5.7 %]. Cropland areas have no significant effect on Q. Reservoir index has a decreasing effect: a 1 unit increase in reservoir index causes a decrease in Q from 21.4 % (with CI = [11.4 %, 29.9 %]) to 6.2 % (with CI = [3.2 %, 9.1 %]) for catchments with initial reservoir indexes from 0 to 3. Among 61 catchments with significant increases in observed Q in 1992–2017, increasing urban areas cause more than 10 % increases in Q in only five (8.2 % of 61) catchments. Among 234 catchments with at least one dam and significant decreases in observed Q in 1960–2017, increasing reservoir indexes cause more than 10 % decreases in Q in 138 (59.8 % of 234) catchments. Among 1249 catchments with limited impacts from urban areas and reservoir indexes, 403 (32.3 %) catchments have significant decreases in Q during 1960–2017, and 46.7 % of the 403 catchments are located in the middle and downstream of the Yellow River Basin and the upper streams of the Hai He River Basin. This study extends the panel regression method in hydrology and sheds light on the attribution of flood changes on a national scale.
- Article
(6291 KB) - Full-text XML
- BibTeX
- EndNote


River flooding is one of the most severe disasters in the world. China has experienced tremendous damage from floods in the past decades with expanding urban areas, a booming economy, and increasing populations (Du et al., 2019; Kundzewicz et al., 2019). Sharply changing flood characteristics make flood risk management more difficult. According to a national investigation of flood peak changes in China conducted by Yang et al. (2019), abrupt changes due to human activities are the predominant mode of flood changes. Understanding how floods change in a changing environment will help flood risk management in the future. Therefore, a quantitative attribution of flood changes is urgent on a national scale for policy decisions.
To detect flood changes and pinpoint the underlying reasons, scientists need to answer the following questions: (1) does a factor affect floods and (2) if the effect is present, how strong is the effect? The drivers of flood changes can be classified into three categories: atmospheric factors, catchment factors, and river factors (Merz et al., 2012; Blöschl et al., 2015). Atmospheric factors refer to the meteorological forcing of water fluxes such as natural climate variability and anthropogenic climate change; catchment factors refer to the alternating physiographic characteristics of catchments, such as land cover changes; and river factors refer to hydraulic infrastructure that changes river morphology and flood routing, such as dams and channelization (Merz et al., 2012; Blöschl et al., 2015). Catchment and river factors are mainly attributed to human activities, which attract increasing attention in hydrological systems in the era of “socio-hydrology” (Di Baldassarre et al., 2019; Müller and Levy, 2019). However, quantifying human impacts on floods is challenging for the following reasons. Firstly, due to the highly unpredictable human behavior, we have limited knowledge to reproduce the process of how human activities affect floods (Pande and Sivapalan, 2017). For example, the expansion of cropland and urban areas not only casts deterministic effects on floods through changing soil physics and surface roughness but also brings uncertain effects through irrigation and water diversions. We consider these effects “uncertain” because they are related to unknown human decisions. Secondly, the observations of human activities are limited (Pande and Sivapalan, 2017). In the example above, many regions lack long-term and large-scale data on soil physics, roughness, irrigation, and water diversions, which are highly dependent on a high-cost network of in-site measurements.
Previous studies have used three methods to quantify human impacts on floods. The first method is a physical model simulation. This method regards the impacts of human activities as either the difference between actual observations and the model simulations of floods (Viglione et al., 2016; Lu et al., 2018) or flood changes with time-varying model parameters (Peña et al., 2016; Umer et al., 2019). However, this method suffers from limited model accuracy. The second method is a paired-catchment experiment. This method either compares the floods before and after human impacts in one catchment or compares floods in two groups of catchments with and without human impacts (Prosdocimi et al., 2015; Hodgkins et al., 2019). However, the comparisons above cannot rigorously isolate multiple impacts on floods since we cannot actually control everything except one targeted human factor (Runge et al., 2019). The third method is empirical variable dependence, i.e., using regressions or non-stationary probability distributions to link human factors to flood characteristics (FitzHugh and Vogel, 2011; Prosdocimi et al., 2015; Bertola et al., 2019; De Niel and Willems, 2019). The third method is cost-efficient for large-scale studies, but it has two problems. Firstly, to derive the causal effects of human factors, all confounders – which correlate with human factors and floods at the same time – should be explicitly accounted for in the empirical relationships. However, defining numerous variables to represent confounders may be an endless task. For example, climatic confounders are ambiguous because floods are caused by different climatic factors (e.g., long rainfall, short rainfall, snowmelt, and rain on snow) in different regions (Stein et al., 2020; W. C. Yang et al., 2020; Merz et al., 2020). Therefore, in a large-sample study, we do not have a unified regression form to control all possible variables for all catchments. Secondly, empirical methods require sufficient data for robust statistical inference, while flood samples are rare for each catchment.
Panel regression (Steinschneider et al., 2013; Wooldridge, 2016) solves the problems of the empirical method in two ways. Firstly, panel regression adds virtual variables to the regression to represent a fixed individual or regional effect (Steinschneider et al., 2013). In such a way, the regression can account for the effects of ambiguous confounders that are constant in time or region. Secondly, panel regression pools all samples into one model and trades space for time (Steinschneider et al., 2013). Therefore, the regression result is more reliable even with short flood records for each catchment. Although panel regression is a tool in economics, it has been introduced in hydrology to estimate the effects of forests on floods (Ferreira and Ghimire, 2012), urbanization on runoff coefficients (Steinschneider et al., 2013), dams on streamflow (McManamay, 2014), rainfall on streamflow (Bassiouni et al., 2016), deforestation on streamflow (Levy et al., 2018), urbanization on floods (Blum et al., 2020), and rain/snow fraction on floods (Davenport et al., 2020). However, these studies only focused on one factor at one time. Considering more human factors can provide a more comprehensive picture of the human impacts on floods. In addition, only Blum et al. (2020) and Davenport et al. (2020) tested the nonlinear effects of factors. Previous studies rarely examined whether the effects increase or decrease with increasing initial values of human factors.
In this study, supported by a large dataset of Chinese floods from 757 streamflow gauge stations, we quantify the national average sensitivities of annual flood peaks to changing urban areas, cropland areas, and reservoir indexes for large and medium dams using panel regression. We also test whether effects increase or decrease for catchments with increasing initial values of the targeted factor. The causal effects of factors distinguish the flood changes explained and unexplained by the three human factors in recent decades. This study is organized as follows. Section 2 introduces methods. Section 3 describes the data. Section 4 presents the results. Section 5 discusses the methods and the insights gained by this study. Section 6 gives conclusions.
2.1 Causal map of flooding
Causal maps depict the dependency relationship between variables, and they help discover confounders and focus on the causal effects of different factors when fitting a regression model (Pearl and Mackenzie, 2020). A confounder is a variable that influences both human factors and floods. A causal effect is defined as the sensitivity of floods to a factor when all possible confounding variables are controlled. Similar to Blum et al. (2020), we draw a causal map of flooding in Fig. 1. This study estimates the causal effects of the changes in dams, urban areas, and cropland areas on floods, as the three dashed lines show in the figure. Variables lying above the dashed lines are unknown or unobserved mediators. Urban areas and cropland areas are interrelated because they may change into each other during the process of land cover change. We consider two major confounders. The first confounder is the time-varying confounder, which can be unique for a catchment or spatially constant in a region. For example, increasing event precipitation during floods, which varies by individual catchments, may promote dam constructions; decreasing annual precipitation, which happens at a regional scale, exacerbates water shortage and may therefore promote the reservoir constructions or the implementation of the Grain for Green project. We delineate regions by climate since the climate is the first-order driver of catchment similarity (Jehn et al., 2020). In this way, we can control the effect of many omitted variables that have spatial homogeneity. The second confounder is the individual time-invariant confounder. This confounder is mainly represented by the characteristics of catchment landscapes, e.g., topography, soil types, and geology. For example, urban areas are likely built on flat and plain catchments.
2.2 Design of panel regression
Panel regression is a statistical technique for panel data (Steinschneider et al., 2013; Wooldridge, 2016). Panel data are observations on several subjects in different periods. Panel regression controls the constant effects of each subject or each period to mitigate regression bias due to omitted variables. Panel regressions in this study are extended from the equation in Blum et al. (2020) and are presented in Eq. (1) as follows:
Qi,t is the annual flood peak of catchment i in year t (m3 s−1). Urbani,t is the urban percentage of catchment i in year t (%). Cropi,t is the cropland percentage of catchment i in year t (%). RI is the reservoir index of catchment i in year t; DOR is the degree of regulation of reservoir j in catchment i, which is the ratio between the storage capacity and total annual flow of the reservoir; is the upstream area of reservoir j; Ai is the area of catchment i. Dr is a regional dummy which equals 1 or 0. Dt is a year dummy which equals 1 or 0. is the 3 d total precipitation before the flood peak in year t of catchment i, which accounts for the rainfall that causes the flood; is the 30-day total precipitation before the flood peak in year t of catchment i, which accounts for the soil moisture and snowmelt that cause the flood. The coefficients of and , namely φr and λr, are assumed to be constant within a climatic region r; αi is the time-invariant constant effects of catchment i; πr,t is the constant effects of region r in year t; εi,t is the model residuals. The response functions g1(⋅), g2(⋅), and g3(⋅) represent various response types of Q to different factors.
A region consists of a group of spatially coherent catchments with a similar climate. Unlike Blum et al. (2020) who used predefined physiographic regions, we delineated regions by using the partitioning around medoids (PAMs) algorithm (Reynolds et al., 2006) based on the distance matrix of all catchments defined as follow:
where distKG(i,j) is the distance of Köppen–Geiger class (Beck et al., 2018) ratios between catchment i and j; is the area percentage of Köppen–Geiger class l in catchment i; distcen(i,j) is the standardized distance between the geometric centers of catchment i and j; and earthdist(i,j) is the spherical distance on the earth between the geometric centers of catchment i and j.
The effect of a factor X on Q, i.e., the percentage change in Q given a fixed change in X, is expressed as follows:
We considered three types of response functions g(⋅): indicated a stable effect in which the percentage change in Q only depended on ΔX; indicated an increasing effect in which the percentage change in Q increased with increasing Xi,t; and indicated a decreasing effect in which the percentage change in Q decreased with increasing Xi,t. To determine the specific effect type, we fitted regressions with 27 possible combinations of (g1(⋅), g2(⋅), g3(⋅)) types and selected the one with the lowest Akaike information criterion (AIC) value. We used bootstrapping to test the significance and derive the confidence intervals of coefficients β, γ, and θ so that the model residuals were allowed to be non-Gaussian and the sampling uncertainty could be accounted for.
The mathematical assumptions of the panel regressions in this study are as follows: (1) there are no other time-varying subregional variables that correlate with both human factors and floods; and (2) there are no interactions between human factors and regional or individual characteristics that produce significant spatially heterogeneous effects. The regressions and statistical tests were performed in R (R Core Team, 2019) using package lfe (Gaure, 2019).
2.3 Flood change quantification
To examine whether the changes in observed floods can be explained by the changes in human factors, we first detected catchments with significant changes in Q using the Mann–Kendall test (Mann, 1945) and Pettitt's test (Pettitt, 1979) and then derived the accumulated flood changes attributed to the change in factor X for catchment i from year t1 to t2.
To examine how floods changed in catchments that were free from the impacts of urban areas, cropland areas, and dams, we selected catchments with less than 10 % changes in flood peaks due to those factors, respectively. Specifically, for a factor X, we selected catchments with %, where t2 was the most recent year of the data. Then, we applied the Mann–Kendall test (Mann, 1945) and Pettitt's test (Pettitt, 1979) in those catchments to detect the ones with significant changes in Q.
3.1 Streamflow and precipitation data
Annual maximum instantaneous discharge data in 2739 streamflow gauge stations were obtained from the Ministry of Water Resources in China (http://www.mwr.gov.cn/english/, last access: 7 May 2020). Figure 2 shows the outlet locations of all stations. The catchment areas are from 1 to 1 705 383 km2 with a median of 1660 km2. Catchment boundaries were extracted using MERIT Hydro hydrography data (Yamazaki et al., 2019). Differences between extracted catchment areas and reported areas were less than 20 % for all catchments. We only used data from 1960 to 2019 because less than 1000 stations had available data before 1960. Notice that a few stations in the northeast lie outside mainland China. They were not excluded from this study because all other data were globally available. The 1 km resolution data of Köppen–Geiger climate classes were obtained from Beck et al. (2018). A 3-hourly and 0.1∘ precipitation dataset in 1979–2017, the multi-source weighted-ensemble precipitation version 2.2 (MSWEP V2.2; Beck et al., 2019), was used.
Figure 2National 2739 streamflow stations and the number of stations with available annual maximum discharges each year. The Köppen–Geiger climate classes are obtained from Beck et al. (2018). The boundary lines delineate nine major river basins of China: 1. the Pearl River Basin, 2. the Southeast Basin, 3. the Yangtze River Basin, 4. the Southwest Basin, 5. the Huai He River Basin, 6. the Yellow River Basin, 7. the Hai He River Basin, 8. the Songliao River Basin, and 9. the Continental Basin.
Figure 3Spatial distribution of catchment characteristics in 757 independent catchments. (a) Urban percentages (Urban), (b) cropland percentages (Crop), and (c) reservoir indexes (RIs) in their last years with available flood data. The changes in (d) urban areas (ΔUrban), (e) cropland areas (ΔCrop), and (f) reservoir indexes (ΔRI) in 1992–2017.
3.2 Land cover and dam data
Land cover maps were obtained from the Climate Change Initiative Land Cover (CCI-LC) product produced by the European Space Agency (ESA) Climate Change Initiative. This product provides global, yearly, 300 m resolution land cover data in 1992–2015 in version 2.0.7 and 2016–2018 in version 2.1.1 (http://maps.elie.ucl.ac.be/CCI/viewer/download.php, last access: 6 October 2020). Urban areas of catchments can be extracted from the maps directly. Cropland areas consist of rain-fed cropland, irrigated or post-flooding cropland, and mosaic cropland.
Dam data were available in the Global Reservoir and Dam (GRanD) v1.3 database (Lehner et al., 2011). GRanD collected information about 7320 global dams in 1948–2017 and recorded 923 dams with storage capacities larger than 10 million m3 in China. These 923 dams were categorized as large and medium dams, according to the Bulletin of the first National Water Conservancy Survey (http://www.chinawater.com.cn/ztgz/xwzt/2013slpczt/1/, last access: 29 September 2020). The total storage capacity of all 4694 large and medium dams is 861 961 million m3 in China, according to the bulletin. The total storage capacity of all the 923 GRanD dams in China is 670 158 million m3, approximately 78 % of that recorded in the bulletin. It suggests that the GRanD database is reliable for quantifying the effects of large and medium dams on floods, whereas it is unsuitable for considering small dams. For simplicity, we use “dams” to represent large and medium dams in the rest of the paper. We obtained the locations, upstream areas, storage capacities, and total annual flows of each dam from the database. The reservoir index can be calculated with the information above.
3.3 Catchment selection for regression setup
We selected catchments with at least 20 years of annual maximum discharges (Q) to fit Eq. (1) in the common period of CCI-LC and GRanD data, i.e., 1992–2017. To avoid inaccurate statistical inference on the regression coefficients due to the correlated model residuals caused by nested catchments, we selected the most upstream catchments with large or medium dams (if possible) among overlapping catchments. We got 757 independent (non-nested) catchments, among which 207 catchments had as least one dam. The statistics of catchment characteristics in those 757 catchments are presented in Table 1, and the spatial distribution of catchments is presented in Fig. 3. Catchments with changes in Urban, Crop, and reservoir index (RI) have large impacts on estimating regression coefficients. The number of catchments with ΔUrban>0, ΔCrop>0, and ΔRI>0 is 656, 351, and 64, respectively. The number of catchment groups k in Sect. 2.2 had no optimal value. In light of the number of selected catchments in the regression models, we set k to be 10, 20, 30, 40, 50, 60, 70, and 80 to test the robustness of the models.
Table 1Summary of catchment characteristics for 757 independent catchments. For each catchment, among its all years with available flood data in 1992–2017, we choose the last year to calculate Urban, Crop, and RI and choose the first and last years to calculate ΔUrban, ΔCrop, and ΔRI. The summaries of RI and ΔRI are calculated based on 207 catchments with at least one large and medium dam.
4.1 The sensitivity of floods to human factors
Table 2 shows the optimal regression forms according to AIC and the corresponding coefficient estimations of factor Urban, Crop, and RI in Eq. (1). For Urban and RI, the effect types are consistent for varying values of k. Urban exhibits a positive and stable effect ( and β>0), which means a fixed percentage point increase in Urban brings a fixed percentage increase in Q no matter how large the initial Urban is. RI exhibits a negative and decreasing effect ( and θ<0), which means a fixed increase in RI brings a lower percentage decrease in Q with a larger value of initial RI. Crop exhibits no significant effect. The maps of catchment groups for all k values can be seen in Fig. A1.
Table 2Optimal regression forms (with the lowest AIC) and the corresponding coefficient estimations of factor urban percentage (Urban), cropland percentage (Crop), and reservoir index (RI) in Eq. (1). The * denotes that the coefficient does not equal 0 at a 0.05 significance level using bootstrapping inference; k is the preset number of catchment groups.
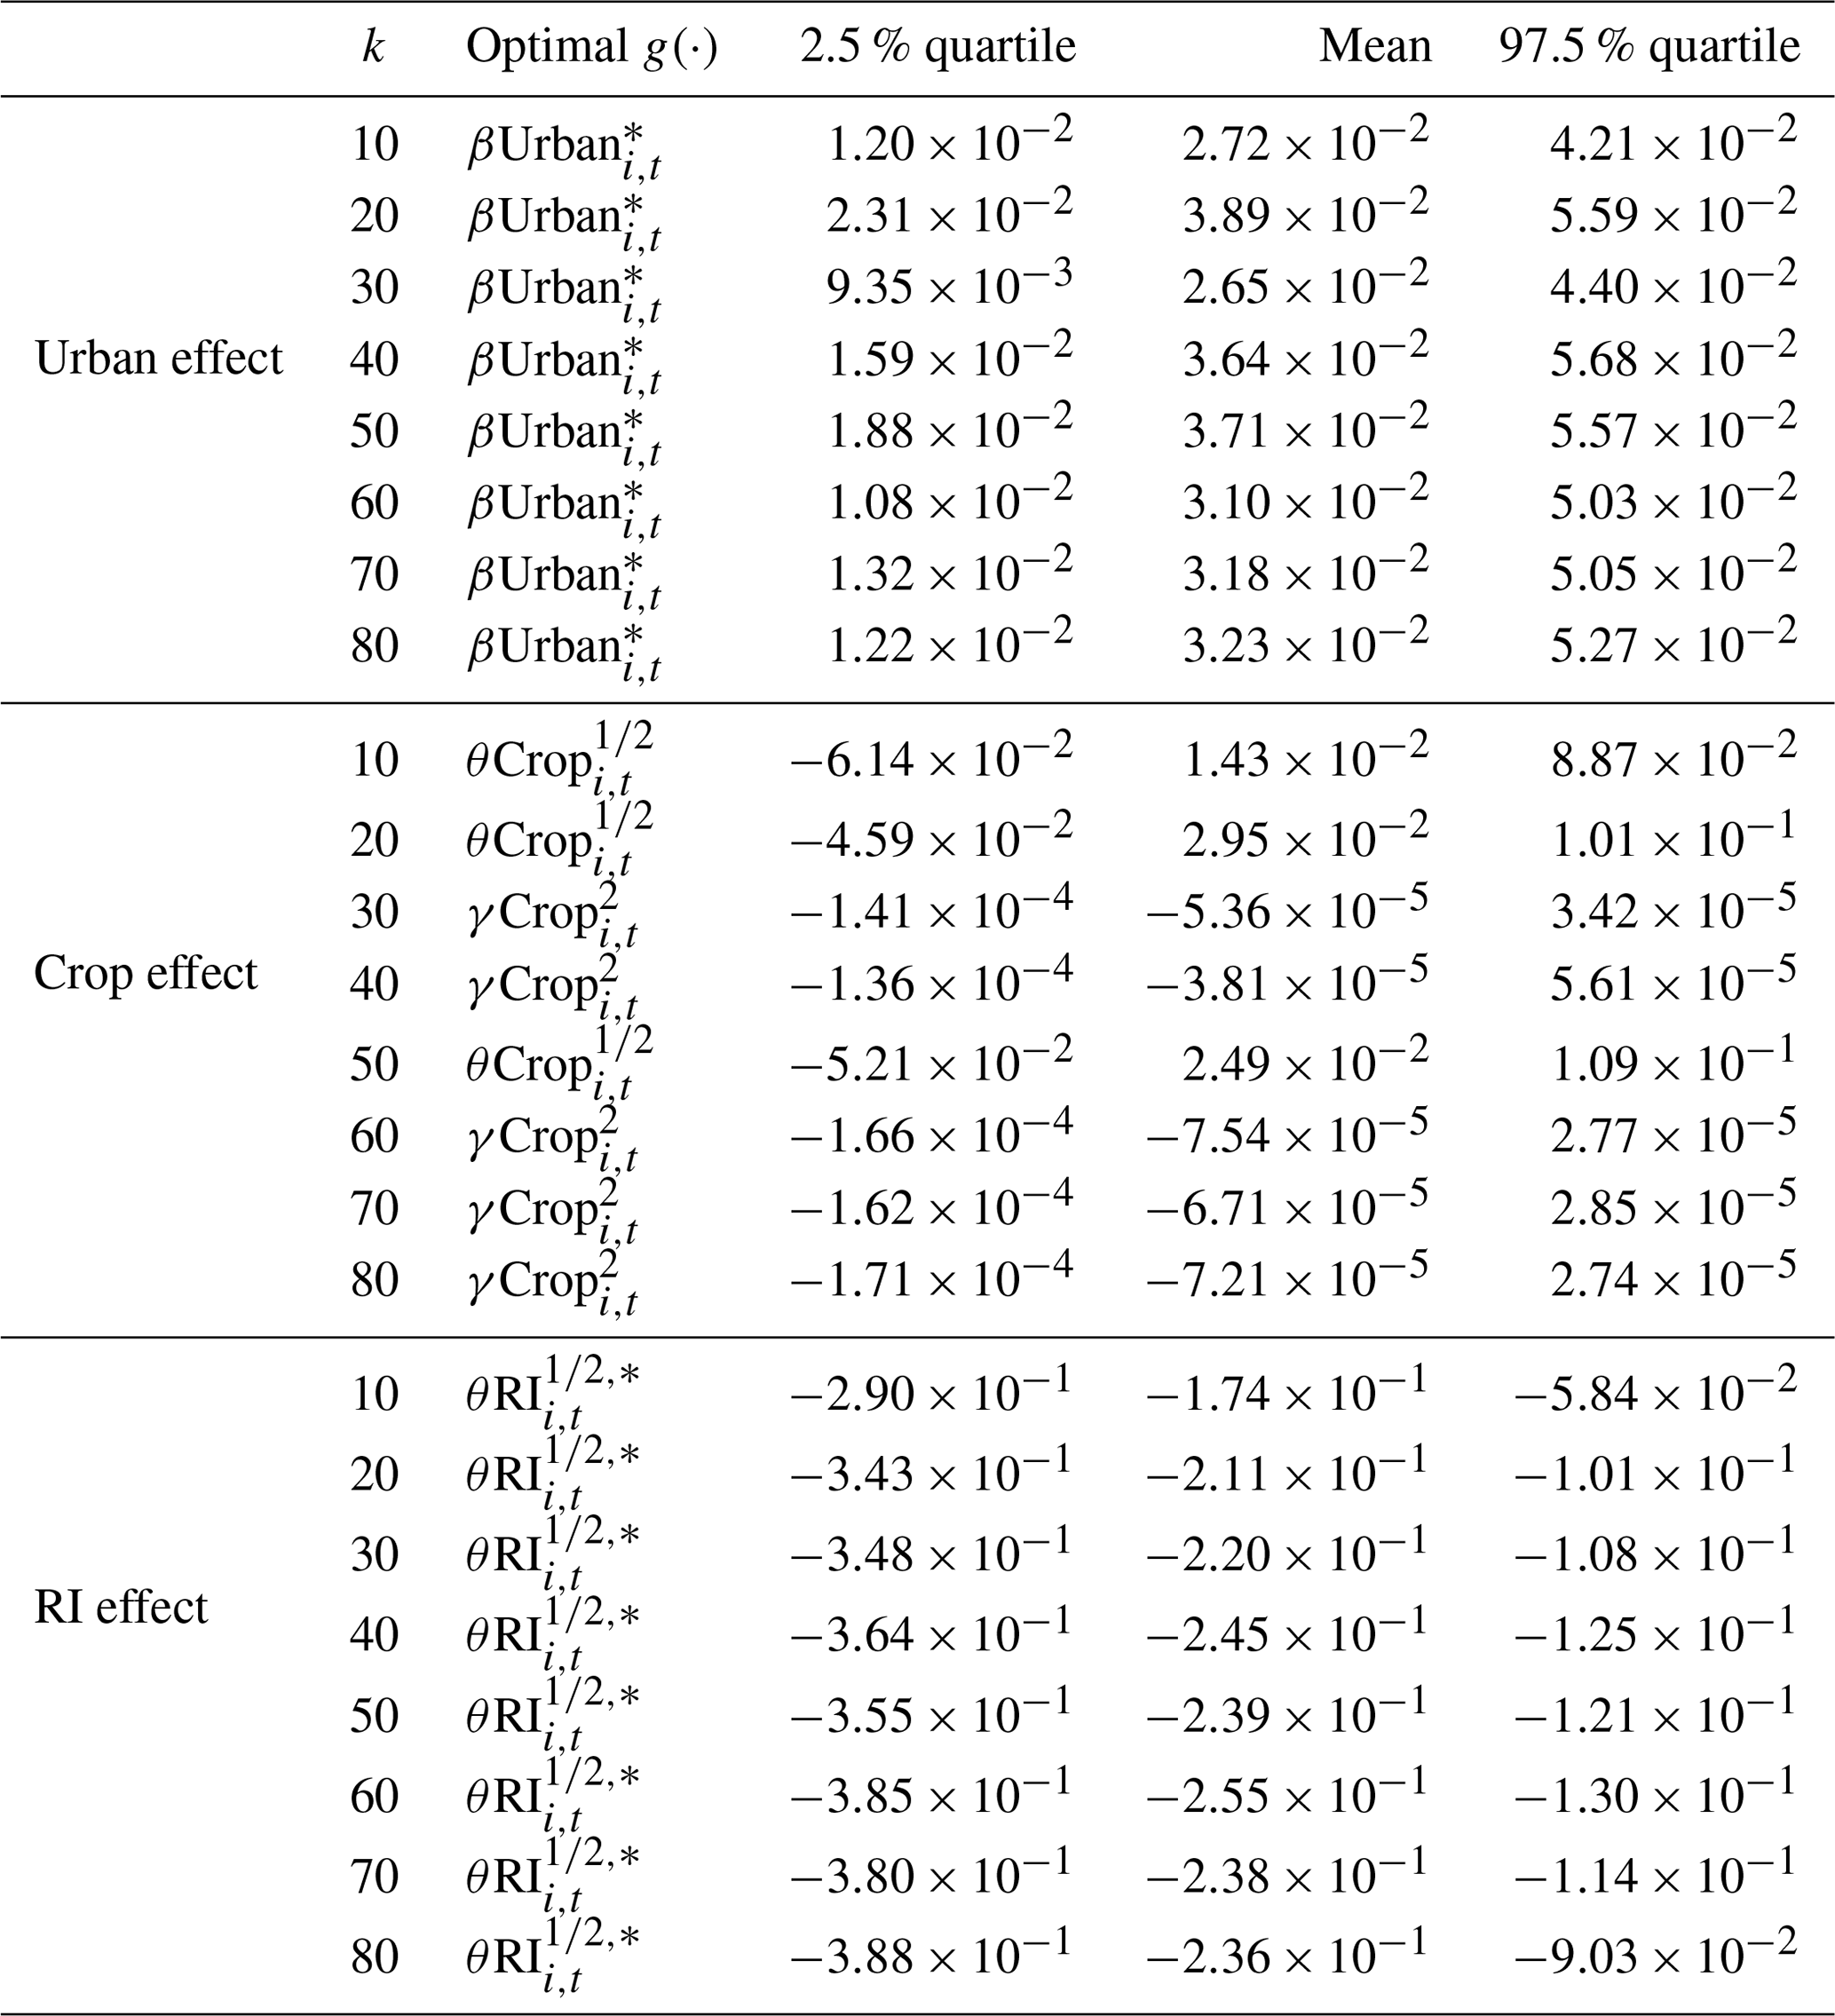
Figure 4 shows the percentage change in Q caused by a 1 % point increase in urban area according to Eq. (5). The values of ΔQ (%) are relatively consistent with varying values of k. Crop has no significant effect on Q; therefore, we do not calculate the corresponding sensitivity. Figure 5 shows the percentage change in Q caused by a 1 unit increase in RI according to Eq. (5). The relationship between ΔQ and RI has little change when k≥20. In summary, the method is robust to k, and thus, we regard the model with k=50 as the main model in the remaining part of the study. The sensitivity of Q to Urban is ΔQ=3.9 % with the 95 % confidence interval CI = 1.9 %, 5.7 %] when ΔUrban=1 %. The absolute values of ΔQ decrease with increasing initial values of RI. For initial RI=0, % with CI = [−29.9 %, −11.4 %] when RI increases by 1; for initial RI=3, % with CI = [−9.1 %, −3.2 %] when RI increases by 1.

Figure 4Percentage change in annual maximum discharge (Q) caused by a 1 % point increase in urban area (Urban) based on different numbers of catchment groups (k). The error bars are 95 % confidence intervals.
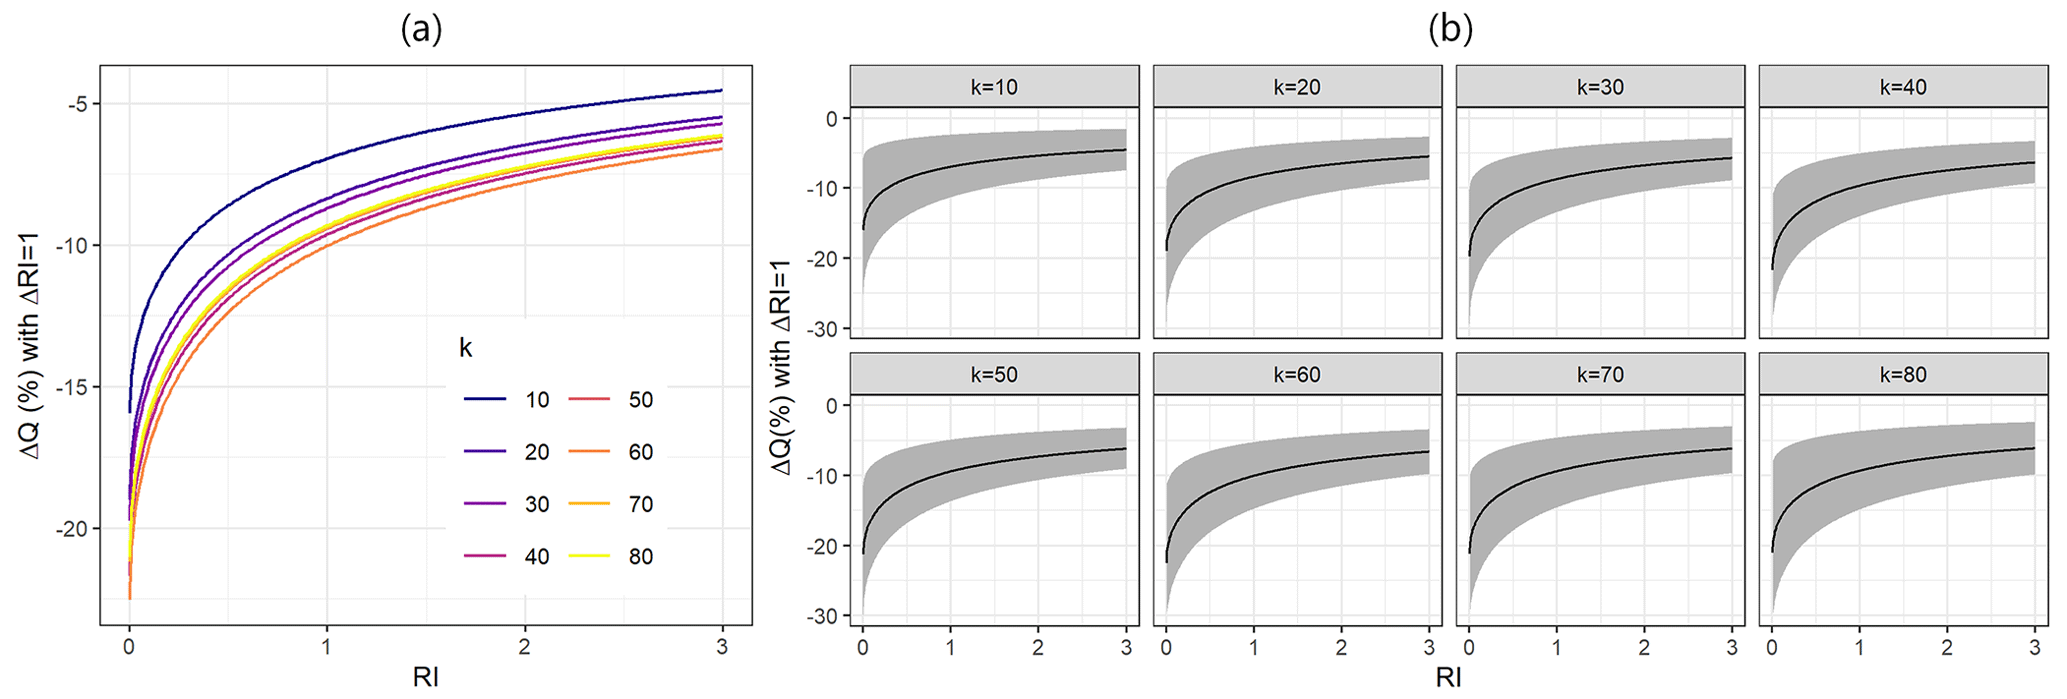
Figure 5(a) Percentage change in annual maximum discharge (Q) caused by a 1 unit increase in reservoir index (RI) from different initial RI values based on different numbers of catchment groups (k). (b) The same as (a) but with the 95 % confidence intervals shown by shaded areas.
4.2 National flood changes and attributions
Figure 6 shows the changes in Q due to the changes in Urban for 1625 catchments with at least 20 years of data in 1992–2017, according to Eq. (6). To avoid sample heterogeneity between these 1625 catchments and the 757 catchments used for regression, we compared the frequency distribution of Urban and ΔUrban for catchments with ΔUrban>0 in the two samples of catchments in Fig. A2. Since there is no substantial difference between the two distributions in Fig. A2, the sensitivity of Q to Urban, which is derived from the 757 catchments, can be used to infer the changes in Q due to ΔUrban in those 1625 catchments. According to Fig. 6, increasing Urban causes increases in Q of more than 10 % in 184 (11.3 % of 1625) catchments, which are mainly located in the North China Plain, especially in the Huai He River Basin and the middle and downstream of the Hai He River Basin. Among these 184 catchments, increasing Urban causes increases in Q of more than 25 % in 71 (4.4 % of 1625) catchments. In 61 catchments with significant increases in observed Q, increasing Urban causes increases in Q of more than 10 % in only five catchments, which means urbanization is not a predominant driver of flood changes in 1992–2017 in China. The changes in Q due to the changes in Crop cannot be effectively quantified because Crop has no statistically significant effects on Q according to the results in Sect. 4.1.
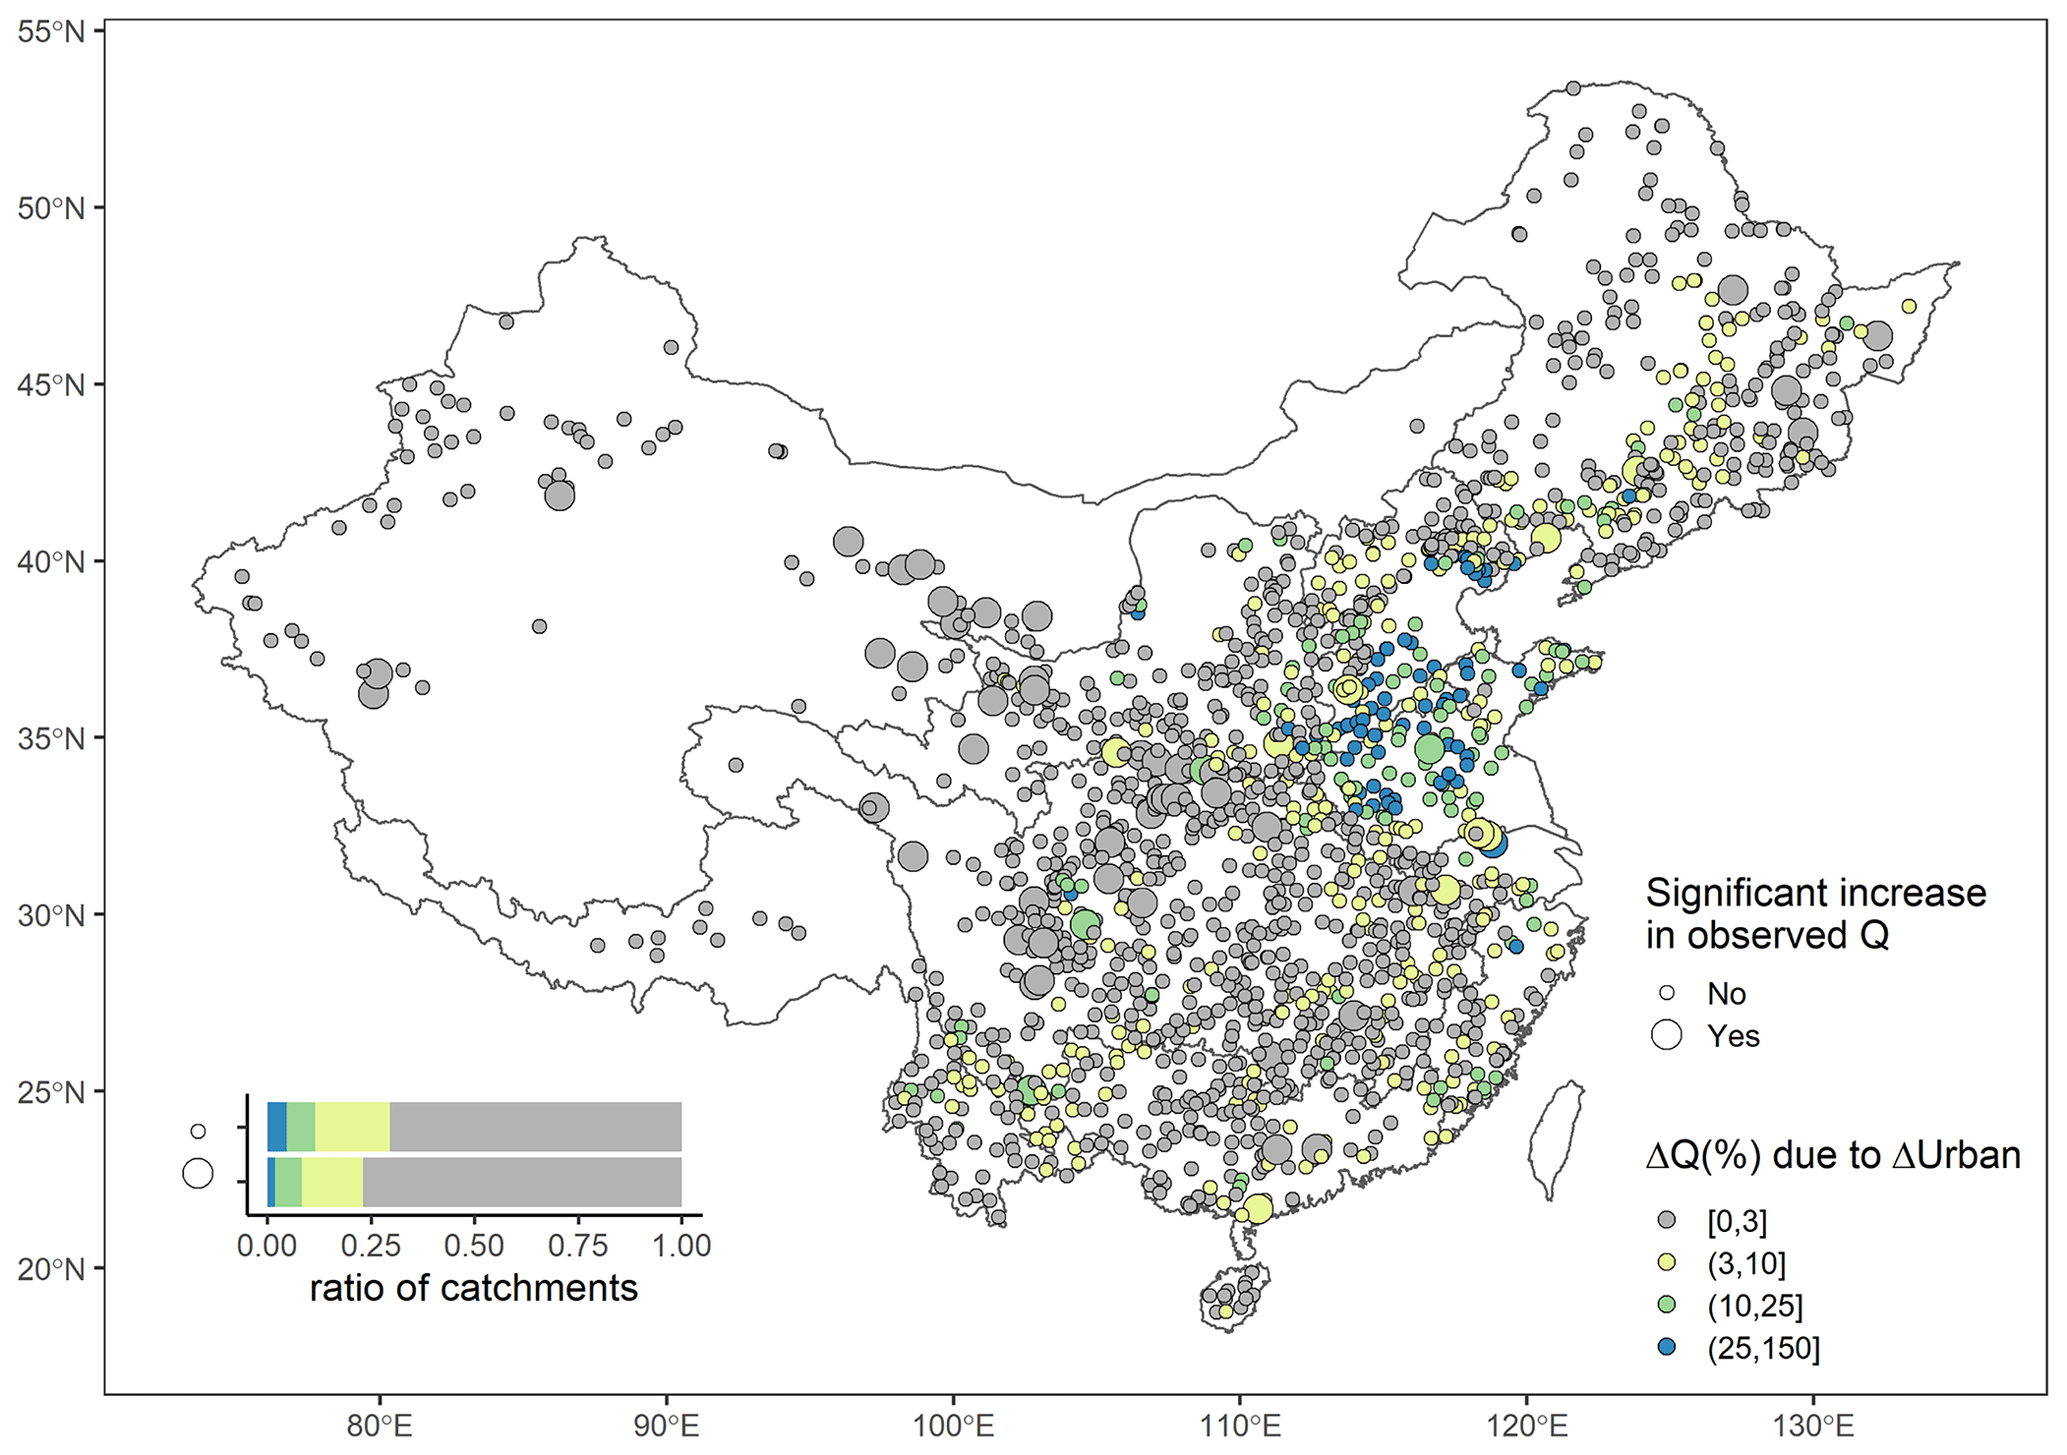
Figure 6Accumulated increases in annual maximum discharges (Q) due to the increases in urban areas (Urban) for 1625 catchments with at least 20 years of flood data in 1992–2017, according to Eq. (6). Large dots represent catchments with significant increases in observed Q if p<0.05 for either one of the Mann–Kendall test and the Pettitt's test. The boundary lines delineate nine major river basins of China.
Figure 7 shows the changes in Q due to the changes in RI for 536 catchments with at least one dam and at least 30 years of data in 1960–2017, according to Eq. (6). Similar to Fig. 6, to avoid sample heterogeneity between these 536 catchments and the 757 catchments used for regression, we compared the frequency distribution of RI and ΔRI for catchments with ΔRI>0 in the two samples of catchments in Fig. A3. Since there is no substantial difference between the two distributions in Fig. A3, the sensitivity of Q to RI, which is derived from the 757 catchments, can be used to infer the changes in Q due toΔRI in those 536 catchments. According to Fig. 7, in 196 (36.6 % of 536) catchments, increasing RI leads to more than 10 % decreases in Q. It indicates that flood peaks are likely to decrease severely if dams are built in the catchment. Among these 196 catchments, increasing RI leads to more than 25 % decreases in Q in 28 (5.2 % of 536) catchments. Spatially, the impacts of dams on floods are larger in northern basins (the Huai He River Basin, the Hai He River Basin, the Yellow River Basin, and the Songhua and Liao river basins) than those in the southern basins (the Yangtze River Basin, the Southeast River Basin, the Southwest River Basin, and the Pearl River Basin). In the northern basins, increasing RI leads to more than 10 % and 25 % decreases in Q in 47.8 % and 10.0 % catchments, respectively. By comparison, in southern basins, increasing RI leads to more than 10 % and 25 % decreases in Q in only 26.3 % and 0.7 % catchments, respectively. In 234 catchments with significant decreases in observed Q, increasing RI leads to more than 10 % decreases in Q in 138 (59.0 % of 234) catchments, which means dam construction is a predominant driver of the decreases in flood magnitudes for catchments with dams in 1960–2017.
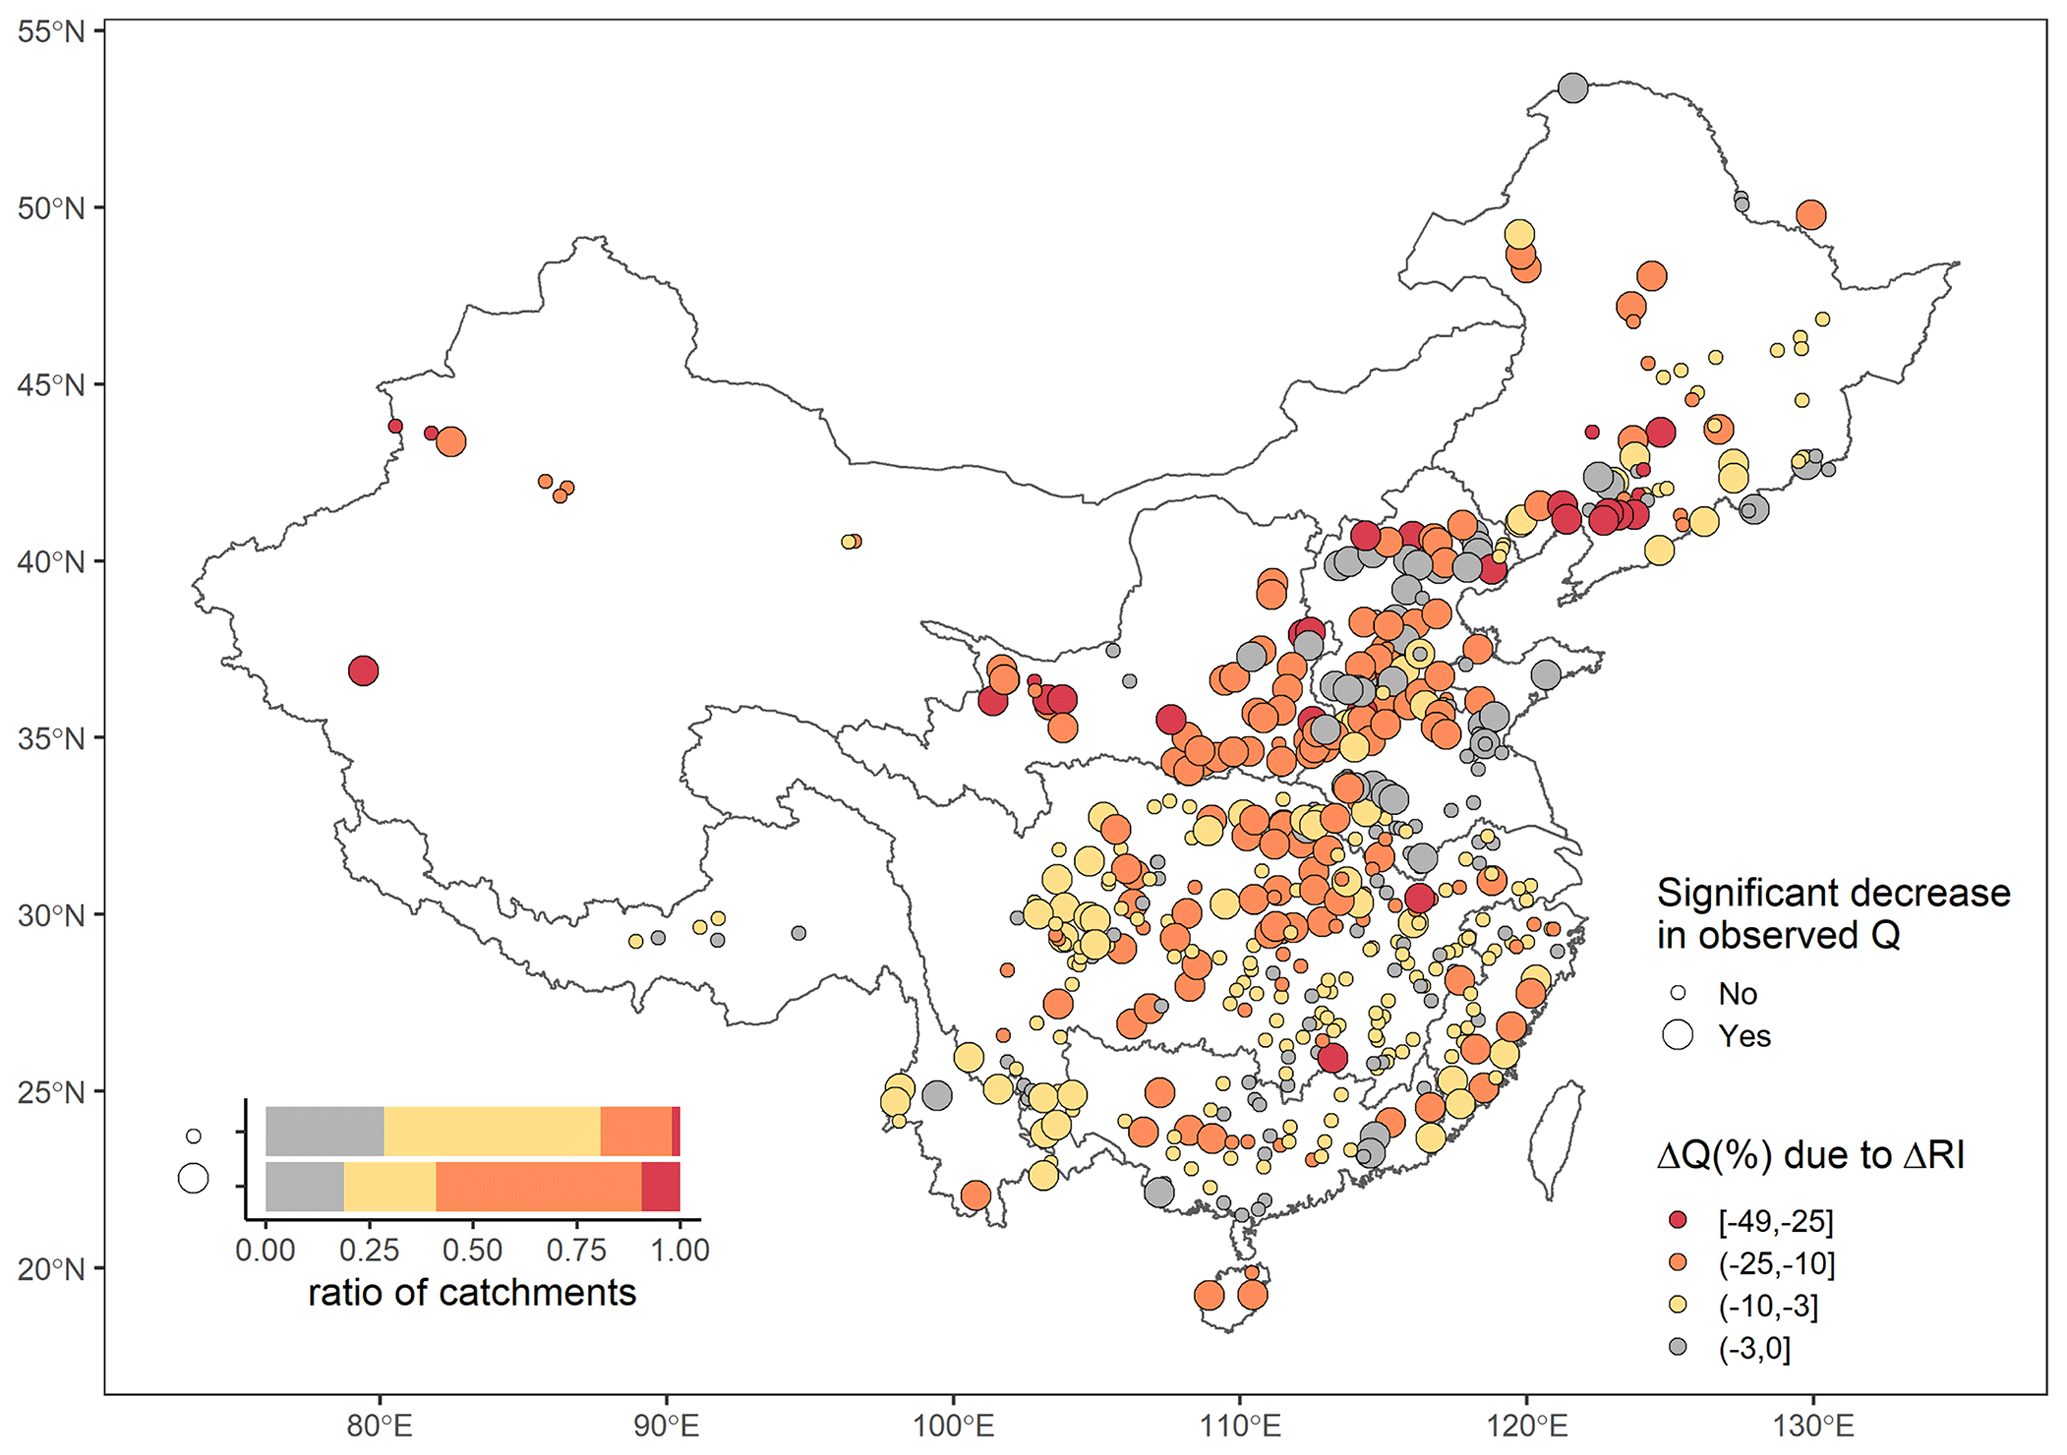
Figure 7Accumulated decreases in annual maximum discharges (Q) due to the increases in reservoir index (RI) for 536 catchments with at least 30 years of flood data and at least one dam in 1960–2017, according to Eq. (6). Large dots represent catchments with significant decreases in observed Q if p<0.05 for either one of the Mann–Kendall test and the Pettitt's test. The boundary lines delineate nine major river basins of China.
Figure 8 shows the change directions of Q during 1960–2017 in 1249 catchments with at least 30 years of data, Urban<2.6 %, and RI<0.19. These catchments were selected based on the thresholds that ensure each factor leads to no more than 10 % changes in Q, as stated in Sect. 2.3. In these catchments, the changes in Q are free from the impacts of Urban, Crop, and RI. Significant increases in Q occur in 85 (6.9 % of 1249) catchments. Significant decreases in Q occur in 403 (32.3 % of 1249) catchments, among which 188 (46.7 % of 403) are located in the Yellow River Basin (mainly in the middle and downstream) and the Hai He River Basin (mainly in the upper streams). Such regional coherence of similar trends cannot be found in other regions.
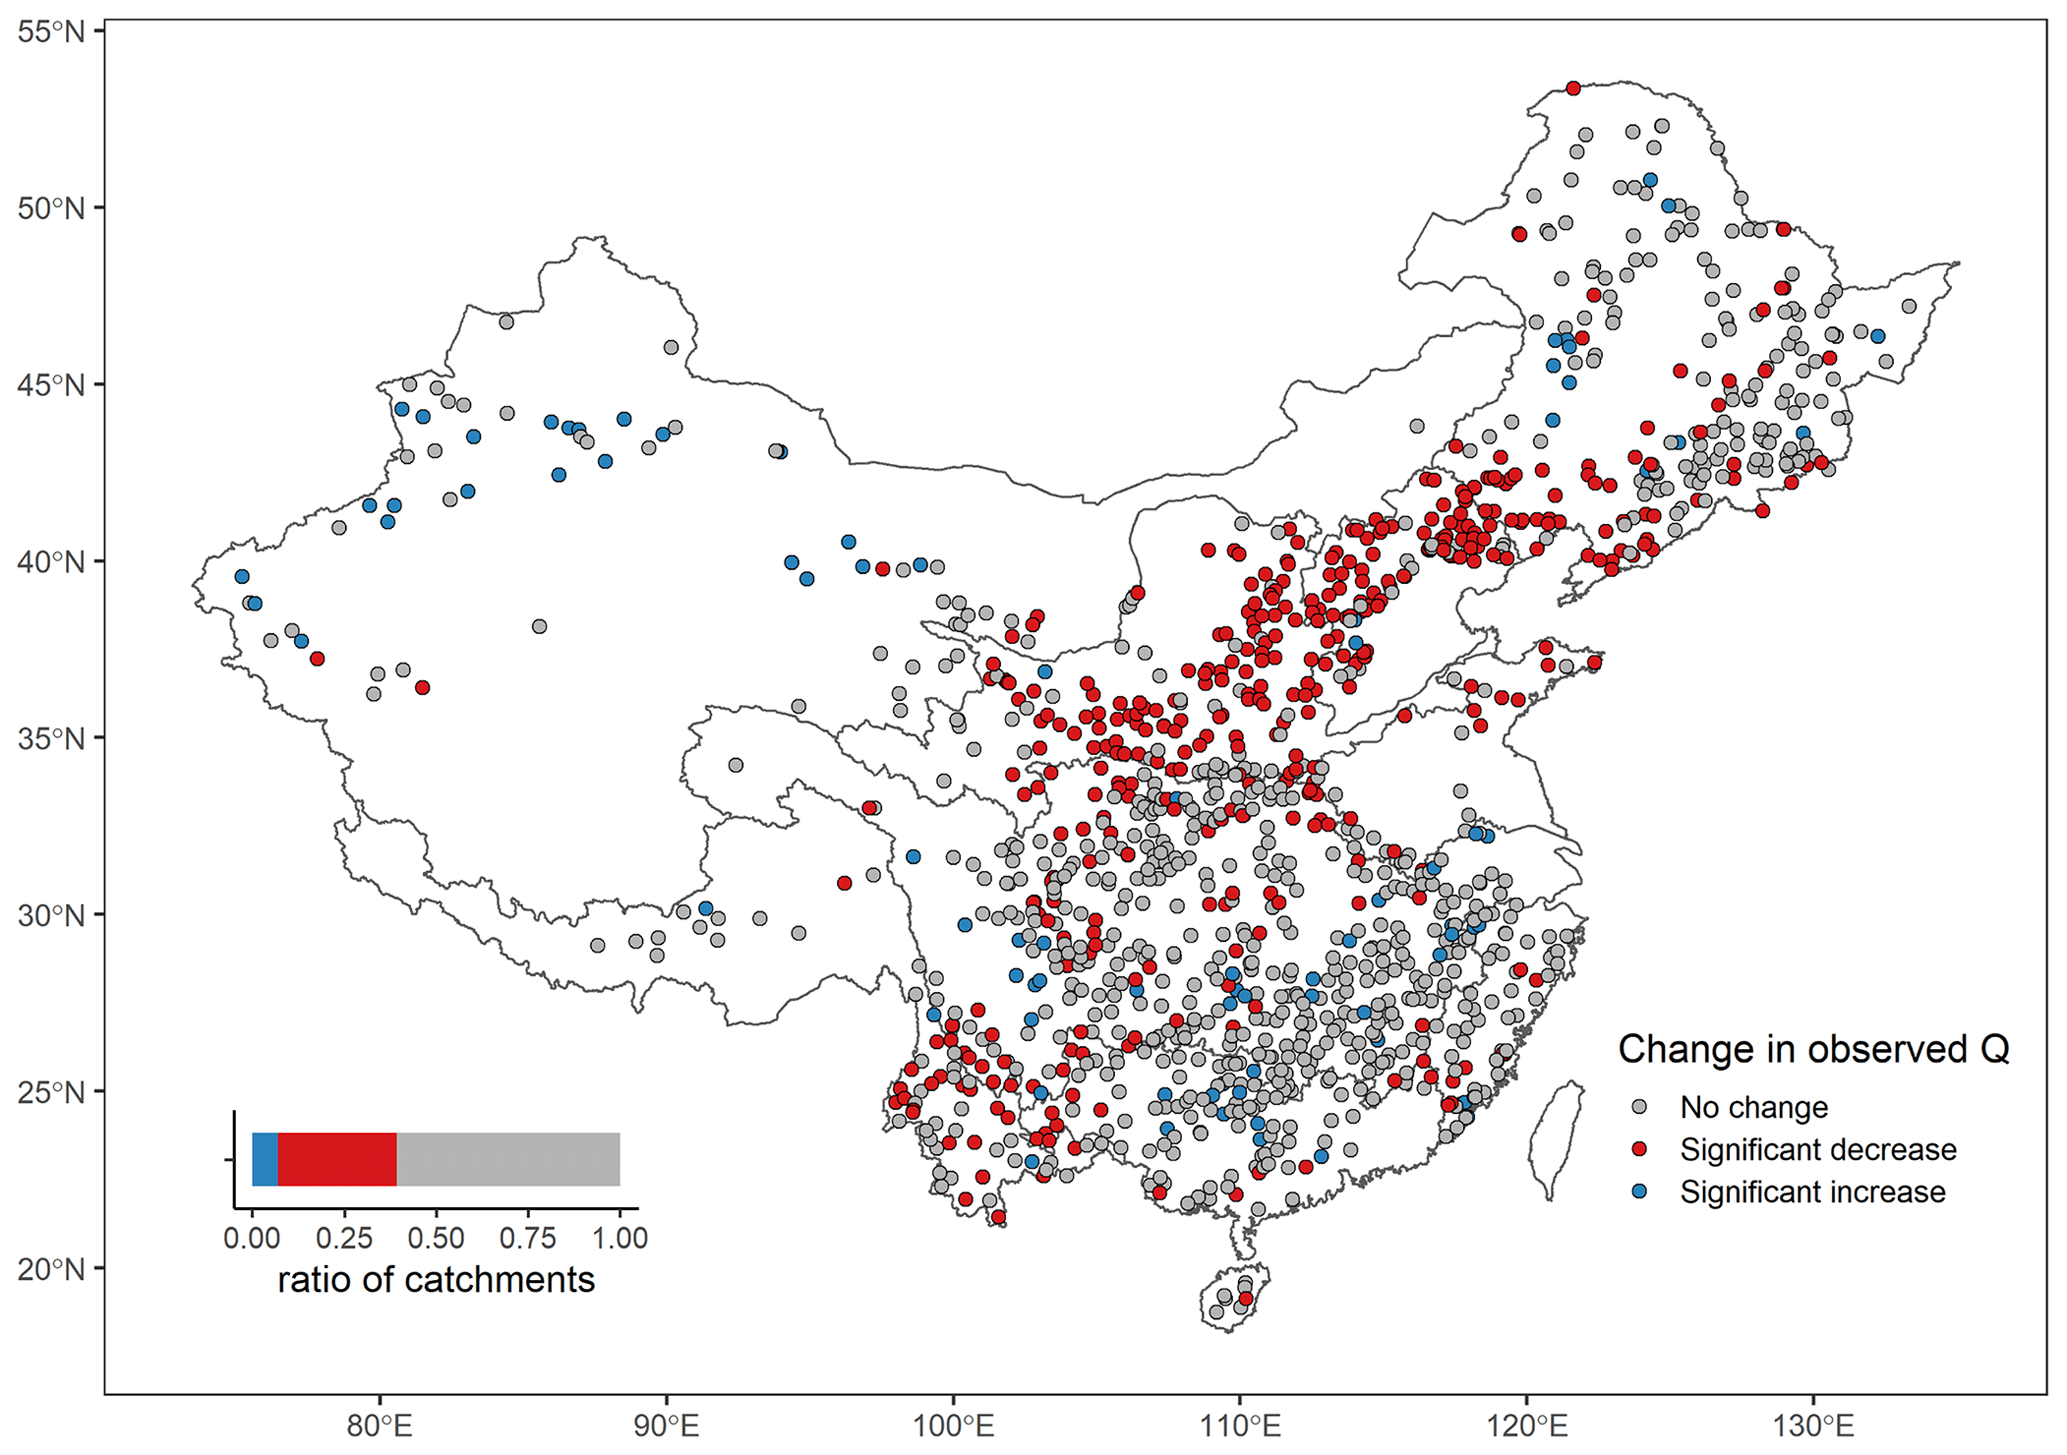
Figure 8Change directions of annual maximum discharges (Q) during 1960–2017 for 1249 catchments with at least 30 years of flood data, Urban<26 %, and RI<019. These catchments are considered to be free from the impacts of urbanization and dam constructions. The change is significant if p<0.05 for either one of the Mann–Kendall test and Pettitt's test. The boundary lines delineate nine major river basins of China.
5.1 Strengths and limitations of panel regressions
We use panel regressions to derive the causal effects of urban areas, cropland areas, and dams on annual maximum discharges across mainland China. In this study, the panel regressions exhibit the following strengths. (1) We obtain a nationally generalizable sensitivity of floods to each human factor. This sensitivity helps us understand the overall added risks of specific human activity on floods on a national scale. In addition, with quantitative sensitivity, scientists are able to select catchments with limited impacts of dams and land cover changes for studying the effects of climate change (e.g., Blöschl et al., 2019). (2) Compared with previous studies using panel regressions in hydrology (Ferreira and Ghimire, 2012; Steinschneider et al., 2013; McManamay, 2014; Bassiouni et al., 2016; Levy et al., 2018; Blum et al., 2020; Davenport et al., 2020), we take it a step further by considering multiple types of human impacts simultaneously and distinguishing their increasing or decreasing effects. Blum et al. (2020) and Davenport et al. (2020) considered nonlinear forms of response functions for the targeted factors, but they did not distinguish increasing and decreasing effects. These improvements provide a more comprehensive understanding of human impacts on floods.
The limitations are as follows. (1) The assumptions in the regressions are difficult to test. As stated in Sect. 2, we assume (i) no more important time-varying subregional confounders and (ii) no interaction terms between human factors and regional or individual characteristics that produce significant spatially heterogeneous effects. These assumptions may be violated in some cases. For example, the effect of urbanization on floods may be larger in regions with higher soil permeability, which means spatially heterogeneous effects may be non-negligible. Testing these assumptions requires detailed information about catchment characteristics such as topography and geology. Moreover, adding too many variables into the regressions will decrease model interpretability. (2) The method cannot distinguish the heterogeneous effects of human factors on different floods. As stated in Sect. 2.3, the method derives a common percentage change in all flood peaks given changing human factors, which means no changes in coefficients of variation. However, practically, the variability in floods may change through human activities. For example, reservoirs tend to regulate extreme floods but omit small floods. (3) This study does not comprehensively assess the effects of total human impacts on floods. We omit many other human factors due to the lack of data. For example, the data about water diversion, irrigation, channelization, and afforestation on a national scale are currently not available to the public.
5.2 Consistency with knowledge and other large-sample studies
We detect a stable positive effect of urban areas on floods. In theory, expanding urban areas magnify floods in two major ways. Firstly, natural soil grounds are replaced by impervious surfaces, which lead to more rainfall water appearing on the surface rather than infiltrating into the soil (Villarini and Slater, 2017). Second, urban areas have smooth surfaces, where floods propagate faster and become more flashy (Mogollón et al., 2016). This study finds a 3.9 % (with CI = [1.9 %, 5.7 %]) increase in annual maximum discharges given a 1 % point increase in urban areas. This finding is in accordance with the results from a national investigation in the United States (Blum et al., 2020), which reported a 3.3 % (with CI = [1.9 %, 4.7 %]) increase in annual maximum discharges based on panel regressions.
The cropland areas impose no significant impacts on floods according to our results. Theoretically, expanding cropland areas affects floods in many ways. For example, during agricultural practices, soil depths may decrease due to erosion, while they may increase due to soil compaction (Rogger et al., 2017). Cropland may also bring artificial drainages that lower groundwater tables (Rogger et al., 2017). Some effects may be offset by others, which masks the relationship between cropland areas and floods. Similar to our result, Bertola et al. (2019) found that agricultural land-use intensification rarely caused flood changes in 95 catchments of Austria using covariate-based non-stationary flood probability distributions. To our knowledge, large-sample studies are limited on the relationship between cropland and floods. Therefore, more detailed in-site investigations are required to uncover the causal chain from cropland changes to flood changes.
This study suggests that dams have a negative decreasing effect on floods. Generally, dams buffer water during floods and thus decrease flood peaks. More dams may not necessarily decrease floods at a constant rate because existing dams with sufficient storage capacities are already capable of controlling floods. This effect was confirmed by Wang et al. (2017), who used detailed conceptual models of reservoir regulation and found that the mean annual floods had a slowing decrease with increasing reservoirs. In a large-sample study on 4859 catchments in the United States (FitzHugh and Vogel, 2011), median annual 1 d maximum flows were estimated to decrease by more than 20 % when the storage ratios, i.e., the total storage capacity of upstream dams divided by average annual runoff, were larger than 1. If a dam with storage capacity equaling the annual runoff is established at the outlet of the catchment without any dam before, both the reservoir index defined in this study and the storage ratio defined by FitzHugh and Vogel (2011) increase from 0 to 1. In this special case, the annual maximum discharges change by −21.2 % (with CI = [−29.9 %, −11.4 % ]) in this study, comparable to the 20% decrease from FitzHugh and Vogel (2011). It is noteworthy that this study only focuses on the effects of human factors on annual maximum discharges. Generally, the effects are larger for less frequent floods. Zhao et al. (2020) investigated floods in 1403 catchments in the United States and found a decrease in 100-year floods by more than 60 % in 47 % of catchments with a dam upstream.
5.3 Insights toward a national investigation of flood changes
This study takes the first step to explain flood changes quantitatively on a national scale in China. In this study, urbanization and dam constructions significantly change annual maximum discharges in the middle and downstream of the Yellow River Basin and the Hai He River Basin, where step changes were detected by Yang et al. (2019). As a major human residence with a high population density, the North China Plain has experienced fast urbanization in recent years (Du et al., 2018), which brings larger flood risks to lives and properties. In addition, the degree of dam regulation is larger in northern China because the annual runoff is much smaller than that in wet southern China. In this study, after removing the catchments with non-negligible impacts of urbanization and dams, unexplained decreasing annual maximum discharges show spatial coherence in the middle and downstream of the Yellow River Basin and the upper streams of the Hai He River Basin, where decreasing trends were also derived by Yang et al. (2019). Yang et al. (2019) interpreted these trends as the results of soil conservation practices (Bai et al., 2016) and decreasing extreme rainfall (Yang et al., 2013; Wu et al., 2016). Besides, other reasons include decreasing soil moisture (Cheng et al., 2015; W. C. Yang et al., 2020) and the impacts of small, soil-retaining cascading dams (X. N. Yang et al., 2020). It indicates that the impact factors of floods are complex in this region and further studies are required.
Caution is required in interpreting the flood changes attributed to urbanization and dam constructions on a national scale because the sensitivity of floods to these factors is derived from a subset of catchments. Although the catchments used for sensitivity calculation and the ones used for flood change attribution have similar frequency distributions of urban areas and reservoir indexes in Figs. A2 and A3, these different sets of catchments may not be completely homogeneous in terms of all characteristics (topography, climate, etc.). Moreover, one should also be cautious when applying the sensitivity results to other regions such as catchments in other countries.
We conducted a data-based analysis on the causal effects of human impacts on floods using a panel regression on a national scale, based on annual maximum discharges (Q) from 757 non-nested catchments in China, CCI-LC data, and GRanD dam data. Specifically, we derived nationally generalizable information about the sensitivity of Q to human factors, namely the changes in urban areas, cropland areas, and reservoir indexes for large and medium dams. Furthermore, using a dataset of 2739 streamflow stations, we determined the explained and unexplained changes in floods by the human factors on a national scale based on the sensitivity of Q to human factors. The major findings are as follows.
Floods are sensitive to the changes in urban areas and dams. Urban areas have a positive and stable effect on floods, i.e., a 1 % point increase in urban areas causes a 3.9 % increase in annual maximum discharges with a confidence interval CI = [1.9 %, 5.7 %]. Cropland areas have no significant effect on Q. Reservoir index has a negative and decreasing effect on Q, i.e., the decrease in Q caused by a 1 unit increase in reservoir indexes ranges from 21.4 % (with CI = [11.4 %, 29.9 %]) to 6.2 % (with CI = [3.2 %, 9.1 %]), corresponding to initial reservoir indexes from 0 to 3.
Urbanization is not a predominant driver of the increases in flood magnitudes on a national scale. In 1992–2017, increasing urban areas cause increases in Q of more than 10 % in 184 (11.3 %) of 1625 catchments. These catchments are mainly located in the North China Plain, especially in the Huai He River Basin and the middle and downstream of the Hai He River Basin. However, among these 184 catchments, only 5 of them have significant increases in observed Q.
Dam construction is a predominant driver of the decreases in flood magnitudes on a national scale. Among the 536 catchments with at least one dam in 1960–2017, increasing reservoir indexes cause decreases in Q of more than 10 % in 196 (36.6 %) catchments. Spatially, the impacts of dams on floods are larger in northern basins, including the Huai He River Basin, the Hai He River Basin, the Yellow River Basin, and the Songhua and Liao river basins. There are 138 of those 196 catchments having significant decreases in observed Q, accounting for 59.0 % of the total 234 catchments with significant decreases in observed Q.
Unexplained decreases in flood magnitudes show spatial coherence in the middle and downstream of the Yellow River Basin and the upper streams of the Hai He River Basin. Among 1249 catchments with less than 10 % changes in Q caused by urban areas or dams, 403 (32.3 %) catchments have significant decreases in Q during 1960–2017, and 46.7 % of the 403 catchments are located in the Yellow River Basin and the Hai He River Basin.
This study extends the panel regression method to quantify the effects of multiple human factors on floods, which helps us understand the causes of flood changes on a national scale in China. Future studies may collect more data to consider more human factors and quantify the effects on different return periods of floods.
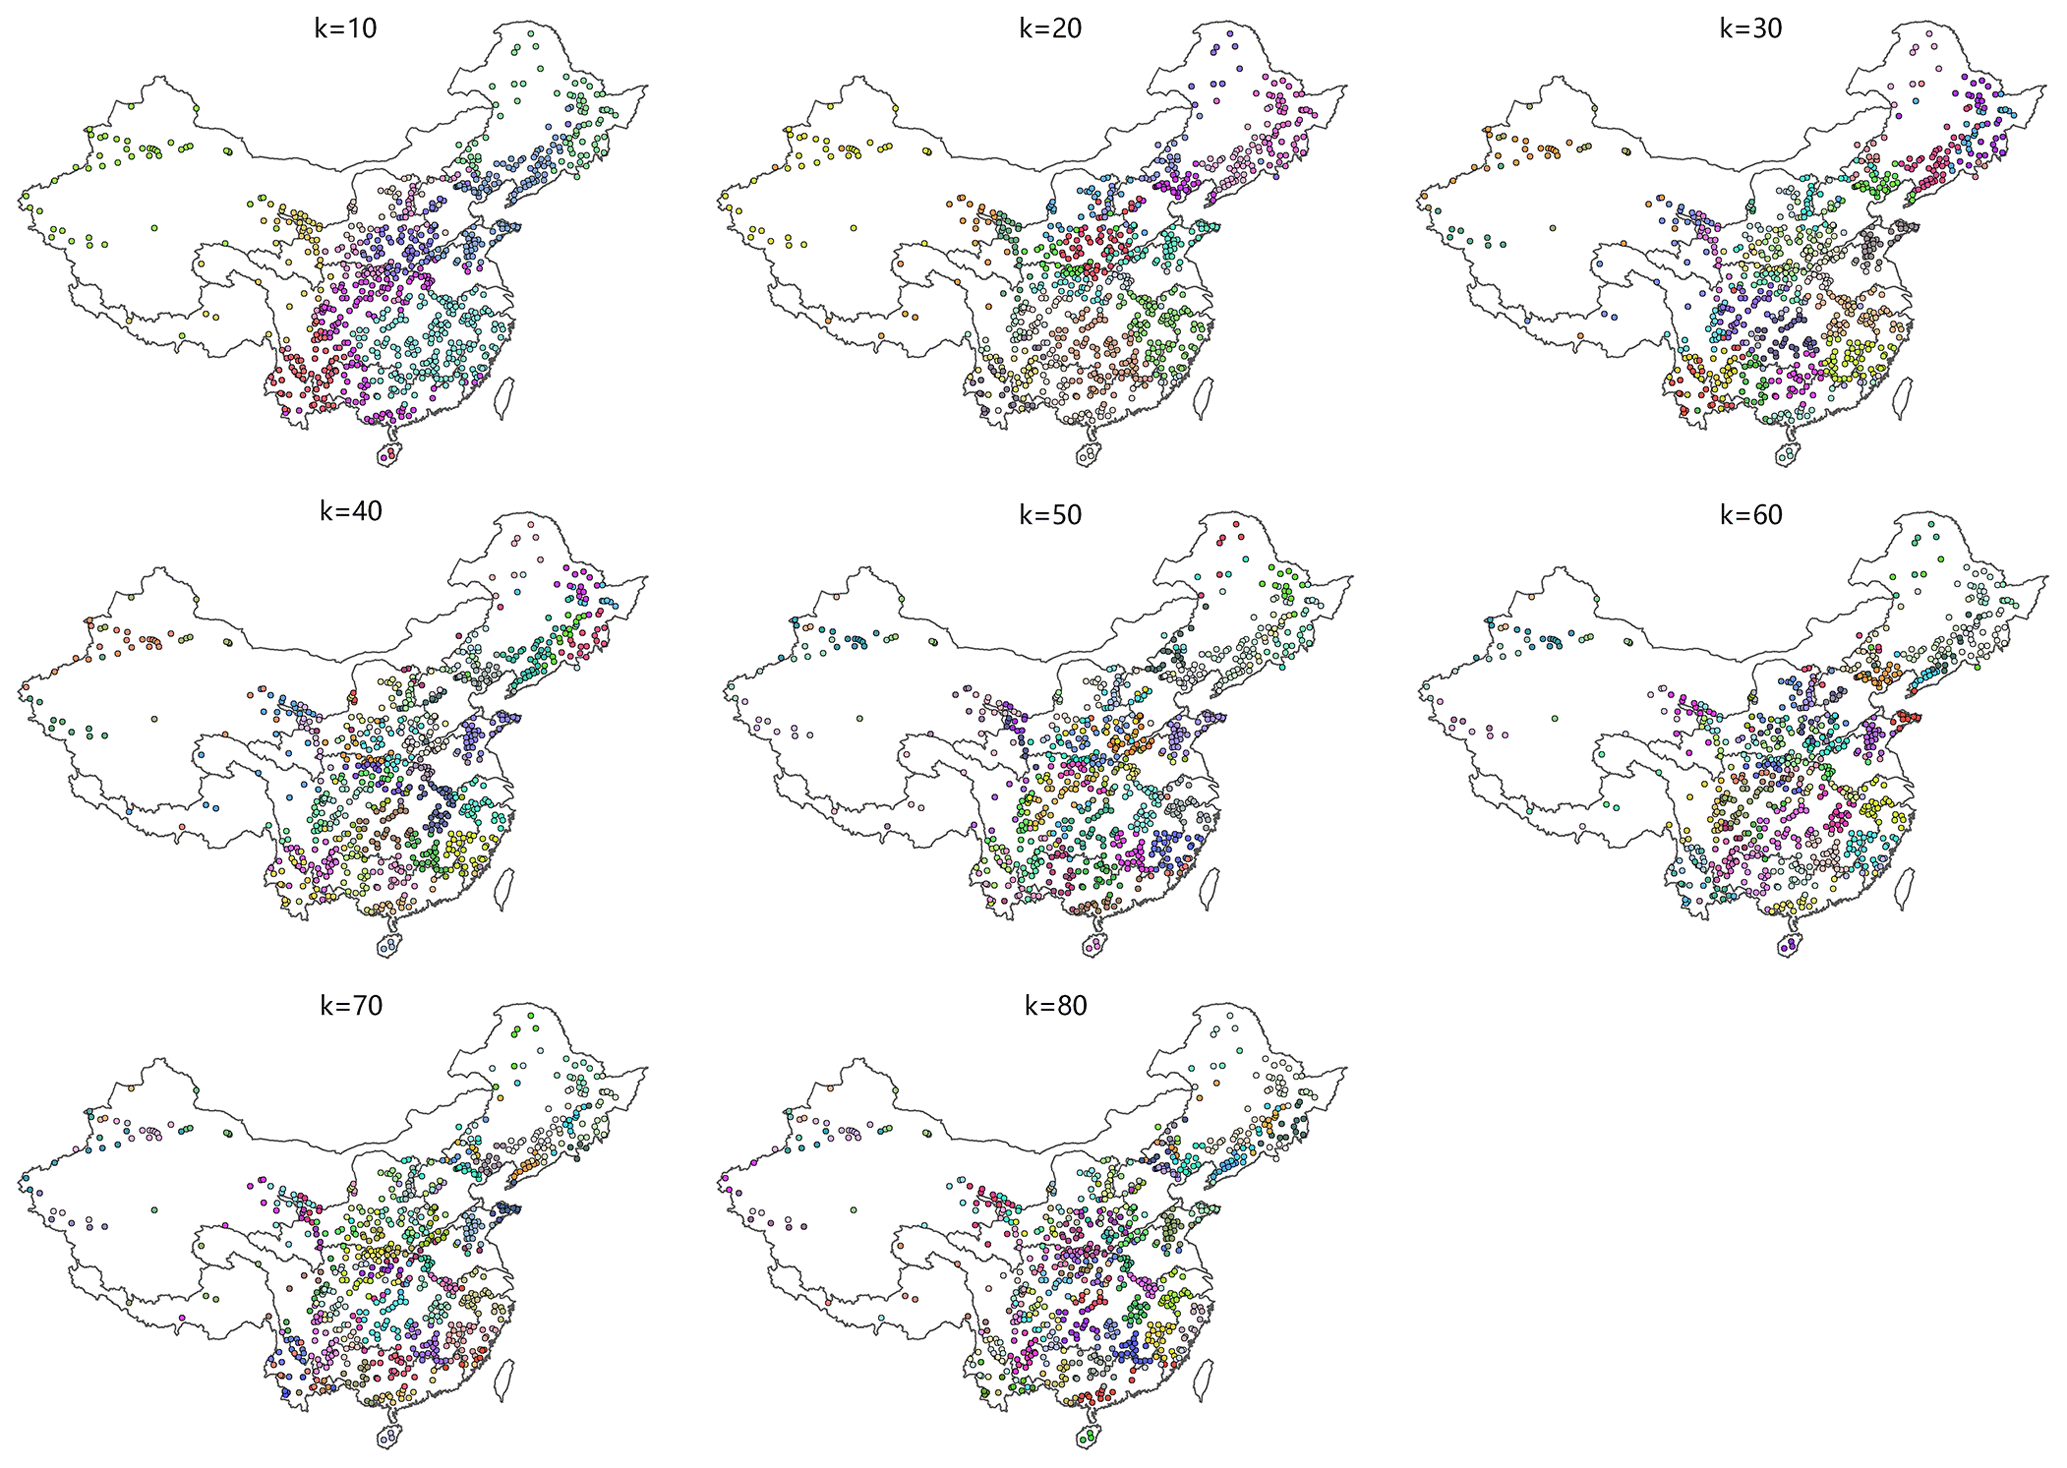
Figure A1Catchment groups for all k values in Eq. (1). The points are the geometric centers of catchments.

Figure A2Frequency distribution of Urban and ΔUrban in catchments with ΔUrban>0 from two catchment sets: the one used for the regression in Fig. 3d (green) and the one used for the flood change attribution in Fig. 6 (red).
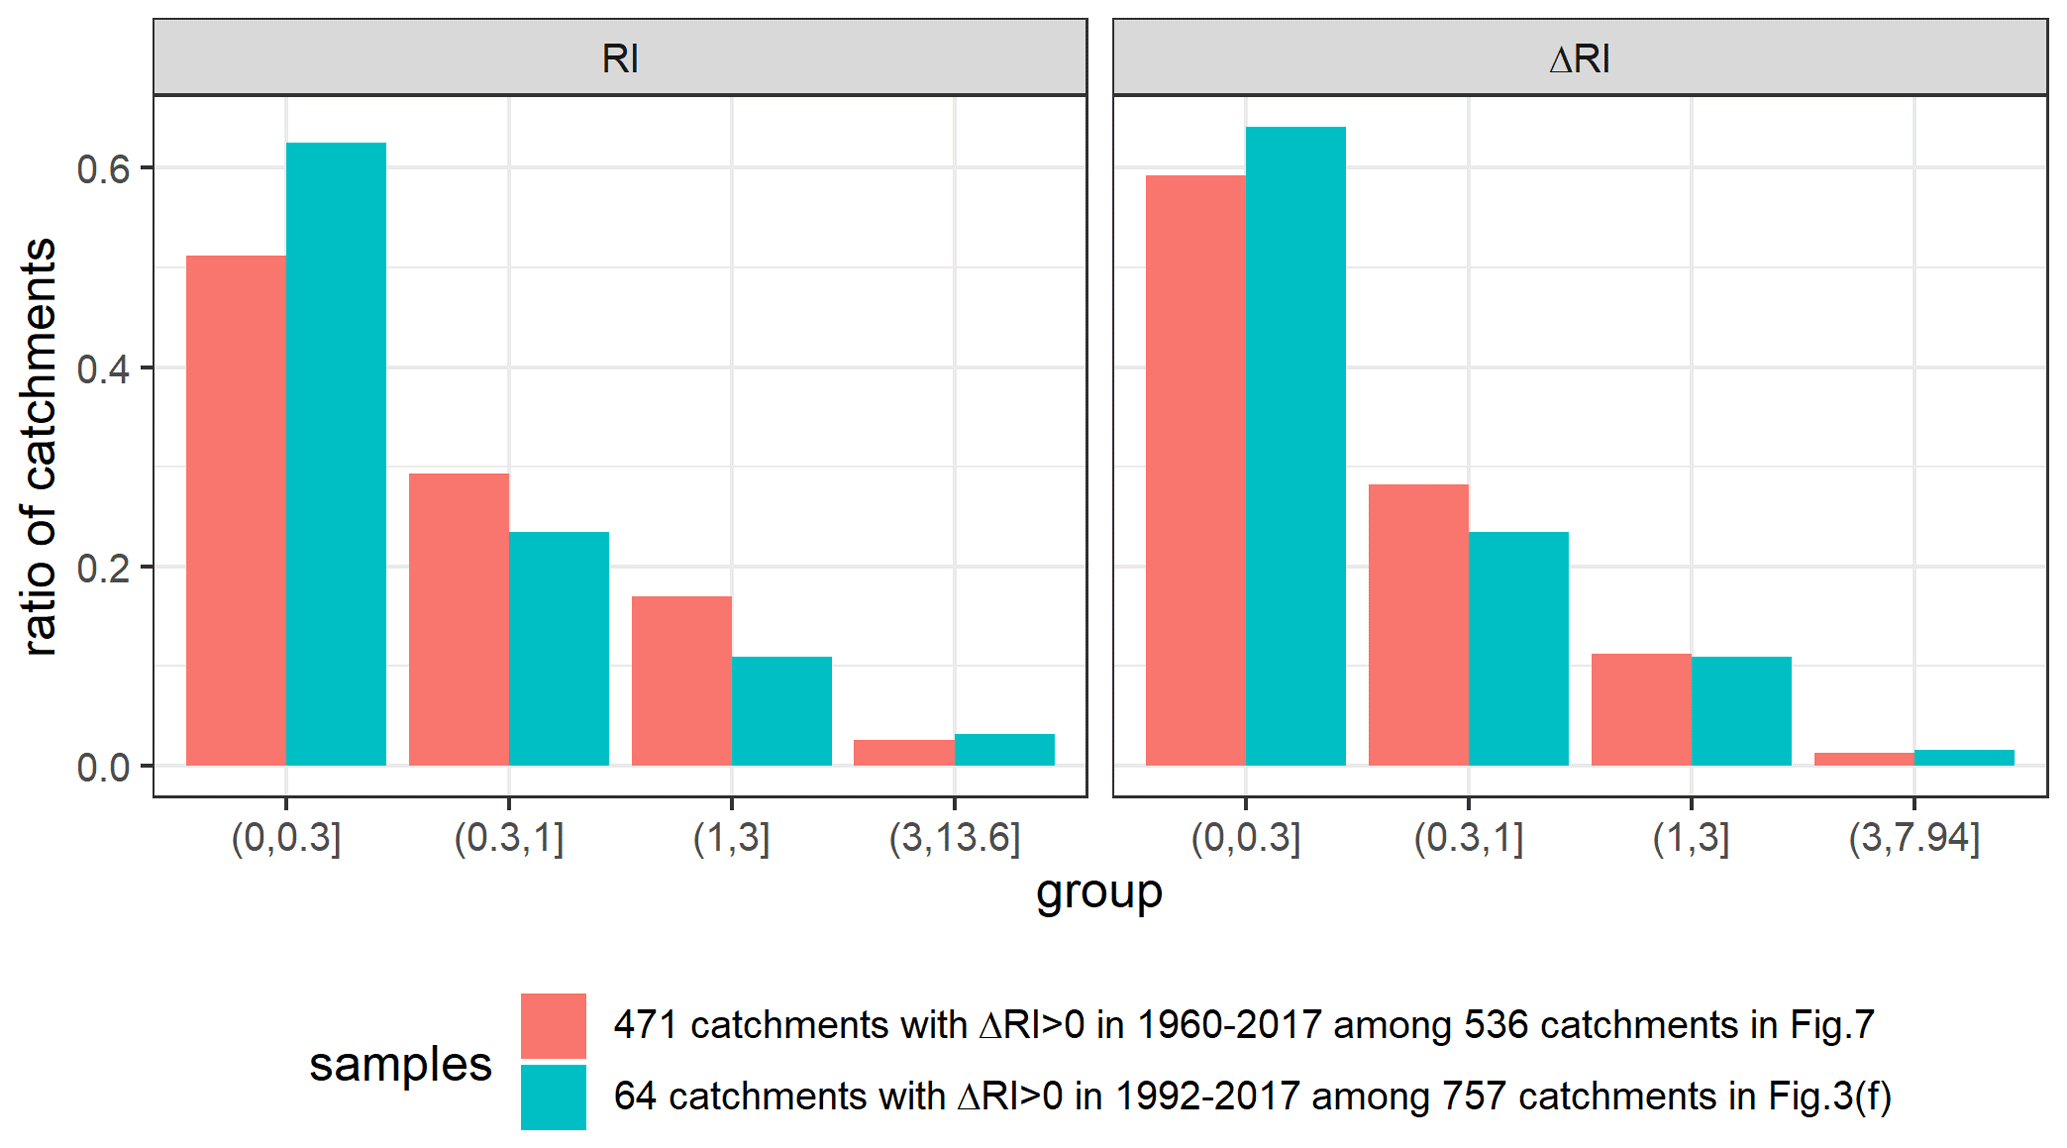
Figure A3Frequency distribution of RI and ΔRI in catchments with ΔRI>0 from two catchment sets: the one used for the regression in Fig. 3f (green) and the one used for the flood change attribution in Fig. 7 (red).
Annual maximum discharge data are obtained from the Water Resources Information Center of the Ministry of Water Resources in China (http://www.mwr.gov.cn/english/, last access: 7 May 2020) (MWR, 2020). CCI-LC data are obtained from the ESA Climate Change Initiative Land Cover project 2017 (http://maps.elie.ucl.ac.be/CCI/viewer/download.php, last access: 6 October 2020) (ESA, 2020). GRanD data are obtained from Global Dam Watch (http://globaldamwatch.org, last access: 26 February 2019) (GDW, 2019). Köppen–Geiger climate class data and MSWEP V2.2 precipitation data are obtained from GLOH2O (http://www.gloh2o.org/, last access: 18 March 2020) (GloH2O, 2020).
WY and HY designed the study. WY conducted the analysis and wrote the manuscript. HY reviewed and edited the manuscript. HY, DY, and AH provided support in the data acquisition. HY and DY contributed to the funding acquisition.
The authors declare that they have no conflict of interest.
We thank the editor and two reviewers for their comments and suggestions. We appreciate the support of colleagues from the Department of Hydraulic Engineering, Tsinghua University.
This research was partially supported by funding from the National Natural Science Foundation of China (grant nos. 51979140 and 41661144031), the State Key Laboratory of Hydro Science and Hydraulic Engineering of China (grant no. 2021-KY-04), the Scientific Research Project from the China Three Gorges Corporation (grant no. 202003098), and the National Program for Support of Top-notch Young Professionals.
This paper was edited by Louise Slater and reviewed by two anonymous referees.
Bai, P., Liu, X. M., Liang, K., and Liu, C. M.: Investigation of changes in the annual maximum flood in the Yellow River basin, China, Quatern. Int., 392, 168–177, https://doi.org/10.1016/j.quaint.2015.04.053, 2016.
Bassiouni, M., Vogel, R. M., and Archfield, S. A.: Panel regressions to estimate low-flow response to rainfall variability in ungaged basins, Water Resour. Res., 52, 9470–9494, https://doi.org/10.1002/2016wr018718, 2016.
Beck, H. E., Zimmermann, N. E., McVicar, T. R., Vergopolan, N., Berg, A., and Wood, E. F.: Present and future Koppen-Geiger climate classification maps at 1-km resolution, Sci. Data, 5, 180214, https://doi.org/10.1038/sdata.2018.214, 2018.
Beck, H. E., Wood, E. F., Pan, M., Fisher, C. K., Miralles, D. G., van Dijk, A. I. J. M., McVicar, T. R., and Adler, R. F.: MSWEP V2 Global 3-Hourly 0.1 degrees Precipitation: Methodology and Quantitative Assessment, B. Am. Meteorol. Soc., 100, 473–502, https://doi.org/10.1175/Bams-D-17-0138.1, 2019.
Bertola, M., Viglione, A., and Bloschl, G.: Informed attribution of flood changes to decadal variation of atmospheric, catchment and river drivers in Upper Austria, J. Hydrol., 577, 123919, https://doi.org/10.1016/j.jhydrol.2019.123919, 2019.
Blöschl, G., Hall, J., Viglione, A., Perdigao, R. A. P., Parajka, J., Merz, B., Lun, D., Arheimer, B., Aronica, G. T., Bilibashi, A., Bohac, M., Bonacci, O., Borga, M., Canjevac, I., Castellarin, A., Chirico, G. B., Claps, P., Frolova, N., Ganora, D., Gorbachova, L., Gul, A., Hannaford, J., Harrigan, S., Kireeva, M., Kiss, A., Kjeldsen, T. R., Kohnova, S., Koskela, J. J., Ledvinka, O., Macdonald, N., Mavrova-Guirguinova, M., Mediero, L., Merz, R., Molnar, P., Montanari, A., Murphy, C., Osuch, M., Ovcharuk, V., Radevski, I., Salinas, J. L., Sauquet, E., Sraj, M., Szolgay, J., Volpi, E., Wilson, D., Zaimi, K., and Zivkovic, N.: Changing climate both increases and decreases European river floods, Nature, 573, 108–111, https://doi.org/10.1038/s41586-019-1495-6, 2019.
Blöschl, G., Gaal, L., Hall, J., Kiss, A., Komma, J., Nester, T., Parajka, J., Perdigao, R. A. P., Plavcova, L., Rogger, M., Salinas, J. L., and Viglione, A.: Increasing river floods: fiction or reality?, Wires Water, 2, 329–344, https://doi.org/10.1002/wat2.1079, 2015.
Blum, A. G., Ferraro, P. J., Archfield, S. A., and Ryberg, K. R.: Causal Effect of Impervious Cover on Annual Flood Magnitude for the United States, Geophys. Res. Lett., 47, e2019GL086480, https://doi.org/10.1029/2019GL086480, 2020.
Cheng, S. J., Guan, X. D., Huang, J. P., Ji, F., and Guo, R. X.: Long-term trend and variability of soil moisture over East Asia, J. Geophys. Res.-Atmos., 120, 8658–8670, https://doi.org/10.1002/2015jd023206, 2015.
Davenport, F. V., Herrera-Estrada, J. E., Burke, M., and Diffenbaugh, N. S.: Flood Size Increases Nonlinearly Across the Western United States in Response to Lower Snow-Precipitation Ratios, Water Resour. Res., 56, e2019WR025571, https://doi.org/10.1029/2019WR025571, 2020.
De Niel, J. and Willems, P.: Climate or land cover variations: what is driving observed changes in river peak flows? A data-based attribution study, Hydrol. Earth Syst. Sci., 23, 871–882, https://doi.org/10.5194/hess-23-871-2019, 2019.
Di Baldassarre, G., Sivapalan, M., Rusca, M., Cudennec, C., Garcia, M., Kreibich, H., Konar, M., Mondino, E., Mard, J., Pande, S., Sanderson, M. R., Tian, F. Q., Viglione, A., Wei, J., Wei, Y. P., Yu, D. J., Srinivasan, V., and Bloschl, G.: Sociohydrology: Scientific Challenges in Addressing the Sustainable Development Goals, Water Resour. Res., 55, 6327–6355, https://doi.org/10.1029/2018wr023901, 2019.
Du, S. Q., He, C. Y., Huang, Q. X., and Shi, P. J.: How did the urban land in floodplains distribute and expand in China from 1992–2015?, Environ. Res. Let t., 13, 034018, https://doi.org/10.1088/1748-9326/aaac07, 2018.
Du, S. Q., Cheng, X. T., Huang, Q. X., Chen, R. S., Ward, P. J., and Aerts, J. C. J. H.: Brief communication: Rethinking the 1998 China floods to prepare for a nonstationary future, Nat. Hazards Earth Syst. Sci., 19, 715–719, https://doi.org/10.5194/nhess-19-715-2019, 2019.
ESA: http://maps.elie.ucl.ac.be/CCI/viewer/download.php, last access: 6 October 2020.
Ferreira, S. and Ghimire, R.: Forest cover, socioeconomics, and reported flood frequency in developing countries, Water Resour. Res., 48, W08529, https://doi.org/10.1029/2011wr011701, 2012.
FitzHugh, T. W. and Vogel, R. M.: The impact of dams on flood flows in the United States, River Res. Appl., 27, 1192–1215, https://doi.org/10.1002/rra.1417, 2011.
Gaure, S.: lfe: Linear group fixed effects, R package version 2.8-5.1, available at: https://cran.r-project.org/web/packages/lfe/index.html (last access: 13 October 2020), 2019.
GDW: http://globaldamwatch.org, last access: 26 February 2019.
GloH2O: High-resolution, bias-corrected weather data for the past, present, and future, available at: http://www.gloh2o.org/, last access: 18 March 2020.
Hodgkins, G. A., Dudley, R. W., Archfield, S. A., and Renard, B.: Effects of climate, regulation, and urbanization on historical flood trends in the United States, J. Hydrol., 573, 697–709, https://doi.org/10.1016/j.jhydrol.2019.03.102, 2019.
Jehn, F. U., Bestian, K., Breuer, L., Kraft, P., and Houska, T.: Using hydrological and climatic catchment clusters to explore drivers of catchment behavior, Hydrol. Earth Syst. Sci., 24, 1081–1100, https://doi.org/10.5194/hess-24-1081-2020, 2020.
Kundzewicz, Z. W., Su, B. D., Wang, Y. J., Xia, J., Huang, J. L., and Jiang, T.: Flood risk and its reduction in China, Adv. Water Resour., 130, 37–45, https://doi.org/10.1016/j.advwatres.2019.05.020, 2019.
Lehner, B., Liermann, C. R., Revenga, C., Vorosmarty, C., Fekete, B., Crouzet, P., Doll, P., Endejan, M., Frenken, K., Magome, J., Nilsson, C., Robertson, J. C., Rodel, R., Sindorf, N., and Wisser, D.: High-resolution mapping of the world's reservoirs and dams for sustainable river-flow management, Front. Ecol. Environ., 9, 494–502, https://doi.org/10.1890/100125, 2011.
Levy, M. C., Lopes, A. V., Cohn, A., Larsen, L. G., and Thompson, S. E.: Land Use Change Increases Streamflow Across the Arc of Deforestation in Brazil, Geophys. Res. Lett., 45, 3520–3530, https://doi.org/10.1002/2017gl076526, 2018.
Lu, W. W., Lei, H. M., Yang, D. W., Tang, L. H., and Miao, Q. H.: Quantifying the impacts of small dam construction on hydrological alterations in the Jiulong River basin of Southeast China, J. Hydrol., 567, 382–392, https://doi.org/10.1016/j.jhydrol.2018.10.034, 2018.
Mann, H. B.: Nonparametric Tests Against Trend, Econometrica, 13, 245–259, https://doi.org/10.2307/1907187, 1945.
McManamay, R. A.: Quantifying and generalizing hydrologic responses to dam regulation using a statistical modeling approach, J. Hydrol., 519, 1278–1296, https://doi.org/10.1016/j.jhydrol.2014.08.053, 2014.
Merz, B., Vorogushyn, S., Uhlemann, S., Delgado, J., and Hundecha, Y.: HESS Opinions “More efforts and scientific rigour are needed to attribute trends in flood time series”, Hydrol. Earth Syst. Sci., 16, 1379–1387, https://doi.org/10.5194/hess-16-1379-2012, 2012.
Merz, R., Tarasova, L., and Basso, S.: The flood cooking book: ingredients and regional flavors of floods across Germany, Environ. Res. Lett., 15, 114024, https://doi.org/10.1088/1748-9326/abb9dd, 2020.
Mogollón, B., Frimpong, E. A., Hoegh, A. B., and Angermeier, P. L.: Recent Changes in Stream Flashiness and Flooding, and Effects of Flood Management in North Carolina and Virginia, J. Am. Water Resour. Assoc., 52, 561–577, https://doi.org/10.1111/1752-1688.12408, 2016.
Müller, M. F. and Levy, M. C.: Complementary Vantage Points: Integrating Hydrology and Economics for Sociohydrologic Knowledge Generation, Water Resour. Res., 55, 2549–2571, https://doi.org/10.1029/2019wr024786, 2019.
MWR: http://www.mwr.gov.cn/english/, last access: 7 May 2020.
Pande, S. and Sivapalan, M.: Progress in socio-hydrology: a meta-analysis of challenges and opportunities, Wires Water, 4, e1193, https://doi.org/10.1002/wat2.1193, 2017.
Pearl, J. and Mackenzie, D.: The book of why: the new science of cause and effect, Basic Books, New York, 2020.
Peña, L. E., Barrios, M., and Frances, F.: Flood quantiles scaling with upper soil hydraulic properties for different land uses at catchment scale, J. Hydrol., 541, 1258–1272, https://doi.org/10.1016/j.jhydrol.2016.08.031, 2016.
Pettitt, A. N.: A Non-Parametric Approach to the Change-Point Problem, Appl. Stat., 28, 126–135, https://doi.org/10.2307/2346729, 1979.
Prosdocimi, I., Kjeldsen, T. R., and Miller, J. D.: Detection and attribution of urbanization effect on flood extremes using nonstationary flood-frequency models, Water Resour. Res., 51, 4244–4262, https://doi.org/10.1002/2015wr017065, 2015.
R Core Team: R: A Language and Environment for Statistical Computing, R Foundation for Statistical Computing, Vienna, Austria, available at: http://www.R-project.org (last access: 13 October 2020), 2019.
Reynolds, A. P., Richards, G., de la Iglesia, B., and Rayward-Smith, V. J.: Clustering Rules: A Comparison of Partitioning and Hierarchical Clustering Algorithms, J. Math. Model. Algorit., 5, 475–504, https://doi.org/10.1007/s10852-005-9022-1, 2006.
Rogger, M., Agnoletti, M., Alaoui, A., Bathurst, J. C., Bodner, G., Borga, M., Chaplot, V., Gallart, F., Glatzel, G., Hall, J., Holden, J., Holko, L., Horn, R., Kiss, A., Kohnova, S., Leitinger, G., Lennartz, B., Parajka, J., Perdigao, R., Peth, S., Plavcova, L., Quinton, J. N., Robinson, M., Salinas, J. L., Santoro, A., Szolgay, J., Tron, S., van den Akker, J. J. H., Viglione, A., and Bloschl, G.: Land use change impacts on floods at the catchment scale: Challenges and opportunities for future research, Water Resour. Res., 53, 5209–5219, https://doi.org/10.1002/2017wr020723, 2017.
Runge, J., Bathiany, S., Bollt, E., Camps-Valls, G., Coumou, D., Deyle, E., Glymour, C., Kretschmer, M., Mahecha, M. D., Munoz-Mari, J., van Nes, E. H., Peters, J., Quax, R., Reichstein, M., Scheffer, M., Scholkopf, B., Spirtes, P., Sugihara, G., Sun, J., Zhang, K., and Zscheischler, J.: Inferring causation from time series in Earth system sciences, Nat. Commun., 10, 2553, https://doi.org/10.1038/s41467-019-10105-3, 2019.
Stein, L., Pianosi, F., and Woods, R.: Event-based classification for global study of river flood generating processes, Hydrol. Process., 34, 1514–1529, https://doi.org/10.1002/hyp.13678, 2020.
Steinschneider, S., Yang, Y. C. E., and Brown, C.: Panel regression techniques for identifying impacts of anthropogenic landscape change on hydrologic response, Water Resour. Res., 49, 7874–7886, https://doi.org/10.1002/2013wr013818, 2013.
Umer, Y. M., Jetten, V. G., and Ettema, J.: Sensitivity of flood dynamics to different soil information sources in urbanized areas, J. Hydrol., 577, 123945, https://doi.org/10.1016/j.jhydrol.2019.123945, 2019.
Viglione, A., Merz, B., Dung, N. V., Parajka, J., Nester, T., and Bloschl, G.: Attribution of regional flood changes based on scaling fingerprints, Water Resour. Res., 52, 5322–5340, https://doi.org/10.1002/2016wr019036, 2016.
Villarini, G. and Slater, L.: Climatology of Flooding in the United States, Oxford Research Encyclopedia of Natural Hazard Science, Oxford, 2017.
Wang, W., Li, H. Y., Leung, L. R., Yigzaw, W., Zhao, J. S., Lu, H., Deng, Z. Q., Demisie, Y., and Bloschl, G.: Nonlinear Filtering Effects of Reservoirs on Flood Frequency Curves at the Regional Scale, Water Resour. Res., 53, 8277–8292, https://doi.org/10.1002/2017wr020871, 2017.
Wooldridge, J. M.: Introductory econometrics a modern approach, 6th Edn., Cengage Learning, Boston, USA, 2016.
Wu, Y. J., Wu, S. Y., Wen, J. H., Xu, M., and Tan, J. G.: Changing characteristics of precipitation in China during 1960–2012, Int. J. Climatol., 36, 1387–1402, https://doi.org/10.1002/joc.4432, 2016.
Yamazaki, D., Ikeshima, D., Sosa, J., Bates, P. D., Allen, G. H., and Pavelsky, T. M.: MERIT Hydro: A High-Resolution Global Hydrography Map Based on Latest Topography Dataset, Water Resour. Res., 55, 5053–5073, https://doi.org/10.1029/2019wr024873, 2019.
Yang, L., Villarini, G., Smith, J. A., Tian, F. Q., and Hu, H. P.: Changes in seasonal maximum daily precipitation in China over the period 1961–2006, Int. J. Climatol., 33, 1646–1657, https://doi.org/10.1002/joc.3539, 2013.
Yang, L., Wang, L. C., Li, X., and Gao, J.: On the flood peak distributions over China, Hydrol. Earth Syst. Sci., 23, 5133–5149, https://doi.org/10.5194/hess-23-5133-2019, 2019.
Yang, W. C., Yang, H. B., and Yang, D. W.: Classifying floods by quantifying driver contributions in the Eastern Monsoon Region of China, J. Hydrol., 585, 124767, https://doi.org/10.1016/j.jhydrol.2020.124767, 2020.
Yang, X. N., Sun, W. Y., Mu, X. M., Gao, P., and Zhao, G. J.: Run-off affected by climate and anthropogenic changes in a large semi-arid river basin, Hydrol. Process., 34, 1906–1919, https://doi.org/10.1002/hyp.13702, 2020.
Zhao, G., Bates, P., and Neal, J.: The Impact of Dams on Design Floods in the Conterminous US, Water Resour. Res., 56, e2019WR025380, https://doi.org/10.1029/2019WR025380, 2020.