the Creative Commons Attribution 4.0 License.
the Creative Commons Attribution 4.0 License.
 | 19 Mar 2021
Coordination and control – limits in standard representations of multi-reservoir operations in hydrological modeling
Patrick M. Reed
Danielle S. Grogan
Shan Zuidema
Alexander Prusevich
Stanley Glidden
Jonathan R. Lamontagne
Richard B. Lammers
Major multi-reservoir cascades represent a primary mechanism for dealing with hydrologic variability and extremes within institutionally complex river basins worldwide. These coordinated management processes fundamentally reshape water balance dynamics. Yet, multi-reservoir coordination processes have been largely ignored in the increasingly sophisticated representations of reservoir operations within large-scale hydrological models. The aim of this paper is twofold, namely (i) to provide evidence that the common modeling practice of parameterizing each reservoir in a cascade independently from the others is a significant approximation and (ii) to demonstrate potential unintended consequences of this independence approximation when simulating the dynamics of hydrological extremes in complex reservoir cascades. We explore these questions using the Water Balance Model, which features detailed representations of the human infrastructure coupled to the natural processes that shape water balance dynamics. It is applied to the Upper Snake River basin in the western US and its heavily regulated multi-reservoir cascade. We employ a time-varying sensitivity analysis that utilizes the method of Morris factor screening to explicitly track how the dominant release rule parameters evolve both along the cascade and in time according to seasonal high- and low-flow events. This enables us to address aim (i) by demonstrating how the progressive and cumulative dominance of upstream releases significantly dampens the ability of downstream reservoir rules' parameters to influence flow conditions. We address aim (ii) by comparing simulation results with observed reservoir operations during critical low-flow and high-flow events in the basin. Our time-varying parameter sensitivity analysis with the method of Morris clarifies how independent single-reservoir parameterizations and their tacit assumption of independence leads to reservoir release behaviors that generate artificial water shortages and flooding, whereas the observed coordinated cascade operations avoided these outcomes for the same events. To further explore the role of (non-)coordination in the large deviations from the observed operations, we use an offline multi-reservoir water balance model in which adding basic coordination mechanisms drawn from the observed emergency operations is sufficient to correct the deficiencies of the independently parameterized reservoir rules from the hydrological model. These results demonstrate the importance of understanding the state–space context in which reservoir releases occur and where operational coordination plays a crucial role in avoiding or mitigating water-related extremes. Understanding how major infrastructure is coordinated and controlled in major river basins is essential for properly assessing future flood and drought hazards in a changing world.
- Article
(4532 KB) - Full-text XML
-
Supplement
(6106 KB) - BibTeX
- EndNote


The cumulative impacts of reservoir cascades on river flows has been recognized and demonstrated worldwide by early global hydrological models (Dynesius and Nilsson, 1994; Vörösmarty et al., 1997). Since then, these findings, frequently corroborated in the literature (e.g., Nilsson et al., 2005; Adam et al., 2007; Döll et al., 2009; Biemans et al., 2011; Grill et al., 2019), have taken a new significance with the planned or ongoing construction of more than 3700 major dams, most of them in the Global South (Zarfl et al., 2015). This new wave of dam construction cements the role of artificial reservoirs as key actors on the global hydrological cycle. A striking illustration of this fact is the cumulative consequences of building multiple dams on river flow regimes, ecosystem benefits or sediment transport in previously relatively undammed major river basins such as the Amazon (Latrubesse et al., 2017; Timpe and Kaplan, 2017) or the Mekong (Schmitt et al., 2018).
In parallel, and as a response to evolving flood and drought risks in a changing world, communities involved in large-scale hydrological modeling aim to address the challenges posed by representing, monitoring and forecasting these risks at fine resolutions in both space and time (Wood et al., 2011; Bierkens, 2015). For high-resolution modeling of multiple reservoir systems, reservoirs should not be lumped together, but their individual impacts on system dynamics should rather be carefully accounted for (Shin et al., 2019). In this context, better representations of how human societies (mis-)manage their water resources needs to be integrated in these models (Wada et al., 2017), especially since state-of-the-art models currently yield mixed results for the modeling of monthly extremes (Zaherpour et al., 2018). There remain opportunities for research to determine which aspects of human management are most urgent to integrate in standard reservoir representations. One such aspect is coordination between reservoirs, long-recognized as a key aspect of water management (e.g., Loucks and van Beek, 2005; Marques and Tilmant, 2013; Jeuland et al., 2014; Quinn et al., 2019). Multi-reservoir coordination implies that release decisions at each reservoir in the basin are explicitly influenced by the current and future state of other reservoirs. So far, such behavior has not been implemented in release rules for large-scale hydrological models. It is not clear to which extent this can be related to results from a recent intermodel comparison by Masaki et al. (2017), who found discrepancies between models when representing flows across large reservoir cascades. This echoes an earlier study that found a deteriorating goodness of fit of monthly releases along such cascades (Adam et al., 2007).
The present study uses a diagnostic analysis of the implication of non-coordinated parameterizations for reservoir release decisions to (i) provide evidence that the common modeling practice of parameterizing each reservoir in a cascade independently from the others is a significant approximation and to (ii) demonstrate potential unintended consequences of this independence approximation when simulating the dynamics of hydrological extremes in complex reservoir cascades. We focus on a highly resolved model of the Upper Snake River basin (USRB) – with 30′′ (approximately 780 m) spatial resolution for an average grid cell of about 0.6 km2 and a daily time step – that encompasses a total of 128 reservoirs in the western US. Our model-based representation of the USRB exploits the Water Balance Model (WBM; e.g., Wisser et al., 2010), which is well suited for regional- or global-scale hydrological assessments (e.g., Wisser et al., 2008; Grogan et al., 2017) and includes a representation of human impacts on the water cycle. The remainder of this introduction reviews reservoir representations in hydrological models, including their use for flood and drought modeling, and key aspects of our contributed diagnostic assessment.
Early attempts at representing artificial reservoirs modeled them as natural reservoirs (i.e., lakes; Meigh et al., 1999; Coe, 2000; Döll et al., 2003). In 2006, representations proposed separately by Haddeland et al. (2006) and Hanasaki et al. (2006) introduced the idea that artificial reservoirs should have a distinct parameterization that reflects the reservoir's purpose, leading to two different kinds of reservoir representations (Nazemi and Wheater, 2015). Haddeland et al. (2006) optimize release for the upcoming year, assuming future inflows are known, and follow a management objective in line with the reservoir's primary purpose. This optimization-based scheme has been extended in several studies, most notably van Beek et al. (2011), who replaced perfect foresight of the next year's inflows with an uncertain forecast (for other improvements, see also Adam et al., 2007; Wada et al., 2014). Alternatively, Hanasaki et al. (2006) propose a parameterization that simulates releases based on a set of site-specific parameters such as long-term average inflow, reservoir capacity and beginning-of-year storage and downstream water demands. There exist several refinements of this rule, which include changing the definition of what constitutes downstream demand (Döll et al., 2009), considering more reservoir purposes (Biemans et al., 2011; Yoshikawa et al., 2014), allowing the reservoir's primary purpose to vary seasonally (Voisin et al., 2013a) or proposing a general rule for differentiating refill and drawdown seasons for large multipurpose reservoirs (Wisser et al., 2010).
This first generation of reservoir representation has led to improved simulations of historically observed discharge at the monthly timescale (Pokhrel et al., 2012; Li et al., 2015; Veldkamp et al., 2018). It has been integrated into increasingly complex modeling frameworks. For instance, the rule first proposed for a global flow routing model by Hanasaki et al. (2006) has been integrated as part of the global hydrological model H08 (Hanasaki et al., 2008), which has then been integrated into a land surface model that models the carbon, energy and water cycles (Pokhrel et al., 2012). Similarly, the rule proposed by Voisin et al. (2013a) has been incorporated into increasingly complex modeling frameworks accounting for regional-scale feedbacks between climate, socioeconomic systems and heavily managed water, energy and food systems (Voisin et al., 2013b; Kraucunas et al., 2015). As the models including these reservoir representations have grown more complex, so have the questions asked of them. Applications typically include assessments of past and present water withdrawals and human impacts on hydrology, water stress and scarcity (e.g., Biemans et al., 2011; Wada et al., 2011, 2014; Yoshikawa et al., 2014; Hanasaki et al., 2018; Liu et al., 2019; Meza et al., 2019). Recently, modeling frameworks have been extended to include water quality (Wanders et al., 2019) or economic appraisals of the consequences of scarcity (Bierkens et al., 2019). These models are also increasingly being used for appraisals of future water scarcity under integrated socioeconomics and climatic scenarios (e.g., Hanasaki et al., 2013; Hejazi et al., 2015; Jägermeyr et al., 2016; Herbert and Döll, 2019).
Reservoir management is also critical for understanding flooding, where simulations must resolve much finer timescales (i.e., daily or shorter). Reservoir rules like those of Hanasaki et al. (2006) can be modified to be applied with a daily time step to investigate the potential of reservoir management to alleviate flooding (Mateo et al., 2014) or be modified to better model the periods when reservoirs are nearly full (Shin et al., 2019). Large-scale or global flooding assessments are made more complex by the fact that hydrologic routing by itself is insufficient for floodplain modeling (e.g., Sampson et al., 2015; Schumann et al., 2016). In this context, a good first approximation to account for reservoirs is to allocate flood storage capacity following an extreme precipitation event, especially since this alone can dramatically alter a flood's outcome (Metin et al., 2018). Yet, subtle changes in flood management by reservoirs can have decisive impacts, both in theory (Najibi et al., 2017) and in observed catastrophic flooding events like in Kerala (southern India) in 2018 (Mishra et al., 2018). A finer assessment of the capacity of reservoirs for flood management involves explicit consideration of the multipurpose nature of reservoirs, as they often are assigned flood control duties on top of other uses. To achieve this, the representation proposed in LISFLOOD by Burek et al. (2013) partitions storage into different compartments; Zajac et al. (2017) demonstrated the merits of this formulation for flood impact assessment at the global scale.
Similar to Burek et al. (2013), several representations of varying complexity have been proposed to divide active storage capacity into several compartments, both to obtain sensible operations at submonthly time steps and to account for the fact that most reservoirs are inherently multipurpose installations (Wu and Chen, 2012; Zhao et al., 2016; Wang et al., 2019; Yassin et al., 2019). Another way to account for the complex nature of operations at a daily time step has been to directly emulate observed operations using machine learning techniques (Ehsani et al., 2016; Coerver et al., 2018). Both types of approaches have also been implemented in the search for representations that can adapt to evolving climate conditions (Ehsani et al., 2016; Zhao et al., 2016). Thus, Ehsani et al. (2017) demonstrated the role of reservoir storage in alleviating the impacts of both floods and droughts under a changing climate in the northeastern US.
It is worth noting, however, that all of the reservoir representations discussed above do not account for coordination within multi-reservoir systems. In other words, consequences of a release decision on downstream reservoir levels (and management objectives) are not considered. To date, there has not been a carefully designed diagnostic model evaluation of the implications of errors in representing actual human coordination and controls in high-impact, complex river basin contexts. This study links observed operations for recent high- and low-flow events in the USRB's reservoir cascade to clarify how standard representations of release rules capture the underlying coupled human–natural processes that are critical for model-based assessments of our vulnerabilities to extremes. The diagnostic model evaluation approach used in this work employs a time-varying sensitivity analysis (e.g., Reusser and Zehe, 2011; Herman et al., 2013b; Guse et al., 2014; Pianosi and Wagener, 2016; Lamontagne et al., 2019; Quinn et al., 2019). Building on prior successful diagnostic model evaluation studies, our sensitivity analysis is based on the factor screening capabilities of the method of Morris (Morris, 1991; Campolongo et al., 2007), which requires significantly less computation time than other methods while providing high-fidelity measures of model controls (Herman et al., 2013a; Iooss and Lemaître, 2015). We explicitly map how reservoir rule parameterizations relate to the impacts of model behavior across the successive reservoirs within the USRB cascade at a daily timescale. To isolate the impacts of (not) including coordination in reservoir release rules, we complete the analysis with simple offline water balance models in which we add simple coordination mechanisms similar to the ones we observed in recent real-world operations of the USRB's multi-reservoir cascade.
This diagnostic assessment exploits the Water Balance Model with a simulation-based parametric release rule introduced by Proussevitch et al. (2013) and incorporated into the WBM in several recent large-scale assessments (Grogan et al., 2015, 2017; Zaveri et al., 2016; Liu et al., 2017). This representation is state of the art in its ability to reproduce the climatological daily water balance of a single reservoir over the year with high accuracy. The possibility to use different parameterizations, depending on the reservoir's perceived use and behavior and the fact that release behavior structurally depends on storage level, is a feature that captures the advanced reservoir representations currently in use in other models. Note that we do not seek to validate this release rule but, rather, to use it as a typical example of release rule abstractions in large-scale hydrological models in that it does not feature a direct coordination between reservoirs' release decisions.
The rest of this work is structured as follows. Section 2 presents the study area and model used for the analysis, including a detailed explanation of the reservoir rule. Section 3 introduces and justifies the methodological aspects of the analysis. Section 4 presents the results from the diagnostic approach. Sections 5 and 6 discuss the implications of our findings and our overall concluding remarks.
2.1 The Upper Snake River basin
The Snake River originates east of the Teton Range in western Wyoming, then crosses the mountains into the Snake River Plain in southern Idaho. After flowing west through the entirety of that plain, it flows north to join the Columbia River. This work focuses on the Upper Snake River basin (USRB; Fig. 1), which has a drainage area of about 92 000 km2 and is characterized by a snow-dominated, semi-arid climate. To ensure water availability for the whole agricultural season, the US Bureau of Reclamation has built and operated a network of reservoirs, canals and lateral distribution ditches since the early 20th century (US Bureau of Reclamations, 2012). Since then, a diverse array of demands, including hydropower, irrigation, ecological conservation and downstream water allocation, has increasingly required the USRB to be extensively managed with a network of dams of a broad range of sizes, including 128 reservoirs of over 10 hm3 (10 million m3) throughout the basin for a total volume of 6.93 km3. Its waters are over-allocated across the USRB's competing demands (McGuire et al., 2006). The over-allocation is at least partially the result of historical perceptions of water availability, where the 20th century was wet compared with previous centuries (Wise, 2010). In fact, water availability is decreasing (Ahmadalipour and Moradkhani, 2017), forcing farmers to adapt to drier conditions (Hoekema and Sridhar, 2011). These drying trends are expected to worsen with climate change, especially as this will be accompanied by an increasing mismatch between seasonal patterns of water availability and use (Hamlet and Lettenmaier, 1999; Rauscher et al., 2008; Wise, 2012).
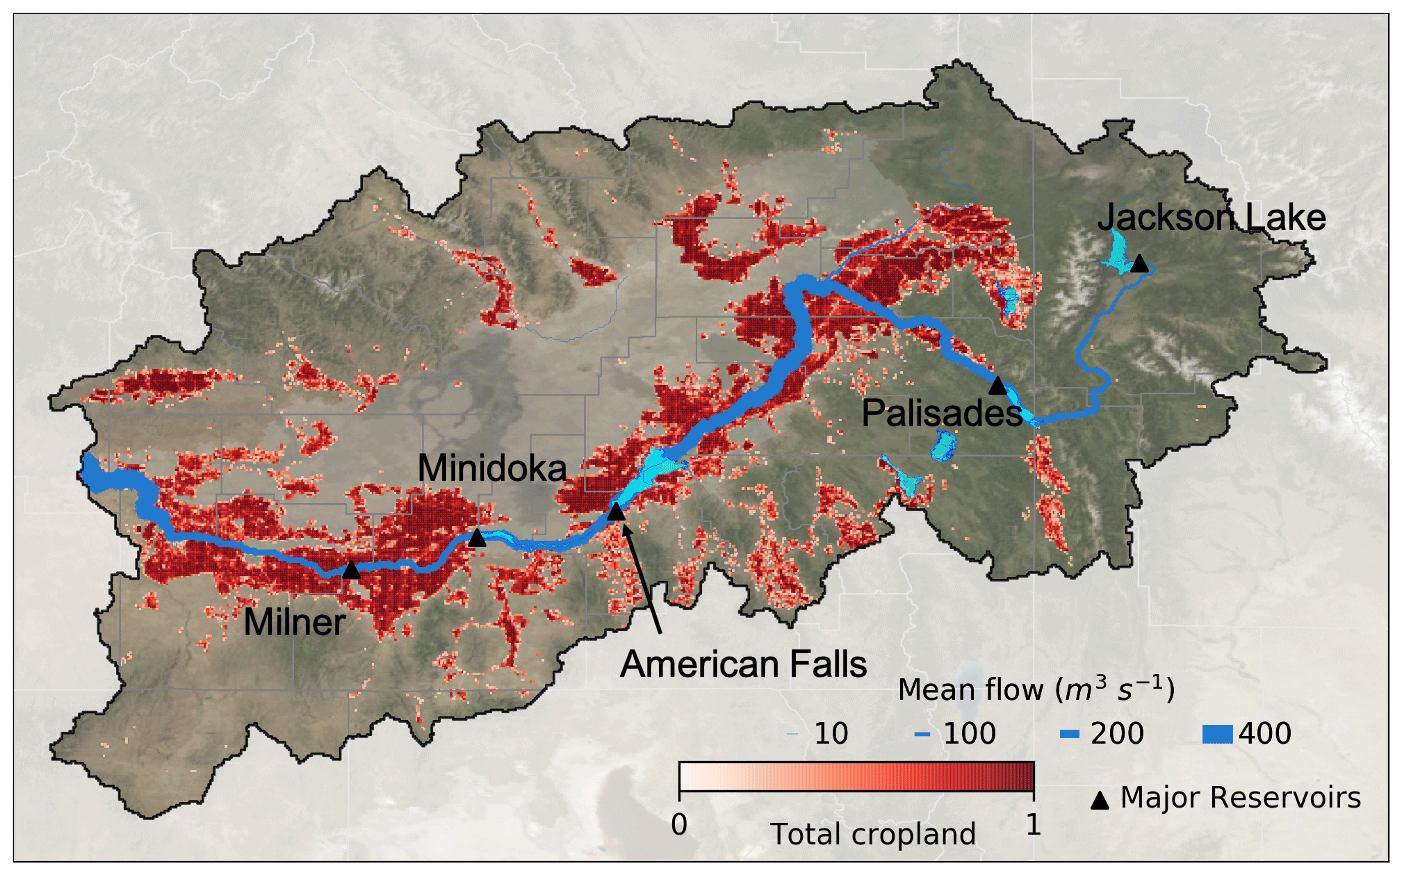
Figure 1Upper Snake River basin (USRB) with the five reservoirs on the main stem of the Snake River.
The USRB is also vulnerable to rain on snow events that can lead to extreme flooding. These events are a common occurrence in the wider US northwest and are expected to worsen in the future (Musselman et al., 2018). In the USRB, a historically significant flood that caused widespread damage occurred in February 1962, with rainfall on frozen ground following a particularly cold spell (Thomas and Lamke, 1962). This was despite the recent completion of the Palisades Dam, giving the Minidoka Project a significant ability to coordinate storage capacity for both water supply and flood control. Following this event, the USRB was also the site of the Teton Dam failure in 1976 (Independent Panel To Review Cause of Teton Dam Failure, 1976). All of these characteristics – heavy reliance on institutionally coordinated reservoir management in a drought- and flood-prone area that has experienced the consequences of dam failure and where water extremes are expected to worsen with climate change – make the USRB a particularly relevant basin for studying the representation of reservoirs within large-scale hydrological models. Any unintended consequences from modeling non-coordinated operations would be a note of caution for large-scale studies featuring water infrastructure balancing protection against water extremes with other competing uses.
2.2 The Water Balance Model
The University of New Hampshire Water Balance Model (WBM; Fig. 2) is a process-based, modular, gridded hydrologic model that simulates spatially and temporally varying water volume and water quality across a wide range of spatial domains, from global half-degree grid cell resolution (e.g., Grogan et al., 2017) to local 120 m grid cells (Stewart et al., 2011). The WBM represents all major land surface components of the hydrological cycle and tracks fluxes and balances between the atmosphere, aboveground water storage (e.g., snowpack and glaciers), soil, vegetation, groundwater and local runoff. A digitized river network connects grid cells, enabling the simulation of flow through the river and groundwater systems and the simulation of water temperature (Stewart et al., 2013). Direct human influences on the water cycle include domestic, industrial and agricultural (irrigation and livestock) water demand and use and the impacts of impervious surfaces. The WBM accounts for the operation of dams and reservoirs (Wisser et al., 2010), inter-basin hydrological transfers (Zaveri et al., 2016) and agricultural water use from irrigation (Wisser et al., 2010; Grogan et al., 2015, 2017; Grogan, 2016; Zaveri et al., 2016; Zuidema et al., 2020). Additionally, new WBM modules have been developed recently to include the use of sub-grid elevation band distributions derived from a high-resolution elevation data set to improve handling of snowpack in mountainous regions.

2.3 WBM representation of the USRB
A drainage network of the USRB that covered an area of 92 900 km2 (compared to US Geological Survey, USGS, estimate of 92 700 km2) was developed at a spatial resolution of 30′′ (approximately 780 m), based on HydroSHEDS (Lehner et al., 2008) and corrected to better represent drainage as mapped by the USGS National Hydrography Dataset (https://nhd.usgs.gov, last access: 16 April 2019). Reservoir data were derived from the National Inventory of Dams (https://nid.usace.army.mil, last access: 16 January 2020). We manually added the dams and updated reservoir capacities, locations and upstream drainage areas. The WBM simulations used gridMET (Abatzoglou, 2013), for contemporary precipitation and temperature, and Modern-Era Retrospective Analysis for Research and Applications, version 2 (MERRA2; Gelaro et al., 2017), for open water evaporation, wind speed, relative humidity, leaf area index and albedo, to calculate potential evapotranspiration following Monteith (1965). Snow accumulation and melt followed the temperature-index-based formulation of Willmott et al. (1985). Human population density, which controls both domestic and industrial water demand, came from the Gridded Population of the World (GPW) data set (Center For International Earth Science Information Network – CIESIN – Columbia University, 2016). The WBM used Food and Agricultural Organization (FAO) estimates of livestock density for cattle (Steinfeld et al., 2006) at 5 min resolution, following Wisser et al. (2010). These data compared favorably with the US Department of Agriculture's (USDA) National Agricultural Summary Statistics (NASS) for 2005 but exhibit more realistic spatial variability than county-level averages. USDA Soil SURvey GeOgraphic (SSURGO) data parameterized available water capacity for the USRB.
WBM uses an adaptation of the FAO irrigation and drainage paper (Allen et al., 1998) to estimate crop water requirements based on potential evapotranspiration, soil moisture and a crop coefficient (kc) that defines a particular crop's water use efficiency. Details regarding the crop water demand calculations are provided in previous works (Grogan et al., 2017; Wisser et al., 2010). This study used the US Department of Agriculture's Cropland Data Layer (CDL) estimates of crop types (and land cover) at 30 m resolution (Han et al., 2012), aggregated by surface area averaging and remapped to a consistent group of crops as monthly irrigated and rainfed crop areas (MIRCA) crops (Portmann et al., 2010). We applied kc, planting dates and crop depletion factors from MIRCA to the CDL crop fractions. Open water, impervious area and wetland data also came from CDL data. Process-based representation of irrigation technology was recently introduced to the WBM, following key aspects of the formulation of Jägermeyr et al. (2015). Irrigation technologies used in the USRB varied by county, following Maupin et al. (2014) and Dieter et al. (2018). Additional details regarding the specific implementation of irrigation technologies will be reported in a separate paper.
2.4 Reservoir representation within WBM
The WBM's release rule for managed reservoirs expresses daily release as a fraction of long-term (5 years or more) mean release at the reservoir, as illustrated in Fig. 3. This is a refined convention for release rules within hydrological models (Hanasaki et al., 2006; Wisser et al., 2010) to be primarily controlled by instantaneous reservoir storage and purpose rather than statistics on the probability distribution of inflow rates. The WBM's reservoir module operates on an hourly time step to closely follow storage variations and yield a daily release total. The general form of the reservoir rule was first presented by Proussevitch et al. (2013) and validated using the GRanD database (Lehner et al., 2011). Variants of this rule have been used with a daily time step on the Niger river basin (Oyerinde et al., 2016) and with large-scale assessments using WBM (Grogan et al., 2015, 2017; Zaveri et al., 2016; Liu et al., 2017). The fine-tuning of the parameters, when establishing this version of the rule, was made using a set of 22 large North American and Eurasian reservoirs in offline mode, including the two largest reservoirs in the USRB (Palisades and American Falls; daily release Nash–Sutcliffe efficiency (NSE) coefficients of 0.70 and 0.60, respectively). Similar to what happens when a reservoir rule that classifies reservoirs by purpose is used in a large-scale model, we did not fine-tune the rule to each reservoir. This allows us to use the reservoir rule in conditions that are similar to what is done in most state-of-the-art hydrological models.
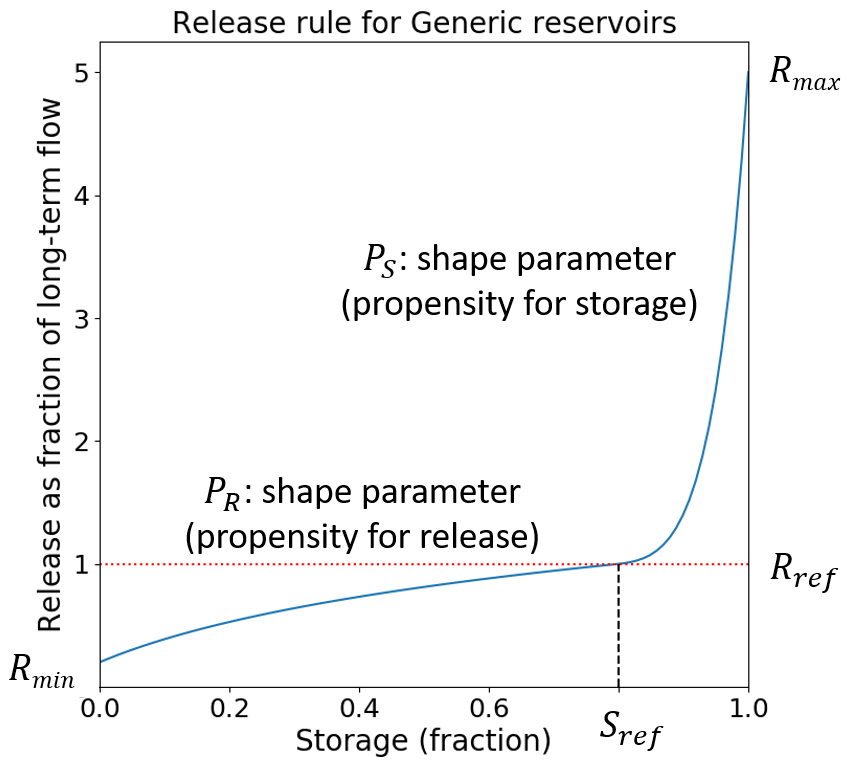
Figure 3A six-parameter reservoir rule. Release is scaled by long-term annual inflow, while storage is scaled by the active capacity; it is 0 at dead storage and 1 at full storage.
In the WBM's release rule, there are structurally different behaviors delimited by a reference storage, Sref, below which the priority is to refill the dam and above which release levels increase rapidly as the reservoir becomes nearly full. We call Rref the release at reference storage. For storage S<Sref, the rule designed to favor filling the reservoir expresses release R, a logarithmic function of storage S, as follows:
where Rmin is release at minimal storage, and PR is a shape parameter for the logarithmic part of the rule that controls the propensity for release. Indeed, PR close to zero leads to an almost linear rule, whereas the higher PR, the more release comes close to Rref even for near-empty storage. For S≥Sref, release R varies exponentially with storage S as follows:
where Rmax is release at full storage and ΔS is computed from the other parameters to ensure that the transition between the logarithmic and exponential parts of the release rule is smooth (continuously differentiable). The exponential shape parameter PS is the propensity for storage since it minimizes releases until storage is close to its maximal level.
Thus, there are six parameters for the reservoir rule in Fig. 3, including shape parameters PR and PS which represent, respectively, the propensity for release at low storage (receiving releases closer to Rref faster) and for storage in near-full reservoirs (delaying releases for as long as possible), releases Rmin and Rmax at minimum and maximum storage and the coordinates Sref and Rref of the (reference) inflection point. Note that this parameterization, similar to those of other state-of-the-art rules in large-scale hydrological models, does not account for possible coordination mechanisms in multi-actor, multi-reservoir systems. These parameters depend on the reservoir's primary purpose, as shown in Table 1.
Table 1Parameters for reservoirs in the USRB. The last column classifies the basin's 128 reservoirs by primary purpose.
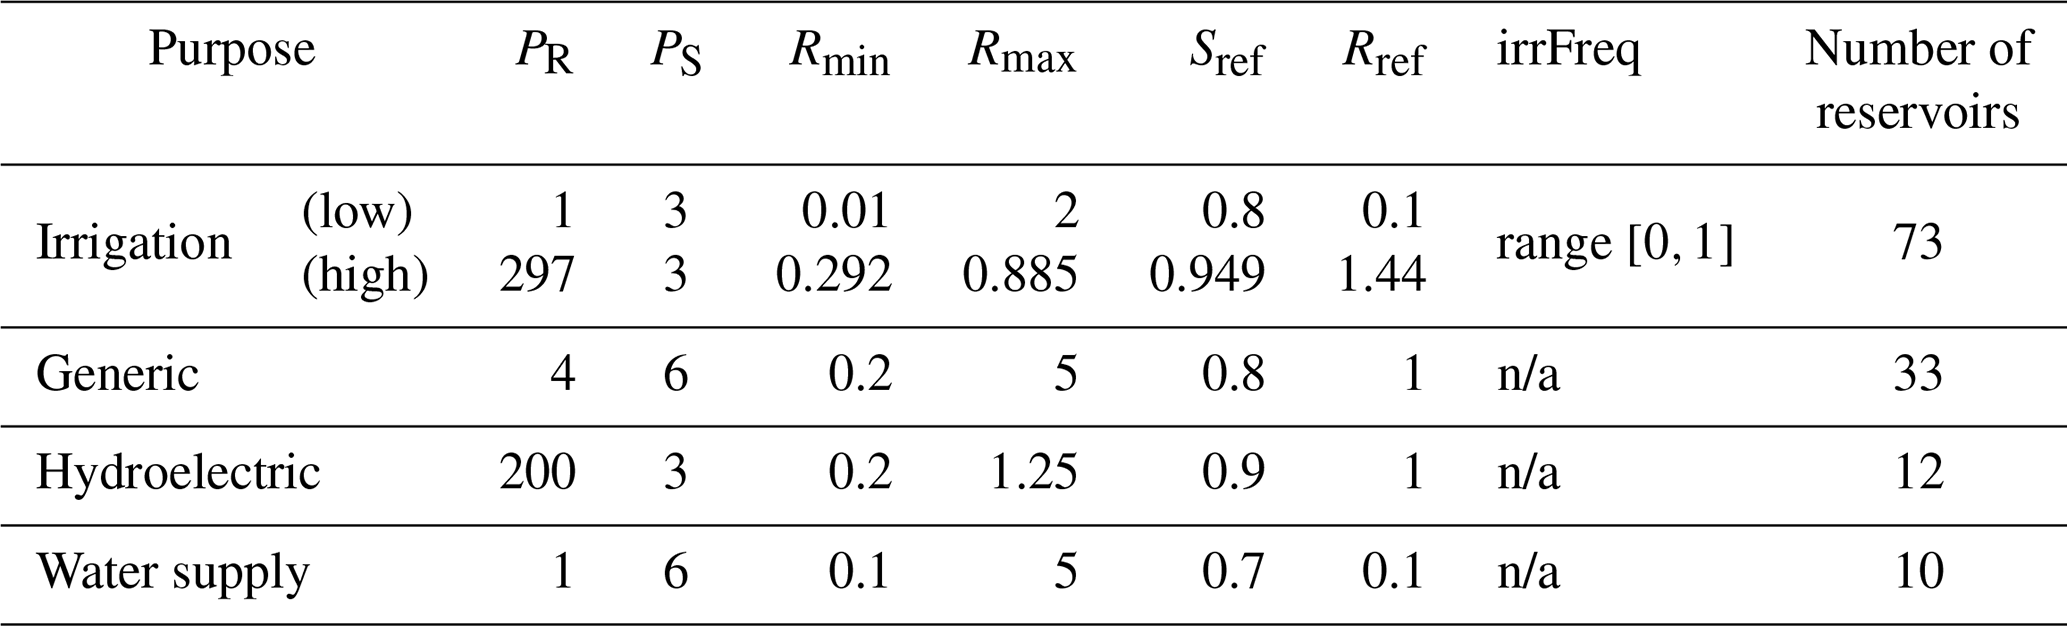
n/a stands for not applicable.
The term irrigation, as shown in Table 1, represents the dominant primary use; taken together, irrigation reservoirs represent a storage capacity of 6.27 km3 or just over 90 % of the USRB's total storage capacity. Note that irrigation reservoirs require a seventh parameter to model the need to refill or store water for the irrigation season and release it with the appropriate timing. This parameter, denoted as irrFreq, represents the relative frequency of water demand for irrigation throughout the year. It affects the release rule through each of the other parameters pi with , according to the following:
with irrFreq between 0 and 1, and the low and high values of the parameters defined in Table 1. This results in three distinct release rules, depending on time of year, as shown in Fig. 4. Winter features a refill phase (irrFreq=0) with low releases, except for keeping a flood control compartment available, whereas peak irrigation season is a drawdown phase (irrFreq=1) with high releases no matter the storage level. A shoulder season (irrFreq=0.5) smooths out the transition between the two.
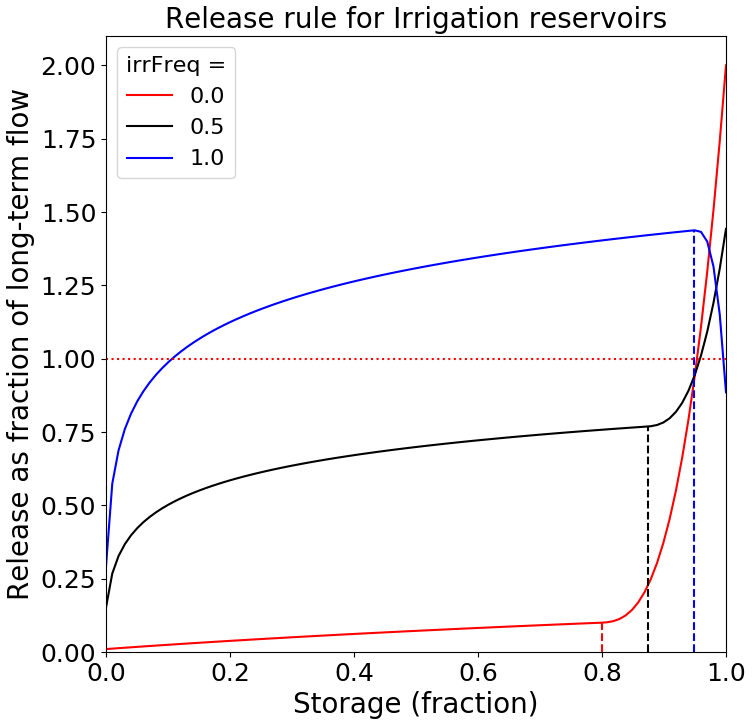
Figure 4Impact of the seasonal shape parameter on reservoirs whose primary purpose is irrigation. Dashed lines indicate the inflection point S*. We have irrFreq=1 between 18 July and 30 August included, 0 between 12 October and 23 April included and 0.5 during the shoulder seasons.
The reservoir rule for hydroelectric (see Table 1) primary use shows a near-constant release, except at very low storage levels, thanks to a very high propensity for release when S<Sref. The primary function for the water supply (see Table 1) use is to keep releases minimal and storage maximal in order to maximize the quantity of water that can be drawn directly from the reservoir – except for circumstances that require flood control at near-full storage. Other reservoirs mix different uses, and they are represented by the generic (see Table 1) rule form that corresponds to Fig. 3 and represents an implicit trade-off between uses that prioritize release and those that prioritize storage.
Despite its relative simplicity, the release rule proposed here shares several important characteristics with other rules proposed in the literature. The logarithmic and exponential portions mirror the intuition that the release behavior is structurally different depending on storage levels, a trait emphasized by some recent release rules (Wu and Chen, 2012; Zhao et al., 2016; Wang et al., 2019; Yassin et al., 2019). Besides, the representation of reservoirs based on their primary purpose has been a recurring theme since the seminal release rules by Hanasaki et al. (2006) and Haddeland et al. (2006); the time-varying irrFreq parameter also enables irrigation reservoir to have flood control behavior in winter, similar to the improvement proposed by Voisin et al. (2013a). Finally, there is the option to fine-tune individual reservoir release rule parameters to better represent actual (generally multipurpose) operations. Yet, adjusting parameters implies the assumption that the release rule is able to capture the main processes at play in operations of a multi-reservoir system. The following section introduces the experimental setup to diagnose this.
3.1 General approach
This work endeavors (i) to provide evidence that the common modeling practice of parameterizing each reservoir in a cascade independently from the others is a significant approximation and (ii) to demonstrate the potential unintended consequences of this independence approximation when simulating the dynamics of hydrological extremes in complex reservoir cascades.
Our diagnostic global sensitivity analysis uses the method of Morris to mathematically trace how downstream parameter choices or effects can be overwhelmed by upstream operational rules that are parameterized independently. The focus is not on which parameters in the release rule are most influential in regulating flows, but on clarifying how the set of dominant controls on water flows and reservoir storage levels evolves along a complex multi-reservoir cascade through time. Parametric sensitivities are then used alongside storage and release trajectories for the simulated ensemble to assess how sets of dominant controls in a point in time and at a given reservoir can be associated to high- or low-flow conditions. We detail the method of Morris in Sect. 3.2 and the experiment we design with it in Sect. 3.3.
Tracking the set of dominant controls through space and time with the method of Morris enables us to rigorously document the quantitative effects of independent parameterizations of the reservoir cascade and highlight that downstream dynamics are not strongly controlled by independent downstream operational curve parameter specifications, i.e., contribution (i). The unintended consequences of treating the reservoirs independently – contribution (ii) – are shown by comparing and contrasting the reservoir rule representation with real-world coordinated reservoir operations. For this, several steps are implemented in succession. First, a prerequisite is to observe dynamics in historical (i.e., observed) operations that cannot be accounted for by a reservoir's release rule simply by changing parameter values or integrating a near-term (less than a month) inflow forecast, as in some existing rules (e.g., Biemans et al., 2011). Other variables would be necessary to incorporate these behaviors within the hydrological models. These behaviors are hypothesized as being preliminary indications of cooperation, and the events they highlight will be investigated further. Second, the comparison of historical and simulated operations is used to understand how reservoirs are coordinated in the historical record and contrast the impact of this with reservoir non-coordination in simulations. Differences observed in this comparison could be due to all sorts of errors in the model and not just failing to represent coordination. Therefore, in a third and final step, the hypothesis that coordination is a key source of the release and storage discrepancies is further evaluated using offline reservoir water balance models that implement basic coordination on the simulated ensembles at times where coordination is hypothesized to be present and important in the real system's dynamic management of extreme events. These offline reservoir water balance models show that very basic coordination strategies alone are capable of correcting the documented differences between simulated and historical operations. Note that we cannot fully quantify and explain all sources of errors; there is, to our knowledge, no study of a real operational context using a hydrological modeling experiment where one would know absolutely every source of error or potential confounding factor. However, the effectiveness of our basic representation of coordination in the Water Balance Model does contribute a simple and quantitatively direct reduction of errors relative to the actual observed operational dynamics. The details of our water balance analysis can be seen in Sect. 4.5.
We focus our application of this approach on the USRB in 2009–2016. The geographical extent of the USRB is small compared with that of areas traditionally considered in large-scale hydrological models. However, the regional focus on the USRB captures a highly dynamic and heavily controlled major reservoir cascade that is critical to managing floods and droughts. Conclusions from this study are fully transferable to larger scales, where critical representational errors in major infrastructure remain consequential. For this reason, we also aim to evaluate model outcomes in the same conditions as large-scale hydrological vulnerability assessments are carried out. For instance, we do not fine-tune reservoir rule parameters to individual basins and, instead, use purpose-based parameterizations typical in large-scale studies (e.g., Biemans et al., 2011; Voisin et al., 2013a; Yoshikawa et al., 2014).
3.2 Time-varying sensitivity analysis – method of Morris
The method of Morris (Morris, 1991; Campolongo et al., 2007) has proven to be a successful tool for detailed diagnostic evaluations of large and complex hydrological models (e.g., Herman et al., 2013b; Zajac et al., 2017; Reinecke et al., 2019). This section presents the sampling technique used, the basic Morris sensitivity indices and a time-varying version of these indices. All sensitivity analyses were performed using the SALib toolbox written in Python by Herman and Usher (2017).
The method of Morris samples points within the parametric spaces of interest by following so-called trajectories. Thus, two consecutive points of a trajectory share the same input values, except for parameter input i where they are separated by a distance Δi. The value of input dimension i is changed exactly once along a trajectory, and the order in which input dimensions are changed is random. If D is the dimension of the parametric input space being sampled, then each trajectory comprises D+1 points. To ensure that the Morris sensitivity measures are as accurate as possible, sampling must cover the parametric input space as well as possible. This paper implements the method proposed by Ruano et al. (2012), which first generates a large number of trajectories, then selects a subset that provides near-optimal input space coverage using a computationally efficient optimization technique (as implemented here, M=50 trajectories were selected out of 1000).
To compute Morris indices from a set of M input trajectories, one must run the model for which the parametric input space is being sampled at each point x of each trajectory. Therefore, there are model runs. For each trajectory j (), model runs yield the so-called elementary effect along input dimension i for each date t as follows:
with M trajectories being sampled, sensitivity index μi(t) for input dimension i at date t is the average over the elementary effects as follows:
In this work, we are concerned with relative contributions to sensitivity across reservoir rule parameters () and over a given time period (). Therefore, we compute the following normalized values for the Morris sensitivity index as follows:
where μmax is the maximal value of over the input space and time frame of interest as follows:
As a result, each μi(t) value will be between −1 and 1. Absolute values close to 1 represent inputs that have a dominant influence on outputs, not only compared with other inputs at that date but also compared with the inputs' impacts on outputs at other dates within [t1,t2]. Positive values indicate that outputs values increase with input values, whereas the contrary holds for negative values.
3.3 Reservoir parameters and ranges
We conduct this diagnostic analysis with seven groups of parameters. Each group contains one of the seven parameters of the release rule for all 128 reservoirs in the USRB. This analysis uses a range of ±10 % around base values for all parameters in Table 1. These modest 10 % ranges would be conservative if our focus were calibration and not diagnosis. The results section (Sect. 4) will demonstrate that our narrow sampling yields quite substantial effects when compounded across the reservoir cascade in periods where coordinated operations are significant. Besides, there are two reasons for choosing the same range across all parameters, namely that (1) it accounts for the fact that each parameter does not have the same base value across all reservoirs, and that (2) it facilitates comparisons between different parameters' sensitivity indices.
Our choice to explore seven groups of parameters serves to reduce the computational burden of our diagnostic analyses while facilitating a clear experimental mechanism to investigate the core parameterization assumptions used to capture multi-reservoir release and storage dynamics. It also meets the core objective of this study, which is to clarify the importance of multi-reservoir coordination and control to our model-based assessments of flood and drought vulnerabilities in complex river basin systems. Indeed, the chosen parameter set is necessary and sufficient for answering two key intermediary questions. First, we must understand how release rule parameters from a given reservoir influence its water balance (release and storage) through time. This makes it necessary to consider all seven parameters of the release rule. Second, we must understand how the release rule parameters from upstream reservoirs influence subsequent at-site reservoir controls. This is key for understanding how the non-coordinated release rule affects the time-varying response to high- and low-flow extremes as we move down a reservoir cascade. Our experimental design highlights when parametric controls on reservoir releases are modified by upstream interferences. Indeed, the same parameters that increase release at a given reservoir also increase upstream releases. Both effects have the opposite consequences for a reservoir's storage. Our analysis will track the instances in which upstream controls dominate at-site controls and clarify the consequences of this for the reservoir cascade's response to hydrological extremes.
The D=7 parameters and ranges thus defined are used to set up a method of Morris experiment with M=50 trajectories. The ensemble size is . We ran this experiment on the cube cluster at the Cornell Center for Advanced Computing Results. The cube has 32 computational nodes with dual eight core E5-2680 central processing units (CPUs), at 2.7 GHz, with 128 GB of RAM. A single run of the USRB WBM takes close to 7 h on average for the USRB, with an 8-year simulation period (2009–2016) preceded by a 5-year spinup period. The ensemble of 400 members took almost 3000 h of computational time to receive and analyze, using parallel runs exploiting Open Message Passing Interface version 1.6.5.
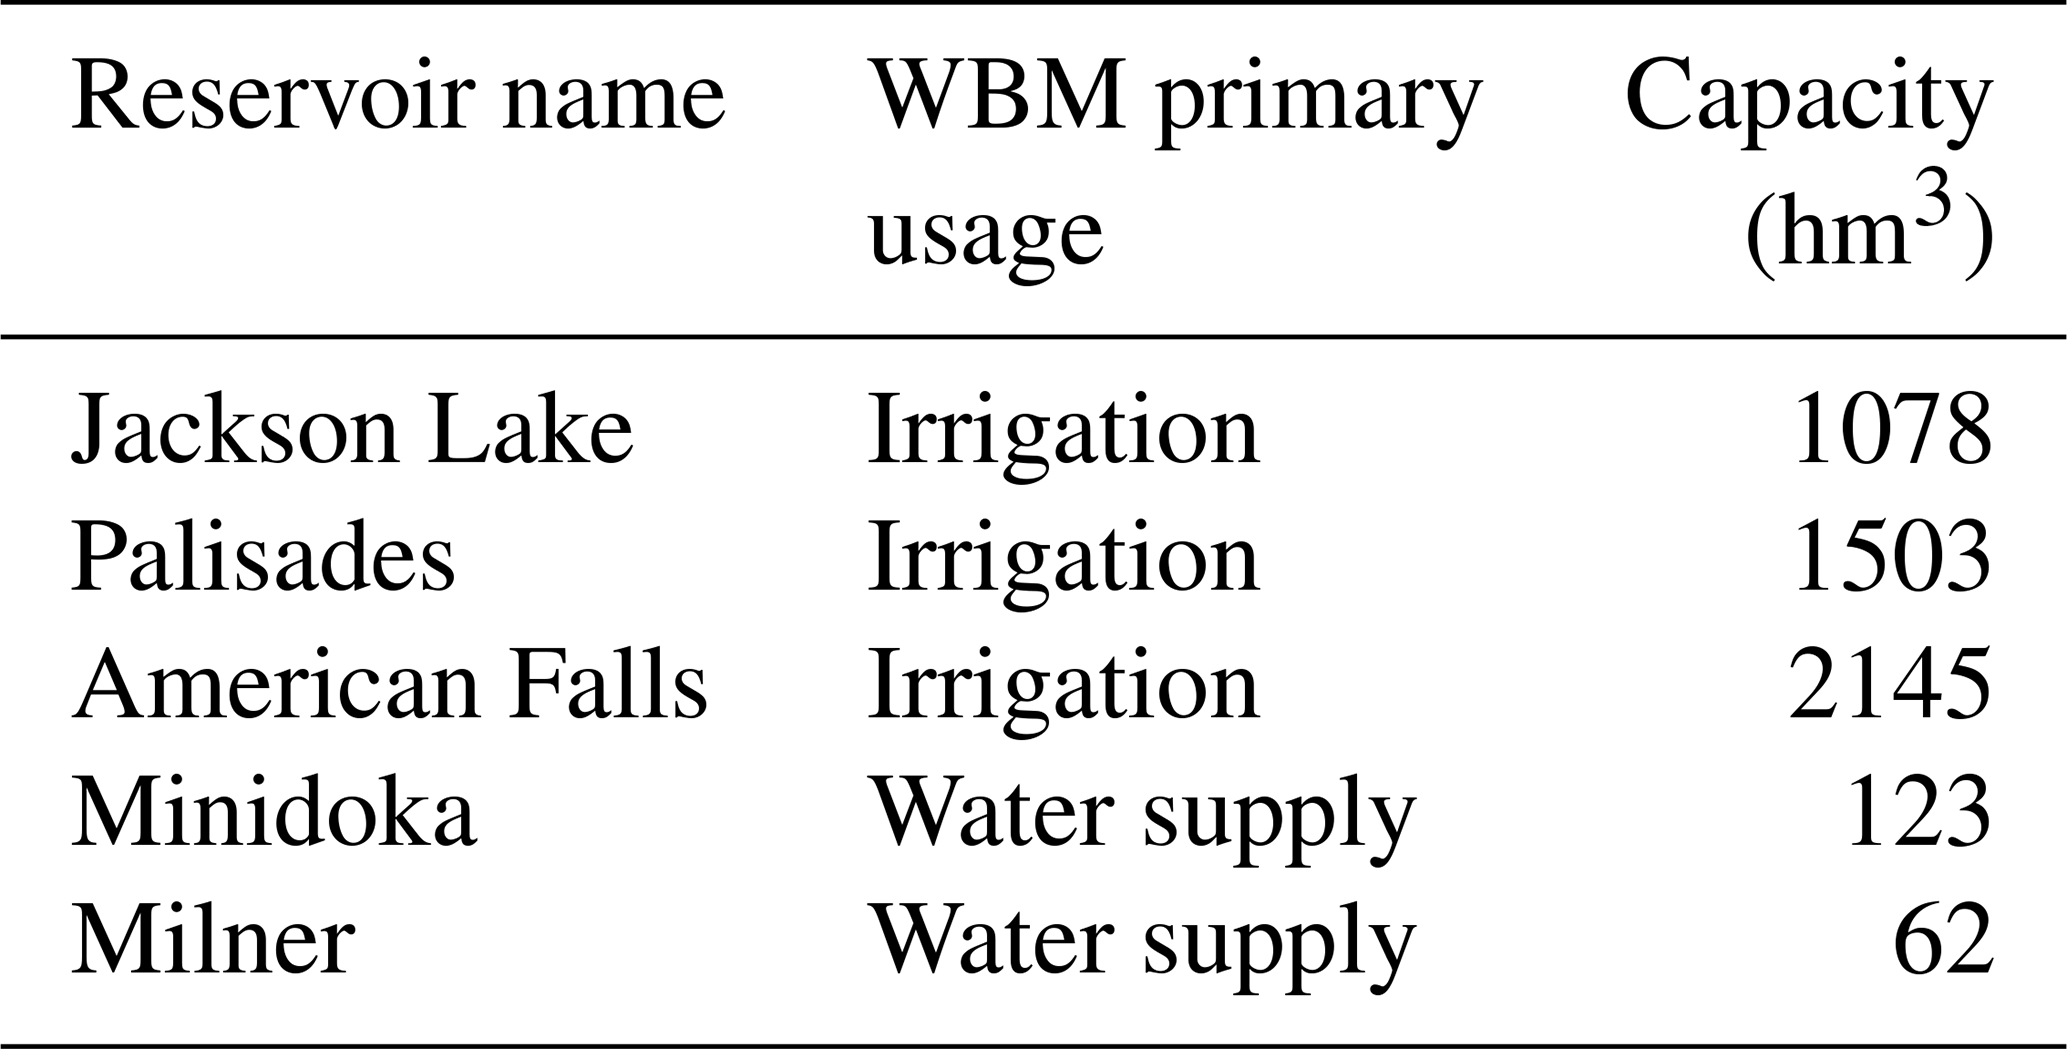
Our results focus on the reservoir cascade on the main stem of the Upper Snake River (Table 2). The three upstream reservoirs in Table 2 are the three largest reservoirs in the basin, and their capacity to store water for the irrigation season is crucial to the agricultural sector in the USRB. Consequently, they are classified as irrigation reservoirs. The two downstream reservoirs are smaller and must be maintained at high storage levels during the irrigation season so that canals can draw directly from them, leading to their classification as water supply reservoirs. All but the most downstream reservoir (Milner) are part of, or associated to, the Minidoka Project; therefore, their operations for water supply and flood protection are largely coordinated when deemed necessary. Using an ensemble of WBM simulations computed, as specified in Sect. 3, we carry out a diagnostic evaluation of the parametric controls of the release rules in three steps. Initially, we focus on the upstream reservoir, Jackson Lake, where there are no interferences from other reservoirs upstream (Sect. 4.1). This is where simulation results enable us to quantify the main controls on a reservoir's release rule, a prerequisite for studying how these controls evolve with hydroclimatic events and along the reservoir cascade. This is also where we can find indications of coordination within the historical record, as defined in Sect. 3.1. Next, we quantify the upstream interference with downstream releases in the USRB's cascade (Sect. 4.2). Then, Sect. 4.3 and 4.4 contrast actual observed operations with those from the simulated ensembles for recent USRB low- and high-flow events, respectively. Finally, Sect. 4.5 shows results from the offline water balance models devised by modifying simulation results with simple coordination mechanisms.
Table 2Reservoir cascade on the main stem of the Upper Snake River, ordered from upstream to downstream.
4.1 Upstream – controls on release and storage
4.1.1 Dominant parametric controls in simulations
First, let us examine the WBM's parametric reservoir rule's dynamic sensitivities through Jackson Lake, an upstream reservoir that is not influenced by inflows from any other reservoir in the USRB. Figure 5 provides a visualization of time-varying sensitivities at the daily time step. Simulated and observed hydrological time series overlay the sensitivities represented by the blue-to-red color scale. The left vertical axis represents the plotted reservoir state (release or storage). In Fig. 5, shades of blue, red and white report the normalized Morris sensitivity index in a given time period (the horizontal axis); they are organized over seven lines, each corresponding to one of the seven reservoir rule input variables evaluated in our analysis and listed on the right vertical axis. As indicated by the color bar to the right of the Fig. 5, shades of red correspond to normalized Morris sensitivity values close to 1, indicating that the associated variable is dominant, and that higher values of it correlate with higher values of the reservoir state. Conversely, shades of blue correspond to normalized Morris sensitivity values close to −1 and indicate that the associated variable is dominant, but that higher values of it correlate with lower values of the reservoir state. Finally, white indicates sensitivity is weak compared to that of other variables and/or dates.
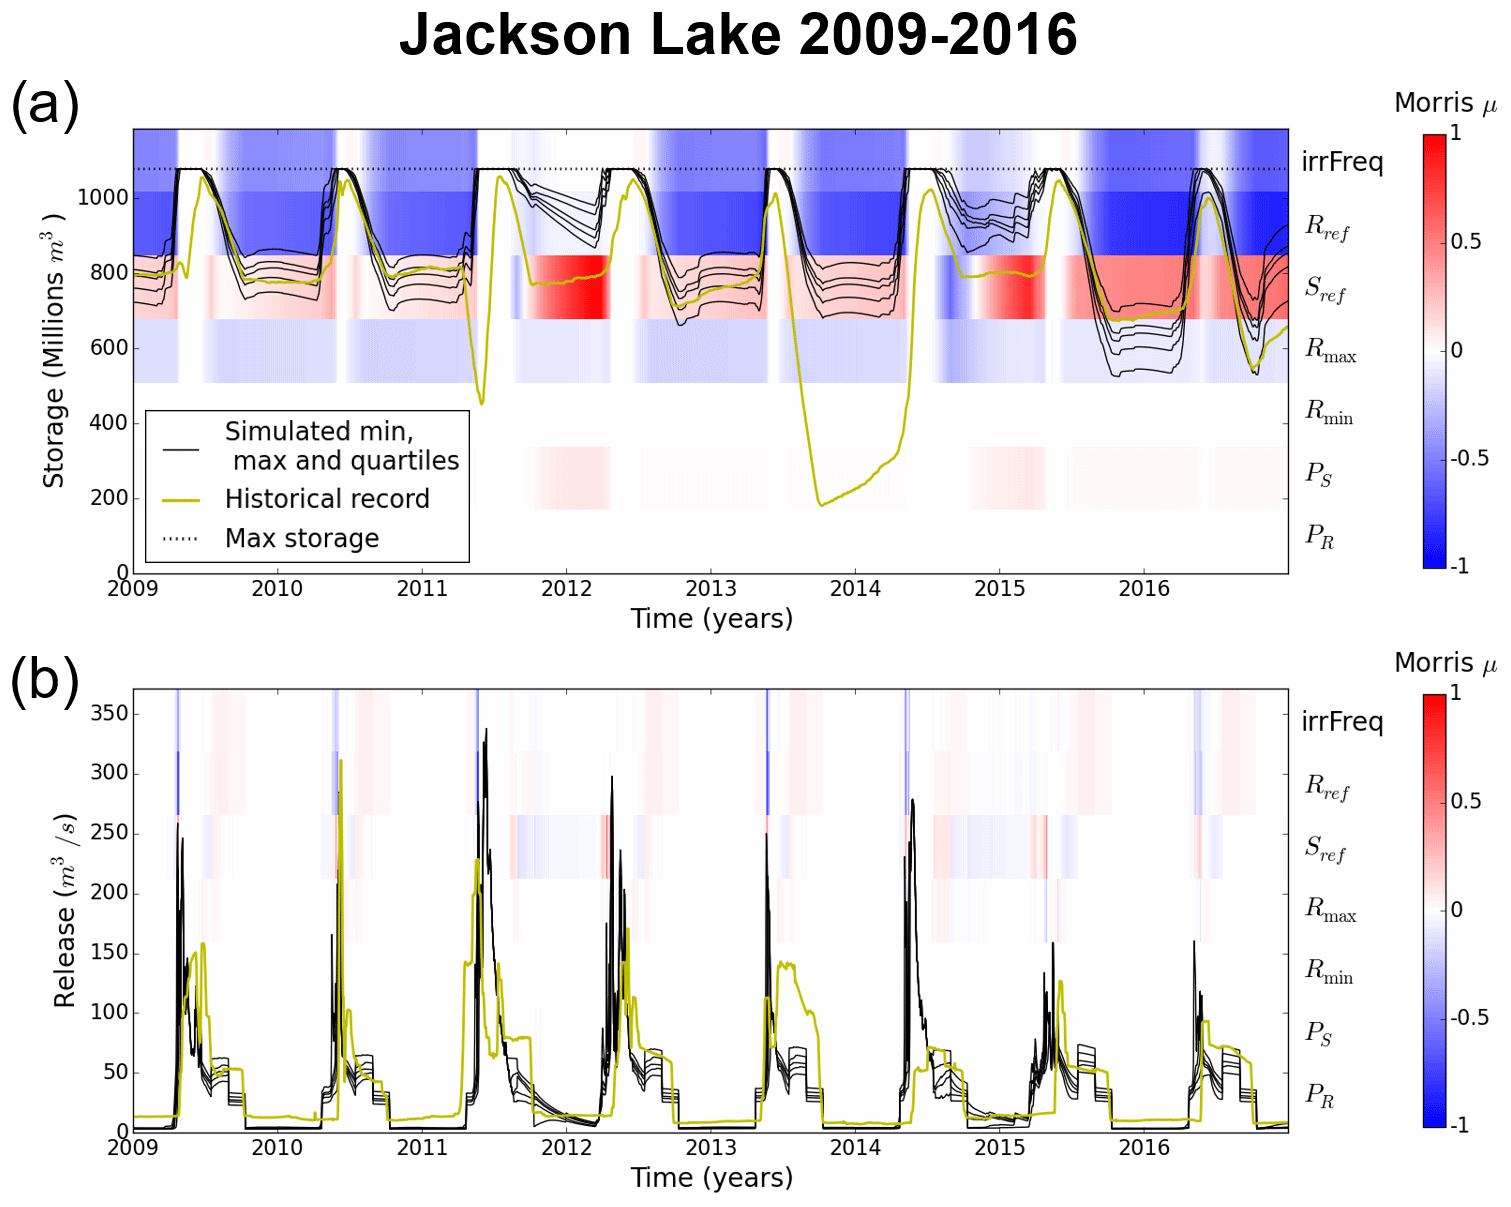
Figure 5The foreground shows a comparison of the observed (gold line) and simulated (black lines) trajectories at Jackson Lake for (a) reservoir storage and (b) release. The background shows the daily sensitivities to the reservoir rule parameters on the left y axis.
In Fig. 5a, storage differences that emerge across the sampled parameterizations of the evaluated WBM ensemble members are the time integral of daily release differences; therefore, they indicate the cumulative effects over time of how the parameters influence the release rule. Storage sensitivities present clear annual patterns for Jackson Lake and are more broadly representative of the dominant controls for an irrigation reservoir within WBM that has an absence of interactions from other reservoirs. Figure 5a shows that the Jackson Lake storage sensitivities go to zero in periods where maximum storage is attained; this is expected because then there is no variation in storage across the ensemble. In all other periods, there are three dominant parameters influencing storage, namely Sref, Rref and irrFreq, with a remarkably consistent influence over the 8-year simulation period. The direction in which these parameters influence the release rule is consistent with the release rules of Figs. 3 and 4. Indeed, higher values of Rref and irrFreq directly increase release, therefore decreasing storage over time, whereas increasing Sref delays the transition between the logarithmic and exponential parts of the rule and has the opposite effect – except if storage is very high during peak irrigation season due to the dip observable for irrFreq=1 in Fig. 4. Although somewhat reduced in effect relative to the top three parameters controlling storage dynamics in the Jackson Lake reservoir, the maximum storage releases Rmax are predictably inversely correlated with storage (Fig. 5b). Yet, the three dominant parameters Sref, Rref and irrFreq yield what can be interpreted as the signature of the parametric influence of the release rule governing storage over time.
Transitioning to Jackson Lake's parametric sensitivities for releases, the overall magnitude of the normalized Morris indices are substantially reduced and less consistent relative to those for storage (Fig. 5b). A potential reason for this is a dampening effect as parameters that increase current releases also decrease future storage and, consequently, limit future releases. Another potential reason for the diminished sensitivities overall in Fig. 5b is that, contrary to storage that registers the cumulative effects of parametric differences, release sensitivities peak on particular days, making other time periods less sensitive in comparison. The parametric sensitivities for the Jackson Lake release have an opposite signature to that of storage during large stretches in summer and fall over 2009–2016. Indeed, the three dominant parameters are Sref, Rref and irrFreq, with higher values of Sref correlating with lower release whereas higher values of R(S*) and irrFreq correlate with higher releases. Both signatures are consistent because parameters that have a sustained impact on release are expected to have an opposite effect on storage.
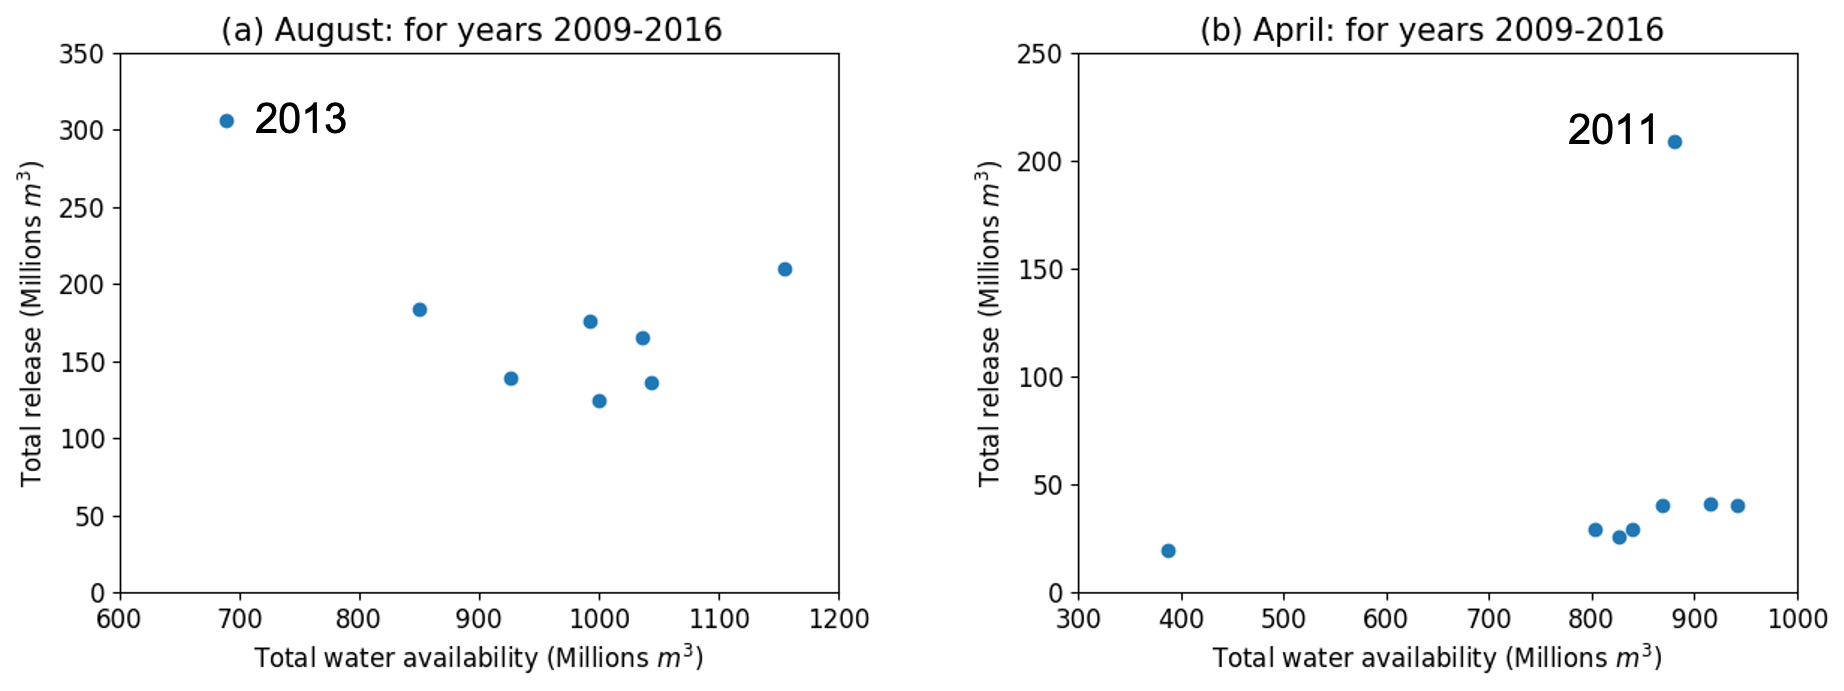
Figure 6Total monthly historical release vs. water availability (beginning-of-month storage plus inflows) for each year between 2009 and 2013 at Jackson Lake for the months of (a) August and (b) April.
4.1.2 Comparison with historical operations
Overall, a comparison of historical versus simulated storage and releases in Fig. 5 shows a broad agreement during the 8-year study period, despite two major departures, especially apparent for storage. In 2011, early spring release in the historical record created flood control storage and enabled peak flows to be lower than in the simulated ensemble. Observations of large drawdown in the summer of 2013, with the reservoir replenished only in 2014, are not matched by the simulations. In both situations, we compared release over a whole month to total water availability (initial storage plus total inflows over the month) for each of the 8 years covered by our analysis. In both cases, results from Fig. 6 show that both events correspond to a major departure with the expectation that release should be indexed on water availability. In 2013 (Fig. 6a), releases are much higher than any other year despite the water availability in that August being the lowest of the 8 years. This corresponds to a low-flow period during which extra water is released to help downstream reservoirs meet demand; we contrast this coordinated historical response with simulation results in detail in Sect. 4.3. In 2011 (Fig. 6b), releases are over four times higher than normal despite water availability being comparable to conditions for 6 of the 7 other years. This is a prelude to an intense snowmelt season, requiring anticipation and coordination from the two main reservoirs tasked with flood control in the USRB, i.e., Jackson Lake and Palisades (US Bureau of Reclamations, 2012). We contrast this response with the simulation results in Sect. 4.4.
4.2 Absence of downstream coordination in controls
We now transition our focus to the fourth reservoir on the USRB reservoir cascade, Minidoka, which is considerably smaller than the first three. Our analysis in Fig. 7 focuses on flows from a single year to clarify the complex interactions between upstream releases and Minidoka operations. Starting with inflows to the reservoir, shown in Fig. 7a, the dominant parameters controlling inflows are Rref and irrFreq (and to a lesser extent Sref). The time-varying pattern of dominant release sensitivities across the year of 2013 (Fig. 7b) mirrors that of inflows, as dominant parameters tend to positively and negatively correlate with inflows and releases alike at the same time of year. Moreover, the strong release sensitivities to the seasonal irrFreq parameter from May to October can only be due to interactions with upstream reservoirs because irrFreq only influences irrigation reservoirs' release rule, whereas Minidoka is classified as a water supply reservoir. These results suggest that the upstream reservoirs' rules are a dominating factor in this downstream reservoir's release decisions.
However closely variations in simulated releases in Fig. 7b tend to follow simulated inflows in Fig. 7a, these releases show unexpected high-frequency fluctuations that are artifacts that are not meant to occur in the reservoir's release rule. This shows the unintended consequences of interactions with upstream reservoirs. In other words, it would arguably be very difficult to calibrate the parameters of Minidoka's release rule without accounting for the complex upstream interactions. Mathematically, this is termed non-separability.
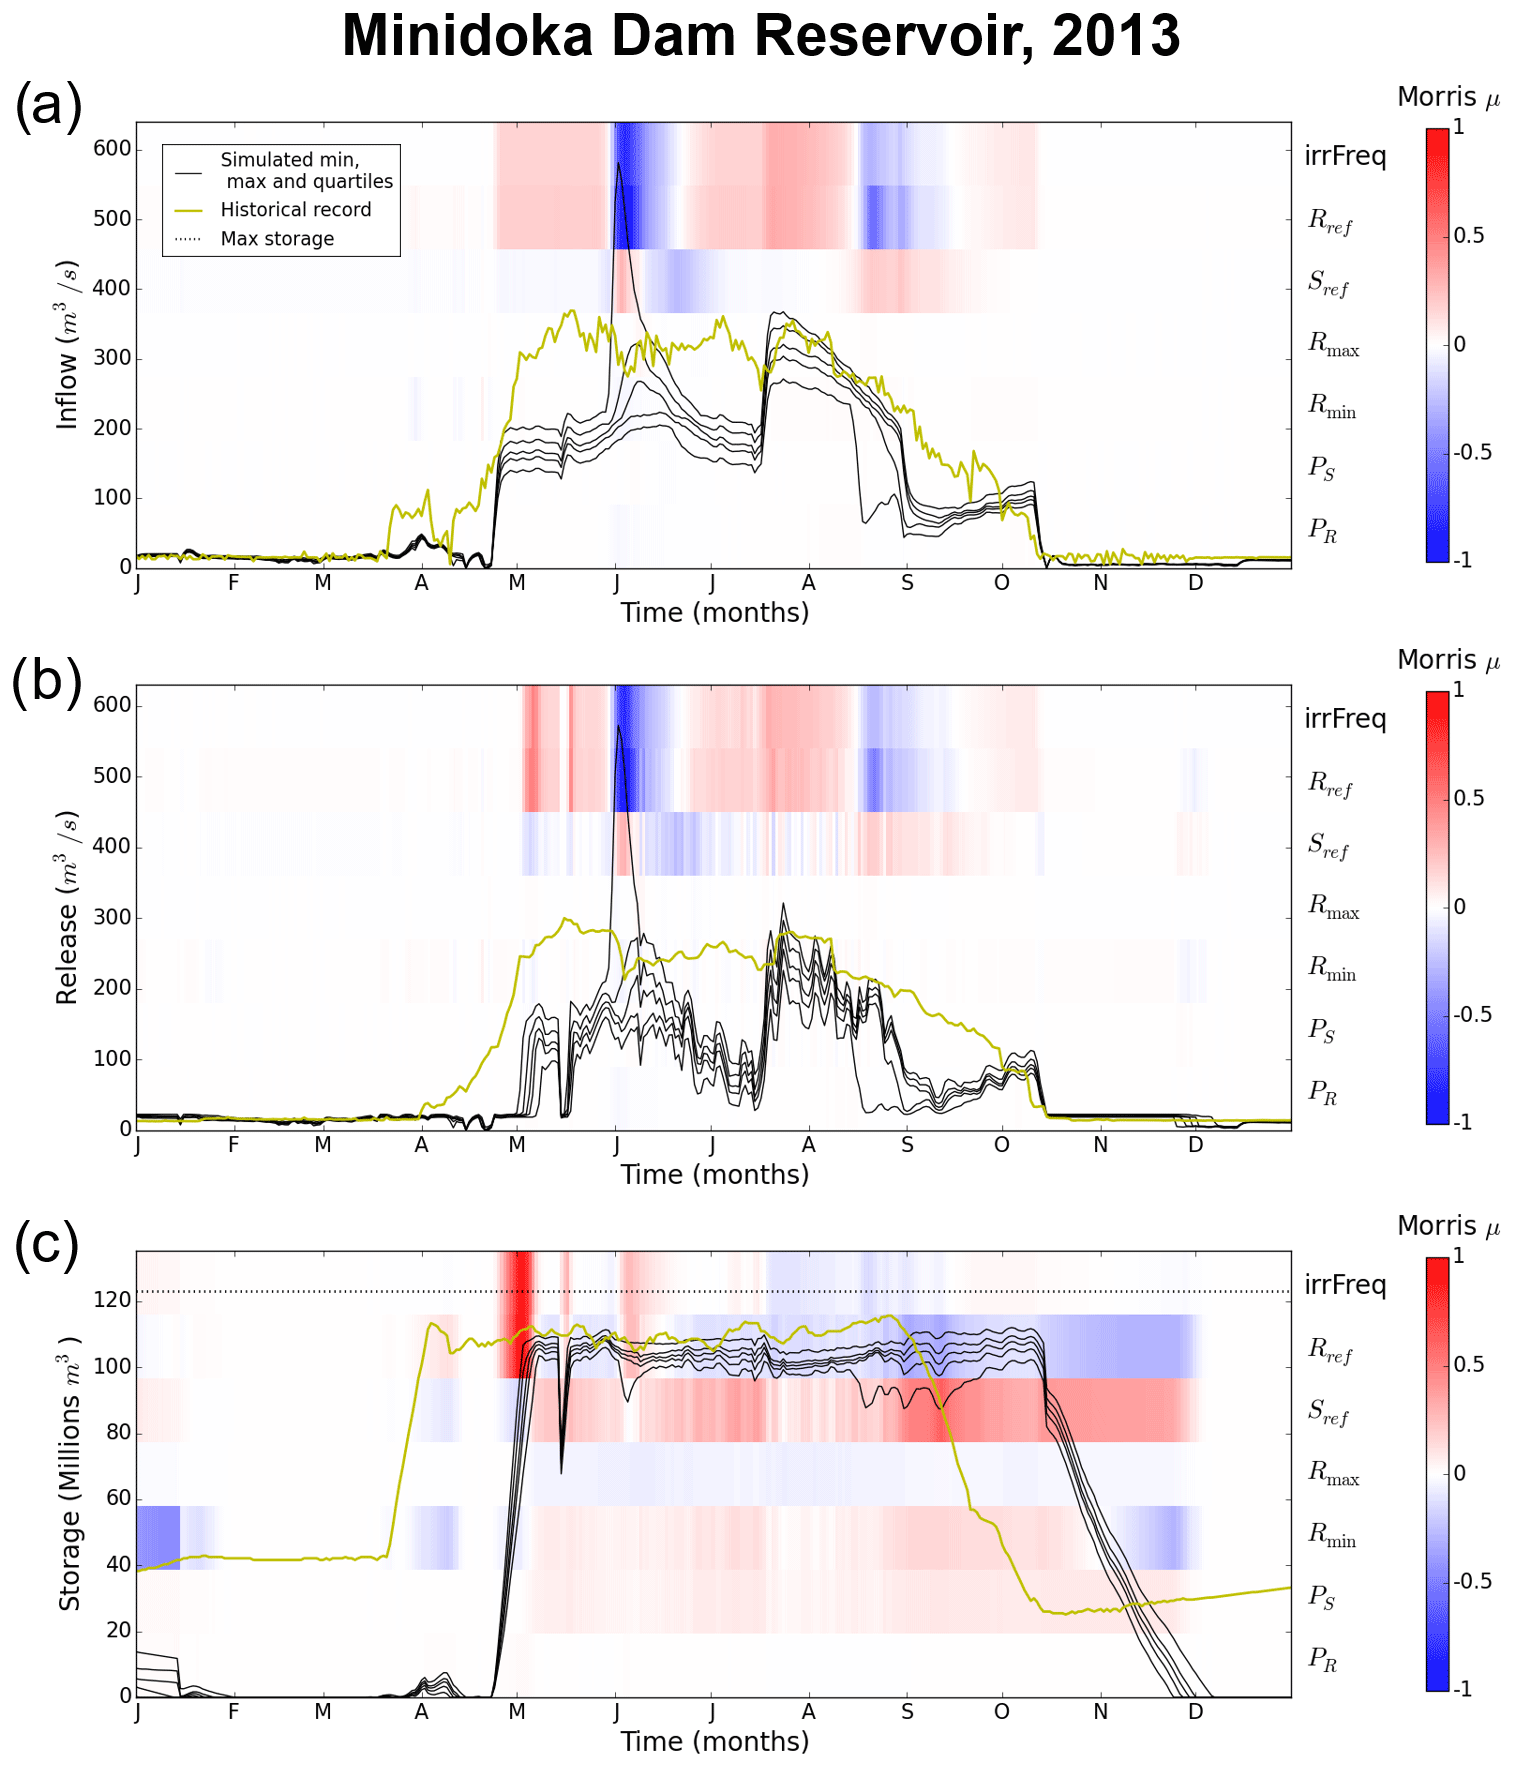
Figure 7Simulated values (max, min and quartiles, shown with black lines) with historical values (gold line) and sensitivity to input variables (background) for (a) Minidoka reservoir's inflow, (b) release and (c) storage.
All of these insights from comparing inflow and release sensitivities are confirmed by looking at Minidoka's 2013 storage sensitivities in Fig. 7c. Similar to the release sensitivities in Fig. 7b, the influence of irrFreq on storage is a direct signature of interactions with upstream releases. In fact, the dominant storage sensitivities for the whole year are end-of-April sensitivities to irrFreq and Rref (dark red in Fig. 7c). The former parameter is not defined for the Minidoka release rule, whereas the latter should be associated with negative sensitivity (with the color blue) in absence of upstream interactions. The simulated reservoir filling for Minidoka is strongly influenced by parametric artifacts outside of its own parameterization. Beyond that, the picture of time-varying storage sensitivities is extremely complex. For instance, the direction of storage sensitivity to irrFreq (i.e., positive or negative correlation with storage) does not always appear to be clear and consistent with that same parameter's sensitivities for inflows and releases (compare panels in Fig. 7). This apparent complexity cannot be dissociated from upstream interactions, again reinforcing the notion that parameterizing Minidoka's release rule cannot be done separately from the parameterizations of the upstream reservoirs. This meets aim (i), confirming that separate parameterization and calibration of individual reservoirs in a cascade is an approximation. The two next sections explore some possible unintended consequences of this assumption.
4.3 Drought risk
We now transition to the reservoir operations along the USRB's reservoir cascade for the consecutive dry years of 2012 and 2013. We contrast coordinated historical operations, illustrated here by storage levels in the basin's three main reservoirs, with the simulations results from our ensemble of hydrological model runs – which we term simulated storage in this Section and in the next (Sect. 4.4). We also analyze the sensitivity of simulated storage to the WBM's parametric controls.
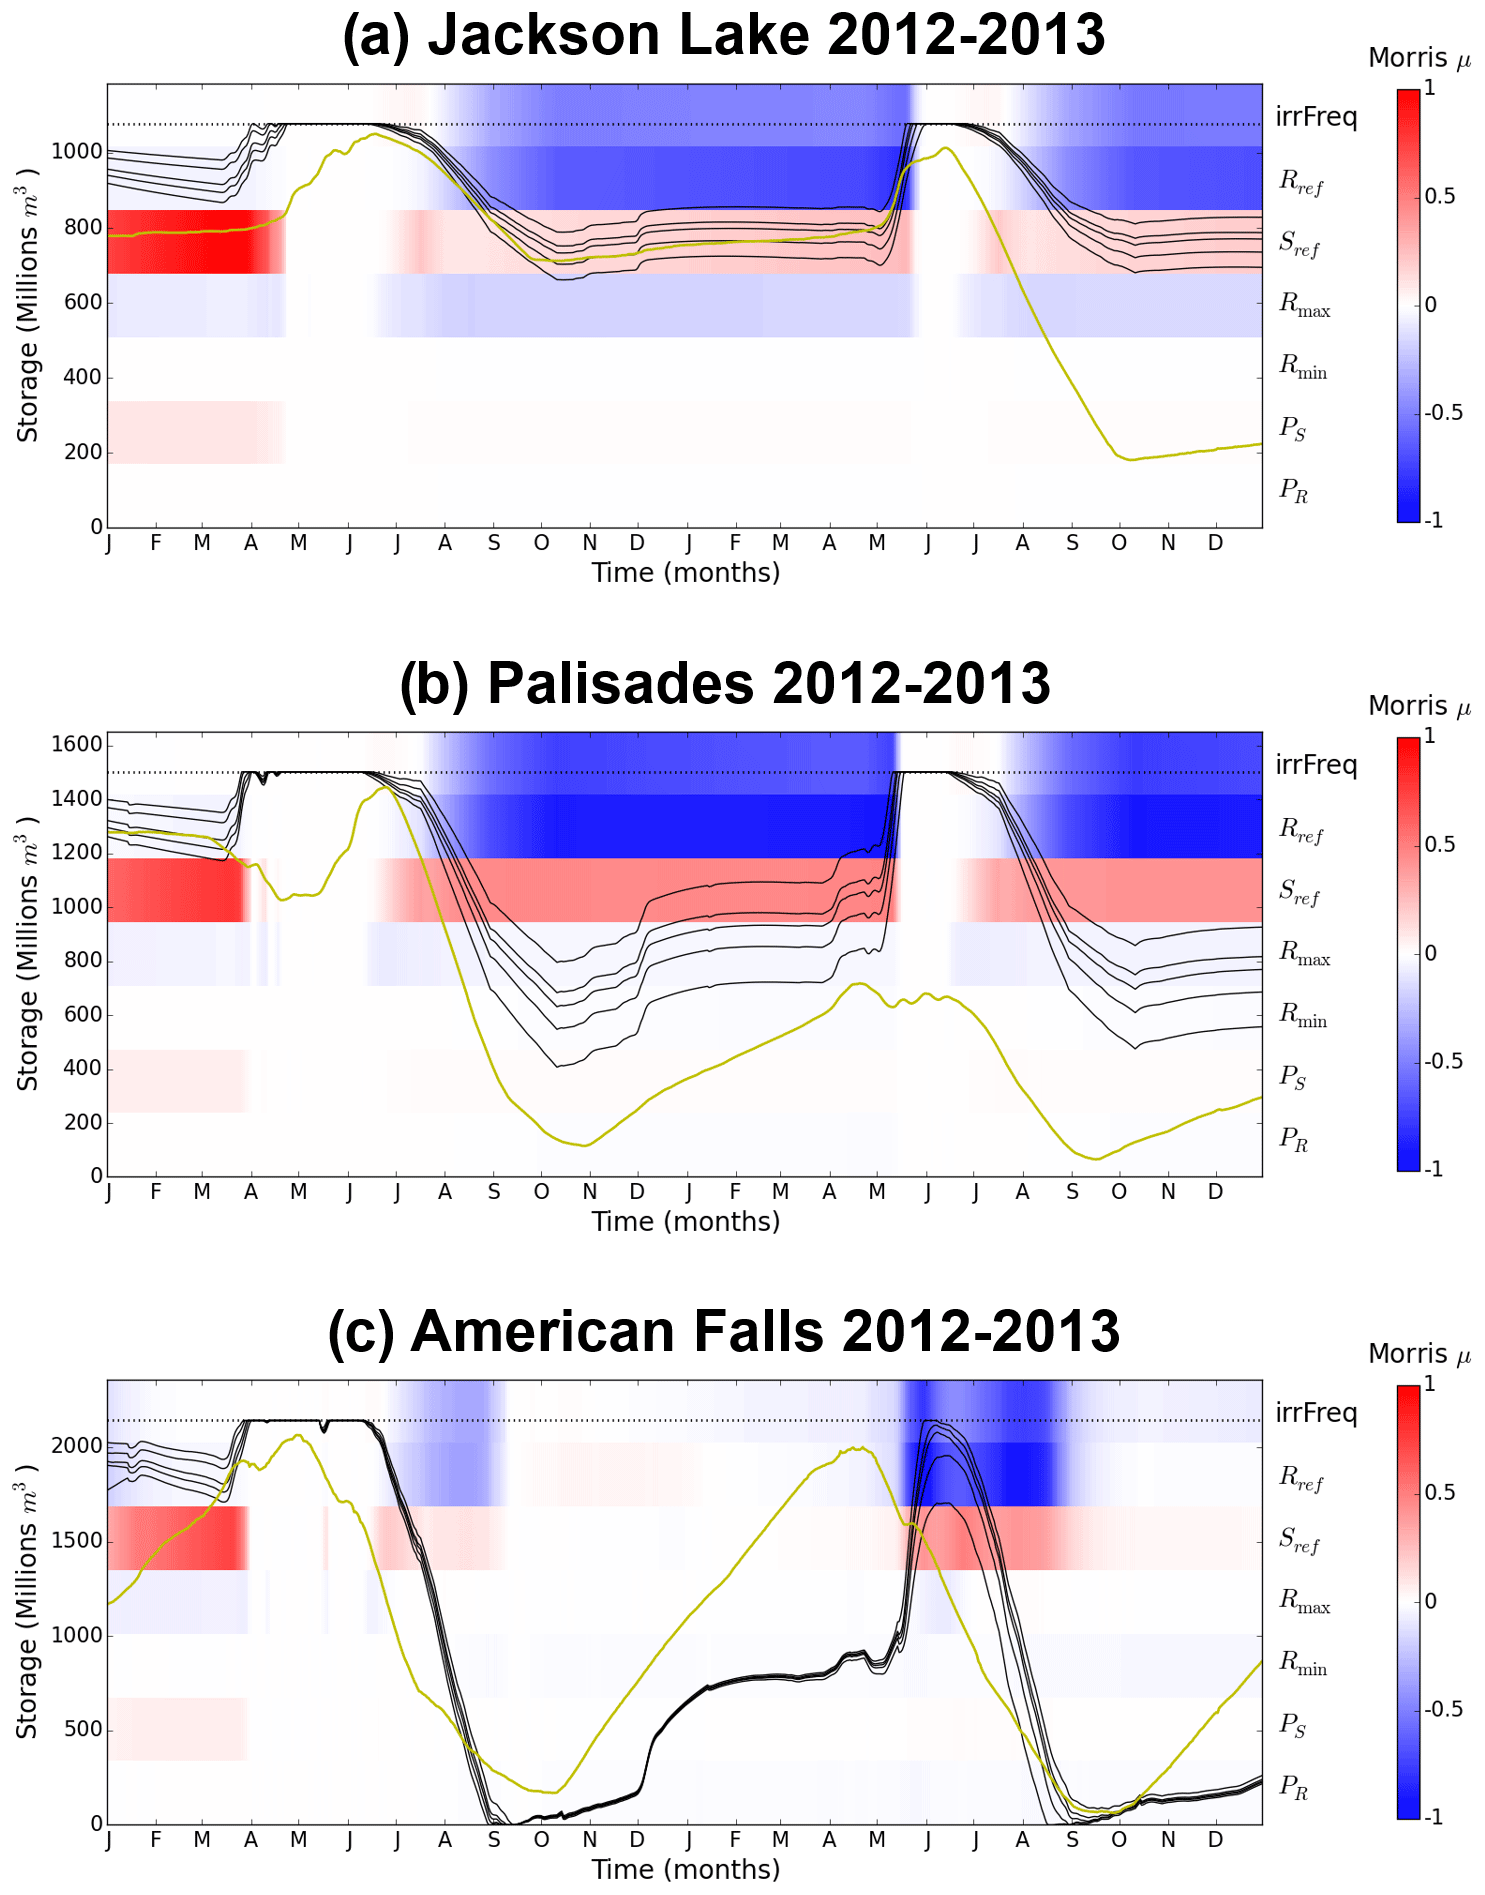
Figure 8Recorded and historical storage during the dry years of 2012 and 2013, with sensitivities of the simulated variables illustrated in the background. Panels (a) to (c) show the storage at the three largest USRB reservoirs from upstream to downstream.
The 2012–2013 low-flow event led to a significant simulated drawdown at upstream Jackson Lake in 2013, previously shown in Fig. 5. The strong deviations in the dynamics of historical (gold lines) and simulated (black lines) reservoir operations for both years, 2012 and 2013, are apparent in Fig. 8. Recall that the two most downstream reservoirs in the Snake River reservoir cascade – Minidoka and Milner – are smaller reservoirs that must stay full during the irrigation season so farmers can draw water through gravity irrigation. Therefore, it is key that American Falls, the main reservoir in the Snake River Plain located just upstream of Minidoka, is not empty so that it can keep regulating water levels in downstream reservoirs, ensuring irrigation needs are met. For this reason, our analysis will start with American Falls (Fig. 8c) and work its way upstream to shed light on the historical observed coordination, and lack thereof in the simulations, during the 2012–2013 low-flow period. The pace and magnitude of the drawdown are the defining differences between historical and simulated operations at American Falls. For both years, historical operations show reservoir levels decreasing at a near-constant rate from nearly full in early May to about 5 %–10 % by the end of summer. The drawdown season spans 4–5 months, and the reservoir never loses its capacity to regulate downstream reservoir levels. Alternatively, simulated drawdown seasons are much shorter – 2.5 months from mid-June to the beginning of September – and the reservoir swings from full (in 2012) or nearly so (in 2013) to completely empty either for the whole ensemble (in 2012) or nearly half of it (in 2013). In other words, American Falls loses its capacity to regulate irrigation delivery or is simulated to be dangerously close to doing so.
The reason for this contrasting behavior can be found with upstream operations. For instance, the historical storage trajectory at Palisades (Fig. 8b) shows a marked drawdown from early July to late October 2012. On average, the reservoir released over 0.5 km3 more towards American Falls in the observed record than it does in the simulations, and this enabled American Falls to keep its capacity to regulate irrigation withdrawals on the Snake River Plain. Simulated storage sensitivities, however, reflect the lack of coordination across the ensemble of simulations. Indeed, method of Morris results show that the main controls on storage from April 2012 onwards are the same as for large reservoirs for which at-site controls dominate upstream interferences (see Sect. 4.1). These controls, and the simulated storage trajectories, fully ignore any connection with the simulated events unfolding downstream.
Yet, in 2013, historical storage levels at Palisades (yellow line in Fig. 8b) had not recovered from the exceptional 2012 drawdown due to a combination of low carryover storage and insufficient snowmelt. Palisades reservoir could no longer supply extra water to the Snake River Plain. Instead, exceptional historical Jackson Lake drawdown in the summer of 2013 (Fig. 8a) supplied over 0.5 km3 extra water to the Snake River Plain compared to what the simulations record. Thus, complex multi-year and multi-reservoir coordination was needed to avert adverse drought impacts on agriculture. The simulations do not account for this coordination, as demonstrated by both simulated storage and by the consistent parametric controls at both Jackson and Lake and Palisades for both years. The ensemble of simulations left American Falls empty whereas the two largest reservoirs upstream of it remain close to full.
4.4 Flood risk
We next evaluate if these representational deficits in simulating coordinated operations also yielded consequential errors in the spring of 2011, where the observed operations averted a flood by exploiting forecast-based anticipatory releases in the two upstream large reservoirs at Jackson Lake and Palisades. Following the flow from upstream Jackson Lake to downstream Palisades (Table 2), we contrast coordinated historical storage and discharge levels observed in the spring of 2011 with the simulation results from our ensemble of hydrological model runs and the associated release and storage sensitivities to WBM's parametric controls.
4.4.1 Jackson Lake
Starting upstream, we focus on the storage and release dynamics, both simulated (black lines) and historical (gold lines), at Jackson Lake (Fig. 9). All simulation results fill the reservoir entirely between 14, at the earliest, and 26 May, at the latest (Fig. 9a); this period coincides with maximal release sensitivity (Fig. 9b). Note that the method of Morris found that the dominant controls on simulated release during 14–26 May (Fig. 9b) are the same as the dominant controls on simulated storage prior to that period (Fig. 9a), with strong negative sensitivities to Rref and irrFreq and strong positive sensitivity to Sref. The dominance of these three parameters corresponds well with our prior results, as detailed in Sect. 4.1. These results, however, run contrary to the real-world expectation that, for reservoirs with no upstream interactions, release rule parameters should influence release and storage in opposite directions.
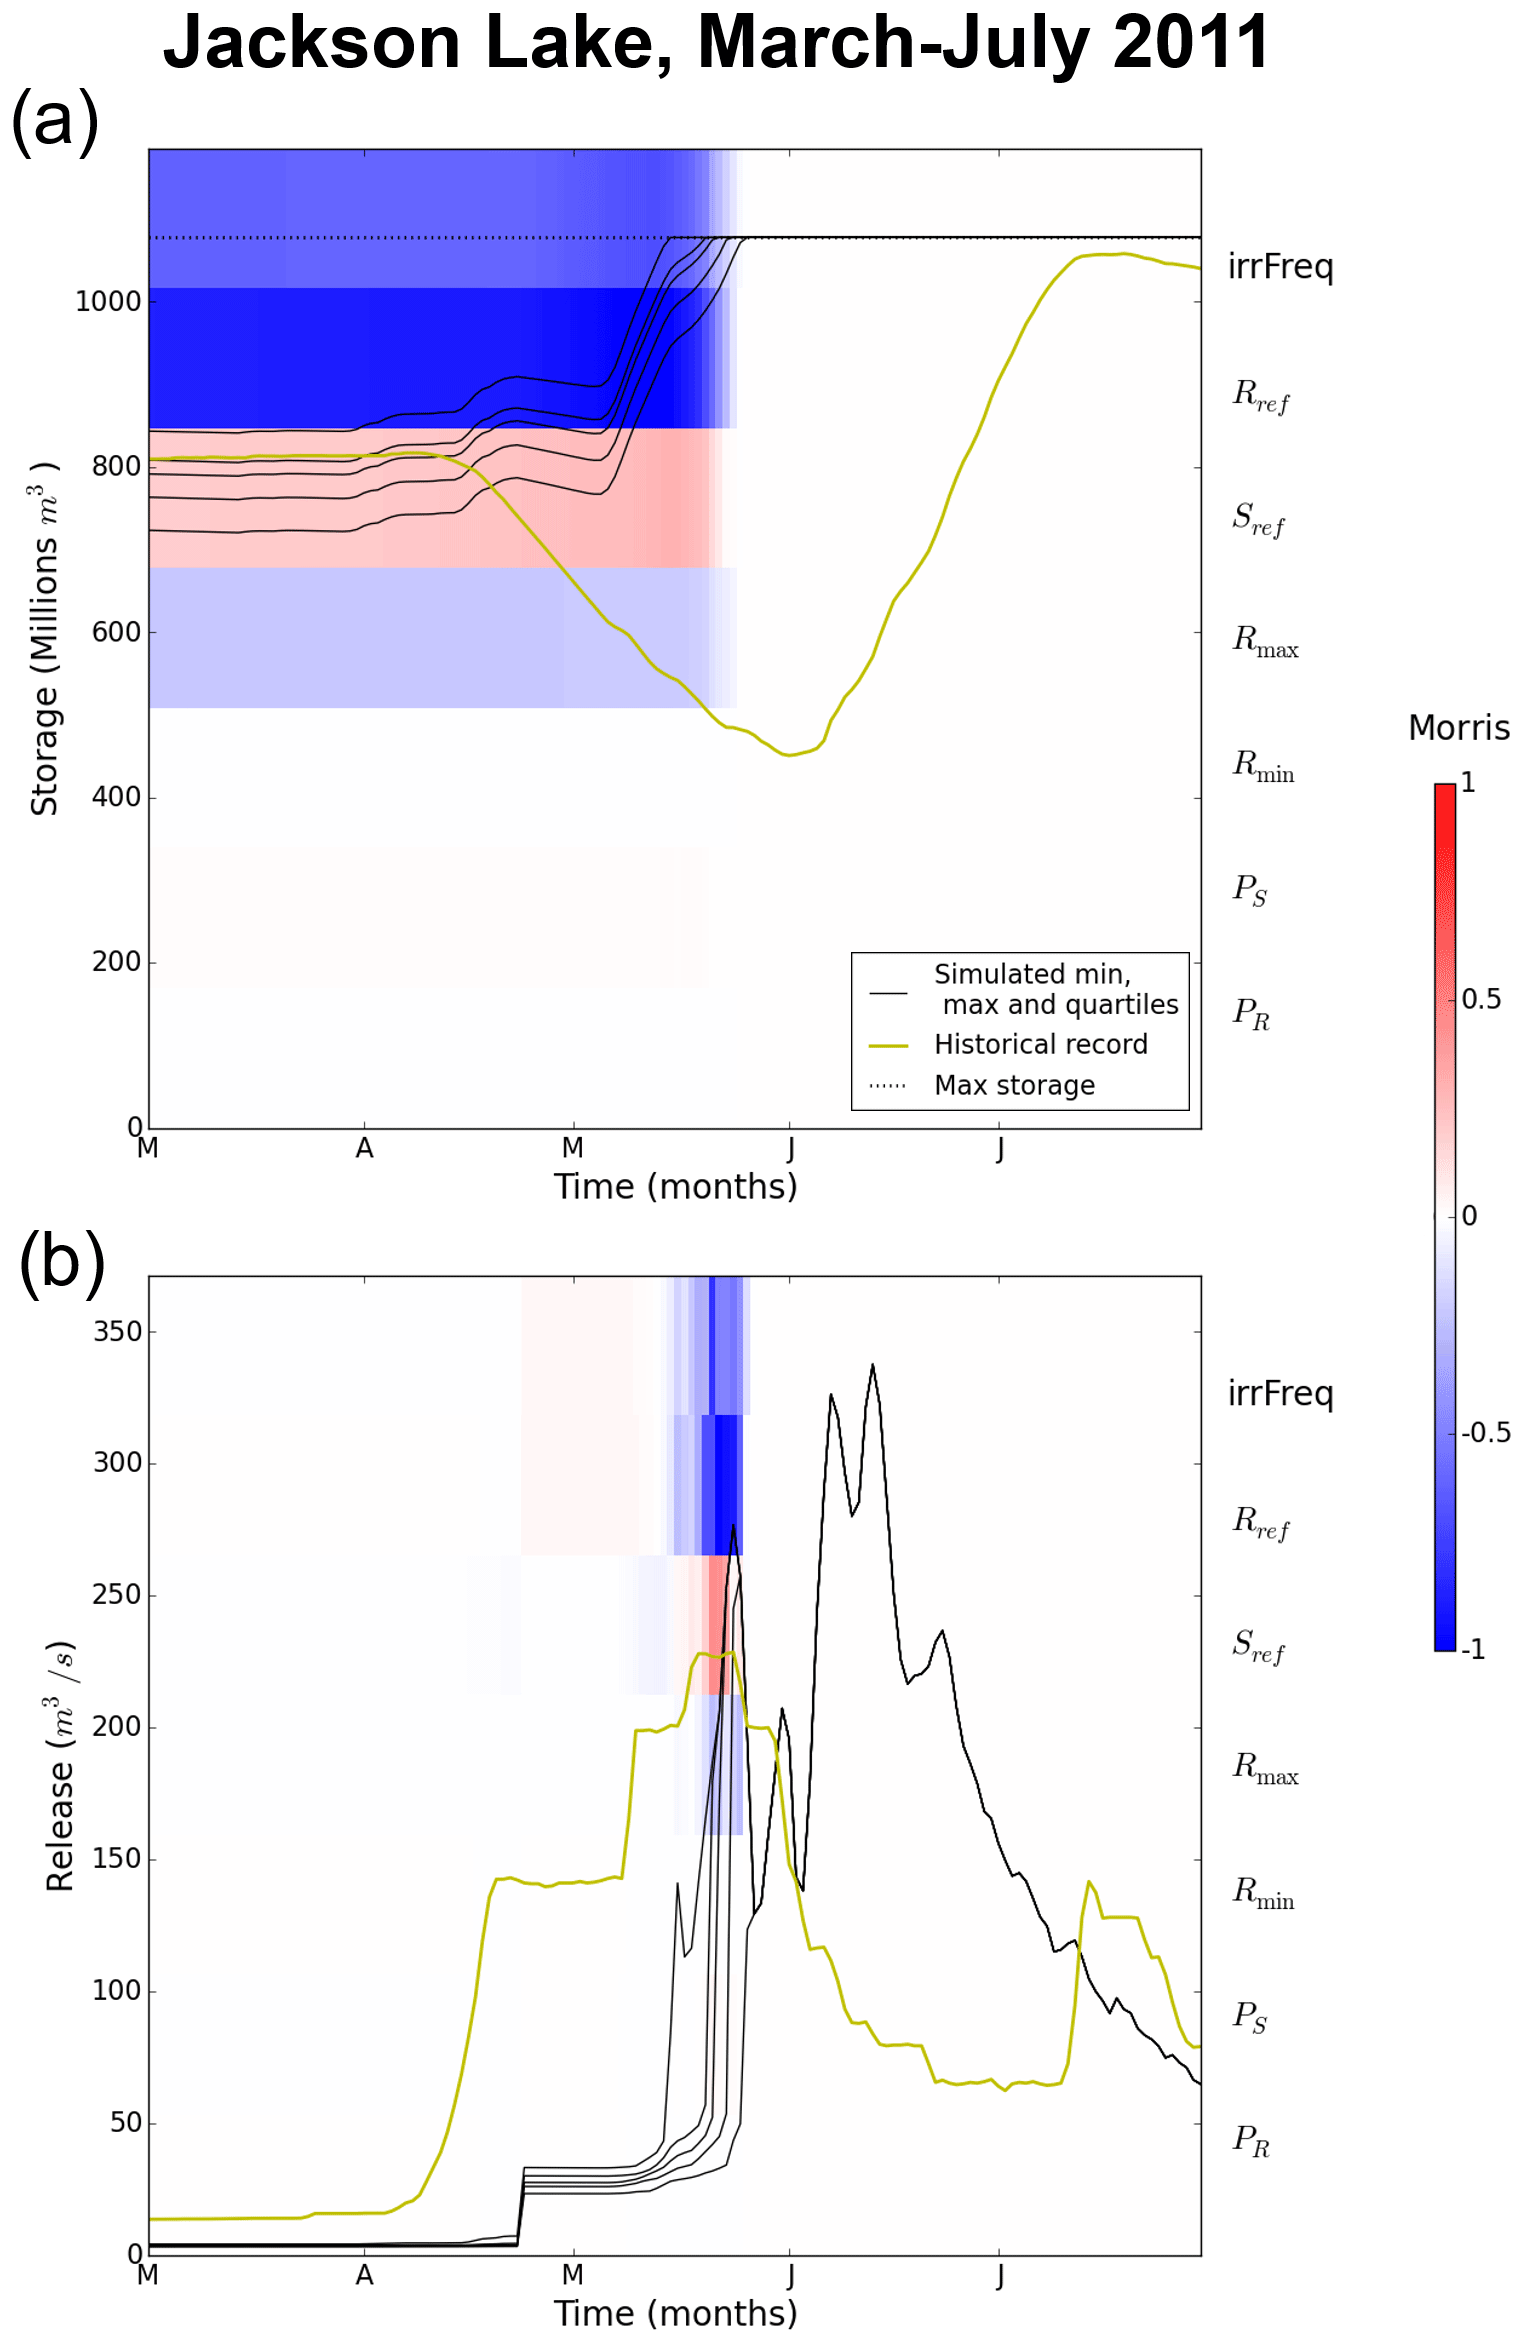
Figure 9Simulated values (max, min and quartiles, shown with black lines) with historical values (gold line) and sensitivity to input variables (background) for Jackson Lake's release and storage.
This is because, during the snowmelt-driven peak flow season, higher simulated storage leads to quicker reservoir filling, which takes away the reservoir's capacity to regulate peak flows. Once the reservoir is full, simulated peak releases out of Jackson Lake are much higher than the historically observed releases. These have been mitigated by real-world reservoir operators, who started releasing water in early April to decrease reservoir storage by almost half between then and early June. This created enough storage space to absorb the runoff from the peak snowmelt season in June, while simultaneously reducing releases to limit the reservoir's contribution to downstream high flows. In contrast, all simulated releases only increase gradually when the reservoir comes close to full capacity. Due to this lack of foresight-driven preventive releases in the simulations, Jackson Lake is full by the end of May and unable to absorb peak flow in June. This represents a large and consequential structural error in the model's representation of flooding operations and vulnerabilities.
4.4.2 Palisades
Moving to the next reservoir downstream, Fig. 10 illustrates the simulated (black lines) and historical (gold lines) storage and release dynamics for the Palisades reservoir in March–July 2011. All simulation results fill the reservoir entirely between 5, at the earliest, and 9 May, at the latest (Fig. 10a). Similar to Jackson Lake, this coincides with a period of maximal release sensitivity, according to the method of Morris results. The dominant controls for both storage and release are identical; they have the same parameters (irrFreq, Rref and Sref) with the same directional effects. Put simply, parameters that favor reservoir filling in simulations diminish the Palisades reservoir's capacity to store water and to absorb peak snowmelt season flows, leading to heightened simulated releases. Since Palisades is downstream of Jackson Lake and snowmelt occurs earlier at lower altitudes, simulated filling occurs earlier, and consequently, the WBM abstraction of the reservoir is subsequently unable to absorb snowmelt peaks, including the one event occurring on 24–26 May, as the result of Jackson Lake filling. This is evidenced by parametric release sensitivities and the concurrent simulated release peak (Fig. 10b) around these dates that necessarily come from upstream – there is no on-site release sensitivity when Palisades is full.
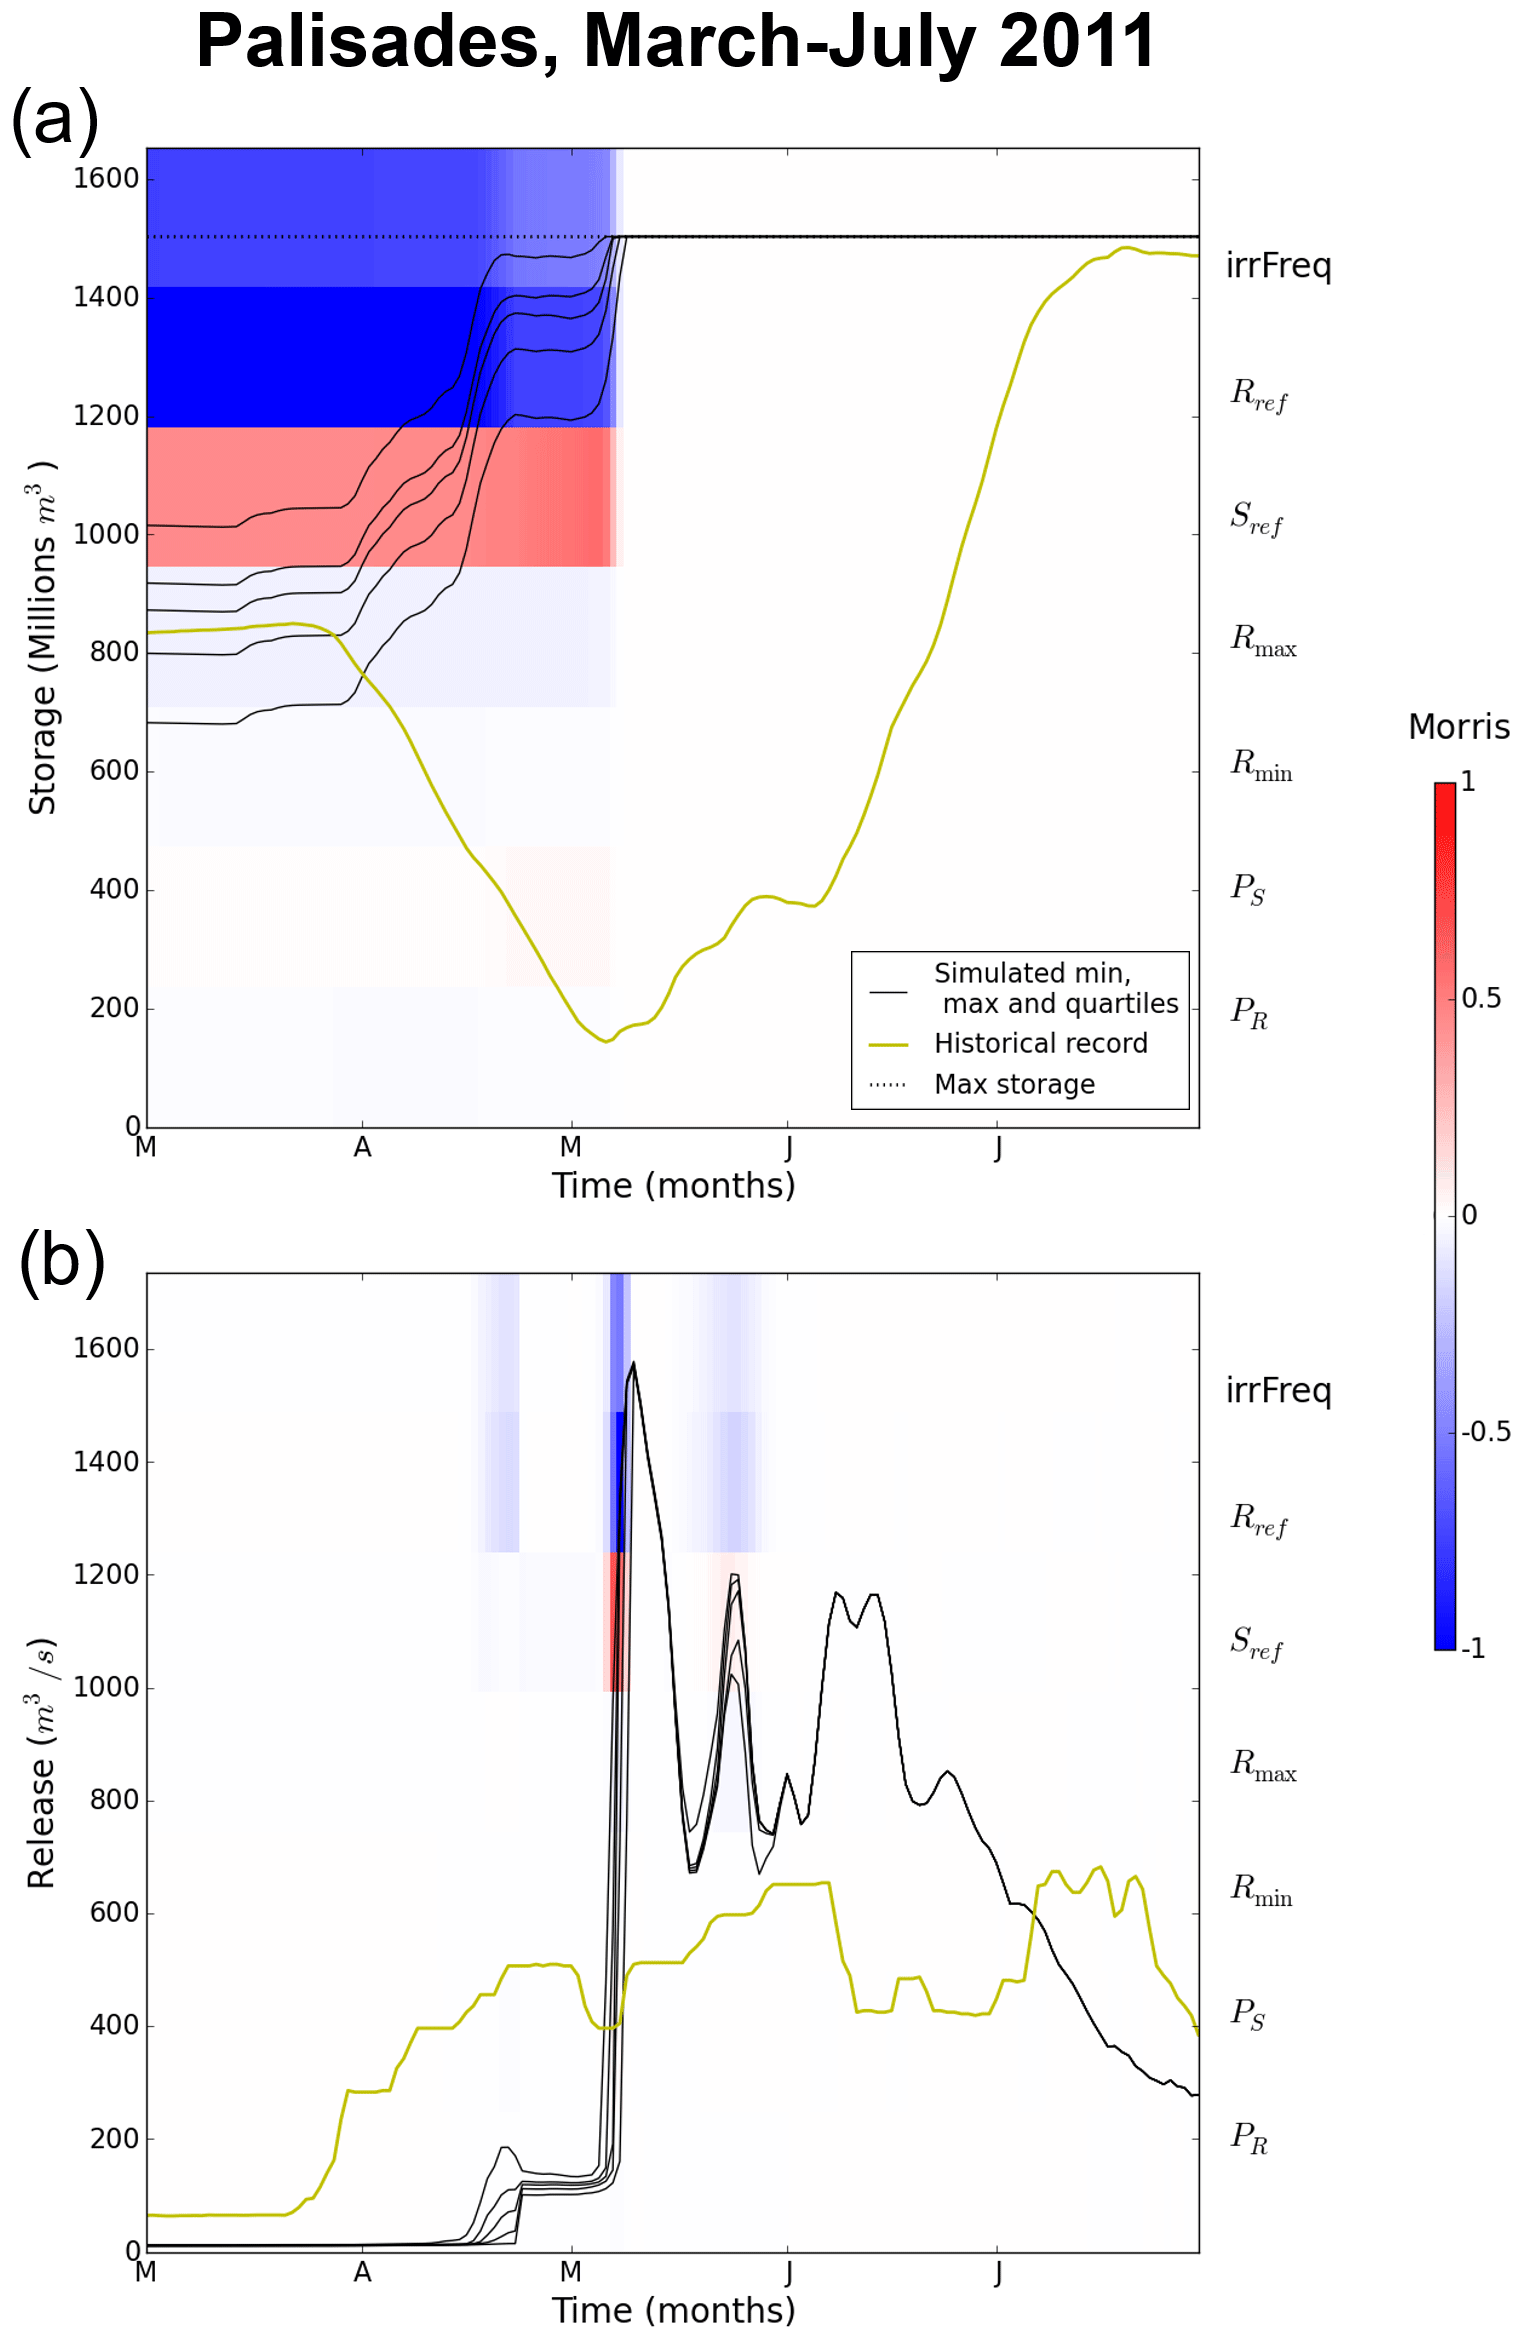
Figure 10Simulated values (max, min and quartiles, shown with black lines) with historical values (gold line) and sensitivity to input variables (background) for Palisades reservoir's release and storage.
In contrast, historical operations favored preventive releases, as early as the end of March at Palisades, to free up almost 1.3 km3 of storage space by early May – precisely at the time when the onset of snowmelt fills up the reservoir in simulations. This leaves over 1.1 km3 of storage space by early June, and the comparison of Figs. 9 and 10 shows that both Jackson Lake and Palisades filled at a near-constant pace throughout June, nearing being completely full around 10 July. This controlled and coordinated filling of both reservoirs ensured that releases well below 700 m3 s−1 at Palisades, a full 900 m3 s−1 lower than the simulated peak across virtually all of the simulated ensemble. The simulated peak is almost 40 % higher than the highest observed daily discharge over the past 40 years. Maximal Palisades release over this period – 1140 m3 s−1 on the 20 June 1997 – corresponds to a flooding event which led to six counties declaring a state of disaster, leading to over USD 11 million in relief by the US federal government (National Oceanic and Atmospheric Administration, 2020). Coordination is mediated by seasonal forecasts based on snowpack height and is apparent through the reduction in Jackson Lake release (Fig. 9b) when Palisades starts filling back up. As a result, neither reservoir ever loses its capacity to regulate streamflow by filling completely, and downstream releases are capped. The simulation is strongly inconsistent with the institutional flood control objectives of the reservoirs (US Bureau of Reclamations, 2012).
4.5 Offline water balance experiments
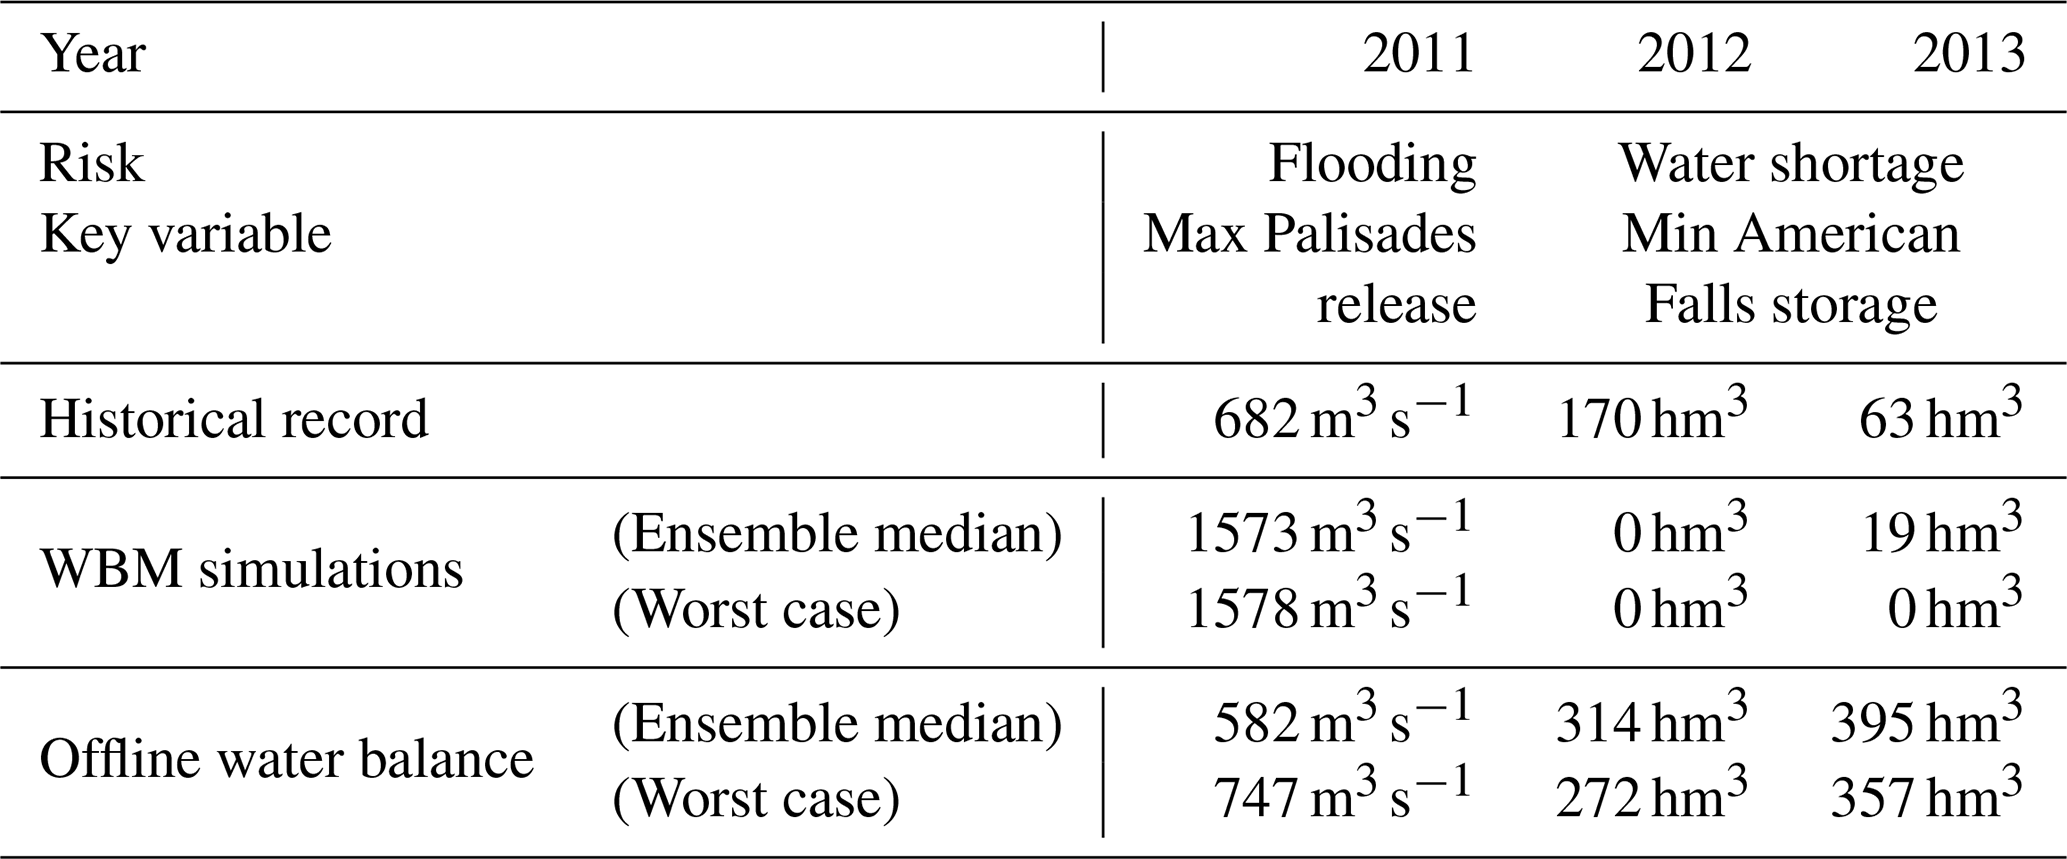
For both the low-flow and high-flow events, our analysis reveals how the absence of simulated coordination between the reservoir of the USRB cascade results in artificial erroneous water shortage and flooding. The actual operational observations capture upstream to downstream coordination in storages and releases that enabled real-world operators to avoid these outcomes. To support our hypothesis that coordination is the difference between modeled and observed outcomes, our offline water balance experiments add simple coordination mechanisms that quantitatively mimic the real-world observations. The water balance models take offline inflow, release and storage trajectories for each simulated ensemble member from our global sensitivity analysis during the events of interest. The coordination mechanisms we add depend on the event and are described below. Overall, our addition of simple coordination rules (Table 3) show that, for both events, coordination is enough to avoid the falsely modeled flooding in the 2011 event and the erroneous water shortage in 2012–2013.
Table 3Comparison of key variables for both the 2011 flood event and the 2012–2013 drought event for the historical record (displaying coordination between the reservoirs), the hydrological model (no coordination) and the offline water balance (modifying model outputs with simple coordination rules).
4.5.1 The 2011 flood event
We develop a simple offline water balance model for the two flood control reservoirs (Jackson Lake and Palisades) with the inflow, release and storage trajectories from every simulated ensemble member. To simulate observed coordination, we replace releases with a simple policy, starting in the last week of March and matching the timing at which operators started emptying Palisades. The Palisades release is set at a full 100 m3 s−1 lower than the maximum historical daily release of 682 m3 s−1, and a policy is set at Jackson Lake to match observations from Fig. 9). Releases are set to be (1) 200 m3 s−1 when Palisades is empty enough (less than 40 % full) or Jackson Lake is nearly (over 98 %) full and to (2) cut the release back to 50 m3 s−1 otherwise. The routing delay was fixed at 1 d, which is a conservative assumption that makes any excessive release from Jackson Lake immediately consequential for Palisades reservoir levels. Table 3 shows that including a simple coordinated flood control policy is enough to eliminate the flood peak obtained in model results. Figure 11 shows that coordination enables the possibility to avoid filling Jackson Lake across the whole ensemble and to also avoid filling Palisades in most cases. The only ensemble members for which Palisades is filled are the ones that start with much higher initial storage at both reservoirs; even then, filling only happens in late June, and peak flows are less than half those simulated without coordination.
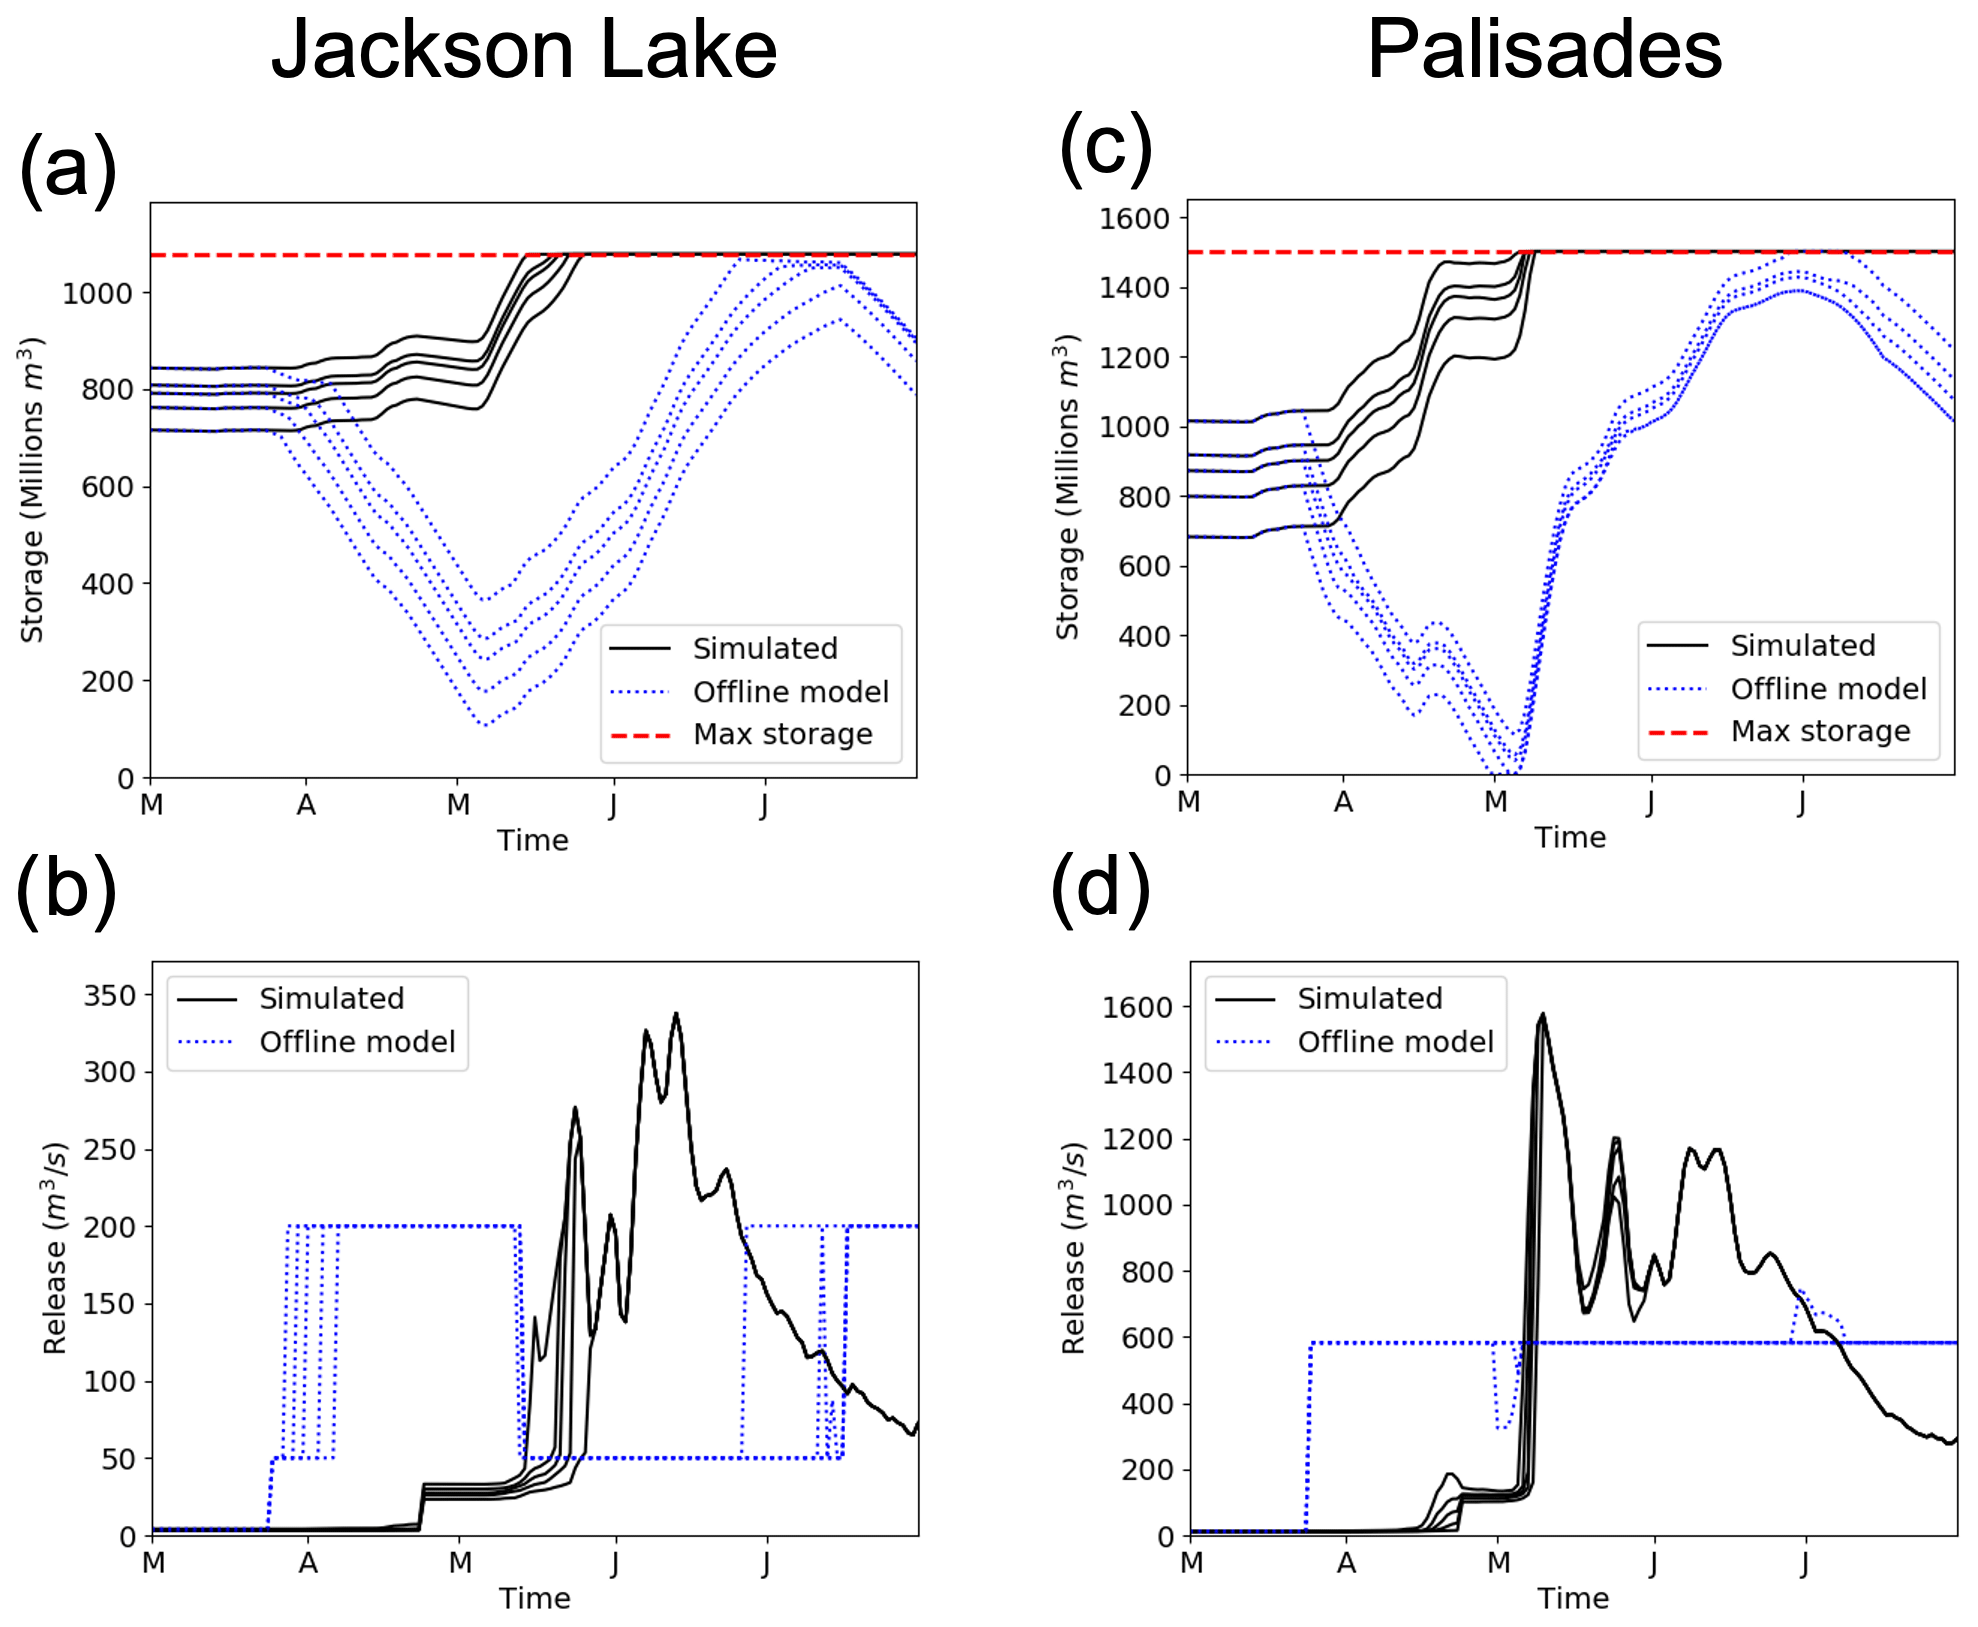
Figure 11Results from the coordinated offline reservoir water balance model (dotted blue lines) compared with hydrological model simulation results from non-coordinated operations (continuous black lines), including min and max values and quartiles for both ensembles. Differences in storage (a and c for Jackson Lake and Palisades, respectively) are due to a simple coordinated released policy starting in the last week of March (b and d for Jackson Lake and Palisades, respectively).
4.5.2 The 2012–2013 drought event
For both 2012 and 2013, we take model results from the Jackson Lake, Palisades and American Falls reservoirs offline for each of the 400 ensemble members. We then simulate operations obtained by releasing an extra 50 m3 s−1 than planned during the summer, according to release rules, as long as the reservoir is over 20 % full. The total extra volume released is thus consistent with the difference between historical and WBM-based simulated releases. Similar to observations from Fig. 8, this policy concerns only Palisades in 2012 and both Palisades and Jackson Lake in 2013. To make sure that underestimating routing times between reservoirs does not falsely cause the reservoirs to store water, we choose a conservatively high (for the area) routing time of 7 d between each reservoir and the one downstream. Results displayed in Table 3 show that, with this simple coordination water balance measure, American Falls would not have emptied in either year and across the full ensembles. Besides, reservoirs upstream of it would not have lost their capacity to supply downstream agriculture either (see Figs. S1 and S2 in the Supplement).
This work analyzes a state-of-the-art release rule from a large-scale, high-resolution hydrological model to understand the potential consequences of not capturing real-world operational coordination across reservoirs when simulating flood and drought events. It focuses on the USRB, a western US basin featuring a reservoir cascade managed with a high level of coordination to avoid both floods and water shortages, two risks made prominent by the area's geography and climate. An ensemble, simulated and analyzed using the screening method known as the method of Morris, provides evidence that parameterizing each reservoir in a cascade independently of the others is an approximation. This assumption implies that reservoirs are not coordinated, which has unintended consequences, as our work showcased (1) a quick and complete drawdown of reservoirs in irrigation hotspots during hot, dry summers and (2) the simulation of potentially catastrophic floods with untimely filling across the cascade. The historical record, and experiments based on offline water balance models of the reservoir cascade, demonstrate that, in both instances, coordinated reservoir management avoided the occurrence of these events.
In both the high-flow and the low-flow events, coordination and control decisions are mediated both by other reservoirs' operations and by other decision-relevant variables. This is obvious for the averted flood of 2011, where snowpack monitoring led to forecasts of large snowmelt with enough lead time to make space in two key reservoirs and coordinate their response. Similarly, the 2012–2013 decisions are mediated by water demands in the Snake River Plain. In both cases, the mix of institutional communication – between reservoirs and farmer representatives – and the monitoring of key water supply and demand predictors are instrumental for the implementation of successful coordination actions in the face of adverse climatic events. Recent research on the water management institutions of the Upper Snake River basin suggests that they are well equipped to show resilience in the face of expected climate change (Kliskey et al., 2019; Gilmore, 2019).
There is a growing body of literature highlighting the potentially highly interdependent nature of state-aware reservoir operations and institutional coordination in large, multipurpose reservoir cascades (Quinn et al., 2019). The importance of the institutional context and the location-specific nature of selecting key variables for informing forecasts is a significant challenge to large-scale hydrological modeling. Poor abstractions of forecast-informed reservoir operations and basin-specific institutions that support coordinated emergency responses limit the value of hydrological modeling in understanding vulnerabilities to extremes. In a context where high-resolution modeling (Wood et al., 2011; Bierkens et al., 2015) is framed as a key element for informing, monitoring and forecasting these risks at exquisitely fine spatial and temporal resolutions, it is urgent to move beyond validation based exclusively on goodness of fit. Model evaluations need to (1) identify key human and natural processes leading to flow extremes and (2) validate that these processes are present in the hydrological model. As recent developments in the literature on reservoir representations in hydrological models illustrate, there has been a growing sophistication in representations of release rules without addressing the key concern of capturing the key variables managers use to address unusual flow conditions in complex coupled human and natural systems. Parameterizations that are deemed good in the sense that they score well with respect to one or more of the goodness-of-fit indicators may not necessarily represent the underlying processes correctly (e.g., Legates and McCabe, 1999; Gupta et al., 2009). This point has recently been illustrated for reservoir representations in large-scale hydrological models through the flawed structural behavior of an upper Mekong (Lancang) basin model in which reservoirs had been omitted (Dang et al., 2020). This is why we did not attempt to calibrate reservoir rule parameters in this work. Besides becoming an increasingly difficult task going downstream, it would only have served to mask a portion of structural model errors without actually addressing them (also known as being right for the wrong reasons). To the contrary, this paper takes the view that the unintended consequences from these errors need to be exposed before well-calibrated but structurally deficient representations are used to assess out-of-sample flood and drought risks with future flow conditions that are often very different from those used for model calibration and evaluation. In this case, we exposed the need to refine representations of human-mediated coordination and controls in hydrological models, so they do not flag false vulnerabilities in a world where rapidly developing global crises are expected to yield large capital investments.
Approaches to address this need will have to contend with trade-offs between the quality of multi-reservoir operations modeling, computational costs and data availability (Masaki et al., 2017). The most straightforward way to represent complex human coordination processes and the key variables they rely on is to integrate actual management rules directly into hydrological models (Zagona et al., 2001; Yates et al., 2005). Such rule systems demonstrably improve hydrological models (Qiu et al., 2019), but they necessitate a direct knowledge of operations that is unavailable in most cases. Alternatively, machine learning techniques have been developed to infer reservoir operator behavior from historical observations but often assume that decisions are taken as a function of a set of standard hydrologic variables on a reservoir-by-reservoir basis (Hejazi et al., 2008; Ehsani et al., 2016; Coerver et al., 2018; Turner et al., 2020). Recently though, applications to multi-reservoir systems in California have seen these techniques extended to consider the impacts of forecast variables such as snowpack depth on operations (Yang et al., 2016) and to infer drought vulnerability from monthly operations (Giuliani and Herman, 2018). Our work demonstrates that further research is needed in this direction to fully account for complex feedbacks between climate variables, water supply and flood control objectives and release decisions. Emerging techniques enabling storage level monitoring, even in inaccessible areas including war zones (Müller et al., 2016; Avisse et al., 2017), could then make it possible to generalize machine-learning-based approaches.
An alternative to reproducing historical operations is to improve operations through optimization instead. Such optimization needs to consider the distinct and sometimes conflicting management objectives, including but not limited to protection against water shortages and floods. Using the example of a single reservoir with multiple commitments in terms of flood control, water supply and hydropower production, Giuliani et al. (2014) showed that the multiple vulnerabilities associated with historical operations could be mitigated using multi-objective heuristics. This emerging approach, called evolutionary multi-objective direct policy search (EMODPS Giuliani et al., 2016), proposes reservoir rules that trade-off flood and drought vulnerabilities with other reservoir management objectives. It has been successfully applied to a flood- and drought-prone multi-reservoir system (Quinn et al., 2017). Yet, this approach is also computationally expensive and needs to use offline water balance models to parameterize parsimonious reservoir rules that can be input into large-scale hydrological models.
The interactions between the multiple stakeholders in major river basin systems are complex, as is the interplay between the key variables they use to monitor and manage flood and drought risks. Although large-scale hydrological models have generally sought to abstract this complexity in their representation of human processes, they, at present, struggle to capture coordination and control processes in multi-reservoir systems. The current standard practice treats each reservoir's release independently from other reservoirs' storage levels. This paper demonstrates the unintended consequences this can have for flood and drought assessment, using a well-established hydrological model with advanced representations of multi-reservoir operations in the Upper Snake River basin. Our diagnostic assessment of a state-of-the-art release rule abstractions in large-scale hydrological models exploits time-varying sensitivity analysis based on the method of Morris to show how the behavioral controls in parameterized reservoir representations can inadvertently lead to amplifying errors. The diagnostic methodology used, which combines the method of Morris with real-world observations and offline water balance modeling along a reservoir cascade, can be replicated with other hydrological models, release rule representations and river basins. It provides insights to cumulative reservoir rules impacts across the basin at a daily time step. Application to the reservoir cascade on the Upper Snake River basin, with its complex institutions and careful monitoring of frequent flood and water risks, showed how failure to represent the appropriate monitoring and reservoir coordination processes could lead a hydrological model to simulate flood and drought events that actual basin operators would unequivocally avoid.
This finding is consequential at a time where reservoir rules of increasing sophistication are being proposed to come to a better agreement between observed and simulated releases, and where the monitoring and forecasting of water-related risks at extremely high resolutions is hailed at the future of hydrology. It demonstrates the necessity to complement goodness-of-fit testing by devising validation techniques that check for the structural behavior of human-operated structures in the face of water emergencies. This is not a task for hydrologists alone as developments across water resources management, operations research, machine learning and assimilation of remotely sensed data, among others, all have a role to play in tackling this challenge, and this work highlights the urgency with respect to finding its solution.
Core WBM code is available from the authors on request, and so is the code for this sensitivity analysis. Result data and code necessary to compile the figures are available online at https://github.com/charlesrouge/ (last access: 15 September 2020) (Rougé et al., 2020).
The supplement related to this article is available online at: https://doi.org/10.5194/hess-25-1365-2021-supplement.
PMR and RBL obtained funding for the study. DSG, SZ, AP, SG and RBL developed the WBM model for the USRB that this study used. DSG, SZ, AP and SG enabled the porting of the WBM model to CR and PMR. CR, PMR and JRL contributed to the design of the analysis. CR performed the analysis under the mentoring of PMR. CR wrote the paper and led revisions in close collaboration with PMR and with contributions from DSG, SZ, AP, JRL and RBL.
The authors declare that they have no conflict of interest.
This work has been supported by the US Department of Energy, Office of Science, Biological and Environmental Research Program, Earth and Environmental Systems Modeling, MultiSector Dynamics (grant no. DE-SC0016162), and the material this work was based upon has been supported by the National Science Foundation (grant no. 1639524) as part of the Innovations at the Nexus of Food, Energy and Water Systems (INFEWS) program.
This paper was edited by Micha Werner and reviewed by three anonymous referees.
Abatzoglou, J. T.: Development of gridded surface meteorological data for ecological applications and modelling, Int. J. Climatol., 33, 121–131, https://doi.org/10.1002/joc.3413, 2013. a
Adam, J. C., Haddeland, I., Su, F., and Lettenmaier, D. P.: Simulation of reservoir influences on annual and seasonal streamflow changes for the Lena, Yenisei, and Ob' rivers, J. Geophys. Res.-Atmos., 112, D24114, https://doi.org/10.1029/2007JD008525, 2007. a, b, c
Ahmadalipour, A. and Moradkhani, H.: Analyzing the uncertainty of ensemble-based gridded observations in land surface simulations and drought assessment, J. Hydrol., 555, 557–568, https://doi.org/10.1016/j.jhydrol.2017.10.059, 2017. a
Allen, R. G., Pereira, L. S., Raes, D., and Smith, M.: Crop evapotranspiration-Guidelines for computing crop water requirements – FAO Irrigation and drainage paper 56, FAO, Rome, 326 pp., 1998. a
Avisse, N., Tilmant, A., Müller, M. F., and Zhang, H.: Monitoring small reservoirs' storage with satellite remote sensing in inaccessible areas, Hydrol. Earth Syst. Sci., 21, 6445–6459, https://doi.org/10.5194/hess-21-6445-2017, 2017. a
Biemans, H., Haddeland, I., Kabat, P., Ludwig, F., Hutjes, R. W. A., Heinke, J., von Bloh, W., and Gerten, D.: Impact of reservoirs on river discharge and irrigation water supply during the 20th century, Water Resour. Res., 47, W03509, https://doi.org/10.1029/2009WR008929, 2011. a, b, c, d, e
Bierkens, M. F. P.: Global hydrology 2015: State, trends, and directions, Water Resour. Res., 51, 4923–4947, https://doi.org/10.1002/2015WR017173, 2015. a
Bierkens, M. F. P., Bell, V. A., Burek, P., Chaney, N., Condon, L. E., David, C. H., de Roo, A., Döll, P., Drost, N., Famiglietti, J. S., Flörke, M., Gochis, D. J., Houser, P., Hut, R., Keune, J., Kollet, S., Maxwell, R. M., Reager, J. T., Samaniego, L., Sudicky, E., Sutanudjaja, E. H., van de Giesen, N., Winsemius, H., and Wood, E. F.: Hyper-resolution global hydrological modelling: what is next?, Hydrol. Process., 29, 310–320, https://doi.org/10.1002/hyp.10391, 2015. a
Bierkens, M. F. P., Reinhard, S., de Bruijn, J. A., Veninga, W., and Wada, Y.: The Shadow Price of Irrigation Water in Major Groundwater-Depleting Countries, Water Resour. Res., 55, 4266–4287, https://doi.org/10.1029/2018WR023086, 2019. a
Burek, P. A., Roo, A. D., and van der Knijff, J.: LISFLOOD - Distributed Water Balance and Flood Simulation Model – Revised User Manual, Tech. Rep., Publications Office of the European Union, Directorate-General Joint Research Centre, Institute for Environment and Sustainability, Ispra, Italy, 2013. a, b
Campolongo, F., Cariboni, J., and Saltelli, A.: An effective screening design for sensitivity analysis of large models, Environ. Model. Softw., 22, 1509–1518, https://doi.org/10.1016/j.envsoft.2006.10.004, 2007. a, b
Center For International Earth Science Information Network – CIESIN – Columbia University: Gridded Population of the World, Version 4 (GPWv4): Population Density, NASA Socioeconomic Data and Applications Center (SEDAC), Palisades, NY, USA, 2016. a
Coe, M. T.: Modeling Terrestrial Hydrological Systems at the Continental Scale: Testing the Accuracy of an Atmospheric GCM, J. Climate, 13, 686–704, https://doi.org/10.1175/1520-0442(2000)013<0686:MTHSAT>2.0.CO;2, 2000. a
Coerver, H. M., Rutten, M. M., and van de Giesen, N. C.: Deduction of reservoir operating rules for application in global hydrological models, Hydrol. Earth Syst. Sci., 22, 831–851, https://doi.org/10.5194/hess-22-831-2018, 2018. a, b
Dang, T. D., Chowdhury, A. F. M. K., and Galelli, S.: On the representation of water reservoir storage and operations in large-scale hydrological models: implications on model parameterization and climate change impact assessments, Hydrol. Earth Syst. Sci., 24, 397–416, https://doi.org/10.5194/hess-24-397-2020, 2020. a
Dieter, C. A., Maupin, M. A., Caldwell, R. R., Harris, M. A., Ivahnenko, T. I., Lovelace, J. K., Barber, N. L., and Linsey, K. S.: Estimated use of water in the United States in 2015, USGS Numbered Series 1441, iP-090439, US Geological Survey, Reston, VA, available at: http://pubs.er.usgs.gov/publication/cir1441, last access: 13 November 2018. a
Döll, P., Kaspar, F., and Lehner, B.: A global hydrological model for deriving water availability indicators: model tuning and validation, J. Hydrol., 270, 105–134, https://doi.org/10.1016/S0022-1694(02)00283-4, 2003. a
Döll, P., Fiedler, K., and Zhang, J.: Global-scale analysis of river flow alterations due to water withdrawals and reservoirs, Hydrol. Earth Syst. Sci., 13, 2413–2432, https://doi.org/10.5194/hess-13-2413-2009, 2009. a, b
Dynesius, M. and Nilsson, C.: Fragmentation and Flow Regulation of River Systems in the Northern Third of the World, Science, 266, 753–762, https://doi.org/10.1126/science.266.5186.753, 1994. a
Ehsani, N., Fekete, B. M., Vörösmarty, C. J., and Tessler, Z. D.: A neural network based general reservoir operation scheme, Stoch. Environ. Res. Risk A., 30, 1151–1166, https://doi.org/10.1007/s00477-015-1147-9, 2016. a, b, c
Ehsani, N., Vörösmarty, C. J., Fekete, B. M., and Stakhiv, E. Z.: Reservoir operations under climate change: Storage capacity options to mitigate risk, J. Hydrol., 555, 435–446, https://doi.org/10.1016/j.jhydrol.2017.09.008, 2017. a
Gelaro, R., McCarty, W., Suárez, M. J., Todling, R., Molod, A., Takacs, L., Randles, C. A., Darmenov, A., Bosilovich, M. G., Reichle, R., Wargan, K., Coy, L., Cullather, R., Draper, C., Akella, S., Buchard, V., Conaty, A., da Silva, A. M., Gu, W., Kim, G.-K., Koster, R., Lucchesi, R., Merkova, D., Nielsen, J. E., Partyka, G., Pawson, S., Putman, W., Rienecker, M., Schubert, S. D., Sienkiewicz, M., and Zhao, B.: The Modern-Era Retrospective Analysis for Research and Applications, Version 2 (MERRA-2), J. Climate, 30, 5419–5454, https://doi.org/10.1175/JCLI-D-16-0758.1, 2017. a
Gilmore, S.: Assessing the Adaptive Capacity of Idaho's Magic Valley As a Complex Social-Ecological System, MS thesis, University of Idaho, Moscow, ID, 2019. a
Giuliani, M. and Herman, J. D.: Modeling the behavior of water reservoir operators via eigenbehavior analysis, Adv. Water Resour., 122, 228–237, https://doi.org/10.1016/j.advwatres.2018.10.021, 2018. a
Giuliani, M., Herman, J. D., Castelletti, A., and Reed, P.: Many-objective reservoir policy identification and refinement to reduce policy inertia and myopia in water management, Water Resour. Res., 50, 3355–3377, https://doi.org/10.1002/2013WR014700, 2014. a
Giuliani, M., Castelletti, A., Pianosi, F., Mason, E., and Reed, P. M.: Curses, Tradeoffs, and Scalable Management: Advancing Evolutionary Multiobjective Direct Policy Search to Improve Water Reservoir Operations, J. Water Resour. Plan. Manage., 142, 04015050, https://doi.org/10.1061/(ASCE)WR.1943-5452.0000570, 2016. a
Grill, G., lehner, B., Thieme, M., Geenen, B., Tickner, D., Antonelli, F., Babu, S., Borrelli, P., l. Cheng, Crochetiere, H., Macedo, H. E., Filgueiras, R., Goichot, M., Higgins, J., Hogan, Z., Lip, B., Mcclain, M. E., Meng, J., Mulligan, M., Nilsson, C., Olden, J. D., Opperman, J. J., Petry, P., Liermann, C. R., l. S/'aenz, Salinas-Rodr/'iguez, S., Schelle, P., Schmitt, R. J. P., Snider, J., anf K. Tockner, F. T., Valdujo, P. H., van Soesbergen, A., and Zarfl, C.: Mapping the world's free-flowing rivers, Nature, 569, 215–221, https://doi.org/10.1038/s41586-019-1111-9, 2019. a
Grogan, D. S.: Global and regional assessments of unsustainable groundwater use in irrigated agriculture, PhD thesis, University of New Hampshire, USA, available at: http://scholars.unh.edu/dissertation/2 (last access: 21 May 2019), 2016. a
Grogan, D. S., Zhang, F., Prusevich, A., Lammers, R. B., Wisser, D., Glidden, S., Li, C., and Frolking, S.: Quantifying the link between crop production and mined groundwater irrigation in China, Sci. Total Environ., 511, 161–175, https://doi.org/10.1016/j.scitotenv.2014.11.076, 2015. a, b, c
Grogan, D. S., Wisser, D., Prusevich, A., Lammers, R. B., and Frolking, S.: The use and re-use of unsustainable groundwater for irrigation: a global budget, Environ. Res. Lett., 12, 034017, https://doi.org/10.1088/1748-9326/aa5fb2, 2017. a, b, c, d, e, f
Gupta, H. V., Kling, H., Yilmaz, K. K., and Martinez, G. F.: Decomposition of the mean squared error and NSE performance criteria: Implications for improving hydrological modelling, J. Hydrol., 377, 80–91, https://doi.org/10.1016/j.jhydrol.2009.08.003, 2009. a
Guse, B., Reusser, D. E., and Fohrer, N.: How to improve the representation of hydrological processes in SWAT for a lowland catchment – temporal analysis of parameter sensitivity and model performance, Hydrol. Process., 28, 2651–2670, https://doi.org/10.1002/hyp.9777, 2014. a
Haddeland, I., Skaugen, T., and Lettenmaier, D. P.: Anthropogenic impacts on continental surface water fluxes, Geophys. Res. Lett., 33, L08406, https://doi.org/10.1029/2006GL026047, 2006. a, b, c
Hamlet, A. F. and Lettenmaier, D. P.: Effects of Climate Change on Hydrology and Water Resources in the Columbia River Basin, J. Am. Water Resour. Assoc., 35, 1597–1623, https://doi.org/10.1111/j.1752-1688.1999.tb04240.x, 1999. a
Han, W., Yang, Z., Di, L., and Mueller, R.: CropScape: A Web service based application for exploring and disseminating US conterminous geospatial cropland data products for decision support, Comput. Electron. Agric., 84, 111–123, https://doi.org/10.1016/j.compag.2012.03.005, 2012. a
Hanasaki, N., Kanae, S., and Oki, T.: A reservoir operation scheme for global river routing models, J. Hydrol., 327, 22–41, https://doi.org/10.1016/j.jhydrol.2005.11.011, 2006. a, b, c, d, e, f
Hanasaki, N., Kanae, S., Oki, T., Masuda, K., Motoya, K., Shirakawa, N., Shen, Y., and Tanaka, K.: An integrated model for the assessment of global water resources – Part 1: Model description and input meteorological forcing, Hydrol. Earth Syst. Sci., 12, 1007–1025, https://doi.org/10.5194/hess-12-1007-2008, 2008. a
Hanasaki, N., Fujimori, S., Yamamoto, T., Yoshikawa, S., Masaki, Y., Hijioka, Y., Kainuma, M., Kanamori, Y., Masui, T., Takahashi, K., and Kanae, S.: A global water scarcity assessment under Shared Socio-economic Pathways – Part 2: Water availability and scarcity, Hydrol. Earth Syst. Sci., 17, 2393–2413, https://doi.org/10.5194/hess-17-2393-2013, 2013. a
Hanasaki, N., Yoshikawa, S., Pokhrel, Y., and Kanae, S.: A Quantitative Investigation of the Thresholds for Two Conventional Water Scarcity Indicators Using a State-of-the-Art Global Hydrological Model With Human Activities, Water Resour. Res., 54, 8279–8294, https://doi.org/10.1029/2018WR022931, 2018. a
Hejazi, M. I., Cai, X., and Ruddell, B. L.: The role of hydrologic information in reservoir operation – Learning from historical releases, Adv. Water Resour., 31, 1636–1650, 2008. a
Hejazi, M. I., Voisin, N., Liu, L., Bramer, L. M., Fortin, D. C., Hathaway, J. E., Huang, M., Kyle, P., Leung, L. R., Li, H.-Y., Liu, Y., Patel, P. L., Pulsipher, T. C., Rice, J. S., Tesfa, T. K., Vernon, C. R., and Zhou, Y.: 21st century United States emissions mitigation could increase water stress more than the climate change it is mitigating, P. Natl. Acad. Sci. USA, 112, 10635–10640, https://doi.org/10.1073/pnas.1421675112, 2015. a
Herbert, C. and Döll, P.: Global assessment of current and future groundwater stress with a focus on transboundary aquifers, Water Resour. Res., 55, 4760–4784, https://doi.org/10.1029/2018WR023321, 2019. a
Herman, J. and Usher, W.: SALib: An open-source Python library for Sensitivity Analysis, J. Open Source Softw., 2, 97, https://doi.org/10.21105/joss.00097, 2017. a
Herman, J. D., Kollat, J. B., Reed, P. M., and Wagener, T.: Technical Note: Method of Morris effectively reduces the computational demands of global sensitivity analysis for distributed watershed models, Hydrol. Earth Syst. Sci., 17, 2893–2903, https://doi.org/10.5194/hess-17-2893-2013, 2013a. a
Herman, J. D., Kollat, J. B., Reed, P. M., and Wagener, T.: From maps to movies: high-resolution time-varying sensitivity analysis for spatially distributed watershed models, Hydrol. Earth Syst. Sci., 17, 5109–5125, https://doi.org/10.5194/hess-17-5109-2013, 2013b. a, b
Hoekema, D. J. and Sridhar, V.: Relating climatic attributes and water resources allocation: A study using surface water supply and soil moisture indices in the Snake River basin, Idaho, Water Resour. Res., 47, W07536, https://doi.org/10.1029/2010WR009697, 2011. a
Independent Panel To Review Cause of Teton Dam Failure: Report to US Department of Interior and State of Idaho on Failure of Teton Dam, Tech. Rep., United States Bureau of Reclamations, available at: https://www.usbr.gov/pn/snakeriver/dams/uppersnake/teton/1976failure.pdf (last access: 20 May 2018), 1976. a
Iooss, B. and Lemaître, P.: A Review on Global Sensitivity Analysis Methods, Springer US, Boston, MA, 101–122, https://doi.org/10.1007/978-1-4899-7547-8_5, 2015. a
Jägermeyr, J., Gerten, D., Heinke, J., Schaphoff, S., Kummu, M., and Lucht, W.: Water savings potentials of irrigation systems: global simulation of processes and linkages, Hydrol. Earth Syst. Sci., 19, 3073–3091, https://doi.org/10.5194/hess-19-3073-2015, 2015. a
Jägermeyr, J., Gerten, D., Schaphoff, S., Heinke, J., Lucht, W., and Rockström, J.: Integrated crop water management might sustainably halve the global food gap, Environ. Res. Lett., 11, 025002, https://doi.org/10.1088/1748-9326/11/2/025002, 2016. a
Jeuland, M., Baker, J., Bartlett, R., and Lacombe, G.: The costs of uncoordinated infrastructure management in multi-reservoir river basins, Environ. Res. Lett., 9, 105006, https://doi.org/10.1088/1748-9326/9/10/105006, 2014. a
Kliskey, A., Abatzoglou, J., Alessa, L., Kolden, C., Hoekema, D., Moore, B., Gilmore, S., and Austin, G.: Planning for Idaho's waterscapes: A review of historical drivers and outlook for the next 50 years, Environ. Sci. Policy, 94, 191–201, https://doi.org/10.1016/j.envsci.2019.01.009, 2019. a
Kraucunas, I., Clarke, L., Dirks, J., Hathaway, J., Hejazi, M., Hibbard, K., Huang, M., Jin, C., Kintner-Meyer, M., van Dam, K. K., Leung, R., Li, H.-Y., Moss, R., Peterson, M., Rice, J., Scott, M., Thomson, A., Voisin, N., and West, T.: Investigating the nexus of climate, energy, water, and land at decision-relevant scales: the Platform for Regional Integrated Modeling and Analysis (PRIMA), Climatic Change, 129, 573–588, https://doi.org/10.1007/s10584-014-1064-9, 2015. a
Lamontagne, J. R., Reed, P. M., Marangoni, G., Keller, K., and Garner, G. G.: Robust abatement pathways to tolerable climate futures require immediate global action, Nat. Clim. Change, 9, 290–294, https://doi.org/10.1038/s41558-019-0426-8, 2019. a
Latrubesse, E. M., Arima, E. Y., Dunne, T., Park, E., Baker, V. R., d'Horta, F. M., Wight, C., Wittmann, F., Zuanon, J., Baker, P. A., Ribas, C. C., Norgaard, R. B., Filizola, N., Ansar, A., Flyvbjerg, B., and Stevaux, J. C.: Damming the rivers of the Amazon basin, Nature, 546, 363–369, https://doi.org/10.1038/nature22333, 2017. a
Legates, D. R. and McCabe Jr., G. J.: Evaluating the use of “goodness-of-fit” Measures in hydrologic and hydroclimatic model validation, Water Resour. Res., 35, 233–241, https://doi.org/10.1029/1998WR900018, 1999. a
Lehner, B., Verdin, K., and Jarvis, A.: New Global Hydrography Derived From Spaceborne Elevation Data, Eos Tran. AGU, 89, 93–94, https://doi.org/10.1029/2008EO100001, 2008. a
Lehner, B., Liermann, C. R., Revenga, C., Vörösmarty, C., Fekete, B., Crouzet, P., Döll, P., Endejan, M., Frenken, K., Magome, J., Nilsson, C., Robertson, J. C., Rödel, R., Sindorf, N., and Wisser, D.: High-resolution mapping of the world's reservoirs and dams for sustainable river-flow management, Front. Ecol. Environ., 9, 494–502, https://doi.org/10.1890/100125, 2011. a
Li, H.-Y., Leung, L. R., Getirana, A., Huang, M., Wu, H., Xu, Y., Guo, J., and Voisin, N.: Evaluating Global Streamflow Simulations by a Physically Based Routing Model Coupled with the Community Land Model, J. Hydrometeorol., 16, 948–971, https://doi.org/10.1175/JHM-D-14-0079.1, 2015. a
Liu, J., Hertel, T. W., Lammers, R. B., Prusevich, A., Baldos, U. L. C., Grogan, D. S., and Frolking, S.: Achieving sustainable irrigation water withdrawals: global impacts on food security and land use, Environ. Res. Lett., 12, 104009, https://doi.org/10.1088/1748-9326/aa88db, 2017. a, b
Liu, X., Liu, W., Yang, H., Tang, Q., Flörke, M., Masaki, Y., Müller Schmied, H., Ostberg, S., Pokhrel, Y., Satoh, Y., and Wada, Y.: Multimodel assessments of human and climate impacts on mean annual streamflow in China, Hydrol. Earth Syst. Sci., 23, 1245–1261, https://doi.org/10.5194/hess-23-1245-2019, 2019. a
Loucks, D. P. and van Beek, E.: Water Resources Systems Planning and Management, UNESCO, Paris, 2005. a
Marques, G. F. and Tilmant, A.: The economic value of coordination in large-scale multireservoir systems: The Parana River case, Water Resour. Res., 49, 7546–7557, https://doi.org/10.1002/2013WR013679, 2013. a
Masaki, Y., Hanasaki, N., Biemans, H., Schmied, H. M., Tang, Q., Wada, Y., Gosling, S. N., Takahashi, K., and Hijioka, Y.: Intercomparison of global river discharge simulations focusing on dam operation – multiple models analysis in two case-study river basins, Missouri-Mississippi and Green-Colorado, Environ. Res. Lett., 12, 055002, https://doi.org/10.1088/1748-9326/aa57a8, 2017. a, b
Mateo, C. M., Hanasaki, N., Komori, D., Tanaka, K., Kiguchi, M., Champathong, A., Sukhapunnaphan, T., Yamazaki, D., and Oki, T.: Assessing the impacts of reservoir operation to floodplain inundation by combining hydrological, reservoir management, and hydrodynamic models, Water Resour. Res., 50, 7245–7266, https://doi.org/10.1002/2013WR014845, 2014. a
Maupin, M. A., Kenny, J. F., Hutson, S. S., Lovelace, J. K., Barber, N. L., and Linsey, K. S.: Estimated use of water in the United States in 2010, no. 1405 in Circular, US Geological Survey, Reston, Virginia, 2014. a
McGuire, M., Wood, A. W., Hamlet, A. F., and Lettenmaier, D. P.: Use of Satellite Data for Streamflow and Reservoir Storage Forecasts in the Snake River Basin, J. Water Resour. Plan. Manage., 132, 97–110, https://doi.org/10.1061/(ASCE)0733-9496(2006)132:2(97), 2006. a
Meigh, J. R., McKenzie, A. A., and Sene, K. J.: A Grid-Based Approach to Water Scarcity Estimates for Eastern and Southern Africa, Water Resour. Manag., 13, 85–115, https://doi.org/10.1023/A:1008025703712, 1999. a
Metin, A. D., Dung, N. V., Schröter, K., Guse, B., Apel, H., Kreibich, H., Vorogushyn, S., and Merz, B.: How do changes along the risk chain affect flood risk?, Nat. Hazards Earth Syst. Sci., 18, 3089–3108, https://doi.org/10.5194/nhess-18-3089-2018, 2018. a
Meza, I., Siebert, S., Döll, P., Kusche, J., Herbert, C., Eyshi Rezaei, E., Nouri, H., Gerdener, H., Popat, E., Frischen, J., Naumann, G., Vogt, J. V., Walz, Y., Sebesvari, Z., and Hagenlocher, M.: Global-scale drought risk assessment for agricultural systems, Nat. Hazards Earth Syst. Sci., 20, 695–712, https://doi.org/10.5194/nhess-20-695-2020, 2020. a
Mishra, V., Aaadhar, S., Shah, H., Kumar, R., Pattanaik, D. R., and Tiwari, A. D.: The Kerala flood of 2018: combined impact of extreme rainfall and reservoir storage, Hydrol. Earth Syst. Sci. Discuss. [preprint], https://doi.org/10.5194/hess-2018-480, 2018. a
Monteith, J. L.: Evaporation and the Environment in the State and Movement of Water in Living Organisms, in: Proceedings of the Society for Experimental Biology, Symposium No. 19, Cambridge University Press, Cambridge, 205–234, 1965. a
Morris, M. D.: Factorial Sampling Plans for Preliminary Computational Experiments, Technometrics, 33, 161–174, https://doi.org/10.1080/00401706.1991.10484804, 1991. a, b
Müller, M. F., Yoon, J., Gorelick, S. M., Avisse, N., and Tilmant, A.: Impact of the Syrian refugee crisis on land use and transboundary freshwater resources, P. Natl. Acad. Sci. USA, 113, 14932–14937, https://doi.org/10.1073/pnas.1614342113, 2016. a
Musselman, K. N., Lehner, F., Ikeda, K., Clark, M. P., Prein, A. F., Liu, C., Barlage, M., and Rasmussen, R.: Projected increases and shifts in rain-on-snow flood risk over western North America, Nat. Clim. Change, 8, 808–812, https://doi.org/10.1038/s41558-018-0236-4, 2018. a
Najibi, N., Devineni, N., and Lu, M.: Hydroclimate drivers and atmospheric teleconnections of long duration floods: An application to large reservoirs in the Missouri River Basin, Adv. Water Resour., 100, 153–167, https://doi.org/10.1016/j.advwatres.2016.12.004, 2017. a
National Oceanic and Atmospheric Administration: Flooding in Idaho, available at: https://www.weather.gov/safety/flood-states-id, last access: 13 April 2020. a
Nazemi, A. and Wheater, H. S.: On inclusion of water resource management in Earth system models – Part 2: Representation of water supply and allocation and opportunities for improved modeling, Hydrol. Earth Syst. Sci., 19, 63–90, https://doi.org/10.5194/hess-19-63-2015, 2015. a
Nilsson, C., Reidy, C. A., Dynesius, M., and Revenga, C.: Fragmentation and Flow Regulation of the World's Large River Systems, Science, 308, 405–408, https://doi.org/10.1126/science.1107887, 2005. a
Oyerinde, G. T., Wisser, D., Hountondji, F. C., Odofin, A. J., Lawin, A. E., Afouda, A., and Diekkrüger, B.: Quantifying Uncertainties in Modeling Climate Change Impacts on Hydropower Production, Climate, 4, 34, https://doi.org/10.3390/cli4030034, 2016. a
Pianosi, F. and Wagener, T.: Understanding the time-varying importance of different uncertainty sources in hydrological modelling using global sensitivity analysis, Hydrol. Process., 30, 3991–4003, https://doi.org/10.1002/hyp.10968, 2016. a
Pokhrel, Y., Hanasaki, N., Koirala, S., Cho, J., Yeh, P. J.-F., Kim, H., Kanae, S., and Oki, T.: Incorporating Anthropogenic Water Regulation Modules into a Land Surface Model, J. Hydrometeorol., 13, 255–269, https://doi.org/10.1175/JHM-D-11-013.1, 2012. a, b
Portmann, F. T., Siebert, S., and Döll, P.: MIRCA2000 – Global monthly irrigated and rainfed crop areas around the year 2000: A new high-resolution data set for agricultural and hydrological modeling, Global Biogeochem. Cy., 24, GB1011, https://doi.org/10.1029/2008GB003435, 2010. a
Proussevitch, A., Shiklomanov, A., Frolking, S., Glidden, S., Lammers, R., and Wisser, D.: Log-Exponential Reservoir Operating Rules for Global And Regional Hydrological Modeling, in: American Geophysical Union, Fall Meeting 2013, 9–13 December 2013, San Francisco, CA, USE, GC21B-0827, 2013. a, b
Qiu, J., Yang, Q., Zhang, X., Huang, M., Adam, J. C., and Malek, K.: Implications of water management representations for watershed hydrologic modeling in the Yakima River basin, Hydrol. Earth Syst. Sci., 23, 35–49, https://doi.org/10.5194/hess-23-35-2019, 2019. a
Quinn, J., Reed, P., Giuliani, M., and Castelletti, A.: What is controlling our control rules? Opening the black box of multi-reservoir operating policies using time-varying sensitivity analysis, Water Resour. Res., 55, 5962–5984, https://doi.org/10.1029/2018WR024177, 2019. a, b, c
Quinn, J. D., Reed, P. M., Giuliani, M., and Castelletti, A.: Rival framings: A framework for discovering how problem formulation uncertainties shape risk management trade-offs in water resources systems, Water Resour. Res., 53, 7208–7233, https://doi.org/10.1002/2017WR020524, 2017. a
Rauscher, S. A., Pal, J. S., Diffenbaugh, N. S., and Benedetti, M. M.: Future changes in snowmelt-driven runoff timing over the western US, Geophys. Res. Lett., 35, L16703, https://doi.org/10.1029/2008GL034424, 2008. a
Reinecke, R., Foglia, L., Mehl, S., Herman, J. D., Wachholz, A., Trautmann, T., and Döll, P.: Spatially distributed sensitivity of simulated global groundwater heads and flows to hydraulic conductivity, groundwater recharge, and surface water body parameterization, Hydrol. Earth Syst. Sci., 23, 4561–4582, https://doi.org/10.5194/hess-23-4561-2019, 2019. a
Reusser, D. E. and Zehe, E.: Inferring model structural deficits by analyzing temporal dynamics of model performance and parameter sensitivity, Water Resour. Res., 47, W07550, https://doi.org/10.1029/2010WR009946, 2011. a
Rougé, C., Reed, P. M., Grogan, D. S., Zuidema, S., Prusevich, A., Glidden, S., Lamontagne, J. R., and Lammers, R. B.: UpperSnakeRiver_reservoirs_WBM, GitHub, available at: https://github.com/charlesrouge/, last access: 15 September 2020. a
Ruano, M., Ribes, J., Seco, A., and Ferrer, J.: An improved sampling strategy based on trajectory design for application of the Morris method to systems with many input factors, Environ. Model. Softw., 37, 103–109, https://doi.org/10.1016/j.envsoft.2012.03.008, 2012. a
Sampson, C. C., Smith, A. M., Bates, P. D., Neal, J. C., Alfieri, L., and Freer, J. E.: A high-resolution global flood hazard model, Water Resour. Res., 51, 7358–7381, https://doi.org/10.1002/2015WR016954, 2015. a
Schmitt, R. J. P., Bizzi, S., Castelletti, A., and Kondolf, G. M.: Improved trade-offs of hydropower and sand connectivity by strategic dam planning in the Mekong, Nat. Sustain., 1, 96–104, https://doi.org/10.1038/s41893-018-0022-3, 2018. a
Schumann, G. J.-P., Stampoulis, D., Smith, A. M., Sampson, C. C., Andreadis, K. M., Neal, J. C., and Bates, P. D.: Rethinking flood hazard at the global scale, Geophys. Res. Lett., 43, 10249–10256, https://doi.org/10.1002/2016GL070260, 2016. a
Shin, S., Pokhrel, Y., and Miguez-Macho, G.: High-Resolution Modeling of Reservoir Release and Storage Dynamics at the Continental Scale, Water Resour. Res., 55, 787–810, https://doi.org/10.1029/2018WR023025, 2019. a, b
Steinfeld, H., Gerber, P., Wassenaar, T., Castel, V., Rosales, M., and de Haan, C.: Livestock's long shadow, Tech. Rep., Food and Agriculture Organisation of the United Nations (UN-FAO), available at: http://www.fao.org/docrep/010/a0701e/a0701e00.HTM (last access: 9 August 2018), 2006. a
Stewart, R., Wollheim, W., Miara, A., Vorosmarty, C., Fekete, B., Lammers, R., and Rosenzweig, B.: Horizontal Cooling Towers: Riverine Ecosystem Services and the Fate of Thermoelectric Heat in the Contemporary Northeast US, Environ. Res. Lett., 8, 025010, https://doi.org/10.1088/1748-9326/8/2/025010, 2013. a
Stewart, R. J., Wollheim, W. M., Gooseff, M. N., Briggs, M. A., Jacobs, J. M., Peterson, B. J., and Hopkinson, C. S.: Separation of river network-scale nitrogen removal among the main channel and two transient storage compartments, Water Resour. Res., 47, W00J10, https://doi.org/10.1029/2010WR009896, 2011. a
Thomas, C. A. and Lamke, R. D.: Floods of February 1962 in Southern Idaho and Northeastern Nevada, Tech. Rep., United States Geological Survey, Washington, D.C., 1962. a
Timpe, K. and Kaplan, D.: The changing hydrology of a dammed Amazon, Sci. Adv., 3, e1700611, https://doi.org/10.1126/sciadv.1700611, 2017. a
Turner, S. W. D., Xu, W., and Voisin, N.: Inferred inflow forecast horizons guiding reservoir release decisions across the United States, Hydrol. Earth Syst. Sci., 24, 1275–1291, https://doi.org/10.5194/hess-24-1275-2020, 2020. a
US Bureau of Reclamations: Project details – Minidoka Project, available at: https://web.archive.org/web/20120925152815/http://www.usbr.gov/projects/Project.jsp?proj_Name=Minidoka+Project (last access: 19 July 2019), 2012. a, b, c
van Beek, L. P. H., Yoshihide, W., and P., B. M. F.: Global monthly water stress: 1. Water balance and water availability, Water Resour. Res., 47, W07517, https://doi.org/10.1029/2010WR009791, 2011. a
Veldkamp, T. I. E., Zhao, F., Ward, P. J., de Moel, H., Aerts, J. C. J. H., Schmied, H. M., Portmann, F. T., Masaki, Y., Pokhrel, Y., Liu, X., Satoh, Y., Gerten, D., Gosling, S. N., Zaherpour, J., and Wada, Y.: Human impact parameterizations in global hydrological models improve estimates of monthly discharges and hydrological extremes: a multi-model validation study, Environ. Res. Lett., 13, 055008, https://doi.org/10.1088/1748-9326/aab96f, 2018. a
Voisin, N., Li, H., Ward, D., Huang, M., Wigmosta, M., and Leung, L. R.: On an improved sub-regional water resources management representation for integration into earth system models, Hydrol. Earth Syst. Sci., 17, 3605–3622, https://doi.org/10.5194/hess-17-3605-2013, 2013a. a, b, c, d
Voisin, N., Liu, L., Hejazi, M., Tesfa, T., Li, H., Huang, M., Liu, Y., and Leung, L. R.: One-way coupling of an integrated assessment model and a water resources model: evaluation and implications of future changes over the US Midwest, Hydrol. Earth Syst. Sci., 17, 4555–4575, https://doi.org/10.5194/hess-17-4555-2013, 2013b. a
Vörösmarty, C. J., Sharma, K. P., Fekete, B. M., Copeland, A. H., Holden, J., Marble, J., and Lough, J. A.: The Storage and Aging of Continental Runoff in Large Reservoir Systems of the World, Ambio, 26, 210–219, 1997. a
Wada, Y., van Beek, L. P. H., Viviroli, D., Dürr, H. H., Weingartner, R., and Bierkens, M. F. P.: Global monthly water stress: 2. Water demand and severity of water stress, Water Resour. Res., 47, W07518, https://doi.org/10.1029/2010WR009792, 2011. a
Wada, Y., Wisser, D., and Bierkens, M. F. P.: Global modeling of withdrawal, allocation and consumptive use of surface water and groundwater resources, Earth Syst. Dynam., 5, 15–40, https://doi.org/10.5194/esd-5-15-2014, 2014. a, b
Wada, Y., Bierkens, M. F. P., de Roo, A., Dirmeyer, P. A., Famiglietti, J. S., Hanasaki, N., Konar, M., Liu, J., Müller Schmied, H., Oki, T., Pokhrel, Y., Sivapalan, M., Troy, T. J., van Dijk, A. I. J. M., van Emmerik, T., Va Huijgevoort, M. H. J., Van Lanen, H. A. J., Vörösmarty, C. J., Wanders, N., and Wheater, H.: Human–water interface in hydrological modelling: current status and future directions, Hydrol. Earth Syst. Sci., 21, 4169–4193, https://doi.org/10.5194/hess-21-4169-2017, 2017. a
Wanders, N., van Vliet, M. T. H., Wada, Y., Bierkens, M. F. P., and van Beek, L. P. H. R.: High-Resolution Global Water Temperature Modeling, Water Resour. Res., 55, 2760–2778, https://doi.org/10.1029/2018WR023250, 2019. a
Wang, K., Shi, H., Chen, J., and Li, T.: An improved operation-based reservoir scheme integrated with Variable Infiltration Capacity model for multiyear and multipurpose reservoirs, J. Hydrol., 571, 365–375, https://doi.org/10.1016/j.jhydrol.2019.02.006, 2019. a, b
Willmott, C. J., Rowe, C. M., and Mintz, Y.: Climatology of the terrestrial seasonal water cycle, J. Climatol., 5, 589–606, https://doi.org/10.1002/joc.3370050602, 1985. a
Wise, E. K.: Tree ring record of streamflow and drought in the upper Snake River, Water Resour. Res., 46, W11529, https://doi.org/10.1029/2010WR009282, 2010. a
Wise, E. K.: Hydroclimatology of the US Intermountain West, Prog. Phys. Geogr., 36, 458–479, https://doi.org/10.1177/0309133312446538, 2012. a
Wisser, D., Frolking, S., Douglas, E. M., Fekete, B. M., Vörösmarty, C. J., and Schumann, A. H.: Global irrigation water demand: Variability and uncertainties arising from agricultural and climate data sets, Geophys. Res. Lett., 35, l24408, https://doi.org/10.1029/2008GL035296, 2008. a
Wisser, D., Fekete, B. M., Vörösmarty, C. J., and Schumann, A. H.: Reconstructing 20th century global hydrography: a contribution to the Global Terrestrial Network- Hydrology (GTN-H), Hydrol. Earth Syst. Sci., 14, 1–24, https://doi.org/10.5194/hess-14-1-2010, 2010. a, b, c, d, e, f, g
Wood, E. F., Roundy, J. K., Troy, T. J., van Beek, L. P. H., Bierkens, M. F. P., Blyth, E., de Roo, A., Döll, P., Ek, M., Famiglietti, J., Gochis, D., van de Giesen, N., Houser, P., Jaffé, P. R., Kollet, S., Lehner, B., Lettenmaier, D. P., Peters-Lidard, C., Sivapalan, M., Sheffield, J., Wade, A., and Whitehead, P.: Hyperresolution global land surface modeling: Meeting a grand challenge for monitoring Earth's terrestrial water, Water Resour. Res., 47, W05301, https://doi.org/10.1029/2010WR010090, 2011. a, b
Wu, Y. and Chen, J.: An Operation-Based Scheme for a Multiyear and Multipurpose Reservoir to Enhance Macroscale Hydrologic Models, J. Hydrometeorol., 13, 270–283, https://doi.org/10.1175/JHM-D-10-05028.1, 2012. a, b
Yang, T., Gao, X., Sorooshian, S., and Li, X.: Simulating California reservoir operation using the classification and regression-tree algorithm combined with a shuffled cross-validation scheme, Water Resour. Res., 52, 1626–1651, https://doi.org/10.1002/2015WR017394, 2016. a
Yassin, F., Razavi, S., Elshamy, M., Davison, B., Sapriza-Azuri, G., and Wheater, H.: Representation and improved parameterization of reservoir operation in hydrological and land-surface models, Hydrol. Earth Syst. Sci., 23, 3735–3764, https://doi.org/10.5194/hess-23-3735-2019, 2019. a, b
Yates, D., Sieber, J., Purkey, D., and Huber-Lee, A.: WEAP21 – A Demand-, Priority-, and Preference-Driven Water Planning Model, Water Int., 30, 487–500, https://doi.org/10.1080/02508060508691893, 2005. a
Yoshikawa, S., Cho, J., Yamada, H. G., Hanasaki, N., and Kanae, S.: An assessment of global net irrigation water requirements from various water supply sources to sustain irrigation: rivers and reservoirs (1960–2050), Hydrol. Earth Syst. Sci., 18, 4289–4310, https://doi.org/10.5194/hess-18-4289-2014, 2014. a, b, c
Zagona, E. A., Fulp, T. J., Shane, R., Magee, T., and Goranflo, H. M.: Riverware: A Generalized Tool for Complex Reservoir System Modeling, J. Am. Water Resour. Assoc., 37, 913–929, https://doi.org/10.1111/j.1752-1688.2001.tb05522.x, 2001. a
Zaherpour, J., Gosling, S. N., Mount, N., Schmied, H. M., Veldkamp, T. I. E., Dankers, R., Eisner, S., Gerten, D., Gudmundsson, L., Haddeland, I., Hanasaki, N., Kim, H., Leng, G., Liu, J., Masaki, Y., Oki, T., Pokhrel, Y., Satoh, Y., Schewe, J., and Wada, Y.: Worldwide evaluation of mean and extreme runoff from six global-scale hydrological models that account for human impacts, Environ. Res. Lett., 13, 065015, https://doi.org/10.1088/1748-9326/aac547, 2018. a
Zajac, Z., Revilla-Romero, B., Salamon, P., Burek, P., Hirpa, F. A., and Beck, H.: The impact of lake and reservoir parameterization on global streamflow simulation, J. Hydrol., 548, 552–568, https://doi.org/10.1016/j.jhydrol.2017.03.022, 2017. a, b
Zarfl, C., Lumsdon, A. E., Berlekamp, J., Tydecks, L., and Tockner, K.: A global boom in hydropower dam construction, Aquat. Sci., 77, 161–170, https://doi.org/10.1007/s00027-014-0377-0, 2015. a
Zaveri, E., Grogan, D. S., Fisher-Vanden, K., Frolking, S., Lammers, R. B., Wrenn, D. H., Prusevich, A., and Nicholas, R. E.: Invisible water, visible impact: groundwater use and Indian agriculture under climate change, Environ. Res. Lett., 11, 084005, https://doi.org/10.1088/1748-9326/11/8/084005, 2016. a, b, c, d
Zhao, G., Gao, H., Naz, B. S., Kao, S.-C., and Voisin, N.: Integrating a reservoir regulation scheme into a spatially distributed hydrological model, Adv. Water Resour., 98, 16–31, https://doi.org/10.1016/j.advwatres.2016.10.014, 2016. a, b, c
Zuidema, S., Grogan, D., Prusevich, A., Lammers, R., Gilmore, S., and Williams, P.: Interplay of changing irrigation technologies and water reuse: example from the upper Snake River basin, Idaho, USA, Hydrol. Earth Syst. Sci., 24, 5231–5249, https://doi.org/10.5194/hess-24-5231-2020, 2020. a