the Creative Commons Attribution 4.0 License.
the Creative Commons Attribution 4.0 License.
 | 27 Aug 2020
Data-driven estimates of evapotranspiration and its controls in the Congo Basin
Michael W. Burnett
Gregory R. Quetin
Alexandra G. Konings
Evapotranspiration (ET) from tropical forests serves as a critical moisture source for regional and global climate cycles. However, the magnitude, seasonality, and interannual variability of ET in the Congo Basin remain poorly constrained due to a scarcity of direct observations, despite the Congo being the second-largest river basin in the world and containing a vast region of tropical forest. In this study, we applied a water balance model to an array of remotely sensed and in situ datasets to produce monthly, basin-wide ET estimates spanning April 2002 to November 2016. Data sources include water storage changes estimated from the Gravity Recovery and Climate Experiment (GRACE) satellites, in situ measurements of river discharge, and precipitation from several remotely sensed and gauge-based sources. An optimal precipitation dataset was determined as a weighted average of interpolated data by Nicholson et al. (2018), Climate Hazards InfraRed Precipitation with Station data version 2 (CHIRPS2) , and the Precipitation Estimation from Remotely Sensed Information using Artificial Neural Networks–Climate Data Record product (PERSIANN-CDR), with the relative weights based on the error magnitudes of each dataset as determined by triple collocation. The resulting water-balance-derived ET (ETwb) features a long-term average that is consistent with previous studies (117.2±3.5 cm yr−1) but displays greater seasonal and interannual variability than seven global ET products. The seasonal cycle of ETwb generally tracks that of precipitation over the basin, with the exception that ETwb is greater in March–April–May (MAM) than in the relatively wetter September–October–November (SON) periods. This pattern appears to be driven by seasonal variations in the diffuse photosynthetically active radiation (PAR) fraction, net radiation (Rn), and soil water availability. From 2002 to 2016, Rn, PAR, and vapor-pressure deficit (VPD) all increased significantly within the Congo Basin; however, no corresponding trend occurred in ETwb. We hypothesize that the stability of ETwb over the study period despite sunnier and less humid conditions may be due to increasing atmospheric CO2 concentrations that offset the impacts of rising VPD and irradiance on stomatal water use efficiency (WUE).
- Article
(3578 KB) - Full-text XML
-
Supplement
(591 KB) - BibTeX
- EndNote


The Congo Basin in central Africa is the second-largest river basin in the world and supports one of Earth's three major humid tropical forest regions (Alsdorf et al., 2016). Approximately 24 % to 39 % of evapotranspiration (ET) from the Congo Basin is recycled as local rainfall (Dyer et al., 2017), and model simulations indicate changes in ET within the basin affect moisture cycling across the African continent (Van Der Ent and Savenije, 2011; Bell et al., 2015; Sorí et al., 2017). Understanding the magnitude, variability, and drivers of ET in the Congo Basin is therefore crucial for studying the climate systems of central Africa and the global tropics, especially because significant environmental shifts have already been reported within the basin. For instance, deforestation is an ongoing problem in Congolese forests with potential impacts on climate (Laporte et al., 2007; Batra et al., 2008; Bell et al., 2015; Turubanova et al., 2018); temperatures are rising due to anthropogenic climate change (Collins, 2011; James and Washington, 2013); and many have reported a long-term decline in precipitation over the basin (Asefi-Najafabady and Saatchi, 2013; Diem et al., 2014; Zhou et al., 2014; Hua et al., 2016; Dezfuli, 2017). Such shifts are particularly concerning because Africa's tropical rainforests are already significantly drier than other humid tropical forests and exist at the climatic threshold of conversion from evergreen to deciduous trees (Guan et al., 2015; Philippon et al., 2019; Bush et al., 2020).
However, the hydrology of the Congo Basin is vastly understudied relative to the region's size and influence (Alsdorf et al., 2016). In particular, no long-term observational studies of ET in the basin exist. There are also no eddy covariance towers operating within the Congo Basin. Prior studies provide only limited information and either analyze short-term ET observations at the individual site scale (Nizinski et al., 2011, 2014) or rely on combining site scale meteorological measurements with localized models (Bultot, 1971; Lauer, 1989; Shahin, 1994). Some studies have also used process-based models to evaluate regional ET (Matsuyama et al., 1994; Shem, 2006; Batra et al., 2008; Chishugi and Alemaw, 2009; Marshall et al., 2012; Ndehedehe et al., 2018; Crowhurst et al., 2020). However, the large size and heterogeneity of the Congo Basin render point-based approaches inadequate for basin scale analysis of hydrological cycling, and regional scale models suffer from being poorly constrained because of the widespread lack of in situ observations throughout the basin (e.g., little understanding of local variability in rooting depth, vegetation responses to water and light availability, and canopy interception). As a result, even basic seasonality patterns across the Congo Basin remain unclear. For example, Konings et al. (2017) showed that canopy water content increases during the dry season, which could be due to either dry-season leaf-out or a change in plant water uptake during the dry season that would increase ET. The latter could not be ruled out in Konings et al. (2017) due to the lack of direct ET estimates in the region.
Remote sensing offers a partial solution to this scarcity of ET observations. Remote-sensing-based estimates of ET are generally indirect, relying on physical models to link temperature, meteorological inputs, and/or other observables to the rate of ET (Zhang et al., 2016). However, these modeling approaches are poorly constrained in the Congo Basin and may be highly erroneous there. Alternatively, basin scale ET can be estimated indirectly by inverting the water balance. This approach requires only three geophysical input variables: precipitation, river discharge, and the change in terrestrial water storage. Precipitation and total water storage change can both be estimated using remote sensing, with the latter determined by gravity measurements from the Gravity Recovery and Climate Experiment (GRACE) (Tapley et al., 2004; Swenson, 2012). Recent examples of this method's application include the Amazon Basin (Maeda et al., 2017; Swann and Koven, 2017) and the coterminous United States (Wan et al., 2015), as well as global examinations of basin scale ET (Liu et al., 2016).
While some previous studies have applied a similar technique to the Congo Basin as part of larger-scale experiments, these studies assumed terrestrial water storage was constant over their study periods (Marshall et al., 2012; Ukkola and Prentice, 2013; Weerasinghe et al., 2020) – a plausible assumption for long-term ET estimates but one that could mask a large degree of ET variability on annual and shorter timescales. Indeed, remotely sensed evidence suggests water storage anomalies within the basin do change significantly on monthly and interannual timescales (Crowley et al., 2006; Rodell et al., 2018), even if long-term trends are typically small relative to the magnitude of ET fluxes (Weerasinghe et al., 2020). Thus in order to explore seasonal cycles and variations in basin-wide ET, terrestrial water storage must be constrained in inverted-water-balance models. In this paper, we applied the water balance method to the Congo Basin to produce the first data-driven estimates of monthly basin-averaged ET for the period from April 2002 to November 2016. To determine the most accurate precipitation time series to use in this computation, precipitation data from multiple remote-sensing-based approaches were combined based on uncertainty estimates from triple collocation. We further used the resulting ET time series to explore the climatic and ecological drivers of ET seasonality and trends by comparing it against a variety of vegetation indices and meteorological drivers.
Based on mass balance, any precipitation that falls on a basin and is not removed from the basin through river discharge or ET must increase the amount of water stored in the basin in the form of groundwater, soil moisture, or open water bodies. The equation for this mass balance can be rearranged to solve for ET as follows:
where ETwb is monthly basin-wide evapotranspiration, P is the monthly basin-wide precipitation, Q is total monthly runoff from the Congo River, S is the water storage anomaly within the basin expressed as an equivalent water height (Rodell et al., 2004a, 2011), and t is time. We calculate ETwb using P from a combination of remotely sensed and gauge-based precipitation products, as further discussed in Sect. 2.1 and 2.2. Q was obtained from a stream gauge at the outlet of the Congo River at Kinshasa–Brazzaville. Lastly, dS∕dt was derived from the monthly change in terrestrial water storage throughout the basin, as estimated by gravitational anomaly data from GRACE (Tapley et al., 2004; Swenson, 2012).
2.1 Water balance data sources
The area and extent of the Congo Basin were determined using the 15 arcsec HydroSHEDS (Hydrological data and maps based on SHuttle Elevation Derivatives at multiple Scales) Level 5 Basin Boundaries product (Lehner et al., 2008). The HydroSHEDS boundary produces a total basin area of 3 705 220 km2 – in good agreement with a recent independent estimate of 3 687 000 km2 (Alsdorf et al., 2016). The HydroSHEDS product was used to trim all remotely sensed raster data to the Congo Basin's boundaries at 0.01∘ spatial resolution (all datasets with coarser spatial resolutions mentioned hereafter were first resampled to 0.01∘ grids with no interpolation before determining their basin-wide values).
Basin-wide runoff (Q) for the Congo Basin was estimated using monthly discharge data collected from the Congo River at Kinshasa–Brazzaville. The long-running gauging station is operated by the Observation Service for Geodynamical, Hydrological and Biogeochemical Control of Erosion/Alteration and Material Transport in the Amazon, Orinoco and Congo Basins (SO-HYBAM) and captures the drainage of over 98 % of the Congo Basin's area (Alsdorf et al., 2016). Because no uncertainty estimate is available for the streamflow gauge, we assumed an uncertainty range of ±20 %.
Changes in terrestrial water storage (dS∕dt) were calculated using S data from NASA's Gravity Recovery and Climate Experiment (GRACE) satellites (Swenson and Wahr, 2006; Landerer and Swenson, 2012; Swenson, 2012). In order to estimate monthly S, three independent GRACE solutions in 1∘ grids from the GeoForschungsZentrum Potsdam (GFZ), Jet Propulsion Laboratory (JPL), and Center for Space Research at the University of Texas at Austin (CSR) were retrieved. A scale factor grid was also applied to the GRACE data to account for attenuation of small-scale surface mass variations (Landerer and Swenson, 2012). The arithmetic mean of the three S solutions was used in the primary dS∕dt calculation in order to reduce noise (Wahr et al., 2006; Sakumura et al., 2014), though all three independent S solutions were also used to calculate unique dS∕dt values in order to estimate uncertainty in the GRACE products (Lee et al., 2011). The S data were converted to dS∕dt values using a centered-difference approach at a monthly timescale:
where the S terms are expressed in centimeters of equivalent water height averaged over the entire Congo Basin for the months before and after month n (Landerer et al., 2010). The uncertainty of dS∕dt is calculated as half of the difference between the highest and lowest dS∕dt values from the three GRACE S solutions in any given month (Lee et al., 2011).
Beginning in early 2011, the GRACE mission began an active-battery-management strategy that resulted in data gaps every several months. In order to reconstruct dS∕dt data from 2011 to 2016, we use the average seasonal cycle and correct for variability based on the deviations of adjacent months from their long-term averages. First, the mean monthly cycle of S was calculated from data-complete months from 2002 to 2016. For every missing month from 2011 to 2016, the average S from the 2 other months in the same season of the same year (DJF, MAM, JJA, and SON, with seasons given by the first initial of their months) was compared to the corresponding value from the multi-year S means. The resulting ratio was then multiplied by the multi-year S mean of the missing month to create the reconstructed S value. Because the sum of multi-year mean S values from October and November is nearly equal to zero and consequently produces unrealistically scaled values for September, missing September values were instead interpolated using August and October of the same year. Repeating the same procedure for months that are available in the GRACE dataset (i.e., calculating what the reconstructed value would be if it were not available, and comparing it to the observations) shows that this seasonal-scaling interpolation reproduces true S fairly accurately: from 2002 to 2016, each of the 12 months was reconstructed with a mean R2 of 0.75 and a mean root-mean-square error (RMSE) of 2.80 cm (relative to average seasonal S variations of ∼10 cm). Applying this procedure to the mean S data from the three monthly GRACE solutions produced the complete dS∕dt time series that determined the study period for our water balance model (April 2002–November 2016).
Due to the uncertainty of precipitation (P) estimates in the Congo (Washington et al., 2013), P was estimated using an array of five datasets with different methodologies. These five datasets were chosen because recent validation efforts have shown them to be the most accurate for the Congo Basin (Nicholson et al., 2018, 2019). They include gridded precipitation data from the Global Precipitation Climatology Centre (GPCC) Version 7.0, which uses interpolation with a worldwide network of rain gauges to produce monthly precipitation grids (Schneider et al., 2015). GPCC-compiled gauges within the Congo are extremely sparse after 2000 (Nicholson et al., 2019), and the GPCC Version 7.0 product only lasts through 2013. The Tropical Rainfall Measuring Mission (TRMM) 3B43 Version 7 product (also known as TRMM Multi-satellite Precipitation Analysis or TMPA), which consists of monthly-mean precipitation rate grids, is generated using microwave and infrared sensors on TRMM and other satellites as well as gauge data from the GPCC (Huffman et al., 2007a). The Precipitation Estimation from Remotely Sensed Information using Artificial Neural Networks–Climate Data Record (PERSIANN-CDR) product uses satellite infrared data and a neural network approach, calibrated with precipitation forecasts, microwave data, and GPCC gauge data to produce grids of precipitation estimates at the daily timescale (Ashouri et al., 2015). While PERSIANN is also available without the GPCC gauge corrections that make PERSIANN-CDR so similar to GPCC v7 and TRMM 3B43 over the Congo Basin (Nguyen et al., 2018), it was not used here because it severely overestimates P across Africa (Beighley et al., 2011; Thiemig et al., 2012). Several recent studies have found that TRMM Version 7 3B43 and PERSIANN-CDR both perform reasonably well over central Africa (Munzimi et al., 2015; Awange et al., 2016; Camberlin et al., 2019).
Notably, the above three products all depend on GPCC rain gauges to some degree. As a result, all three datasets feature similar rainfall trends and model performance over the Congo Basin during the 2002–2016 period studied here and cannot be considered truly independent P datasets (Nicholson et al., 2019). To that end, the Climate Hazards InfraRed Precipitation with Station data version 2.0 (CHIRPS2) product, which uses two thermal infrared datasets and interpolated gauge data, was also included as a more independent dataset (Funk et al., 2015a). The CHIRPS2 product was recently found to be among the most accurate rainfall datasets on monthly timescales within the Congo Basin (Camberlin et al., 2019).While CHIRPS2 does incorporate some gauge data that overlap with the GPCC product, it is not scaled to fit GPCC data to the same extent as TRMM 3B43 or PERSIANN-CDR are over central Africa (Nicholson et al., 2019) – in fact, the near-total lack of rain gauges within the basin in both CHIRPS2 and GPCC leads to a low correlation between the two datasets within the study area (Funk et al., 2015a), indicating the P datasets maintain a high degree of independence. Finally, a recent gauge-based dataset developed for the Congo Basin, NIC131-gridded, served as another independent precipitation data source with coverage through 2014 (Nicholson et al., 2018). The monthly 2.5∘ NIC131-gridded product was created by applying a spatial reconstruction technique based on principal component analysis to a gauge network that, due to the severe decline of GPCC coverage during the 1990s, is largely independent of the GPCC's gauges in Africa (Nicholson et al., 2019).
2.2 Comparing and merging precipitation estimates
Because the above five datasets each individually remain highly uncertain and because no accurate independent basin-wide validation is possible, triple collocation (TC) was used to estimate the error statistics of the different datasets and ultimately combine them by weighting them according to their relative errors. TC is a method for characterizing systematic and random errors in geophysical measurements using three independent, collocated time series, even if these datasets are individually noisy (Stoffelen, 1998; McColl et al., 2014). It is particularly valuable in gauge-sparse regions like the Congo Basin because it does not rely on independent error-free validation data. TC-based error calculations have previously been used in a wide variety of geophysical settings – among others, TC was recently used to determine the relative weightings of different hydrologic flux estimates in a neural-network-based data combination effort in a manner conceptually analogous to its use here (Alemohammad et al., 2017), and other work has confirmed the ability of TC to merge P datasets into a single more accurate dataset (Dong et al., 2020). Rather than the linear model used in most TC applications, we used a multiplicative model that is more appropriate for quantifying errors in precipitation estimates (Alemohammad et al., 2015). In the multiplicative-error model, true precipitation rate T is assumed to be related to the estimated precipitation of product i, Pi, as follows:
in which ai is the multiplicative error, βi is the deformation error, and ϵi is the random residual error (which is assumed to have a mean of zero).
Assuming the three collocated precipitation estimates' residual errors are uncorrelated with each other and are uncorrelated with the true precipitation values, the RMSEs of all three input P datasets may be calculated with Eqs. (4)–(6):
where Ci,j is the (i, j)th element of the sample covariance matrix between the three log-transformed datasets and is the RMSE of the log-transformed Pi time series. can be converted to the actual RMSE of Pi by multiplying by the mean value of Pi (Alemohammad et al., 2015).
The errors of the five P datasets were evaluated by applying TC to triplets of products deemed relatively independent. That is, TC was repeated three times using different triplets: TRMM–NIC131–CHIRPS2, GPCC–NIC131–CHIRPS2, and PERSIANN–NIC131–CHIRPS2. The three RMSEs calculated for NIC131-gridded and CHIRPS2 were then averaged and compared to the RMSEs calculated for TRMM, GPCC, and PERSIANN-CDR. In order to combine the most accurate P time series (and their estimated errors) into a single unified P estimate, weighting factors were assigned to each time series in a manner inversely proportional to the product RMSE. That is, each weighting factor wi was assigned as in Eq. (7):
The best-estimate rate of precipitation for each month was then calculated as a weighted average across the three independent precipitation products using wi. The resulting dataset's RMSE was also used to propagate precipitation uncertainty into the uncertainty of ETwb using a root-mean-square sum of the weighted errors. While longer time series are generally preferred for TC in order to reduce sampling error, data prior to 2002 were discarded in the TC analysis because the greater number of rain gauges likely leads to different error statistics than in this period (Nicholson et al., 2018).
2.3 Comparison to global ET products
Many hydrological studies of the Congo Basin rely on global ET products to constrain their models (e.g., Hassan and Jin, 2016; Ndehedehe et al., 2018). We analyzed seven widely used global ET data products and evaluated their performance relative to ETwb. MOD16A2 Version 6 is a global ET data product based on the Penman–Monteith equation, meteorological reanalysis, and remotely sensed land surface data from the Moderate Resolution Imaging Spectroradiometer (MODIS) satellite mission (Mu et al., 2013). The Operational Simplified Surface Energy Balance (SSEBop) Version 4 model uses remotely sensed thermal data from MODIS and global weather datasets to produce gridded ET estimates at a very high (1 km) spatial resolution (Senay et al., 2013). The Global Land Evaporation Amsterdam Model Version 3.3a (GLEAM v3.3a) product estimates Priestley–Taylor potential ET (PET) from reanalysis radiation and temperature data and then reduces PET to actual ET using remotely sensed soil moisture and vegetation optical-depth measurements (Miralles et al., 2011; Martens et al., 2017). Modern-Era Retrospective Analysis for Research and Applications, Version 2 (MERRA2) is a reanalysis product that integrates a wide variety of observation types from satellites and in situ sources to produce terrestrial ET estimates using a water balance approach (Gelaro et al., 2017a). The Global Land Data Assimilation System Version 2.1 Noah (GLDAS-Noah) product is a land surface simulation forced by a combination of model and observation datasets that provides monthly-mean ET estimates (Rodell et al., 2004b).
Lastly, two global ET products based on upscaling tower data from the global FLUXNET eddy covariance network (Baldocchi et al., 2001) were included: the Model Tree Ensemble (FLUXNET-MTE) product uses a tree-based machine learning approach to upscale carbon, water, and energy flux observations using external global data sources, resulting in a monthly 0.5∘ global dataset (Jung et al., 2011). The more recent FLUXCOM product uses machine learning algorithms and additional time-varying meteorological inputs to achieve greater accuracy in upscaling eddy covariance tower data (Jung et al., 2019). This study uses FLUXCOM's daily RS + METEO (remote sensing and meteorological data) version because of its lower ET uncertainty in Africa (Jung et al., 2019). However, it should be noted that FLUXNET-MTE and FLUXCOM, like the physical modeling approaches above, have primarily been validated against observational data in the mid-latitudes. There are no FLUXNET towers located within the Congo Basin that could have been used for training these and other models.
The accuracies of these seven products were evaluated by comparing them to the monthly ETwb values: RMSEs, Pearson correlation coefficients, and Taylor skill scores were calculated for each dataset versus ETwb. Only the years 2003–2011 are common to all seven ET datasets and the GRACE S data, so all statistics were calculated over this period. Pearson correlation coefficients help determine the ability of each ET model to predict ETwb, while Taylor skill scores allow for a comparison of the variability present in each model by accounting for their standard deviations (Taylor, 2001). The average seasonal cycles and interannual variations of the products are also compared to better understand similarities and differences between the products.
2.4 Meteorological and vegetation data
To examine potential drivers of ET's seasonality, interannual variability, and long-term trends in the Congo Basin, ETwb is compared to a host of meteorological and vegetation data including photosynthetically active radiation (PAR), net radiation (Rn), vapor-pressure deficit (VPD), air and skin temperatures (Ta and Ts), solar-induced fluorescence (SIF), and the enhanced vegetation index (EVI). We used all-sky monthly-mean PAR and Rn data from the Clouds and the Earth's Radiant Energy System (CERES) project's 1∘ gridded products. PAR data were derived from the synoptic-surface-flux model (SYN1deg) (Doelling, 2017), which divides surface PAR fluxes into direct (PARdir) and diffuse (PARdiff) components, while Rn data were derived from the Energy Balanced and Filled (EBAF) climate data record (Loeb, 2017). The global ECMWF Reanalysis (ERA-Interim) model (Dee et al., 2011a) provided surface air temperature and relative humidity data in 6 h increments, which were used to calculate monthly VPD means of the entire basin using linear interpolation. Although reanalysis models over central Africa remain uncertain and poorly constrained (Lorenz and Kunstmann, 2012; Brands et al., 2013), these VPD values were tested against hourly VPD data from Automated Surface Observing Systems (ASOS) and Met Office Integrated Data Archive System (MIDAS) weather reports from the Congo Basin (Met Office, 2012) and were found to capture monthly cycles of VPD with acceptable accuracy (Fig. S1 in the Supplement).
Monthly-mean Ta and Ts from the Congo Basin were sourced from the ascending (daytime) retrievals of the Atmospheric Infrared Sounder (AIRS) Level 3 monthly product (Kahn et al., 2014). The 740 nm SIF data from the Global Ozone Monitoring Experiment 2 (GOME-2) platform were retrieved from the GOME2_Fluorescence Version 26 Level 3 dataset (Joiner et al., 2013). The GOME-2 SIF dataset is known to have suffered from a significant sensor decay problem resulting in a spurious worldwide downward trend (Zhang et al., 2018), so the SIF data were not used in any long-term trend analyses. SIF was normalized by monthly CERES total PAR data (SIF/PAR) in order to isolate the effects of phenological, physiological, and hydrological variability on plant productivity independent of radiative controls (Madani et al., 2017; Pagán et al., 2019). MODIS Collection 6 EVI data processed with the Multi-Angle Implementation of Atmospheric Correction (MAIAC) algorithm were converted to monthly means from 8 d composite rasters (Lyapustin et al., 2018). The MAIAC algorithm, which eliminates errors from aerosols and sun-sensor geometry issues in MODIS data, has previously proven beneficial for examining vegetation greenness in tropical forests (Lyapustin et al., 2011a, b, 2012; Hilker et al., 2012; Bi et al., 2016). Lastly, annual land cover data from the MODIS-based MCD12C1 Version 6 dataset were retrieved for 2002–2016 and modally averaged to produce a single land cover classification of the Congo Basin (Friedl and Sulla-Menashe, 2015). Pixels were aggregated into dominantly deciduous or evergreen vegetation types according to the International Geosphere-Biosphere Programme's (IGBP) 17-class land cover scheme, with savannas and grasslands considered deciduous and permanent wetlands considered evergreen. Other vegetation types that are more difficult to generalize (e.g., croplands, mixed forests, and shrublands) were spatially limited enough to be ignored once the land cover data were majority-resampled to match the 1∘ pixel size of our study's coarsest datasets (Fig. S2).
2.5 Removing seasonal cycles and long-term trends
In order to track interannual correlations between ETwb, meteorological variables, and vegetation indices, the Breaks for Additive Season and Trend (BFAST) R package (Verbesselt et al., 2015) was used to search for abrupt changes in the trends of our time series, identify linear long-term trends, and remove average seasonal cycles from the data (Verbesselt et al., 2010a, b).
3.1 Triple collocation of precipitation datasets
The results of the TC analysis are provided in Table 1. NIC131-gridded exhibited the lowest RMSE in all three triplets, from 0.60 to 0.72 cm per month (mean of 0.65 cm per month) depending on the triplet. The TC results indicate that NIC131-gridded, a Congo-specific gauge-based dataset designed using meteorological stations absent from the GPCC network and a principal-component-based statistical approach, is the best currently available P dataset for the Congo Basin after 2002 (Nicholson et al., 2018). The results in Table 1 agree well with those of Nicholson et al. (2019), which found CHIRPS2 and PERSIANN-CDR to be more accurate than TRMM and GPCC in the Congo Basin after 1998. Prior work has also demonstrated that CHIRPS2 is among the best P products available for central Africa and outperforms TRMM and PERSIANN-CDR on a monthly basis (Dembélé and Zwart, 2016; Camberlin et al., 2019; Nicholson et al., 2019), consistent with the results in Table 1. Given the decreasing availability of Congolese rain gauge data in the GPCC database and the difficulty of measuring P with satellite remote sensing in central Africa (McCollum et al., 2000; Yin and Gruber, 2010; Awange et al., 2016; Nicholson et al., 2018), it is not surprising that the GPCC-based products generally displayed higher errors.
Table 1Root-mean-square errors (RMSEs) for the five P datasets (in three triplets) evaluated in this study, as well as the weighting factors used to unify the three most accurate datasets. All values are presented in centimeters per month.
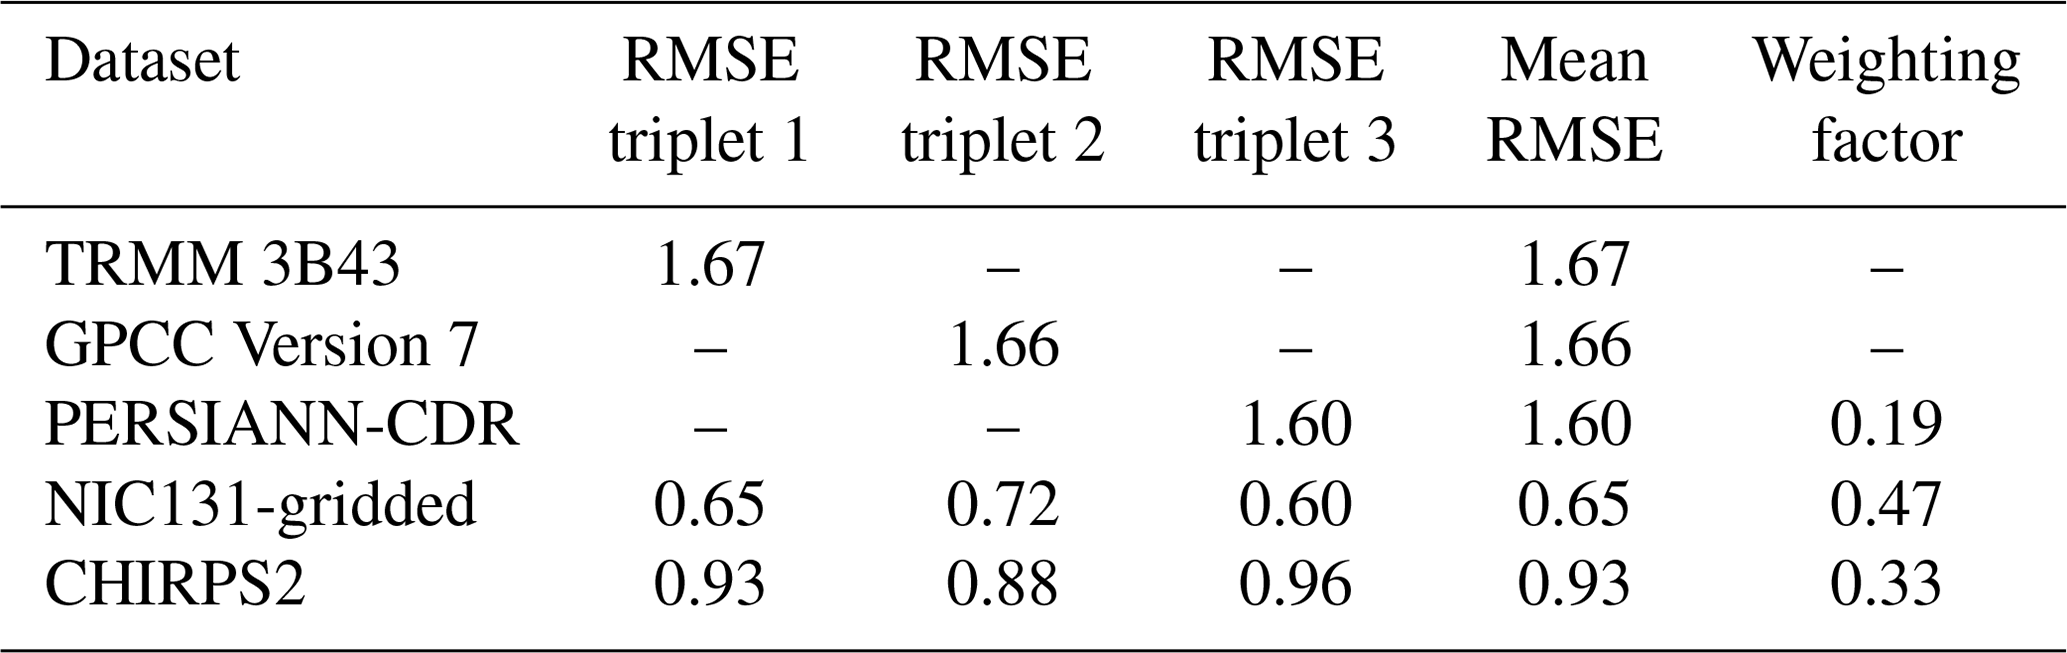
TRMM, GPCC, and PERSIANN-CDR – which all integrate GPCC rain gauges in some capacity – are highly correlated and therefore feature similar RMSEs between 1.60 cm per month (PERSIANN-CDR) and 1.67 cm per month (TRMM). Therefore, our subsequent analyses discard GPCC and TRMM and use only PERSIANN-CDR, the most accurate of the three GPCC gauge-related datasets. As discussed in Sect. 2.2, PERSIANN-CDR was implemented in a weighted average in combination with NIC131-gridded and CHRIPS2 to create a unified P time series, PTC. The NIC131-gridded dataset only lasts through 2014, so from 2015 to 2016 only CHIRPS2 and PERSIANN-CDR were used in PTC. The uncertainty in PTC was estimated to be 0.30 cm per month from 2002 to 2014 and 0.59 cm per month from 2015 to 2016 (after NIC131-gridded data coverage ends) – both lower than the RMSEs of any of the individual P products tested.
3.2 Water balance ET estimates
In Fig. 1, clear seasonal cycles as well as interannual variations are visible in all four of the hydrologic fluxes from Eq. (1): the rainy MAM and SON seasons show local peaks in ETwb as well as dS∕dt, which is generally a negative flux (representing water leaving the land surface system) for most of the rest of the year. Q has the least temporal variability of the fluxes and is the smallest in magnitude, although it exhibits increased runoff 1–2 months after the primary SON rainy season. Mean annual ETwb is 117.2±3.5 cm yr−1 (calculated from 2003 to 2015, the data-complete years of the study period). Mean annual PTC from 2003 to 2015 is 150.4±2.6 cm yr−1, and mean annual Q is 33.7 cm yr−1. dS∕dt, which fluctuates between positive and negative values, ranges from −3.2 to 3.7 cm per month on average.
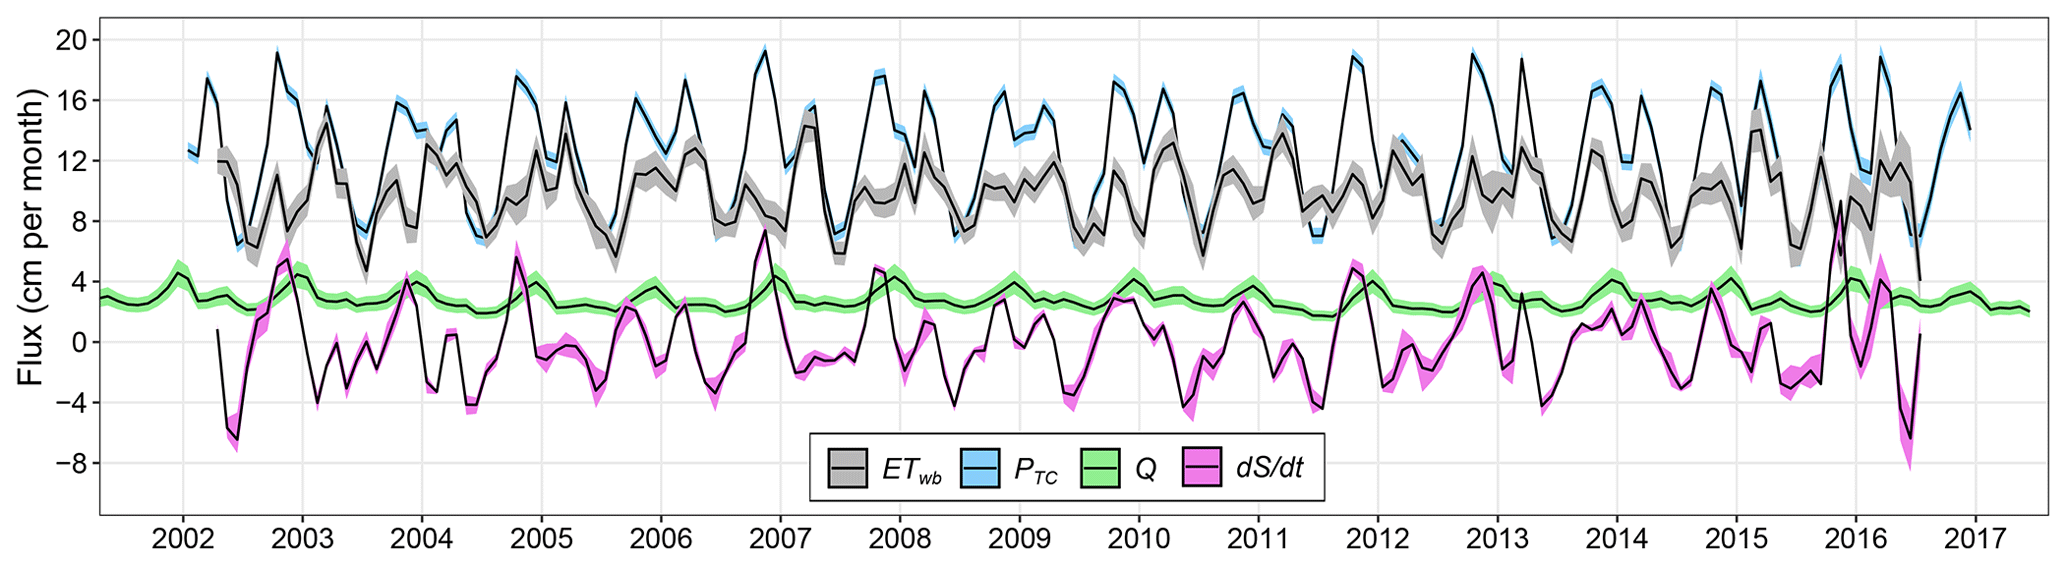
Figure 1Time series of the four water balance components from 2002 to 2016. Data are monthly, basin-wide averages in centimeter water height equivalents. Black lines represent mean values; ribbons represent uncertainty ranges.
Plotting monthly means of the water balance fluxes provides further clarity regarding their seasonal cycles (Fig. 2). The basin-wide seasonal flux cycles are dominated by contributions from the region south of the Equator, which comprises the majority of the Congo Basin (Fig. S2). October and November are the rainiest months, followed by March and April, while June and July are the driest months of the year. Positive dS∕dt rates indicate S regenerates mostly during the very wet October and November months and less so during December, the secondary rainy season in March and April, and in September with the onset of the primary rainy season. S loses water fastest during May and June, reaching its minimum during June, when ETwb exceeds PTC on average (Matsuyama et al., 1994). Interestingly, while ETwb tracks the seasonality of PTC to an extent, it peaks in March during the secondary rainy season rather than during the primary, wetter, SON wet season. The possible causes of this difference between precipitation and ET seasonality are analyzed further in Sect. 4.2.

Figure 2Mean monthly cycle of the four water balance components from 2002 to 2016. Dark lines represent mean values; ribbons represent uncertainties.
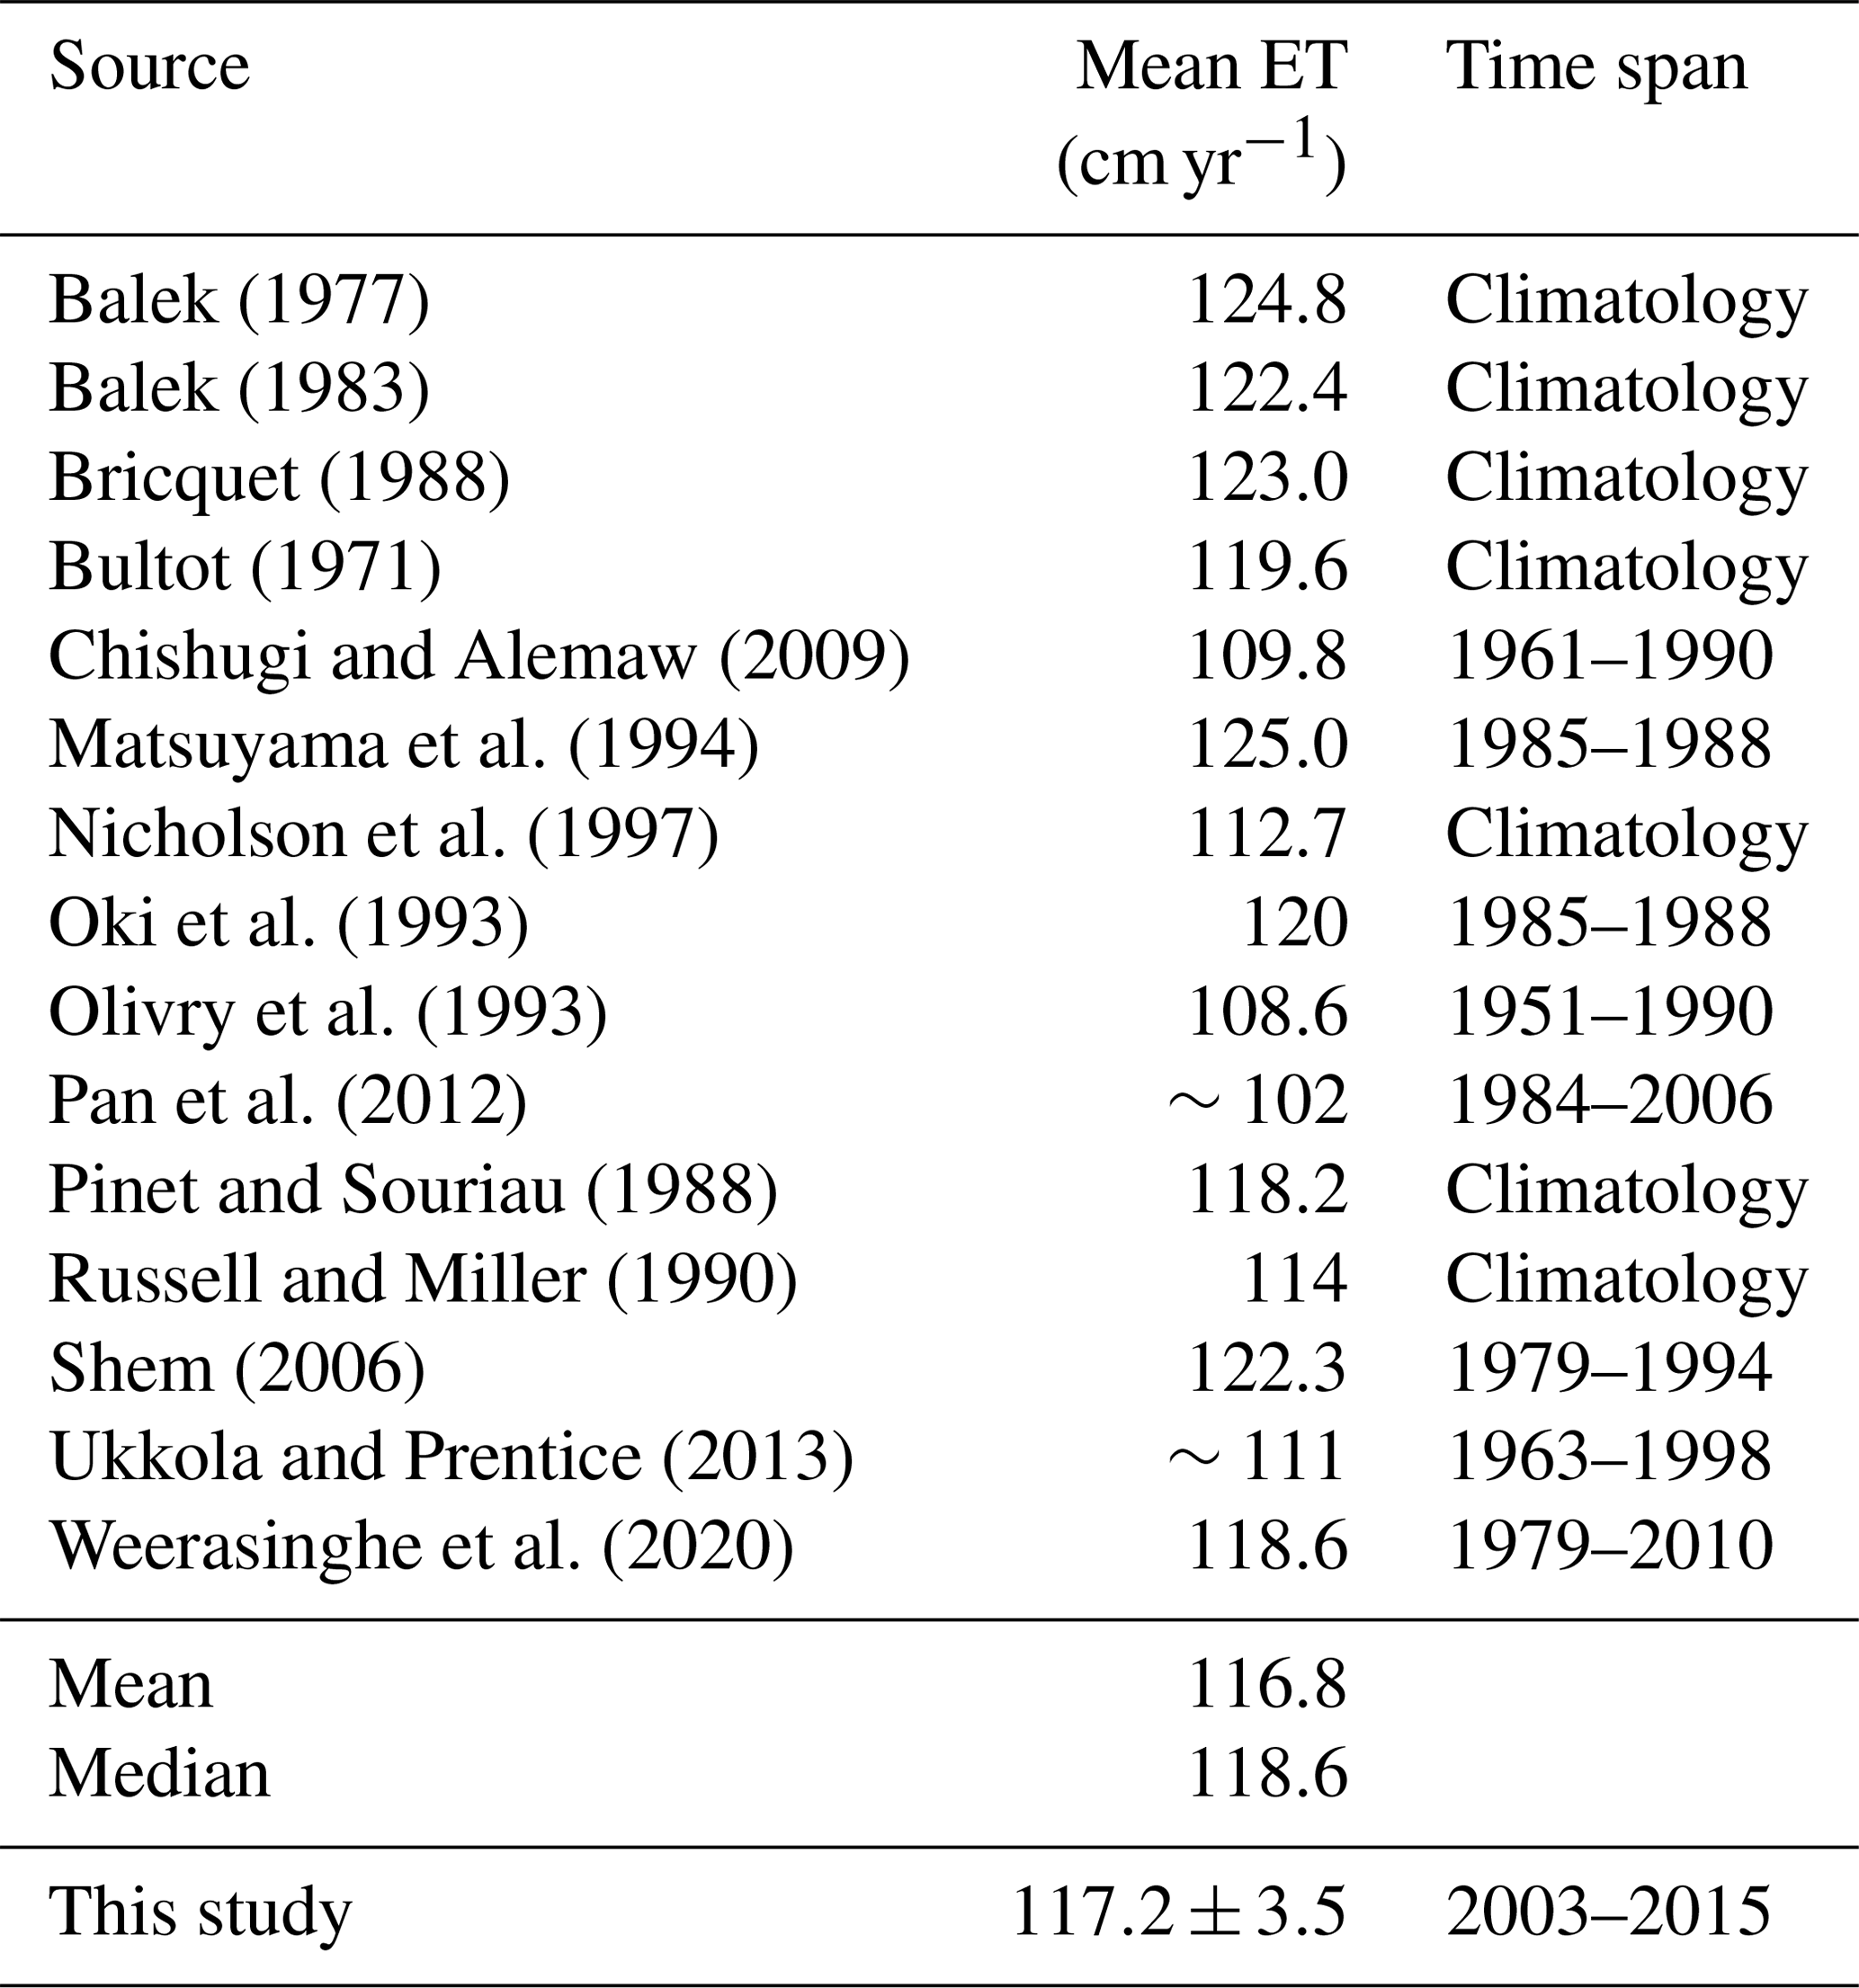
Table 2 summarizes 14 mean annual ET estimates from the Congo Basin found in the literature. The studies produce a mean ET of 116.8 cm yr−1 with a standard deviation of 6.6 cm yr−1 and a median ET of 118.6 cm yr−1, although different study periods and a variety of methods were used to estimate actual ET. All but one historical ET estimate fall within 10 % of mean annual ETwb, showing good agreement between the present study's ET estimates and prior literature on the subject.
Table 2Historical estimates of mean annual basin-wide ET from the literature. Mean and median values are derived from the literature and presented alongside the mean annual ETwb from this study.
3.3 Comparing the ETwb seasonal cycle to global ET models
The seasonal cycle of ETwb is compared to those of seven global ET products in Fig. 3. All seven products generally follow the seasonal shape of ETwb; however, none capture the full amplitude of ET fluctuations across seasons. Peak basin-wide ET during March is underestimated in all models to some degree, and all seven overestimate the basin's low JJA ET while also failing to capture the fast recovery of ETwb from August to September. The period from November to January displays the most consistent departure of global ET products from ETwb, with all seven products overestimating ET during these 3 months. Most models do correctly find ET to peak during the MAM rainy season (Matsuyama et al., 1994; Pan et al., 2012; Crowhurst et al., 2020), yet they generally underestimate how much larger the MAM ETwb peak is than the SON one. For instance, FLUXNET-MTE plots SON ET as roughly equivalent to MAM ET. In general, the global ET products underestimate the magnitude of seasonal variations in ETwb, although some track ETwb much more closely than others.
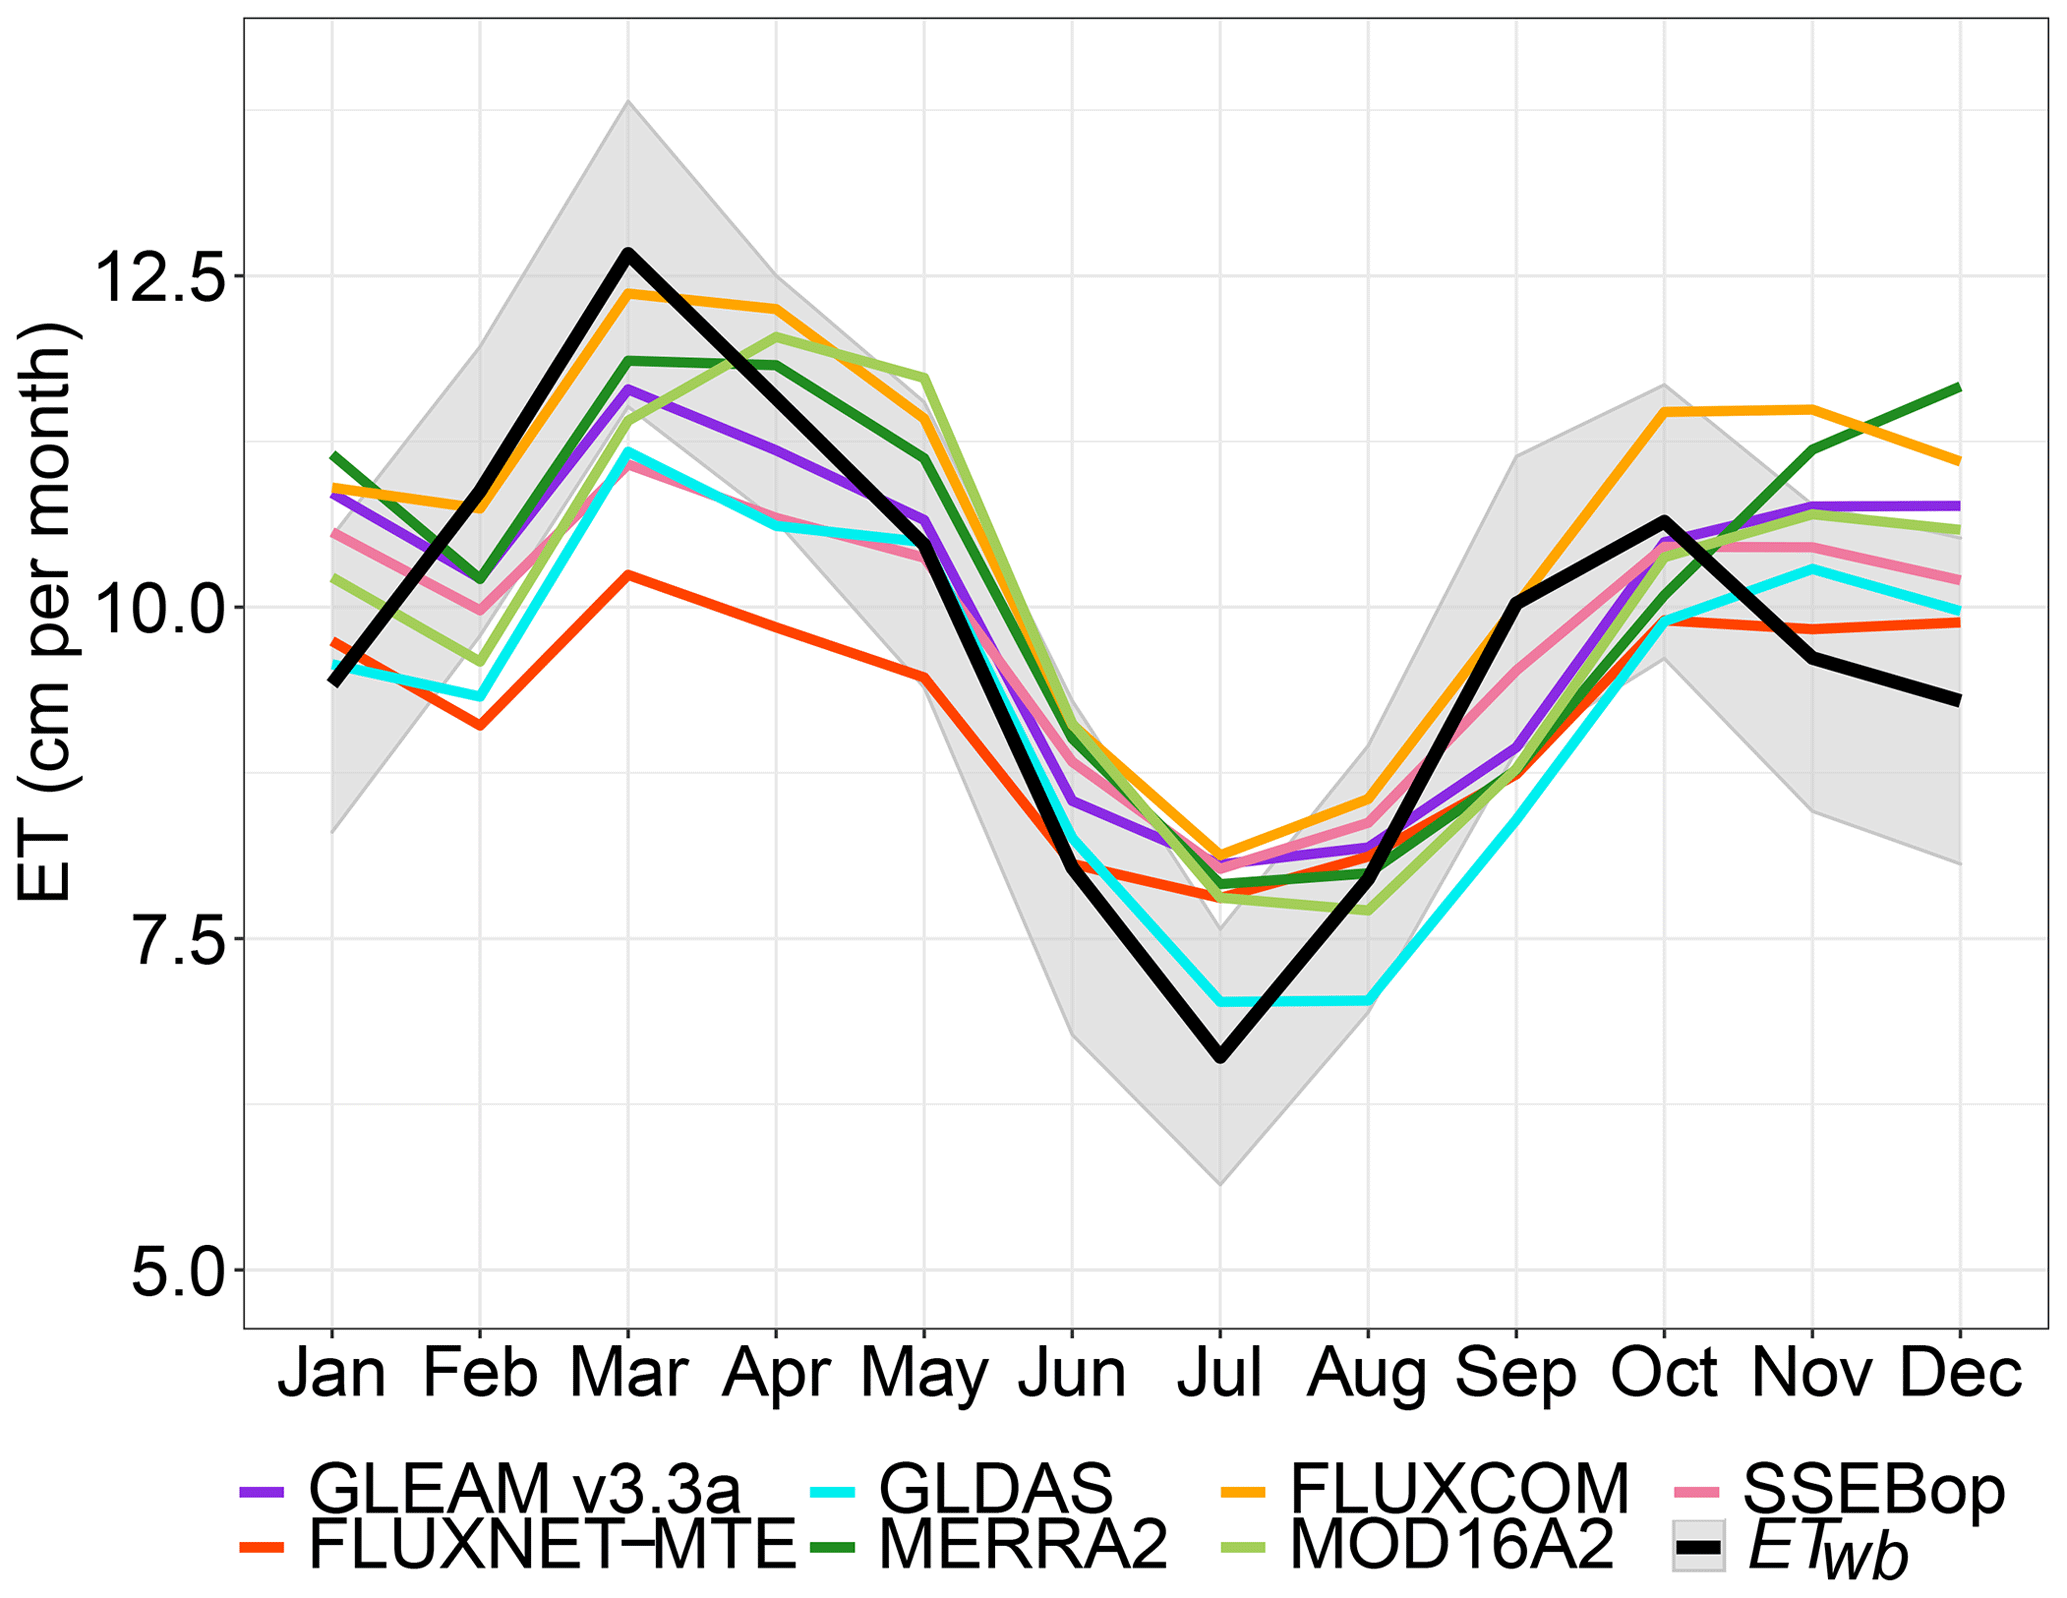
Figure 3Mean monthly cycle of ETwb plotted alongside the mean monthly cycles of seven global ET products. The gray ribbon represents ETwb uncertainty.
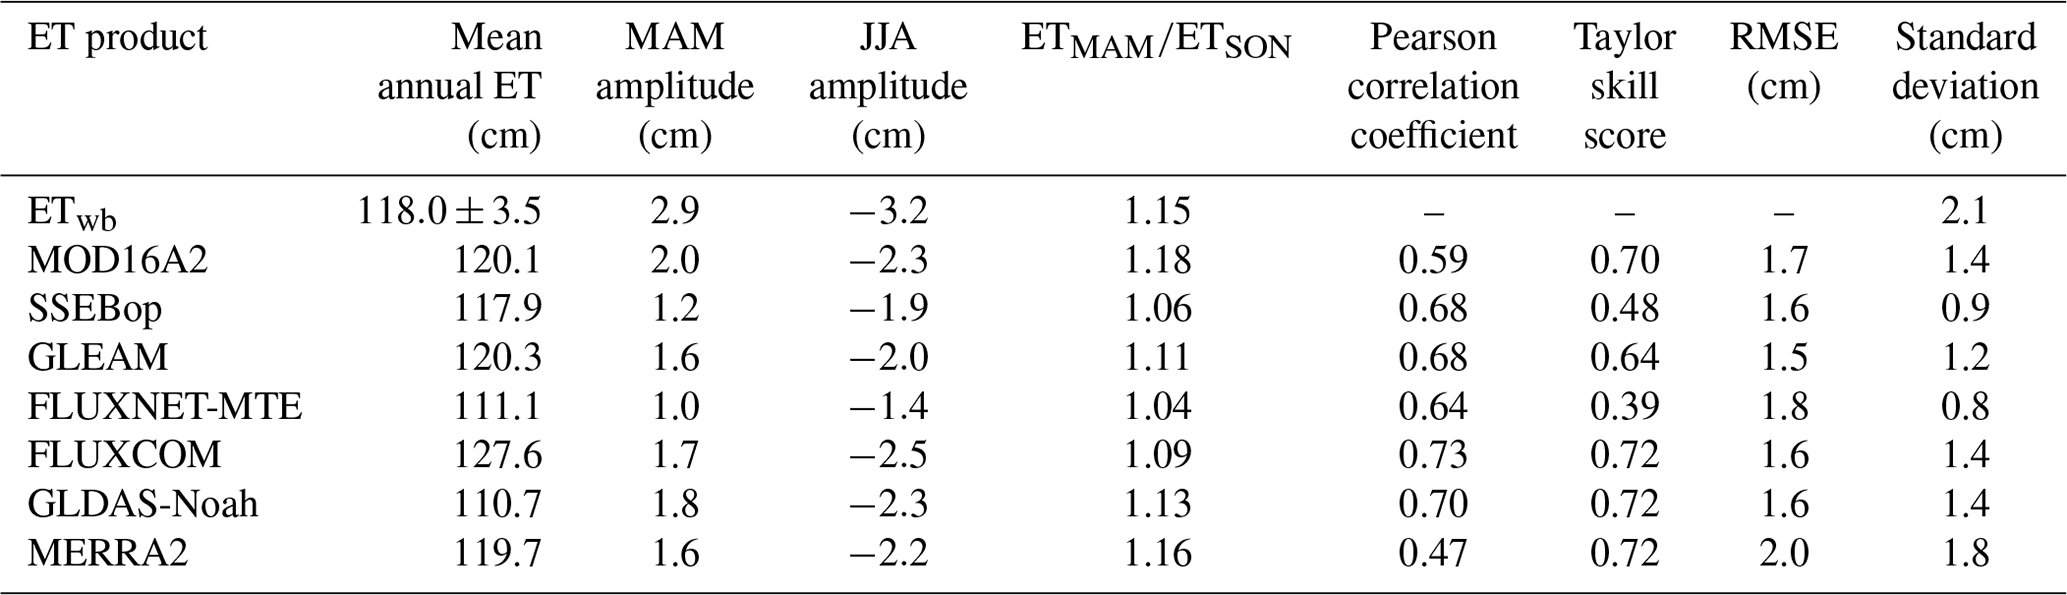
Global ET products are evaluated against ETwb from 2003 to 2011 using several metrics in Table 3. Mean annual ET ranges from 110.7 cm yr−1 (GLDAS-Noah) to 127.6 cm yr−1 (FLUXCOM), compared to the ETwb annual mean of 118.0±3.5 cm yr−1 for that time period. Global ET product annual averages all fall within 10 % of ETwb's, yet no product comes close to the 6.1 cm average difference observed between maximum and minimum ETwb, nor do they match the 2.1 cm standard deviation of the ETwb time series. All models find mean ET during MAM to exceed mean ET during SON, but the global products feature more uniform ET rates within each season (Fig. 3). FLUXCOM produces the highest Pearson correlation coefficient with ETwb, while MERRA2 produces the lowest; FLUXCOM, GLDAS-Noah, and MERRA2 lead the products in Taylor skill score, while FLUXNET-MTE achieves the lowest score. GLEAM v3.3a features the lowest RMSE relative to ETwb, while MERRA2 features the highest. FLUXNET-MTE and SSEBop both exhibit very low standard deviations that manifest in low Taylor scores, suggesting these products are the worst at representing variability in Congo Basin ET.
Table 3Mean annual ET values, mean seasonal amplitudes, ratios of seasonal-mean ET from MAM over SON, Pearson correlation coefficients, Taylor skill scores, RMSEs, and standard deviations from 2003 to 2011 for seven global ET products in comparison to ETwb.
3.4 Drivers of ET seasonality and variability
As discussed in Sect. 3.2, the shape of ETwb's seasonal cycle roughly follows that of PTC, since water availability and vegetation productivity modulate ET. However, ETwb is greater during the MAM rainy season than in the SON rainy season, despite the latter season being wetter than the former. On average, ETwb also exceeds PTC during June. These findings are consistent with previous studies that found basin-wide ET can peak during MAM (Matsuyama et al., 1994; Pan et al., 2012; Crowhurst et al., 2020), although the drivers behind this seasonal cycle are less clear. To help develop hypotheses on the nature of ET's drivers, monthly-mean ETwb is compared here to several climatic drivers and indices reflecting seasonally varying vegetation activity (Fig. 4).
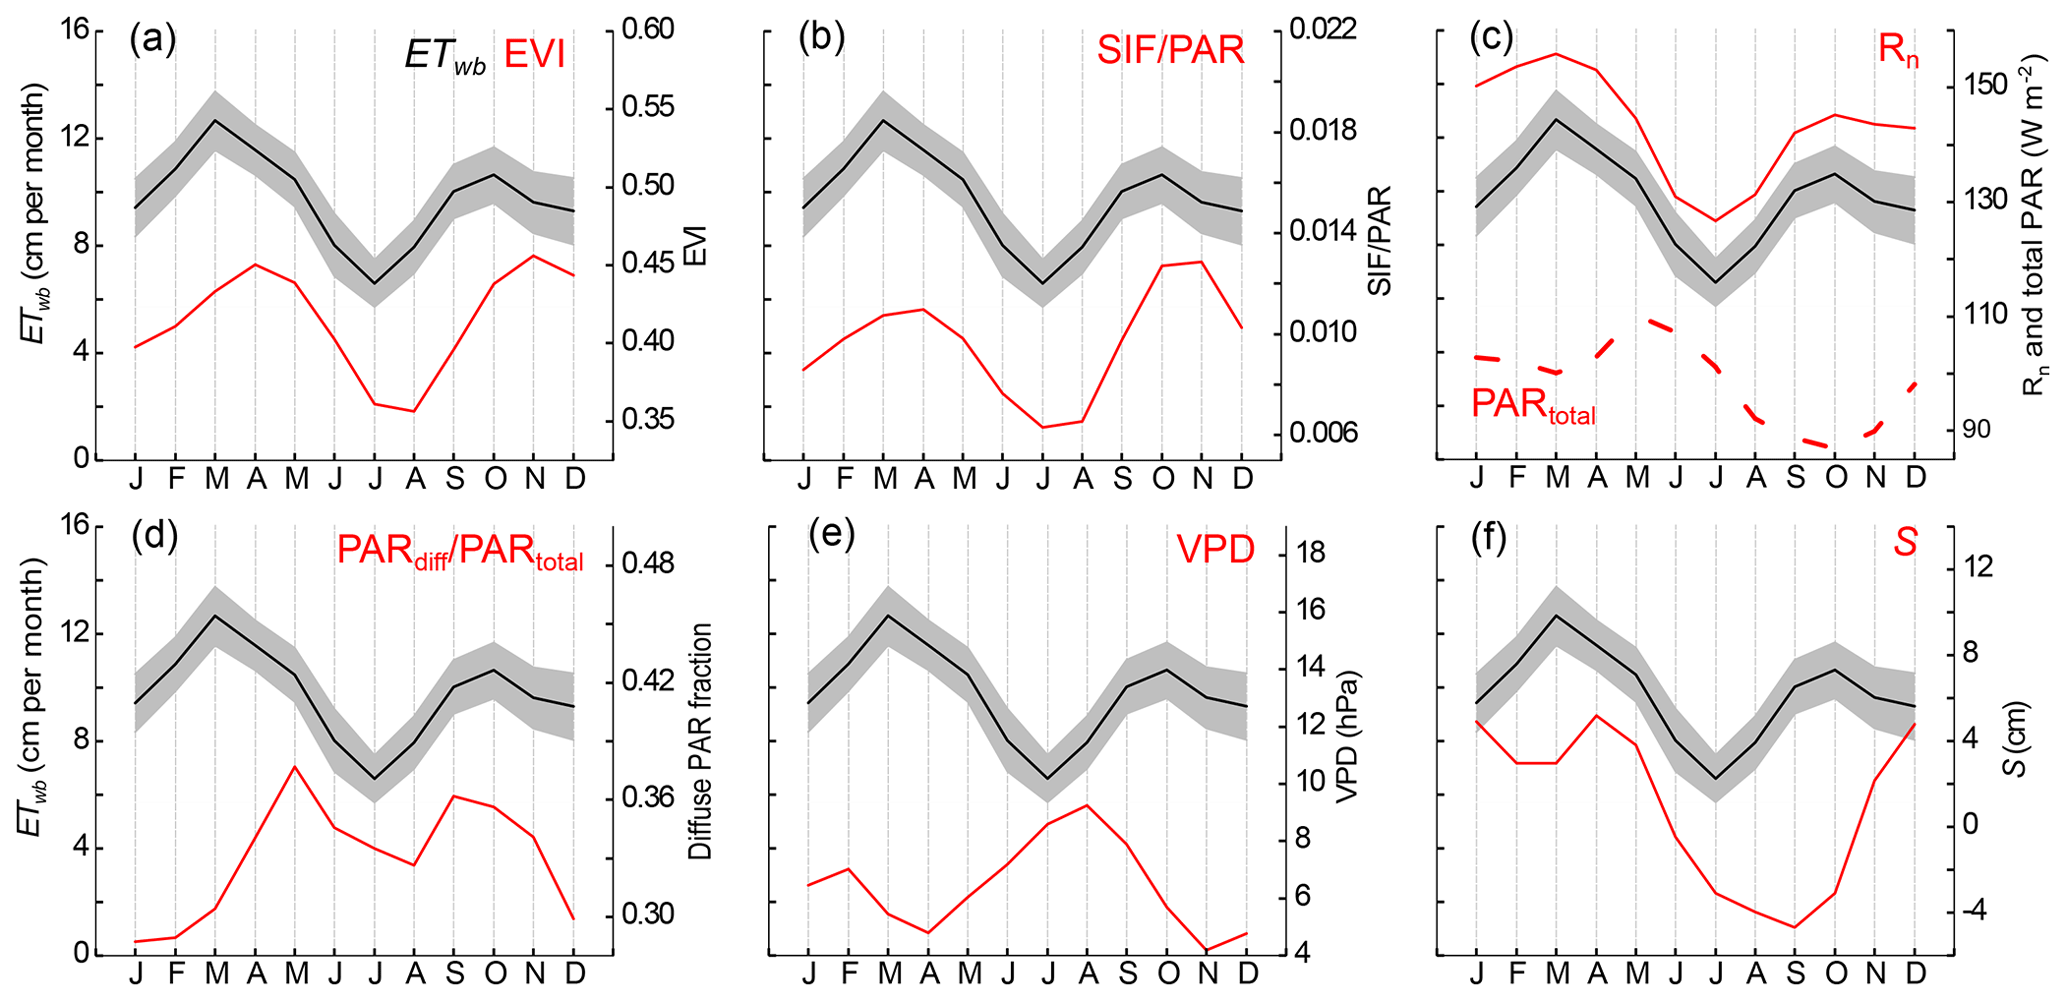
Figure 4Mean monthly cycle of ETwb (black line with gray uncertainty range) plotted alongside those of (a) MAIAC-processed EVI, (b) SIF/PAR, (c) Rn and total PAR, (d) diffuse PAR fraction (PARdiff∕PARtotal), (e) VPD, and (f) S from GRACE (red lines). Data are averaged over the entire basin area. Note that the mean ETwb curve and scale is the same in each panel.
Possible environmental drivers of ETwb's seasonality include soil water availability, water demand from VPD, solar irradiance, and temperature. GRACE-derived S can be assumed to be a partial proxy for water availability (though note that not all water measured by S is necessarily accessible to plant roots or available for soil evaporation; see Sect. 4.2.4). S is significantly lower during SON than MAM when considering the entire basin (Fig. 4f), consistent with the relatively lower SON ETwb. The relatively lower SON S could be due to the much lower precipitation during JJA than DJF (Fig. 3) and/or due to a seasonal difference in how much of the rainfall infiltrates the land surface. VPD is fairly low in both wet seasons, although still elevated in September following the JJA dry season (Fig. 4e). Rn is lower during the SON wet season than the MAM, likely contributing to the lower ETwb in SON (Fig. 4c).
The variability of ET is expected to be linked to vegetation phenology through the large contribution of transpiration to overall ET in the densely vegetated Congo Basin (Lian et al., 2018). However, both MAIAC EVI (Fig. 4a) and PAR-normalized SIF (Fig. 4b) show greater vegetation greenness and photosynthesis, respectively, during the SON wet season than during the MAM wet season (SIF peaks in October and November with or without PAR normalization, indicating both greater total photosynthesis and more light-efficient production during these months; see Fig. S3). The high SON productivity without correspondingly high ETwb suggests relatively greater water use efficiency (WUE, or the ratio of photosynthetic production to the amount of water transpired through plants' stomata) in SON and/or a relatively greater contribution of direct soil and canopy evaporation to ET in MAM (although bare soil evaporation is expected to be a minority of total ET in the densely forested basin; see Sect. 4.2). WUE during SON may be higher than in March and April (when ETwb peaks) because of the greater ratio of diffuse PAR to total PAR during SON (Fig. 4d) which can increase photosynthetic efficiency (Mercado et al., 2009), as further discussed in Sect. 4.2.3.
The basin-wide analyses in Fig. 4 are almost certainly masking significant subbasin variability. The subbasin division of ET is not known, and dividing the coarse-resolution S at the subbasin level is also highly uncertain. Nevertheless, we considered the subbasin variation of MAIAC EVI, PAR-normalized SIF, and VPD in Fig. 5. The basin was divided into the equatorial evergreen forest region, northern deciduous ecosystems, and southern deciduous ecosystems (Fig. S2). The deciduous regions feature larger seasonal variations in all three variables than the evergreen forest does, but the opposite seasonalities of the northern and southern regions partially offset one another and produce basin-wide EVI and SIF/PAR cycles that are roughly similar to those of the evergreen forest (Figs. 4a, b and 5b). The greater extent of the southern deciduous region results in basin-wide EVI and SIF/PAR minima during JJA rather than DJF, and basin-averaged VPD likewise peaks during JJA (Fig. 4e) despite its low variability in the extensive evergreen forest region (Fig. 5b). Taken together, the results of Fig. 5 suggest that a basin-wide analysis is informative despite averaging over multiple vegetation types.
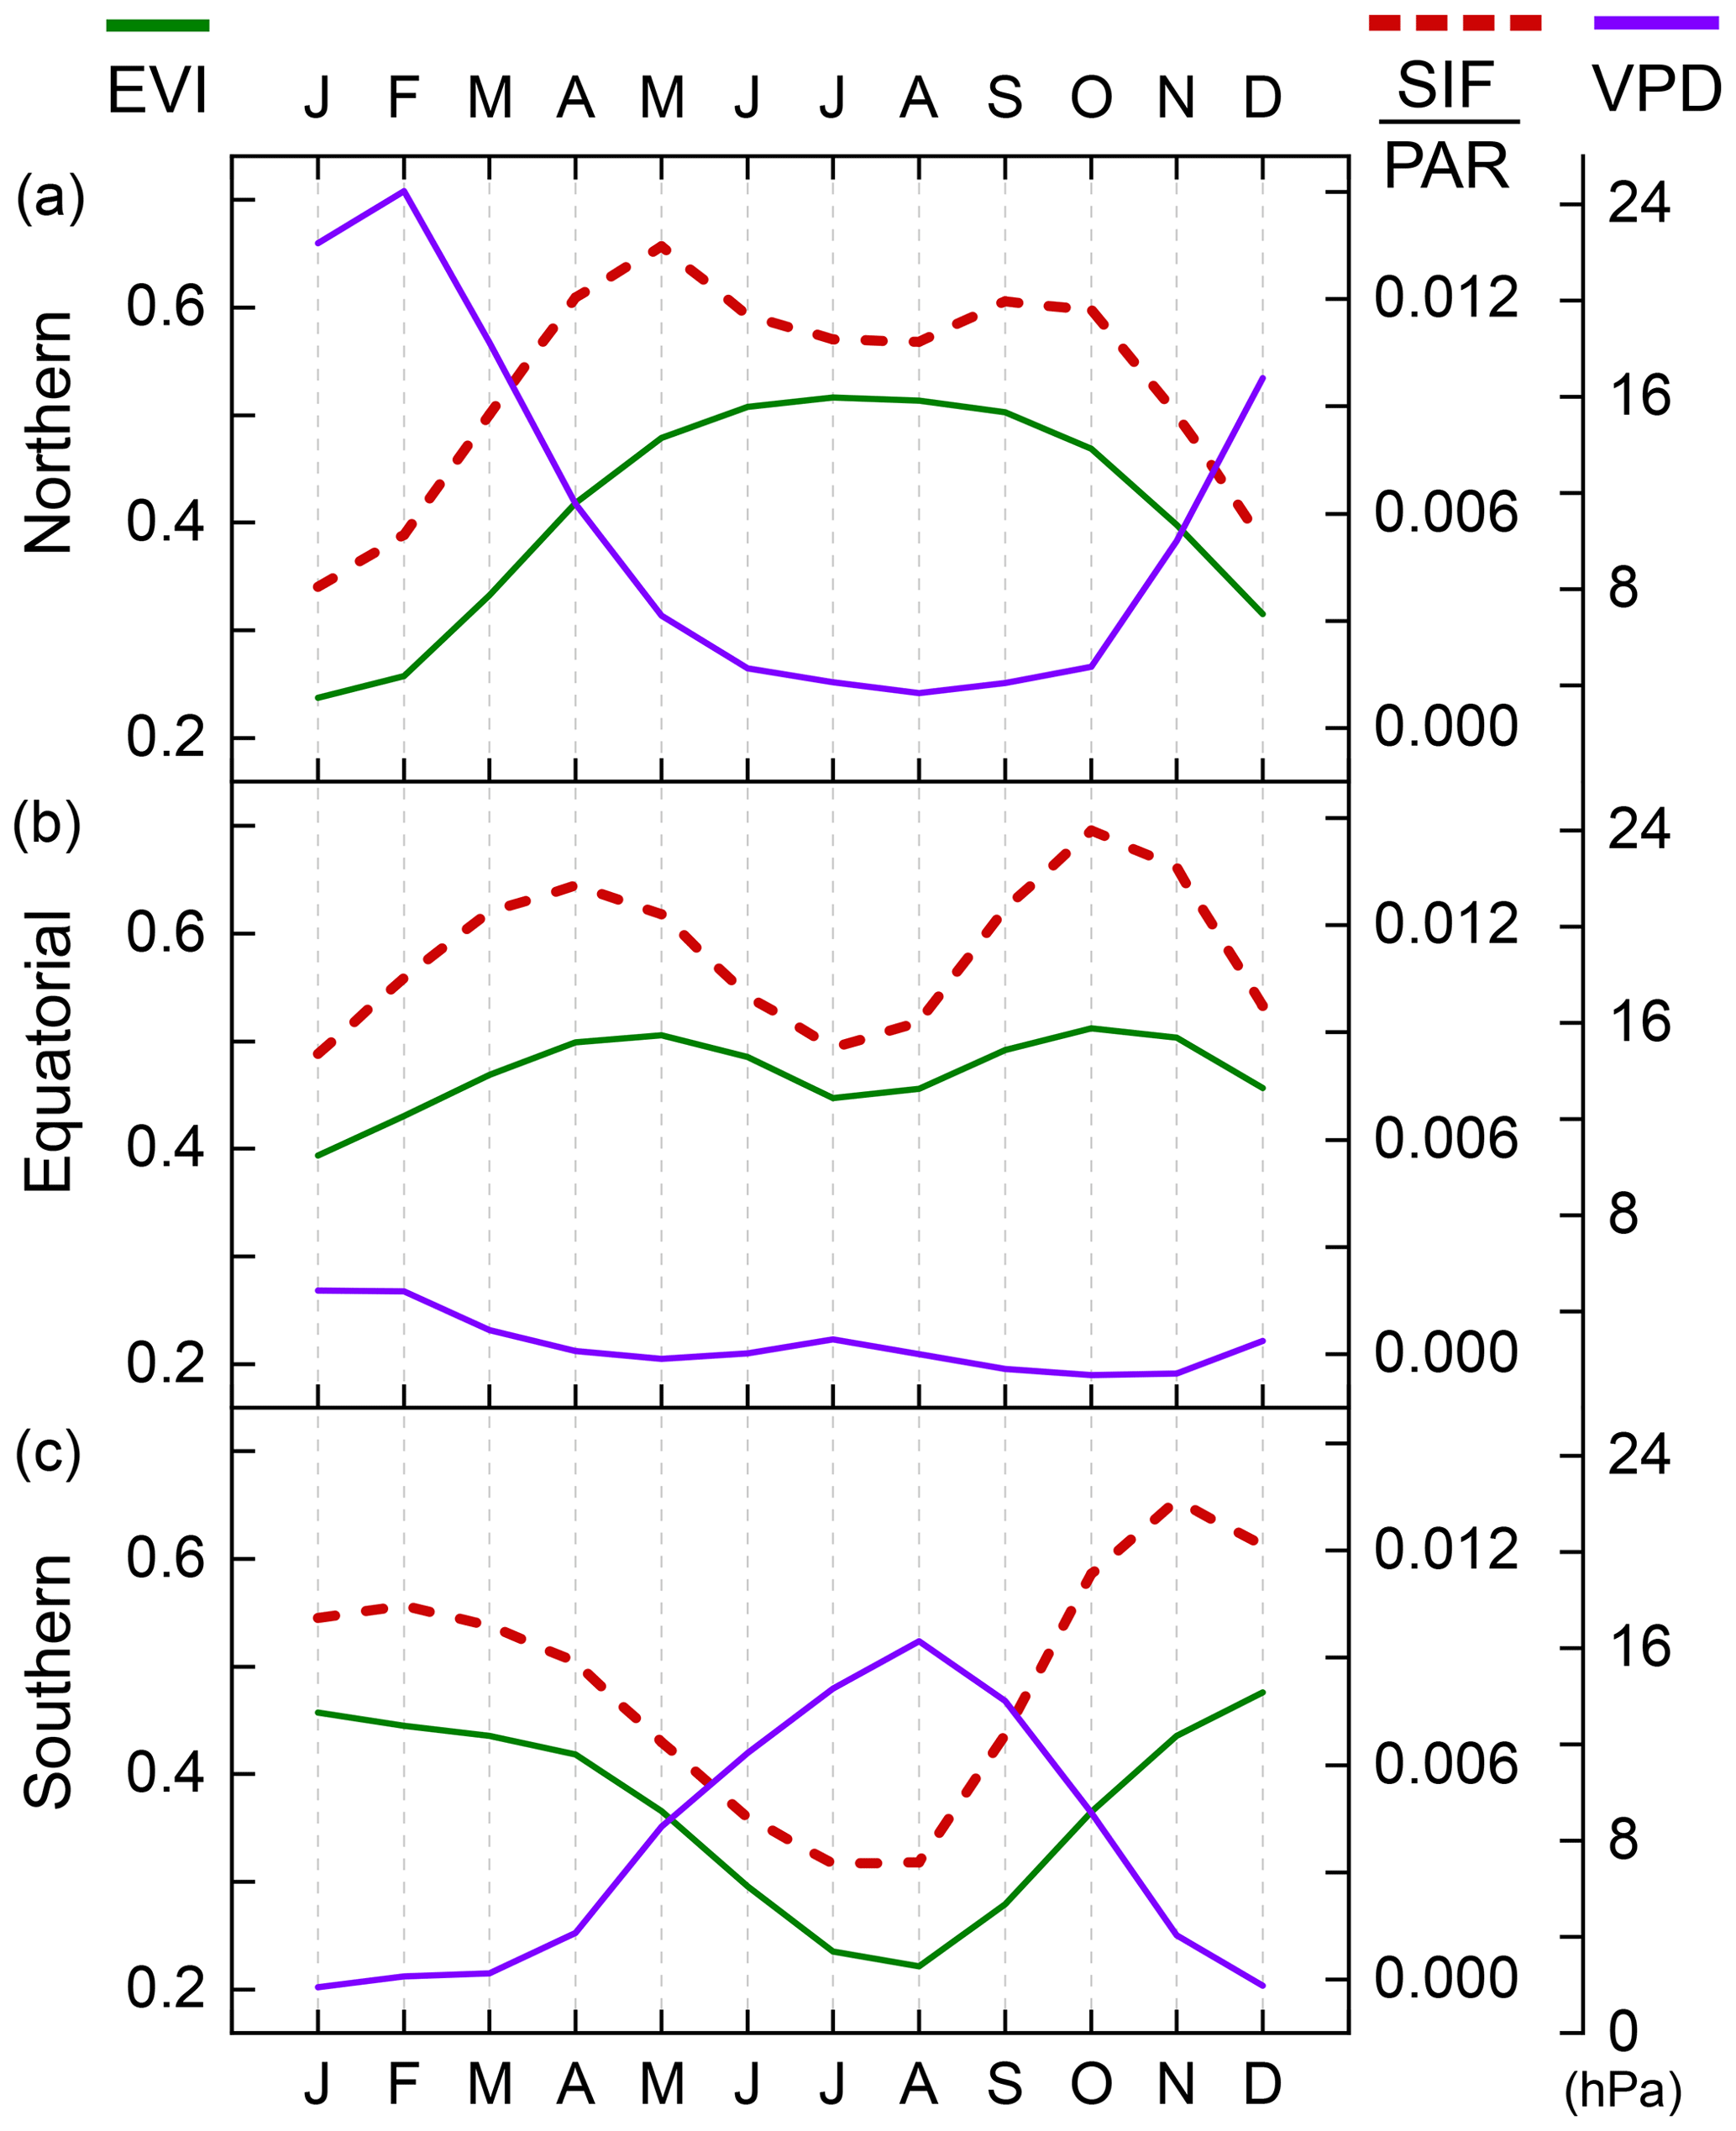
Figure 5(a) Average monthly cycles of MAIAC-processed EVI (green line), SIF/PAR (red dashed line), and VPD (purple line) for the northern deciduous area of the Congo Basin. (b, c) As with (a) but for the equatorial evergreen and southern deciduous regions, respectively. Scales are consistent between plots (a) and (c) for each variable.
3.5 Long-term climatic shifts and their impacts in the Congo Basin
We detect no significant linear trends in ETwb, PTC, dS∕dt, or Q from 2002 to 2016 after removing average seasonal cycles with BFAST (Fig. 6). However, several interannual trends are detectable in other environmental data (Fig. 7): PAR, Rn, and VPD all increase significantly from 2002 to 2016 after the average seasonal cycle is removed from the time series, indicating the Congo Basin has become sunnier and less humid in recent years. This progression to sunnier and less humid conditions in the Congo Basin is not reflected in ETwb and productivity (as measured by MAIAC EVI), which do not show long-term changes over the past 2 decades (Figs. 6d and 7d).

Figure 6Linear regressions of deseasonalized monthly (a) Q, (b) dS∕dt, (c) PTC, and (d) ETwb.
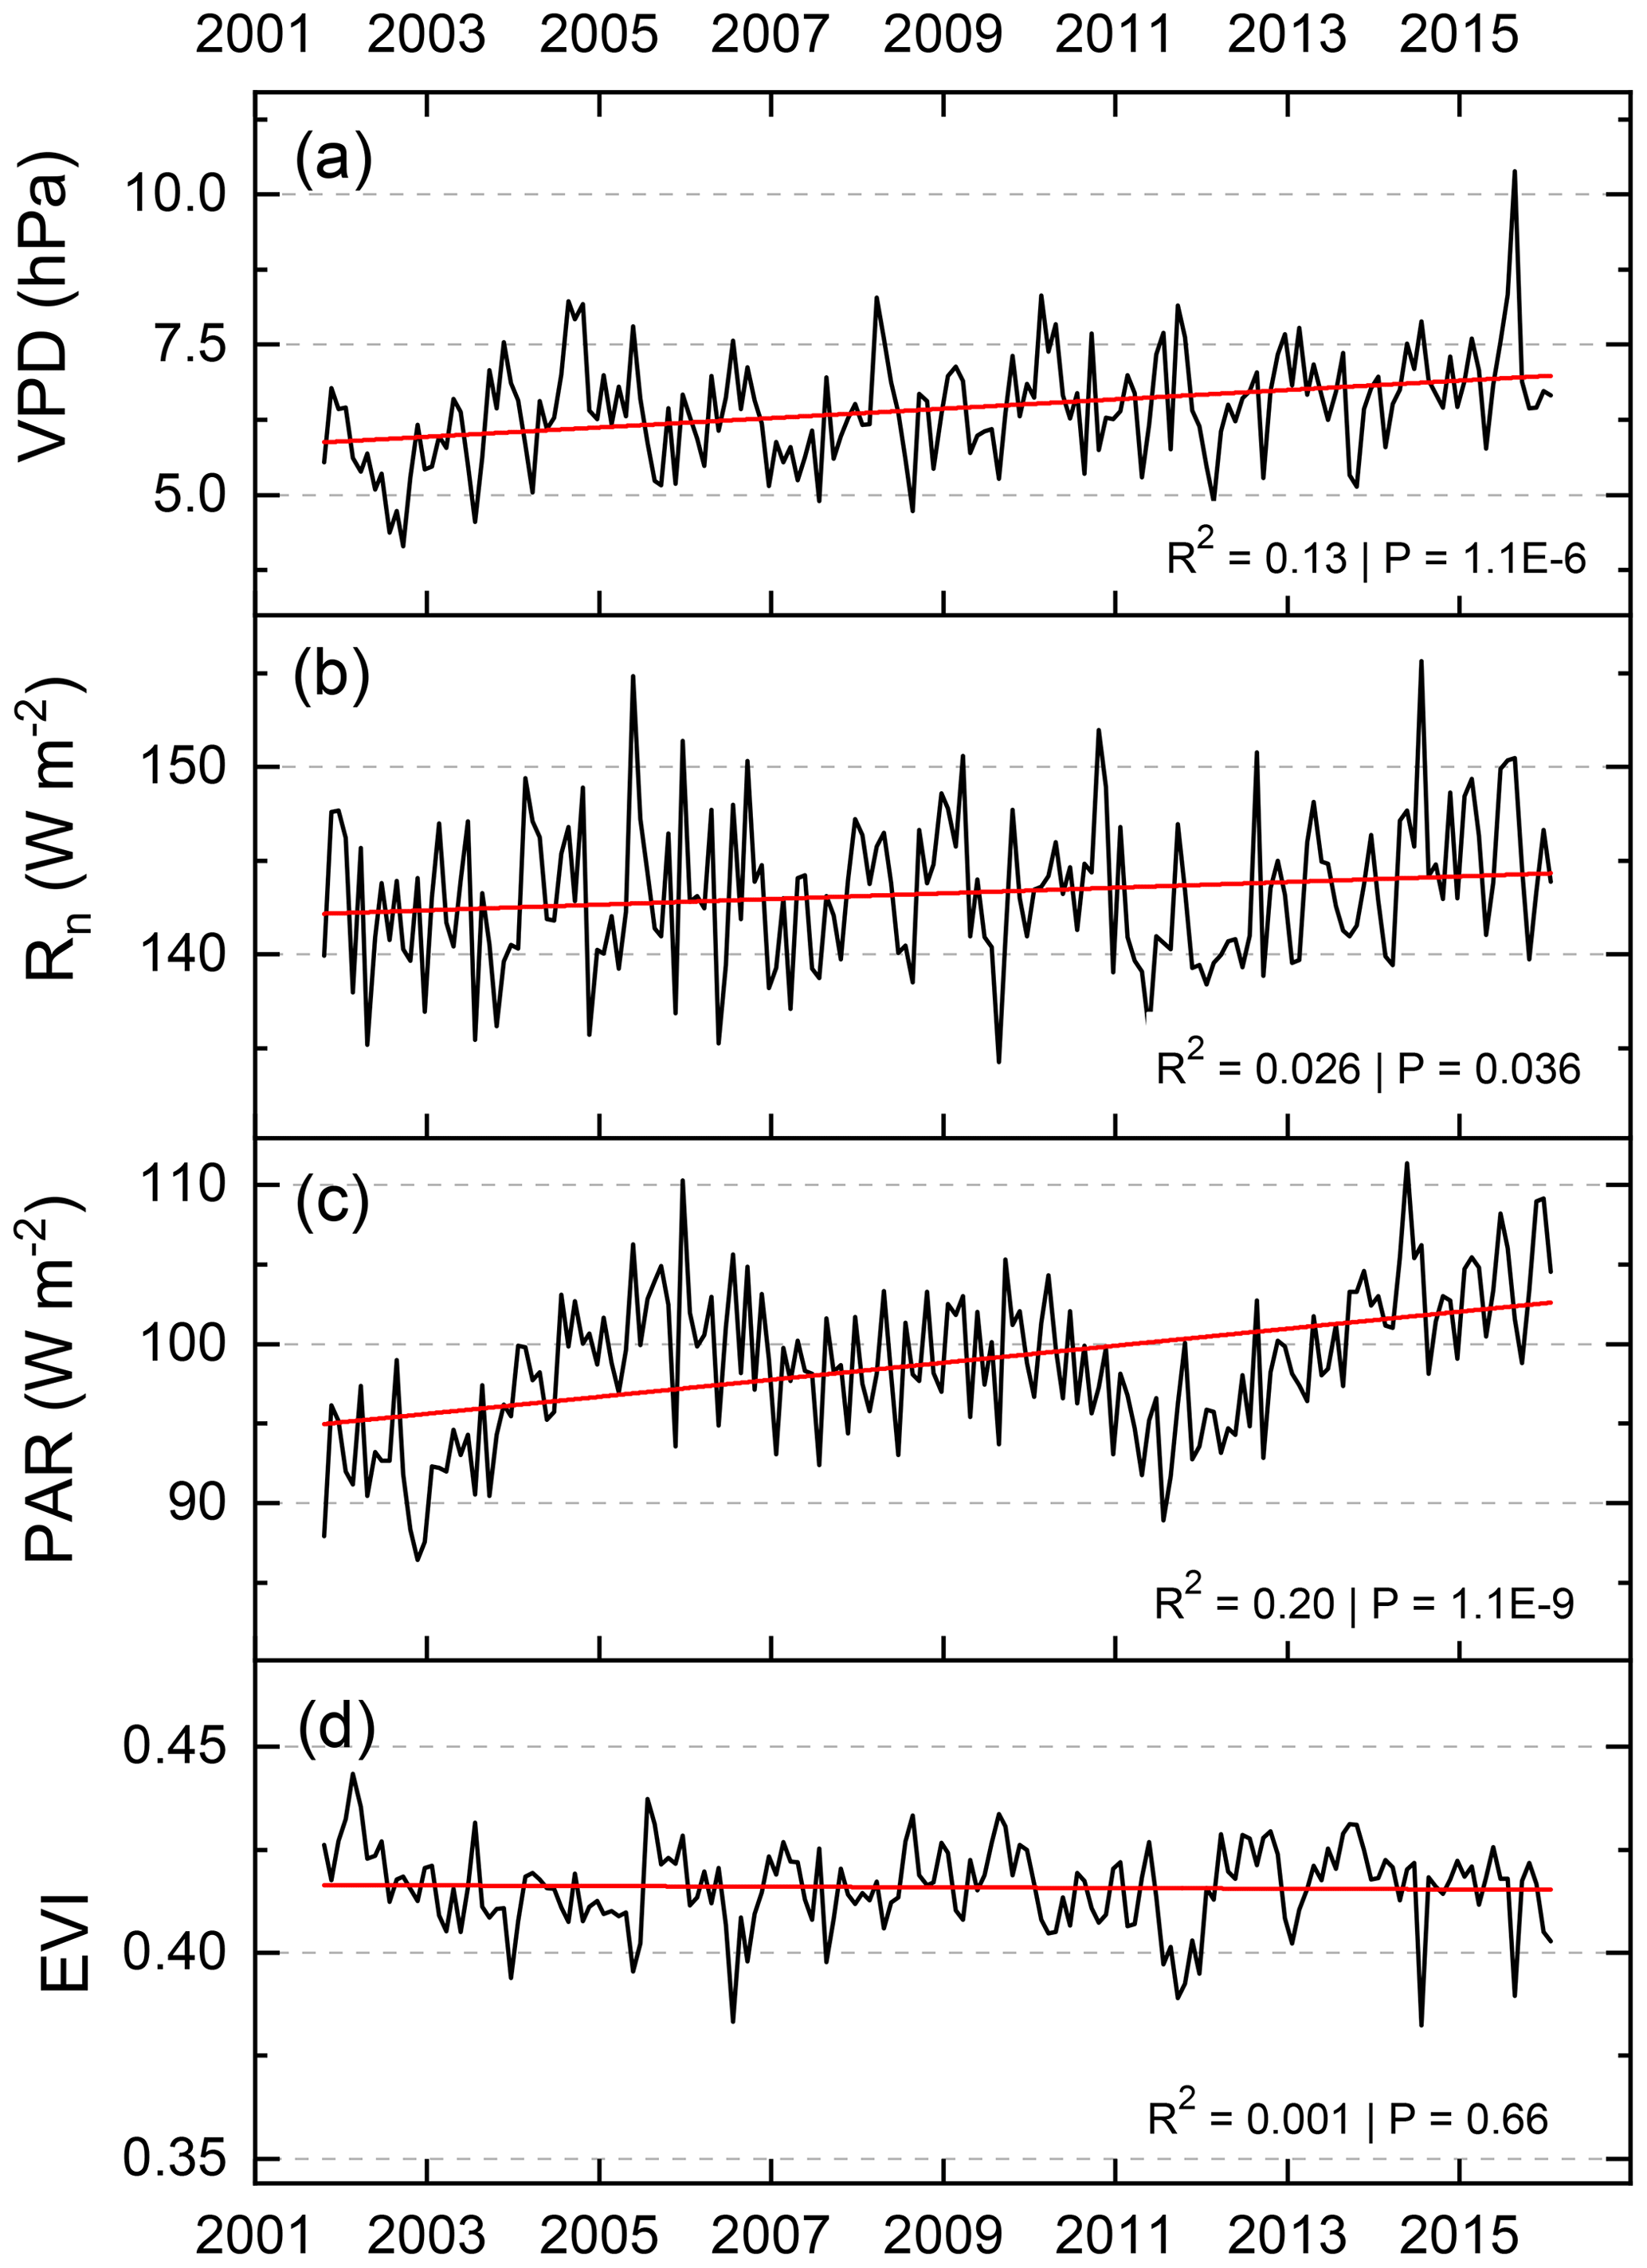
Figure 7Linear regressions of deseasonalized monthly (a) VPD, (b) Rn, (c) PAR, and (d) MAIAC EVI.
4.1 The value of water-balance-based ET estimates
The scarcity of operational precipitation gauges and complete lack of eddy covariance towers within the Congo Basin have previously restricted ET estimates to process-based models, short-term ET observations at the site scale, and global products with insufficient validation in tropical Africa. The water-balance-based ETwb derived here provides a basin-wide constraint on ET. It has an uncertainty that is relatively low compared to its average seasonal cycle (Fig. 2), and its magnitude matches well with previous long-term ET estimates from the basin (Table 2). The shape of its annual seasonal cycle (with ETwb peaking in MAM rather than in SON) also agrees with several previous ET modeling efforts in the basin (Matsuyama et al., 1994; Pan et al., 2012; Crowhurst et al., 2020). These findings support the accuracy of the water balance model in estimating basin-wide ET.
The results of this study also reinforce the value of the inverted-water-balance method for studying river basins large enough to accommodate the coarse spatial resolution of GRACE data. Compared to the difficulty of directly measuring ET and the large amount of observational data needed to constrain ET models, the inverted water balance is conceptually straightforward and has relatively simple data requirements. But as demonstrated here and in other large river basins like the Amazon (Maeda et al., 2017; Swann and Koven, 2017), inverting the water balance produces robust estimates of ET which can be used to validate and improve other ET models' representation of sparsely observed basins. Limitations of water balance ET estimates include the coarse spatial resolution, monthly time steps, short temporal coverage of GRACE (2002–2016, with various data gaps), availability of river discharge data for the area of interest, and quality of gridded P data in the region. However, the use of dS∕dt data may not be necessary in long-term ET estimates (Weerasinghe et al., 2020), so the limitations of GRACE data mostly affect studies examining ET variability on annual or shorter timescales. The uncertainties of P datasets can be assessed and mitigated using techniques such as TC (Stoffelen, 1998; McColl et al., 2014; Alemohammad et al., 2015; Dong et al., 2020), but basins with more thorough gauge coverage than the Congo probably do not require such thorough analysis of multiple gridded P products.
4.2 The seasonal imbalance of ETwb and P maxima
As expected, the seasonal cycle of ETwb mostly follows that of precipitation, with two annual dry and two annual wet seasons. However, the seasonal cycles of P and ETwb feature an interesting offset: whereas SON is the wetter of the two rainy seasons, ETwb is greater during MAM than during SON (Fig. 2). The ETwb peak during MAM is supported by several previous modeling efforts with a variety of methodologies (Matsuyama et al., 1994; Pan et al., 2012; Crowhurst et al., 2020), indicating it is not simply an artifact of the water balance model or the data sources used here. Yet the underlying causes of the imbalance are not well understood (Crowhurst et al., 2020). We evaluated several possible drivers of the observed MAM peak in ETwb including phenology, photosynthetic production (via EVI and SIF), terrestrial water availability (via GRACE-derived S), PAR, Rn, VPD, Ta, and Ts. Ultimately, we conclude that higher levels of solar irradiance (especially photosynthetically favorable diffuse radiation) and greater soil water availability during MAM provide the most likely explanation for seasonally high ET rates.
As transpiration is the dominant component of ET throughout the Congo Basin (Lian et al., 2018), primary productivity (through its links to stomatal closure and active leaf area) likely explains the seasonality of ETwb to some degree. In fact, recent studies have found that evergreen forests in an equatorial section of the Congo exhibit a similar greenness seasonality to the seasonality of ETwb, with a bimodal cycle generally aligning with P but peaking in MAM instead of the wetter SON (Betbeder et al., 2014; Philippon et al., 2016). However, these studies focused on specific areas of evergreen forests and wetlands that may not represent the ecohydrology of the Congo Basin's entire equatorial rainforest belt and used MODIS products that do not fully account for sun-sensor geometry and other sources of error at low latitudes (Hilker et al., 2012; Bi et al., 2016). To this end, the MAIAC algorithm (Lyapustin et al., 2018) reduces noise and increases the availability of clear-sky data in wet tropical regions (Maeda et al., 2016). Here we find that, after correction with the MAIAC algorithm, EVI data from the Congo Basin's evergreen forest region do not present any significant difference between the two rainy seasons (Fig. 5b), and basin-wide MAIAC EVI appears to peak during SON rather than MAM (Fig. 4a). Furthermore, direct estimation of photosynthetic rates using SIF/PAR data reveals greater productivity and light use efficiency (LUE) in SON than MAM throughout the evergreen forest band (Fig. 5b) and the basin as a whole (Figs. 4b and S3). The misaligned seasonal peaks of SIF/PAR and ETwb indicate that either (a) water use efficiency (WUE) varies seasonally when generalized across the basin, resulting in higher MAM transpiration but lower MAM photosynthesis, or (b) the MAM peak in ET is primarily driven by direct evaporation from the canopy or land surface rather than transpiration.
4.2.1 Leaf-age-related WUE variations
Leaf age offers a possible explanation for the variable WUE hypothesis. Studies of tropical trees have found that new leaves can take 1–2 months to reach peak photosynthetic capacity and WUE and that both traits tend to decline as leaves reach 5–6 months old (Sobrado, 1994; Shirke, 2001). Leaf age has been linked to photosynthetic seasonality within the Amazon rainforest (Wu et al., 2016), although this effect has not been investigated in the Congo Basin. Connecting the phenology of Congolese forests to basin-wide photosynthesis and transpiration must account for multiple broad ecoregions that span the Equator and therefore face inverted seasonalities (Figs. 5 and S2). In much of the deciduous woodlands of the northern (southern) basin, vegetation leaf flushing tends to begin 1–2 months prior to the onset of MAM (SON) rains, and senescence begins around the end of the SON (MAM) rains, but both processes occur over the course of 1–2 months (Guan et al., 2014; Vinya et al., 2019). Likewise, microwave backscatter data from large areas of the Congo's evergreen forests imply canopy biomass and/or water content peak during JJA and, to a lesser extent, DJF (Guan et al., 2013; Konings et al., 2017). But phenological observations from Gabon indicate that new leaf growth is suppressed during JJA and that the full mature-leaf tree canopies common in JJA contain an elevated fraction of senescing leaves, so dry-season backscatter peaks in Congolese evergreen forests may not be attributable to widespread leaf-flushing events (Bush, 2018). Overall, the phenological synchronicity of leaf-out events appears to be low in the evergreen forests of central Africa (Couralet et al., 2013; Bush, 2018), so the magnitude and hydrologic effects of evergreen leaf flushing are probably smaller and more temporally distributed in the evergreen forests than in the deciduous woodlands of the basin.
After accounting for the different ecoregions within the Congo Basin, leaf age effects alone appear unable to explain the flipped seasonality of ETwb in the two rainy seasons: although WUE increases as leaves mature, overall transpiration rates in tropical deciduous leaves remain high until they reach old age (Sobrado, 1994; Shirke, 2001). Thus, July–August leaf flushing of the southern deciduous woodlands, which far exceed the northern woodlands in area (Fig. S2), would most likely increase basin-wide transpiration alongside photosynthesis during SON. While our current understanding of regional phenology appears broadly consistent with remotely sensed vegetation data, better field observations of phenology, leaf age, and associated changes in stomatal conductance and productivity in the different ecosystems of the Congo Basin are needed to fully determine the role of vegetation in modulating ET seasonality.
4.2.2 VPD and temperature
Climatic conditions beyond precipitation could also contribute to the seasonal variations in WUE. For instance, high VPD reduces WUE by drawing more water from stomata per unit of carbon intake during transpiration. Basin-averaged VPD data from the ERA-Interim reanalysis do not indicate that MAM conditions are significantly less humid than SON conditions (Fig. 4e), suggesting seasonal VPD variations cannot explain the swapped ETwb–precipitation wet-season magnitudes. But the uncertainties in reanalysis-based temperature and humidity data from tropical regions (Lorenz and Kunstmann, 2012; Brands et al., 2013) warrant an examination of the limited in situ data available from within the Congo Basin. Observational VPD data from weather reports show that while ERA-Interim captures the shapes of seasonal VPD cycles fairly accurately, it fails to capture the magnitude of daytime VPDs in the evergreen rainforest (Fig. S1). Further examination of station and reanalysis data from within the evergreen forest region shows that rainforest VPD is slightly greater during MAM than SON (Figs. 5b and S1c–f), consistent with models based on historical pan evaporation data across the basin (Bultot, 1971) and historical atmospheric humidity data from within the equatorial rainforest (Lauer, 1989). However, because evergreen rainforest VPDs are generally low compared to other regions of the basin (Fig. 5) and are only slightly greater during MAM (Fig. S1c–f), VPD is not expected to be a significant driver of ET variations at basin-wide scales.
While basin-averaged Ta does not vary drastically throughout the year, Ts features a bimodal seasonality that peaks primarily in September and also from February to March (Fig. S4). Ts can regulate ET via stomatal conductance, which tends to increase with leaf temperature to a point, although a wide range of sometimes-contradictory results have been published on this matter (Urban et al., 2017). In this case, the poor alignment of peak Ts and ETwb values – taken in conjunction with the widespread stomatal closures known to occur in tropical forests during the hottest parts of the day (Fisher et al., 2006; Konings and Gentine, 2017; Konings et al., 2017) – indicate that other variables are more directly responsible for the high ETwb observed during MAM.
4.2.3 Radiative fluxes
The magnitude and quality of radiative fluxes can drive the dynamics of ETwb by influencing primary production as well as WUE. Rn and total PAR are both diminished in SON relative to MAM levels (Fig. 4c), which does not explain the SON peak in primary production observed in SIF/PAR and EVI data (Fig. 4a and b). However, greater Rn levels during MAM could decrease WUE by increasing water demand, thereby driving the high ETwb levels observed in MAM.
In addition to the magnitude of the incoming radiative flux, the quality of PAR could affect WUE and explain the apparent decoupling of productivity from irradiance levels and ETwb. Prior studies have found that increasing PARdiff∕PAR can raise WUE and LUE in tropical savannahs and global forest canopies, including an Amazonian tropical broadleaf stand (Alton et al., 2007; Kanniah et al., 2013). Furthermore, total canopy ET has been found to decrease as the diffuse light fraction increases (Rocha et al., 2004). Philippon et al. (2019) examined diffuse and direct irradiance data from the Breathing Earth System Simulator (BESS; Ryu et al., 2018) and the Satellite Application Facility on Climate Monitoring (CM-SAF; Müller et al., 2015) and found that the ratio of direct irradiance is often higher during MAM than in SON throughout much of the Congo Basin. The CERES data produce similar results: while PARdiff∕PAR peaks in May, it remains low throughout March and April (the month when ETwb peaks), and the greater total PAR flux in MAM is mostly attributable to greater PARdir (Fig. S5). LUE (as approximated by PAR-normalized SIF) is greater during SON (Figs. 4b and 5), which is consistent with the presence of higher-quality radiation during the primary rainy season. After removing seasonal cycles and long-term trends, monthly-mean SIF/PAR displays a strong negative correlation with mean PARdir but not with PARdiff, indicating photosynthetic rates do not scale as well with increasing direct sunlight as with diffuse sunlight (Fig. S6). These experiments suggest the quality of irradiance during SON could allow for higher photosynthetic rates with lower ET than during MAM, especially since monthly PARdiff∕PAR in the Congo remains below 0.4 on average (Kanniah et al., 2013) and lower Rn corresponds to lower water demand (Philippon et al., 2019). Even if total PAR availability would favor a productivity peak in MAM, lower WUE and LUE could result in plants transpiring water at the highest possible rate without reaching the productivity levels achieved in SON. Thus the quality of solar irradiance potentially explains ETwb's imbalanced seasonality.
4.2.4 Terrestrial water storage
The availability of water in the rooting zone can modulate ETwb by directly limiting transpiration during SON. In the Congo Basin, low average SIF values retrieved during both dry seasons even after normalizing for incident PAR imply that water availability could be limiting transpiration across all ecoregions (Figs. 4b and 5), warranting investigation of the terrestrial water dynamics of the basin.
As with other variables examined in this study, seasonal S dynamics at the basin scale are driven by the wet SON and dry JJA seasons experienced by the larger southern portion of the basin. Even though basin-wide P during MAM is significant, dS∕dt (which measures groundwater within the rooting zone as well as in deeper reserves) remains much lower than its SON levels and only seems to recharge S enough to compensate for the slightly negative dS∕dt values of January and February (Fig. 2), indicating that water reserves are largely saturated during MAM and undersaturated at the onset of SON when averaged across the basin (Fig. 4f). This hypothesis is consistent with prior soil moisture modeling efforts, which indicate that Congolese ecosystems south of the Equator (i.e., most of the basin's area) feature low soil moisture as SON rains begin before maintaining high soil moisture and deeper water reserves through the end of the MAM rainy season (Pokam et al., 2012; Guan et al., 2014). Terrestrial water reserves are well-known to modulate productivity and ET throughout the basin (Saeed et al., 2013; Guan et al., 2014; Ndehedehe et al., 2018; Cuthbert et al., 2019), so depleted S during September and October could limit transpiration even after the dry season ends. This hypothesis is also consistent with recent findings that variability in soil moisture and groundwater is much more influential than variability in rainfall with regard to productivity anomalies within the Congo Basin (Madani et al., 2020), making variations in plant-available soil moisture a plausible driver of the seasonal ETwb imbalance when combined with the light quality impacts on WUE outlined in the previous section.
4.2.5 Direct canopy and soil evaporation
The WUE hypotheses explored above largely focus on the seasonality of transpiration, but seasonal variability in direct evaporation from forest canopies and the soil system could also potentially influence the seasonal cycle of ETwb. As outlined above, Rn is lower in SON than during MAM (Fig. 4c), suggesting that there may simply be less energy driving direct evaporation of water from the land surface. As Rn and ETwb both peak in March and high water content in the soil surface layer is apparently sustained throughout the rainy seasons (Guan et al., 2014), the conditions seem appropriate to drive increased direct evaporation during MAM. However, the higher proportion of nighttime rains during these months (Philippon et al., 2016) make this scenario less plausible, as recent rainfall would have more time to drip from the canopy to the soil surface and percolate to deeper soil levels. Additionally, a recent study of several climate models within the Congo Basin determined that soil and canopy evaporation rates are likely similar between the two wet seasons, and that the ETwb seasonal imbalance is more likely due to increased transpiration during MAM (Crowhurst et al., 2020). More research is required to definitively characterize the role of direct evaporation in the seasonality of ET, but given the dominance of transpiration as the primary component of ET within the Congo Basin (Lian et al., 2018) and the conclusions of Crowhurst et al. (2020), we find it unlikely to be the main driver of ETwb's MAM peak.
Taken together, the analyses above suggest that the timing of peak ET rates in MAM rather than SON is primarily due to a combination of greater moisture availability and higher Rn during MAM, as well as the higher fraction of diffuse radiation during that season. The decoupled seasonal peaks of ETwb and photosynthetic productivity also indicate that seasonal variations in WUE occur across the Congo Basin.
4.3 Comparison to global ET products
The seven global ET models evaluated generally do not capture the degrees of seasonal and interannual variability displayed by ETwb (Fig. 3 and Table 3). Global ET product annual averages all fall within 10 % of ETwb's, consistent with Weerasinghe et al.'s (2020) finding that global ET products can accurately capture the magnitude of long-term ET in the Congo Basin. Yet all seven ET products have less temporal variability than ETwb, ranging from only ∼40 % of ETwb's variability (FLUXNET-MTE) to at most 80 % of it (MERRA2). These metrics reflect not only the lack of seasonal variability in these models (Fig. 3) but also the fact that global ET models tend to repeat the same seasonal ET cycle every year with only minor variations. Although some products feature relatively accurate seasonal cycles, ETwb makes significant departures from its mean seasonal cycle in any given year (Fig. 1) that are not reflected in the seven ET products evaluated here.
Broadly speaking, FLUXCOM and GLDAS-Noah appear to lead global ET products in reproducing ETwb at monthly timescales – they feature the highest Taylor scores and Pearson coefficients and also exhibit relatively large seasonal amplitudes (Table 3). However, both of these products still have significantly lower temporal standard deviations than ETwb does and also display the largest overall biases from 2003 to 2011. After FLUXCOM and GLDAS-Noah, two primarily remote-sensing-based products (MOD16A2 and GLEAM) achieve relatively high Taylor scores and Pearson coefficients, supporting previous reports that they approximate actual ET fairly well in tropical Africa (Schüttemeyer et al., 2007; Opoku-Duah et al., 2008; Andam-Akorful et al., 2015; Liu et al., 2016). Weerasinghe et al. (2020) found that FLUXNET-MTE and SSEBop exhibit very low long-term biases over the Congo Basin, but their low Taylor skill scores and standard deviations suggest a significant underestimation of month-to-month ET variability. Finally, ET from MERRA2 was found to possess the greatest temporal variability over the basin and, as a result, tied with FLUXCOM and GLDAS-Noah for the highest Taylor score; however, MERRA2 also produced the worst correlation coefficient and highest RMSE out of the seven global products.
Our results show some disagreements with the previous model comparison efforts of Liu et al. (2016). As part of a global water-balance-based assessment of ET products, Liu et al. (2016) also compare ETwb (estimated using a different approach; see below) to ET from GLEAM, FLUXNET-MTE, GLDAS-Noah, and MERRA in the Congo Basin. However, in our calculation, the Taylor skill score of GLDAS-Noah appears to far outperform its value in Liu et al. (2016); FLUXNET-MTE and MERRA2 both show modest improvements in their Taylor scores, and only GLEAM falls into its previously assigned score bin. These discrepancies were likely caused by (a) the different study period used by Liu et al. (2016), which necessitated an extrapolation of GRACE data prior to 2002; (b) the exclusive use of the GPCC Version 6 product to constrain P in their water balance models; and (c) the use of different versions of the four datasets common to both Liu et al. (2016) and the present study. Nonetheless, comparison of these Taylor scores indicates that the most recent generation of ET products generally improved upon the previous generation: FLUXCOM outperforms its predecessor, FLUXNET-MTE; GLDAS-Noah Version 2.1 outperforms GLDAS-Noah Version 2.0; and MERRA Version 2 improves upon MERRA Version 1's skill score.
4.4 Effects of long-term climatic shifts on ET
From 2002 to 2016, no significant trend is detectable in the deseasonalized ETwb data nor in any of the other water balance component fluxes (Fig. 6). The lack of significant trends in water balance components over the 15-year study period is surprising given the numerous reports of declining precipitation in the Congo Basin, both in magnitude (Asefi-Najafabady and Saatchi, 2013; Diem et al., 2014; Zhou et al., 2014; Hua et al., 2016; Dezfuli, 2017) and in wet-season duration (Jiang et al., 2019). However, the absence of a trend in PTC does not prove the absence of a longer-term drying trend that began in the 20th century – rather, it probably results from our study period, which is shorter and generally more recent than those of the aforementioned studies; from our analysis of rainfall over all seasons rather than during certain 3-month windows; and from the fact that rainfall declines mainly affect the northern portion of the basin (Zhou et al., 2014; Hua et al., 2016), whereas our study is dominated by the basin area south of the Equator (Fig. S2). Indeed, careful examination of long-term precipitation records from the literature reveals marked declines in rainfall during the 1990s and early 2000s that did not continue significantly into our 2002–2016 study period (Diem et al., 2014; Dezfuli, 2017; Hua et al., 2019). The lack of an interannual ETwb trend is consistent with the recent findings of Weerasinghe et al. (2020).
The lack of long-term trends in ETwb and EVI is intriguing given the changes detectable in the other environmental variables (Figs. 7 and S7): PARdiff, PARdir, Rn, and VPD all increase significantly from 2002 to 2016, meaning the Congo Basin has become sunnier and less humid in recent years. While these findings should be viewed with caution because meteorological data are quite sparse in the basin during the 15-year study period, the increasing VPD and irradiance trends are consistent with long-term projections over the 21st century in CMIP5 models (Yuan et al., 2019; Zou et al., 2019). Sunnier and less humid conditions caused by increasing PAR, Rn, and VPD would typically lead to lower WUE in plants, which would in turn lead to increased ET and/or decreased EVI. Given the seasonal dependence of productivity and transpiration on irradiance levels (see Sect. 4.2.3), the apparent lack of a corresponding long-term relationship suggests that some mechanism may be counteracting the biological impacts of rising irradiance and VPD.
Carbon fertilization offers one possible explanation for the lack of ETwb and EVI trends. Rising VPD can indeed reduce the WUE of vegetation, but conversely, rising atmospheric CO2 levels can increase WUE in tropical forests by catalyzing stomatal closure (De Kauwe et al., 2013; Keenan et al., 2013; Van Der Sleen et al., 2015). Ukkola and Prentice's (2013) vegetation dynamics simulations yield a sizable decrease in stomatal conductance between 1960 and 2000 in the Congo Basin, consistent with altered stomatal behavior from CO2 fertilization and increasing VPD. Increasing PAR levels also could have helped support forest productivity rates as stomatal conductance declined, although the PAR data in Fig. S7 suggest a continual decrease in diffuse PAR fraction that could adversely affect the WUE and LUE of Congolese forests (Kanniah et al., 2013). In summary, even as VPD and irradiance have increased and driven up evaporative demand in plant stomata, the rising concentration of atmospheric CO2 may have allowed the Congo's forests to lower stomatal conductance without significantly impacting growth or ET (Peñuelas et al., 2011; Van Der Sleen et al., 2015). But the effects of present and future carbon fertilization on WUE remain highly uncertain (Guerrieri et al., 2019), and a recent study of herbarium samples from Congolese evergreen forest trees found that while stomatal density has decreased from 1938 to 2013, inherent WUE has paradoxically decreased over the same period (Bauters et al., 2020). While the results of Bauters et al. (2020) pertain to a much longer time period and smaller spatial extent than our study and are thus difficult to compare here, they hint at the complexity of photosynthetic responses to environmental factors like VPD, CO2 fertilization, temperature, and water availability and suggest that Congolese forests may feature unique ecophysiological functions that warrant further study. Ultimately, even if ET did not show any statistically significant trends during our 2002–2016 study period as a result of CO2 fertilization, future ET rates could nevertheless start to change if the compensation between decreasing radiation quality and rising VPD on the one hand and increasing CO2 on the other hand become imbalanced or if long-term declines in precipitation continue.
4.5 Opportunities for further study
This study demonstrates the value in combining in situ observations with remote sensing in data-sparse regions like the Congo Basin. However, there are clear limitations to the water balance approach employed here that suggest several opportunities for further study of the region. For instance, applying the inverted-water-balance model at the basin scale masks differences in the magnitude and variability of ET across the diverse regions of the Congo Basin, but the availability of river discharge data from tributaries of the Congo River could allow for modeling of ET at the subbasin scale (Alsdorf et al., 2016). Similarly, the monthly temporal resolution of the GRACE data prevents examination of diurnal and submonthly variations in ET. While GRACE data also represent a relatively short time span, the GRACE Follow-On (GRACE-FO) mission promises to extend the global S dataset well into the future. Ultimately, improved in situ observations of hydrologic and climatic fluxes are necessary to understand the ecohydrology of central Africa in greater detail and at finer scales – eddy covariance towers, weather stations, and long-term phenological surveys would all be of great benefit to the growing field of research on the Congo Basin.
This study leverages several remotely sensed and gauge-based precipitation datasets, river gauge data, and terrestrial-water-storage anomalies from GRACE to produce ET estimates for the Congo Basin in central Africa at the monthly timescale. This technique has been successfully applied to the Amazon Basin in recent years, but to the authors' knowledge it has not yet been used in the Congo Basin except as part of global-scale reviews of major river basins. The Congo Basin is greatly understudied despite its importance as one of the world's largest river basins and one of three major humid tropical forest regions, and quantification of basin-wide ET and its variability is imperative for understanding the basin's climatic influence as well as its susceptibility to environmental disturbances. We find annual ETwb to equal 117.2±3.5 cm yr−1, on average, from 2003 to 2015 – well in line with many historical estimates of basin-wide ET.
Triple collocation was applied to determine the accuracy of P products over the sparsely gauged Congo Basin, finding that the recently developed NIC131-gridded dataset is the most accurate over our study period (RMSE of 0.65 cm per month). NIC131-gridded is followed by CHIRPS2 in terms of accuracy (RMSE of 0.93 cm per month), while three separate products that incorporate GPCC rain gauge data feature similar variability and RMSEs (1.60 to 1.67 cm per month). RMSEs from TC were also used to create a unified PTC time series with a mean annual precipitation of 150.4±2.6 cm yr−1. A suite of global ET products is also evaluated versus ETwb, with FLUXCOM and GLDAS-Noah Version 2.1 displaying the closest agreement with the variability of ETwb from 2003 to 2011 and SSEBop most closely reproducing long-term mean ET. However, all ET models underestimated the seasonal and interannual variability of ETwb.
In good agreement with existing literature, rainfall appears to exert a primary control on ET, but other environmental drivers appear to modulate ET and cause unexpected seasonal features, such as the MAM peak in ET recently explored by Crowhurst et al. (2020). Several possible causes for this MAM ET peak were investigated, but neither VPD, temperature, phenology, nor leaf age seasonalities could explain this MAM peak. Instead, the amount and quality of radiative energy and the availability of water in the terrestrial system appear to offer the most plausible explanations for the seasonal imbalance in peak ETwb – higher diffuse PAR fractions and lower Rn during SON allow for higher WUE, while depleted terrestrial water stores limit the amount of water available for transpiration. On interannual timescales, VPD, Rn, and both direct and diffuse PAR increased from 2002 to 2016, while no trend was detectable in EVI and ETwb, implying the rising concentration of atmospheric CO2 may have compensated for the increasingly dry conditions facing the Congo Basin's forests. However, these effects may not remain balanced in a future of higher CO2 levels, increased VPD and temperatures, and spreading deforestation within the basin.
We provide our monthly basin-wide P, ETwb, dS∕dt, discharge, and other data online at https://doi.org/10.17605/OSF.IO/JPVMB (Burnett et al., 2020). Most of the original data products used in this study are freely available to the public: the HydroSHEDS basin boundary shapefile can be retrieved from https://hydrosheds.org/page/hydrobasins (last access: 15 January 2018) (Lehner and Grill, 2013). PERSIANN-CDR data were accessed at https://doi.org/10.7289/V51V5BWQ (Sorooshian et al., 2014), and CHIRPS2 data were downloaded from https://www.chc.ucsb.edu/data (last access: 25 July 2018) (Funk et al., 2015b). The GPCC dataset was accessed at https://doi.org/10.5676/DWD_GPCC/FD_M_V7_250 (Schneider et al., 2015). GRACE data were retrieved from NASA's Physical Oceanography DAAC at https://doi.org/10.5067/TELND-NC005 (Swenson, 2012), and Congo River discharge data were downloaded from HYBAM at http://www.ore-hybam.org (last access: 15 January 2018) (SO-HYBAM, 2015). FLUXNET-MTE and FLUXCOM were made available by the Max Planck Institute for Biogeochemistry; FLUXCOM may be accessed at http://fluxcom.org (last access: 5 March 2019) (Jung et al., 2018). GLEAM data were accessed at http://gleam.eu (last access: 2 July 2020) (Martens et al., 2019). SSEBop can be found at https://earlywarning.usgs.gov/fews/product/460 (last access: 2 July 2020) (Senay et al., 2017). TRMM, MERRA2, and GLDAS-Noah data were provided by NASA GES DISC at https://disc.gsfc.nasa.gov/ (last access: 4 February 2018) (Huffman et al., 2007b; Gelaro et al., 2017b; Rodell et al., 2004c). CERES data were downloaded from https://ceres.larc.nasa.gov/order_data.php (last access: 25 Juy 2018) (Loeb, 2017; Doelling, 2017). ERA-Interim data were retrieved from the ECMWF at https://www.ecmwf.int/en/forecasts/datasets (last access: 19 March 2019) (Dee et al., 2011b). MOD16A2 and MCD12C1 data were downloaded from the USGS website at https://lpdaac.usgs.gov/products/mod16a2v006/ (Running et al., 2017) and https://lpdaac.usgs.gov/products/mcd12c1v006/ (last access: 7 May 2019) (Friedl and Sulla-Menashe, 2015), respectively, and AIRS data were downloaded from NASA's Giovanni web interface at https://giovanni.gsfc.nasa.gov/giovanni/ (last access: 21 August 2019) (Acker and Leptoukh, 2007). ASOS and MIDAS weather data were sourced from the UK Met Office's CEDA website at http://catalogue.ceda.ac.uk/uuid/220a65615218d5c9cc9e4785a3234bd0 (last access: 19 March 2019) (Met Office, 2012) and from Iowa State University's Iowa Environmental Mesonet site at https://mesonet.agron.iastate.edu/ASOS/ (last access: 19 March 2019) (Arritt and Herzmann, 2001).
The supplement related to this article is available online at: https://doi.org/10.5194/hess-24-4189-2020-supplement.
AGK and MWB designed the study. MWB and GRQ retrieved the data. All authors analyzed the data. MWB prepared the paper with the assistance of AGK and GRQ.
The authors declare that they have no conflict of interest.
We gratefully acknowledge the researchers who provided their datasets and expertise for this study: Alexei Lyapustin and Yujie Wang of NASA provided the MAIAC EVI data; Sharon Nicholson and Douglas Klotter of Florida State University provided their NIC131-gridded dataset; and Joanna Joiner of NASA provided the GOME-2 SIF data. Christian Frankenberg of the California Institute of Technology graciously provided additional SIF data for comparison. We further thank two anonymous reviewers for helping us substantially improve this article.
This research has been supported by the National Oceanic and Atmospheric Administration (grant no. NA17OAR4310127), the National Aeronautics and Space Administration (grant nos. 80NSSC18K0715 and 16-CARBON16-0130), and a Vice Provost for Undergraduate Education (VPUE) grant from Stanford University.
This paper was edited by Ryan Teuling and reviewed by two anonymous referees.
Acker, J. G. and Leptoukh, G.: GIOVANNI, NASA Goddard Earth Sciences Data and Information Services Center (GES-DISC), available at: https://giovanni.gsfc.nasa.gov/giovanni/ (last access: 21 August 2019), 2007.
Alemohammad, S. H., McColl, K. A., Konings, A. G., Entekhabi, D., and Stoffelen, A.: Characterization of precipitation product errors across the United States using multiplicative triple collocation, Hydrol. Earth Syst. Sci., 19, 3489–3503, https://doi.org/10.5194/hess-19-3489-2015, 2015.
Alemohammad, S. H., Fang, B., Konings, A. G., Aires, F., Green, J. K., Kolassa, J., Miralles, D., Prigent, C., and Gentine, P.: Water, Energy, and Carbon with Artificial Neural Networks (WECANN): a statistically based estimate of global surface turbulent fluxes and gross primary productivity using solar-induced fluorescence, Biogeosciences, 14, 4101–4124, https://doi.org/10.5194/bg-14-4101-2017, 2017.
Alsdorf, D., Beighley, E., Laraque, A., Lee, H., Tshimanga, R., O'Loughlin, F., Mahé, G., Dinga, B., Moukandi, G., and Spencer, R. G. M.: Opportunities for hydrologic research in the Congo Basin, Rev. Geophys., 54, 378–409, https://doi.org/10.1002/2016RG000517, 2016.
Alton, P. B., North, P. R., and Los, S. O.: The impact of diffuse sunlight on canopy light-use efficiency, gross photosynthetic product and net ecosystem exchange in three forest biomes, Global Change Biol., 13, 776–787, https://doi.org/10.1111/j.1365-2486.2007.01316.x, 2007.
Andam-Akorful, S. A., Ferreira, V. G., Awange, J. L., Forootan, E., and He, X. F.: Multi-model and multi-sensor estimations of evapotranspiration over the Volta Basin, West Africa, Int. J. Climatol., 35, 3132–3145, https://doi.org/10.1002/joc.4198, 2015.
Arritt, R. and Herzmann, D.: Iowa Environmental Mesonet – Automated Surface Observing System (ASOS) Network, Iowa State University, available at: https://mesonet.agron.iastate.edu/ASOS/ (last access: 19 March 2019), 2001.
Asefi-Najafabady, S. and Saatchi, S.: Response of African humid tropical forests to recent rainfall anomalies., Philos. T. Roy. Soc. B, 368, 20120306, https://doi.org/10.1098/rstb.2012.0306, 2013.
Ashouri, H., Hsu, K. L., Sorooshian, S., Braithwaite, D. K., Knapp, K. R., Cecil, L. D., Nelson, B. R., and Prat, O. P.: PERSIANN-CDR: Daily precipitation climate data record from multisatellite observations for hydrological and climate studies, B. Am. Meteorol. Soc., 96, 69–83, https://doi.org/10.1175/BAMS-D-13-00068.1, 2015.
Awange, J. L., Ferreira, V. G., Forootan, E., Khandu, Andam-Akorful, S. A., Agutu, N. O., and He, X. F.: Uncertainties in remotely sensed precipitation data over Africa, Int. J. Climatol., 36, 303–323, https://doi.org/10.1002/joc.4346, 2016.
Baldocchi, D., Wilson, K., Valentini, R., Law, B., Munger, W., Davis, K., Wofsy, S., Pilegaard, K., Goldstein, A., Falge, E., Vesala, T., Hollinger, D., Running, S., Fuentes, J., Katul, G., Gu, L., Verma, S., Paw, K. T., Malhi, Y., Anthoni, P., Oechel, W., Schmid, H. P., Bernhofer, C., Meyers, T., Evans, R., Olson, R., and Lee, X.: FLUXNET: A New Tool to Study the Temporal and Spatial Variability of Ecosystem–Scale Carbon Dioxide, Water Vapor, and Energy Flux Densities, B. Am. Meteorol. Soc., 82, 2415–2434, https://doi.org/10.1175/1520-0477(2001)082<2415:FANTTS>2.3.CO;2, 2001.
Balek, J. (Ed.): Hydrology and Water Resources in Tropical Africa, in: Dev. Water Res., 8, Elsevier, New York, 1977.
Balek, J. (Ed.): Hydrology and Water Resources in Tropical Regions, in: Dev. Water Res., 18, Elsevier, New York, 1983.
Batra, N., Yang, Y.-C. E., Choi, H. I., Kumar, P., Cai, X., and De Fraiture, C.: Understanding Hydrological Cycle Dynamics Due to Changing Land Use and Land Cover: Congo Basin Case Study, in: IEEE International Geoscience and Remote Sensing Symposium 2008 (IGARSS 2008), 7–11 July 2008, Boston, 491–494, https://doi.org/10.1109/IGARSS.2008.4780136, 2008.
Bauters, M., Meeus, S., Barthel, M., Stoffelen, P., De Deurwaerder, H. P. T., Meunier, F., Drake, T. W., Ponette, Q., Ebuy, J., Vermeir, P., Beeckman, H., Wyffels, F., Bodé, S., Verbeeck, H., Vandelook, F., and Boeckx, P.: Century-long apparent decrease in intrinsic water-use efficiency with no evidence of progressive nutrient limitation in African tropical forests, Global Change Biol., 26, 4449–4461, https://doi.org/10.1111/gcb.15145, 2020.
Beighley, R. E., Ray, R. L., He, Y., Lee, H., Schaller, L., Andreadis, K. M., Durand, M., Alsdorf, D. E., and Shum, C. K.: Comparing satellite derived precipitation datasets using the Hillslope River Routing (HRR) model in the Congo River Basin, Hydrol. Process., 25, 3216–3229, https://doi.org/10.1002/hyp.8045, 2011.
Bell, J. P., Tompkins, A. M., Bouka-Biona, C., and Sanda, I. S.: A process-based investigation into the impact of the Congo basin deforestation on surface climate, J. Geophys. Res.-Atmos., 120, 5721–5739, https://doi.org/10.1002/2014JD022586, 2015.
Betbeder, J., Gond, V., Frappart, F., Baghdadi, N. N., Briant, G., and Bartholome, E.: Mapping of Central Africa Forested Wetlands Using Remote Sensing, IEEE J. Select. Top. Appl. Earth Obs. Remote Sens., 7, 531–542, https://doi.org/10.1109/JSTARS.2013.2269733, 2014.
Bi, J., Myneni, R., Lyapustin, A., Wang, Y., Park, T., Chi, C., Yan, K., and Knyazikhin, Y.: Amazon forests' response to droughts: A perspective from the MAIAC product, Remote Sens., 8, 356, https://doi.org/10.3390/rs8040356, 2016.
Brands, S., Herrera, S., Fernández, J., and Gutiérrez, J. M.: How well do CMIP5 Earth System Models simulate present climate conditions in Europe and Africa?, Clim. Dynam., 41, 803–817, https://doi.org/10.1007/s00382-013-1742-8, 2013.
Bricquet, J.-P.: Transports en solution et en suspension par le bassin du fleuve Congo, in: Quatriemes Journees Hydrologiques de l'ORSTOM a Montpellier, ORSTOM, Montpellier, 131–161, 1988.
Bultot, F.: Atlas Climatique du Bassin Congolais, Deuxieme Partie: Les Composantes du Bilan d'Eau, I.N.E.A.C. – L'Institut National pour L'Etude Agronomique du Congo, Brussels, 1971.
Burnett, M. W., Quetin, G. R., and Konings, A. G.: Congo Basin Evapotranspiration (ET), Open Science Framework (OSF), https://doi.org/10.17605/OSF.IO/JPVMB, 2020.
Bush, E. R.: Tropical phenology in a time of change, PhD thesis, Faculty of Natural Sciences, University of Stirling, Stirling, UK, 286 pp., 2018.
Bush, E. R., Jeffery, K., Bunnefeld, N., Tutin, C., Musgrave, R., Moussavou, G., Mihindou, V., Malhi, Y., Lehmann, D., Ndong, J. E., Makaga, L., and Abernethy, K.: Rare ground data confirm significant warming and drying in western equatorial Africa, Peer J., 8, e8732, https://doi.org/10.7717/peerj.8732, 2020.
Camberlin, P., Barraud, G., Bigot, S., Dewitte, O., Makanzu Imwangana, F., Maki Mateso, J. C., Martiny, N., Monsieurs, E., Moron, V., Pellarin, T., Philippon, N., Sahani, M., and Samba, G.: Evaluation of remotely sensed rainfall products over Central Africa, Q. J. Roy. Meteorol. Soc., 145, 2115–2138, https://doi.org/10.1002/qj.3547, 2019.
Chishugi, J. B. and Alemaw, B. F.: The Hydrology of the Congo River Basin: A GIS-based Hydrological Water Balance Model, in: Proceedings of the 2009 World Environmental and Water Resources Congress: Great Rivers, 17–21 May 2009, Kansas City, MO, 5864–5879, 2009.
Collins, J. M.: Temperature variability over Africa, J. Climate, 24, 3649–3666, https://doi.org/10.1175/2011JCLI3753.1, 2011.
Couralet, C., Van Den Bulcke, J., Ngoma, L. M., Van Acker, J., and Beeckman, H.: Phenology in functional groups of Central African rainforest trees, J. Trop. Forest Sci., 25, 361–374, 2013.
Crowhurst, D. M., Dadson, S. J., and Washington, R.: Evaluation of Evaporation Climatology for the Congo Basin Wet Seasons in Eleven Global Climate Models, J. Geophys. Res.-Atmos., 125, e2019JD030619, https://doi.org/10.1029/2019jd030619, 2020.
Crowley, J. W., Mitrovica, J. X., Bailey, R. C., Tamisiea, M. E., and Davis, J. L.: Land water storage within the Congo Basin inferred from GRACE satellite gravity data, Geophys. Res. Lett., 33, L19402, https://doi.org/10.1029/2006GL027070, 2006.
Cuthbert, M. O., Gleeson, T., Moosdorf, N., Befus, K. M., Schneider, A., Hartmann, J., and Lehner, B.: Global patterns and dynamics of climate–groundwater interactions, Nat. Clim. Change, 9, 137–141, https://doi.org/10.1038/s41558-018-0386-4, 2019.
Dee, D. P., Uppala, S. M., Simmons, A. J., Berrisford, P., Poli, P., Kobayashi, S., Andrae, U., Balmaseda, M. A., Balsamo, G., Bauer, P., Bechtold, P., Beljaars, A. C. M., van de Berg, L., Bidlot, J., Bormann, N., Delsol, C., Dragani, R., Fuentes, M., Geer, A. J., Haimberger, L., Healy, S. B., Hersbach, H., Hólm, E. V., Isaksen, L., Kållberg, P., Köhler, M., Matricardi, M., Mcnally, A. P., Monge-Sanz, B. M., Morcrette, J. J., Park, B. K., Peubey, C., de Rosnay, P., Tavolato, C., Thépaut, J. N., and Vitart, F.: The ERA-Interim reanalysis: Configuration and performance of the data assimilation system, Q. J. Roy. Meteorol. Soc., 137, 553–597, https://doi.org/10.1002/qj.828, 2011a.
Dee, D. P., Uppala, S. M., Simmons, A. J., Berrisford, P., Poli, P., Kobayashi, S., Andrae, U., Balmaseda, M. A., Balsamo, G., Bauer, P., Bechtold, P., Beljaars, A. C. M., van de Berg, L., Bidlot, J., Bormann, N., Delsol, C., Dragani, R., Fuentes, M., Geer, A. J., Haimberger, L., Healy, S. B., Hersbach, H., Hólm, E. V., Isaksen, L., Kållberg, P., Köhler, M., Matricardi, M., Mcnally, A. P., Monge-Sanz, B. M., Morcrette, J. J., Park, B. K., Peubey, C., de Rosnay, P., Tavolato, C., Thépaut, J. N., and Vitart, F.: ERA-Interim Daily Reanalysis Data, European Centre for Medium-Range Weather Forecasts (ECMWF), available at: https://www.ecmwf.int/en/forecasts/datasets (last access: 19 March 2019), 2011b.
De Kauwe, M. G., Medlyn, B. E., Zaehle, S., Walker, A. P., Dietze, M. C., Hickler, T., Jain, A. K., Luo, Y., Parton, W. J., Prentice, I. C., Smith, B., Thornton, P. E., Wang, S., Wang, Y. P., Wårlind, D., Weng, E., Crous, K. Y., Ellsworth, D. S., Hanson, P. J., Seok Kim, H., Warren, J. M., Oren, R., and Norby, R. J.: Forest water use and water use efficiency at elevated CO2: A model-data intercomparison at two contrasting temperate forest FACE sites, Global Change Biol., 19, 1759–1779, https://doi.org/10.1111/gcb.12164, 2013.
Dembélé, M. and Zwart, S. J.: Evaluation and comparison of satellite-based rainfall products in Burkina Faso, West Africa, Int. J. Remote Sens., 37, 3995–4014, https://doi.org/10.1080/01431161.2016.1207258, 2016.
Dezfuli, A.: Climate of Western and Central Equatorial Africa, in: Oxford Research Encyclopedia of Climate Science, Oxford University Press, Oxford, https://doi.org/10.1093/acrefore/9780190228620.013.511, 2017.
Diem, J. E., Ryan, S. J., Hartter, J., and Palace, M. W.: Satellite-based rainfall data reveal a recent drying trend in central equatorial Africa, Climatic Change, 126, 263–272, https://doi.org/10.1007/s10584-014-1217-x, 2014.
Doelling, D.: CERES SYN1DEG-MONTH HDF4 file – Edition 4A, NASA Langley Atmospheric Science Data Center DAAC, https://doi.org/10.5067/TERRA+AQUA/CERES/SYN1DEGMONTH_L3.004A, 2017.
Dong, J., Lei, F., and Wei, L.: Triple collocation based multi-source precipitation merging, Front. Water, 2, 1, https://doi.org/10.3389/frwa.2020.00001, 2020.
Dyer, E. L. E., Jones, D. B. A., Nusbaumer, J., Li, H., Collins, O., Vettoretti, G., and Noone, D.: Congo Basin precipitation: Assessing seasonality, regional interactions, and sources of moisture, J. Geophys. Res.-Atmos., 122, 6882–6898, https://doi.org/10.1002/2016JD026240, 2017.
Fisher, R. A., Williams, M., Do Vale, R. L., Da Costa, A. L., and Meir, P.: Evidence from Amazonian forests is consistent with isohydric control of leaf water potential, Plant Cell Environ., 29, 151–165, https://doi.org/10.1111/j.1365-3040.2005.01407.x, 2006.
Friedl, M. and Sulla-Menashe, D.: MCD12C1 MODIS/Terra + Aqua Land Cover Type Yearly L3 Global 0.05Deg CMG V006, NASA Land Processes DAAC, https://doi.org/10.5067/MODIS/MCD12C1.006, 2015.
Funk, C., Peterson, P., Landsfeld, M., Pedreros, D., Verdin, J., Shukla, S., Husak, G., Rowland, J., Harrison, L., Hoell, A., and Michaelsen, J.: The climate hazards infrared precipitation with stations – a new environmental record for monitoring extremes, Sci. Data, 2, 150066, https://doi.org/10.1038/sdata.2015.66, 2015a.
Funk, C. C., Peterson, P. J., Landsfeld, M. F., Pedreros, D. H., Verdin, J. P., Rowland, J. D., Romero, B. E., Husak, G. J., Michaelsen, J. C., and Verdin, A. P.: Climate Hazards Center InfraRed Precipitation with Station data (CHIRPS) Version 2, University of California, Santa Barbara Climate Hazards Center, available at: https://www.chc.ucsb.edu/data/ (last access: 25 July 2018), 2015b.
Gelaro, R., McCarty, W., Suárez, M. J., Todling, R., Molod, A., Takacs, L., Randles, C. A., Darmenov, A., Bosilovich, M. G., Reichle, R., Wargan, K., Coy, L., Cullather, R., Draper, C., Akella, S., Buchard, V., Conaty, A., da Silva, A. M., Gu, W., Kim, G. K., Koster, R., Lucchesi, R., Merkova, D., Nielsen, J. E., Partyka, G., Pawson, S., Putman, W., Rienecker, M., Schubert, S. D., Sienkiewicz, M., and Zhao, B.: The modern-era retrospective analysis for research and applications, version 2 (MERRA-2), J. Climate, 30, 5419–5454, https://doi.org/10.1175/JCLI-D-16-0758.1, 2017a.
Gelaro, R., McCarty, W., Suárez, M. J., Todling, R., Molod, A., Takacs, L., Randles, C. A., Darmenov, A., Bosilovich, M. G., Reichle, R., Wargan, K., Coy, L., Cullather, R., Draper, C., Akella, S., Buchard, V., Conaty, A., da Silva, A. M., Gu, W., Kim, G. K., Koster, R., Lucchesi, R., Merkova, D., Nielsen, J. E., Partyka, G., Pawson, S., Putman, W., Rienecker, M., Schubert, S. D., Sienkiewicz, M., and Zhao, B.: MERRA Version 2, NASA Goddard Earth Sciences Data and Information Services Center (GES-DISC), available at: https://disc.gsfc.nasa.gov/ (last access: 9 May 2018), 2017b.
Guan, K., Wolf, A., Medvigy, D., Caylor, K. K., Pan, M., and Wood, E. F.: Seasonal coupling of canopy structure and function in African tropical forests and its environmental controls, Ecosphere, 4, 35, https://doi.org/10.1890/ES12-00232.1, 2013.
Guan, K., Wood, E. F., Medvigy, D., Kimball, J., Pan, M., Caylor, K. K., Sheffield, J., Xu, X., and Jones, M. O.: Terrestrial hydrological controls on land surface phenology of African savannas and woodlands, J. Geophys. Res.-Biogeo., 119, 1652–1669, https://doi.org/10.1002/2013JG002572, 2014.
Guan, K., Pan, M., Li, H., Wolf, A., Wu, J., Medvigy, D., Caylor, K. K., Sheffield, J., Wood, E. F., Malhi, Y., Liang, M., Kimball, J. S., Saleska, S. R., Berry, J., Joiner, J., and Lyapustin, A. I.: Photosynthetic seasonality of global tropical forests constrained by hydroclimate, Nat. Geosci., 8, 284–289, https://doi.org/10.1038/ngeo2382, 2015.
Guerrieri, R., Belmecheri, S., Ollinger, S. V., Asbjornsen, H., Jennings, K., Xiao, J., Stocker, B. D., Martin, M., Hollinger, D. Y., Bracho-Garrillo, R., Clark, K., Dore, S., Kolb, T., William Munger, J., Novick, K., and Richardson, A. D.: Disentangling the role of photosynthesis and stomatal conductance on rising forest water-use efficiency, P. Natl. Acad. Sci. USA, 116, 16909–16914, https://doi.org/10.1073/pnas.1905912116, 2019.
Hassan, A. and Jin, S.: Water storage changes and balances in Africa observed by GRACE and hydrologic models, Geod. Geodyn., 7, 39–49, https://doi.org/10.1016/j.geog.2016.03.002, 2016.
Hilker, T., Lyapustin, A. I., Tucker, C. J., Sellers, P. J., Hall, F. G., and Wang, Y.: Remote sensing of tropical ecosystems: Atmospheric correction and cloud masking matter, Remote Sens. Environ., 127, 370–384, https://doi.org/10.1016/j.rse.2012.08.035, 2012.
Hua, W., Zhou, L., Chen, H., Nicholson, S. E., Raghavendra, A., and Jiang, Y.: Possible causes of the Central Equatorial African long-term drought, Environ. Res. Lett., 11, 124002, https://doi.org/10.1088/1748-9326/11/12/124002, 2016.
Hua, W., Zhou, L., Nicholson, S. E., Chen, H., and Qin, M.: Assessing reanalysis data for understanding rainfall climatology and variability over Central Equatorial Africa, Clim. Dynam., 53, 651–669, https://doi.org/10.1007/s00382-018-04604-0, 2019.
Huffman, G. J., Bolvin, D. T., Nelkin, E. J., Wolff, D. B., Adler, R. F., Gu, G., Hong, Y., Bowman, K. P., and Stocker, E. F.: The TRMM Multisatellite Precipitation Analysis (TMPA): Quasi-Global, Multiyear, Combined-Sensor Precipitation Estimates at Fine Scales, J. Hydrometeorol., 8, 38–55, https://doi.org/10.1175/JHM560.1, 2007a.
Huffman, G. J., Bolvin, D. T., Nelkin, E. J., Wolff, D. B., Adler, R. F., Gu, G., Hong, Y., Bowman, K. P., and Stocker, E. F.: TRMM 3B43 Version 7 Monthly Precipitation Rates, NASA Goddard Earth Sciences Data and Information Services Center (GES-DISC), available at: https://disc.gsfc.nasa.gov/ (last access: 4 February 2018), 2007b.
James, R. and Washington, R.: Changes in African temperature and precipitation associated with degrees of global warming, Climatic Change, 117, 859–872, https://doi.org/10.1007/s10584-012-0581-7, 2013.
Jiang, Y., Zhou, L., Tucker, C. J., Raghavendra, A., Hua, W., Liu, Y. Y., and Joiner, J.: Widespread increase of boreal summer dry season length over the Congo rainforest, Nat. Clim. Change, 9, 617–622, https://doi.org/10.1038/s41558-019-0512-y, 2019.
Joiner, J., Guanter, L., Lindstrot, R., Voigt, M., Vasilkov, A. P., Middleton, E. M., Huemmrich, K. F., Yoshida, Y., and Frankenberg, C.: Global monitoring of terrestrial chlorophyll fluorescence from moderate-spectral-resolution near-infrared satellite measurements: methodology, simulations, and application to GOME-2, Atmos. Meas. Tech., 6, 2803–2823, https://doi.org/10.5194/amt-6-2803-2013, 2013.
Jung, M., Reichstein, M., Margolis, H. A., Cescatti, A., Richardson, A. D., Arain, M. A., Arneth, A., Bernhofer, C., Bonal, D., Chen, J., Gianelle, D., Gobron, N., Kiely, G., Kutsch, W., Lasslop, G., Law, B. E., Lindroth, A., Merbold, L., Montagnani, L., Moors, E. J., Papale, D., Sottocornola, M., Vaccari, F., and Williams, C.: Global patterns of land-atmosphere fluxes of carbon dioxide, latent heat, and sensible heat derived from eddy covariance, satellite, and meteorological observations, J. Geophys. Res., 116, G00J07, https://doi.org/10.1029/2010JG001566, 2011.
Jung, M., Koirala, S., Weber, U., Ichii, K., Gans, F., Camps-Valls, G., Papale, D., Schwalm, C. R., Tramontana, G., and Reichstein, M.: FLUXCOM, Max Planck Institute for Biogeochemistry, available at: https://fluxcom.org (last access: 5 March 2019), 2018.
Jung, M., Koirala, S., Weber, U., Ichii, K., Gans, F., Camps-Valls, G., Papale, D., Schwalm, C., Tramontana, G., and Reichstein, M.: The FLUXCOM ensemble of global land-atmosphere energy fluxes, Sci. Data, 6, 74, https://doi.org/10.1038/s41597-019-0076-8, 2019.
Kahn, B. H., Irion, F. W., Dang, V. T., Manning, E. M., Nasiri, S. L., Naud, C. M., Blaisdell, J. M., Schreier, M. M., Yue, Q., Bowman, K. W., Fetzer, E. J., Hulley, G. C., Liou, K. N., Lubin, D., Ou, S. C., Susskind, J., Takano, Y., Tian, B., and Worden, J. R.: The atmospheric infrared sounder version 6 cloud products, Atmos. Chem. Phys., 14, 399–426, https://doi.org/10.5194/acp-14-399-2014, 2014.
Kanniah, K. D., Beringer, J., and Hutley, L.: Exploring the link between clouds, radiation, and canopy productivity of tropical savannas, Agr. Forest Meteorol., 182–183, 304–313, https://doi.org/10.1016/j.agrformet.2013.06.010, 2013.
Keenan, T. F., Hollinger, D. Y., Bohrer, G., Dragoni, D., Munger, J. W., Schmid, H. P., and Richardson, A. D.: Increase in forest water-use efficiency as atmospheric carbon dioxide concentrations rise, Nature, 499, 324–327, https://doi.org/10.1038/nature12291, 2013.
Konings, A. G. and Gentine, P.: Global variations in ecosystem-scale isohydricity, Global Change Biol., 23, 891–905, https://doi.org/10.1111/gcb.13389, 2017.
Konings, A. G., Yu, Y., Xu, L., Yang, Y., Schimel, D. S., and Saatchi, S. S.: Active microwave observations of diurnal and seasonal variations of canopy water content across the humid African tropical forests, Geophys. Res. Lett., 44, 2290–2299, https://doi.org/10.1002/2016GL072388, 2017.
Landerer, F. W. and Swenson, S. C.: Accuracy of scaled GRACE terrestrial water storage estimates, Water Resour. Res., 48, W04531, https://doi.org/10.1029/2011WR011453, 2012.
Landerer, F. W., Dickey, J. O., and Güntner, A.: Terrestrial water budget of the Eurasian pan-Arctic from GRACE satellite measurements during 2003–2009, J. Geophys. Res., 115, D23115, https://doi.org/10.1029/2010JD014584, 2010.
Laporte, N. T., Stabach, J. A., Grosch, R., Lin, T. S., and Goetz, S. J.: Expansion of industrial logging in Central Africa, Science, 316, 1451, https://doi.org/10.1126/science.1141057, 2007.
Lauer, W.: Climate and Weather, in: Tropical Rain Forest Ecosystems: Biogeographical and Ecological Studies, edited by: Lieth, H. and Werger, M. J. A., Elsevier, New York, 7–53, 1989.
Lee, H., Beighley, R. E., Alsdorf, D., Jung, H. C., Shum, C. K., Duan, J., Guo, J., Yamazaki, D., and Andreadis, K.: Characterization of terrestrial water dynamics in the Congo Basin using GRACE and satellite radar altimetry, Remote Sens. Environ., 115, 3530–3538, https://doi.org/10.1016/j.rse.2011.08.015, 2011.
Lehner, B. and Grill, G.: HydroBASINS Version 1.0, World Wildlife Foundation, available at: https://hydrosheds.org/page/hydrobasins (last access: 15 January 2018), 2013.
Lehner, B., Verdin, K., and Jarvis, A.: New global hydrography derived from spaceborne elevation data, Eos Trans. Am Gesphys. Union, 89, 93–95, https://doi.org/10.1029/2008EO100001, 2008.
Lian, X., Piao, S., Huntingford, C., Li, Y., Zeng, Z., Wang, X., Ciais, P., McVicar, T. R., Peng, S., Ottlé, C., Yang, H., Yang, Y., Zhang, Y., and Wang, T.: Partitioning global land evapotranspiration using CMIP5 models constrained by observations, Nat. Clim. Change, 8, 640–646, https://doi.org/10.1038/s41558-018-0207-9, 2018.
Liu, W., Wang, L., Zhou, J., Li, Y., Sun, F., Fu, G., Li, X., and Sang, Y. F.: A worldwide evaluation of basin-scale evapotranspiration estimates against the water balance method, J. Hydrol., 538, 82–95, https://doi.org/10.1016/j.jhydrol.2016.04.006, 2016.
Loeb, N.: CERES Level 3B EBAF-Surface Terra + Aqua netCDF file – Edition 4.0, NASA Langley Atmospheric Science Data Center DAAC, https://doi.org/10.5067/TERRA+AQUA/CERES/EBAF-SURFACE_L3B004.0, 2017.
Lorenz, C. and Kunstmann, H.: The hydrological cycle in three state-of-the-art reanalyses: intercomparison and performance analysis, J. Hydrometeorol., 13, 1397–1420, https://doi.org/10.1175/JHM-D-11-088.1, 2012.
Lyapustin, A., Martonchik, J., Wang, Y., Laszlo, I., and Korkin, S.: Multiangle implementation of atmospheric correction (MAIAC): 1. Radiative transfer basis and look-up tables, J. Geophys. Res., 116, D03210, https://doi.org/10.1029/2010JD014985, 2011a.
Lyapustin, A., Wang, Y., Laszlo, I., Kahn, R., Korkin, S., Remer, L., Levy, R., and Reid, J. S.: Multiangle implementation of atmospheric correction (MAIAC): 2. Aerosol algorithm, J. Geophys. Res., 116, D03211, https://doi.org/10.1029/2010JD014986, 2011b.
Lyapustin, A., Wang, Y., Korkin, S., and Huang, D.: MODIS Collection 6 MAIAC algorithm, Atmos. Meas. Tech., 11, 5741–5765, https://doi.org/10.5194/amt-11-5741-2018, 2018.
Lyapustin, A. I., Wang, Y., Laszlo, I., Hilker, T., Hall, F. G., Sellers, P. J., Tucker, C. J., and Korkin, S. V.: Multi-angle implementation of atmospheric correction for MODIS (MAIAC): 3. Atmospheric correction, Remote Sens. Environ., 127, 385–393, https://doi.org/10.1016/j.rse.2012.09.002, 2012.
Madani, N., Kimball, J. S., Jones, L. A., Parazoo, N. C., and Guan, K.: Global analysis of bioclimatic controls on ecosystem productivity using satellite observations of solar-induced chlorophyll fluorescence, Remote Sens., 9, 530, https://doi.org/10.3390/rs9060530, 2017.
Madani, N., Kimball, J. S., Parazoo, N. C., Ballantyne, A. P., Tagesson, T., Jones, L. A., Reichle, R. H., Palmer, P. I., Velicogna, I., Bloom, A. A., Saatchi, S., Liu, Z., and Geruo, A.: Below-surface water mediates the response of African forests to reduced rainfall, Environ. Res. Lett., 15, 034063, https://doi.org/10.1088/1748-9326/ab724a, 2020.
Maeda, E. E., Moura, Y. M., Wagner, F., Hilker, T., Lyapustin, A. I., Wang, Y., Chave, J., Mõttus, M., Aragão, L. E. O. C., and Shimabukuro, Y.: Consistency of vegetation index seasonality across the Amazon rainforest, Int. J. Appl. Earth Obs. Geoinf., 52, 42–53, https://doi.org/10.1016/j.jag.2016.05.005, 2016.
Maeda, E. E., Ma, X., Wagner, F. H., Kim, H., Oki, T., Eamus, D., and Huete, A.: Evapotranspiration seasonality across the Amazon Basin, Earth Syst. Dynam., 8, 439–454, https://doi.org/10.5194/esd-8-439-2017, 2017.
Marshall, M., Funk, C., and Michaelsen, J.: Examining evapotranspiration trends in Africa, Clim. Dynam., 38, 1849–1865, https://doi.org/10.1007/s00382-012-1299-y, 2012.
Martens, B., Miralles, D. G., Lievens, H., Van Der Schalie, R., De Jeu, R. A. M., Fernández-Prieto, D., Beck, H. E., Dorigo, W. A., and Verhoest, N. E. C.: GLEAM v3: Satellite-based land evaporation and root-zone soil moisture, Geosci. Model Dev., 10, 1903–1925, https://doi.org/10.5194/gmd-10-1903-2017, 2017.
Martens, B., Miralles, D. G., Lievens, H., van der Schalie, R., de Jeu, R. A. M., Fernández-Prieto, D., Beck, H. E., Dorigo, W. A., and Verhoest, N. E. C.: GLEAM v3.3a, Global Land Evaporation Amsterdam Model, available at: https://gleam.eu (last access: 2 July 2020), 2019.
Matsuyama, H., Oki, T., Shinoda, M., and Masuda, K.: The seasonal change of the water budget in the Congo River Basin, J. Meteorol. Soc. Jpn., 72, 281–299, 1994.
McColl, K. A., Vogelzang, J., Konings, A. G., Entekhabi, D., Piles, M., and Stoffelen, A.: Extended triple collocation: Estimating errors and correlation coefficients with respect to an unknown target, Geophys. Res. Lett., 41, 6229–6236, https://doi.org/10.1002/2014GL061322, 2014.
McCollum, J. R., Gruber, A., and Ba, M. B.: Discrepancy between gauges and satellite estimates of rainfall in equatorial Africa, J. Appl. Meteorol., 39, 666–679, https://doi.org/10.1175/1520-0450-39.5.666, 2000.
Mercado, L. M., Bellouin, N., Sitch, S., Boucher, O., Huntingford, C., Wild, M., and Cox, P. M.: Impact of changes in diffuse radiation on the global land carbon sink, Nature, 458, 1014–1017, https://doi.org/10.1038/nature07949, 2009.
Met Office: Met Office Integrated Data Archive System (MIDAS) Land and Marine Surface Station Data (1853–current), NCAS British Atmospheric Data Centre, available at: http://catalogue.ceda.ac.uk/uuid/220a65615218d5c9cc9e4785a3234bd0 (last access: 19 March 2019), 2012.
Miralles, D. G., Holmes, T. R. H., De Jeu, R. A. M., Gash, J. H., Meesters, A. G. C. A., and Dolman, A. J.: Global land-surface evaporation estimated from satellite-based observations, Hydrol. Earth Syst. Sci., 15, 453–469, https://doi.org/10.5194/hess-15-453-2011, 2011.
Mu, Q., Zhao, M., and Running, S. W.: MODIS Global Terrestrial Evapotranspiration (ET) Product (MOD16A2/A3): Algorithm Theoretical Basis Document, University of Montana, Missoula, MT, 55 pp., 2013.
Müller, R., Pfeifroth, U., Träger-Chatterjee, C., Trentmann, J., and Cremer, R.: Digging the METEOSAT treasure – 3 decades of solar surface radiation, Remote Sens., 7, 8067–8101, https://doi.org/10.3390/rs70608067, 2015.
Munzimi, Y. A., Hansen, M. C., Adusei, B., and Senay, G. B.: Characterizing Congo basin rainfall and climate using Tropical Rainfall Measuring Mission (TRMM) satellite data and limited rain gauge ground observations, J. Appl. Meteorol. Clim., 54, 541–555, https://doi.org/10.1175/JAMC-D-14-0052.1, 2015.
Ndehedehe, C. E., Okwuashi, O., Ferreira, V. G., and Agutu, N. O.: Exploring evapotranspiration dynamics over Sub-Sahara Africa (2000–2014), Environ. Monit. Assess., 190, 400, https://doi.org/10.1007/s10661-018-6780-6, 2018.
Nguyen, P., Ombadi, M., Sorooshian, S., Hsu, K., AghaKouchak, A., Braithwaite, D., Ashouri, H., and Thorstensen, A. R.: The PERSIANN family of global satellite precipitation data: a review and evaluation of products, Hydrol. Earth Syst. Sci., 22, 5801–5816, https://doi.org/10.5194/hess-22-5801-2018, 2018.
Nicholson, S. E., Kim, J., Ba, M. B., and Lare, A. R.: The mean surface water balance over Africa and its interannual variability, J. Climate, 10, 2981–3002, https://doi.org/10.1175/1520-0442(1997)010<2981:TMSWBO>2.0.CO;2, 1997.
Nicholson, S. E., Klotter, D., Dezfuli, A. K., and Zhou, L.: New Rainfall Datasets for the Congo Basin and Surrounding Regions, J. Hydrometeorol., 19, 1379–1396, https://doi.org/10.1175/JHM-D-18-0015.1, 2018.
Nicholson, S. E., Klotter, D., Zhou, L., and Hua, W.: Validation of Satellite Precipitation Estimates over the Congo Basin, J. Hydrometeorol., 20, 631–656, https://doi.org/10.1175/JHM-D-18-0118.1, 2019.
Nizinski, J. J., Galat, G., and Galat-Luong, A.: Water balance and sustainability of eucalyptus plantations in the Kouilou basin (Congo-Brazzaville), Russ. J. Ecol., 42, 305–314, https://doi.org/10.1134/S1067413611040126, 2011.
Nizinski, J. J., Galat, G., and Galat-Luong, A.: Actual evapotranspiration and canopy resistance measurement of the savannah in the Kouilou basin (Congo-Brazzaville), Russ. J. Ecol., 45, 359–366, https://doi.org/10.1134/S1067413614050191, 2014.
Oki, T., Musiake, K., Masuda, K., and Matsuyama, H.: Global runoff estimation by atmospheric water balance using ECMWF data set, in: Proceedings of the IAHS Yokohama Symposium: Hydrology of Warm Humid Regions, 13–15 July 1993, Yokohama, Japan, 163–171, 1993.
Olivry, J. C., Bricquet, J. P., and Mahé, G.: Vers un appauvrissement durable des ressources en eau de l'Afrique humide?, in: Proceedings of the IAHS Yokohama Symposium: Hydrology of Warm Humid Regions, 13–15 July 1993, Yokohama, Japan, 67–78, 1993.
Opoku-Duah, S., Donoghue, D. N. M., and Burt, T. P.: Intercomparison of evapotranspiration over the Savannah Volta Basin in West Africa using remote sensing data, Sensors, 8, 2736–2761, https://doi.org/10.3390/s8042736, 2008.
Pagán, B. R., Maes, W. H., Gentine, P., Martens, B., and Miralles, D. G.: Exploring the potential of satellite solar-induced fluorescence to constrain global transpiration estimates, Remote Sens., 11, 413, https://doi.org/10.3390/rs11040413, 2019.
Pan, M., Sahoo, A. K., Troy, T. J., Vinukollu, R. K., Sheffield, J., and Wood, A. E. F.: Multisource estimation of long-term terrestrial water budget for major global river basins, J. Climate, 25, 3191–3206, https://doi.org/10.1175/JCLI-D-11-00300.1, 2012.
Peñuelas, J., Canadell, J. G., and Ogaya, R.: Increased water-use efficiency during the 20th century did not translate into enhanced tree growth, Global Ecol. Biogeogr., 20, 597–608, https://doi.org/10.1111/j.1466-8238.2010.00608.x, 2011.
Philippon, N., de Lapparent, B., Gond, V., Sèze, G., Martiny, N., Camberlin, P., Cornu, G., Morel, B., Moron, V., Bigot, S., Brou, T., and Dubreuil, V.: Analysis of the diurnal cycles for a better understanding of the mean annual cycle of forests greenness in Central Africa, Agr. Forest Meteorol., 223, 81–94, https://doi.org/10.1016/j.agrformet.2016.04.005, 2016.
Philippon, N., Cornu, G., Monteil, L., Gond, V., Moron, V., Pergaud, J., Sèze, G., Bigot, S., Camberlin, P., Doumenge, C., Fayolle, A., and Ngomanda, A.: The light-deficient climates of western Central African evergreen forests, Environ. Res. Lett., 14, 034007, https://doi.org/10.1088/1748-9326/aaf5d8, 2019.
Pinet, P. and Souriau, M.: Continental erosion and large-scale relief, Tectonics, 7, 563–582, https://doi.org/10.1029/TC007i003p00563, 1988.
Pokam, W. M., Djiotang, L. A. T., and Mkankam, F. K.: Atmospheric water vapor transport and recycling in Equatorial Central Africa through NCEP/NCAR reanalysis data, Clim. Dynam., 38, 1715–1729, https://doi.org/10.1007/s00382-011-1242-7, 2012.
Rocha, A. V., Su, H. B., Vogel, C. S., Schmid, H. P., and Curtis, P. S.: Photosynthetic and water use efficiency responses to diffuse radiation by an aspen-dominated northern hardwood forest, Forest Sci., 50, 793–801, 2004.
Rodell, M., Famiglietti, J. S., Chen, J., Seneviratne, S. I., Viterbo, P., Holl, S., and Wilson, C. R.: Basin scale estimates of evapotranspiration using GRACE and other observations, Geophys. Res. Lett., 31, 10–13, https://doi.org/10.1029/2004GL020873, 2004a.
Rodell, M., Houser, P. R., Jambor, U., Gottschalck, J., Mitchell, K., Meng, C., Arsenault, K., Cosgrove, B., Radakovich, J., Bosilovich, M., Entin, J. K., Walker, J. P., Lohmann, D., and Toll, D.: The Global Land Data Assimilation System, B. Am. Meteorol. Soc., 85, 381–394, https://doi.org/10.1175/BAMS-85-3-381, 2004b.
Rodell, M., Houser, P. R., Jambor, U., Gottschalck, J., Mitchell, K., Meng, C., Arsenault, K., Cosgrove, B., Radakovich, J., Bosilovich, M., Entin, J. K., Walker, J. P., Lohmann, D., and Toll, D.: GLDAS Noah Land Surface Model L4 monthly 1.0×1.0 degree V2.1 (GLDAS_NOAH10_M), NASA Goddard Earth Sciences Data and Information Services Center (GES-DISC), available at: https://disc.gsfc.nasa.gov/ (last access: 5 March 2019), 2004c.
Rodell, M., McWilliams, E. B., Famiglietti, J. S., Beaudoing, H. K., and Nigro, J.: Estimating evapotranspiration using an observation based terrestrial water budget, Hydrol. Process., 25, 4082–4092, https://doi.org/10.1002/hyp.8369, 2011.
Rodell, M., Famiglietti, J. S., Wiese, D. N., Reager, J. T., Beaudoing, H. K., Landerer, F. W., and Lo, M. H.: Emerging trends in global freshwater availability, Nature, 557, 651–659, https://doi.org/10.1038/s41586-018-0123-1, 2018.
Running, S., Mu, Q., and Zhao, M.: MOD16A2 MODIS/Terra Net Evapotranspiration 8-Day L4 Global 500 m SIN Grid V006, NASA Land Processes DAAC, https://doi.org/10.5067/MODIS/MOD16A2.006, 2017.
Russell, G. L. and Miller, J. R.: Global River Runoff Calculated from a Global Atmospheric General Circulation Model, J. Hydrol., 117, 241–254, 1990.
Ryu, Y., Jiang, C., Kobayashi, H., and Detto, M.: MODIS-derived global land products of shortwave radiation and diffuse and total photosynthetically active radiation at 5 km resolution from 2000, Remote Sens. Environ., 204, 812–825, https://doi.org/10.1016/j.rse.2017.09.021, 2018.
Saeed, F., Haensler, A., Weber, T., Hagemann, S., and Jacob, D.: Representation of extreme precipitation events leading to opposite climate change signals over the Congo basin, Atmosphere-Basel, 4, 254–271, https://doi.org/10.3390/atmos4030254, 2013.
Sakumura, C., Bettadpur, S., and Bruinsma, S.: Ensemble prediction and intercomparison analysis of GRACE time-variable gravity field models, Geophys. Res. Lett., 41, 1389–1397, https://doi.org/10.1002/2013GL058632, 2014.
Schneider, U., Becker, A., Finger, P., Meyer-Christoffer, A., Rudolf, B., and Ziese, M.: GPCC Full Data Monthly Product Version 7.0 at 2.5∘: Monthly Land-Surface Precipitation from Rain-Gauges built on GTS-based and Historic Data, Global Precipitation Climatology Centre (GPCC), https://doi.org/10.5676/DWD_GPCC/FD_M_V7_250, 2015.
Schüttemeyer, D., Schillings, C., Moene, A. F., and de Bruin, H. A. R.: Satellite-based actual evapotranspiration over drying semiarid terrain in West Africa, J. Appl. Meteorol. Clim., 46, 97–111, https://doi.org/10.1175/JAM2444.1, 2007.
Senay, G. B., Bohms, S., Singh, R. K., Gowda, P. H., Velpuri, N. M., Alemu, H., and Verdin, J. P.: Operational evapotranspiration mapping using remote sensing and weather datasets: a new paramaterization for the SSEB approach, J. Am. Water Resour. Asoc., 49, 577–591, https://doi.org/10.1111/jawr.12057, 2013.
Senay, G. B., Bohms, S., Singh, R., Gowda, P. A., Velpuri, N. M., Alemu, H., and Verdin, J. P.: SSEBop Version 4.0 Monthly ETa, USGS Famine Early Warning Systems Network, available at: https://earlywarning.usgs.gov/fews/product/460 (last access: 2 July 2020), 2017.
Shahin, M.: Evapotranspiration, in: Hydrology and Water Resources of Africa, Springer Netherlands, Dordrecht, 157–212, 1994.
Shem, W. O.: Biosphere-atmosphere interaction over the Congo Basin and its influence on the regional hydrological cycle, PhD thesis, School of Earth and Atmospheric Sciences, Georgia Institute of Technology, USA, 141 pp., 2006.
Shirke, P. A.: Leaf photosynthesis, dark respiration, and fluorescence as influenced by leaf age in an evergreen tree, Prosopis juliflora, Photosynthetica, 39, 305–311, https://doi.org/10.1023/A:1013761410734, 2001.
Sobrado, M. A.: Leaf age effects on photosynthetic rate, transpiration rate and nitrogen content in a tropical dry forest, Physiol. Plant., 90, 210–215, https://doi.org/10.1111/j.1399-3054.1994.tb02213.x, 1994.
SO-HYBAM: Congo River Discharge Data, Hydrological and Biogeochemical Control of Erosion/Alteration and Material Transport in the Amazon, Orinoco and Congo Basins (HYBAM), available at: https://www.ore-hybam.org (last access: 15 January 2018), 2015.
Sorí, R., Nieto, R., Vicente-Serrano, S. M., Drumond, A., and Gimeno, L.: A Lagrangian perspective of the hydrological cycle in the Congo River basin, Earth Syst. Dynam., 8, 653–675, https://doi.org/10.5194/esd-8-653-2017, 2017.
Sorooshian, S., Hsu, K., Braithwaite, D., Ashouri, H., and NOAA CDR Program: NOAA Climate Data Record (CDR) of Precipitation Estimation from Remotely Sensed Information using Artificial Neural Networks (PERSIANN-CDR), Version 1 Revision 1, NOAA National Centers for Environmental Information, https://doi.org/10.7289/V51V5BWQ, 2014.
Stoffelen, A.: Toward the true near-surface wind speed: Error modeling and calibration using triple collocation, J. Geophys. Res.-Oceans, 103, 7755–7766, https://doi.org/10.1029/97JC03180, 1998.
Swann, A. L. S. and Koven, C. D.: A Direct Estimate of the Seasonal Cycle of Evapotranspiration over the Amazon Basin, J. Hydrometeorol., 18, 2173–2185, https://doi.org/10.1175/JHM-D-17-0004.1, 2017.
Swenson, S. and Wahr, J.: Post-processing removal of correlated errors in GRACE data, Geophys. Res. Lett., 33, L08402, https://doi.org/10.1029/2005GL025285, 2006.
Swenson, S. C.: Grace Monthly Land Water Mass Grids NETCDF Release Ver. 5.0, NASA Physical Oceanography DAAC, https://doi.org/10.5067/TELND-NC005, 2012.
Tapley, B. D., Bettadpur, S., Ries, J. C., Thompson, P. F., and Watkins, M. M.: GRACE Measurements of Mass Variability in the Earth System, Science, 305, 503–505, https://doi.org/10.1126/science.1099192, 2004.
Taylor, K. E.: Summarizing multiple aspects of model performance in a single diagram, J. Geophys. Res., 106, 7183–7192, 2001.
Thiemig, V., Rojas, R., Zambrano-Bigiarini, M., Levizzani, V., and De Roo, A.: Validation of satellite-based precipitation products over sparsely gauged African river basins, J. Hydrometeorol., 13, 1760–1783, https://doi.org/10.1175/JHM-D-12-032.1, 2012.
Turubanova, S., Potapov, P. V., Tyukavina, A., and Hansen, M. C.: Ongoing primary forest loss in Brazil, Democratic Republic of the Congo, and Indonesia, Environ. Res. Lett., 13, 074028, https://doi.org/10.1088/1748-9326/aacd1c, 2018.
Ukkola, A. M. and Prentice, I. C.: A worldwide analysis of trends in water-balance evapotranspiration, Hydrol. Earth Syst. Sci., 17, 4177–4187, https://doi.org/10.5194/hess-17-4177-2013, 2013.
Urban, J., Ingwers, M. W., McGuire, M. A., and Teskey, R. O.: Increase in leaf temperature opens stomata and decouples net photosynthesis from stomatal conductance in Pinus taeda and Populus deltoides x nigra, J. Exp. Bot., 68, 1757–1767, https://doi.org/10.1093/jxb/erx052, 2017.
Van Der Ent, R. J. and Savenije, H. H. G.: Length and time scales of atmospheric moisture recycling, Atmos. Chem. Phys., 11, 1853–1863, https://doi.org/10.5194/acp-11-1853-2011, 2011.
Van Der Sleen, P., Groenendijk, P., Vlam, M., Anten, N. P. R., Boom, A., Bongers, F., Pons, T. L., Terburg, G., and Zuidema, P. A.: No growth stimulation of tropical trees by 150 years of CO2 fertilization but water-use efficiency increased, Nat. Geosci., 8, 24–28, https://doi.org/10.1038/ngeo2313, 2015.
Verbesselt, J., Hyndman, R., Newnham, G., and Culvenor, D.: Detecting trend and seasonal changes in satellite image time series, Remote Sens. Environ., 114, 106–115, https://doi.org/10.1016/j.rse.2009.08.014, 2010a.
Verbesselt, J., Hyndman, R., Zeileis, A., and Culvenor, D.: Phenological change detection while accounting for abrupt and gradual trends in satellite image time series, Remote Sens. Environ., 114, 2970–2980, https://doi.org/10.1016/j.rse.2010.08.003, 2010b.
Verbesselt, J., Zeileis, A., and Hyndman, R.: Breaks for Additive Season and Trend (BFAST), available at: http://bfast.r-forge.r-project.org (last access: 27 May 2019), 2015.
Vinya, R., Malhi, Y., Brown, N. D., Fisher, J. B., Brodribb, T., and Aragão, L. E. O. C.: Seasonal changes in plant–water relations influence patterns of leaf display in Miombo woodlands: evidence of water conservative strategies, Tree Physiol., 39, 104–112, https://doi.org/10.1093/treephys/tpy062, 2019.
Wahr, J., Swenson, S., and Velicogna, I.: Accuracy of GRACE mass estimates, Geophys. Res. Lett., 33, L06401, https://doi.org/10.1029/2005GL025305, 2006.
Wan, Z., Zhang, K., Xue, X., Hong, Z., Hong, Y., and Gourley, J. J.: Water balance-based actual evapotranspiration reconstruction from ground and satellite observations over the conterminous United States, Water Resour. Res., 51, 6485–6499, https://doi.org/10.1002/2015WR017311, 2015.
Washington, R., James, R., Pearce, H., Pokam, W. M., and Moufouma-Okia, W.: Congo Basin rainfall climatology: can we believe the climate models?, Philos. T. Roy. Soc. B, 368, 20120296, https://doi.org/10.1098/rstb.2012.0296, 2013.
Weerasinghe, I., Bastiaanssen, W., Mul, M., Jia, L., and van Griensven, A.: Can we trust remote sensing evapotranspiration products over Africa?, Hydrol. Earth Syst. Sci., 24, 1565–1586, https://doi.org/10.5194/hess-24-1565-2020, 2020.
Wu, J., Albert, L. P., Lopes, A. P., Restrepo-Coupe, N., Hayek, M., Wiedemann, K. T., Guan, K., Stark, S. C., Christoffersen, B., Prohaska, N., Tavares, J. V., Marostica, S., Kobayashi, H., Ferreira, M. L., Campos, K. S., da Silva, R., Brando, P. M., Dye, D. G., Huxman, T. E., Huete, A. R., Nelson, B. W., and Saleska, S. R.: Leaf development and demography explain photosynthetic seasonality in Amazon evergreen forests, Science, 351, 972–976, https://doi.org/10.1126/science.aad5068, 2016.
Yin, X. and Gruber, A.: Validation of the abrupt change in GPCP precipitation in the Congo River Basin, Int. J. Climatol., 30, 110–119, https://doi.org/10.1002/joc.1875, 2010.
Yuan, W., Zheng, Y., Piao, S., Ciais, P., Lombardozzi, D., Wang, Y., Ryu, Y., Chen, G., Dong, W., Hu, Z., Jain, A. K., Jiang, C., Kato, E., Li, S., Lienert, S., Liu, S., Nabel, J. E. M. S., Qin, Z., Quine, T., Sitch, S., Smith, W. K., Wang, F., Wu, C., Xiao, Z., and Yang, S.: Increased atmospheric vapor pressure deficit reduces global vegetation growth, Sci. Adv., 5, eaax1396, https://doi.org/10.1126/sciadv.aax1396, 2019.
Zhang, K., Kimball, J. S., and Running, S. W.: A review of remote sensing based actual evapotranspiration estimation, Wiley Interdiscip. Rev. Water, 3, 834–853, https://doi.org/10.1002/wat2.1168, 2016.
Zhang, Y., Joiner, J., Gentine, P., and Zhou, S.: Reduced solar-induced chlorophyll fluorescence from GOME-2 during Amazon drought caused by dataset artifacts, Global Change Biol., 24, 2229–2230, https://doi.org/10.1111/gcb.14134, 2018.
Zhou, L., Tian, Y., Myneni, R. B., Ciais, P., Saatchi, S., Liu, Y. Y., Piao, S., Chen, H., Vermote, E. F., Song, C., and Hwang, T.: Widespread decline of Congo rainforest greenness in the past decade, Nature, 508, 86–90, https://doi.org/10.1038/nature13265, 2014.
Zou, L., Wang, L., Li, J., Lu, Y., Gong, W., and Niu, Y.: Global surface solar radiation and photovoltaic power from Coupled Model Intercomparison Project Phase 5 climate models, J. Clean. Prod., 224, 304–324, https://doi.org/10.1016/j.jclepro.2019.03.268, 2019.