the Creative Commons Attribution 4.0 License.
the Creative Commons Attribution 4.0 License.
 | 11 May 2020
Modeling inorganic carbon dynamics in the Seine River continuum in France
Audrey Marescaux
Vincent Thieu
Nathalie Gypens
Marie Silvestre
Josette Garnier
Inland waters are an active component of the carbon cycle where transformations and transports are associated with carbon dioxide (CO2) outgassing. This study estimated CO2 emissions from the human-impacted Seine River (France) and provided a detailed budget of aquatic carbon transfers for organic and inorganic forms, including the in-stream metabolism along the whole Seine River network. The existing process-based biogeochemical pyNuts-Riverstrahler model was supplemented with a newly developed inorganic carbon module and simulations were performed for the recent time period 2010–2013. New input constraints for the modeling of riverine inorganic carbon were documented by field measurements and complemented by analysis of existing databases. The resulting dissolved inorganic carbon (DIC) concentrations in the Seine aquifers ranged from 25 to 92 mg C L−1, while in wastewater treatment plant (WWTP) effluents our DIC measurements averaged 70 mg C L−1.
Along the main stem of the Seine River, simulations of DIC, total alkalinity, pH and CO2 concentrations were of the same order of magnitude as the observations, but seasonal variability was not always well reproduced. Our simulations demonstrated the CO2 supersaturation with respect to atmospheric concentrations over the entire Seine River network. The most significant outgassing was in lower-order streams while peaks were simulated downstream of the major WWTP effluent. For the period studied (2010–2013), the annual average of simulated CO2 emissions from the Seine drainage network were estimated at 364±99 Gg C yr−1.
Results from metabolism analysis in the Seine hydrographic network
highlighted the importance of benthic activities in headwaters while
planktonic activities occurred mainly downstream in larger rivers. The net
ecosystem productivity remained negative throughout the 4 simulated years
and over the entire drainage network, highlighting the heterotrophy of the
basin.
Highlights
-
CO2 emission from the Seine River was estimated at 364±99 Gg C yr−1 with the Riverstrahler model.
-
CO2 riverine concentrations are modulated by groundwater discharge and instream metabolism.
-
CO2 emissions account for 31 % of inorganic carbon exports, the rest being exported as DIC.
- Article
(3363 KB) - Full-text XML
-
Supplement
(643 KB) - BibTeX
- EndNote


Rivers have been demonstrated to be active pipes for transport, transformation, storage and outgassing of inorganic and organic carbon (Cole et al., 2007). Although there are large uncertainties in the quantification of flux from inland waters, carbon dioxide (CO2) outgassing has been estimated to be a significant efflux to the atmosphere, subject to regional variabilities (Cole et al., 2007; Battin et al., 2009a; Aufdenkampe et al., 2011; Lauerwald et al., 2015; Regnier et al., 2013a; Raymond et al., 2013; Sawakuchi et al., 2017; Drake et al., 2018). These variabilities are determined by regional climate and watershed characteristics and are related to terrestrial carbon exports under different forms, from organic to inorganic, and dissolved to particulate. Organic carbon entering rivers can originate from terrestrial ecosystems as plant detritus, soil leaching or soil erosion, and groundwater supply, but it can also be produced instream by photosynthesis or brought by dust particles (Prairie and Cole, 2009; Drake et al., 2018). Inorganic carbon originates from groundwater, soil leaching and exchange by diffusion at the air–water interface, depending on the partial pressure of CO2 (pCO2) at the water surface with respect to atmospheric pCO2 (Cole et al., 2007; Drake et al., 2018; Marx et al., 2018). Besides air–water exchanges, carbon exchanges occur at the water–sediment interface, through biomineralization and/or burial (Regnier et al., 2013b). As a whole, eutrophic, oligo- and mesotrophic hydrosystems generally act as a source of carbon; however, lentic systems may be undersaturated with respect to atmospheric pCO2 (Prairie and Cole, 2009; Xu et al., 2019; Yang et al., 2019).
Direct measurements of pCO2 or isotopic surveys (as realized by Dubois et al., 2010, in the Mississippi River) along the drainage network are still too scarce to accurately support temporal and spatial analyses of CO2 variability. While calculations from pH, temperature and alkalinity may help reconstruct spatiotemporal patterns of CO2 dynamics (Marescaux et al., 2018b), modeling tools can predict the fate of carbon in whole aquatic systems. Indeed, modeling approaches have made it possible to simulate and quantify carbon fluxes between different reservoirs: atmosphere, biosphere, hydrosphere and lithosphere (e.g., Bern-SAR, Joos et al., 1996; ACC2, Tanaka et al., 2007; TOTEM, Mackenzie et al., 2011; MAGICC6, Meehl et al., 2007). In addition to these box approaches, a number of more comprehensive mechanistic models, describing biogeochemical processes involved in carbon cycling and CO2 evasion, have been set up for oceans (e.g., Doney et al., 2004; Aumont et al., 2015), coastal waters (e.g., Borges et al., 2006; Gypens et al., 2004, 2009, 2011) and estuaries (e.g., Cai and Wang, 1998; Volta et al., 2014; Laruelle et al., 2019). In inland waters, the NICE-BGC model (Nakayama, 2016) accurately represents CO2 evasion at the global scale. However, to our knowledge, while several process-based river models describe the carbon cycle through organic matter input and degradation by aquatic microorganisms (e.g., PEGASE, Smitz et al., 1997; ProSe, Vilmin et al., 2018; QUAL2Kw, Pelletier et al., 2006; QUAL-NET, Minaudo et al., 2018, QUASAR, Whitehead et al., 1997; Riverstrahler, Billen et al., 1994; Garnier et al., 2002), none of them describes the inorganic carbon cycle including carbon dioxide outgassing.
The Seine River (northwestern France) has long been studied using the biogeochemical riverine Riverstrahler model (Billen et al., 1994; Garnier et al., 1995), a generic model of water quality and biogeochemical functioning of large river systems. For example, the model has made it possible to quantify deliveries to the coastal zone and understand eutrophication phenomena (Billen and Garnier, 1999; Billen et al., 2001; Passy et al., 2016; Garnier et al., 2019), nitrogen transformation and N2O emissions (Garnier et al., 2007, 2009; Vilain et al., 2012) as well as nitrate retention (Billen and Garnier, 1999; Billen et al., 2018), and the organic carbon metabolism (Garnier and Billen, 2007; Vilmin et al., 2016). It is only recently that we investigated pCO2 and emphasized the factors controlling pCO2 dynamics in the Seine River (Marescaux et al., 2018b) or its estuary (Laruelle et al., 2019).
The purpose of the present study was to quantify the sources, transformations, sinks and gaseous emissions of inorganic carbon using the Riverstrahler modeling approach (Billen et al., 1994; Garnier et al., 2002; Thieu et al., 2009). A further aim in newly implementing this CO2 module was to quantify and discuss autotrophy versus heterotrophy patterns in regard to CO2 concentrations and supersaturation in the drainage network.
2.1 Description of the Seine basin
Situated in northwestern France, 46∘57′–50∘55′ N and 0∘7′1′′–4∘ E, the Seine basin (∼76 285 km2) has a temperate climate and a pluvio-oceanic hydrologic regime (Fig. 1). The mean altitude of the basin is 150 m a.s.l. (above sea level) with 1 % of the basin reaching more than 550 m a.s.l. in the Morvan (Guerrini et al., 1998). The water flow at Poses (stream order 7, basin area 64 867 km2), the most downstream monitoring station free from tidal influence, averaged 490 m3 s−1 during the 2010–2013 period (the HYDRO database, http://www.hydro.eaufrance.fr, last access: 11 February 2020). The major tributaries include the Marne and upper Seine rivers upstream from Paris, and the Oise River downstream from Paris (Fig. 1a). Three main reservoirs, storing water during winter and sustaining low flow during summer, are located upstream on the Marne River and the upstream Seine and its Aube tributary (Fig. 1a). The total storage capacity of these reservoirs is 800×106 m3 (Garnier et al., 1999).
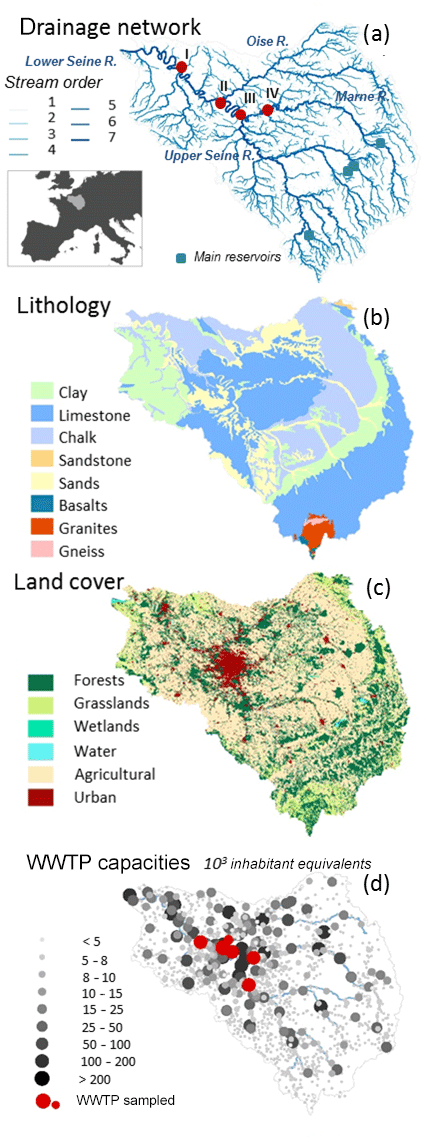
Figure 1Characteristics of the Seine basin: (a) drainage network according to Strahler stream orders (Strahler, 1952, 1957) and monitoring stations (I: Poses, II: Poissy (downstream of Paris), III: Paris, IV: Ferté-sous-Jouarre (upstream from Paris)); (b) the lithology according to Albinet (1967); (c) land use according to the Corine Land Cover database, with six simplified classes (EEA, 2012); (d) wastewater treatment plants (WWTPs) of the basin. Red dots are the WWTPs sampled in 2018.
The maximum water discharge of these tributaries occurs during winter with the lowest temperature and rate of evapotranspiration; the opposite behavior is observed during summer (Guerrini et al., 1998).
Except for the crystalline rocks in the north and from the highland of the Morvan (south), the Seine basin is for the most part located in the lowland Parisian basin with sedimentary rocks (Mégnien, 1980; Pomerol and Feugueur, 1986; Guerrini et al., 1998). The largest aquifers are in carbonate rock (mainly limestone and chalk) or detrital (sand and sandstone) material separated by impermeable or less permeable layers.
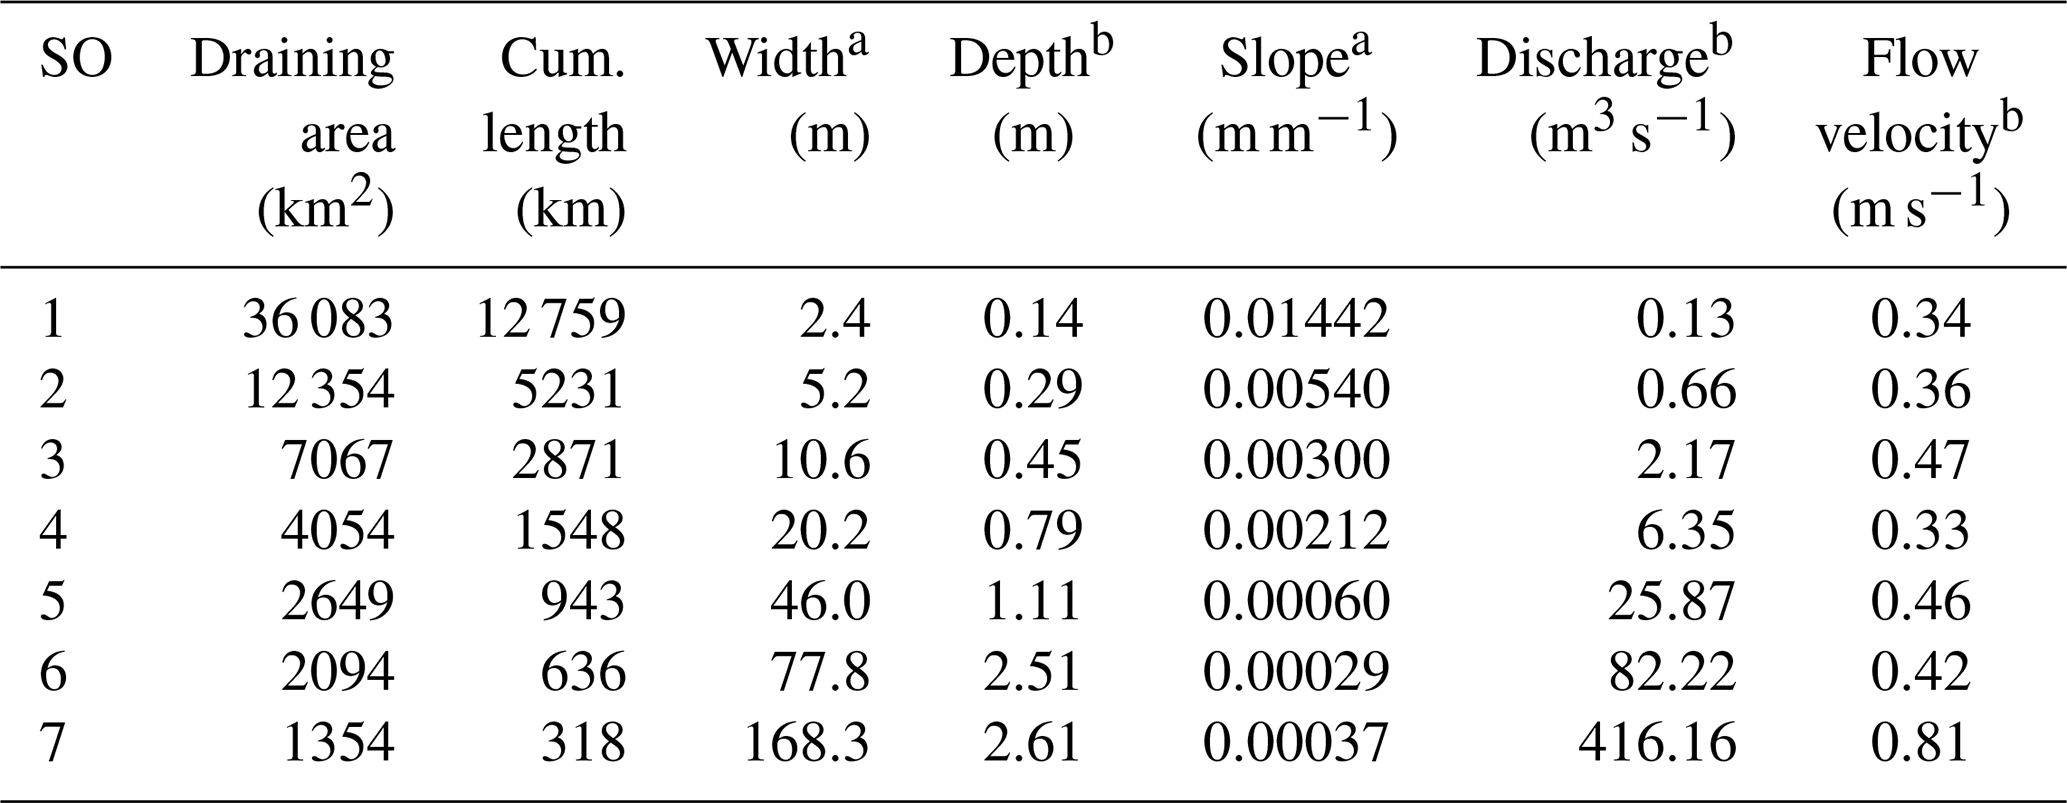
The concept of Strahler stream order (SO) (Strahler, 1957) was adopted for describing the geomorphology of a drainage network in the Riverstrahler model (Billen et al., 1994). The smaller perennial streams are in order 1. Only confluences between two river stretches with the same SO produce an increase in Strahler ordination (SO + 1) (Fig. 1a). The mean hydrophysical characteristics of the Seine River are aggregated by stream orders shown in Table 1.
Table 1Hydro-morphological characteristics of the Seine drainage network, a averaged by Strahler order (SO) and b over the time period 2010-2013. Hydrographic network provided by the Agence de l'Eau Seine Normandie and water discharges by the national Banque Hydro database. Depth and flow velocity calculated according to Billen et al. (1994); width calculated according to Thieu et al. (2009).
The Seine basin is characterized by intensive agriculture (more than 50 % of the basin; EEA, 2012) and is densely populated. The population is mostly concentrated in the Paris conurbation, which had 12.4 million inhabitants in 2015 (Fig. 1) (INSEE, 2015). Located 70 km downstream of Paris, the largest wastewater treatment plant in Europe (Seine Aval, SAV WWTP) can treat up to 6×10⁶ per inhabitant equivalent per day, releasing 15.4 m3 s−1 into the lower Seine River (Syndicat interdépartemental pour l'assainissement de l'agglomération parisienne; French acronym SIAAP, http://www.siaap.fr/, last access: 11 February 2020).
2.2 The pyNuts-Riverstrahler model and its biogeochemical model, RIVE
The biogeochemical model, RIVE
The core of the biogeochemical calculation of the pyNuts-Riverstrahler model (described hereafter) is the RIVE model (e.g., Billen et al., 1994; Garnier et al., 1995, 2002; Servais et al., 2007) (https://www.fire.upmc.fr/rive/, last access: 3 May 2020), which simulates concentrations of oxygen, nutrients (nitrogen, N; phosphorus, P; and silica, Si), particulate suspended matter, and dissolved and particulate organic carbon (three classes of biodegradability) in a homogeneous water column. Biological compartments are represented by three taxonomic classes of phytoplankton (diatoms, Chlorophyceae and Cyanobacteria), two types of zooplankton (rotifers with a short generation time and microcrustaceans with a long generation time), two types of heterotrophic bacteria (small autochthonous and large allochthonous with a higher growth rate than the small ones), and two types of nitrifying bacteria (ammonium-oxidizing bacteria and nitrite-oxidizing bacteria).
The model also describes benthic processes (erosion, organic matter degradation, denitrification, etc.) and exchanges with the water column with the explicit description of benthic organic matter, inorganic particulate P and benthic biogenic Si state variables. The benthic component does not explicitly represent all the anaerobic reduction chains, denitrification being the major anaerobic microbial process.
A detailed list of the state variables of the RIVE model is provided in Sect. S1 in the Supplement. Most of the kinetic parameters involved in this description have been previously determined through field or laboratory experiments under controlled conditions and are fixed a priori (see detailed description of all kinetics and parameter values in Garnier et al., 2002). To date, there has been no explicit representation of inorganic carbon in the RIVE model (see this new input in Sect. S1).
Riverstrahler allows for the calculation of water quality variables at any point in the aquatic continuum based on a number of constraints characterizing the watershed, namely, the geomorphology and hydrology of the river system and the point and diffuse sources of nutrients.
Geomorphology
A drainage network can be described as subbasins (tributaries) connected to one or several main axes that define a number of modeling units. The modeling approach considers the drainage network as a set of river axes with a spatial resolution of 1 km (axis object), or they can be aggregated to form subbasins that are idealized as a regular scheme of tributary confluences where each stream order is described by mean characteristics (basin object). Here, the Seine drainage network starts from its headwater, ends at its fluvial outlet (Poses), and was divided into 69 modeling units, including six axes (axis object) and 63 upstream basins (basin object). A map and a table introducing the main characteristics of the modeling units are provided in Sect. S2.
Hydrology
Runoffs were calculated over the whole Seine basin using water discharge measurements at 48 gauged stations (source: Banque Hydro database, http://www.hydro.eaufrance.fr/, last access: 11 February 2020). Surface and base flow contributions were estimated applying the BFLOW automatic hydrograph separation method (Arnold and Allen, 1999) over the recent time series of water discharges (2010–2017). For the study period (2010–2013), the mean base flow index (BFI = 0.71) of the Seine basin indicates the extent of the groundwater contribution to river discharge, with spatial heterogeneity following the main lithological structures (Fig. 1b), but when summarizing the BFI criteria by Strahler order, significant differences did not appear (not shown).
Water temperature
Water temperature was calculated according to an empirical relationship, adjusted on inter-annual averaged observations (2006–2016), and describes seasonal variation of water temperature in each Strahler order with a 10 d time step (see Sect. S2).
Diffuse and point sources
Riverstrahler manages the calculation of the RIVE model according to a Lagrangian routing of water masses along the hydrographic network (Billen et al., 1994) and is a generic model of water quality and biogeochemical functioning of large drainage networks that simulates water quality. PyNuts is a modeling environment that can calculate the constraints (diffuse and point sources) on the Riverstrahler model at a multiregional scale (Desmit et al., 2018, for the Atlantic façade).
2.2.1 Development of an inorganic carbon module
Introducing the carbonate system
The carbonate system was described by a set of equations (named the CO2 module) based on a previous representation provided by Gypens et al. (2004) and adapted for freshwater environments (Nathalie Gypens and Alberto Vieira Borges, personal communication, 2016). This CO2 module was fully integrated in the RIVE model (Fig. 2). It aims to compute the speciation of the carbonate system based on two new state variables, dissolved inorganic carbon (DIC) and total alkalinity (TA), making it possible to calculate carbon dioxide (CO2). The module uses three equations (see Sect. S3: Eqs. 1–3) that also calculate bicarbonate (), carbonate () and hydronium (H3O+). Indeed, two variables of the carbonate system are sufficient to calculate all the other components (Zeebe and Wolf-Gladrow, 2001). Here, DIC and TA were selected because the biological processes involved in their spatiotemporal variability along the aquatic continuum were already included in the RIVE model (Fig. 2). We calculated pH as a function of TA and DIC using the Culberson equation (Culberson, 1980) (Sect. S3.4).
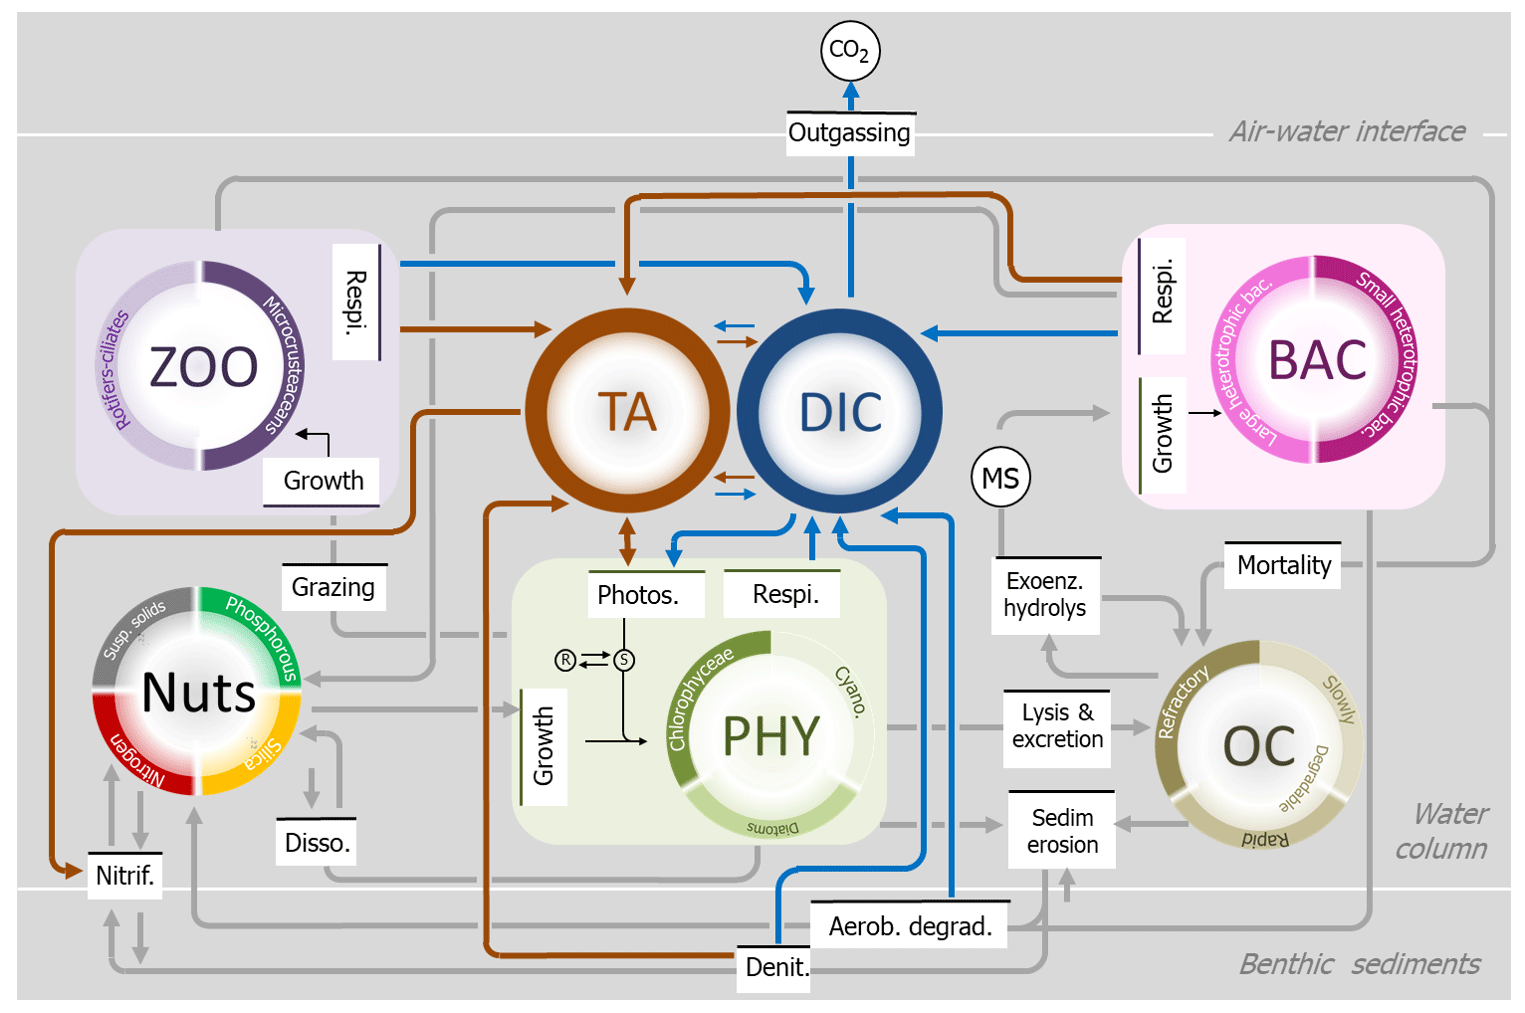
Figure 2Schematic representation of the ecological RIVE model (initially developed by Billen et al., 1994, and Garnier and Billen, 1994), with gray lines indicating the main processes simulated in the water column and at the interface with sediment (oxygen not shown), and implementation of the new inorganic module, based on total alkalinity (TA, maroon) and dissolved inorganic carbon (DIC, blue).
Aquatic processes affecting TA and DIC
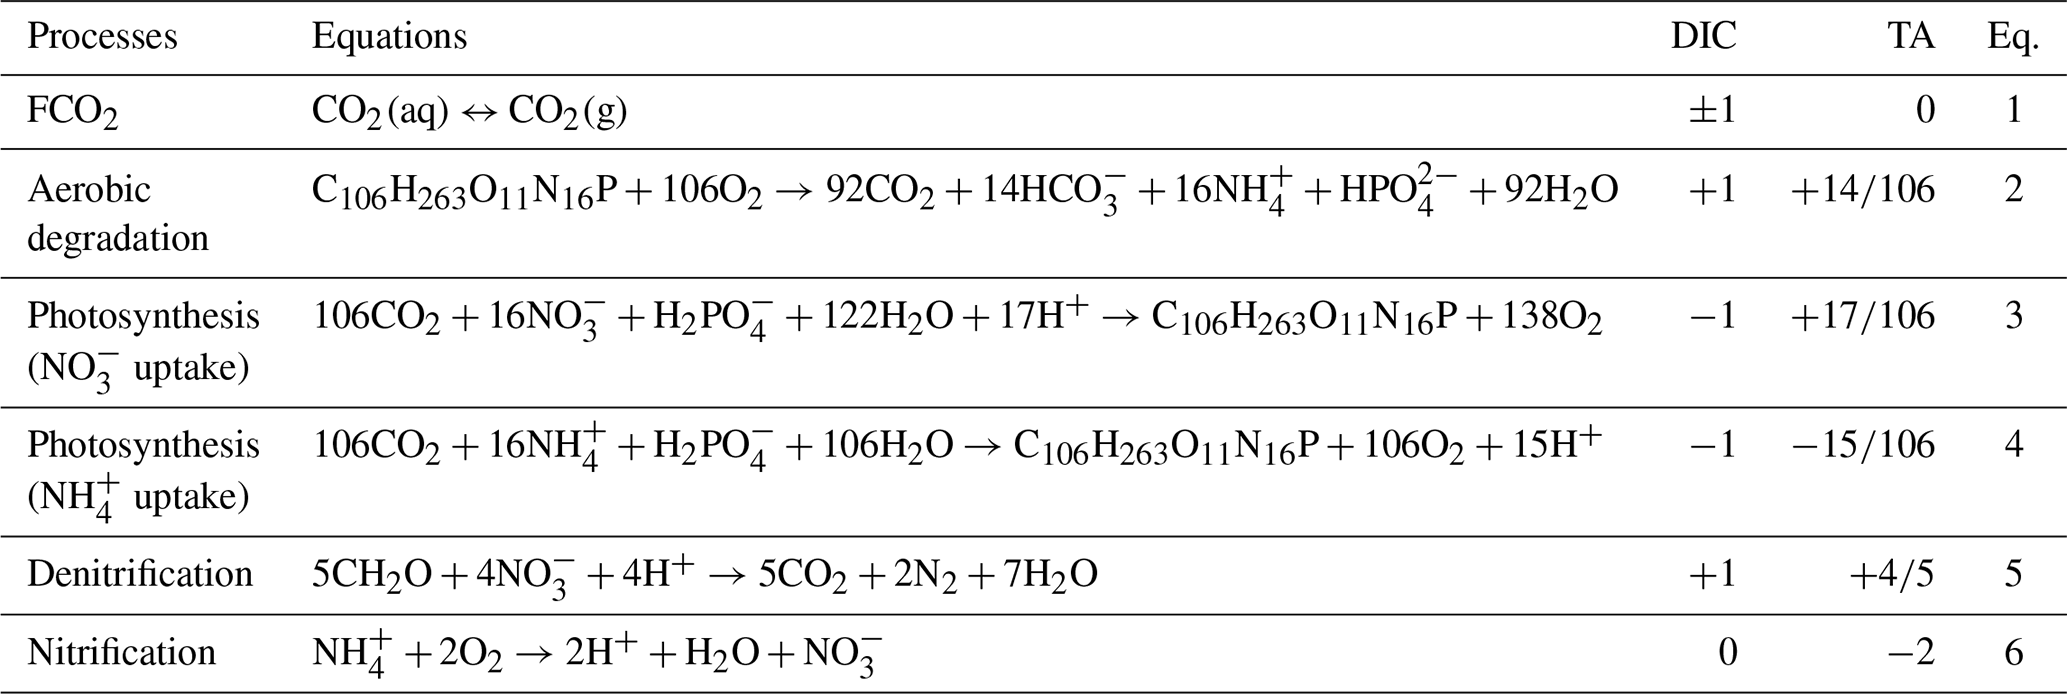
The exchange of CO2 between the water surface and the atmosphere depends, respectively, on the gas transfer velocity (k value) and on the sign of the CO2 concentration gradient at the water surface–atmosphere interface (Sect. S3.5). Change in pCO2 will in turn affect DIC concentrations (see Table 2, Eq. 1). Dissolved or particulate organic matter is mostly degraded by microbial activities (more or less quickly depending on their biodegradability), resulting in CO2 and production (Servais et al., 1995), thus inducing a change in DIC and TA concentrations in the water column (Table 2, Eq. 2, Fig. 2). Photosynthesis and denitrification processes also affect DIC and TA (Table 2, Eqs. 3–5), while instream nitrification only influences TA (Table 2, Eq. 6, Fig. 2).
Table 2Stoichiometry of the biogeochemical processes, influencing dissolved inorganic carbon (DIC) and total alkalinity (TA) in freshwater, as taken into account in the new inorganic carbon module. TA and DIC expressed in mol : mol of the main substrate (either C or N).
State equations and parameters of the inorganic carbon module
These processes affecting TA and DIC result in equations governing inorganic carbon dynamics as follows:
with
where TAt−1 is the value of TA (µmol L−1) in the previous time step (t−1). Respbact, RespZoo and respBent are respectively the heterotrophic planktonic respiration of bacteria, zooplankton and benthic bacteria already included in RIVE (mg C L−1 h−1). M(C) is the molar mass of the carbon (12 g mol−1). Denit and nitr[′AOB′] are respectively the processes of denitrification and nitrification by ammonia-oxidizing bacteria (AOB) as implemented in the RIVE model (mg N L−1 h−1); M(N) is the molar mass of the nitrogen (14 g mol−1). phot is the net photosynthesis (mg O2 L−1 h−1). uptPhyN is the nitrogen uptake by phytoplankton (mg N L−1 h−1) which is differentiated for nitrate (uptPhy, mg C L−1 h−1) and ammonium (uptPhy, mg C L−1 h−1), and M(O2) is the molar mass of the dioxygen (32 g mol−1). TAinputs is TA (µmol L−1) entering the water column by diffuse sources (groundwater and subsurface discharges) and point sources (WWTPs).
with
where DICt−1 is the value of DIC (mg C L−1) in the previous time step (t−1). is the CO2 flux at the water–atmosphere interface in mg C m−2 h−1 described in Sect. S3.5; depth is the water column depth (m).
The different values of constants and parameters used in the inorganic carbon module are introduced in Table 1 of Sect. S3.6. The full inorganic carbon module is described in Sect. S3 (Sects. 3.1 to 3.6).
2.2.2 Input constraints of the pyNuts-Riverstrahler model
Diffuse sources from soil and groundwater
Diffuse sources are calculated at the scale of each modeling unit, based on several spatially explicit databases describing natural and anthropogenic constraints on the Seine River basin. Diffuse sources are taken into account by assigning a yearly mean concentration of carbon and nutrients to subsurface and groundwater flow components, respectively. These concentrations are then combined with a 10 d time step description of surface and base flows to simulate the seasonal contribution of diffuse emissions to the river system. For nutrients, several applications of the Riverstrahler on the Seine River basin refined the quantification of diffuse sources: e.g., Billen and Garnier (1999) and Billen et al. (2018) for nitrogen; Aissa-Grouz et al. (2018) for phosphorus; Billen et al. (2007), Sferratore et al. (2008) and Thieu et al. (2009) for N, P and Si. In this study we revised our estimates for diffuse organic carbon sources and propose TA and DIC values for the Seine basin. The summary of all the carbon-related inputs of the model is provided in Table 3.
Table 3Summary of the carbon related inputs of the pyNuts-Riverstrahler model.
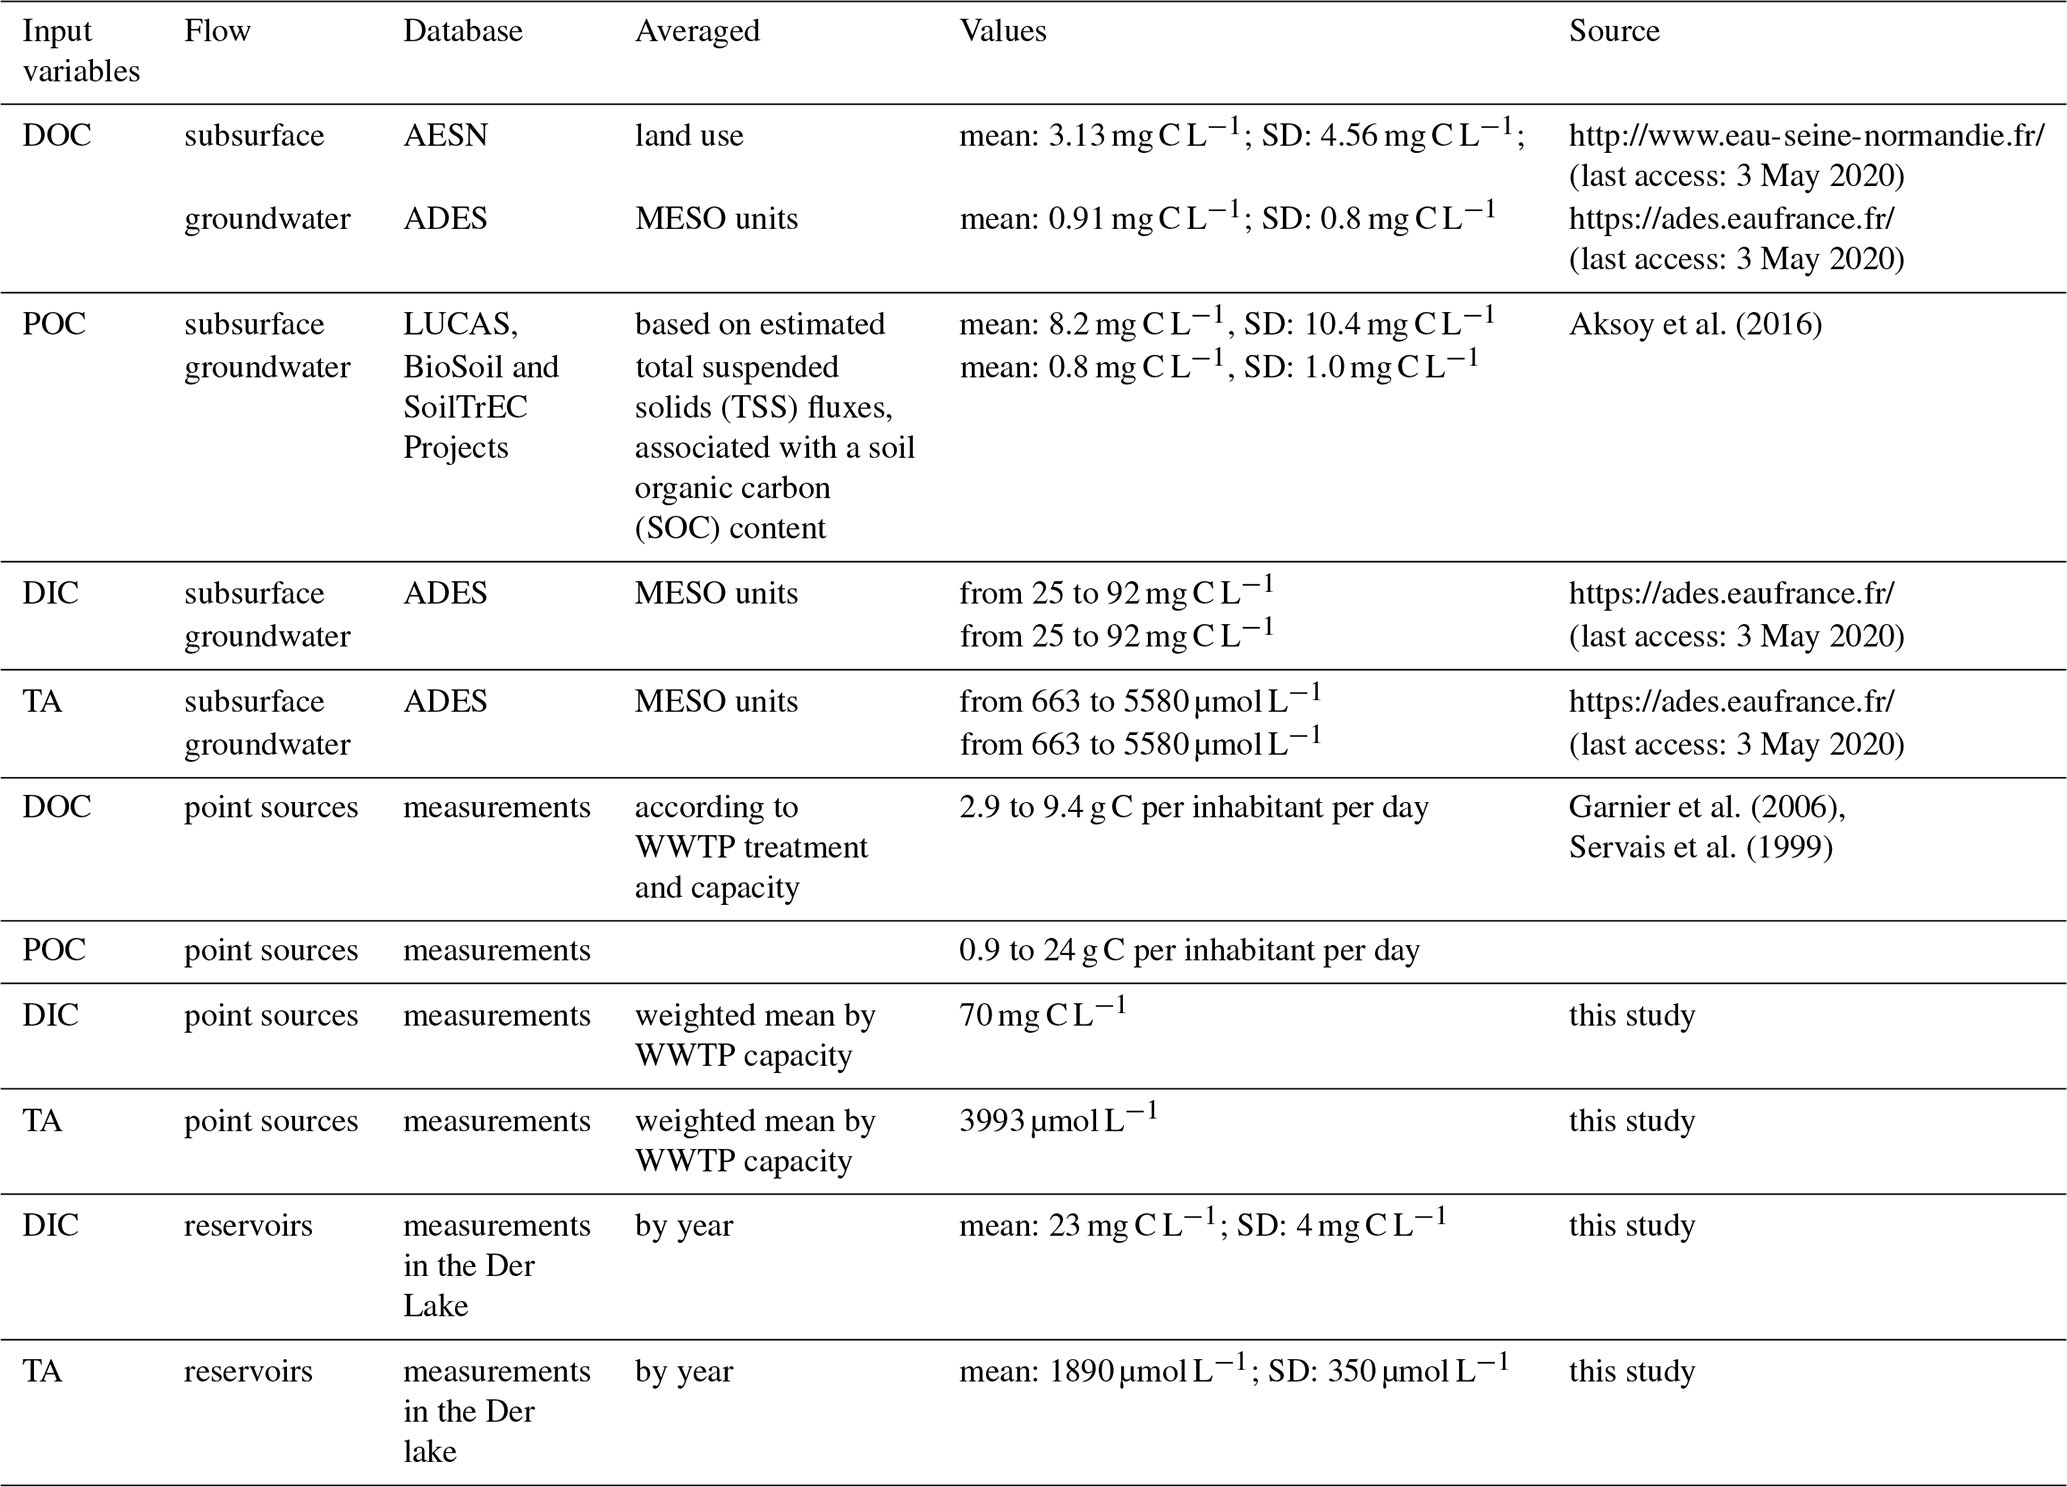
Dissolved organic carbon (DOC) input concentrations were extracted from the AESN database (http://www.eau-seine-normandie.fr/, last access: 11 February 2020) and averaged by land use for subsurface sources (mean: 3.13 mg C L−1; standard deviation (SD): 4.56 mg C L−1; 3225 data for 2010–2013). For groundwater sources, concentrations were extracted from the ADES database (https://ades.eaufrance.fr/, last access: 11 February 2020) and averaged by MESO waterbodies (French name: Masse d'Eau SOuterraine, see Sect. S4; mean: 0.91 mg C L−1; SD: 0.8 mg C L−1; 16 000 data for 2010–2013). These concentrations were separated into three pools of different biodegradability levels, with 7.5 % rapidly biodegradable, 17.5 % slowly biodegradable and 75 % refractory DOC for subsurface sources and 100 % refractory DOC for groundwater flow (Garnier, unpublished).
Total POC inputs were calculated based on estimated total suspended solid (TSS) fluxes, associated with soil organic carbon (SOC) content provided by the LUCAS Project (samples from agricultural soil; Tóth et al., 2013), the BioSoil Project (samples from European forest soil; Lacarce et al., 2009) and the Soil Transformations in European Catchments (SoilTrEC) project (samples from local soil data from five different critical zone observatories (CZOs) in Europe; Menon et al., 2014; Aksoy et al., 2016). TSS concentrations were calculated using fluxes of TSS provided by WaTEM-SEDEM (Borrelli et al., 2018) and runoffs averaged over the 1970–2000 period (SAFRAN-ISBA-MODCOU, SIM; Habets et al., 2008). The POC mean was 8.2 mg C L−1 and its SD was 10.4 mg C L−1 in subsurface runoff, and the groundwater discharge mean was 0.8 mg C L−1 and its SD was 1.0 mg C L−1. The same ratio of DOC reactivity was applied for three classes of POC degradability. The kinetics for POC and DOC hydrolysis and parameters however are different (Billen and Servais, 1989; Garnier et al., 2002).
DIC and TA are brought by subsurface and groundwater discharges (Venkiteswaran et al., 2014). DIC is defined by the sum of bicarbonates (), carbonates () and CO2. Unlike and measured in groundwater on a regular basis by French authorities (ADES, https://ades.eaufrance.fr/, last access: 11 February 2020), CO2 concentrations were not measured in their survey. TA values are also provided in the ADES database.
To calculate DIC concentrations in groundwater, we therefore used our own CO2 measurements, equaling on average 15.92 mg C L−1, with an SD of 7.12 mg C L−1 (55 measurements in six piezometers in the Brie aquifer during 2016–2017) (see methodology in Marescaux et al., 2018a). DIC and TA were averaged for the 48 unconfined hydrogeological MESO units of the basin (see concentrations in Sect. S4) during the recent period (2010–2015), including the simulation period. In Fig. 3, a summary of TA and DIC inputs by MESO units is shown by grouping MESO units according to lithology and geological ages.
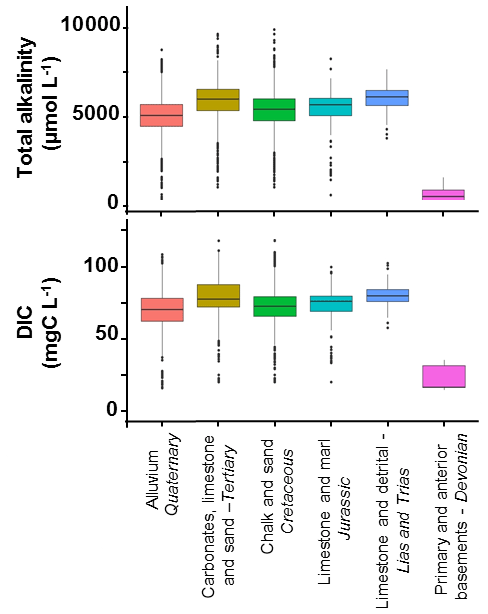
Figure 3Boxplots of total alkalinity (µmol L−1) and dissolved inorganic carbon (DIC, mg C L−1) groundwater concentrations by grouping the MESO units. The lower, intermediate and upper parts of the boxes represent, respectively, the 25th, 50th and 75th percentiles, and the circles represent the outlier values (source: ADES). The color code is the same as the one in S4 spatially representing the MESO units of the basin.
Documenting TA and DIC diffuse sources based on MESO units ensures a representation of their spatial heterogeneity in the Seine River basin. Carbonate waters showed higher TA and DIC mean concentrations while crystalline waters had the lowest mean concentrations in TA and DIC (primary and anterior basements from the Devonian; Fig. 3). Aquifers from the Tertiary and alluvium from the Quaternary had a more heterogeneous distribution of their concentrations (Fig. 3). TA and DIC by MESO units were then spatially averaged at the scale of each modeling unit of the pyNuts-Riverstrahler model (69 modeling units, subdivided according to Strahler ordination; Sect. S2), thus forming a semi-distributed estimate of groundwater concentrations.
TA and DIC measurements in lower-order streams cannot be considered as representative of subsurface concentrations because lower-order streams are expected to degas strongly in a few hundred meters, as shown for N2O by Garnier et al. (2009) and for CO2 by Öquist et al. (2009). We have considered similar concentrations and spatial distribution for subsurface components to those obtained for groundwater (from 25 to 92 mg C L−1 DIC, and from 663 to 5580 µmol L−1 TA; Fig. 3).
Point sources from WWTP effluents
The pyNuts-Riverstrahler model integrates carbon and nutrient raw emissions from the local population starting from the collection of household emissions into sewage networks until their release after specific treatments in WWTPs. In the Seine River basin, most of these releases are adequately treated before being discharged to the drainage network. DOC discharge from WWTPs was described according to treatment type, ranging from 2.9 to 9.4 g C per inhabitant per day while POC discharge ranged from 0.9 to 24 g C per inhabitant per day based on the sample of water purification treatment observed in the Seine basin (Garnier et al., 2006; Servais et al., 1999).
TA and DIC were measured at eight WWTPs selected to reflect various treatment capacities (from 6×10³ to 6×10⁶ inhabitant equivalents) and different treatment types (activated, sludge, Biostyr® Biological Aerated Filter) in the Seine River basin. Sampling and analysis protocols are provided in Sect. S5. This sampling did not allow us to highlight differences in per capita TA and DIC emissions. Consequently, we used a fixed value of 3993 µmol L−1 for TA and 70 mg C L−1 for DIC, which correspond to the weighted mean by WWTP capacity of our measurements and are in agreement with values from Alshboul et al. (2016) found in the literature.
Impact of the reservoirs
Nutrients and organic carbon cycling within the three reservoirs of the Seine River network were simulated using the biogeochemical RIVE model adapted for stagnant aquatic systems (Garnier et al., 1999). Owing to the absence of an inorganic carbon module in the modeling of reservoirs, we used mean measurements of TA and DIC in reservoirs as forcing variables to the river network. The Der lake reservoir was sampled 3 times (24 May 2016, 12 September 2016, 16 March 2017) and, among others, TA and DIC were measured (see Table 3). Recent sampling campaigns showed that TA and DIC are similar for the three reservoirs (Xingcheng Yan, personal communication, 2019).
2.2.3 Observational data
We selected the 2010–2013 timeframe for setting up and validating the new inorganic module. This period includes the year 2011, which was particularly dry in summer (mean annual water discharge at Poses, 366 m3 s−1) and 2013, which was wet (mean annual average water discharge at Poses, 717 m3 s−1) while 2010 and 2012 showed intermediate hydrological conditions (mean annual average water discharges at Poses, 418 and 458 m3 s−1, respectively) (data source: Banque Hydro).
The pCO2 values (ppmv) were calculated using CO2SYS software algorithms (version 25b06; Pierrot et al., 2006) based on existing data collected by the AESN. TA, pH and water temperature datasets were used for the 2010–2013 selected period (8693 records for these three variables, i.e., around 1209 stations distributed throughout the Seine basin, measurements that were taken at a fixed time, 09:00–15:00 UTC, and could not represent diurnal fluctuations). The carbonate dissociation constants (K1 and K2) applied were calculated from Millero (1979) with zero salinity and depending on the water temperature. Because pCO2 calculations from pH and TA can lead to overestimation of pCO2 (Abril et al., 2015), the pCO2 calculated data were corrected by a relationship established for the Seine River and based on pCO2 field measurements (Marescaux et al., 2018b). To compute the interannual average over the 2010–2013 period, data were averaged monthly, then annually at each measurement station and then spatially averaged (i.e., by Strahler orders). Four stations offering sufficient data for the 2010–2013 period were selected for appraising seasonal patterns. They are located along the main stem of the Marne–lower Seine River: Poses (the outlet), Poissy (downstream of the SAV WWTP), Paris and Ferté-sous-Jouarre (upstream of Paris) (Fig. 1a).
All data were processed using R (R Core team, 2015) and QGIS (QGIS Development Team, 2016). Kruskal–Wallis tests were used to compare simulated and measured pCO2 averages.
2.2.4 Evaluation of the model
Root mean square errors normalized to the range of the observed data (NRMSEs) were used to evaluate the pyNuts-Riverstrahler model including the inorganic module, indicating the variability of the model results with respect to the observations, normalized to the variability of the observations. NRMSE analyses were performed on inter-annual variations once every 10 d for the 2010–2013 period, combining observations and simulations at four main monitoring stations along the longitudinal profile of the Seine River: Poses, Poissy (downstream of Paris), Paris and Ferté-sous-Jouarre (upstream of Paris).
3.1 Simulations of spatial and seasonal variations of pCO2
3.1.1 CO2 from lower-order streams to larger sections of the Seine River
Simulations of CO2 concentrations averaged for 2010–2013 by Strahler orders showed that pyNuts-Riverstrahler succeeded in reproducing the general trends of CO2 observations (7565 data) (Fig. 4). Although differences in CO2 concentrations between the different order streams were not significant, their means tended to decrease from lower-order streams (SO1) (width < 100 m) to SO5, and to finally increase in the higher-order streams (width > 100 m) from SO6 to SO7, downstream of the Paris conurbation. Some discrepancy appeared for order 1, with simulations yielding higher values than the observations while for orders 2–7 simulation values were conversely lower than observation values. The corresponding k values calculated for the Seine ranged from 0.04 to 0.23 m h−1 with higher values in the first streams and lower values in larger rivers (not shown), with CO2 outgassing positively related to the k value (Sect. S3.5, Eq. S25).
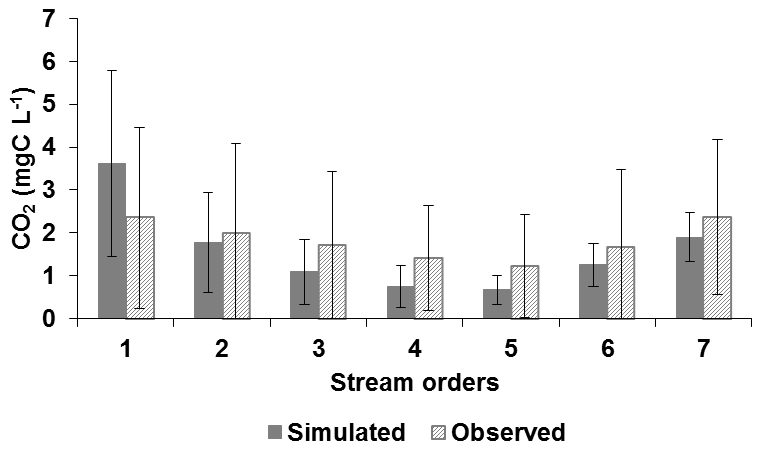
Figure 4Carbon dioxide concentrations in the Seine waters (CO2, mg C L−1) simulated by the pyNuts-Riverstrahler model (dark gray) and observed (light gray ) as a function of the stream order averaged over the 2010–2013 period (whiskers indicating standard deviations).
3.1.2 Profiles of the main stem Marne and lower Seine (at Poses)
In the same period (2010–2013), a focus on the main stem from the Marne River (SO6) until the outlet of the Seine River (Poses, SO7) showed that the model correctly reproduced longitudinal variations. Higher concentrations of CO2 downstream of Paris, and a peak of CO2 concentrations immediately downstream of the SAV WWTP were followed by a progressive decrease until the estuary (Fig. 5). Note that the estuarine CO2 concentrations were specifically modeled by Laruelle et al. (2019), using these outputs of the Riverstrahler simulations.
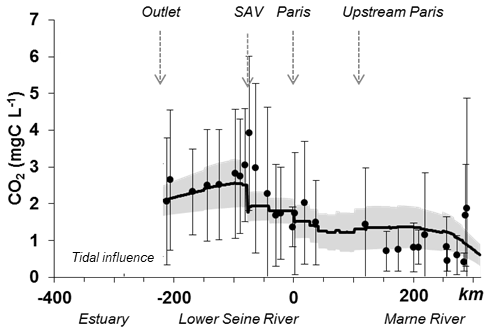
Figure 5Observed (dots) and simulated (line) mean carbon dioxide concentrations (CO2, mg C L−1) along the main stem of the Marne River (kilometer −350 to 0) and the lower Seine River (kilometer 0–350) averaged over the 2010–2013 period. The simulation envelope (gray area) represents standard deviations of simulated CO2 concentrations. Whiskers are standard deviations between observed CO2 concentrations.
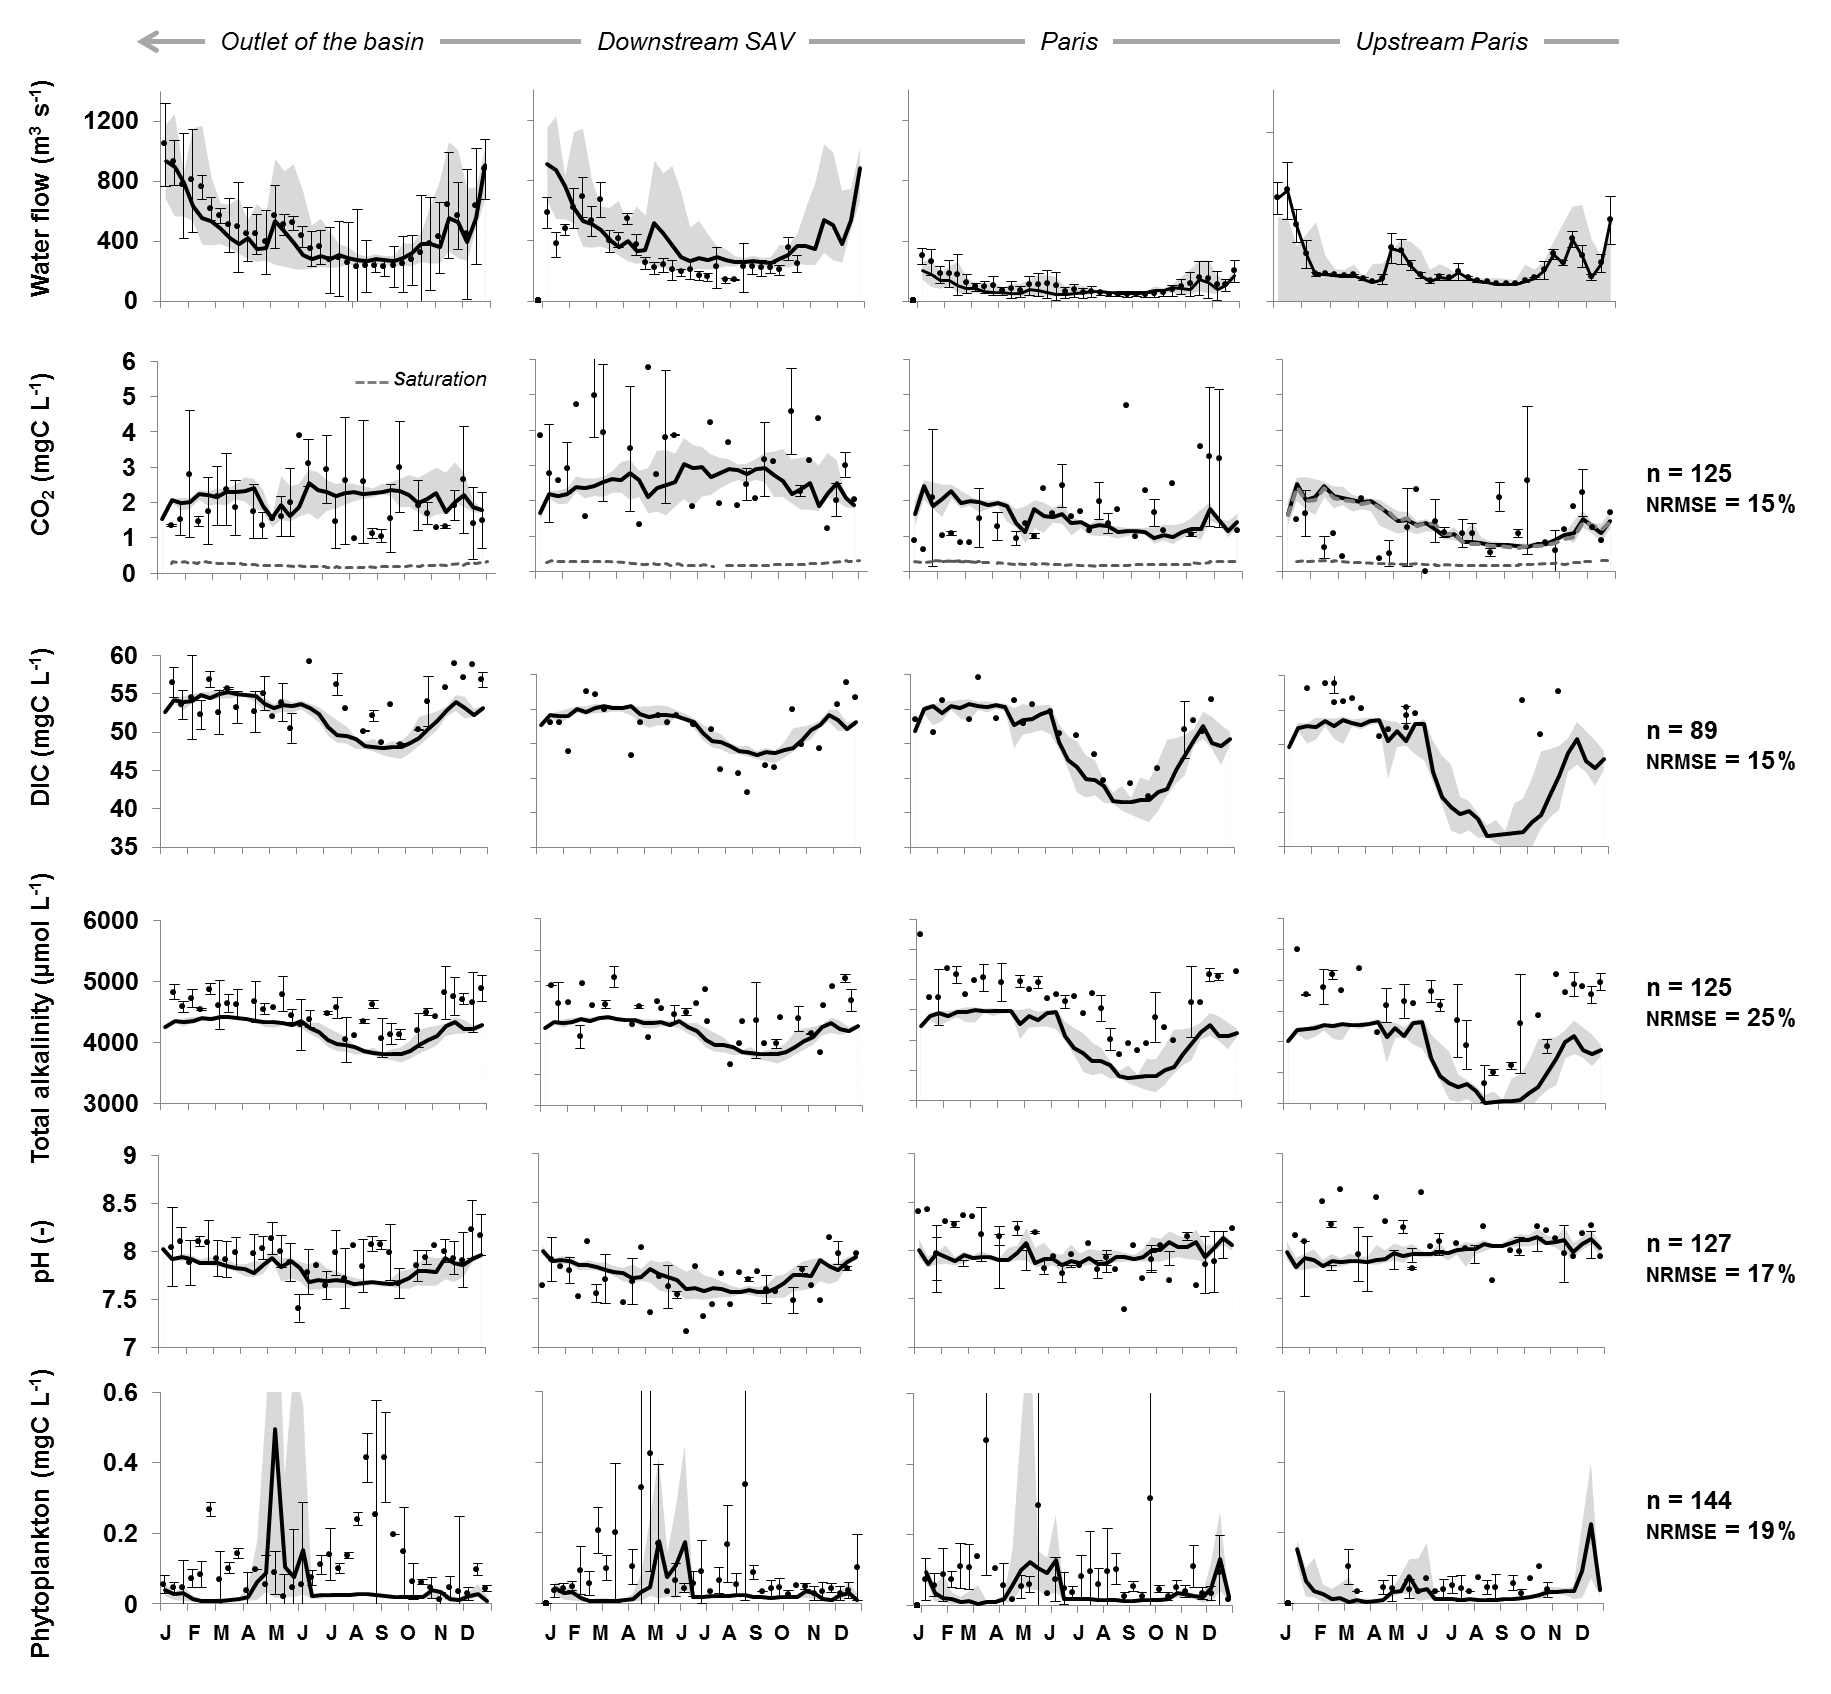
Figure 6The 10-day simulated (lines) and observed (dots) water discharges over the 2010–2013 period (Q, m3 s−1), concentrations of carbon dioxide (CO2, mg C L−1, and CO2 sat, mg C L−1), dissolved inorganic carbon (DIC, mg C L−1), total alkalinity (TA, µmol L−1), pH (–), and phytoplankton (mg C L−1). Four monitoring stations of interest along the main stem of Marne–lower Seine are shown: Ferté-sous-Jouarre (upstream of Paris on the Marne River), Paris on the lower Seine (upstream at Charenton), downstream of the SAV WWTP and at the outlet of the basin (Poses). NRMSE analyses were performed on inter-annual variations per decade for the 2010–2013 period, combining observations and simulations at four main monitoring stations. The simulation envelope corresponds to standard deviations (gray area). For observed data, whiskers are standard deviations.
3.1.3 Seasonal variations
Upstream, within Paris, and downstream of Paris, the model provides simulations in the right order of magnitude of the observed CO2, DIC, TA and pH values, despite the fact that TA was underestimated in the two upstream stations selected for all seasons (Fig. 6). DIC and TA simulations followed the observed seasonal patterns with a depletion of concentrations occurring in summer–autumn related to low-flow support by the reservoirs. Indeed, reservoirs showed lower TA and DIC concentrations than rivers (Table 3). In addition to the intra- and inter-stream order variabilities of CO2 (Fig. 4), CO2 concentrations showed a wide spread in values over the year (Fig. 6). Although simulated CO2 concentrations fitted rather well with the level of the observations (NRMSE = 15 %), the model tended to overestimate the winter values upstream and within Paris (Fig. 6, left).
For DIC, simulations upstream from Paris (Fig. 6, right) seemed lower than the observations (but summer data are missing); however, downstream at the other three stations selected, simulations accurately represented the observations (Fig. 6, NRMSE = 15 %). Seasonal variations of TA were satisfactorily reproduced by the simulations, although they were slightly underestimated by the model at the stations upstream and downstream of Paris (Fig. 6, NRMSE = 25 %). Regarding pH, simulations were in a similar range to the observations (range: 7.5–8.5), and lower summer pH values in the lower Seine were correctly simulated by the model (Fig. 6, NRMSE = 17 %).
Although the level of phytoplankton biomass was adequately simulated, the summer bloom observed at the outlet was not reproduced, whereas the early spring bloom observed in the lower Seine was simulated with a time lag compared to the observations (Fig. 6, bottom, NRMSE = 19 %).
3.1.4 Selection of a gas transfer velocity
The way of taking into account the gas transfer velocity in the modeling approach could explain these discrepancies in SO6 and SO7 (Fig. 4). Different values of k were explored specifically in the downstream part of the Seine river network (SO6 and SO7 where river width exceeds 100 m) (Fig. 7). Indeed, the gas transfer velocity value reported by Alin et al. (2011) was used for streams and rivers up to 100 m wide, as they recommended. Whereas these k values provided adequate simulations in the river up to 100 m wide, for river widths greater than 100 m, we tested different k values. In larger stream orders, we showed that calculations of k according to Eq. (5) of Table 2 by Raymond et al. (2012) induced an outgassing that was too high, while when not using any k value for these larger rivers, the opposite behavior was observed, with no outgassing of CO2.
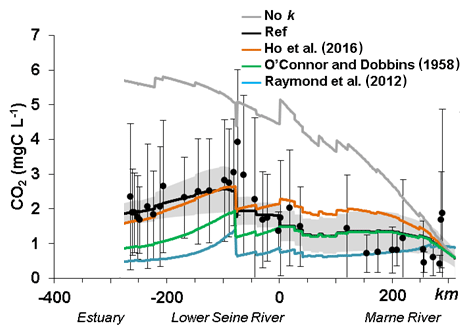
Figure 7Influence of the gas transfer velocity formalisms along the main stem of the Seine River basin (Marne–lower Seine River) impacted riverine CO2 concentrations.
Therefore, for river widths greater than 100 m, a k600 equation based on O'Connor and Dobbins (1958) and Ho et al. (2016), neglecting the term related to the wind, and providing the most accurate CO2 concentrations, was selected (see Sect. S3 for more information on the selection of k and the tests performed).
Although these results can be improved, organic and inorganic carbon and total alkalinity budgets can be calculated at the scale of a whole drainage basin for the first time.
3.2 Alkalinity, inorganic and organic carbon budgets
We established an average inorganic and organic budget for the period studied (2010–2013) (Table 4). The budget of inorganic and organic carbon (IC and OC) of the entire Seine River basin (from headwater streams to the beginning of the estuary) showed the high contribution of external inputs (sum of point and diffuse sources accounted for 92 % and 68 % of IC and OC inputs, respectively) and riverine exports (68 % and 66 % of IC and OC outputs, respectively). These exports were at least 1 order of magnitude higher for the IC budget (Table 4). The substantial contribution of the Seine aquifer water flow led the IC flux brought by groundwater to dominate over those from the subsurface (57.5 % vs. 34 % of total IC inputs, respectively), while for OC, the subsurface contributions were higher than the groundwater contributions (54 % vs. 14 % of the total OC fluxes).
Table 4Budget of the Seine hydrosystem for inorganic and organic carbon (kg C km−2 yr−1) and total alkalinity (TA, mol km−2 yr−1) as calculated by the pyNuts-Riverstrahler model averaged over the period 2010–2013. a TA input related to NPP refers to the net difference between TA produced by photosynthesis on NO3 uptake and photosynthesis on NH4 uptake (reducing alkalinity). b Net sediment loss is the difference between the erosion and the sedimentation calculated by the model.
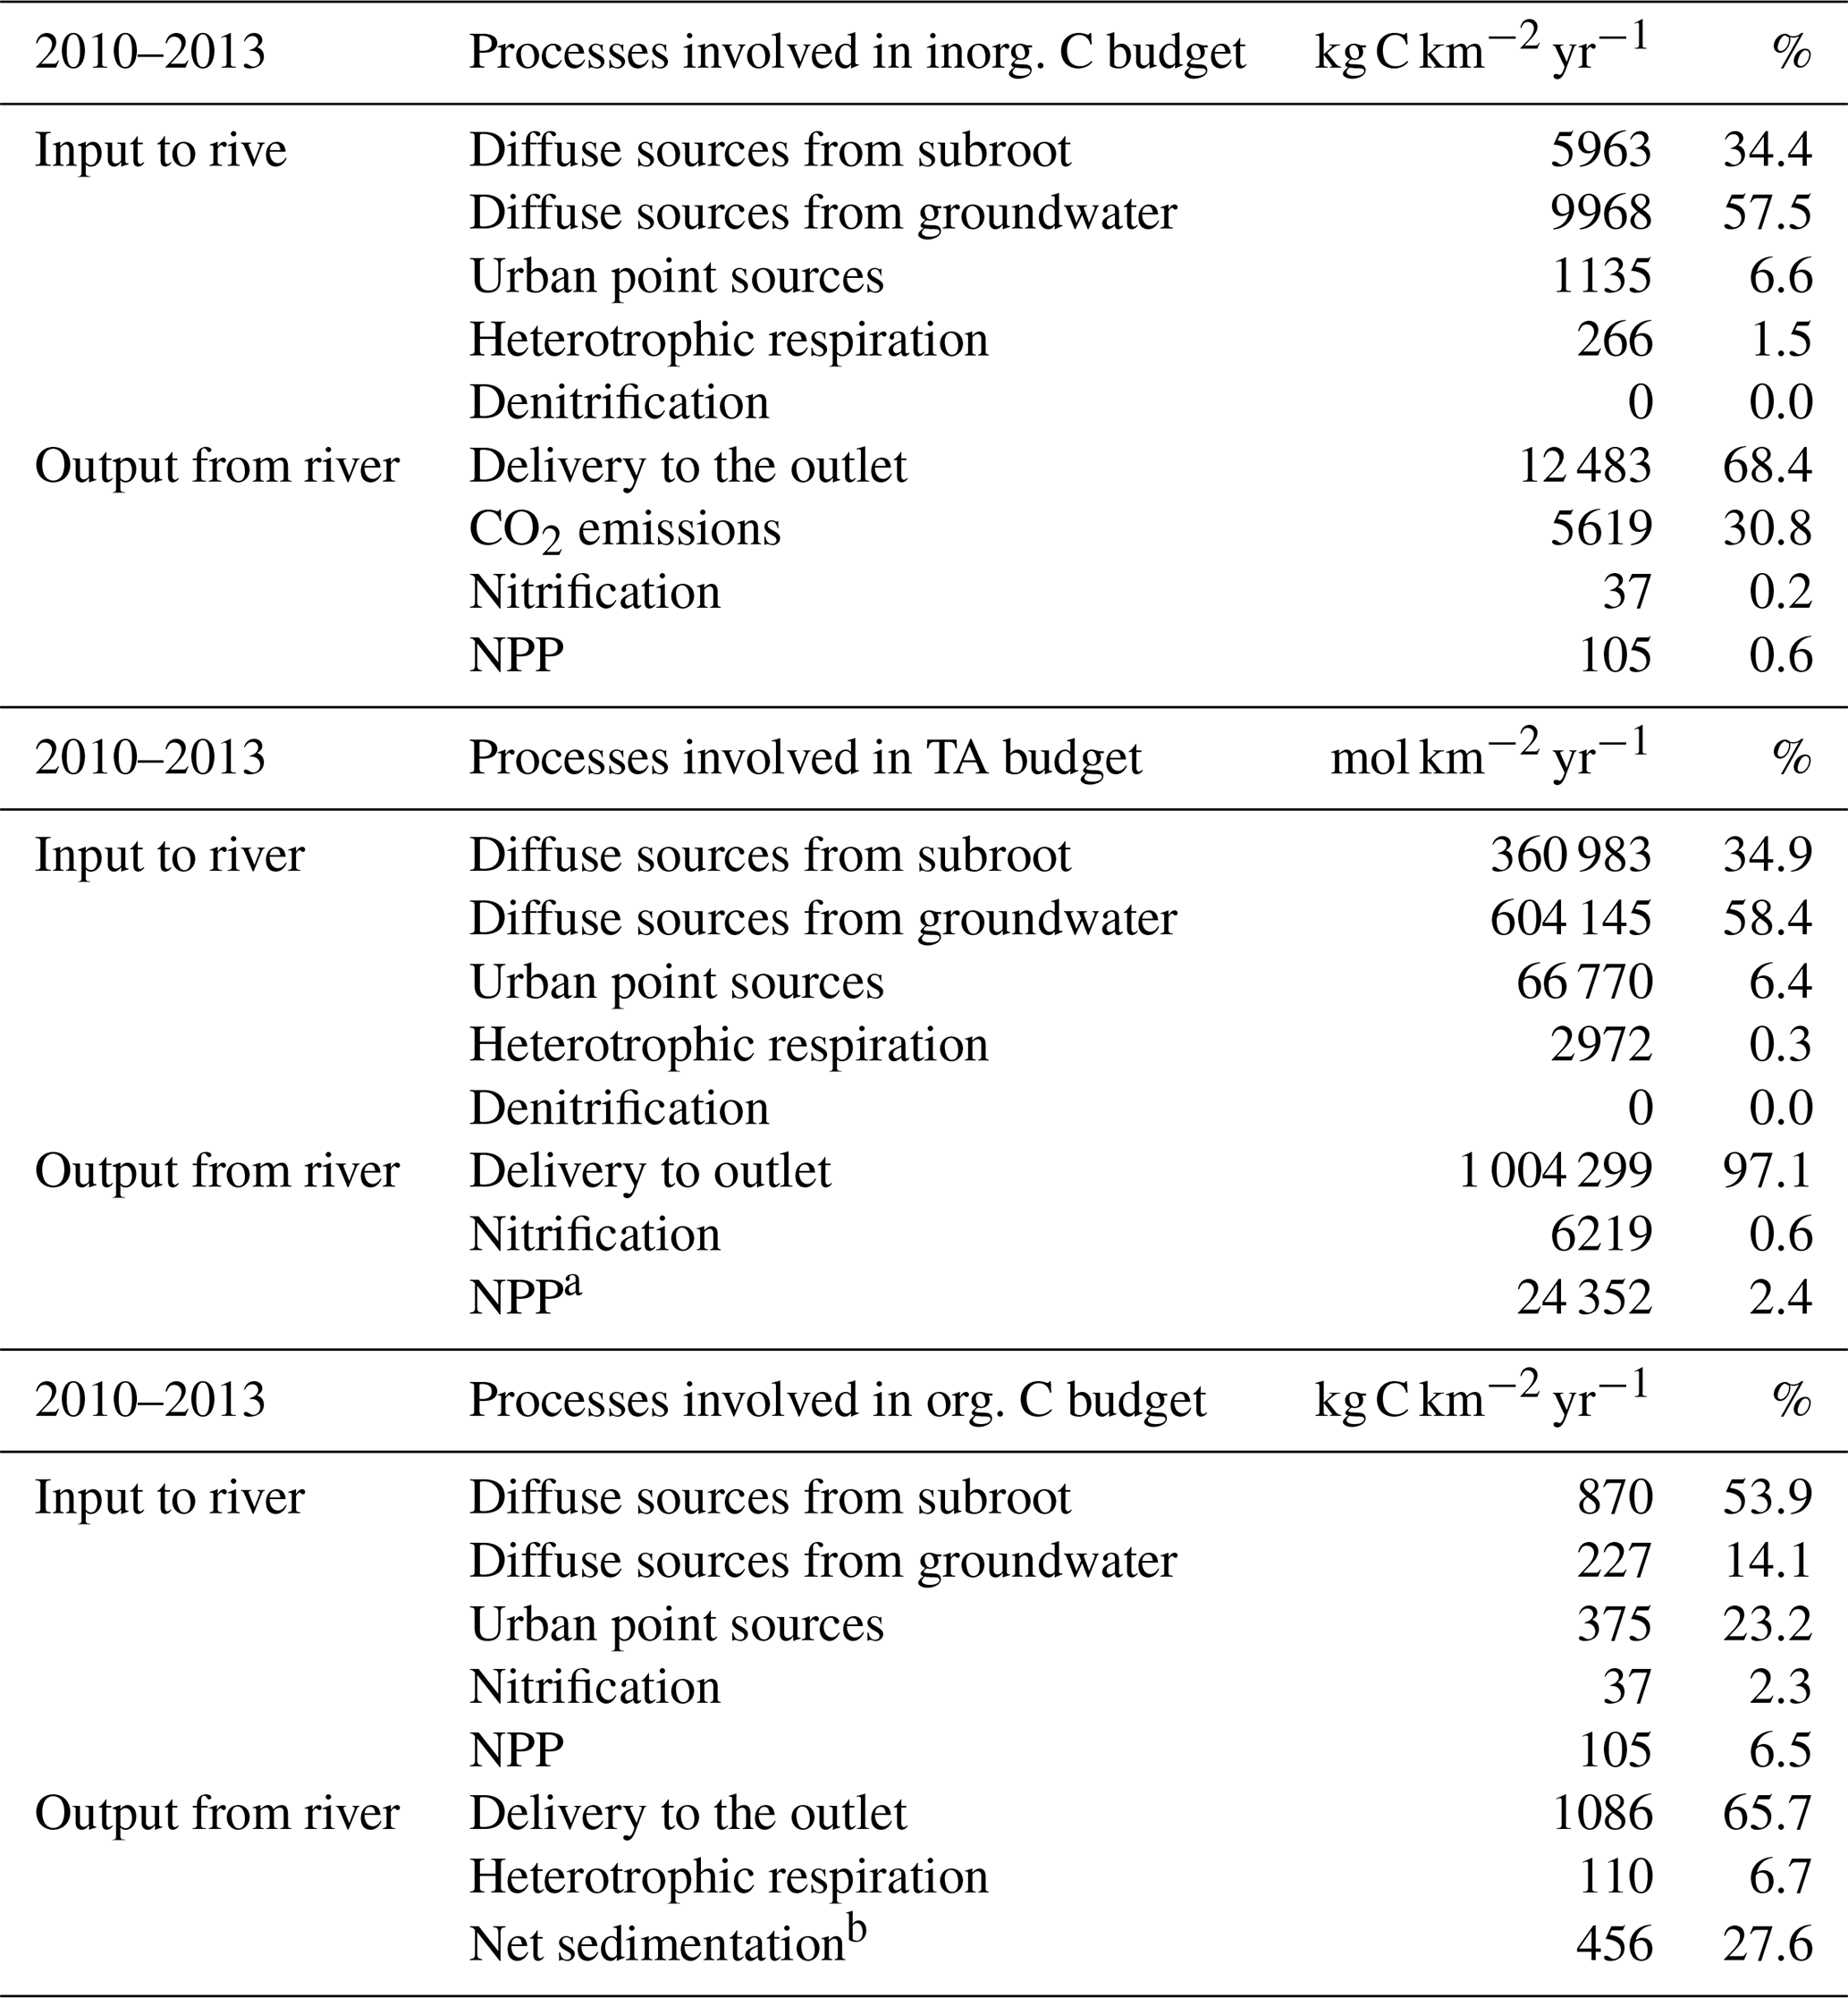
Interestingly, the relative contributions of point sources to OC inputs were higher than for IC (23 % and 7 % of the OC and IC inputs, respectively) (Table 4).
Heterotrophic respiration by microorganisms accounted for only 1.5 % of the IC inputs. Similarly, IC losses by net primary production also accounted for a small proportion, i.e., 0.6 %, of the IC inputs. For the OC budget, despite a contribution of autochthonous inputs from instream biological metabolisms (net primary production, NPP, and nitrification: 9 % of inputs; heterotrophic respiration: 7 %), which was relatively high compared with their proportion in IC fluxes (2.3 %), allochthonous terrestrial inputs still dominated the OC budget (Table 4).
The Seine River, at the outlet, exported 68 % of the IC entering or produced in the drainage network, and 66 % of the OC brought to the river (including both particulate and dissolved forms) (Table 4). Instream OC losses were related to heterotrophic respiration (7 %) and to a net transfer to the benthic sediment compartment, including sedimentation and erosion processes (estimated at 28 % of losses). In the IC budget, CO2 emissions were a substantial physical process (31 % of the overall losses) (Table 4).
A similar calculation was performed for the TA budget. As for inorganic carbon, the contribution of internal processes remained relatively low compared with the high levels of TA in lateral inputs (diffuse sources: 93 %; point sources: 6 %) and flows exported to the basin outlet (97 %). Indeed, instream production mostly relied on heterotrophic respiration (<1 %) while denitrification was negligible. Photosynthesis might also produce or consume alkalinity whether or is the preferential N source of phytoplankton's uptake, but in our budget it resulted in our budget in a net TA reduction (2 %), while nitrification also contributed to less than 1 % of TA output.
3.3 Carbon aquatic processes
Whereas IC and OC budgets of the Seine hydrosystem were clearly dominated by external terrestrial inputs and outputs through deliveries at the coast, an attempt was made here to analyze instream processes involved in the IC and OC cycles (Figs. 8 and 9).
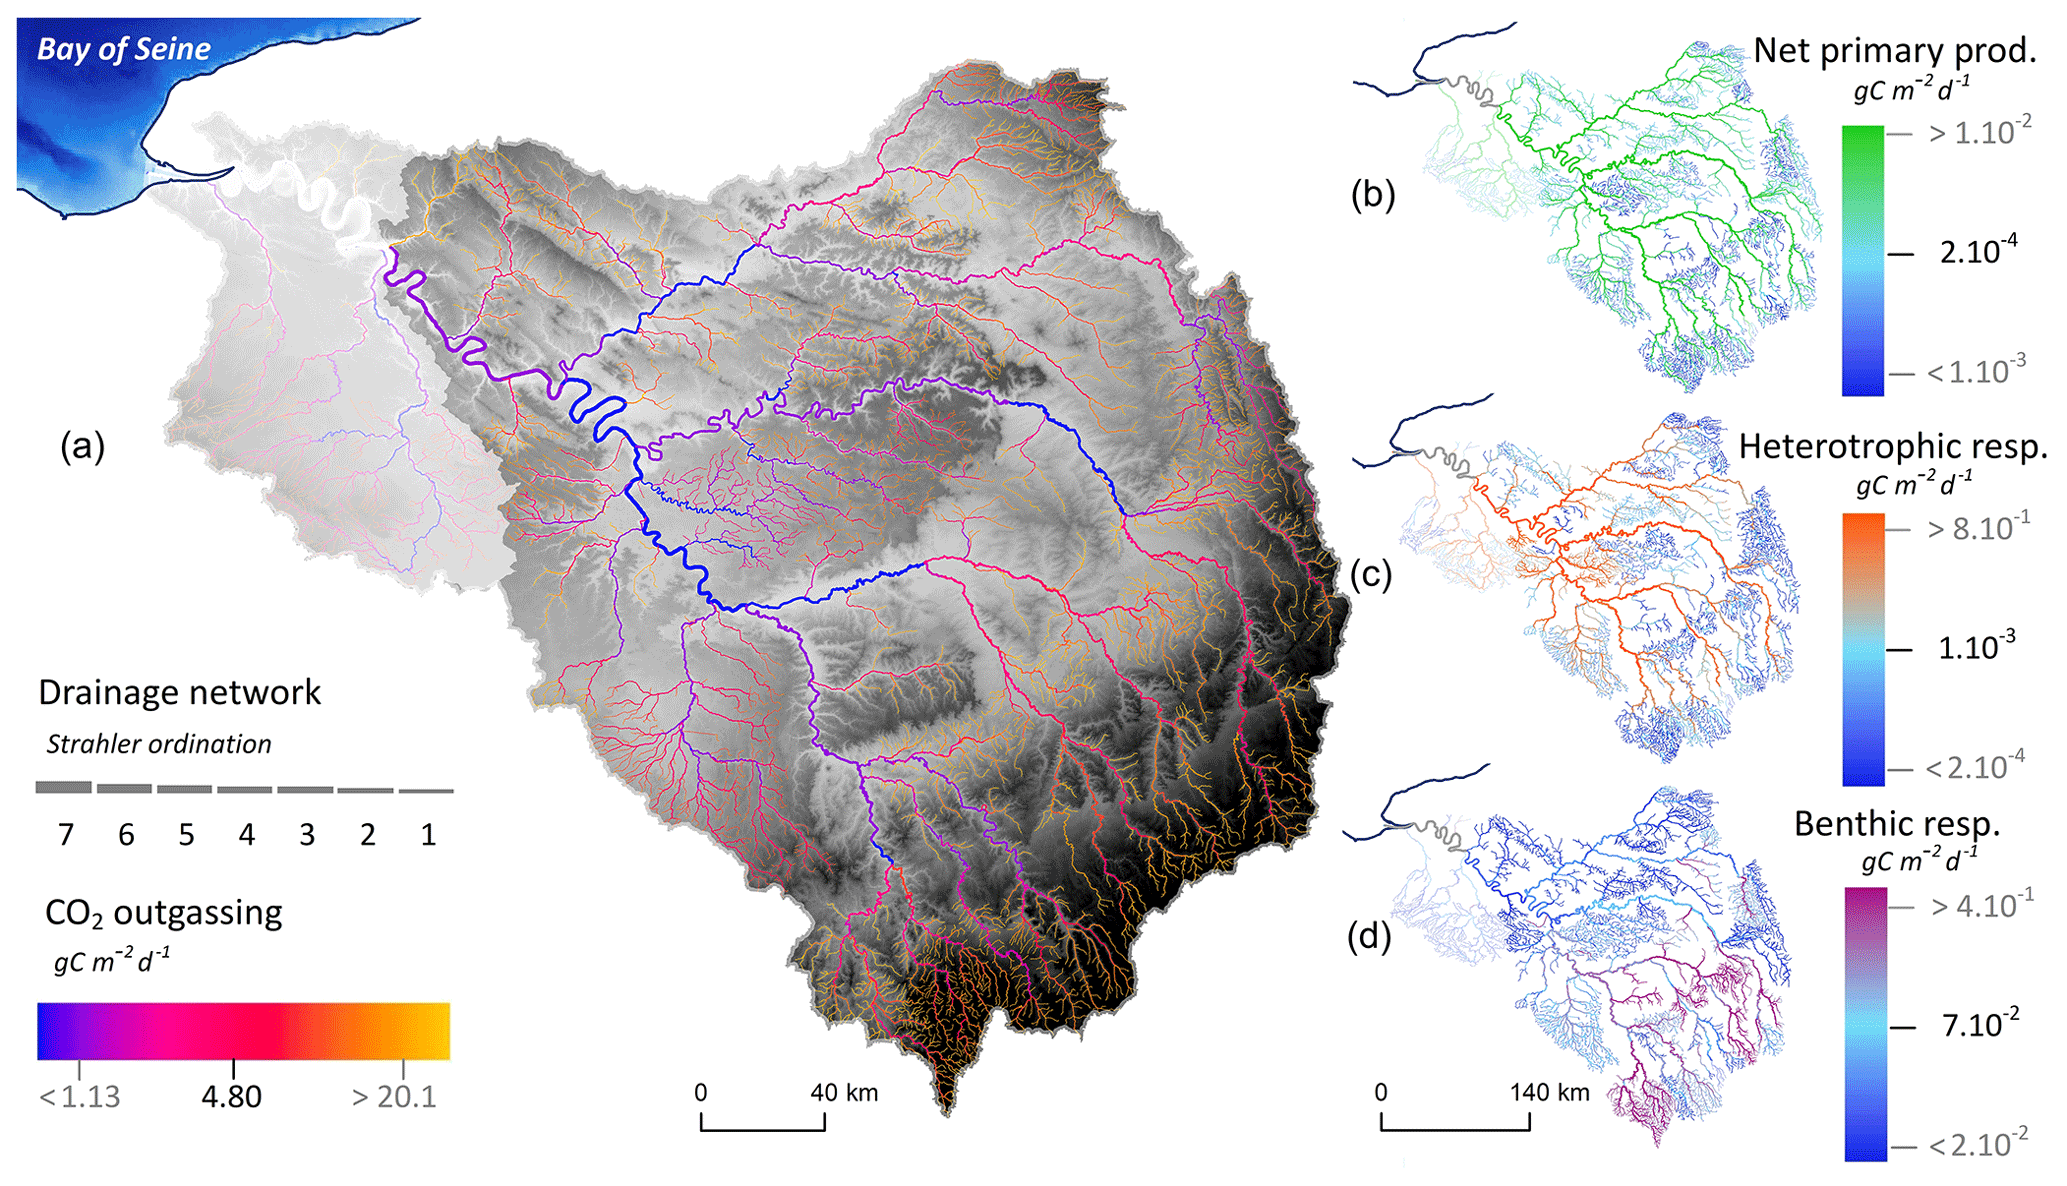
Figure 8Instream processes involved in the inorganic carbon cycle simulated by pyNuts-Riverstrahler and averaged over the 2010–2013 period for the Seine River network until its fluvial outlet at Poses. (a) CO2 outgassing (blue–yellow, g C m−2 d−1), (b) net primary production (blue–green, g C m−2 d−1), (c) heterotrophic planktonic (blue–violet), and (d) benthic respiration (blue–orange, g C m−2 d−1) are represented in the hydrographic network.
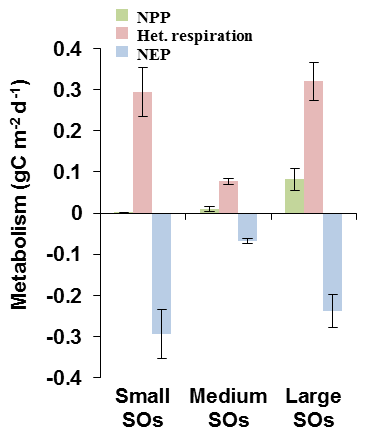
Figure 9Metabolism for small, intermediate and large stream orders (SO) (here represented by SO1, SO5 and SO7, respectively) of the Seine basin simulated by pyNuts-Riverstrahler and averaged over the 2010–2013 period: net primary production (NPP, g C m2 d−1), heterotrophic respiration (het. respiration, g C m2 d−1), net ecosystem production (NEP, g C m2 d−1).
The average spatial distribution of IC processes, as calculated by the model, was mapped for the 2010–2013 period (Fig. 8). Benthic activities were the greatest in smaller streams. By contrast, net primary production and heterotrophic planktonic respiration, which both followed a similar spatial pattern, increased as Strahler order increased, reaching their highest values in the lower Seine River. All these biological processes involved in the IC cycle were therefore highly active in the main stem of the river, while on the other hand CO2 outgassing occurred mainly in the basin's small headwater streams (Fig. 8).
Regarding the OC processes, mostly linked to biological activity, they were analyzed in terms of ecosystem metabolism (Fig. 9). The net ecosystem production (NEP, g C m−2 d−1) is defined as follow:
where NPP is the net primary production (g C m−2 d−1) depending on the growth of phytoplankton. NPP contributes to building phytoplankton biomass that constitutes a stock of organic carbon, emitted in turn as CO2 by respiration (het. respiration, g C m−2 d−1).
Simulations showed that NEP would remain negative in the entire drainage network (Fig. 9). However, NEP must be analyzed with caution since the phytoplankton pattern was not adequately represented (see Fig. 6). In SO1, this negative NEP was associated with almost no NPP, and heterotrophic respiration was dominated by benthic activities (see Fig. 8). In SO5, NEP was less negative than in SO1 (Fig. 9), and heterotrophic respiration was lower than in SO1 while NPP was higher. In the lower Seine River (SO7), NPP increased as did heterotrophic respiration, which reached its highest value in this downstream stretch receiving treated effluents from WWTPs. Therefore, the increase in NPP did not result in positive NEP. The entire drainage network was thus supersaturated in CO2 with respect to atmospheric concentrations and constituted a source of CO2. This supersaturation was the highest in smaller orders, lower in intermediate orders and increased again in the lower Seine River (Fig. 4, see also Fig. 8).
4.1 Evaluation of the model
Simulated CO2 concentrations tend to be higher than observed ones for SO1. These differences may be related to the high variability of CO2 in SO1, and the scarcity of measurements in spring. However, Öquist et al. (2009) estimated that up to 90% of daily soil DIC import into streams was emitted to the atmosphere within 200 m. Such a CO2 emission pattern can be applied to the Seine, as a similar result was found for N2O (Garnier et al., 2009). Since soil emissions were very difficult to capture, we considered that concentrations in groundwater (DIC and TA) closely reflect the composition of diffuse sources, much like soil composition. This assumption probably underestimates the DIC∕TA ratio brought to the river in lower-order streams. Differently from SO1, simulated concentrations in SO2–7 are lower than the observed values (Fig. 4). Overall, the NRMSE indicating a percentage of variation was less than 20 %, except for TA (25 %).
Regarding gas transfer velocity values, an equation for large rivers with no tidal influence using wind speed could be more appropriate (Alin et al., 2011) and could decrease NRMSE in these downstream sections of the river. However, the Riverstrahler model does not consider wind as an input variable, which would have required the model to have a much higher spatiotemporal resolution to reflect its spatiotemporal heterogeneity in the Seine basin, with for example the diurnal cycle affected by phenomena such as breezes (Quintana-Seguí et al., 2008).
Future work with direct k measurements and/or a new representation of k values in the model could help improve outgassing simulations with pyNuts-Riverstrahler. A test of different k formulations on high stream orders (width > 100 m) representing only 1.5 % of the length of the river system showed an increase in the total CO2 outgassing estimates by up to 6.2 %. Our model is k sensitive and our estimates differ from the results of Lauerwald et al. (2017), who observed that a large variation in k does not lead to a significant change in simulated aquatic CO2 emissions. For the Seine River here, we indeed used a more accurate k value calculated at each time step (10 d) and at every kilometer of the river network (according to water temperature, velocity and depth). In addition, a huge organic carbon load is brought by WWTPs in this Seine urbanized hydrosystem that disrupts carbon dynamics (e.g., WWTPs treating 12 million inhabitant equivalents in the Parisian conurbation) in the downstream part of the Seine River, in contrast to simulations on a natural network (Lauerwald et al., 2017).
Regarding seasonal patterns, DIC and alkalinity amplitudes were suitably captured and the level of the values was correct. DIC and TA observations showed a strong decrease from June–July to November (maximum amplitude decrease, 10 mg C L−1 and 1000 µmol L−1), as illustrated by the model. For the Seine River, the water flow decrease in summer was mainly related to the decrease in runoff water, meaning that the groundwater contribution was comparatively higher at this time. According to our measurements, these groundwaters were more concentrated in TA, DIC and CO2 than runoff water. However, water released by upstream reservoirs (supporting low flow in the downstream section of the Seine network) accounts for a significant proportion of the river discharge during summer and was characterized by lower TA, DIC and CO2 concentrations. Then the decrease observed was related to the contribution of reservoirs. These results strongly encourage the implementation of an inorganic carbon module in the modeling of reservoirs, already coupled with Riverstrahler for nutrients and organic carbon (Garnier et al., 1999).
The model showed a weak performance in representing CO2 seasonality. Referring to a previous study (Marescaux et al., 2018b), pCO2 seasonality in the Seine River resulted from a combination of water temperature and hydrology leading to an increase in pCO2 and CO2 evasion fluxes from winter to summer–autumn. The pyNuts-Riverstrahler model, however, has an accurate representation of these constraints and would not account for these discrepancies. Also, despite the fact that the biomass level of phytoplankton was consistent with the observations, the seasonal pattern was not satisfactorily reproduced by the model. However, it is worth mentioning that phytoplankton parameters in RIVE were determined through laboratory experiments at a time when the amplitude of algal blooms was much higher than at present (up to 4.5–6 mg C L−1, i.e., chlorophyll a reaching 150 µg Chl a L−1; Garnier et al., 1995). Indeed, the implementation of the European Water Framework Directive in the 2000s with enhancement of treatments in WWTPs greatly improved water quality (Romero et al., 2016). New laboratory experiments for possibly taking into account additional phytoplankton groups or species in these new trophic conditions and/or mixing of stochastic and mechanistic modeling are required to better represent phytoplankton temporal dynamics in the model. In addition, the observed incident light, instead of the empirical relationship used, would improve the early winter bloom, newly occurring in a changing environment.
4.2 Export fluxes
The new implementation of an inorganic carbon module in the pyNuts-Riverstrahler model allows us to estimate CO2 outgassing of the Seine River at 364±99 Gg C yr−1 (1.4 Gg C km−2 yr−1 taking into account a river surface area of 260 km2). This is significantly lower than our previous estimate of 590 Gg C yr−1 (2.2 Gg C km−2 yr−1 from a river surface area of 265 km2) using CO2 measurements only (Marescaux et al., 2018a). This difference is explained by various factors. Marescaux et al. (2018a) used k formulates according to Raymond et al. (2012, Eq. 5 in Table 2) all along the Seine drainage network and, consequently, the value of CO2 emissions was most likely overestimated (see Sect. 4.1). We also acknowledged that the CO2 outgassing estimate yielded by simulations might slightly underestimate emissions overall with respect to Fig. 4, which showed that our simulated CO2 concentrations were overestimated for SO1 but underestimated for SO2 to SO7. In the model, a better spatiotemporal resolution and more accurate descriptions of the water temperature, the water velocity and the k value adopted here, along with different k values for low and high stream orders, would be associated with less outgassing than in our previous study. For these reasons, we believe that our estimate of 364±99 Gg C yr−1, using our process based model, is a more accurate value of CO2 emissions from the Seine River.
The outgassing found for the Seine River by the surface area of the river of 1400±381 g C m−2 yr−1 is in the middle range of the average estimates of outgassing from temperate rivers (70–2370 g C m−2 yr−1), including the St. Lawrence River (Yang et al., 1996), Ottawa River (Telmer and Veizer, 1999), Hudson River (Raymond et al., 1997), US temperate rivers (Butman and Raymond, 2011) and Mississippi River (Dubois et al., 2010). This high variability for these temperate rivers is strongly dependent on whether or not the first-order streams were considered in the outgassing. Similar to our study, Butman and Raymond (2011) took into account lower-order streams and rivers while lower estimates correspond to studies investigating large rivers, excluding lower-order streams. Indeed, outgassing are often greater in headwater streams than in large rivers owing to higher CO2 concentrations and headwater streams have higher gas transfer velocities (Marx et al., 2017; Raymond et al., 2012). The mapping of CO2 outgassing in the Seine basin clearly showed these spatial trends, with smaller streams releasing more CO2 than median and larger rivers (see Fig. 8). Indeed, first-order streams of the Seine River represent 9.6 % of the Seine surface area and contributed to 40 % of the total CO2 emissions by the river network.
Regarding organic carbon, Meybeck (1993) estimated the DOC export to the ocean for a temperate climate at 1.5 g C m−2 yr−1, a value that is higher than our OC estimate of 1.1 g C m−2 yr−1 for the Seine River basin, before entering the estuarine section. Compared with other temperate rivers, the rivers of the northern France, and specifically the Seine River here, are rather flat, their low altitude limiting erosion (Guerrini et al., 1998). In addition, since the implementation of the European Water Framework Directive in the 2000s, decreasing nutrients and carbon in wastewater effluents discharged into the rivers (Rocher and Azimi, 2017), together with a decrease in phytoplankton biomass development (Aissa-Grouz et al., 2018; Romero et al., 2016), can explain this difference in DOC fluxes for the Seine, a change probably valid for many other western European rivers (Romero et al., 2013). Furthermore, the CO2∕OC ratio of the export to the estuary of the Seine hydrosystem is 5.2, which is higher than this ratio for the Mississippi River, for example (4.1; Dubois et al., 2010; Li et al., 2013), and may be related to considerable outgassing from headwater streams taken into account in our study. Note, however, that the small Seine River basin exports only 70±99 Gg C yr−1 OC compared with the large Mississippi River with exports amounting to 2435 Gg C yr−1 OC (Dubois et al., 2010), and with a surface area more than 40 times greater than the Seine. Interestingly, the Seine River export was estimated at three times less than the export calculated in 1979 (250 Gg C yr−1; Kempe, 1984). This difference in DOC concentrations in the Seine River would be 2.8 times lower than in the 1990s (Rocher and Azimi, 2017).
We estimated the DIC export of the Seine River at 820±220Gg C yr−1, a value higher than basins of the same size or even larger (e.g., the Ottawa River, with a drainage area of 149 000 km2, showed a DIC export at 520 Gg C yr−1; Telmer and Veizer, 1999; Li et al., 2013). The high concentrations of in the Seine basin already documented and related to the lithology of the Seine basin (limestone and gypsum beds from Cretaceous and Tertiary) (Kempe, 1982; 1984) may explain this high export to the river outlet. With both high CO2 and DIC exports, the ratio of CO2∕DIC exports from the Seine River is the same as the overall ratio here (0.5; Li et al., 2013).
4.3 Metabolism
Model simulations with the new inorganic carbon module can be used to analyze spatial variations of CO2 in regard to instream metabolism activities. We observe that the influence of the metabolism activities on the CO2 outgassing is low. Indeed, in the carbonated Seine River, the IC originating from groundwater supports the CO2 outgassing along the network (Fig. 8). Nevertheless, instream metabolism activities produce or consume CO2.
The model highlights the importance of benthic activities in headwater streams (Fig. 8) that decreased downstream as heterotrophic planktonic activities increased in larger rivers, a typical pattern described by the river continuum concept (RCC; Vannote et al., 1980) and quantified for the Seine River (Billen et al., 1994; Garnier et al., 1995; Garnier and Billen, 2007). These results are also in agreement with those reported by Hotchkiss et al. (2015), who suggested that the percentage of CO2 emissions from metabolism increases with stream size while CO2 emissions of lower-order streams are related to allochthonous terrestrial CO2. Regarding headwater streams, Battin et al. (2009b) described benthic activities as the highest (as also observed in our study; Fig. 8) where microbial biomass is associated with streambeds characterized by exchanges with subsurface flow bringing nutrients and oxygen and increasing mineralization.
Mean NEP would remain negative in the entire basin, resulting from heterotrophic conditions producing CO2 (Figs. 8 and 9). However, even though the level of phytoplankton biomass was correctly simulated, the summer downstream bloom, which was not reproduced by the model, could lead to some NPP underestimation. As expected, NPP in lower-order streams was lower than in higher SOs owing to shorter water residence times. Benthic respiration of lower-order streams was significant (Fig. 8) and made NEP highly negative. Also, small SOs were the most concentrated in CO2 owing to the groundwater contribution. Intermediate stream orders showed the smallest CO2 or heterotrophic respirations with NEP less than −0.1 g C m−2 d−1. This can be explained by an increase in NPP due to a lower dilution rate than the phytoplankton growth rate (Garnier et al., 1995), and to a reduced ratio of the bottom sediment-to-water column volume, decreasing heterotrophic respiration. In higher-order streams both NPP and heterotrophic respiration were the highest; however, they led to negative NEP lower than SO1 (Figs. 8 and 9). Despite photosynthesis reducing the CO2 concentrations (Fig. 6), the highest SOs were affected by wastewater effluents, resulting in an overall negative NEP.
During the recent 2010–2013 period studied herein, and in all SOs, the NPP never exceeded heterotrophic respiration (ratio of NPP to het. resp less than 1 or ) (Fig. 9). Whereas in the past the eutrophication of the Seine River led to a P:R ratio greater than 1 in large rivers, at least during spring blooms, with P and R values increasing up to 2.5 g C m−2 d−1 (Garnier and Billen, 2007), the P:R ratio is now systematically less than 1. These changes, linked to an overall decrease in biological metabolism, are explained by improvements of treatments in WWTPs decreasing the organic carbon load discharged into rivers and the associated pollution, and hence decreasing the CO2 concentration along the main stem of the Seine River (Marescaux et al., 2018b). Besides DOC, improvements in wastewater treatments also reduced nutrient inputs to the river, especially phosphates, today a limiting nutrient to algal development in SO5 and 6, reducing algal peaks by a factor of 3.
The pyNuts-Riverstrahler model of biogeochemical river functioning now includes the processes involved in the inorganic carbon cycle in order to represent the spatial dynamics and seasonal variations of CO2 concentrations and outgassing along the Seine hydrosystem. The sensitivity of simulations to different gas transfer velocity values highlighted the need for additional refinement for the Seine River so as to choose the best model equation. In addition, revisiting the phytoplankton description in the model could facilitate a better simulation of the temporal dynamics of phytoplankton. Further, an explicit representation of the anaerobic reduction chain of the benthos could enable us to specify the benthic impact on TA and DIC in a greater variety of ecosystems.
CO2 concentrations appear to be controlled differently along the Seine hydrosystem. In small orders, concentrations were mainly driven by diffuse sources. In larger rivers, in addition to the influence of groundwater and low-flow support by upstream reservoirs, concentrations showed patterns linked to hydrosystem metabolisms. Indeed, blooms tended to decrease CO2 concentrations, although the hydrosystem remained heterotrophic and supersaturated with respect to the atmospheric CO2 concentrations. Heterotrophic respiration increased CO2 concentrations with peaks downstream of WWTP effluents enriched in organic carbon.
Our Riverstrahler modeling has shown that there are many factors that control CO2 emissions in basins affected by human activity along an aquatic continuum. Once validated by field measurements, which are still too scarce, this generic modeling approach can be applied to any drainage system to better quantify lateral CO2 emission on a continental scale.
The datasets generated during the current study are available from the corresponding author on reasonable request.
The supplement related to this article is available online at: https://doi.org/10.5194/hess-24-2379-2020-supplement.
All the authors contributed to the design of the study. JG and VT are co-supervisors of the PhD. AM participated as a PhD student in the field campaigns, lab chemical analyses and implementation of the new inorganic carbon module. NG and MS provided technical and scientific support for the modeling. AM wrote the first draft of the manuscript, and all the co-authors helped to interpret the data and write the article.
The authors declare that they have no conflict of interest.
The project leading to this paper received funding from the European Union's Horizon 2020 research and innovation program under the Marie Sklodowska-Curie grant agreement no. 643052. A PhD grant was attributed to Audrey Marescaux. Many thanks are due to Sébastien Bosc, Anunciacion Martinez Serrano and Benjamin Mercier for their kind participation in the fieldwork and for their assistance with chemical analyses in the lab. We thank Emmanuel Soyeux (Veolia Water, France), Muriel Chagniot (Veolia Water, France), and the operators of the Veolia WWTPs for their precious help in organizing the field campaigns. The SIAAP (Vincent Rocher) is also sincerely acknowledged for their contribution to sampling the largest WWTP of the Paris conurbation and the long-term view on treatments in the SIAAP WWTPs provided by their recent book (Rocher and Azimi, 2017). Vincent Thieu (assistant professor at Sorbonne University, Paris) and Josette Garnier (Research Director at the Centre National de la Recherche Scientifique, France) are co-supervisors of the PhD. Nathalie Gypens is Professor at the Université Libre de Bruxelles (Belgium). Marie Silvestre is GIS Engineer at the Centre National de la Recherche Scientifique (France).
This research has been supported by the Marie Sklodowska-Curie grant (grant no. 643052).
This paper was edited by Anas Ghadouani and reviewed by three anonymous referees.
Abril, G., Bouillon, S., Darchambeau, F., Teodoru, C. R., Marwick, T. R., Tamooh, F., Ochieng Omengo, F., Geeraert, N., Deirmendjian, L., Polsenaere, P., and Borges, A. V.: Technical Note: Large overestimation of pCO2 calculated from pH and alkalinity in acidic, organic-rich freshwaters, Biogeosciences, 12, 67–78, https://doi.org/10.5194/bg-12-67-2015, 2015.
Aissa-Grouz, N., Garnier, J., and Billen, G.: Long trend reduction of phosphorus wastewater loading in the Seine: determination of phosphorus speciation and sorption for modeling algal growth, Environ. Sci. Pollut. Res., 25, 23515–23528, https://doi.org/10.1007/s11356-016-7555-7, 2018.
Aksoy, E., Yigini, Y., and Montanarella, L.: Combining soil databases for topsoil organic carbon mapping in Europe, PLoS One, 11, 1–17, https://doi.org/10.1371/journal.pone.0152098, 2016.
Albinet, M. : Piézométrie moyennes eaux de 1967: Carte hydrogéologique du bassin de Paris au 1∕500 000, Editions BRGM, Paris, 1967.
Alin, S. R., Rasera, M. M. D. F. F. L., Salimon, C. I., Richey, J. E., Holtgrieve, G. W., Krusche, A. V., and Snidvongs, A.: Physical controls on carbon dioxide transfer velocity and flux in low-gradient river systems and implications for regional carbon budgets, J. Geophys. Res., 116, G01009, https://doi.org/10.1029/2010jg001398, 2011.
Alshboul, Z., Encinas-Fernández, J., Hofmann, H., Lorke, A., Encinas-Ferna, J., Hofmann, H., Lorke, A., Encinas-Fernández, J., Hofmann, H., and Lorke, A.: Export of dissolved methane and carbon dioxide with effluents from municipal wastewater treatment plants, Environ. Sci. Technol., 50, 5555–5563, https://doi.org/10.1021/acs.est.5b04923, 2016.
Arnold, J. G. and Allen, P. M.: Automated methods for estimating baseflow and ground water recharge from streamflow records, J. Am. Water Resour. Assoc., 35, 411–424, https://doi.org/10.1111/j.1752-1688.1999.tb03599.x, 1999.
Aufdenkampe, A. K., Mayorga, E., Raymond, P. A., Melack, J. M., Doney, S. C., Alin, S. R., Aalto, R. E., and Yoo, K.: Riverine coupling of biogeochemical cycles between land, oceans, and atmosphere, Front. Ecol. Environ., 9, 53–60, https://doi.org/10.1890/100014, 2011.
Aumont, O., Ethé, C., Tagliabue, A., Bopp, L., and Gehlen, M.: PISCES-v2: An ocean biogeochemical model for carbon and ecosystem studies, Geosci. Model Dev., 8, 2465–2513, https://doi.org/10.5194/gmd-8-2465-2015, 2015.
Battin, T. J., Kaplan, L. a., Findlay, S., Hopkinson, C. S., Marti, E., Packman, A. I., Newbold, J. D., and Sabater, F.: Biophysical controls on organic carbon fluxes in fluvial networks, Nat. Geosci., 2, 595–595, https://doi.org/10.1038/ngeo602, 2009a.
Battin, T. J., Luyssaert, S., Kaplan, L. a., Aufdenkampe, A. K., Richter, A., and Tranvik, L. J.: The boundless carbon cycle, Nat. Geosci., 2, 598–600, https://doi.org/10.1038/ngeo618, 2009b.
Billen, G. and Garnier, J.: Nitrogen transfers through the Seine drainage network: a budget based on the application of the `Riverstrahler' model, Hydrobiologia, 410, 139–150, https://doi.org/10.1023/A:1003838116725, 1999.
Billen, G. and Servais, P.: Modélisation des processus de dégradation bactérienne de la matière organique en milieu aquatique, in: Micro-organismes dans les écosystèmes océaniques, edited by: Bianchi, M., Marty, D., Bertrand, J. C., Caumette, P., and Gauthier, M., Masson, Paris, 219–245, 1989.
Billen, G., Garnier, J., and Hanset, P.: Modelling phytoplankton development in whole drainage networks: the RIVERSTRAHLER Model applied to the Seine river system, Hydrobiologia, 289, 119–137, https://doi.org/10.1007/BF00007414, 1994.
Billen, G., Garnier, J., Ficht, A., and Cun, C.: Modeling the Response of Water Quality in the Seine River Estuary to Human Activity in its Watershed Over the Last 50 Years, Estuaries, 24, 977–993, 2001.
Billen, G., Garnier, J., Némery, J., Sebilo, M., Sferratore, a, Barles, S., Benoit, P., and Benoît, M.: A long-term view of nutrient transfers through the Seine river continuum, Sci. Total Environ., 375, 80–97, https://doi.org/10.1016/j.scitotenv.2006.12.005, 2007.
Billen, G., Ramarson, A., Thieu, V., Théry, S., Silvestre, M., Pasquier, C., Hénault, C., and Garnier, J.: Nitrate retention at the river–watershed interface: a new conceptual modeling approach, Biogeochemistry, 139, 31–51, https://doi.org/10.1007/s10533-018-0455-9, 2018.
Borges, A. V., Schiettecatte, L. S., Abril, G., Delille, B., and Gazeau, F.: Carbon dioxide in European coastal waters, Estuar. Coast. Shelf Sci., 70, 375–387, https://doi.org/10.1016/j.ecss.2006.05.046, 2006.
Borrelli, P., Van Oost, K., Meusburger, K., Alewell, C., Lugato, E., and Panagos, P.: A step towards a holistic assessment of soil degradation in Europe: Coupling on-site erosion with sediment transfer and carbon fluxes, Environ. Res., 161, 291–298, https://doi.org/10.1016/j.envres.2017.11.009, 2018.
Butman, D. and Raymond, P. A.: Significant efflux of carbon dioxide from streams and rivers in the United States, Nat. Geosci., 4, 839–842, https://doi.org/10.1038/ngeo1294, 2011.
Cai, W.-J. and Wang, Y.: The chemistry, fluxes, and sources of carbon dioxide in the estuarine waters of the Satilla and Altamaha Rivers, Georgia, Limnol. Oceanogr., 43, 657–668, https://doi.org/10.4319/lo.1998.43.4.0657, 1998.
Cole, J. J., Prairie, Y. T., Caraco, N. F., McDowell, W. H., Tranvik, L. J., Striegl, R. G., Duarte, C. M., Kortelainen, P., Downing, J. A., Middelburg, J. J., and Melack, J.: Plumbing the Global Carbon Cycle: Integrating Inland Waters into the Terrestrial Carbon Budget, Ecosystems, 10, 172–185, https://doi.org/10.1007/s10021-006-9013-8, 2007.
Culberson, C. H.: Calculation of the in situ pH of seawater, Limnol. Oceanogr., 25, 150–152, https://doi.org/10.4319/lo.1980.25.1.0150, 1980.
Desmit, X., Thieu, V., Billen, G., Campuzano, F., Dulière, V., Garnier, J., Lassaletta, L., Ménesguen, A., Neves, R., Pinto, L., Silvestre, M., Sobrinho, J. L., and Lacroix, G.: Reducing marine eutrophication may require a paradigmatic change, Sci. Total Environ., 635, 1444–1466, https://doi.org/10.1016/j.scitotenv.2018.04.181, 2018.
Doney, S. C., Lindsay, K., Caldeira, K., Campin, J. M., Drange, H., Dutay, J. C., Follows, M., Gao, Y., Gnanadesikan, A., Gruber, N., Ishida, A., Joos, F., Madec, G., Maier-Reimer, E., Marshall, J. C., Matear, R. J., Monfray, P., Mouchet, A., Najjar, R., Orr, J. C., Plattner, G. K., Sarmiento, J., Schlitzer, R., Slater, R., Totterdell, I. J., Weirig, M. F., Yamanaka, Y., and Yool, A.: Evaluating global ocean carbon models: The importance of realistic physics, Global Biogeochem. Cy., 18, GB3017, https://doi.org/10.1029/2003GB002150, 2004.
Drake, T. W., Raymond, P. A., and Spencer, R. G. M.: Terrestrial carbon inputs to inland waters: A current synthesis of estimates and uncertainty, Limnol. Oceanogr. Lett., 3, 132–142, https://doi.org/10.1002/lol2.10055, 2018.
Dubois, K. D., Lee, D., and Veizer, J.: Isotopic constraints on alkalinity, dissolved organic carbon, and atmospheric carbon dioxide fluxes in the Mississippi River, J. Geophys. Res.-Biogeo., 115, G02018, https://doi.org/10.1029/2009JG001102, 2010.
EEA: Copernicus Land Monitoring Service – Corine Land Cover (CLC), availablea at: https://land.copernicus.eu/pan-european/corine-land-cover/clc-2012 (last access: 3 May 2020), 2012.
Garnier, J. and Billen, G.: Ecological interactions in a shallow sand-pit lake (Lake Créteil, Parisian Basin, France): a modelling approach, Hydrobiologia, 275–276, 97–114, https://doi.org/10.1007/BF00026703, 1994.
Garnier, J. and Billen, G.: Production vs. respiration in river systems: an indicator of an “ecological status”, Sci. Total Environ., 375, 110–124, https://doi.org/10.1016/j.scitotenv.2006.12.006, 2007.
Garnier, J., Billen, G., and Coste, M.: Seasonal succession of diatoms and Chlorophyceae in the drainage network of the Seine River: Observation and modeling, Limnol. Oceanogr., 40, 750–765, https://doi.org/10.4319/lo.1995.40.4.0750, 1995.
Garnier, J., Leporcq, B., Sanchez, N., and Phillippon, X.: Biogeochemical mass-balances (C, N, P, Si) in three large reservoirs of the Seine Basin (France), Biogeochemistry, 47, 119–146, https://doi.org/10.1023/A:1006101318417, 1999.
Garnier, J., Billen, G., Hannon, E., Fonbonne, S., Videnina, Y., and Soulie, M.: Modelling the Transfer and Retention of Nutrients in the Drainage Network of the Danube River, Estuar. Coast. Shelf Sci., 54, 285–308, https://doi.org/10.1006/ecss.2000.0648, 2002.
Garnier, J., Cébron, A., Tallec, G., Billen, G., Sebilo, M., and Martinez, A.: Nitrogen behaviour and nitrous oxide emission in the tidal Seine River estuary (France) as influenced by human activities in the upstream watershed, Biogeochemistry, 77, 305–326, https://doi.org/10.1007/s10533-005-0544-4, 2006.
Garnier, J., Billen, G., and Cébron, A.: Modelling nitrogen transformations in the lower Seine river and estuary (France): Impact of wastewater release on oxygenation and N2O emission, Hydrobiologia, 588, 291–302, https://doi.org/10.1007/s10750-007-0670-1, 2007.
Garnier, J., Billen, G., Vilain, G., Martinez, A., Silvestre, M., Mounier, E., and Toche, F.: Nitrous oxide (N2O) in the Seine river and basin: Observations and budgets, Agr. Ecosyst. Environ., 133, 223–233, https://doi.org/10.1016/j.agee.2009.04.024, 2009.
Guerrini, M.-C., Mouchel, J.-M., Meybeck, M., Penven, M. J., Hubert, G., and Muxart, T.: Le bassin de la Seine: la confrontation du rural et de l'urbain, in La Seine en son bassin, in: Fonctionnement écologique d'un système fluvial anthropisé, edited by: Meybeck, M., de Marsily, G., and Fustec, E., Elsevier, Paris, Amsterdam, Lausanne, 29–73, 1998.
Gypens, N., Lancelot, C., and Borges, A. V.: Carbon dynamics and CO2 air–sea exchanges in the eutrophied coastal waters of the Southern Bight of the North Sea: a modelling study, Biogeosciences, 1, 147–157, https://doi.org/10.5194/bg-1-147-2004, 2004.
Gypens, N., Borges, A. V., and Lancelot, C.: Effect of eutrophication on air–sea CO2 fluxes in the coastal Southern North Sea: A model study of the past 50 years, Global Change Biol., 15, 1040–1056, https://doi.org/10.1111/j.1365-2486.2008.01773.x, 2009.
Gypens, N., Lacroix, G., Lancelot, C., and Borges, A. V.: Seasonal and inter-annual variability of air–sea CO2 fluxes and seawater carbonate chemistry in the Southern North Sea, Prog. Oceanogr., 88, 59–77, https://doi.org/10.1016/j.pocean.2010.11.004, 2011.
Habets, F., Boone, A., Champeaux, J. L., Etchevers, P., Franchistéguy, L., Leblois, E., Ledoux, E., Le Moigne, P., Martin, E., Morel, S., Noilhan, J., Seguí, P. Q., Rousset-Regimbeau, F., and Viennot, P.: The SAFRAN-ISBA-MODCOU hydrometeorological model applied over France, J. Geophys. Res.-Atmos., 113, 1–18, https://doi.org/10.1029/2007JD008548, 2008.
Ho, D. T., Coffineau, N., Hickman, B., Chow, N., Koffman, T., and Schlosser, P.: Influence of current velocity and wind speed on air-water gas exchange in a mangrove estuary, Geophys. Res. Lett., 43, 3813–3821, https://doi.org/10.1002/2016GL068727, 2016.
Hotchkiss, E. R., Hall, R. O., Sponseller, R., Butman, D., Klaminder, J., Laudon, H., Rosvall, M., and Karlsson, J.: Sources and control of CO2 emissions change with the size of streams and rivers, Nat. Geosci., 8, 696–699, https://doi.org/10.1038/ngeo2507, 2015.
INSEE: French National Institute of Statistics and Economic Studies, Recensement de la population 2015, available at: https://www.insee.fr/fr/information/2008354 (last access: 3 May 2020), 2015.
Joos, F., Bruno, M., Fink, R., Siegenthaler, U., Stocker, T. F., Le Quéré, C., and Sarmiento, J. L.: An efficient and accurate representation of complex oceanic and biospheric models of anthropogenic carbon uptake, Tellus B, 48, 397–417, https://doi.org/10.1034/j.1600-0889.1996.t01-2-00006.x, 1996.
Kempe, S.: Long-term records of CO2 pressure fluctuations in fresh waters, Transp. carbon Miner. major world rivers, part 1, 91–332 available at: https://www.karstwanderweg.de/publika/gpi/52/116-120/index.htm (last access: 3 May 2020), 1982.
Kempe, S.: Sinks of the anthropogenically enhanced carbon cycle in surface fresh waters, J. Geophys. Res., 89, 4657, https://doi.org/10.1029/JD089iD03p04657, 1984.
Lacarce, E., Le Bas, C., Cousin, J. L., Pesty, B., Toutain, B., Houston Durrant, T., and Montanarella, L.: Data management for monitoring forest soils in Europe for the Biosoil project, Soil Use Manage., 25, 57–65, https://doi.org/10.1111/j.1475-2743.2009.00194.x, 2009.
Laruelle, G. G., Marescaux, A., Le Gendre, R., Garnier, J., Rabouille, C., and Thieu, V.: Carbon dynamics along the Seine River network: Insight from a coupled estuarine/river modeling approach, Front. Mar. Sci., https://doi.org/10.3389/fmars.2019.00216, in press, 2019.
Lauerwald, R., Laruelle, G. G., Hartmann, J., Ciais, P., and Regnier, P. A. G.: Spatial patterns in CO2 evasion from the global river network, Global Biogeochem. Cy., 29, 534–554, https://doi.org/10.1002/2014GB004941, 2015.
Lauerwald, R., Regnier, P., Camino-serrano, M., Guenet, B., Guimberteau, M., Ducharne, A., Polcher, J., and Ciais, P.: ORCHILEAK (revision 3875): A new model branch to simulate carbon transfers along the terrestrial-aquatic continuum of the Amazon basin, Geosci. Model Dev., 10, 3821–3859, https://doi.org/10.5194/gmd-10-3821-2017, 2017.
Li, S., Lu, X. X., and Bush, R. T.: CO2 partial pressure and CO2 emission in the Lower Mekong River, J. Hydrol., 504, 40–56, https://doi.org/10.1016/j.jhydrol.2013.09.024, 2013.
Mackenzie, F. T., De Carlo, E. H., and Lerman, A.: Coupled C, N, P, and O Biogeochemical Cycling at the Land-Ocean Interface, in: Biogeochemistry Vol. 5, Elsevier Inc., 317–342, https://doi.org/10.1016/B978-0-12-374711-2.00512-X, 2011.
Marescaux, A., Thieu, V., and Garnier, J.: Carbon dioxide, methane and nitrous oxide emissions from the human-impacted Seine watershed in France, Sci. Total Environ., 643, 247–259, https://doi.org/10.1016/j.scitotenv.2018.06.151, 2018a.
Marescaux, A., Thieu, V., Borges, A. V., and Garnier, J.: Seasonal and spatial variability of the partial pressure of carbon dioxide in the human-impacted Seine River in France, Sci. Rep., 8, 13961, https://doi.org/10.1038/s41598-018-32332-2, 2018b.
Marx, A., Dusek, J., Jankovec, J., Sanda, M., Vogel, T., van Geldern, R., Hartmann, J., and Barth, J. A. C.: A review of CO2 and associated carbon dynamics in headwater streams: A global perspective, Rev. Geophys., 55, 560–585, https://doi.org/10.1002/2016RG000547, 2017.
Marx, A., Conrad, M., Aizinger, V., Prechtel, A., Van Geldern, R., and Barth, J. A. C.: Groundwater data improve modelling of headwater stream CO2 outgassing with a stable DIC isotope approach, Biogeosciences, 15, 3093–3106, https://doi.org/10.5194/bg-15-3093-2018, 2018.
Meehl, G. A., Stocker, T. F., Collins, W. D., Friedlingstein, P. G. A. T., Gregory, J. M., Kitoh, A., Knutti, R., Murphy, J. M., N. A., Raper, S. C. B., Watterson, I. G. J. W. A., and Zhao, Z.-C.: Global Climate Projections, in: Climate Change 2007: The Physical Science Basis. Contribution of Working Group I to Fourth Assessment Report of the Intergovernmental Panel on Climate Change, edited by: Solomon, S., Qin, D., Manning, M., Chen, Z., Marquis, M., Averyt, K. B., Tignor, M., and Miller, H. L., Cambridge, UK and New York, NY, USA, p. 996, 2007.
Mégnien, C.: Synthèse géologique du bassin de Paris, edited by: Mégnien, C., Édition du B. R. G. M., available at: https://books.google.fr/books?id=x0w9bwAACAAJ (last access: 3 May 2020), 1980.
Menon, M., Rousseva, S., Nikolaidis, N. P., van Gaans, P., Panagos, P., de Souza, D. M., Ragnarsdottir, K. V., Lair, G. J., Weng, L., Bloem, J., Kram, P., Novak, M., Davidsdottir, B., Gisladottir, G., Robinson, D. A., Reynolds, B., White, T., Lundin, L., Zhang, B., Duffy, C., Bernasconi, S. M., De Ruiter, P., Blum, W. E. H., and Banwart, S. A.: SoilTrEC: A global initiative on critical zone research and integration, Environ. Sci. Pollut. Res., 21, 3191–3195, https://doi.org/10.1007/s11356-013-2346-x, 2014.
Meybeck, M.: Riverine transport of atmospheric carbon: Sources, global typology and budget, Water Air Soil Pollut., 70, 443–463, https://doi.org/10.1007/BF01105015, 1993.
Millero, F. J.: The thermodynamics of the carbonate system in seawater, Geochim. Cosmochim. Ac., 43, 1651–1661, https://doi.org/10.1016/0016-7037(79)90184-4, 1979.
Minaudo, C., Curie, F., Jullian, Y., Gassama, N., and Moatar, F.: QUAL-NET, a high temporal-resolution eutrophication model for large hydrographic networks, Biogeosciences, 15, 2251–2269, https://doi.org/10.5194/bg-15-2251-2018, 2018.
Nakayama, T.: New perspective for eco-hydrology model to constrain missing role of inland waters on boundless biogeochemical cycle in terrestrial–aquatic continuum, Ecohydrol. Hydrobiol., 16, 138–148, https://doi.org/10.1016/j.ecohyd.2016.07.002, 2016.
O'Connor, D. J. and Dobbins, W. E.: Mechanism of reaeration in natural streams, Trans. Am. Soc. Civ. Eng., 123, 641–684, 1958.
Öquist, M. G., Wallin, M., Seibert, J., Bishop, K., and Laudon, H.: Dissolved Inorganic Carbon Export Across the Soil/Stream Interface and Its Fate in a Boreal Headwater Stream, Environ. Sci. Technol., 43, 7364–7369, 2009.
Passy, P., Le Gendre, R., Garnier, J., Cugier, P., Callens, J., Paris, F., Billen, G., Riou, P., and Romero, E.: Eutrophication modelling chain for improved management strategies to prevent algal blooms in the Bay of Seine, Mar. Ecol. Prog. Ser., 543, 107–125, https://doi.org/10.3354/meps11533, 2016.
Pelletier, G. J., Chapra, S. C., and Tao, H.: QUAL2Kw – A framework for modeling water quality in streams and rivers using a genetic algorithm for calibration, Environ. Model. Softw., 21, 419–425, https://doi.org/10.1016/j.envsoft.2005.07.002, 2006.
Pierrot, D., Lewis, D. E., and Wallace, D. W. R.: MS Excel Program Developed for CO2 System Calculations, ORNL/CDIAC-105a, Carbon Dioxide Inf. Anal. Center, Oak Ridge Natl. Lab. US Dep. Energy, Oak Ridge, Tennessee, https://doi.org/10.3334/CDIAC/otg.CO2SYS_XLS_CDIAC105a, 2006.
Pomerol, C. and Feugueur, L. L.: Bassin de Paris: Ile de France, Pays de Bray, Masson, Paris, available at: https://books.google.fr/books?id=SAoeAQAAMAAJ (last access: 3 May 2020), 1986.
Prairie, Y. T. and Cole, J. J.: Carbon, Unifying Currency, Encycl. Inl. Waters, 2, 743–746, https://doi.org/10.1016/B978-012370626-3.00107-1, 2009.
QGIS Development Team: QGIS Geographic Information System 2.18, Open Source Geospatial Found, available at: http://qgis.osgeo.org/ (last access: 3 May 2020), 2016.
Quintana-Seguí, P., Le Moigne, P., Durand, Y., Martin, E., Habets, F., Baillon, M., Canellas, C., Franchisteguy, L., and Morel, S.: Analysis of near-surface atmospheric variables: Validation of the SAFRAN analysis over France, J. Appl. Meteorol. Clim., 47, 92–107, https://doi.org/10.1175/2007JAMC1636.1, 2008.
Raymond, P. A., Caraco, N. F., and Cole, J. J.: Carbon dioxide concentration and atmospheric flux in the Hudson River, Estuaries, 20, 381–390, https://doi.org/10.2307/1352351, 1997.
Raymond, P. A., Zappa, C. J., Butman, D., Bott, T. L., Potter, J., Mulholland, P., Laursen, A. E., McDowell, W. H., and Newbold, D.: Scaling the gas transfer velocity and hydraulic geometry in streams and small rivers, Limnol. Oceanogr. Fluids Environ., 2, 41–53, https://doi.org/10.1215/21573689-1597669, 2012.
Raymond, P. A., Hartmann, J., Lauerwald, R., Sobek, S., McDonald, C., Hoover, M., Butman, D., Striegl, R., Mayorga, E., Humborg, C., Kortelainen, P., Dürr, H., Meybeck, M., Ciais, P., and Guth, P.: Global carbon dioxide emissions from inland waters, Nature, 503, 355–359, https://doi.org/10.1038/nature12760, 2013.
R Core team: R Core Team, R A Lang. Environ. Stat. Comput. R Found. Stat. Comput., Vienna, Austria, 275–286, ISBN 3-900051-07-0, available at: http://www.R-project.org/ (last access: 3 May 2020), 2015.
Regnier, P., Friedlingstein, P., Ciais, P., Mackenzie, F. T., Gruber, N., Janssens, I. A., Laruelle, G. G., Lauerwald, R., Luyssaert, S., Andersson, A. J., Arndt, S., Arnosti, C., Borges, A. V., Dale, A. W., Gallego-Sala, A., Goddéris, Y., Goossens, N., Hartmann, J., Heinze, C., Ilyina, T., Joos, F., LaRowe, D. E., Leifeld, J., Meysman, F. J. R., Munhoven, G., Raymond, P. A., Spahni, R., Suntharalingam, P., and Thullner, M.: Anthropogenic perturbation of the carbon fluxes from land to ocean, Nat. Geosci., 6, 597–607, https://doi.org/10.1038/ngeo1830, 2013a.
Regnier, P., Arndt, S., Goossens, N., Volta, C., Laruelle, G. G., Lauerwald, R., and Hartmann, J.: Modelling Estuarine Biogeochemical Dynamics: From the Local to the Global Scale, Aquat. Geochem., 19, 591–626, https://doi.org/10.1007/s10498-013-9218-3, 2013b.
Rocher, V. and Azimi, S.: Evolution de la qualité de la Seine en lien avec les progrès de l'assainissement, Johanet, Paris, 2017.
Romero, E., Garnier, J., Lassaletta, L., Billen, G., Le Gendre, R., Riou, P., and Cugier, P.: Large-scale patterns of river inputs in southwestern Europe: Seasonal and interannual variations and potential eutrophication effects at the coastal zone, Biogeochemistry, 113, 481–505, https://doi.org/10.1007/s10533-012-9778-0, 2013.
Romero, E., Le Gendre, R., Garnier, J., Billen, G., Fisson, C., Silvestre, M., and Riou, P.: Long-term water quality in the lower Seine: Lessons learned over 4 decades of monitoring, Environ. Sci. Policy, 58, 141–154, https://doi.org/10.1016/j.envsci.2016.01.016, 2016.
Sawakuchi, H. O., Neu, V., Ward, N. D., de Barros, M. L. C., Valerio, A. M., Gagne-Maynard, W., Cunha, A. C., Less, D. F. S., Diniz, J. E. M., Brito, D. C., Krusche, A. V., and Richey, J. E.: Carbon Dioxide Emissions along the Lower Amazon River, Front. Mar. Sci., 4, 1–12, https://doi.org/10.3389/fmars.2017.00076, 2017.
Servais, P., Billen, G., and Hascoët, M. C.: Determination of the biodegradable fraction of dissolved organic matter in waters, Water Res., 21, 445–450, https://doi.org/10.1016/0043-1354(87)90192-8, 1995.
Servais, P., Garnier, J., Demarteau, N., Brion, N., and Billen, G.: Supply of organic matter and bacteria to aquatic ecosystems through waste water effluents, Water Res., 33, 3521–3531, https://doi.org/10.1016/S0043-1354(99)00056-1, 1999.
Servais, P., Billen, G., Goncalves, A., and Garcia-Armisen, T.: Modelling microbiological water quality in the Seine river drainage network: past, present and future situations, Hydrol. Earth Syst. Sci., 11, 1581–1592, https://doi.org/10.5194/hess-11-1581-2007, 2007.
Sferratore, A., Billen, G., Garnier, J., Smedberg, E., Humborg, C., and Rahm, L.: Modelling nutrient fluxes from sub-arctic basins: Comparison of pristine vs. dammed rivers, J. Mar. Syst., 73, 236–249, https://doi.org/10.1016/j.jmarsys.2007.10.012, 2008.
Smitz, J. S., Everbecq, E., Deliège, J.-F., Descy, J.-P., Wollast, R., and Vanderborght, J. P.: PEGASE, une méthodologie et un outil de simulation prévisionnelle pour la gestion de la qualité des eaux de surface, Trib. l'eau, 588, 73–82, 1997.
Strahler, A. N.: Hypsometric (area-altitude) analysis of erosional topography, Bull. Geol. Soc. Am., 63, 1117–1142, https://doi.org/10.1130/0016-7606(1952)63, 1952.
Strahler, A. N.: Quantitative Analysis of Watershed Geomorphology, Geophys. Union Trans., 38, 913–920, https://doi.org/10.1029/TR038i006p00913, 1957.
Tanaka, K., Kriegler, E., Bruckner, T., Georg, H., Knorr, W., and Raddatz, T.: Aggregated Carbon Cycle, Atmospheric Chemistry, and Climate Model (ACC2) – description of the forward and inverse modes, Max Planck Institute for Meteorology, Hamburg, Germany, 1–188, 2007.
Telmer, K. and Veizer, J.: Carbon fluxes, pCO2 and substrate weathering in a large northern river basin, Canada: Carbon isotope perspectives, Chem. Geol., 159, 61–86, https://doi.org/10.1016/S0009-2541(99)00034-0, 1999.
Thieu, V., Billen, G., and Garnier, J.: Nutrient transfer in three contrasting NW European watersheds: the Seine, Somme, and Scheldt Rivers. A comparative application of the Seneque/Riverstrahler model, Water Res., 43, 1740–1754, https://doi.org/10.1016/j.watres.2009.01.014, 2009.
Tóth, G., Jones, A., and Montanarella, L. (Eds.): LUCAS Topsoil Survey. Methodology, data and results, in: EUR26102 – Scientific and Technical Research series, JRC Technical Reports, Publications Office of the European Union, Luxembourg, https://doi.org/10.2788/97922, 2013.
Vannote, R. L., Minshall, G. W., Cummins, K. W., Sedell, J. R., and Cushing, C. E.: The River Continuum Concept, Can. J. Fish. Aquat. Sci., 37, 130–137, https://doi.org/10.1139/f80-017, 1980.
Venkiteswaran, J. J., Schiff, S. L., and Wallin, M. B.: Large carbon dioxide fluxes from headwater boreal and sub-boreal streams, PLoS One, 9, 22–25, https://doi.org/10.1371/journal.pone.0101756, 2014.
Vilain, G., Garnier, J., Passy, P., Silvestre, M., and Billen, G.: Budget of N2O emissions at the watershed scale: Role of land cover and topography (the Orgeval basin, France), Biogeosciences, 9, 1085–1097, https://doi.org/10.5194/bg-9-1085-2012, 2012.
Vilmin, L., Flipo, N., Escoffier, N., Rocher, V., and Groleau, A.: Carbon fate in a large temperate human-impacted river system: Focus on benthic dynamics, Global Biogeochem. Cy., 30, 1086–1104, https://doi.org/10.1002/2015GB005271, 2016.
Vilmin, L., Flipo, N., Escoffier, N., and Groleau, A.: Estimation of the water quality of a large urbanized river as defined by the European WFD: what is the optimal sampling frequency?, Environ. Sci. Pollut. Res., 25, 23485–23501, https://doi.org/10.1007/s11356-016-7109-z, 2018.
Volta, C., Arndt, S., Savenije, H. H. G., Laruelle, G. G., and Regnier, P.: C-GEM (v 1.0): A new, cost-efficient biogeochemical model for estuaries and its application to a funnel-shaped system, Geosci. Model Dev., 7, 1271–1295, https://doi.org/10.5194/gmd-7-1271-2014, 2014.
Whitehead, P. G., Williams, R. J., and Lewis, D. R.: Quality simulation along river systems (QUASAR): Model theory and development, Sci. Total Environ., 194–195, 447–456, https://doi.org/10.1016/S0048-9697(96)05382-X, 1997.
Xu, Y. J., Xu, Z., and Yang, R.: Rapid daily change in surface water pCO2 and CO2 evasion: A case study in a subtropical eutrophic lake in Southern USA, J. Hydrol., 570, 486–494, https://doi.org/10.1016/j.jhydrol.2019.01.016, 2019.
Yang, C., Telmer, K., and Veizer, J.: Chemical dynamics of the “St. Lawrence” riverine system: δDH2O, δ18OH2O, δ13CDIC, δ34S sulfate, and dissolved 87Sr∕86Sr, Geochim. Cosmochim. Ac., 60, 851–865, https://doi.org/10.1016/0016-7037(95)00445-9, 1996.
Yang, R., Xu, Z., Liu, S., and Xu, Y. J.: Daily pCO2 and CO2 flux variations in a subtropical mesotrophic shallow lake, Water Res., 153, 29–38, https://doi.org/10.1016/j.watres.2019.01.012, 2019.
Zeebe, R. and Wolf-Gladrow, D.: CO2 in Seawater-Equilibrium, Kinetics, Isotopes, in: Elsevier Oceanography Book Series 65, Elsevier, Amsterdam, 346 pp., https://doi.org/10.1016/S0422-9894(01)80002-7, 2001.