the Creative Commons Attribution 4.0 License.
the Creative Commons Attribution 4.0 License.
 | 22 Apr 2020
Catchment-scale drought: capturing the whole drought cycle using multiple indicators
Abraham J. Gibson
Danielle C. Verdon-Kidd
Greg R. Hancock
Garry Willgoose
Global agricultural drought policy has shifted towards promoting drought preparedness and climate resilience in favor of disaster-relief-based strategies. For this approach to be successful, drought predictability and methods for assessing the many aspects of drought need to be improved. Therefore, this study aims to bring together meteorological and hydrological measures of drought as well as vegetation and soil moisture data to assess how droughts begin, propagate and subsequently terminate for a catchment in eastern Australia. For the study area, 13 meteorological drought periods persisting more than 6 months were identified over the last 100 years. During these periods, vegetation health, soil moisture and streamflow declined; however, all of the indicators recovered quickly post-drought, with no evidence of extended impacts on the rainfall–runoff response, as has been observed elsewhere. Furthermore, drought initiation and propagation were found to be tightly coupled to the combined state of large-scale ocean–atmosphere climate drivers (e.g., the El Niño–Southern Oscillation, the Indian Ocean Dipole and the Southern Annular Mode), whereas termination was caused by persistent synoptic systems (e.g., low-pressure troughs). The combination of climatic factors, topography, soils and vegetation are believed to be what makes the study catchments more resilient to drought than others in eastern Australia. This study diversifies traditional approaches to studying droughts by quantifying the catchment response to drought using a range of measures that could also be applied in other catchments globally. This is a key step towards improved drought management.
- Article
(9393 KB) - Full-text XML
- BibTeX
- EndNote


Drought is most simply defined as a deficiency in water to meet needs (Redmond, 2002). However, the concept of drought is markedly more complex than this, as these “needs” vary between sectors. For this reason, drought tends to be separated into four broad categories: meteorological, hydrological, agricultural, and socioeconomic (van Dijk et al., 2013). Meteorological drought refers to a decline in precipitation, whereas hydrological drought is caused by runoff deficits. Agricultural droughts, in comparison, are defined by declines in vegetation and conditions suitable for agricultural productivity (e.g., declines in soil moisture) that, in turn, lead to reduced economic activity and subsequent socioeconomic drought (van Dijk et al., 2013). Further to this complexity, the processes of how meteorological drought leads to the other forms of drought are still poorly understood (Dai, 2011; Kiem et al., 2007; Verdon-Kidd et al., 2017). This issue has a global dimension, with every continent experiencing water scarcity at some time over varying durations.
Large-scale, persistent (i.e., greater than 6 months) drought more commonly occurs in regions with a highly variable hydroclimate (van Dijk et al., 2013; Kiem et al., 2007; Verdon-Kidd et al., 2017). Such droughts impact crop production, the water available for the environment, and town and industrial water supply. This leads to many social, economic and political problems; drought is estimated to cost agriculture and related business USD 6–8 billion a year worldwide (Below et al., 2007; Botterill and Cockfield, 2013). The “Millennium Drought” in Australia, for example, led to declines in agricultural output of up to 85 % in some areas, while water scarcity led to some population centers importing water (Verdon-Kidd et al., 2014). Recent droughts in Texas saw losses of up USD 7.6 billion to its agricultural sector in 2011, and water stores in California were seriously depleted due to drought in 2012 (Chew and Small, 2014; Verdon-Kidd et al., 2017). Drought has also led to widespread famine in African regions, such as the ongoing crisis in the Sahel and the recent water shortage in southwestern South Africa (WFP, 2012; BBC, 2018). These instances highlight that the ability to predict drought and understand physical environmental responses to drought is a pertinent issue in forming effective policies to manage and minimize the negative impacts of this hazard. Furthermore, determining which catchments are more or less responsive to drought is much needed, as this could be used to inform planning decisions around new frontiers or the maintenance of existing agricultural lands.
Most drought studies examine declines in water availability using global-, continental- and regional-scale studies (e.g., Dai, 2011; Deo et al., 2017; Gallant et al., 2013; Mpelasoka et al., 2008; Romm, 2011). However, to date, there has been little research conducted at the local catchment scale. In particular, there is a significant knowledge gap regarding how meteorological drought propagates throughout the catchment to influence other stages/categories of drought (van Dijk et al., 2013; Kiem et al., 2007). Existing studies have primarily focused on highly productive arid to semiarid agricultural zones, such as the Murray–Darling Basin (MDB), southwestern Western Australia and Queensland in Australia; California and Texas in the US; and areas along the Mediterranean Sea (Grove, 1986; Dai, 2011; Matusick et al., 2013; Romm, 2011; Verdon-Kidd et al., 2017). A key impetus of these studies has been recent or current water shortages and the imposing threat of desertification. As a result, there is little understanding of persistent drought within higher rainfall areas, such as the eastern seaboard of Australia (i.e., the region east of the Great Dividing Range), which is recognized as a separate climate entity with respect to wider southeastern Australia (Timbal, 2011). This is crucial given that higher rainfall areas may have a greater role to play in adapting to the pressures of climate change, especially with respect to water security in agriculture.
Recently, Saft et al. (2015) found that persistent drought periods have more significant and long-lasting impacts on the catchment response to rainfall (i.e., conversion to runoff) in drier, flatter, and less vegetated catchments of Australia, whereas catchments in the higher relief, higher rainfall, well-vegetated zone (such as the eastern seaboard catchments) may be more resilient to long-term drought. Better predictability, through characterizing drought likelihood and identification of causal mechanisms, allows for earlier implementation of management strategies to buffer the impacts of drought (Romm, 2011; van Dijk et al., 2013). This is important given that global drought policy has seen a paradigm shift away from “drought-proofing” to management practices that allow for sustainable resource use under climate stress and encourage quick return to pre-drought function once stress is lifted (Botterill, 2003; Wilhite et al., 2014). However, to develop these management strategies, baseline data that characterize how droughts begin, impact a catchment, end and how quickly the catchment responds to this need to be quantified (van Dijk et al., 2013).
This study aims to quantify catchment-scale drought characteristics for a high-relief, high-rainfall catchment located in eastern Australia using multiple indicators. Firstly, a long-term drought history is established, and the onset and termination rates of drought and the large-scale ocean–atmosphere drivers that drive these events are investigated. Secondly, the propagation of the iconic Millennium drought through the study catchments and the environmental response to its termination is identified using pre- and post-drought states of vegetation and soil moisture using remote sensing and field-based datasets.
The study area is comprised of two agricultural catchments located near the town of Merriwa, New South Wales, Australia (Fig. 1). The Krui River (585 km2) and Merriwa River (808 km2) catchments form part of the Goulburn River catchment (6450 km2), which drains into the Hunter River catchment (Rudiger et al., 2007). Rainfall varies spatially across the two catchments due to the large range in elevation. In the areas of lower elevation (350–400 m), the average annual rainfall is approximately 550–600 mm yr−1, whereas in areas where the elevation exceeds 1000 m, the average annual rainfall can exceed 1000 mm yr−1. This is distributed evenly throughout the year (Rudiger et al., 2007; Kunkel et al., 2019). The large-scale drivers that modulate this rainfall include the El Niño–Southern Oscillation (ENSO) during late spring, summer and early autumn; the Indian Ocean Dipole (IOD) during winter and spring; and the Southern Annular Mode, which has varying impacts throughout the year (Risbey et al., 2009).
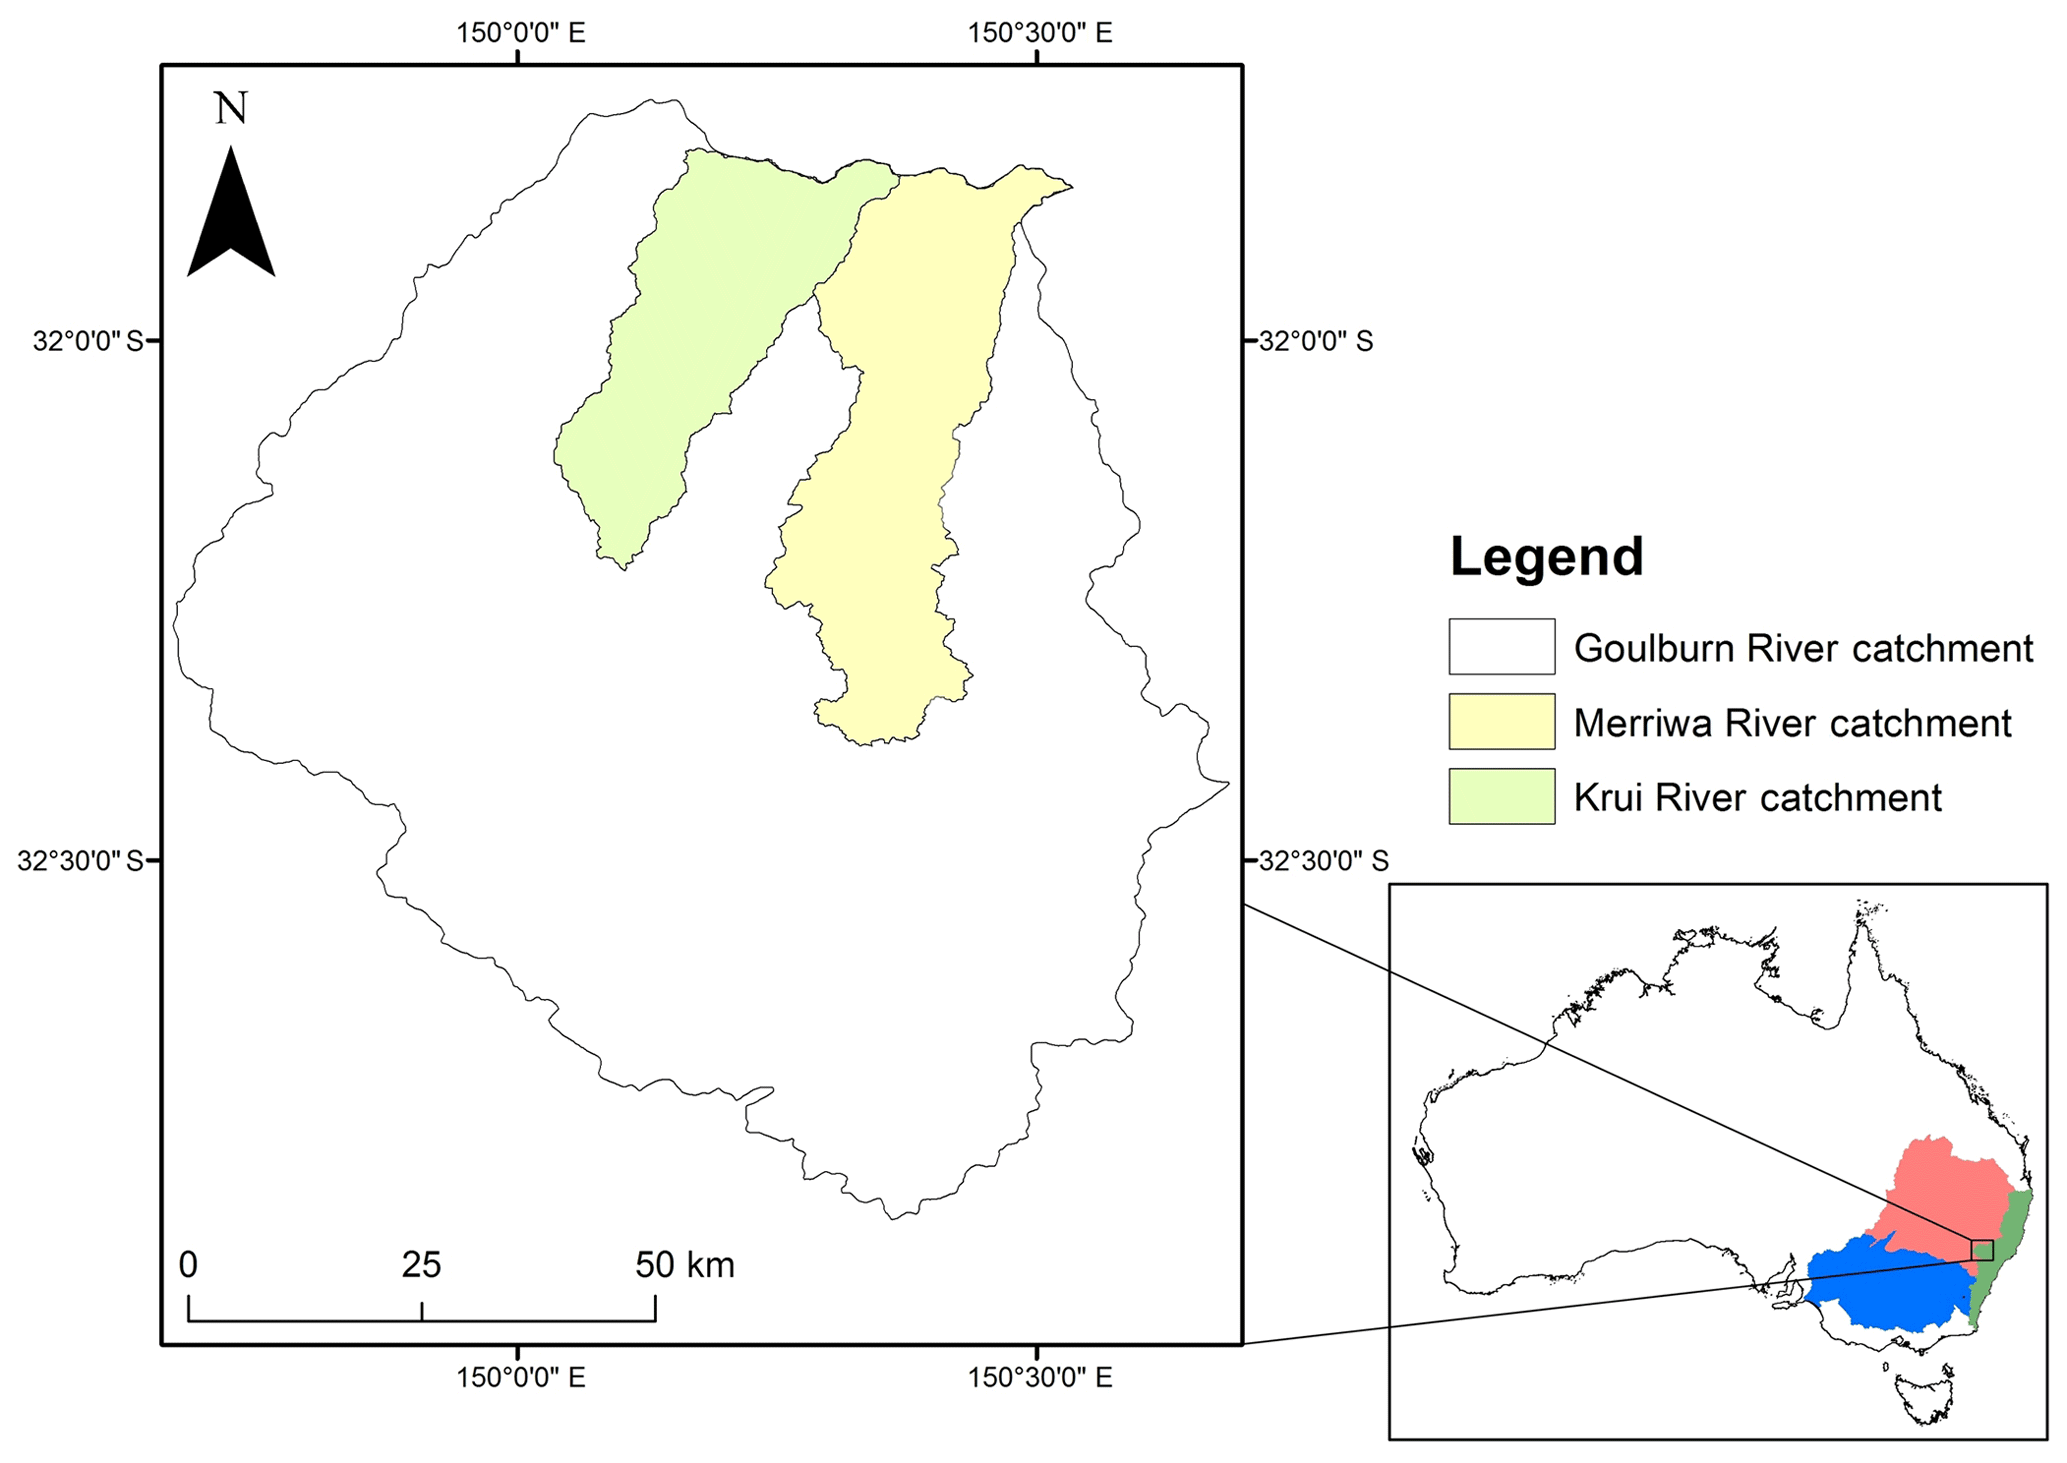
Figure 1Location of the study catchments: the Upper (red) and Lower (blue) Murray–Darling Basin catchments and the New South Wales east coast climate zone (green; inset), which are referred to in the later analysis.
The underlying geology of the area is predominantly Tertiary basalt, with Jurassic sedimentary sequences of the Sydney Basin exposed in the river valleys. The dominant soil types are Euchrozem, Chromosols, Vertisols and Dermosols. Due to the deep and fertile soil profiles, the area is of agricultural significance and sustains grazing and cropping that comprise up around 75 % of each catchment (Hancock et al., 2015; Rudiger et al., 2007). Vegetation is described as cover grasses with sparse eucalypt forest in the lower and central regions of the catchments, whereas dense, wet sclerophyll forest dominates the northern slopes (Kunkel et al., 2019). Vegetation cover is generally consistent throughout the year due to even rainfall distribution.
This study aims to quantify and measure the many aspects of drought from its onset and causal mechanisms to its propagation, the causes of its termination and the response of the catchment. Figure 2 outlines the methodology used here as a framework for holistically understanding drought at the catchment scale.
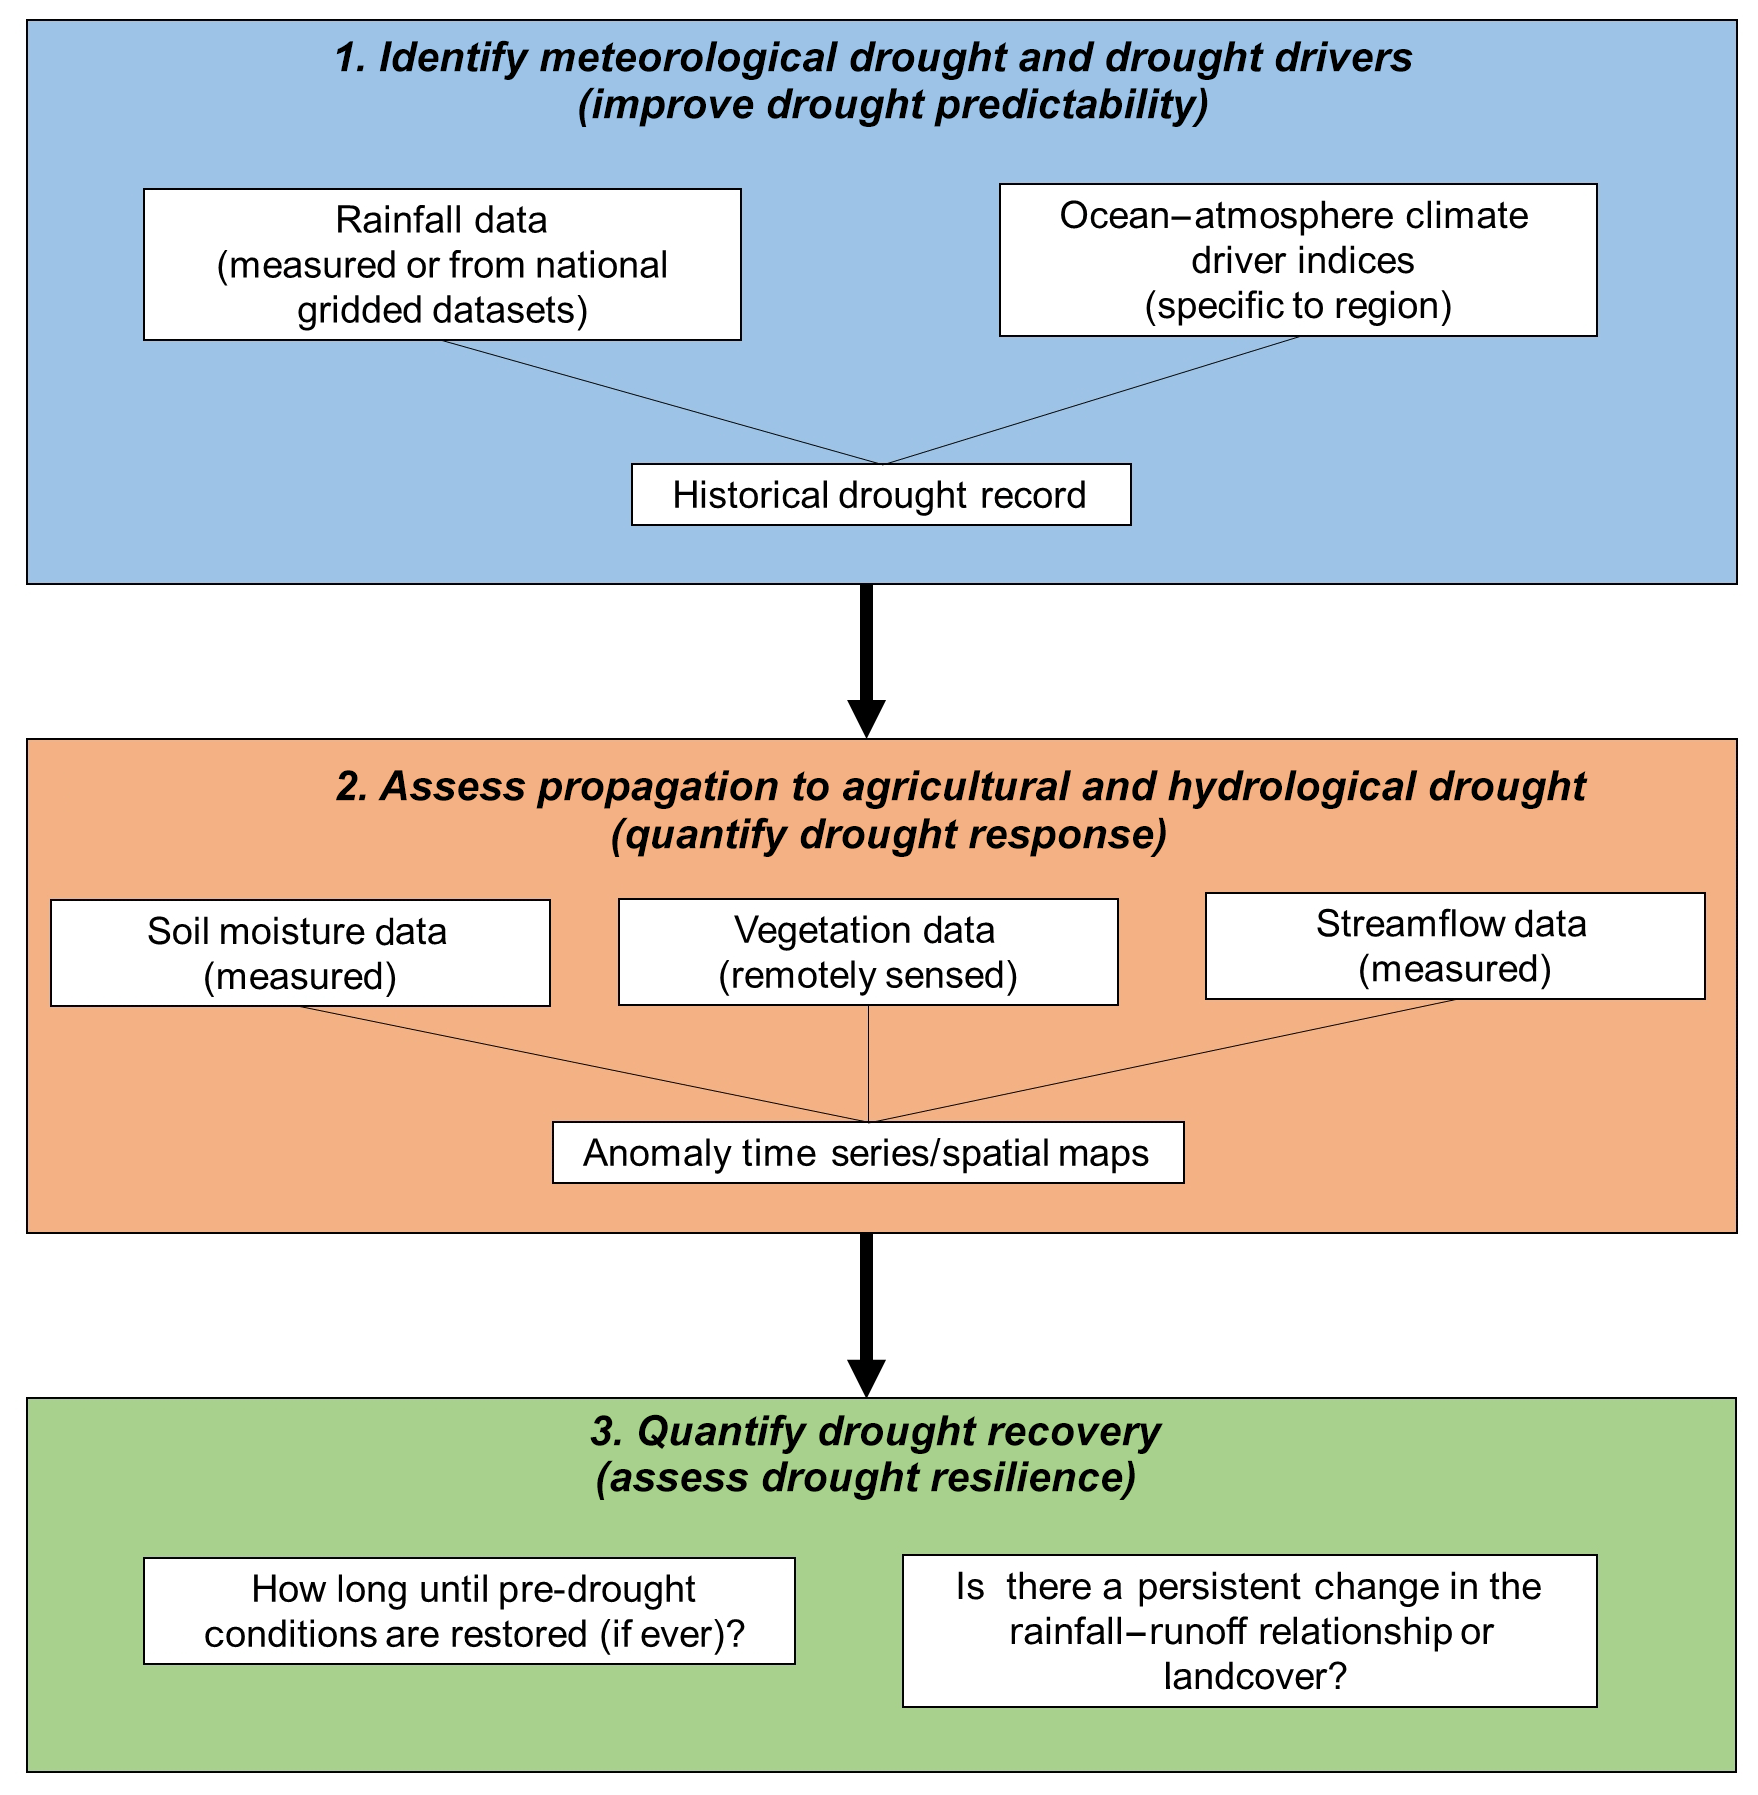
Figure 2Diagram outlining the methods used to quantify drought from its onset, through to propagation and then termination.
3.1 Rainfall data
For this study, two rainfall records were used. Long-term monthly rainfall data were obtained from the Bureau of Meteorology (BoM) for two stations: Roscommon (station no. 061287), and Terragong (station no. 061073). The Roscommon rainfall record covers the period from 1970 to 2015 (and is 98.7 % complete), whereas the Terragong station provides data from 1908 to 1970 (and is 98.7 % complete). The stations were found to be analogous using regression analyses (Terragong rainfall = 1.03 × Roscommon rainfall; R2=0.93, p<0.001) and were therefore combined to form a long-term rainfall record (1908–2015) for the study area. This provided the long-term historical data required for the drought index applications to create a single drought history for both catchments (referred to as the study area).
Catchment-specific instrumental rainfall data were sourced from the Scaling and Assimilation of Soil Moisture and Streamflow (SASMAS) project (Rudiger et al., 2007). A total of 13 monitoring stations are situated throughout the Krui and Merriwa catchments, with rainfall recorded using a 2 mm tipping bucket rain gauge. Rainfall has been recorded at the stations since 2005 (Rudiger et al., 2007). The Krui catchment rainfall data record was 83.2 % complete, whereas the Merriwa catchment data record was 85.3 % complete. These data in conjunction with the BoM data provided the basis for the analysis of rainfall distribution and trends during the Millennium Drought.
3.2 Streamflow data
Modeled Australian Water Availability Project (AWAP) streamflow data (run 26j) were used in this study (1901–2014), as there are no long-term streamflow data available for either catchment (Raupach et al., 2009, 2012). AWAP streamflow is generated using the WaterDyn model, with water balance calculations being carried out using meteorological data (e.g., rainfall and potential evapotranspiration) and continental parameters (e.g., soil characteristics and vegetation). The raw output data are monthly average runoff (in millimeters) on an approximately 0.05∘ × 0.05∘ Australia-wide grid (Raupach et al., 2009, 2012). Australia-wide validation of the AWAP dataset can be found in Raupach et al. (2009), and a local validation is given in Gibson (2016). A single record to match the rainfall record, using average streamflow from both catchments, was then produced for the period from 1908 to 2015.
3.3 The standard precipitation index and surface water supply index
The two most common meteorological drought indices are the standardized precipitation index (SPI) and the Palmer drought severity index (PDSI). Given the absence of a local instrumental long-term temperature record for the region (a requirement for the PDSI calculation), the SPI was selected to identify meteorological drought (see McKee et al., 1993 for a detailed description of the SPI calculation). The SPI is an indicator of how many standard deviations (SDs) that the precipitation over a defined number of months lies from the long-term average (University of Nebraska, 2017). For this study, an SPI period of 6 months (SPI6) was chosen to capture persistent droughts, with meteorological drought onset being defined as a period of 6 successive months of a SPI6 below −1 (Dettinger, 2013; Verdon-Kidd et al., 2017). Drought severity was then categorized, based on SPI values, as mild (−1 < SPI < −0.5), moderate (−1.5 < SPI < −1), severe (−2 < SPI < −1.5) and extreme (SPI < −2), as recommended by McKee et al. (1993, 1995). Following this, termination of a drought event was then defined as a period of 6 successive months where the SPI6 was above −1 (Dettinger, 2013; Verdon-Kidd et al., 2017). Rainfall data from the composite record of the Roscommon and Terragong weather stations were used for the calculation of the SPI.
The surface water supply index (SWSI) was applied in this study to identify hydrological drought (see Doesken et al., 1991 for a detailed description of the SWSI calculation). Similar to the SPI, the SWSI represents how many SDs streamflow for a specified number of months deviates from the long-term average (University of Nebraska, 2017). A SWSI period of 6 months (SWSI6) was also used to capture persistent drought, with periods of hydrological drought and drought severity being defined in the same way as for meteorological drought using the SPI6. The streamflow time series created from the AWAP dataset was used to calculate the SWSI6, which corresponded to the SPI6 calculated for the general study area. The potential issue of non-stationarity in the SPI6 and SWI6 time series was tested using an adjusted Dicky–Fuller test and was found not to be significant for the study area from 1908 to 2015 (Rashid and Beecham, 2019).
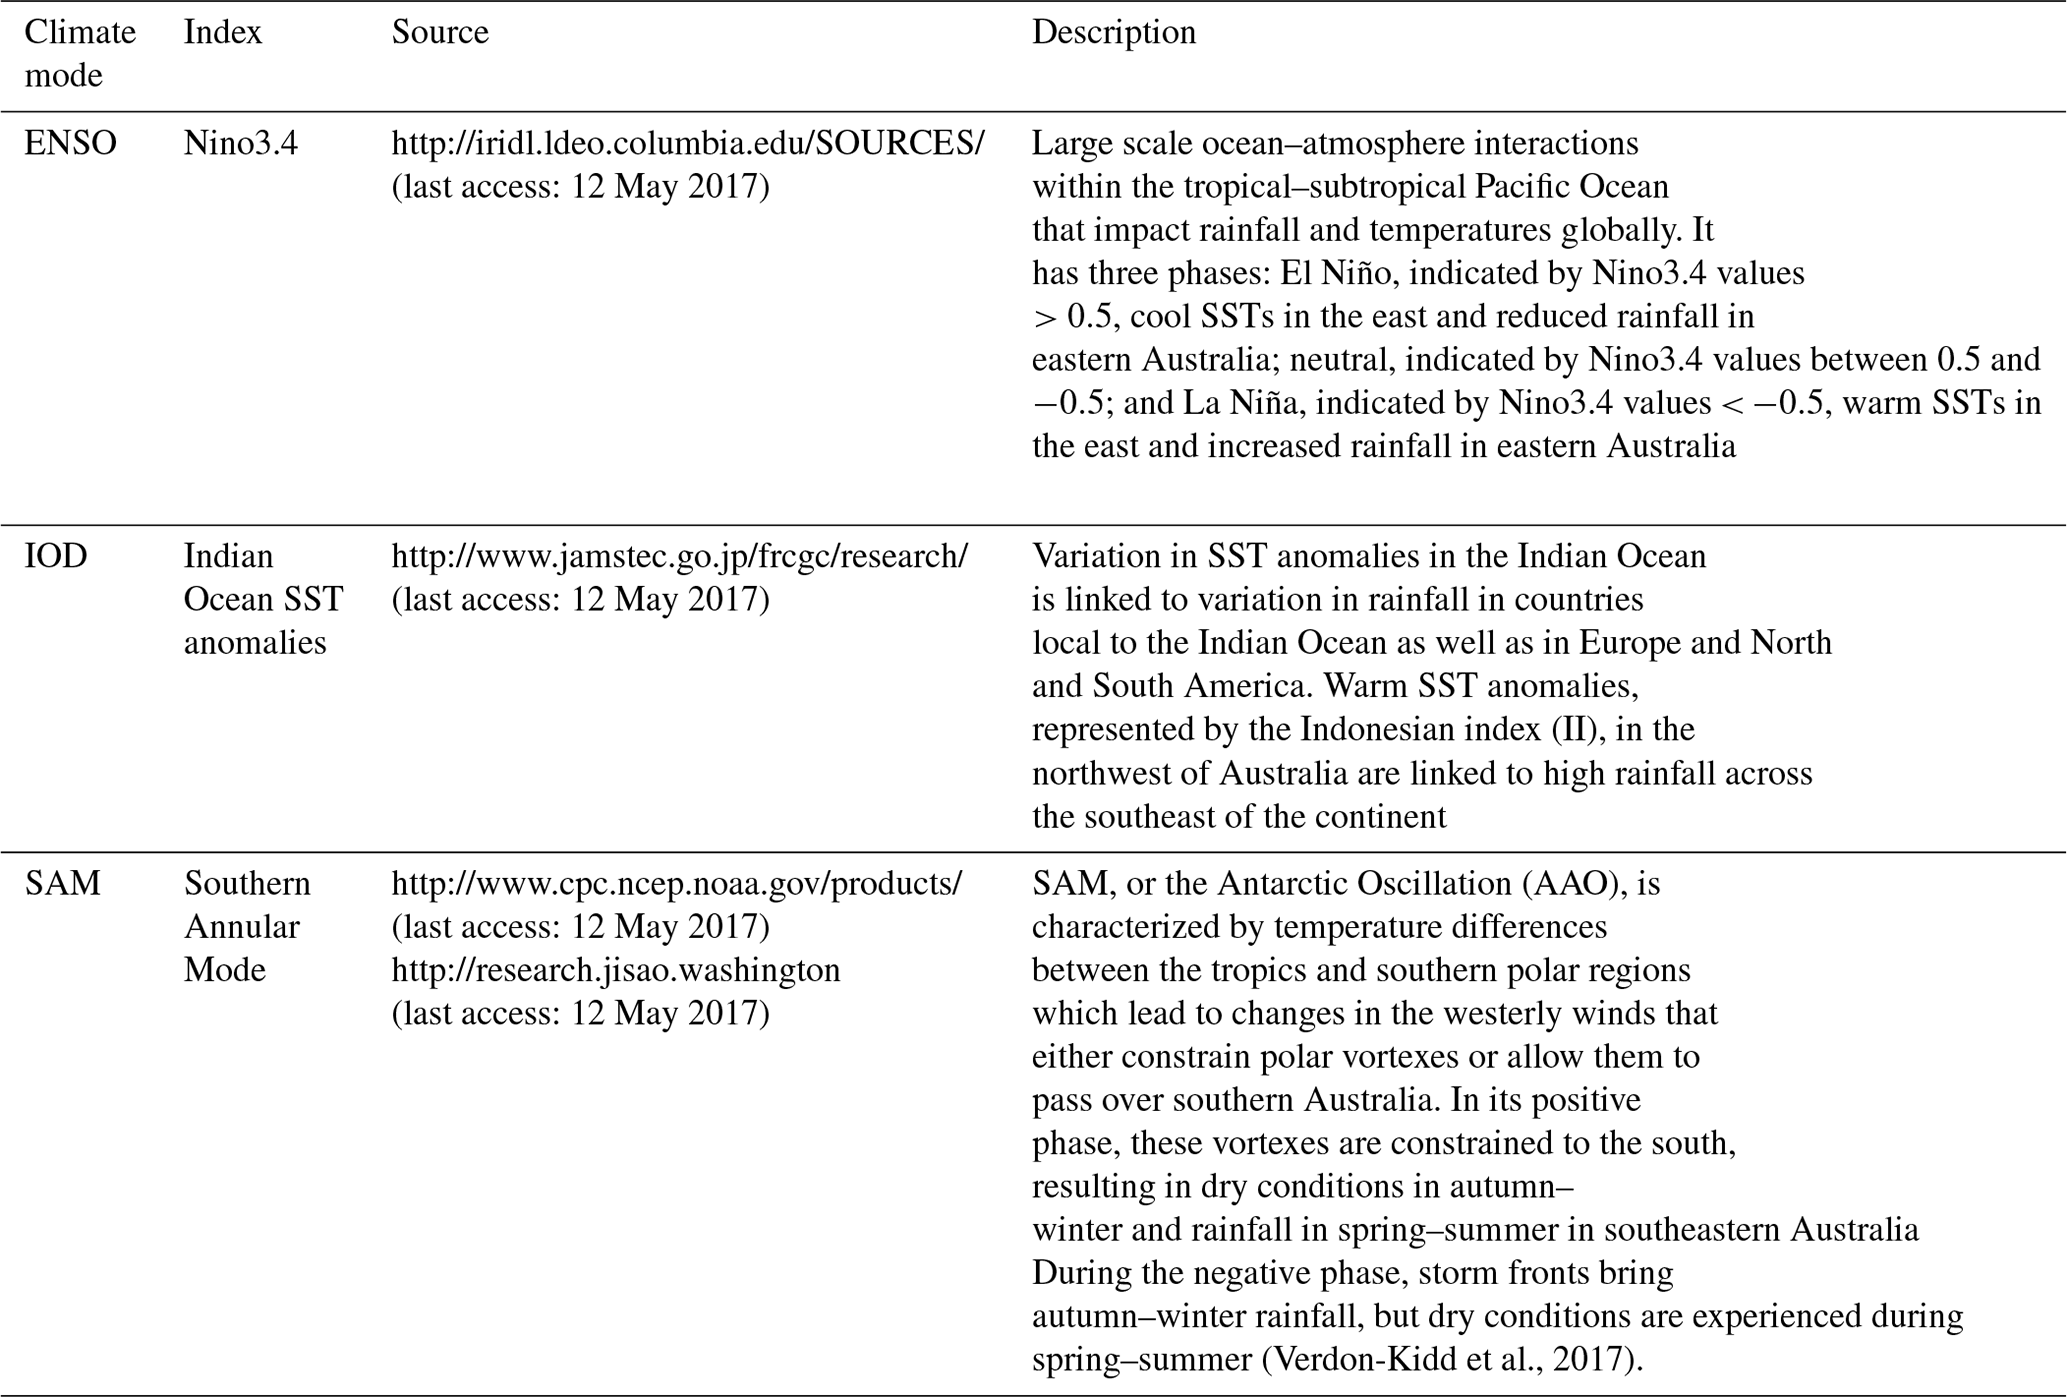
Table 1Climate index data used in this study. (SST refers to sea surface temperature.)
3.4 Rainfall–runoff relationship
Persistent changes in the rainfall–runoff relationship were observed after the Millennium Drought by Saft et al. (2015). This relationship is the amount of runoff generated by a given amount of rainfall. Persistent changes in this relationship indicate a change in the hydrology in a catchment, thereby demonstrating that the catchment has undergone a sustained change or has been unable to recover from drought (Saft et al., 2015). Annual rainfall anomalies were calculated for the same rainfall record that was used to calculate the SPI6 and the percent change from the mean for running 3-year periods. Periods of 3 or more years during which the anomaly was less than 15 % of the mean were classed as “drought periods”. This classification excludes short, less intense meteorological droughts that are unlikely to lead to hydrological drought and a change in the rainfall–runoff relationship (Kiem et al., 2007; Saft et al., 2015). Annual runoff, calculated from the AWAP streamflow used to calculate the SWSI6 time series, was then normalized using a Box–Cox transformation (Box and Cox, 1964). This transformation results in heavily skewed runoff data to approximate a normal distribution, with the relationship with rainfall then becoming linear and more widely applicable (Saft et al., 2015). This was carried out for each “drought period” and for non-drought years using the best transformation selection method, with λ=0.264. A t test was utilized to determine if a significant change within this relationship had occurred within each drought period (Saft et al., 2015).
3.5 Climate data
The relationships between various climate drivers and drought onset are explored in this study. The climate index data used for this analysis are summarized in Table 1. Similarly, the relationship between synoptic-scale events and drought termination are also explored. This is achieved using monthly geopotential height anomalies from the 20th Century Reanalysis V2c data (Compo et al., 2011) provided by the NOAA/OAR/ESRL PSD, Boulder, Colorado, USA (http://www.esrl.noaa.gov/psd/, last access: 26 April 2017).
3.6 Normalized difference vegetation index
An important indicator of water availability is vegetation health, and the normalized difference vegetation index (NDVI) is a simple remote sensing method to measure this parameter. The NDVI is generally regarded as a measure of greenness and is calculated from the difference in the reflectance of the red and near-infrared bands (e.g., Peters et al., 2002; Sawada and Koike, 2016; Verdon-Kidd et al., 2017). This study utilized 0.05∘ resolution Moderate Resolution Imaging Spectrometer (MODIS), NDVI data. This dataset provided monthly NDVI values from 2000 to 2015; Advanced High-Resolution Radiometer (AVHRR) NDVI data were then used to extend the temporal coverage to 1982 (http://reverb.echo.nasa.gov/reverb/, last access: 3 February 2017). To match the single rainfall and streamflow records, an average was calculated across both catchments. The data were then standardized to remove seasonal cycles, with values ranging from +3 to −3. Many studies exist that demonstrate the ability of NDVI to detect agricultural drought and the response of vegetation to drought (Deleglise at al., 2015; Vicente-Serrano et al., 2013). Recent drought conditions in Australia have highlighted the costly impacts of drought when naturally occurring pastoral feed is limited and needs to be supplemented with grain and hay (Kiem et al., 2007). Given the dependence of Australian agriculture on native and unimproved pasture, negative values are considered to show high levels of plant water stress and reduced feed, whereas positive values show good plant health and feed availability (e.g., van Dijk et al., 2013; Verdon-Kidd et al., 2017).
3.7 Soil moisture
The most accurate indicator of agricultural drought is field-measured soil moisture, as this directly relates to the water available for plant uptake. However, a significant issue (in Australia and globally) is the lack of continuous in situ soil moisture data (Rudiger et al., 2007). The study catchments have one of the longest continuous running soil moisture measurements in Australia as part of the SASMAS (Rudiger et al., 2007) project. Soil moisture (% v v−1) across the two catchments was recorded at each of the 13 stations at soil depths of 0–300, 300–600 and 600–900 mm. This was carried out using a vertically inserted Campbell Scientific CS616 water content reflectometer: a recording was taken every 5 min, and the 20 min average was calculated from these recordings. For this study, daily average soil moisture was used. These data extend from 2003 to 2015 and consequently represent conditions during and after the Millennium Drought. These datasets were 84.4 % complete on average.
Table 2Summary of meteorological drought events identified using the SPI6.
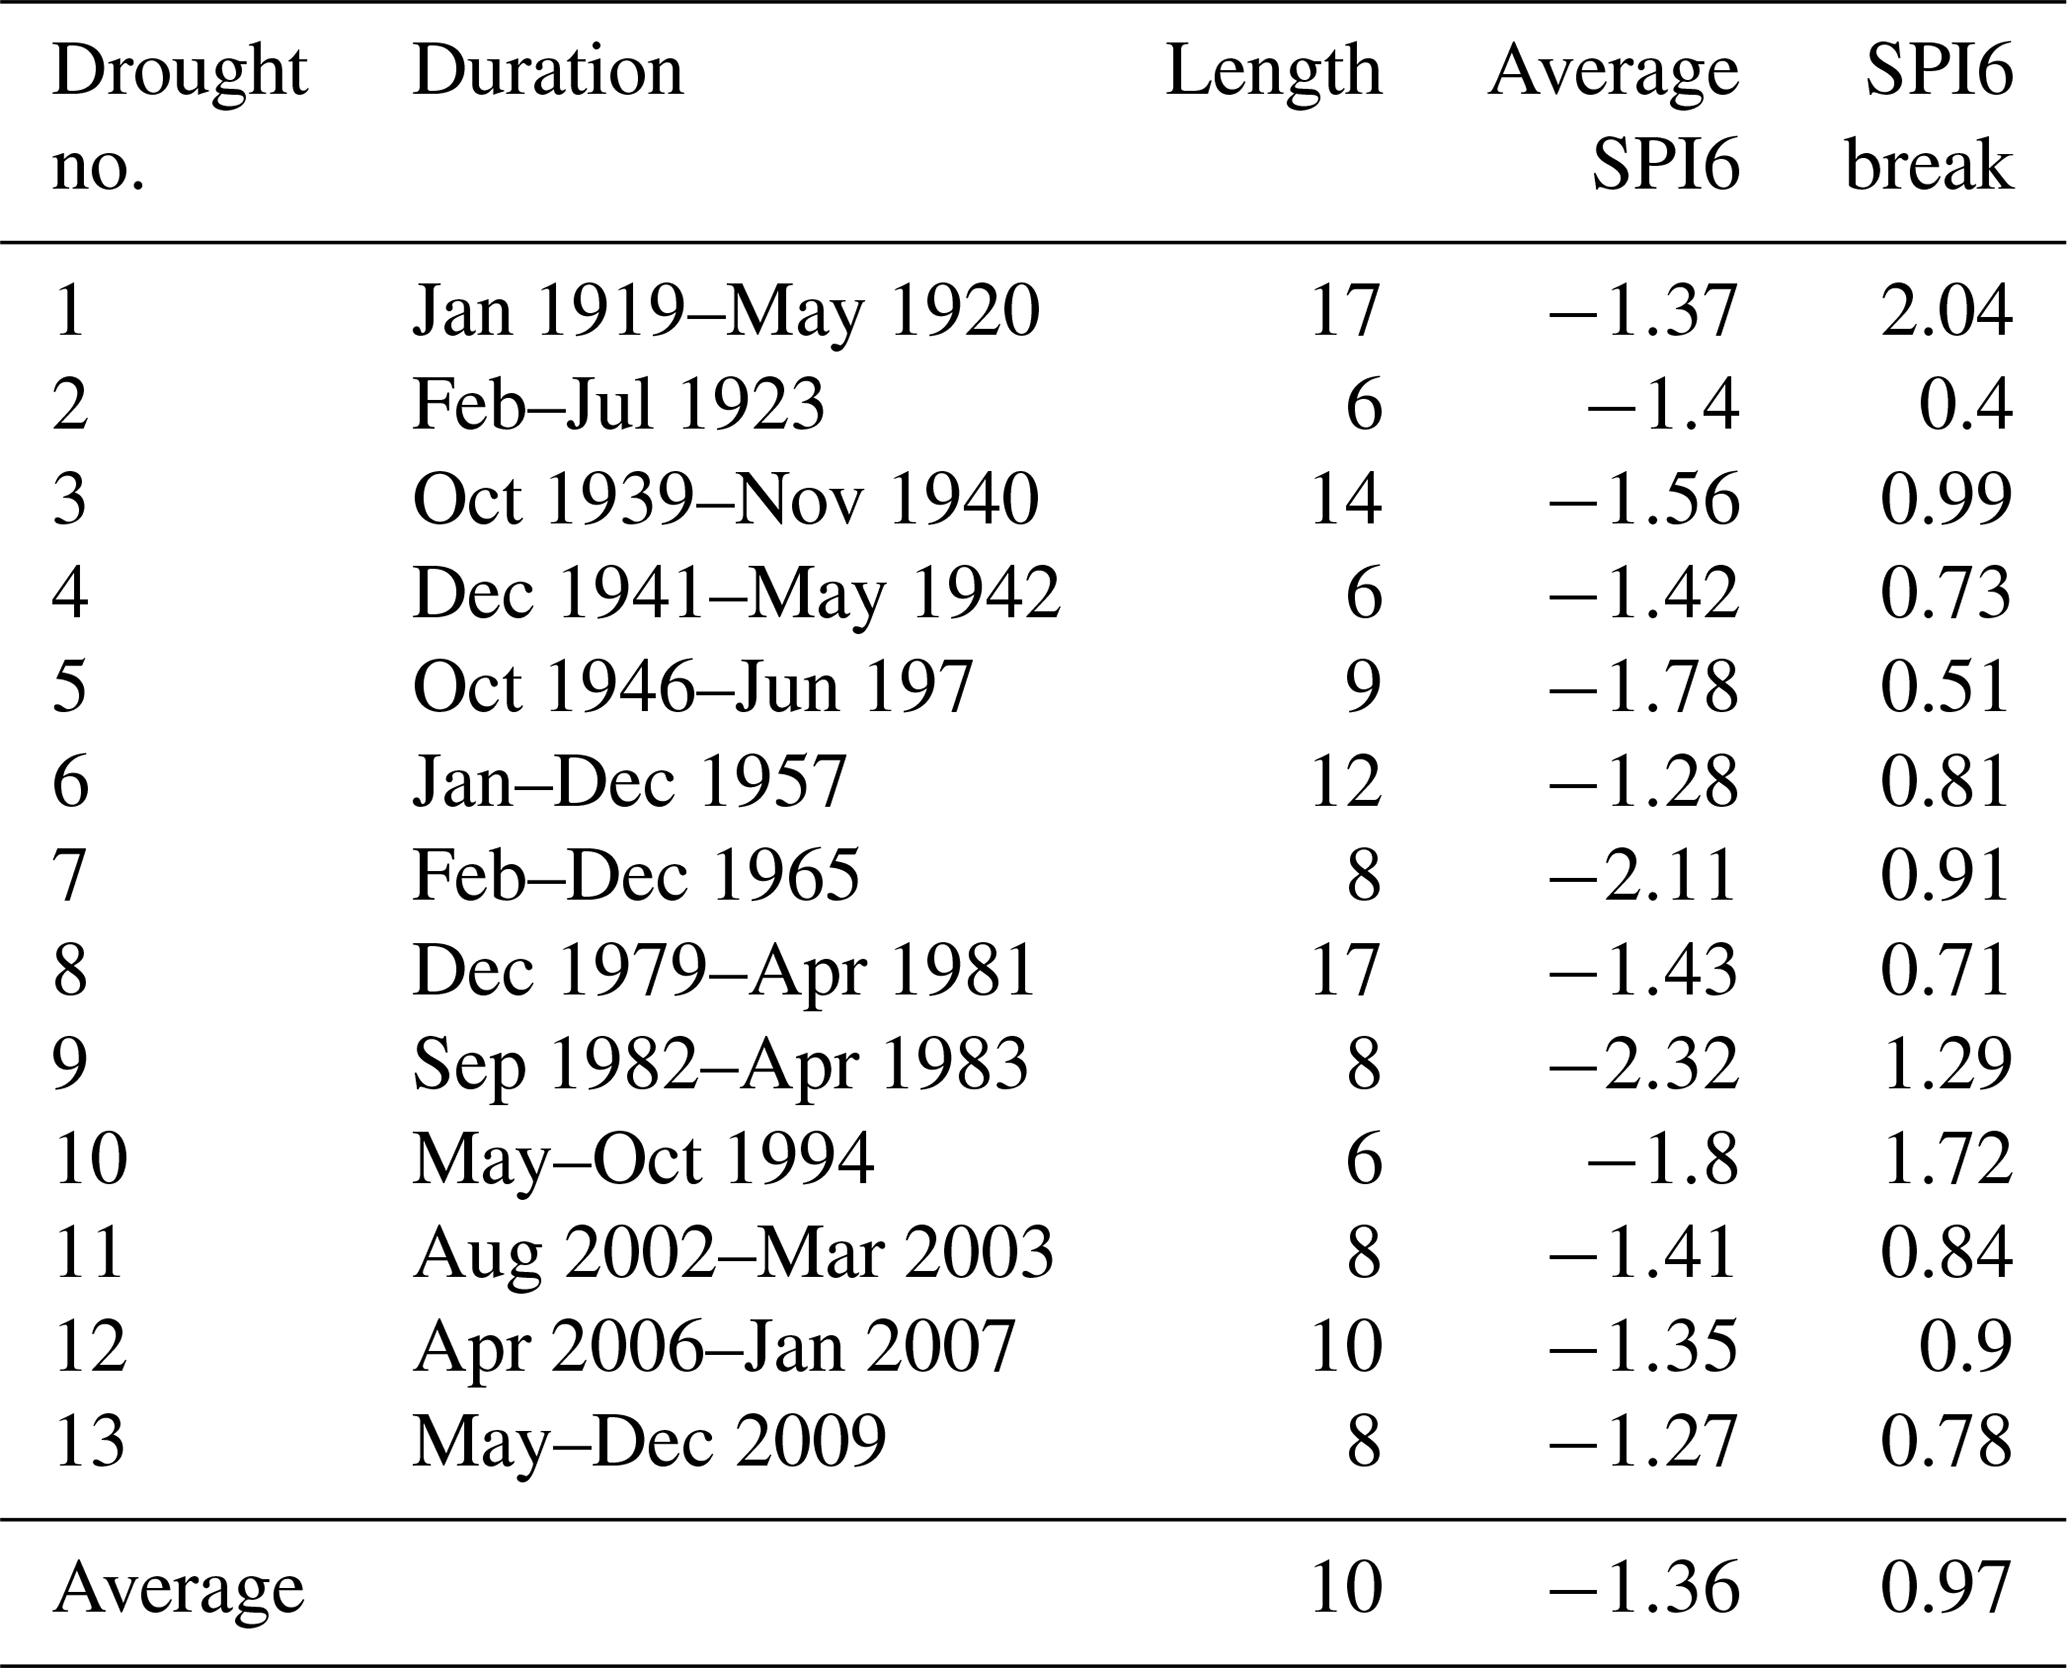
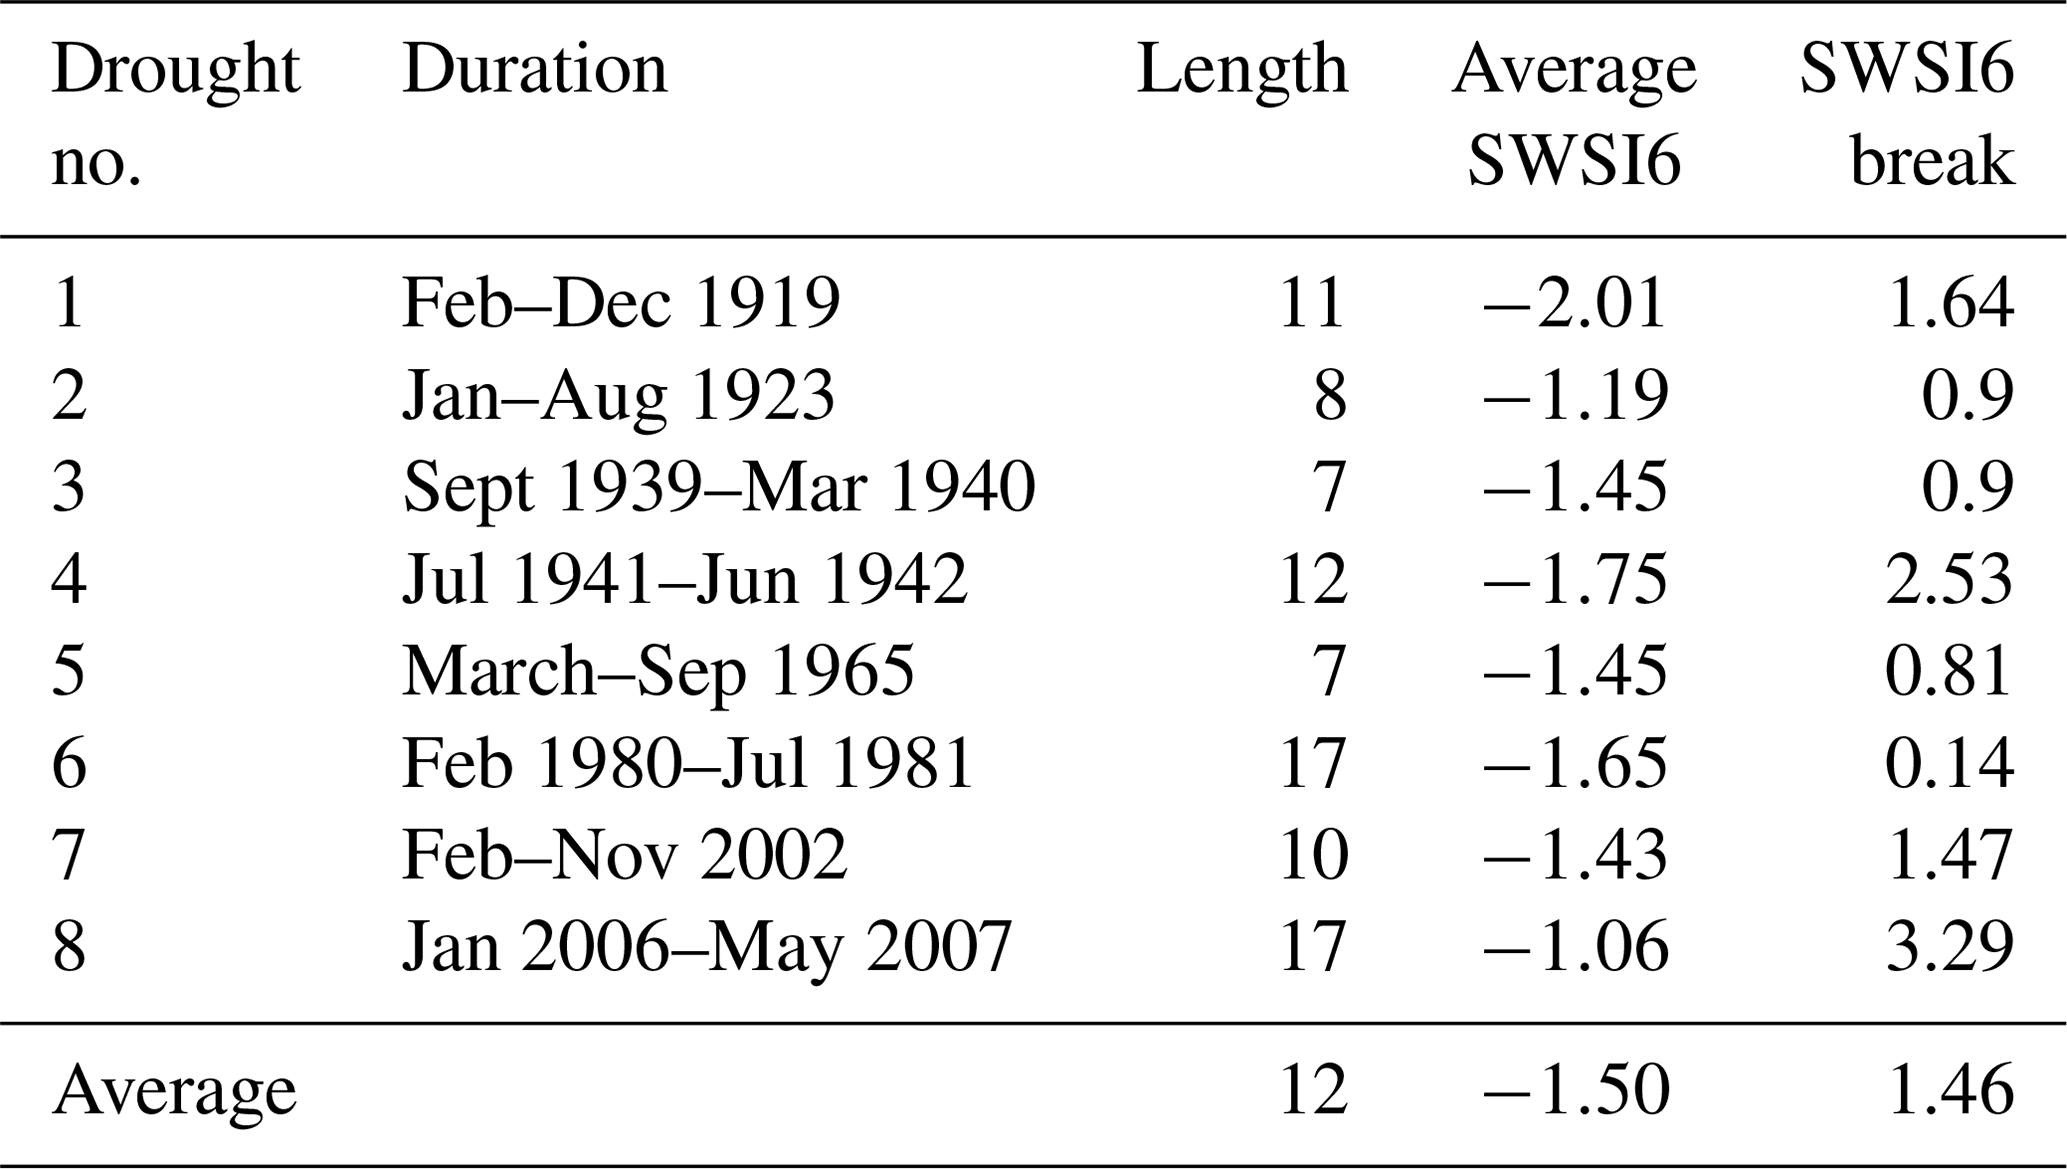
Table 3Summary of hydrological drought events identified using the SWSI6.
4.1 Drought identification
4.1.1 Defining the drought record
Figure 3 presents the SPI6 values derived for the study area from 1908 to 2014, with periods of meteorological drought highlighted. As shown, 13 drought events of varying severity occurred over the study period (Table 2). On average, these events lasted approximately 10 months, with the longest lasting 17 months and the shortest lasting 6 months. In terms of intensity, the meteorological droughts tend to be rated as “moderate” (McKee et al., 1993; 1995), with few severe to extreme periods experienced (average SPI6 value of −1.36). Drought events are punctuated by periods with positive SPI values, with a large change in the SPI in the month of drought termination (0.51–2.04). This indicates a large amount of rainfall occurring within a month (e.g., from a monsoon trough), leading to drought termination, which rapidly relieves drought stress on water availability and vegetation production.
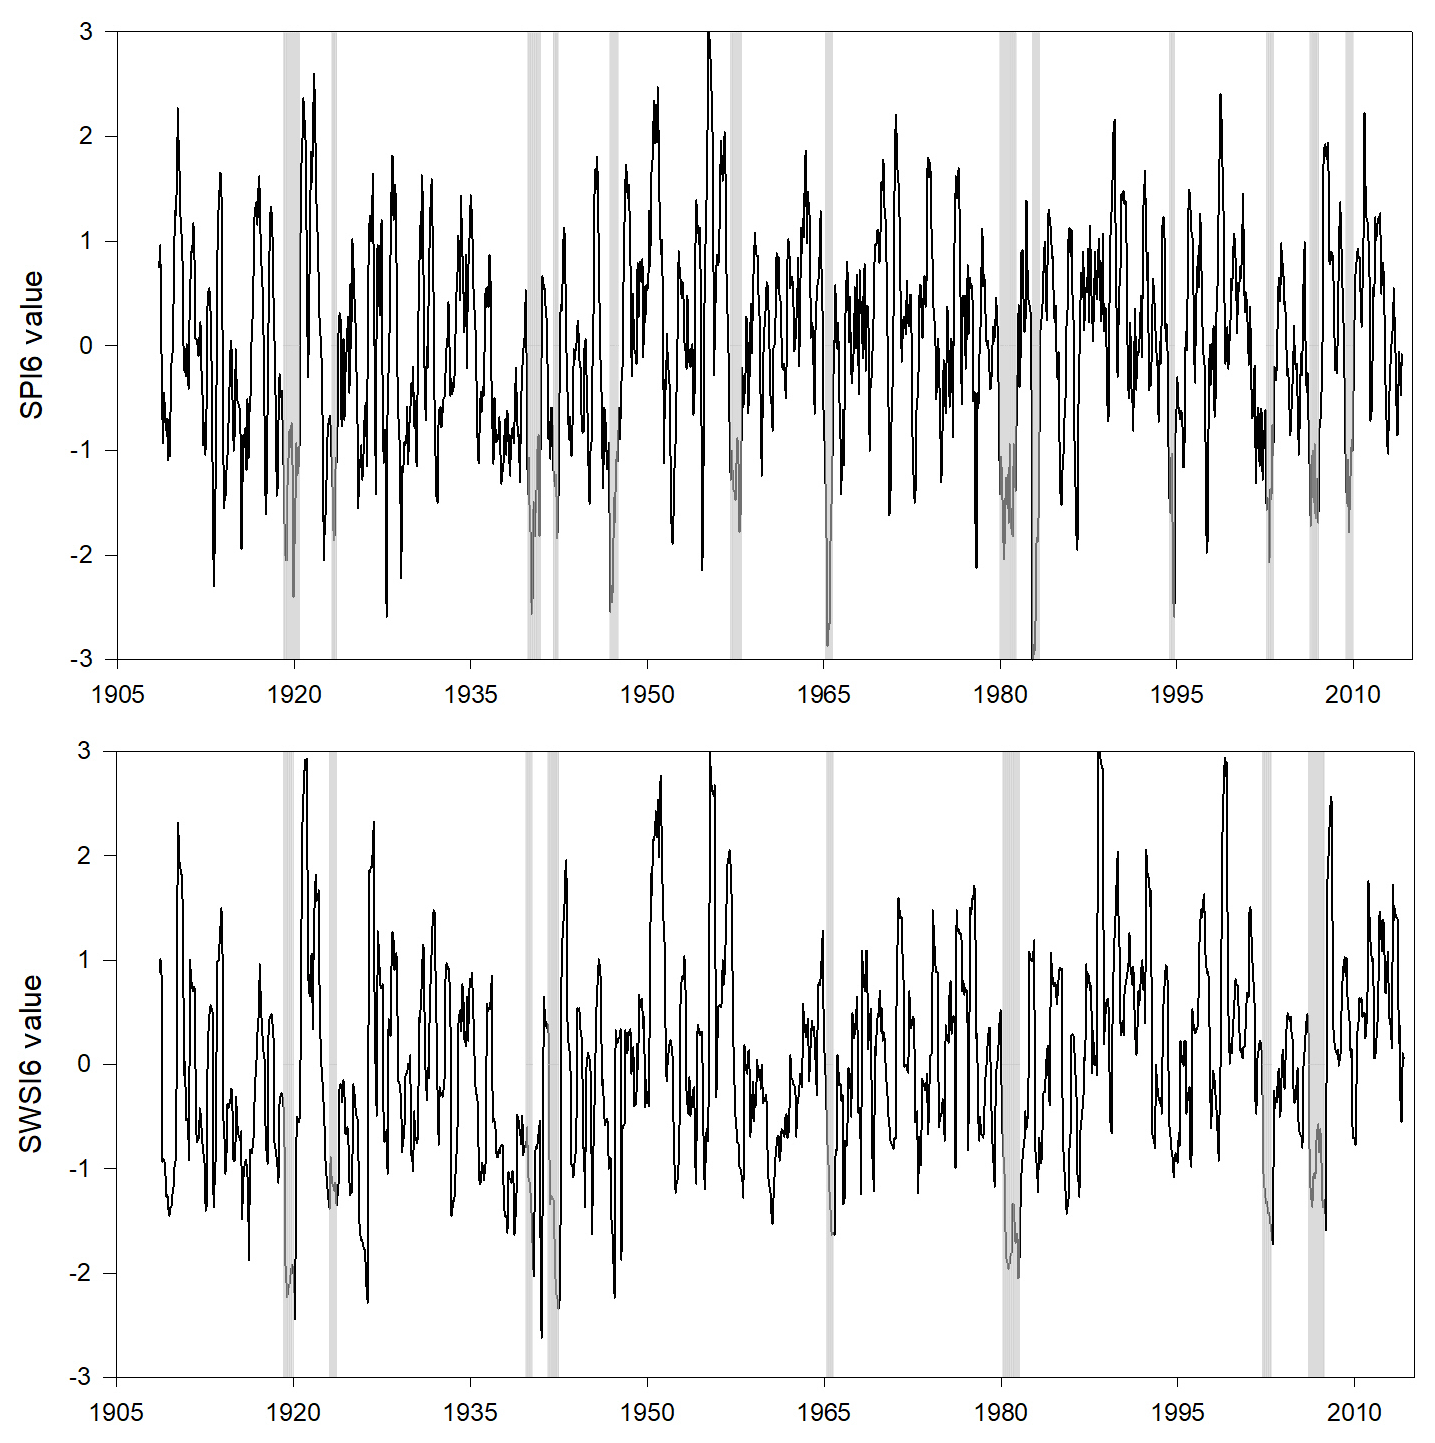
The SWSI6 values for the study area from 1908 to 2014 are also presented in Fig. 3, with eight hydrological drought events of varying intensity highlighted (Table 3). There is strong correlation between the SWSI6 and SPI6 within the study area (r=0.75, p<0.001), indicating that meteorological drought quickly leads to hydrological drought. Event intensities are quite variable (average SWSI6 of −1.50), while durations range between 7 and 17 months (an average of 11 months). Like the SPI6, the SWSI6 is strongly positive between drought periods, and there is a greater range in the magnitude of change in SWSI6 when drought events terminate (0.14–3.29). Again, this indicates a quick return to water surplus.
4.1.2 Rates of drought onset and termination
Figure 4 presents the rates of drought onset and termination for the study area for each drought identified in Sect. 4.1.1 as well as the average of all events. These have been calculated as the relative difference in SPI6 and SWSI6 in the 6 months (to match the index lengths) prior to and after the month of drought onset or termination. Both meteorological and hydrological droughts usually exhibit a steady rate of drought onset in the 6 months preceding drought onset, with average rates of and 0.21±0.12 SPI units per month, respectively. Rates of drought termination are similar to onset rates, with average rates of 0.23±0.16 and 0.21±0.16 SPI units per month for the respective drought indices; however, there are sharp breaks in the average slope 1 month prior to drought termination. The rates of onset and termination uphold the notion that drought is a “creeping” phenomenon and are terminated rapidly; this makes long-term prediction of drought onset, run length and termination difficult.
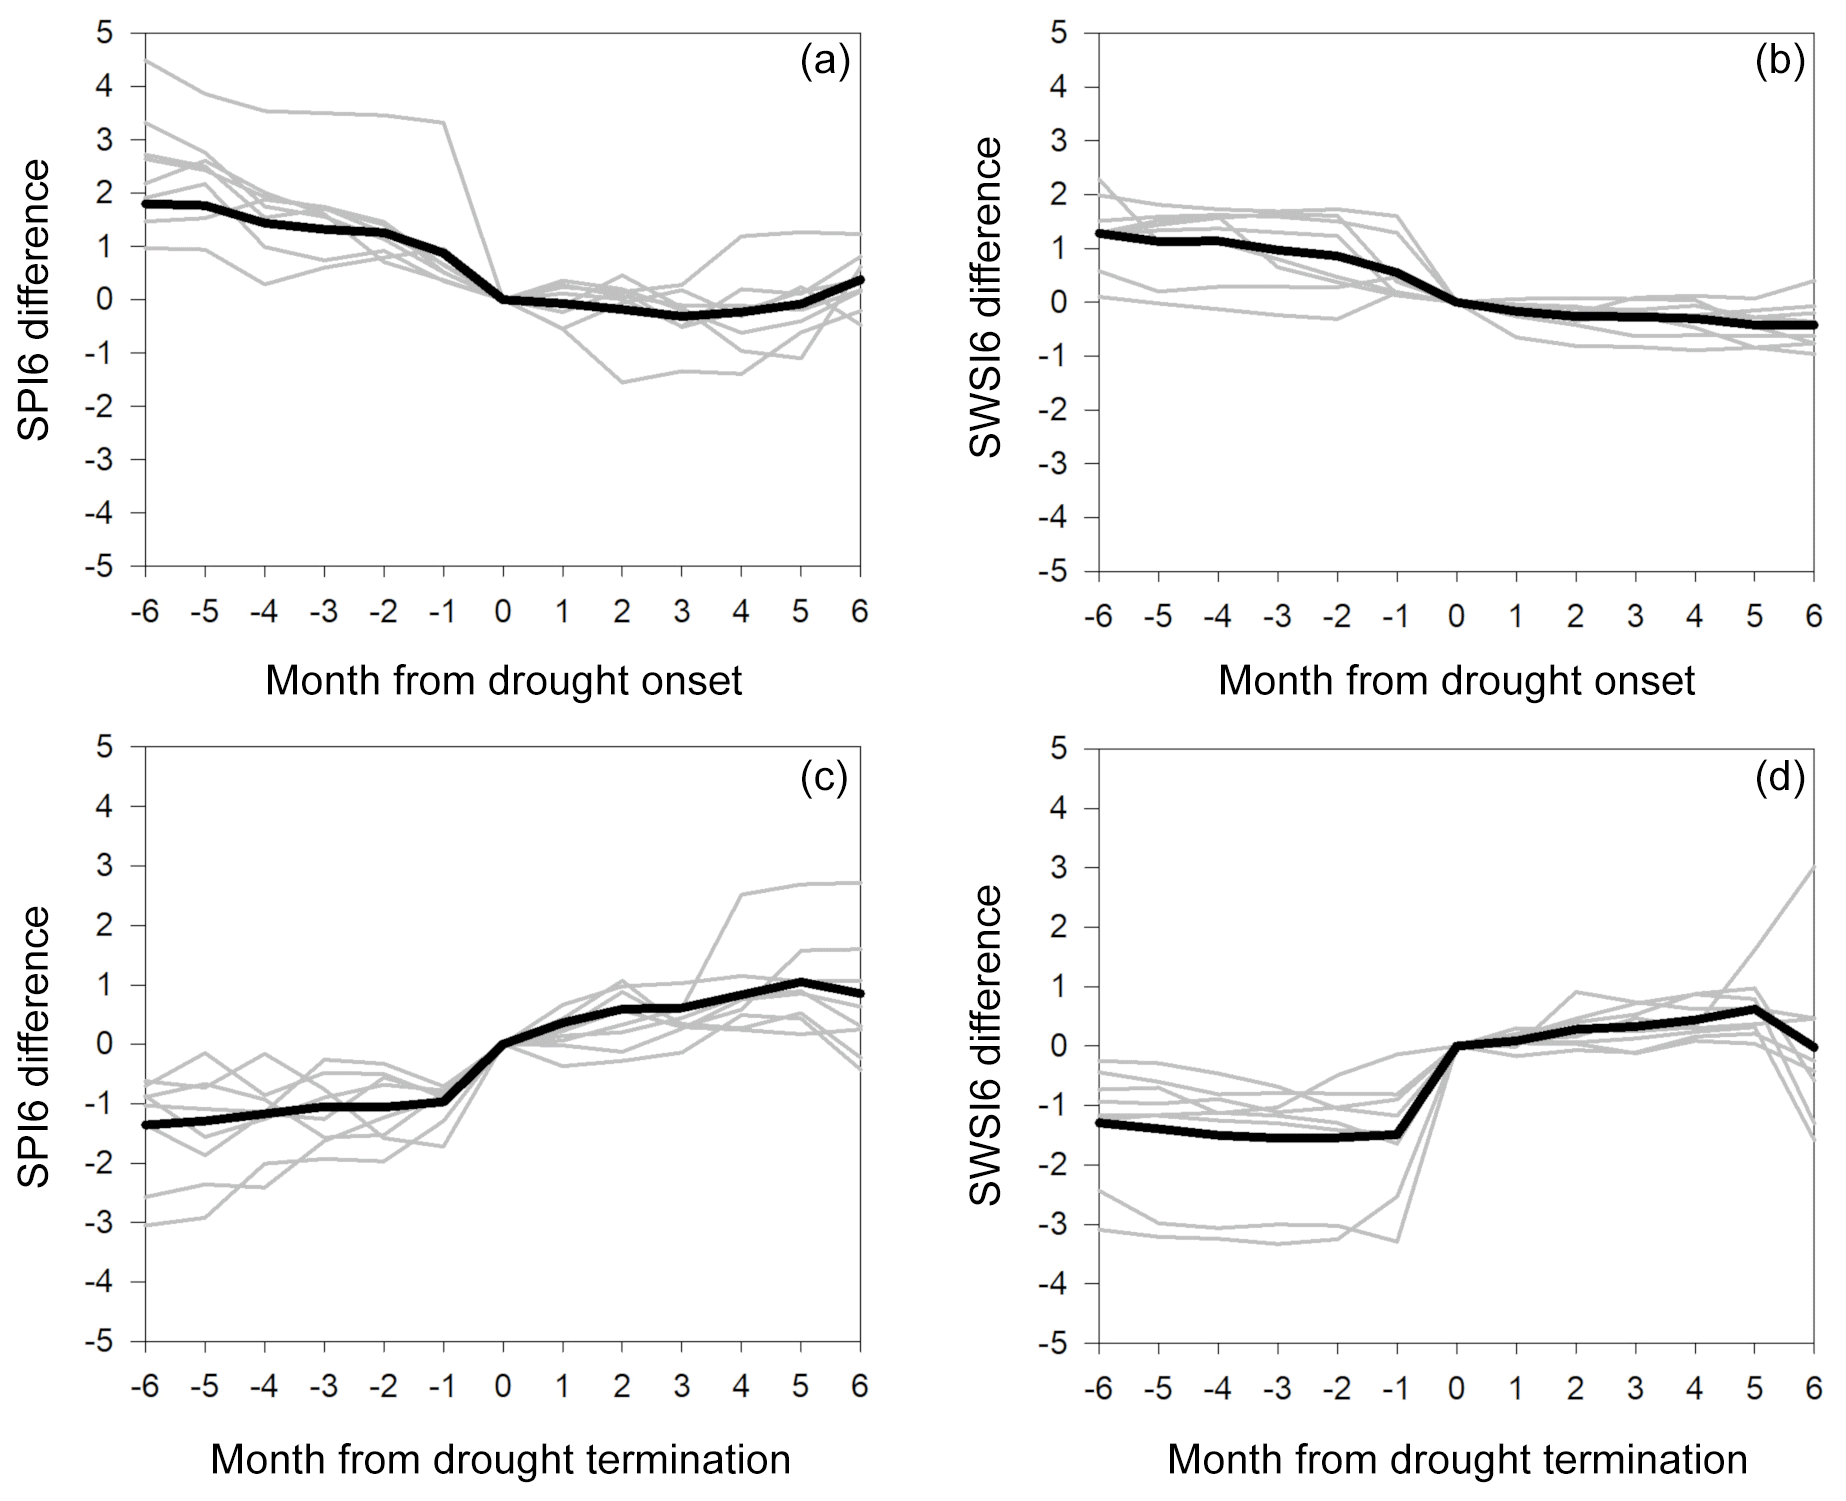
Figure 4Rates of drought onset (a, c) and termination (b, d) for the SPI6 (a, b) and the SWSI6 (c, d).
4.1.3 Causes of drought onset and termination
Figure 5 highlights the trends for each climate mode (as represented by the indices outlined in Sect. 3.5) during the 6 months leading into and following drought onset for the 13 droughts identified. The index thresholds for the various climate modes to be classified as a dry, wet or neutral phases (±0.5 SD) are also indicated. This shows that, in the 6 months prior to drought onset, ENSO tends to be in the neutral phase, with a large degree of variability. However, in most cases, there is a shift to El Niño conditions following month 0 (the month of drought initiation). The number of months with index values above 0.5 is greater following drought onset, with no droughts having values below −0.5 (i.e., La Niña conditions) once onset has occurred. This pattern indicates that ENSO may not be initiating drought but rather sustaining it. Indian Ocean sea surface temperatures (SSTs; represented by the II in Table 1) show a clear trend towards cooler SSTs in the east Indian Ocean 5 to 1 month before drought onset. In contrast to ENSO, the Indian Ocean SSTs trend towards neutral conditions post-onset. Over shorter lead times (2 months), the SAM also exhibits a transition towards more negative values leading up to the onset of drought and for an average of 4 months post-onset.
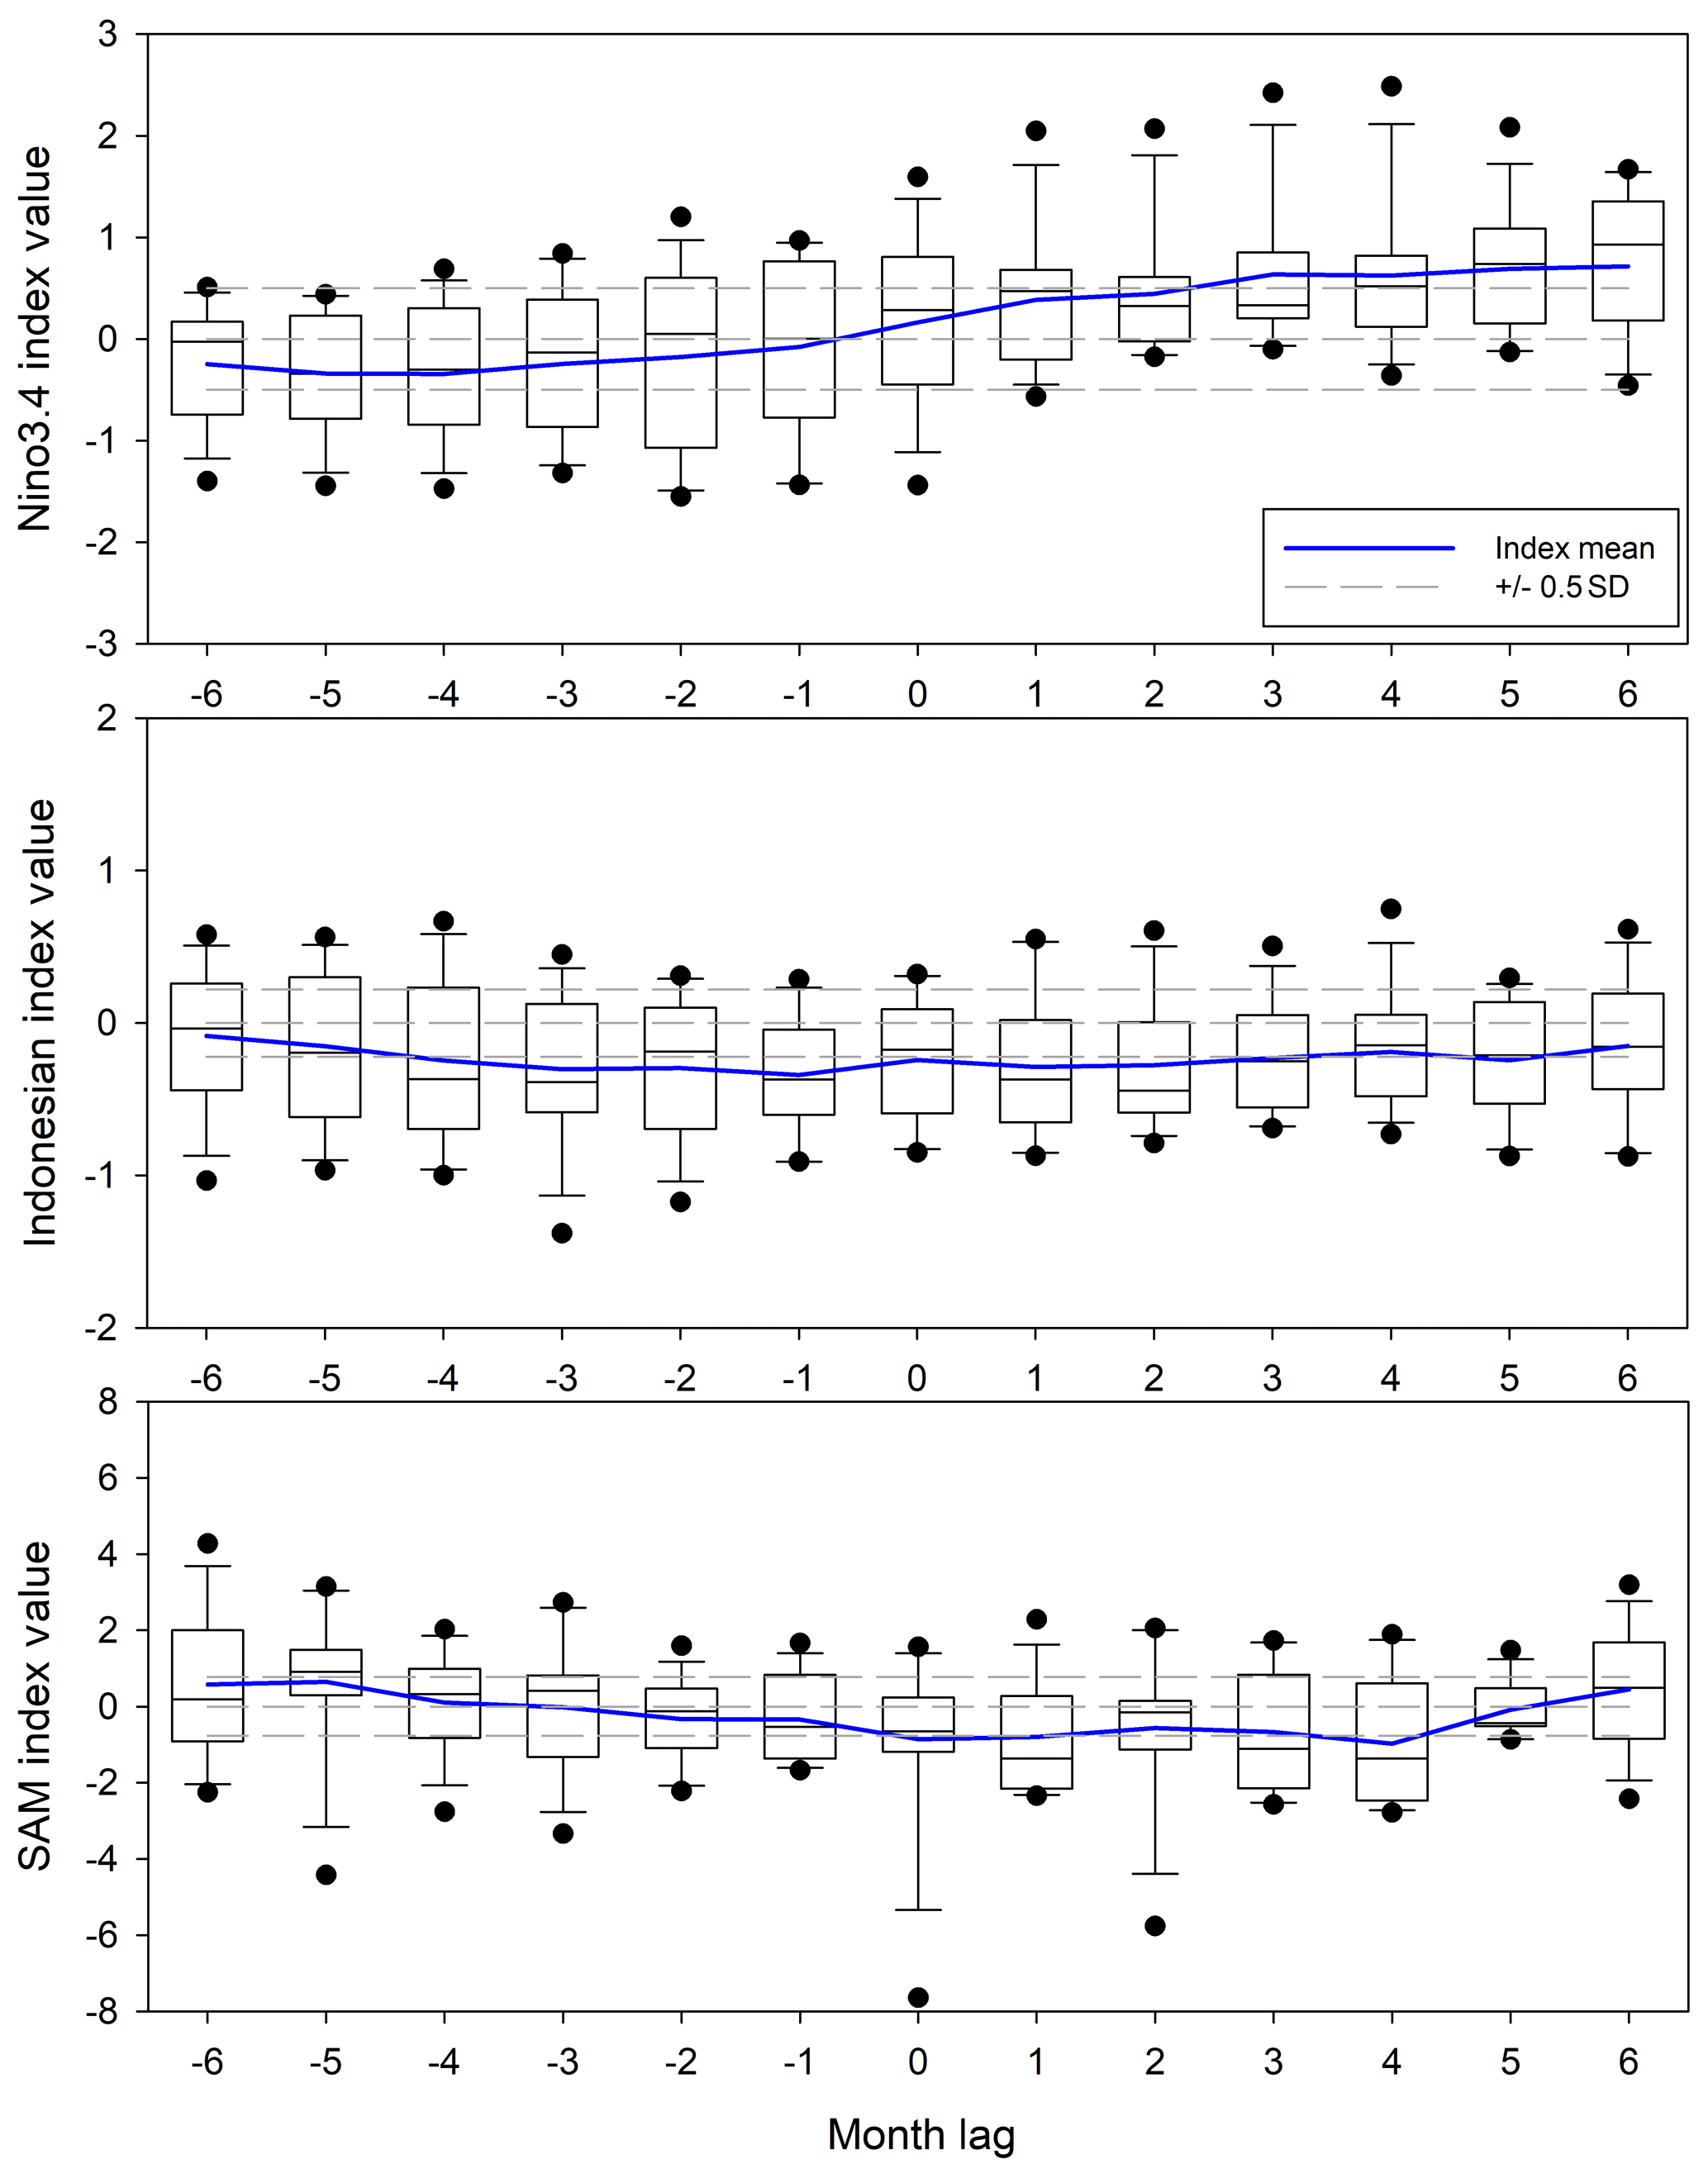
Figure 5Distribution of climate index values across the 6 months leading up to and after drought initiation.
The varying timing of the three climate modes' impact on drought is most likely due to the seasonal nature of each climate mode. A total of 9 out of 13 droughts in the study area initiate (month 0) in the 6-month period between September and February. Indian Ocean variability is most active during Austral winter and spring, and ENSO also primarily impacts New South Wales during the austral winter and spring; SAM, in comparison, is known to influence rainfall during spring and summer. Thus, it is proposed that a combination of cool SSTs in the eastern Indian Ocean and a negative SAM sets up the drought for our catchment and El Niño sustains it.
To further highlight this, droughts 4 (December 1941–May 1942) and 9 (September 1982–April 1983) are presented as case studies (Fig. 6). Drought 4 represents a drought onset, similar to the majority presented in Fig. 4, where there is a gradual decline in the SPI6 in the 6 months leading up to the drought. During this lead-up (June–December), negative II values represent cold SSTs in the northwest of Australia (and the eastern Indian Ocean), indicating a positive IOD. An El Niño event also developed at the same time, along with a positive Niño3.4 trend (0.5<1). It is this sustained effect of these two climate drivers in their “dry phase” that led to the persistence of this drought. Drought 9, however, is an anomalous drought in terms of onset, with a more rapid rate of onset than the mean rate in Fig. 4. This drought is well recognized as having all three drivers locked into their dry phase (Verdon-Kidd and Kiem, 2009). This is shown in Fig. 6b, where a positive SAM during autumn–winter leads to negative II values during winter–spring, which is followed by an El Niño event.
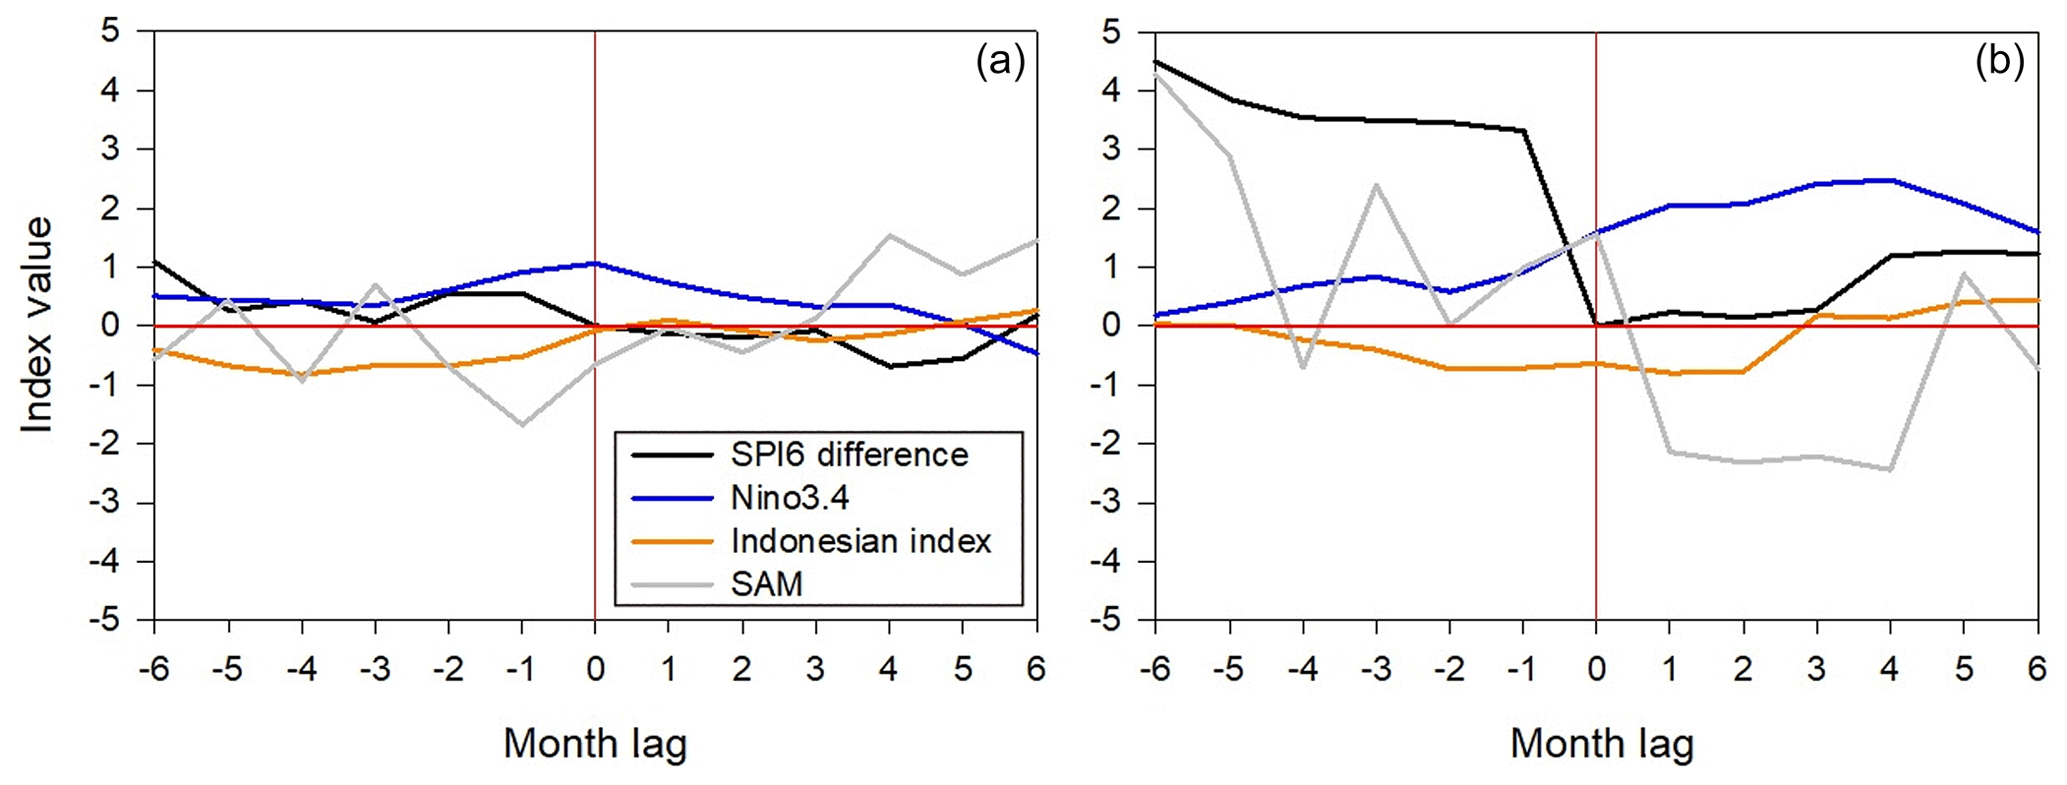
Figure 6Climate index values for Nino3.4, II and SAM as well as the SPI6 for the 6 months prior to and post-drought onset for (a) drought 4 (onset in December 1941) and (b) drought 9 (onset in September 1982).
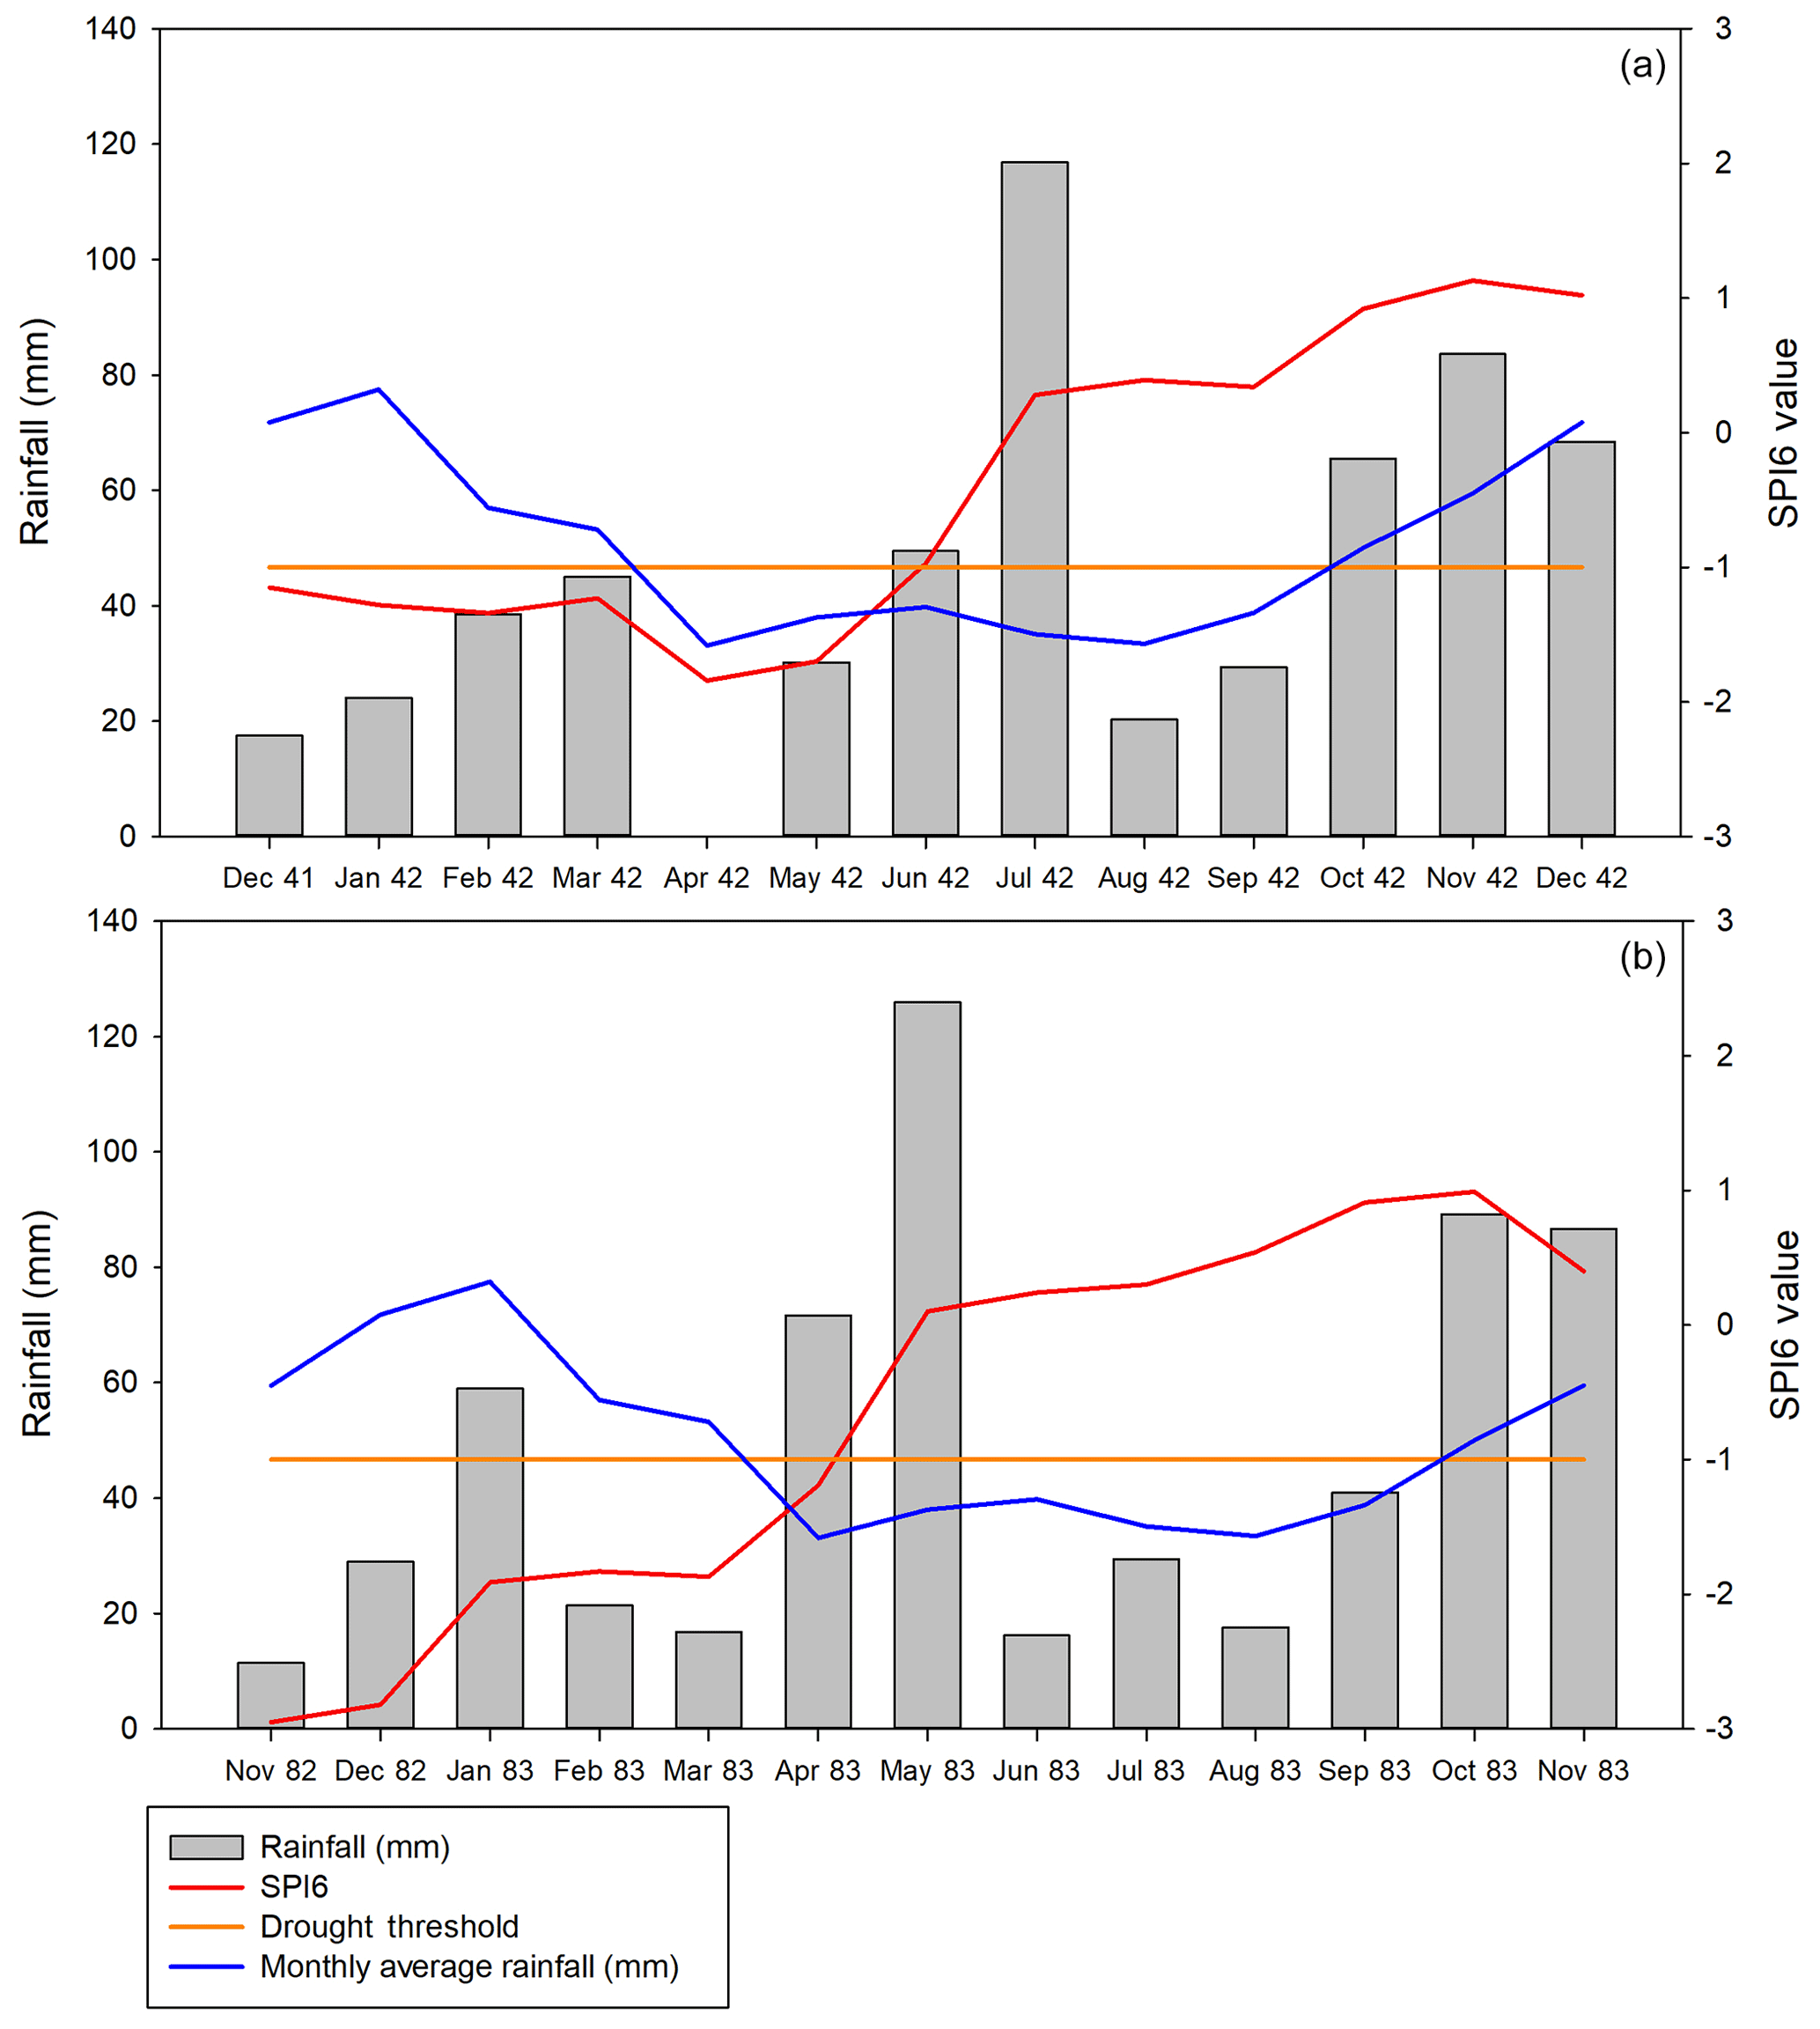
Figure 7Changes in SPI6 and monthly rainfall during drought termination for drought 4 (a) and drought 9 (b).
The changes in SPI6, monthly rainfall totals and the average monthly rainfall totals in the 6 months before and after drought termination for droughts 4 and 9 are presented in Fig. 7. Rainfall deficits are maintained by below average rainfall in the 6 months leading up to drought termination, with above average rainfall falling during the month of and month after drought termination. This is shown in the abrupt termination of meteorological and hydrological droughts in Fig. 3 and by the large breaks in the SPI6 and SWSI6 in Tables 2 and 3, respectively. This is consistent with the notion that droughts are most often broken abruptly by synoptic events (e.g., Verdon-Kidd et al., 2017). Figure 8 shows anomalies in geopotential height for the 2 months prior to and post-drought termination for droughts 4 and 9. Both time series show high-pressure systems dominating in eastern Australia prior to drought termination followed by the development of a low-pressure system across the west and southwest. During drought termination, monsoon troughs (denoted by a “dip” in the isobars) cause widespread sustained rainfall across much of eastern Australia. These are then followed by low-pressure systems developing in northern Australia that bring further rainfall, as reflected in Fig. 7. These synoptic patterns reflect the sharp changes in the SPI6 during drought termination and show that droughts are ended abruptly by synoptic-scale events, in contrast to their prolonged onset.
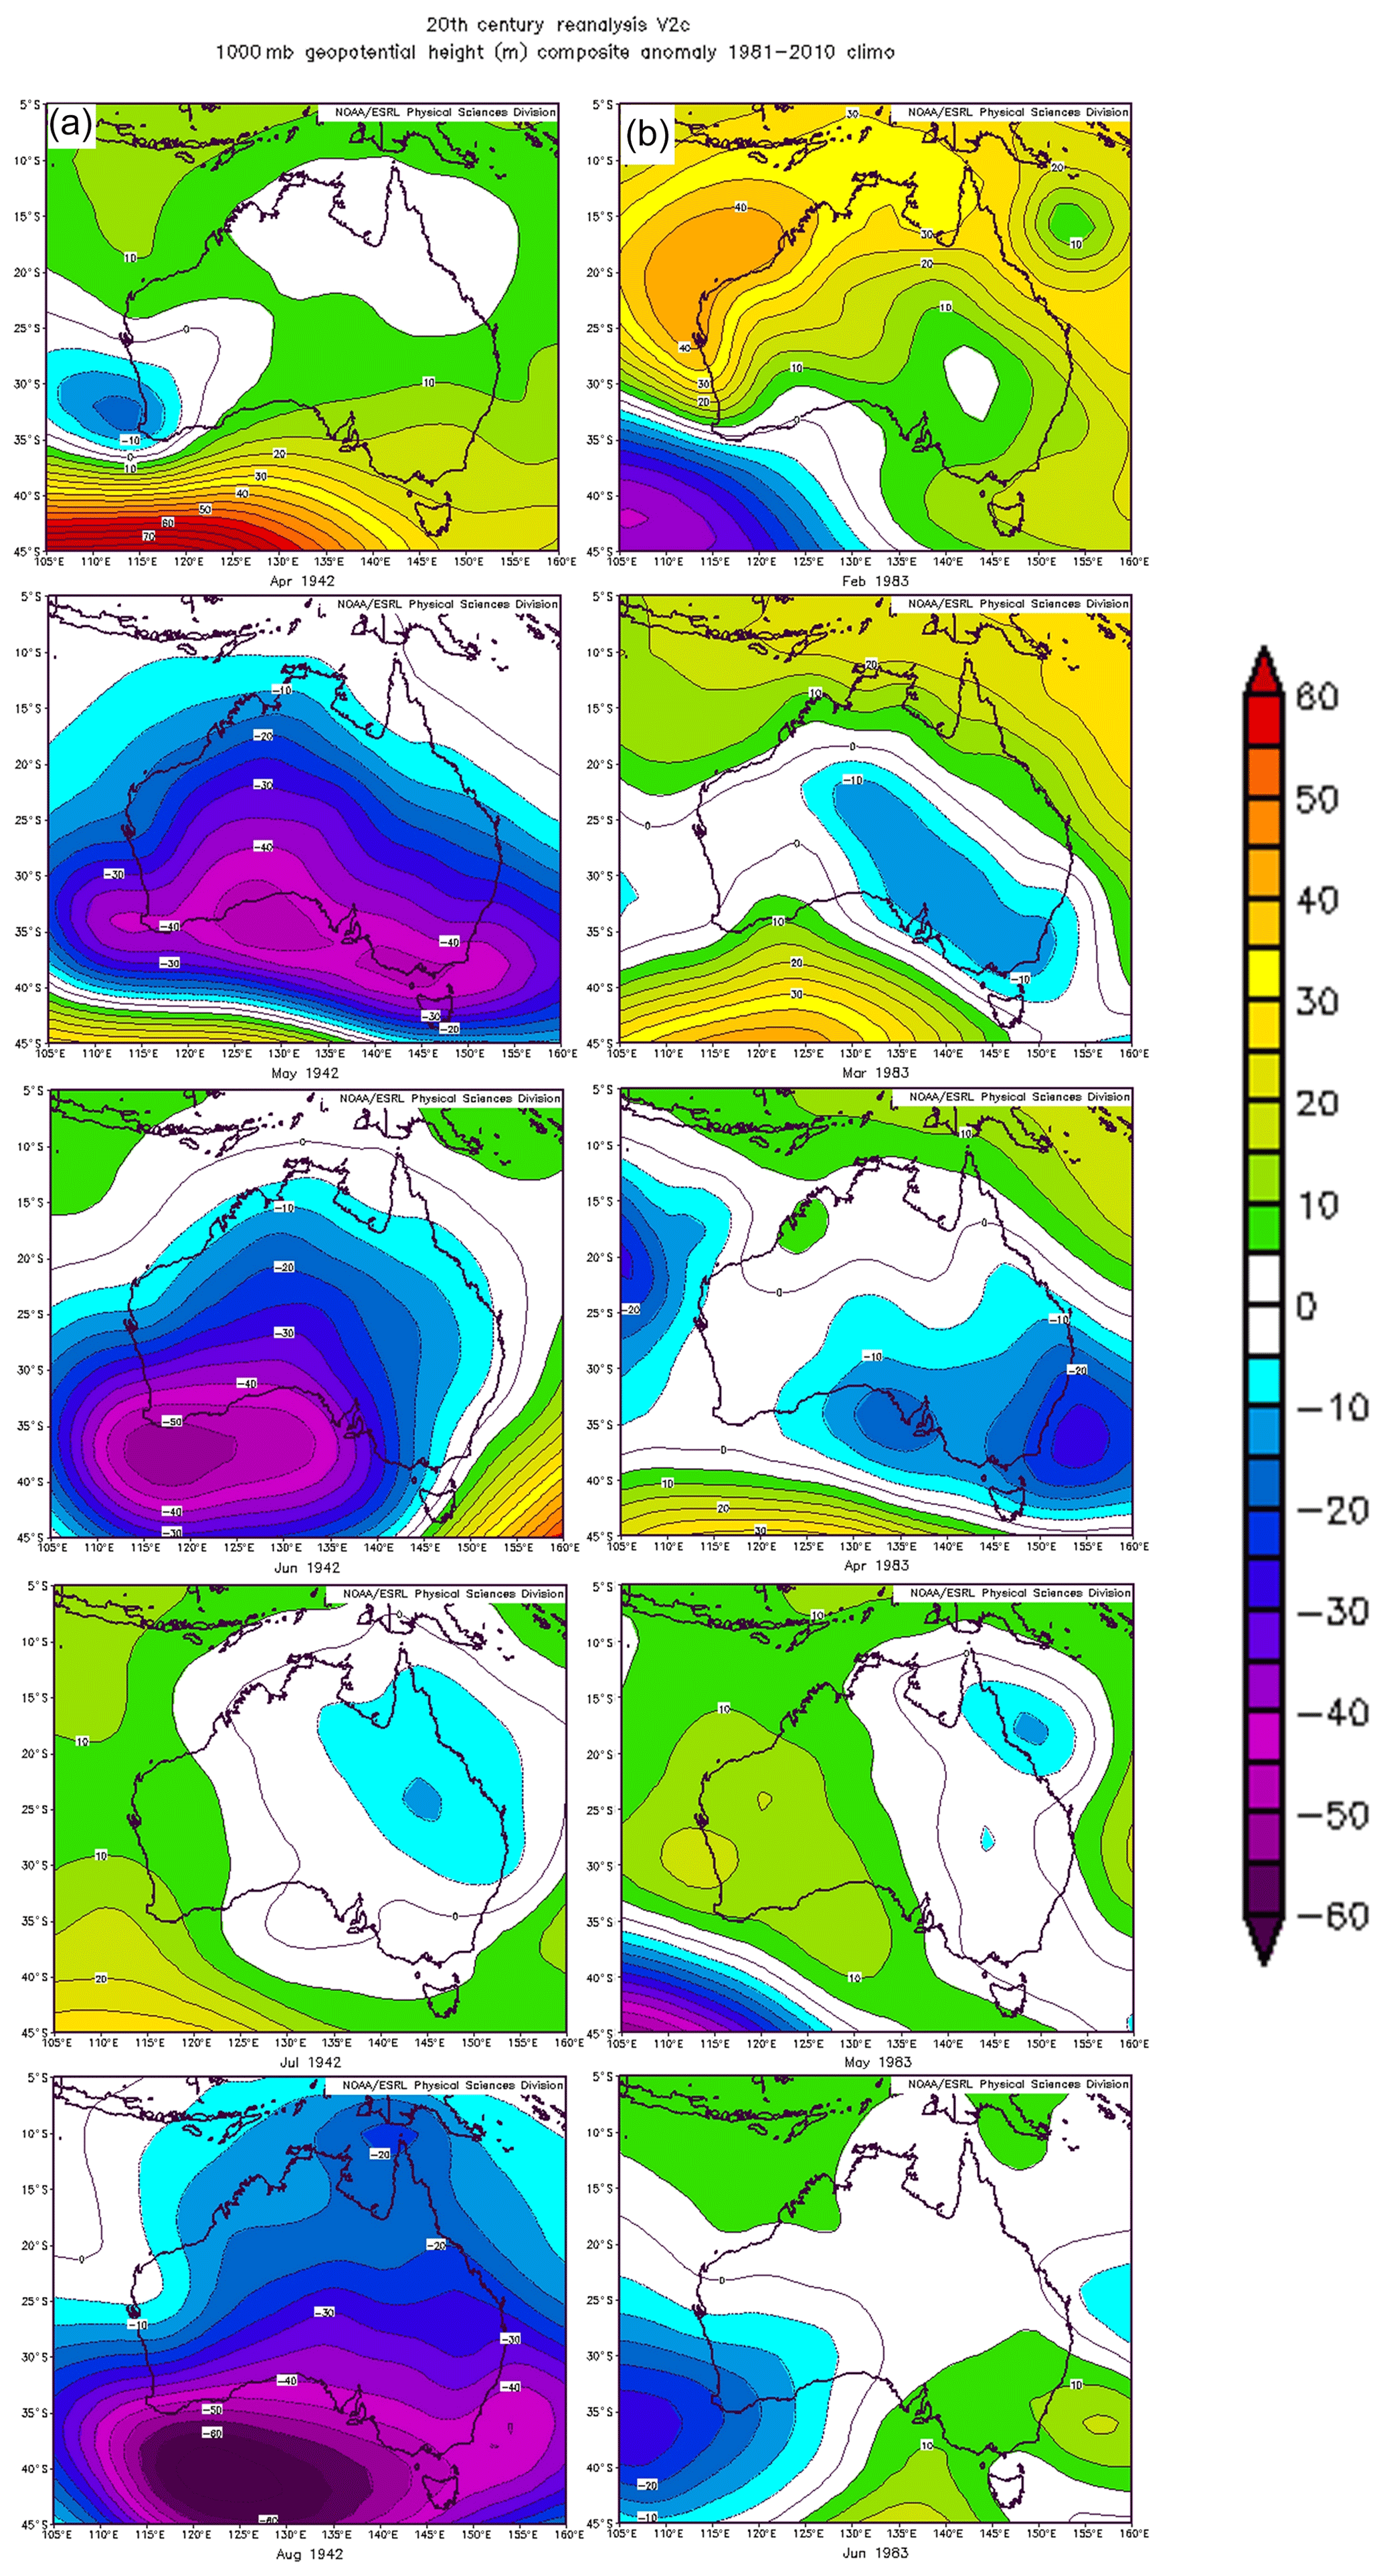
Figure 8Geopotential height anomalies (in meters) for the 2 months before and after drought onset for (a) drought 4 (April 1943 to August 1943, from top to bottom) and (b) drought 9 (February 1983 to June 1983, from top to bottom).
4.2 Changes in the long-term rainfall–runoff relationship
Figure 9 presents the annual rainfall–runoff relationships during the drought periods that were identified using the methods in Sect. 3.4. These closely align with the longer-term drought events identified using the SPI6 and SWSI6 (Tables 2 and 3, respectively). Drought causes a downward shift in the relationship in all drought periods; however, this shift is not statistically different to the annual rainfall–runoff relationships. Following the conclusions of Saft et al. (2015), this indicates that the catchment is able to recover from drought with no long-lasting hydrological impacts.
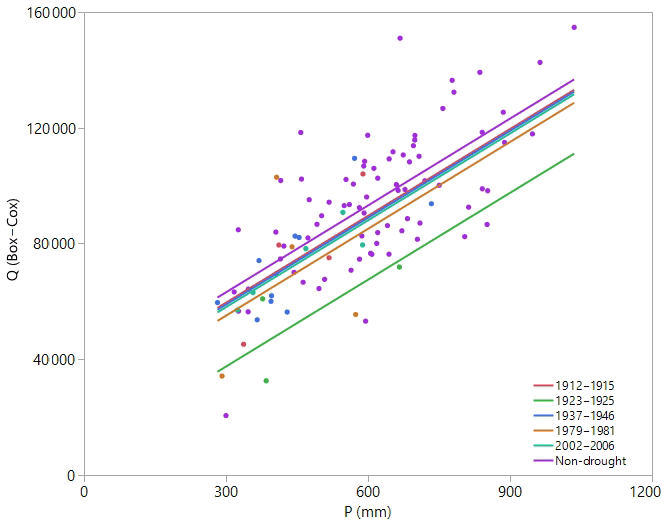
Figure 9Rainfall–runoff relationships for the drought periods and non-drought periods identified using the methods of Saft et al. (2015).
4.3 Drought propagation and catchment response
Few studies explore how the effects of rainfall deficits propagate throughout a catchment (van Dijk et al., 2013; Kiem et al., 2007). This is a significant challenge with respect to improving the understanding of drought and developing better forecasting and drought response policy (Kiem et al., 2007). Using the Millennium Drought as a case study, catchment-wide vegetation and soil moisture responses to rainfall deficiencies were assessed to quantify drought resilience.
4.3.1 Rainfall distribution
Given the persistent nature of the Millennium Drought and the widespread impacts on agriculture in eastern Australia (Nicholls, 2004; Verdon-Kidd and Kiem, 2009; Vance et al., 2014), in this section we investigate how this major drought affected our study catchments. Figure 10 presents annual catchment-averaged rainfall totals for the Merriwa River and Krui River catchments derived from the SASMAS data and the annual rainfall totals from the BoM Roscommon station. Average annual rainfall totals for the drought period were 668, 619 and 550 mm for the Merriwa, Krui and Roscommon datasets, respectively, whereas during the non-drought period they were 65, 647 and 664 mm, respectively. In comparison, the long-term average annual rainfall total for the BoM Roscommon site was 603 mm. Thus, these values represent annual declines of 2 %–5 %. The coefficients of variance for annual rainfall, for all years of data from 2003 to 2015, were 36 %, 26 % and 29 % for each respective dataset, whereas the long-term value for Roscommon (1970–2015) was 23 %.
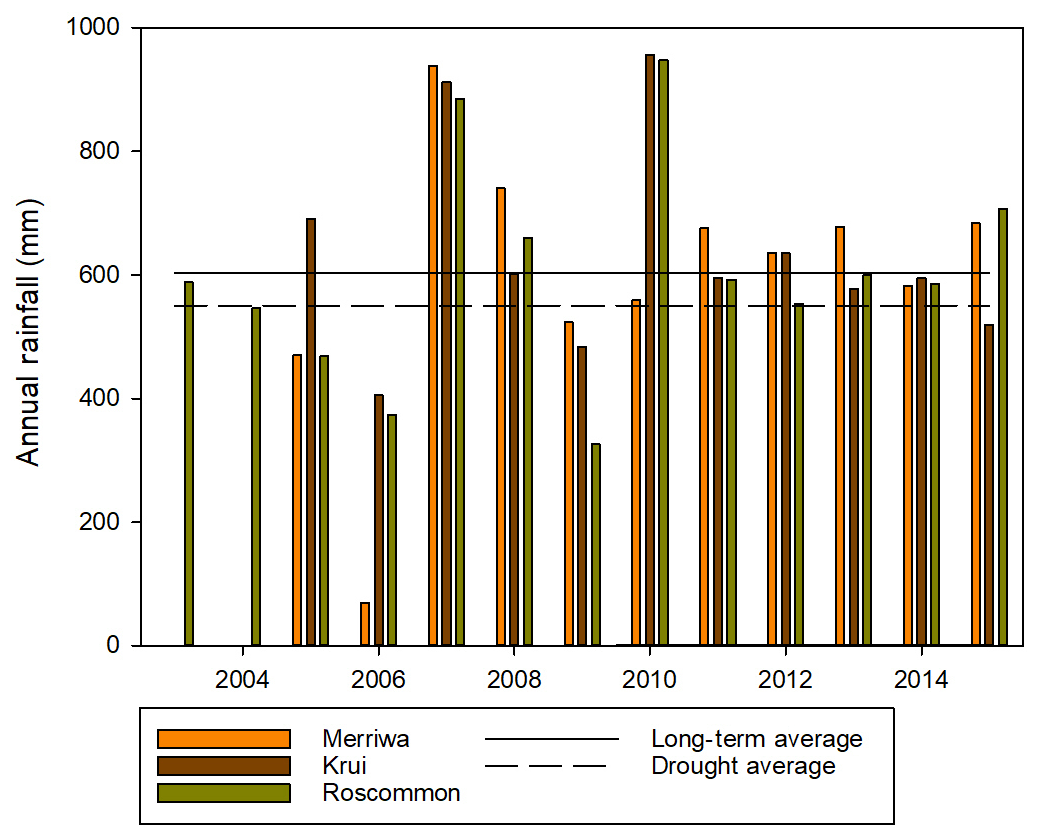
Figure 10Total annual rainfall for the Krui and Merriwa SASMAS stations (an average from all stations) and the BoM Roscommon station from 2003 to 2015. Note that a significant amount of data was missing from Merriwa rainfall totals in 2006 and 2010. The long-term average for the Roscommon site and the drought period average across the three datasets are also presented.
It is widely accepted that the Millennium Drought was strongly seasonal (autumn/winter) in nature (Verdon-Kidd and Kiem, 2009). Therefore, the annual totals may not reveal the nature of the drought's impact on the catchment. Thus, the seasonal medians were compared between the drought (2003–2009) and post-drought (2010–2015) periods for the catchment-specific and BoM station data (Fig 11). The percent change in the seasonal medians during the drought period compared with the long-term rainfall record at Roscommon (1970–2015) is also shown. All three datasets show a decrease of 20 %–50 % in autumn rainfall during the drought period. Interestingly, spring rainfall was also reduced (31 %) across the Krui catchment; however, spring rainfall was higher (by 30 %) in the Merriwa catchment during the drought. These differences over a small geographic range highlight the need to assess drought characteristics at the catchment level. Summer rainfall during the drought period shows little variation from the non-drought periods for either catchment.

Figure 11Change in the seasonal median rainfall (%) from the drought period (2003–2009) to the post-drought period (2010–2015) as well as between the drought period and the Roscommon long-term record (1970–2015).
4.3.2 NDVI
Figure 12 presents the standardized NDVI time series for the Merriwa and Krui catchments from 1982 to 2015. The periods of meteorological and hydrological drought as defined using the SPI6 and SWSI6 are also highlighted (Sect. 4.1.1). The NDVI is well correlated with the SPI6 (r=0.56, p<0.001), and this correlation is not improved by applying monthly time lags. This shows that the propagation from meteorological drought to agricultural drought is rapid compared with other studies (e.g., Verdon-Kidd et al., 2017). This is an important aspect of using the SPI6 to quantify drought here. A response between rainfall and vegetation may not be seen at short timescales; however, using the longer-term SPI highlights the response of vegetation after sustained rainfall deficits (Dettinger, 2013; Verdon-Kidd et al., 2017). Nevertheless, while the catchment is impacted by drought, vegetation also recovers quickly from rainfall after drought.
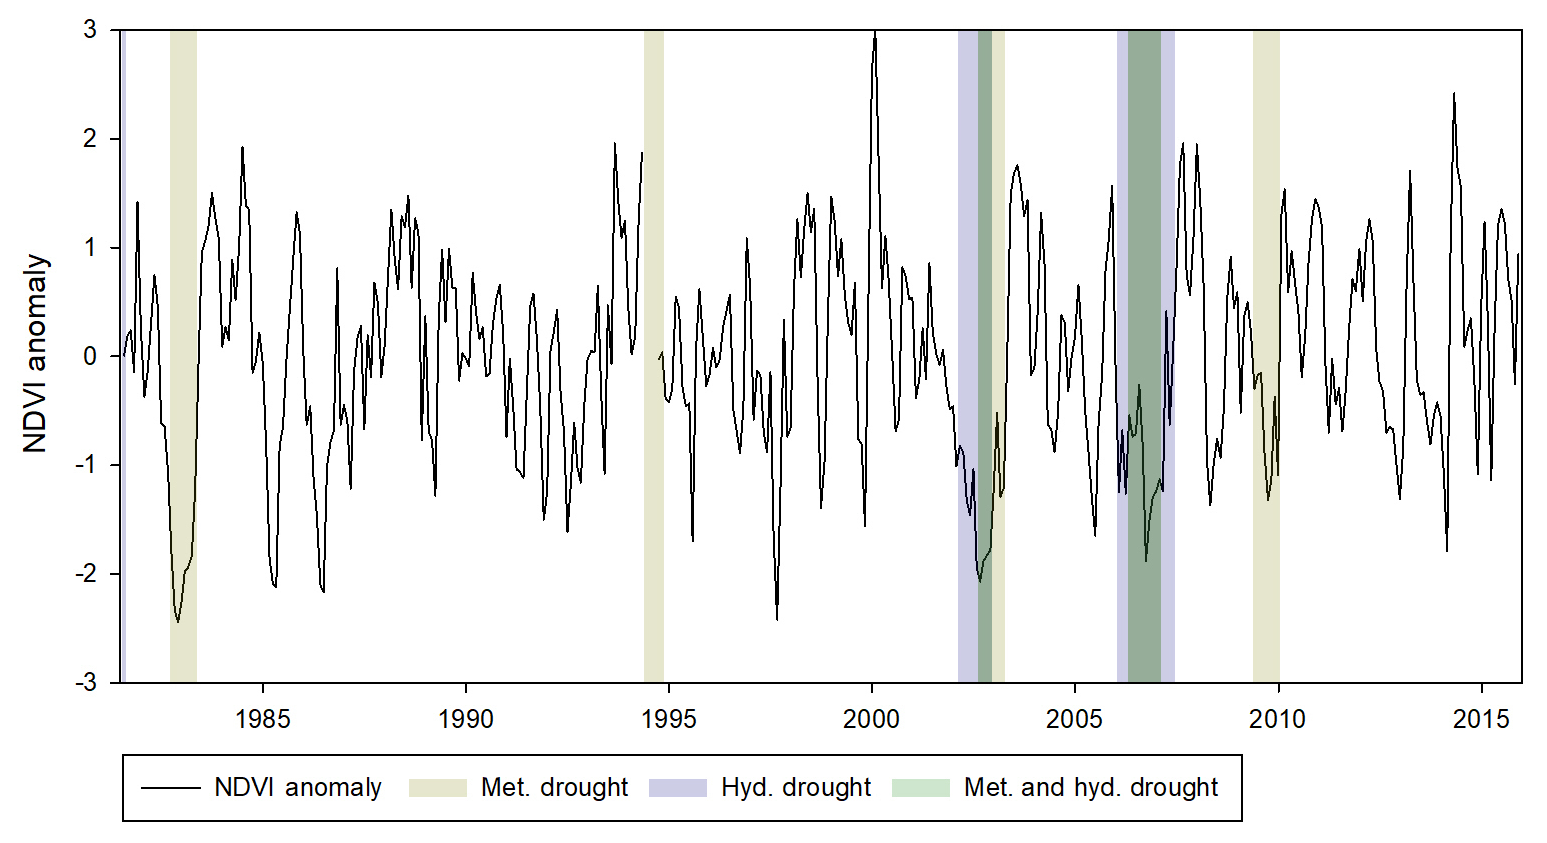
Figure 12Time series of the AVHRR and MODIS NDVI anomaly for the Merriwa and Krui catchments.
4.3.3 Soil moisture
Figure 13 presents daily catchment-averaged soil moisture time-series data from 2003 to 2015. Coefficients of variance for the median daily average soil moisture in the Krui catchment are 28 %, 23 % and 17 % for depths of 0–300, 300–600 and 600–900 mm, respectively; within the Merriwa catchment the coefficient of variance values are 45 %, 31 % and 20 %, respectively. Average soil moisture across the soil profile is well correlated with the SPI6 (r=0.58, p<0.001), although again, this was not improved by applying monthly time lags. This indicates that the impacts of meteorological drought propagate quickly through the catchment. For example, all depths across both catchments show decreases in the median soil moisture from year to year for drought events during the period from 2004 to 2005 and in 2009. Similarly, increases in median daily soil moisture also occur at comparable times to drought termination; the years 2007 and 2010 show strong increases in the median daily soil moisture that correspond to the end of drought events. The strong correlation with the SPI6 and the declines in soil moisture during drought periods indicate that the study area is impacted by drought. However, similarly to the NDVI, this correlation and small variance indicate that the catchment responds quickly to drought termination, showing that the catchment is resilient to drought.
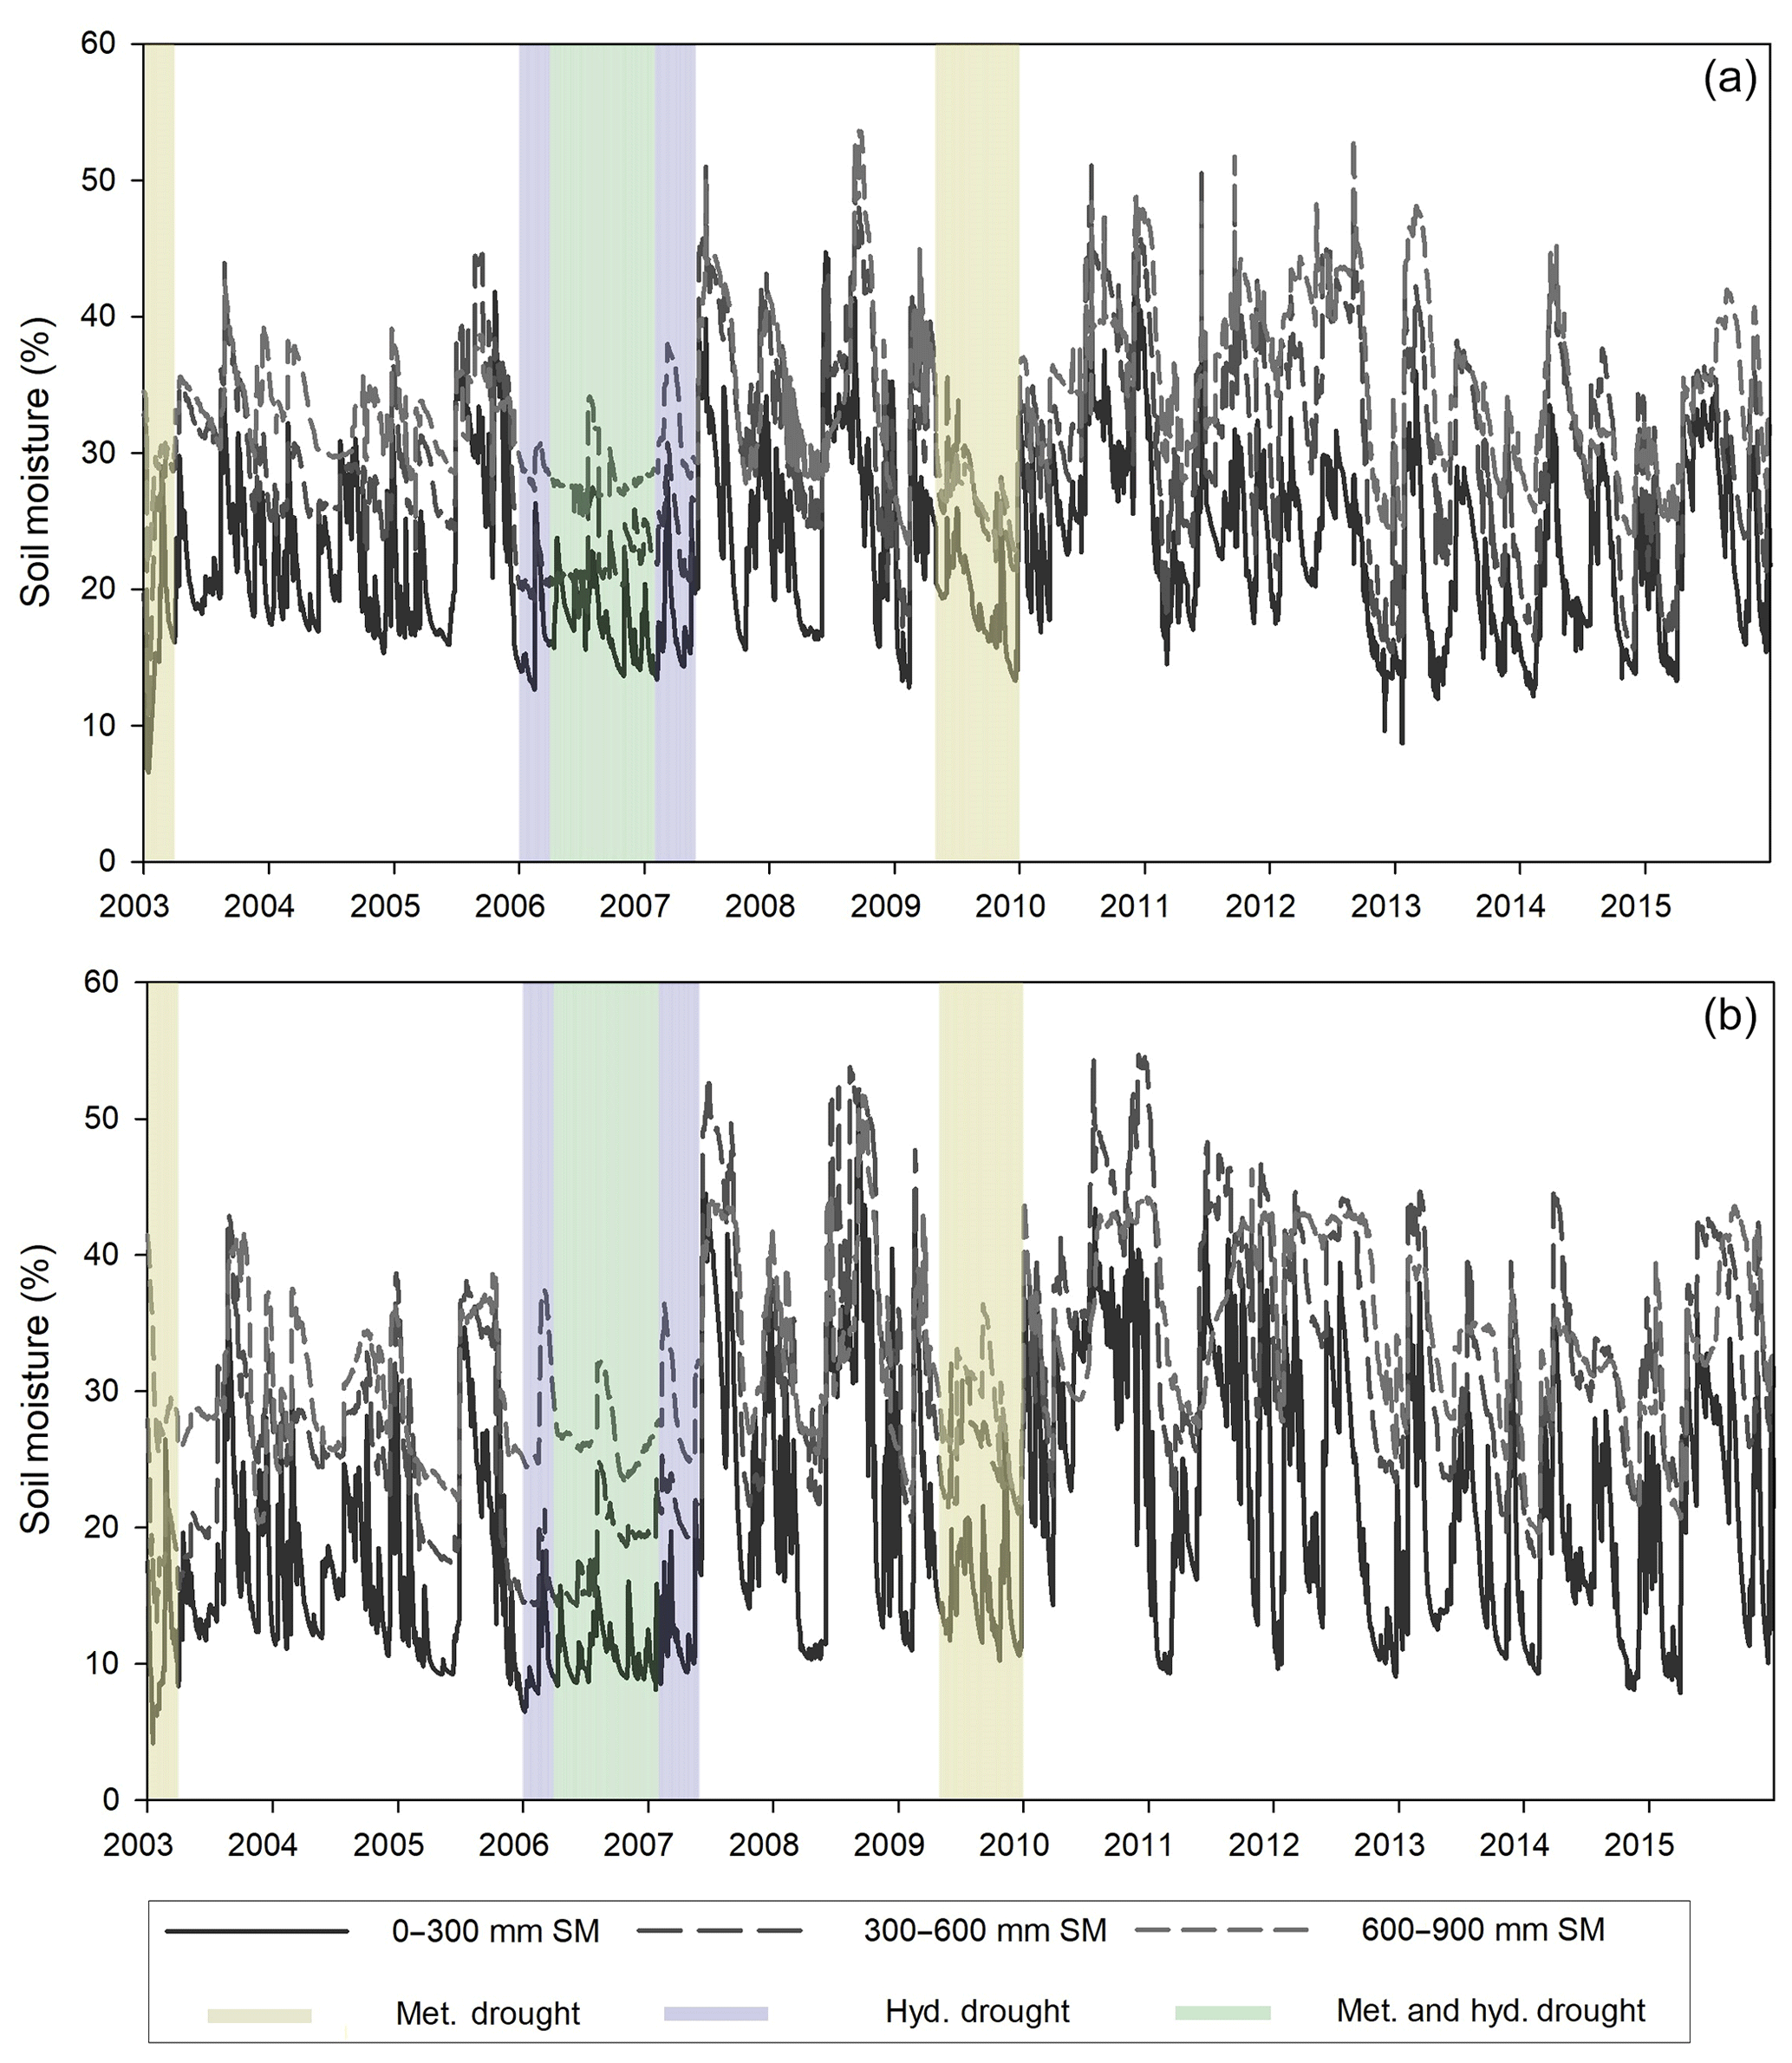
Figure 13SASMAS time series of soil moisture data, showing the daily variation for the Krui (a) and Merriwa (b) catchments at depths of 0–300, 300–600 and 600–900 mm.
5.1 Drought characteristic and causal mechanisms
Notable protracted drought events have occurred across the wider southeast Australian region over the last 80 years, including the “World War II Drought” (1937–1945), the “1982–1983 Drought”, and the Millennium Drought (Nicholls, 2004; Verdon-Kidd and Kiem, 2009; Vance et al., 2014). The meteorological drought record established for the study area corresponds closely to records established by Verdon-Kidd et al. (2017) for the Upper and Lower MDB (Fig. 1) with respect to the timing and run lengths of the droughts. However, drought is less severe in the study area, with an average SPI of -1.36 compared with −1.74 and −1.61 in the Upper and Lower MDB, respectively (Verdon-Kidd et al., 2017). It is proposed that the similarity in the drought records' run lengths is linked to the large-scale ocean–atmosphere drivers driving climate over eastern Australia; thus, by establishing these records and comparing the onset and termination rates with climate data, drought predictability can be improved.
Not all meteorological droughts were found to progress to hydrological drought in our study catchment. The best example of this is the absence of a hydrological drought during the 1982–1983 meteorological event. This was the most severe meteorological drought, with an average SPI6 of −2.32, and also had a rapid rate of onset (outlier in Fig. 3); however, there was no associated hydrological drought. Rather, protracted droughts, such as the Millennium and WWII events, tend to lead to hydrological drought. This can be attributed to the time required for the effects of meteorological drought to propagate through a catchment and cause hydrological drought (Leblanc et al., 2009, 2012). Evidence of this is shown in Fig. 3, where the average onset rates for hydrological drought are lower than those for meteorological drought. Similarly, the spread of drought onset rates is also lower for hydrological events than meteorological events. Overall, this indicates that long-term periods of repeated droughts pose a greater threat of generating hydrological drought, as the reduction in water availability propagates gradually throughout a catchment's water cycle. This is consistent with the notion of drought as a “creeping” natural disaster.
Many studies have investigated the causes and nature of protracted droughts in the Australian and global contexts (Gallant et al., 2013; Nicholls, 2004; Verdon-Kidd and Kiem, 2009; Vance et al., 2014). What is shown here is that the most severe droughts in this high-relief catchment are not attributable to the influence of a single climate driver, rather they occur as a result of multiple modes locked into their respective dry phases across different seasons. Long-term rainfall forecasts are limited globally, proving a significant barrier to predicting long-term droughts and their cessation. However, a clear link is established here (and is supported by the literature) between multiple climate drivers and drought at the large scale (Gallant et al., 2013; Mpelasoka et al., 2018; Verdon-Kidd and Kiem, 2009). Moreover, this result highlights that drought predictability could be improved by improved forecasting of the dominant climate drivers that lead to drought (Mera et al., 2018).
In contrast to drought onset, both meteorological and hydrological drought seem to terminate rapidly in the study area. Dettinger (2013) and Verdon-Kidd et al. (2017) suggest that drought termination is more closely linked to synoptic-scale processes rather than the large-scale climate drivers associated with drought onset (e.g., ENSO and IOD). This is consistent with Fig. 3 regarding both meteorological and hydrological drought, with nearly all events showing sharp breaks in the slope 1 month prior to drought termination. Events such as east coast lows, polar storm fronts and monsoon troughs are closely linked to drought termination along the eastern seaboard, and we clearly demonstrate the role of monsoon troughs in breaking droughts in our study catchments. These manifest as higher than average rainfall (Fig. 6) and sharp breaks in the SPI6 and SWSI6 upon drought termination (Verdon-Kidd et al., 2017). Similarly to drought onset, understanding and improving the predictability of these systems can improve drought forecasting (Mera et al., 2018).
5.2 Drought propagation and catchment response
Both study catchments displayed a strong decrease in autumn rainfall during the Millennium Drought. This deficiency in autumn rainfall is a well-observed characteristic of the Millennium Drought, and the climate drivers causing drought in the study area indicate that it has been impacted by similar drought mechanics as those seen across wider Australia (Gallant et al., 2013; Vance et al., 2014; Verdon-Kidd and Kiem, 2009). However, when compared with inland regions (west of the Great Dividing Range) of southeastern Australia, declines in the annual and seasonal rainfall are far less severe (Verdon-Kidd and Kiem, 2009). This reinforces the results of the SPI6 analysis which showed that the catchment is affected by droughts in a similar manner to surrounding areas, albeit less severely.
The strong concurrent correlation of the NDVI with the SPI6 is indicative of how quickly the catchment responds to variations in rainfall. Decreases in the NDVI indicate water stress associated with the onset of drought and a subsequent reduction in available feed (Deleglise et al., 2015; Sawada and Koike, 2016; Verdon-Kidd et al., 2017). During the severe–extreme drought events of 2002–2003, 2005–2006 and 2009, significant water stress was shown through the strong negative NDVI anomaly values. However, NDVI anomaly values quickly returned to positive values when drought conditions eased, indicating that pastoral feed quickly become available. In addition to this, variance in the NDVI values across the entire time series was small. Considering that the drought magnitude, based on the SPI6, was lower than in other areas (Verdon-Kidd et al., 2017) during the Millennium Drought, the recovery rates and small variance indicate resilience within the two catchments. We argue that understanding the vegetation response to drought is important for effective land management. Characterizing drought propagation in this way allows decision-makers to develop long-term strategies to plan for drought. This will reduce the need for financial assistance and limit environmental damage.
Declines in soil moisture in response to meteorological drought are also associated with the onset of hydrological and agricultural drought (Leblanc et al., 2009; Lodge and Johnson, 2008). Soil moisture is similarly correlated with the SPI6 with no lag; this again indicates a quick catchment response to the onset of meteorological drought. While the link between precipitation and soil moisture can be hard to quantify due to the episodic nature of rainfall variability and the continuous nature of field-measured soil moisture variability (Lodge and Johnson 2008), the analysis presented here indicates that the drought has affected soil moisture availability across the study area. However, the variation is small over the time series and decreases with depth. Soil moisture is important for regulating vegetation growth and rainfall–runoff relationships. The reliability of orographic rainfall here acts as a buffer, reducing the impacts of drought and allowing for pre-drought conditions to be restored quickly after rainfall, with deep water still available during the drought due to reliable orographic rainfall. This is consistent with the notion that high-relief, well-vegetated catchments may be buffered against or less impacted by drought (Petheram et al., 2011; Potter et al., 2011; Saft et al., 2015).
This idea is explored further in the stability of the rainfall–runoff relationship. Saft et al. (2015) found that persistent drought can lead to a long-term shift in the rainfall–runoff relationship. Across 139 catchments in eastern Australia, only approximately 20 % showed no decrease in the rainfall–runoff relationship following prolonged drought. These catchments were mostly, high-relief, high-rainfall, well-vegetated catchments, such as the one studied here and those typical of the east coast of Australia. These results are reinforced here and are shown from the propagation of drought through to vegetation and soil moisture and strong recovery following drought termination. This may be linked to droughts being less severe in the historical record compared with lower rainfall areas.
Global drought management strategies look to preserve and maintain resources under climate stress to promote quick recovery once this stress is eased. Developing baseline data to understand different drought responses at the catchment scale is crucial for developing strategies that allow for this goal to be achieved. Drought forecasting is generally poor across the globe, with many droughts only being identified after they have begun. This is further compounded by the potential for the increased risk of drought under projected climate change. Thus, a better characterization of how droughts occur and end is required to ensure adequate preparation for long-term, severe drought events. The methods applied here identify drought and the wider mechanisms associated with their cause and termination. This understanding is applicable in many environments due to the recognized pattern of large-scale climate oscillations being associated with drought causation and smaller synoptic-scale events being associated with drought termination.
Various studies have identified drying trends in hydroclimate under climate change with the increased risk of protracted and more severe droughts occurring. Examples of the devastating impacts this may have are found in the Millennium Drought as well as in the recent Texas and Californian droughts and the ongoing crises in Africa. To mitigate these impacts, regions that experience high, reliable rainfall, as outlined here, could play a crucial role in ensuring water and food security in drought. While the scale of application is local within this study, the indices and remotely sensed data can be applied almost anywhere in the world and at any scale. Importantly, assessing drought resilience at the local catchment scale may allow for better land use planning and resource management during drought both in the present and the future under climate change. By quantifying the response to drought in drought resilient areas, this study adds to the knowledge base required for this to occur.
The SASMAS data are available upon request (Rudiger et al., 2007). The rainfall data used in this study are publicly available from the Australian Bureau of Meteorology: http://www.bom.gov.au/ (last access: 17 June 2017). NDVI data were obtained from https://earthexplorer.usgs.gov/ (last access: 17 June 2020) (https://doi.org/10.5067/MODIS/MOD13Q1.006, Didan, 2015; https://doi.org/10.5066/F7707ZKN, AVHRR, 2020).
All authors conceptualized the paper and its scope. DVK and AG designed the framework for analyses in this study, and data acquisition and processing was carried out by AG. AG prepared the paper with contributions from all coauthors.
The authors declare that they have no conflict of interest.
The authors would like to thank the landholders of the Merriwa region for their hospitality and cooperation and acknowledge the work completed by those involved with the SASMAS project, especially the contribution of Tony Wells. This work has been completed under an Australian Government Research Training Program scholarship and a CSIRO PhD Top-Up Scholarship.
This paper was edited by Nunzio Romano and reviewed by two anonymous referees.
AVHRR – Advanced Very High Resolution Radiometer: AVHRR Normalized Difference Vegetation Index (NDVI) Composites Digital Object Identifier, https://doi.org/10.5066/F7707ZKN, 2020.
BBC: Cape Town drought: South African city may avoid `day zero', available at: https://www.bbc.com/news/world-africa-43321093, last access: 23 April 2018.
Below, R., Grover-Kopec, E., and Dilley, M.: Documenting drought-related disasters: a global reassessment, J. Environ. Dev., 16, 328–344, https://doi.org/10.1177/1070496507306222, 2007.
Botterill, L. C.: Uncertain Climate: The Recent History of Drought Policy in Australia, Aust. J. Polit. Hist., 49, 61–74, https://doi.org/10.1111/1467-8497.00281, 2003.
Botterill, L. C. and Cockfield, G. (Eds.): Drought, Risk management, and policy: Decision-making under uncertainty. Drought and water crises, CRC Press, Taylor and Francis Group, Boca Raton, Florida, USA, 33487–2742, 2013.
Box, G. E. P. and Cox, D. R.: An Analysis of Transformations, J. Roy. Stat. Soc. B, 26, 211–252, 1964.
Chew, C. C. and Small, E. E.: Terrestrial water storage response to the 2012 drought estimated from GPS vertical position anomalies, Geophys. Res. Lett., 41, 6145–6151, https://doi.org/10.1002/2014gl061206, 2014.
Compo, G. P., Whitaker, J. S., Sardeshmukh, P. D., Matsui, N., Allan, R. J., Yin, X., Gleason, B. E., Vose, R. S., Rutledge, G., Bessemoulin, P., Brönnimann, S., Brunet, M., Crouthamel, R. I., Grant, A. N., Groisman, P. Y., Jones, P. D., Kruk, M., Kruger, A. C., Marshall, G. J., Maugeri, M., Mok, H. Y., Nordli, Ø., Ross, T. F., Trigo, R. M., Wang, X. L., Woodruff, S. D., and Worley, S. J.: The Twentieth Century Reanalysis Project, Q. J. Roy. Meteorol. Soc., 137, 1–28, https://doi.org/10.1002/qj.776, 2011.
Dai, A. G.: Drought under global warming: a review, Wiley Interdisciplin. Rev. – Clim. Change, 2, 45–65, https://doi.org/10.1002/wcc.81, 2011.
Deleglise, C., Meisser, M., Mosimann, E., Spiegelberger, T., Signarbieux, C., Jeangros, B., and Buttler, A.: Drought-induced shifts in plants traits, yields and nutritive value under realistic grazing and mowing managements in a mountain grassland, Agr. Ecosyst. Environ., 213, 94–104, https://doi.org/10.1016/j.agee.2015.07.020, 2015.
Deo, R. C., Byun, H. R., Adamowski, J. F., and Begum, K.: Application of effective drought index for quantification of meteorological drought events: a case study in Australia, Theor. Appl. Climatol., 128, 359–379, https://doi.org/10.1007/s00704-015-1706-5, 2017.
Dettinger, M. D.: Atmospheric Rivers as Drought Busters on the U.S. West Coast, J. Hydrometeorol., 14, 1721–1732, https://doi.org/10.1175/JHM-D-13-02.1, 2013.
Didan, K.: MOD13Q1 MODIS/Terra Vegetation Indices 16-Day L3 Global 250 m SIN Grid V006 [Data set], NASA EOSDIS Land Processes DAAC, https://doi.org/10.5067/MODIS/MOD13Q1.006, 2015.
Doesken, N. J., McKee, T. B., and Kleist, J.: Development of a Surface Water Supply Index for the Western United States, Climatology Report 91-3, Colorado Climate Center, Colorado State University, 1991.
Gallant, A. J. E., Reeder, M. J., Risbey, J. S., and Hennessy, K. J.: The characteristics of seasonal-scale droughts in Australia, 1911–2009, Int. J. Climatol., 33, 1658–1672, https://doi.org/10.1002/joc.3540, 2013.
Gibson, A. J.: Estimating Sediment Yield From a Large, Unguaged South-East Australian Catchment, Hons Thesis, The University of Newcastle, Newcastle, Australia, 2016.
Grove, A. T.: Desertification in southern Europe, Climatic Change, 9, 49–57, https://doi.org/10.1007/bf00140524, 1986.
Hancock, G. R., Wells, T., Martinez, C., and Dever, C.: Soil erosion and tolerable soil loss: Insights into erosion rates for a well-managed grassland catchment, Geoderma, 237, 256–265, https://doi.org/10.1016/j.geoderma.2014.08.017, 2015.
Kiem, A. S., Johnson, F., Westra, S., Van Dijk, A., Evans, J. P., O'donnell, A., Rouillard, A., Barr, C., Tyler, J., Thyer, M., Jakob, D., Woldemeskel, F., Sivakumar, B., and Mehrotra, R.: Natural hazards in Australia: droughts, Climatic Change, 139, 37–54, https://doi.org/10.1007/s10584-016-1798-7, 2007.
Kunkel, V., Hancock, G. R., and Wells, T.: Large catchment-scale spatiotemporal distribution of soil organic carbon, Geoderma, 334, 175–185, 2019.
Leblanc, M., Tweed, S., van Dijk, A., and Timbal, B.: A review of historic and future hydrological changes in the Murray-Darling Basin, Global Planet. Change, 80–81, 226–246, https://doi.org/10.1016/j.gloplacha.2011.10.012, 2012.
Leblanc, M. J., Tregoning, P., Ramillien, G., Tweed, S. O., and Fakes, A.: Basin-scale, integrated observations of the early 21st century multiyear drought in southeast Australia, Water Resour. Res., 45, W04408, https://doi.org/10.1029/2008wr007333, 2009.
Lodge, G. M. and Johnson, I. R.: Agricultural drought analyses for temperate Australia using a biophysical pasture model. 1. Identifying and characterising drought periods, Aust. J. Agricult. Res., 59, 1049–1060, https://doi.org/10.1071/ar08075, 2008.
Matusick, G., Ruthrof, K. X., Brouwers, N. C., Dell, B., and Hardy, G. S.: Sudden forest canopy collapse corresponding with extreme drought and heat in a mediterranean-type eucalypt forest in southwestern Australia,Eur. J. Forest Res., 132, 497–510, https://doi.org/10.1007/s10342-013-0690-5, 2013.
McKee, T. B., Doesken, N. J., and Kleist, J.: The Relationship of Drought Frequency and Duration Time Scales. Eighth Conference on Applied Climatology, California, American Meteorological Society, Boston, 1993.
McKee, T. B., Doesken, N. J., and Kleist, J.: Drought monitoring with multiple time scales, Proceedings of the Ninth Conference on Applied Climatology, American Meteorological Society, Boston, 233–236, 1995.
Mera, Y. E. Z., Vera, J. F. R., and Perez-Martin, M. A.: Linking El Nino Southern Oscillation for early drought detection in tropical climates: The Ecuadorian coast, Sci. Total Environ., 643, 193–207, https://doi.org/10.1016/j.scitotenv.2018.06.160, 2018.
Mpelasoka, F., Hennessy, K., Jones, R., and Bates, B.: Comparison of suitable drought indices for climate change impacts assessment over Australia towards resource management, Int. J. Climatol., 28, 1283–1292, https://doi.org/10.1002/joc.1649, 2008.
Mpelasoka, F., Awange, J. L., and Zerihun, A.: Influence of coupled ocean–atmosphere phenomena on the Greater Horn of Africa droughts and their implications, Sci. Total Environ., 610, 691–702, https://doi.org/10.1016/j.scitotenv.2017.08.109, 2018.
Nicholls, N.: The changing nature of Australian droughts, Climatic Change, 63, 323–336, https://doi.org/10.1023/B:CLIM.0000018515.46344.6d, 2004.
Peters, A. J., Walter-Shea, E. A., Ji, L., Vina, A., Hayes,M., and Svoboda, M. D.: Drought monitoring with NDVI-based standardized vegetation index, Photogram. Eng. Remote Sens., 68, 71–75, 2002.
Petheram, C., Potter, N., Vaze, J., Chiew, F., and Zhang, L.: Towards better understanding of changes in rainfall runoff relationships during the recent drought in southeastern Australia, in: 19th International Congress on Modelling and Simulation, 12–16 December 2011, Perth, Australia, 3622–3628, 2011.
Potter, N. J., Petheram, C., and Zhang, L.: Sensitivity of streamflow to rainfall and temperature in south-eastern Australia during the Millennium drought, in: 19th International Congress on Modelling and Simulation (Modsim2011), 12–16 December 2011, Perth, Australia, 3636–3642, 2011.
Rashid, M. M. and Beecham, S.: Development of a non-stationary Standardized Precipitation Index and its application to a South Australian climate, Sci. Total Environ., 657, 882–892, 2019.
Raupach, M. R., Briggs, P. R., Haverd, V., King, E. A., Paget, M., and Trudinger, C. M.: Australian Water Availability Project (AWAP): CSIRO Marine and Atmospheric Research Component: Final Report for Phase 3, CAWCR Technical Report No. 013, CSIRO, Canberra, Australia, 67 pp., 2009.
Raupach, M. R., Briggs, P. R., Haverd, V., King, E. A., Paget, M., and Trudinger, C. M.: Australian Water Availability Project, CSIRO Marine and Atmospheric Research, Canberra, Australia, available at: http://www.csiro.au/awap/ (last access: 7 July 2016), 2012.
Redmond, K. T.: The depiction of drought: A commentary, B. Am. Meteorol. Soc., 83, 1143–2002, 2002.
Risbey, J. S., Pook, M. J., McIntosh, P. C., Wheeler, M. C., and Hendon, H. H.: On the remote drivers of rainfall variability in Australia, Mon. Weather Rev., 137, 3233–3253, https://doi.org/10.1175/2009MWR2861.1, 2009.
Romm, J.: The next dust bowl, Nature, 478, 450–451, https://doi.org/10.1038/478450a, 2011.
Rudiger, C., Hancock, G., Hemakumara, H. M., Jacobs, B., Kalma, J. D., Martinez, C., Thyer, M., Walker, J. P., Wells, T., and Willgoose, G. R.: Goulburn River experimental catchment data set, Water Resour. Res., 43, W10403, https://doi.org/10.1029/2006wr005837, 2007.
Saft, M., Western, A. W., Zhang, L., Peel, M. C., and Potter, N. J.: The influence of multiyear drought on the annual rainfall-runoff relationship: an Australian perspective, Water. Resoures. Res., 51, 2444–2463, 2015.
Sawada, Y. and Koike, T.: Ecosystem resilience to the Millennium drought in southeast Australia (2001–2009), J. Geophys. Res.-Biogeo., 121, 2312–2327, https://doi.org/10.1002/2016jg003356, 2016.
Timbal, B.: The climate of the Eastern Seaboard of Australia: A challenging entity now and for future projections, IOP Conf. Ser.: Earth Environ. Sci., 11, 012013, https://doi.org/10.1088/1755-1315/11/1/012013, 2011.
University of Nebraska: Program to calculate the standard precipitation index, available at: https://drought.unl.edu/droughtmonitoring/SPI/SPIProgram.aspx, last access: 12 May 2017.
Vance, T. R., Roberts, J. L., Plummer, C. T., Kiem, A. S., and van Ommen, T. D.: Interdecadal Pacific variability and eastern Australian mega-droughts over the last millennium, Geophys. Res. Lett., 41, 129–137, https://doi.org/10.1002/2014GL062447, 2014.
van Dijk, A., Beck, H. E., Crosbie, R. S., de Jeu, R. A. M., Liu, Y. Y., Podger, G. M., Timbal, B., and Viney, N. R.: The millennium drought in southeast Australia (2001–2009): natural and human causes and implications for water resources, ecosystems, economy, and society, Water Resour. Res., 49, 1040–1057, 2013.
Verdon-Kidd, D. C. and Kiem, A. S.: Nature and causes of protracted droughts in southeast Australia: comparison between the federation, WWII, and big dry droughts, Geophys. Res. Lett., 36, L22707, https://doi.org/10.1029/2009GL041067, 2009.
Verdon-Kidd, D. C., Kiem, A. S., and Moran, R.: Links between the Big Dry in Australia and hemispheric multi-decadal climate variability – implications for water resource management, Hydrol. Earth Syst. Sci., 18, 2235–2256, https://doi.org/10.5194/hess-18-2235-2014, 2014.
Verdon-Kidd, D. C., Scanlon, B. R., Tong, R. C., and Fernando, D. N.: A comparative study of historical droughts over Texas, USA and Murray-Darling Basin, Australia: Factors influencing initialization and cessation, Global Planet. Change, 149, 123–138, https://doi.org/10.1016/j.gloplacha.2017.01.001, 2017.
Vicente-Serrano, S. M., Gouveia, C., Camarero, J. J., Beguería, S., Trigo, R., López-Moreno, J.I.,Azorín-Molina, C., Pasho, E., Lorenzo-Lacruz, J., Revuelto, J., and Morán-Tejeda, E.: Response of vegetation to drought time-scales across global land biomes, P. Natl. Acad. Sci. USA, 110, 52–57, 2013.
WFP: Drought affects millions in the Sahel, available at: https://www.wfp.org/stories/drought-returns-sahel (last access: 23 April 2018), 2012.
Wilhite, D. A., Sivakumar, M. V. K., and Pulwarty, R.: Managing drought risk in a changing climate: The role of national drought policy, Weather Clim. Extrem., 3, 4–13, https://doi.org/10.1016/j.wace.2014.01.002, 2014.