the Creative Commons Attribution 4.0 License.
the Creative Commons Attribution 4.0 License.
 | 09 Apr 2020
Long-term changes in central European river discharge for 1869–2016: impact of changing snow covers, reservoir constructions and an intensified hydrological cycle
Till Francke
Gerd Bürger
Axel Bronstert
Recent climatic changes have the potential to severely alter river runoff, particularly in snow-dominated river basins. Effects of changing snow covers superimpose with changes in precipitation and anthropogenic modifications of the watershed and river network. In the attempt to identify and disentangle long-term effects of different mechanisms, we employ a set of analytical tools to extract long-term changes in river runoff at high resolution. We combine quantile sampling with moving average trend statistics and empirical mode decomposition and apply these tools to discharge data recorded along rivers with nival, pluvial and mixed flow regimes as well as temperature and precipitation data covering the time frame 1869–2016. With a focus on central Europe, we analyse the long-term impact of snow cover and precipitation changes along with their interaction with reservoir constructions.
Our results show that runoff seasonality of snow-dominated rivers decreases. Runoff increases in winter and spring, while discharge decreases in summer and at the beginning of autumn. We attribute this redistribution of annual flow mainly to reservoir constructions in the Alpine ridge. During the course of the last century, large fractions of the Alpine rivers were dammed to produce hydropower. In recent decades, runoff changes induced by reservoir constructions seem to overlap with changes in snow cover. We suggest that Alpine signals propagate downstream and affect runoff far outside the Alpine area in river segments with mixed flow regimes. Furthermore, our results hint at more (intense) rainfall in recent decades. Detected increases in high discharge can be traced back to corresponding changes in precipitation.
- Article
(16321 KB) - Full-text XML
- BibTeX
- EndNote


In many regions of the world, rivers constitute essential lifelines and form the basis of human livelihood. However, recent climate changes may severely affect the hydrological cycle and jeopardize the functional diversity of river systems. Most severe changes are expected to occur in snow-dominated river basins. In a warmer world, snow cover characteristics and snowmelt contribution to river runoff will change fundamentally. Rising temperatures are expected to cause less winter precipitation to fall as snow and existing snow covers to melt earlier in spring (Barnett et al., 2005; Simpkins, 2018; Kormann et al., 2015; Birsan et al., 2005). Recent studies suggest that rainfall amount and the number of extreme rainfall events increase due to warmer air holding more water along with enhanced evaporation (Lehmann et al., 2015; Coumou and Rahmstorf, 2012; Mueller and Pfister, 2011). Investigating changes in features of snowpack and snowmelt for key mountain regions, Stewart (2009) summarizes “that both temperature and precipitation increases to date have impacted mountain snowpacks” already. For the Rhine River, one of the most important rivers in Europe, Stahl et al. (2016) indicate that “the influence of climate change is visible particularly in the temporal shifts of seasonal minima and maxima of the hydrological regimes of snow and glacier melt dominated alpine headwater catchments.”
In addition to changes in snowpacks and precipitation, anthropogenic modifications of land surface, subsurface properties and the river network alter river runoff. During the 20th century, more than 45 000 large dams were constructed around the world (Word Commision on Dams, 2000). Also in the Rhine River basin, human activities change runoff with regard to amount, its temporal distribution as well as water quality (Wildenhahn and Klaholz, 1996; Belz et al., 2007; Wildi et al., 2004).
The current knowledge of how climatic changes and changing watershed properties impact river runoff comes largely from instrumental records of hydro-climatic variables, particularly temperature, precipitation and runoff. Birsan et al. (2005) state that “as a spatially integrated variable streamflow is more appealing for detecting regional trends than point measurements of precipitation which is highly variable in space and time”, but also point out that watershed properties and their changes over time constitute an “obvious complication in interpreting trends in streamflow data.” In addition, quality and length of recorded time series often are insufficient to identify and disentangle effects of the various mechanisms. A sufficient length of the time series inter alia is crucial to be able to distinguish between natural climate variability and signals of climate change. Variability of large-scale atmospheric flow on annual to multi-decadal scales, for example, can cause variations in hydro-climatic data, which can either counterbalance or reinforce signals of long-term changes (Hanson et al., 2006; Frei et al., 2000; Kerr, 2000; Scherrer et al., 2016). Studies preparing and investigating long time series of high quality are of great importance and form the basis of our current understanding of features and magnitudes of recent climatic changes (e.g. Vincent et al., 2002; Begert et al., 2005; Schmidli and Frei, 2005; Moberg et al., 2006; Scherrer et al., 2016). Often, simple linear regression approaches are applied to assess characteristics of climatic changes. One frequently used analytical tool in this regard is the robust non-parametric Mann–Kendall trend test (Kendall, 1975; Theil, 1950; Sen, 1968). However, restricting the assessment to linear trends only is hard to justify. The potential of more detailed analyses with regard to seasons, moving time windows (e.g. Kormann et al., 2015) or quantiles of the target variable have hardly been tapped. To further consolidate and extend findings obtained so far, new sets of analytical tools to extract information stored in this time series need to be developed, tested and applied to climatological and hydrological records.
Our study aims at a better understanding of long-term changes in river runoff and identifying potential underlying driving mechanisms, by analysing daily resolution hydro-climatic time series recorded in central Europe between 1869 and 2016. We assess long-term changes in a highly resolved manner by combining quantile sampling, moving average trend statistics and empirical mode decomposition. The two main research question we want to address are the following.
-
What is the long-term impact of changes in snow cover on river runoff?
-
How do runoff changes induced by changes in snow cover compare with changes caused by reservoir constructions and changes in precipitation?
We investigate discharge time series from four gauging stations (Fig. 1 and Table 1). The depicted gauges stand out by the exceptional length of their records and represent different types of flow regimes: nival, pluvial and complex. Gauge Wasserburg is located at the Inn River in Upper Bavaria, Germany. The Inn River is a right tributary of the Danube. The river's source is located in the Swiss Alps and most of its drainage area (1.20 × 10⁴ km2 until gauge Wasserburg) possesses a high Alpine character. The other three gauges investigated, namely Basel, Würzburg and Cologne, are located in the Rhine River basin. The Rhine River is one of the largest rivers in Europe. It is a heavily used waterway and livelihood for the region. At gauge Basel, river runoff is dominated by snowmelt and rainfall runoff from the Alps. Gauge Würzburg is located at the Main River in northern Bavaria, Germany. The Main River is a right tributary of the Rhine River. The catchment area until gauge Würzburg is 1.40 × 10⁴ km2. The city of Cologne is the largest city along the Rhine River and located in the Lower Rhine region after the confluences with all major tributaries. Until Cologne, the Rhine River drains an area of 1.44 × 10⁵ km2. For all selected gauges, discharge data at daily resolution have been available since at least 1869. For gauge Basel, statistical tests on daily runoff means conducted by Pfister et al. (2006) show that measured discharge has been homogeneous since 1869 (digitally available part of the time series); i.e. the values are free of anthropogenic effects such as change in instrumentation, change in daily recording frequency or lowering of the river bed (Pfister et al., 2006). Other gauging stations investigated are part of the hydrometric observation network of the water authorities in Germany. Recordings are regularly checked to ensure high quality and reliability. Discharge time series were obtained from the Global Runoff Data Centre (GRDC). Data from the GRDC were used as-is without any further treatment. Elevation distributions and monthly Pardé coefficients for investigated river basins are presented in the Appendix (Fig. A1).
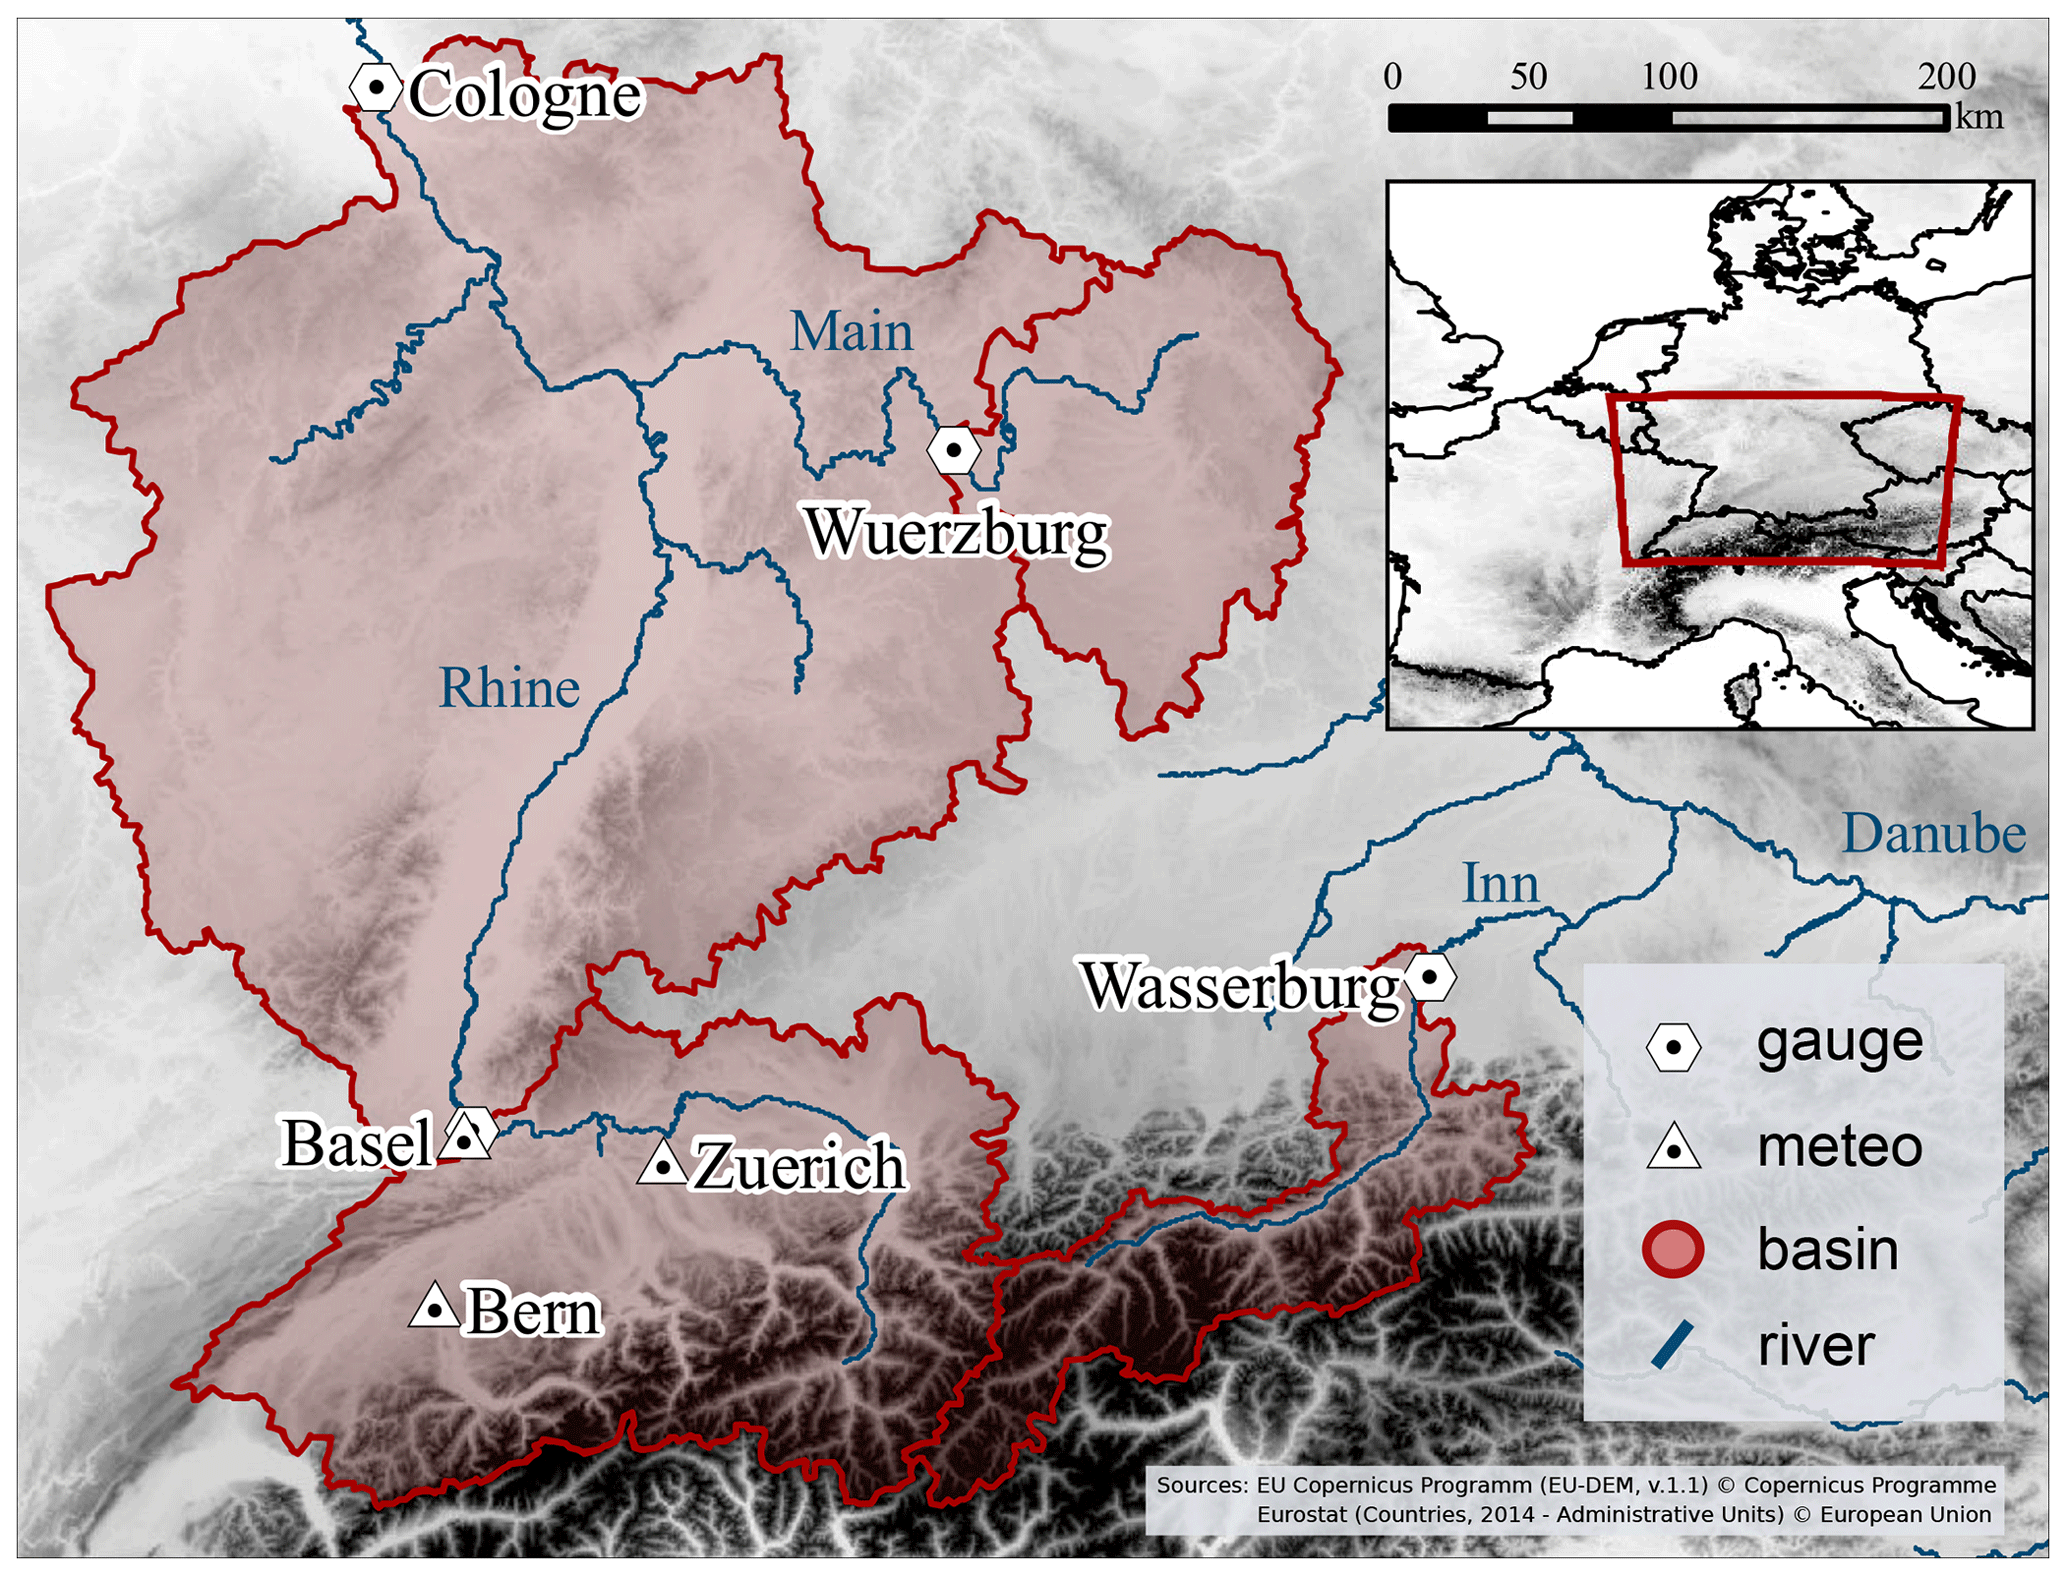
Figure 1Topographic map of the study area with the locations of river gauges, river basins and meteorological stations.
Table 1Database studied: station name, associated river, location (WSG 84), altitude (m), daily resolution time series investigated with temperature (T), precipitation (P) and discharge (D), catchment area, mean runoff (MQ) and data source with the Global Runoff Data Centre (GRDC) and Federal Office of Meteorology and Climatology of Switzerland (MeteoSwiss).
Furthermore, we analyse daily resolution temperature and precipitation data provided by the Federal Office of Meteorology and Climatology of Switzerland (MeteoSwiss). At MeteoSwiss, a standardized homogenization procedure is applied to a set of monthly temperature and precipitation time series (Begert et al., 2005). During this homogenization procedure attained monthly correction values are also applied to daily resolution data. The homogenization of long climatological time series is necessary to correct for non-climatic factors influencing the data. Currently, homogenized daily temperature/precipitation data are available for 28∕73 stations. In the following, we focus on meteorological stations where both temperature and precipitation data have been available since at least 1869 and there is no gap in the data longer than 60 d. In total, nine stations fulfil these criteria. Results of the three most prominent stations are displayed and discussed in the main paper (Fig. 1 and Table 1). Information and results of the remaining stations are given in the Appendix (Table A1 Fig. D1). These strict selection criteria with regard to data length and quality strongly limit the number of recordings suitable for analysis. However, even if a smaller database can reduce the significance of attained results, this is a trade-off we need to accept. Only with recordings having sufficient length and quality can we ensure that the advantages of the proposed analytical tools described in the following chapter can take effect.
To detect long-term changes in the investigated hydro-climatic data, we combine quantile sampling with moving average trend statistics and empirical mode decomposition (EMD). The selected analytical tools and their combined application to daily time series enable a highly resolved investigation of changes throughout the investigated time frame. The analysis is divided into four steps. Each analysis step complements and extends the information of the previous one, so that step by step, a comprehensive picture of long-term changes takes shape (Fig. 3). A list of all abbreviations and acronyms used can be found in the Appendix (Table B1).
3.1 Seasonality of river runoff
To investigate the seasonality of river runoff, we estimate quantiles on a daily basis (QDAY). For every day of the year (DOY), we take all available measurements (i.e. 148 daily values for the period 1869–2016) and calculate QDAYs empirically for probabilities ranging from 0.01 to 0.99. In the framework of this study, quantiles are calculated as the plotting position, with n as the sample size and as the rank (e.g. Hyndman and Fan, 1996). This approach corresponds to type 8 of the “quantile” function in the R environment (R Core Team, 2018).
3.2 Changes in seasonality
In order to get a first insight into changes in runoff seasonality, we estimate quantiles from and within a 30 d moving window (QMOV). QMOV operates on discharge data and is independent of previously computed QDAYs. Quantiles are calculated for probabilities between 0.01 and 0.99. The results are continuous quantile time series for each discharge series (Fig. 3). To assess the temporal evolution of these values over the observation period, we employ trend analysis. We calculate trend magnitudes of QMOV using the robust Theil–Sen trend estimator (TST) on a daily basis for all quantiles. Since the computation of the trend uses the values of the same DOY of successive years, auto-correlation should not be of any concern. Within the linear regression approach of the TST, trend magnitudes are estimated as the median slope of ranked data values (Theil, 1950; Sen, 1968; Bronaugh and Werner, 2013).
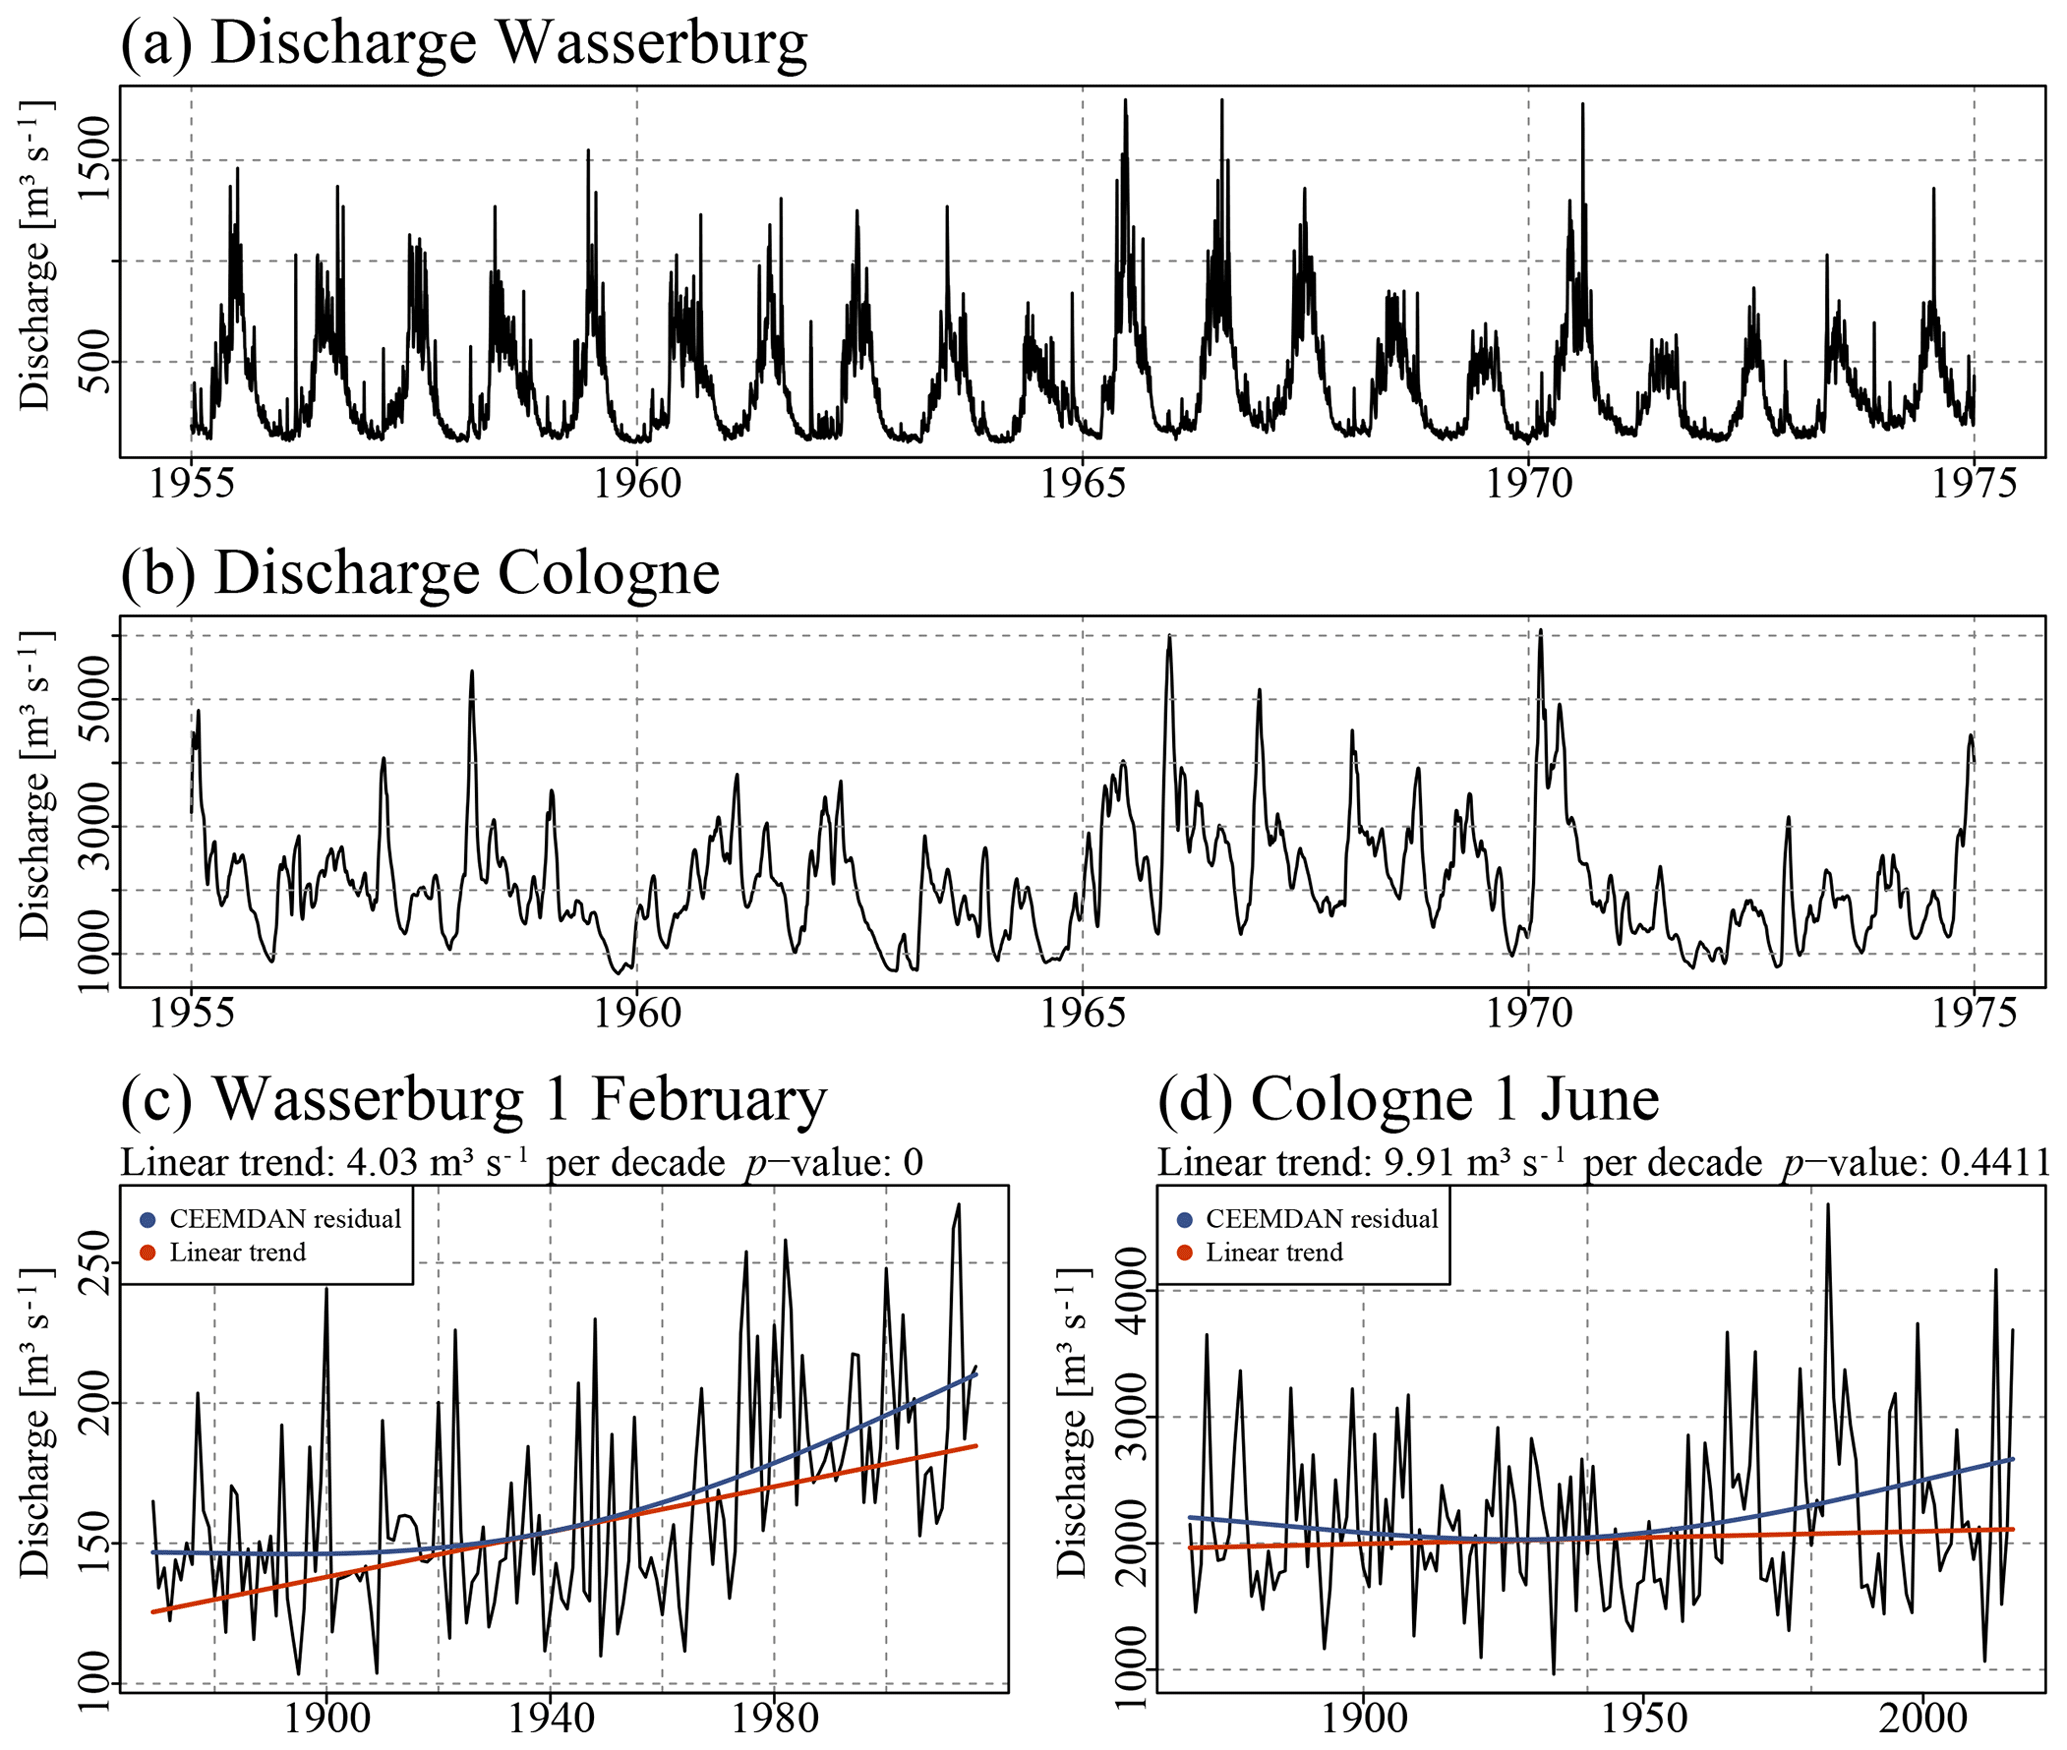
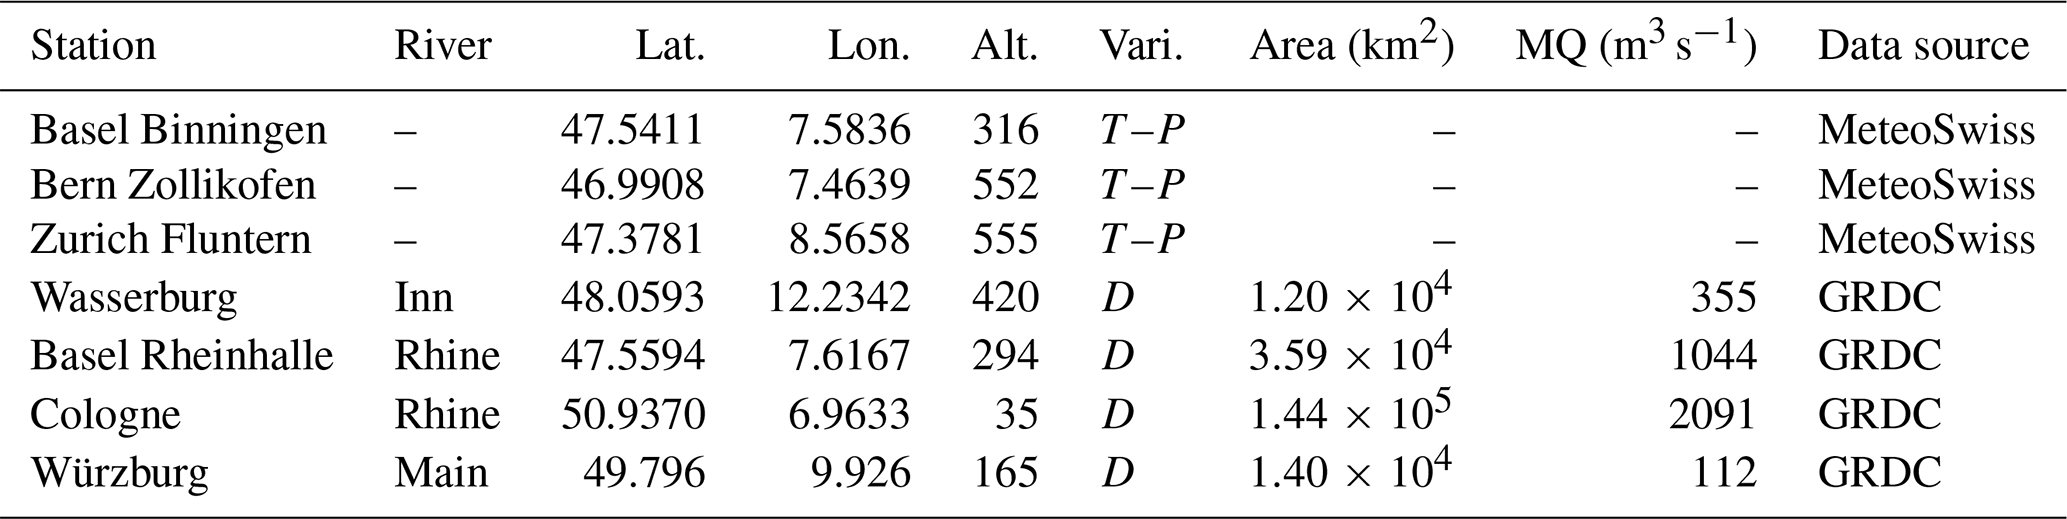
Figure 2Discharge recordings from gauges Wasserburg (a) and Cologne (b) and measurements from all 1 February/1 June days for gauge Wasserburg/Cologne after applying a 30 d moving average filter over the entire time series (c, d). The robust Theil–Sen trend estimator and the Mann–Kendall trend test were applied to assess the magnitude and significance of the linear trends (red line). The CEEMDAN residual is used to extract the non-linear evolution of the trend (blue curve).
Figure 3Schematic overview of analytical tools used to detect long-term changes in hydro-climatological time series. The analysis of discharge data is subdivided into four steps, where each step complements and extends the information acquired in the previous step.
3.3 Onset and evolution of changes
The use of linear trends to quantify the temporal evolution of hydro-climatic variables often lacks physical justification. The respective signals are likely to be non-linear (Fig. 2c and d). Even when using parametric functions for capturing the non-linear behaviour, e.g. exponential or power-law functions, it is not guaranteed that results will reflect the actual characteristics of underlying processes in the data. An adaptive approach, which does not require a predetermined basis function, is required to get a more flexible characterization of the trend. We employ EMD for this purpose. EMD is an empirical, direct and adaptive method to analyse non-linear trends. It decomposes the signal into oscillatory modes and provides a powerful tool to separate short timescale signals from a general trend (Wu et al., 2007; Huang et al., 1998, 1999; Luukko et al., 2016). To avoid mode mixing issues, we performed EMD on an ensemble of the initial data signal: ensemble EMD (EEMD) (Wu and Huang, 2009). Each ensemble member is perturbed by low-amplitude white noise and the results are averaged at the end of the computations. To keep the characteristics of a complete decomposition, i.e. all extracted intrinsic mode functions (IMFs) sum up to the original signal, the averaging process is carried out separately for each IMF component (Torres et al., 2011). This extension results in a complete EEMD with additive noise (CEEMDAN). We use an ensemble of 10 000 members, a noise strength of 0.5 times the standard deviation of the input signal, and R package “Rlibeemd” (Luukko et al., 2016) to perform CEEMDAN. The residual of CEEMDAN “can be used to represent the intrinsic trend of the data” (Luukko et al., 2016).
We assess these residuals for discharge, temperature and precipitation on a daily basis after calculating moving average values within a window with a width of 30 d for discharge and temperature and a width of 90 d for precipitation. Testing different window sizes, commonly used monthly (30) and seasonal (90) values proved to be a good compromise between robustness of the signal and preservation of signal variability. To make results of different days comparable, we centre each residual by subtracting its mean. To enable the comparison between CEEMDAN residuals and more commonly used linear approaches, we assess whether the non-parametric Mann–Kendall trend test (MK) detects statistical significant monotonic trends in the data CEEMDAN was applied to (α=0.05) (Mann, 1945; Kendall, 1975). Days with significant monotonic changes are marked with points on top of the respective plot panels (third column in Fig. 4 and columns one and three in Fig. 5).
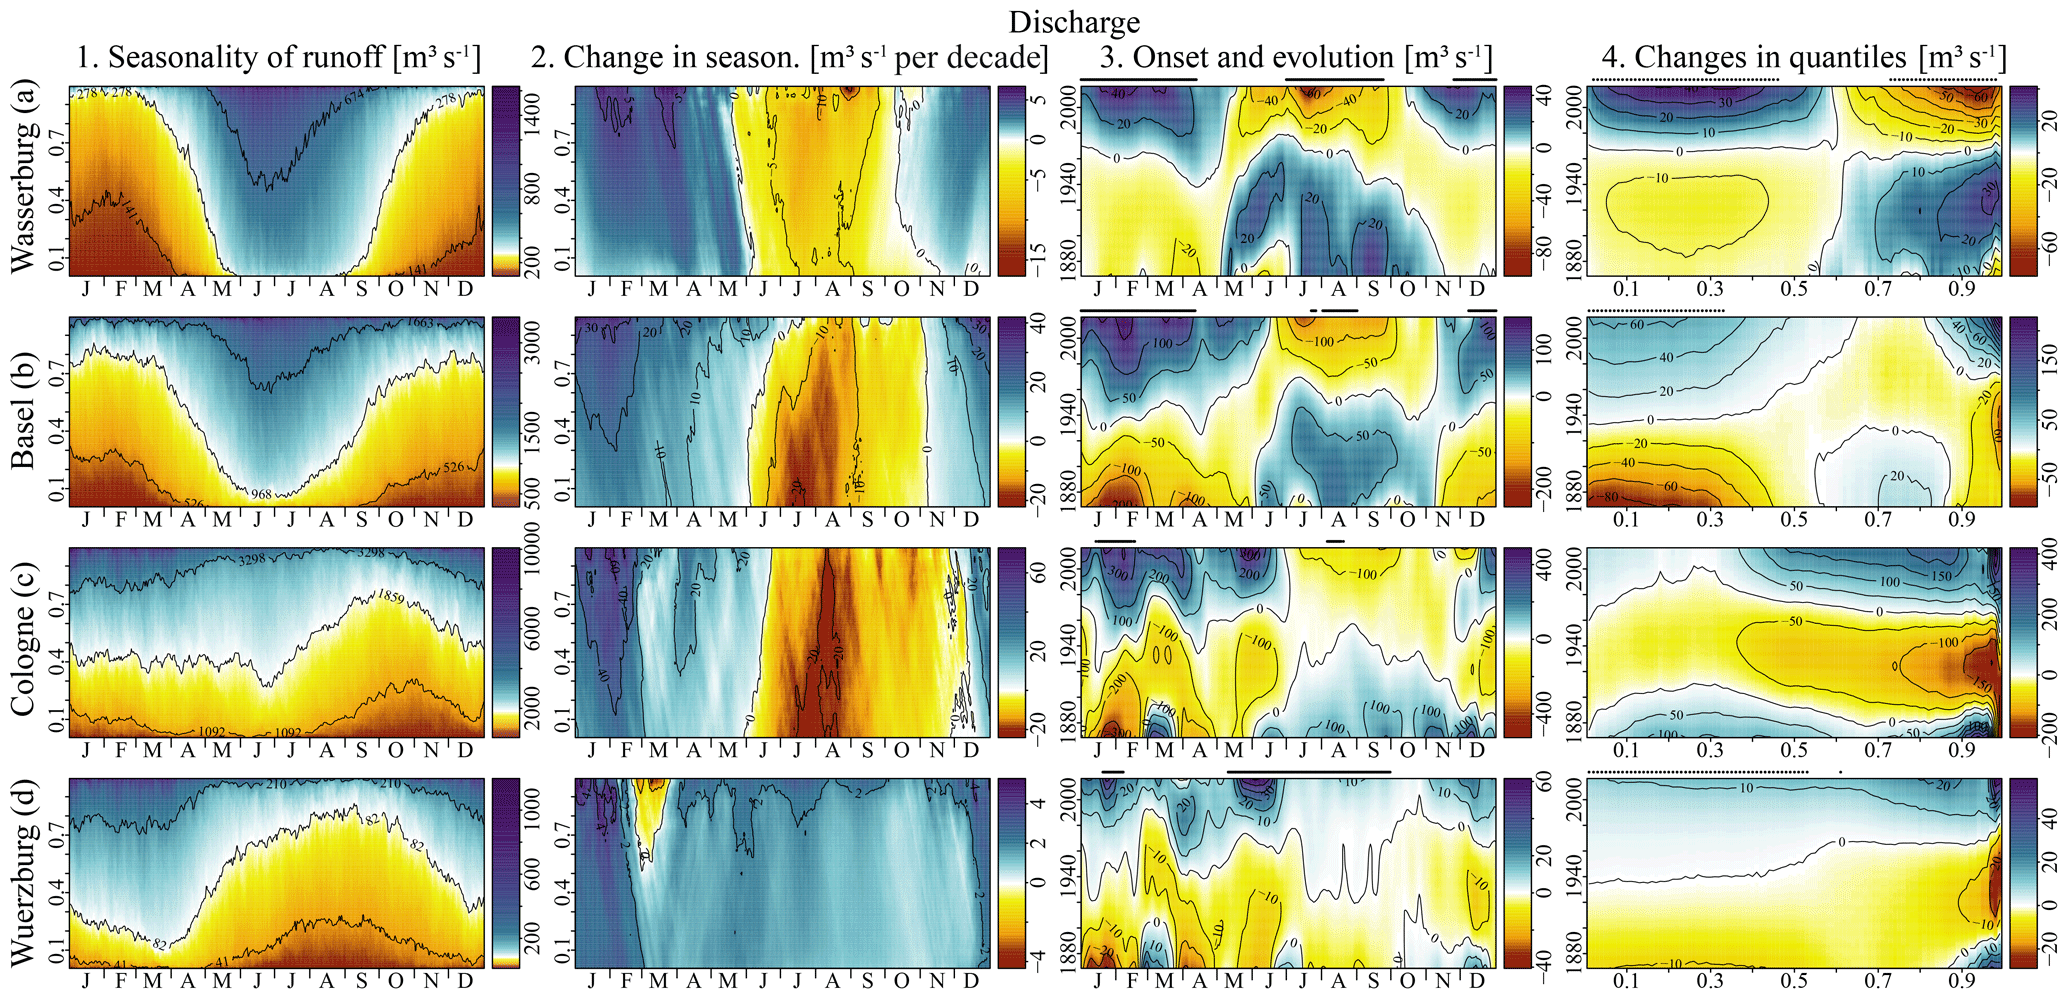
Figure 4Seasonality of river runoff, change in seasonality, onset and evolution of changes and changes in quantiles for discharge measured at gauges Wasserburg (a), Basel (b), Cologne (c) and Würzburg (d). Isolines in left panels “1. Seasonality of runoff” indicate quantiles for probabilities 0.1, 0.5 and 0.9 determined over the entire time series using all available measurements. Points on top of the panels (two right columns) indicate days/probabilities with significant changes according to the Mann–Kendall trend test. Time frame investigated: 1869–2016.
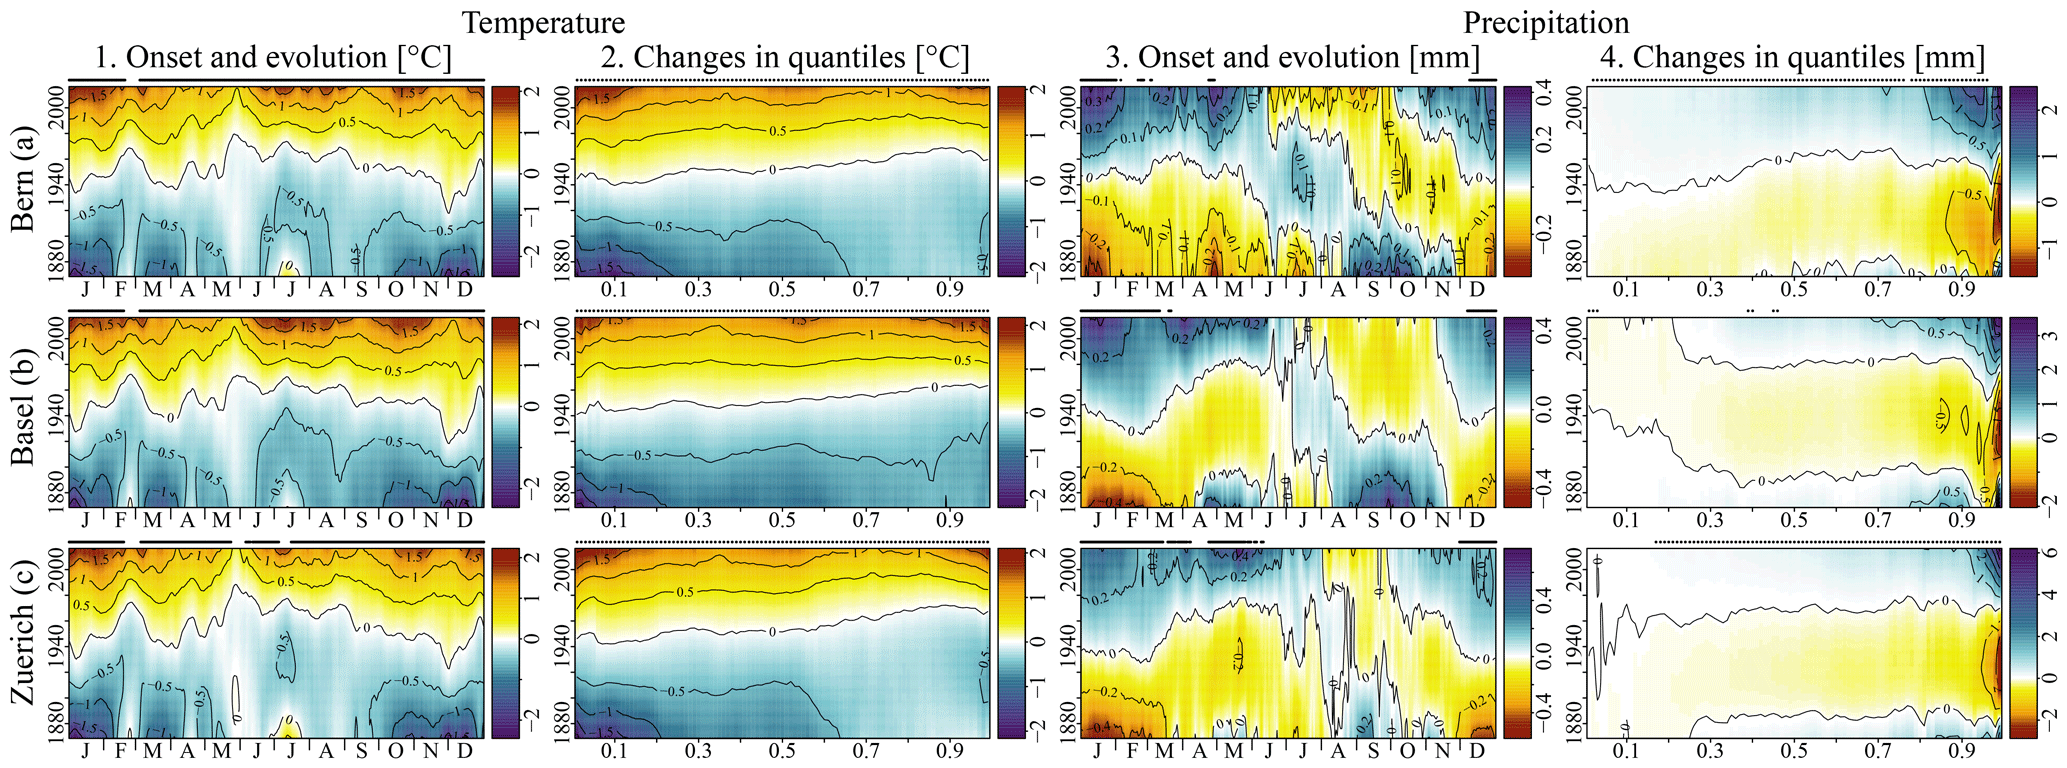
Figure 5Onset and evolution of changes and changes in quantiles for temperature and precipitation measured at stations Bern (a), Basel (b) and Zurich (c). Points on top of the panels indicate days/probabilities with significant changes according to the Mann–Kendall trend test. Time frame investigated: 1869–2016.
3.4 Changes in quantiles
Furthermore, we investigate changes in quantile magnitudes over time. Therefore, quantiles are estimated on an annual level (QYEA) (Fig. 3). The temporal evolution of QYEAs over the investigated time frame is assessed by applying CEEMDAN. In the case of precipitation, we only use values from “rainy days” (i.e. precipitation > 1 mm). The MK test serves to assess the significance of the trends (marked with points on top of the panel; see Sect. 3.3).
4.1 Seasonality of river runoff
Runoff recorded at gauges Wasserburg and Basel is highly seasonal, with high/low runoff during summer/winter (Fig. 4a1 and b1). Compared to gauge Wasserburg, more runoff is recorded at Basel during winter; i.e. the contrast between summer and winter is less pronounced. At gauge Wasserburg, very high discharge values are almost solely recorded between the months of May and September. Conversely, at gauge Basel, days with very high runoff show up throughout the year. Downstream from gauge Basel, runoff from rain-dominated tributaries such as the Neckar, Main and Mosel blend with Alpine runoff (see gauge Cologne, Fig. 4c1). Rainfall-runoff-dominated basins are characterized by high discharge during winter and the beginning of spring and low discharge in summer, as seen for Würzburg (Fig. 4d1).
4.2 Changes in seasonality
At gauges Wasserburg and Basel, runoff increases during winter and spring for all quantiles, while it decreases during summer and at the beginning of autumn (Fig. 4a2 and b2). This corresponds to a reduction in runoff seasonality. A very similar overall pattern of changes in runoff can be detected at gauge Cologne: runoff increases during winter and spring and decreases during summer and autumn (Fig. 4c2). In contrast, at gauge Würzburg, discharge quantiles increase throughout, except for high levels at the end of February and March (Fig. 4d2). Similarly to gauges Basel and Cologne, the strongest increases occur during winter.
4.3 Onset and evolution of changes
At gauge Wasserburg, pronounced changes in seasonality started in the second half of the 20th century during the 1960s (Fig. 4a3). In contrast, changes at gauge Basel seem to be more gradual and starting earlier in the investigated time period already (Fig. 4b3). At gauge Würzburg, a clear onset of change cannot be detected (Fig. 4d3); however, increases seem to be more uniform and enhanced in recent decades. Patterns of change from snowmelt and rainfall-runoff-dominated tributaries overlap at gauge Cologne (Fig. 4c3).
Looking at the respective evolution of potential drivers, temperatures continuously increased throughout the year (Fig. 5a1, b1, and c1). Similar amplitude and interannual patterns are apparent in the three time series. The amount of precipitation increases in recent decades, particularly during winter (Fig. 5a3, b3, and c3). The MK trend test detects significant monotonic increases/decrease in runoff during winter/summer for gauges Wasserburg and Basel (Fig. 4a3 and b3). For temperature, the MK detects significant increases throughout the year (Fig. 5a1, b1, and c1). Precipitation increases significantly during winter (Fig. 5a3, b3, and c3).
4.4 Changes in quantiles
Since the 1960s, QYEAs have strongly increased/decreased at levels below/above 0.6 at gauge Wasserburg (Fig. 4a4). These changes in QYEAs correspond to the strong decrease in seasonality in recent decades (see Sect. 4.2): runoff diminishes in summer and increases in winter. Likewise, at gauge Basel, lower QYEAs (levels < 0.6) increase and higher QYEAs (levels 0.6–0.8) decrease (Fig. 4b4). However, the onset of changes is earlier and changes are smoother compared to detected signals at gauge Wasserburg. Particularly changes in low QYEAs start to increase at the beginning of the investigated time frame already. In contrast to results from gauge Wasserburg, QYEAs at the highest levels (> 0.8) have been increasing at gauge Basel since the 1960s (Fig. 4b4). QYEAs from gauge Würzburg increase over the entire range investigated (Fig. 4d4). Changes in QYEAs below a level of approximately 0.6 occur earlier and are smoother than for higher levels. There, the increases have been enhanced in recent decades. At gauge Cologne, high QYEAs have increased in recent decades (Fig. 4c4), making it similar to findings from gauges Basel and Würzburg. Also, the lower QYEAs have experienced an increase. This increase, however, is not a gradual one over the entire time frame, but is rather a U-shaped process (decline until the 1940s, then increase).
For precipitation, similar pattern seem to show up. Increasing QYEAs hint at more (intense) rainfall in recent decades (Fig. 5a4, b4 and c4). Increases in QYEAs in temperature seem to occur earlier and seem to be enhanced at lower temperatures (Fig. 5a2, b2 and c2). Changes in quantiles for individual seasons are given in the Appendix (Figs. B1 and C1). At gauge Wasserburg, changes in QYEAs are significant according to the MK (Fig. 4a4). The more a trend pattern deviates from a monotonic increase and more U-shaped signals emerge, the more often the MK results in non-significant p values. The main results depicted in Fig. 4 are summarized in Table 2.
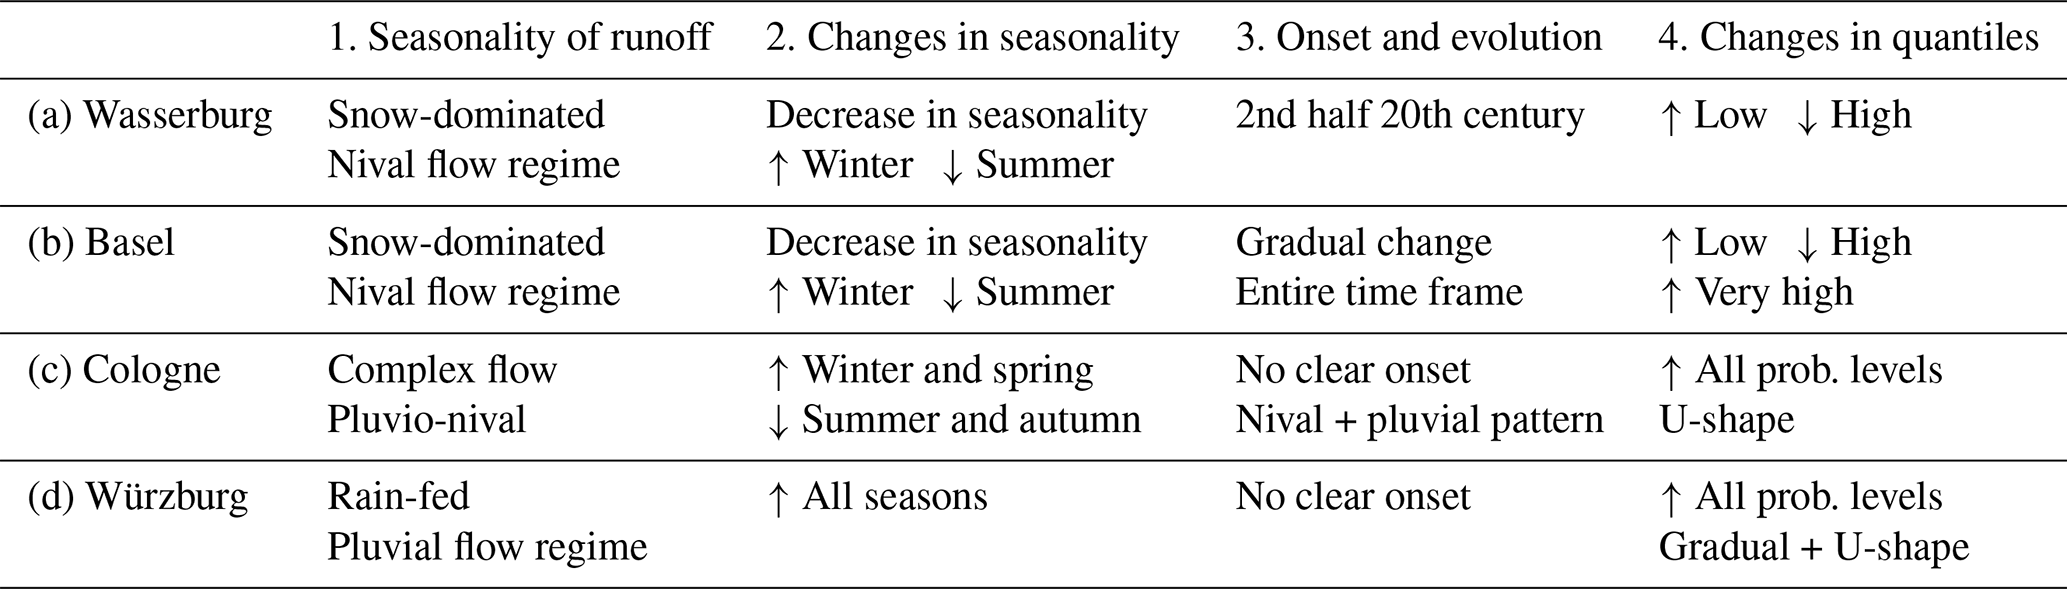
Table 2Summary of analysis results presented in Fig. 4. Table arrangement reflects figure layout.
5.1 Seasonality of river runoff
Runoff at gauge Wasserburg is dominated by the accumulation and depletion of a seasonal snowpack. The intra-annual variability of runoff is very high, and high flows mainly occur during the snowmelt season and during summer, when higher temperatures enable liquid precipitation in large fractions of the catchment (Fig. 4a1). There are no bigger lakes that could attenuate flood or low-flow events generated in the basin. In comparison, large lakes constitute an important element of the Rhine River basin until gauge Basel. Furthermore, large parts of the basin are sub-Alpine terrain. As a result, liquid rainfall is an important streamflow component throughout the year and runoff less seasonal compared to gauge Wasserburg (Stahl et al., 2016). A detailed overview of hydrological regimes in Switzerland and their characteristics can inter alia be found in Weingartner and Aschwanden (1992) or Speich et al. (2015). Reconstructing the largest flood events in the High Rhine basin since 1268, Wetter et al. (2011) indicate that about half of all major floods occur during summer. Flood events during summer usually are the result of high baseflow due to a melting Alpine snow cover superimposing with heavy rainfall (Wetter et al., 2011). Extreme flood events during autumn, winter and spring often are caused by long-lasting precipitation events coinciding with strong snowmelt due to rain on snow (RoS) and/or a temporary temperature increase (Wetter et al., 2011; Schmocker-Fackel and Naef, 2010). For higher-elevated river basins, RoS events play an important role in runoff formation (Sui and Koehler, 2001; Merz and Blöschl, 2003). The RoS flood that occurred in the Bernese Alps, Switzerland, in October 2011 showed how damaging these kinds of events can be (Rössler et al., 2014). Another example is the RoS events from January 2011, where rainfall released vast amounts of water stored in a temporary snow cover and caused RoS-driven flood events in the whole of central Europe (Freudiger et al., 2014). However, the importance of different flood-generating mechanisms is changing with recent climatic changes (see e.g. Blöschl et al., 2017, 2019; Berghuijs et al., 2019).
Even though about one-third of the runoff in the Main River originates from snowmelt (Stahl et al., 2016), there is only little impact of snow accumulation and snowmelt on the seasonal distribution of discharge. It seems that low temperatures rarely prevail long enough to enable the accumulation and preservation of snow over a longer period. Runoff is dominated by large-scale rainfall events occurring in winter and increased evapotranspiration during summer (Fig. 4d1). At gauge Cologne, we have the situation of superimposing nival and pluvial runoff components (Fig. 4c1). This overlap results in a more uniform seasonal distribution of discharge. High QDAYs are higher during winter, whereas low QDAYs are higher during summer (Fig. 4c1). This reversal in the seasonal distribution hints at the importance of different flow components for different flow situations. Runoff due to large-scale rainfall events over the middle and lower parts of the catchment are important for high discharge values, particularly during winter. During summer, snowmelt and glacier melt from the Alpine part of the basin play an important role in the sustenance of runoff in the lower reaches of the Rhine River (Stahl et al., 2016).
5.2 Changes in seasonality
In the snow-dominated river basins Wasserburg and Basel, the seasonality of river runoff decreases over the investigated time frame. For the increasing runoff values during winter and early spring, several mechanisms have to be taken into account. First of all, changes in the Alpine snow cover have to be considered. In recent decades, rising temperatures have caused less snow accumulation during winter (Laternser and Schneebeli, 2003; Marty, 2008; Scherrer et al., 2004; Wielke et al., 2004; Marty et al., 2017). Thus, a greater fraction of total precipitation is liquid and reaches the river system without being stored in snowpacks. In addition, the frequency of days with temperatures above 0 ∘C increases, causing parts of any existing snow cover to melt (Scheifinger et al., 2003; Kreyling and Henry, 2011; Zubler et al., 2014; Schädler and Weingartner, 2010). Rising temperatures also result in shorter snow duration, where “shorter snow duration is mainly caused by earlier snow melting in spring than by later first snowfalls in autumn” (Laternser and Schneebeli, 2003). The earlier onset of snowmelt in spring represents a much-noticed effect of rising temperatures on Alpine river runoff (e.g. Kormann et al., 2015; Birsan et al., 2005; Stewart, 2009).
Less snow accumulation during the preceding winter results in lower discharges during the following melting period, i.e. late spring and early summer. Furthermore, recent studies suggest that rising temperatures might lead to a reduction in snowmelt rates (Musselman et al., 2017; Wu et al., 2018). “Slower snowmelt in a warmer world may decrease the likelihood that wetness thresholds that permit hydrologic connectivity will be exceeded, leading to spring and summer streamflow declines and lower runoff efficiency” (Musselman et al., 2017).
Changes in the liquid/solid fraction of precipitation overlap with changes in the total amount of rainfall. We observed increased rainfall during winter for all stations investigated. Likewise, numerous other studies point to a recent increase in precipitation, particularly during winter (e.g. Begert et al., 2005; Scherrer et al., 2016; Frei and Schär, 2001). However, increasing catchment evaporation due to increasing radiation, air temperature and vegetation activity might at least partly compensate detected changes in precipitation (Duethmann and Blöschl, 2018; Schädler and Weingartner, 2010; Norris and Wild, 2007; Wild et al., 2007).
At gauge Cologne, we also detect a decrease in discharge during summer and autumn (Fig. 4c2). We hypothesize that this decrease is the result of a downstream propagation of the Alpine signal, possibly overlapping with increasing evaporation rates in the basin. The decrease in summer discharge in the Lower Rhine cannot be attributed to reduced ice melt contributions from the Alpine glaciers. Assessing the snow and glacier melt components of streamflow of the Rhine River for the time frame 1901–2006, Stahl et al. (2016) showed that “despite the glacier retreat the modelled ice melt component of the streamflow in the Rhine does not show a strong long-term trend over the entire study period, i.e. a systematic decline or increase of this component. The detailed results of the modelling suggests that an increased ice melt due to increased temperature may have been compensated by the reduction in glacier area”. Gauge Würzburg, with its discharge increasing throughout the entire year, does not show any detectable changes in seasonality.
5.3 Onset and evolution of changes
Investigating long-term snow trends of the Swiss Alps, Laternser and Schneebeli (2003) suggest that “mean snow depth, the duration of continuous snow cover and the number of snowfall days in the Swiss Alps all show very similar trends during the observation period 1933–1999: a gradual increase until the early 1980s (with significant interruptions during the late 1950s and early 1970s) followed by a statistically significant decrease towards the end of the century”.
At gauge Basel, these changes in Alpine snowpacks seem to be insufficient to explain the decrease in runoff seasonality detected. In particular, winter discharge (low QYEAs) increases already from the beginning of the investigated time frame on (Fig. 4b3 and b4). Instead, we suspect anthropogenic alterations of the river network, particularly reservoir constructions, to be an important driver. These might have caused the redistribution of water from summer to winter earlier in the investigated time frame already. Large fractions of the Swiss and Austrian Alpine river systems have been dammed to produce hydropower. The two Alpine countries have the highest specific hydroelectric production per surface area globally (Truffer et al., 2001). The first hydropower station in Switzerland was constructed in 1899 (Verbunt et al., 2005). Dam constructions in the Alpine Rhine and along other Alpine rivers, such as the Aare, Limmat and Reuss, gained momentum in the 1920s, and most of the large storage lakes were constructed between 1950 and 1970 (Meile et al., 2011; Wildenhahn and Klaholz, 1996; Wagner et al., 2015; Bosshard et al., 2013) (Fig. E1). The total storage volume of large storage lakes (river weirs not included) of the High Rhine/entire Rhine basin is estimated to amount to 1.86/3.12 × 109 m3 (Wildenhahn and Klaholz, 1996). In order to ensure full functional capability of high-head storage hydropower stations, reservoirs need to have sufficient water volume stored at all times. Therefore, reservoirs tend to be filled during summer when discharge is high. Conversely, storages are depleted during low flow in winter (Belz et al., 2007; Meile et al., 2011; Farinotti et al., 2016; Wesemann et al., 2018). A rough estimation supports this notion: assuming the 1.86 × 10⁹ m3 of storage is emptied between December and April (and filled between June and October), mean runoff would increase/decrease by approximately 10 in these months during the investigated time frame, which corresponds to the trend magnitudes depicted in Fig. 4b2. In addition to reservoir constructions, regulations of lake levels and routing of rivers through lakes, e.g. the diversion of the Aare River into Lake Biel in 1887 (part of the First Jura-Waters Corrections), need to be considered (Wetter et al., 2011).
At gauge Wasserburg, pronounced changes in runoff seasonality do not show up until the second half of the 20th century (Fig. 4a3 and a4). In the Inn basin, the constructions of key reservoirs, such as the Gepatsch reservoir (Tyrol, Austria), the Lago di Livigno reservoir (Grisons, Switzerland, and Lombardy, Italy) and the Lai da Ova Spin compensation reservoir (Grisons, Switzerland), were not completed until the 1960s. The construction of those big reservoirs coincides with the detected onset of changes in river runoff. We suspect that also in the Inn River basin, the construction and management of reservoirs for hydropower might be an important factor changing seasonality of river runoff. In addition to changes in seasonality, the operation of high-head hydropower stations causes unnatural fluctuation on (sub-)daily timescales (hydropeaking) (Meile et al., 2011; Pérez Ciria et al., 2019) (see also Fig. F1). Effects of reservoirs possibly overlap (with) changes induced by changes in snow cover.
Also, rainfall-runoff-dominated rivers, such as the Main River at Würzburg, are strongly affected by hydro-engineering installations. One large-scale project inaugurated in 1992 after numerous decades of constructions is the Rhine–Main–Danube waterway. In order to raise low water discharge in the Main River, about 1.55 × 10⁸ m3 (3.50 × 10⁸ m3) of water is transferred on average per year (in a dry year) from the Danube into the Main River basin via the Main–Danube Canal (Maniak, 2016). The connection from the Rhine River until Würzburg with constructions of weirs to regulate the river´s water level was completed in the 1940s (Wirth, 1995). This onset of water-level regulations in the 1940s coincides with increasing low QYEAs (< 0.6) at gauge Würzburg (Fig. 4d4). We suspected that anthropogenic alterations strongly impacted the discharge of the Main River, particularly during low-discharge periods. However, they seem to be insufficient to explain changes in higher QYEAs.
5.4 Changes in quantiles
We detect increasing high QYEAs at gauges Basel, Cologne and Würzburg (Fig. 4b4, c4, and d4). Possible driving mechanisms might be changes in precipitation: our results hint at more (intense) rainfall in recent decades (Fig. 5). In the following, we discuss possible underlying forcing mechanisms of detected signals. These include changes in large-scale circulation patterns, solar dimming/brightening and temperature–moisture feedbacks.
Long-term changes in the occurrence frequencies and/or characteristics of circulation patterns are known to have a strong impact on local climate. More frequent zonal circulation in winter since the 1970s, for example, might be responsible for “more frequent mild and humid winters in Central Europe” (Bárdossy and Caspary, 1990). This increase in zonal circulation follows upon several decades with increased numbers of blocking days during winter (Häkkinen et al., 2011). Blocking in the Atlantic region is anti-correlated with phases of the North Atlantic Oscillation (NAO) (Scherrer et al., 2006; Stein, 2000; Pavan et al., 2000). Negative values of the NAO index “indicate periods of reduced north-south pressure gradient, reduced westerly winds and weaker advection of warm oceanic air onto the cold European landmass” (Parker et al., 2007). Wintertime NAO on the other hand is influenced by the Atlantic Multidecadal Oscillation (AMO): a “positive phase of the AMO results in more frequent negative NAO” (Peings and Magnusdottir, 2014). The AMO depicts multi-decadal (60–70 years) variations in sea surface temperatures in the North Atlantic basin (Peings and Magnusdottir, 2014; Kerr, 2000). After several decades of warm anomalies of sea surface temperatures (positive phase of AMO, which coincided with more frequent blocking days), the North Atlantic started to cool down and to transition into a negative AMO phase in the 1960s (Peings and Magnusdottir, 2014; Häkkinen et al., 2011). This transition into a negative AMO phase and fewer blocking days coincides with more frequent zonal circulation in winter (Bárdossy and Caspary, 1990), more (intense) rainfall (Fig. 5a3, b3, c3, a4, b4, and c4) and an increase in discharge, whereas changes seem to overlap with changes induced by anthropogenic alteration of the river network and changes in Alpine snowpacks (Fig. 4b4, c4, and d4).
Generally, detected patterns in temperature time series investigated in the framework of this study are consistent across all stations (Figs. 5 and D1). In the case of precipitation, overall patterns are similar; however, stronger variations among stations show up. Precipitation is subject to stronger local and regional variability than temperature. This evidently limits the informative value of precipitation recorded at individual points for discussions on catchment scale. However, variations of local meteorological variables are strongly influenced by large-scale flow and regional-scale weather patterns (Scherrer et al., 2016; Murawski et al., 2018; Weusthoff, 2011). Weather patterns/types represent specific synoptic conditions and lead to certain meteorological conditions in a region. For western Germany, precipitation correlates well on scales of hundreds of kilometres, particularly during winter (Schönwiese and Rapp, 1997). During summer, local convective storms are an important source of rainfall, and strong differences in amount and intensity over very short distances are possible (Sodemann and Zubler, 2010; Lavers et al., 2013). However, such convective storms “are hardly of any relevance for the formation of floods in the large river basins of Central Europe, because the extent of convective rainstorms is restricted to local occurrence” (Bronstert et al., 2007). Rainfall-runoff processes on larger scales are dominated by advective precipitation. The main moisture source then is the Atlantic Ocean (Sodemann and Zubler, 2010). Following the above-mentioned aspects, we hypothesize that even if superimposed by local variability due to smaller-scale processes and regional variations due to general precipitation gradients, long-term signals in precipitation detected on point scale can provide important information for discussions on catchment scale. However, caution has to be exercised, results of available stations compared and findings not transferred to places outside the region of influence.
Marty (2008) relate detected shifts in snow days in Switzerland to an enhanced temperature increase due to changes in circulation patterns coinciding with “the full magnitude of the greenhouse effect, which is no longer masked by solar dimming”. After a multi-decadal decrease from about the 1950s to the 1980s (solar dimming), recent decades saw an increase in regional solar irradiance (solar brightening) due to decreasing amounts of anthropogenic aerosols in the atmosphere (Ruckstuhl et al., 2008; Norris and Wild, 2007; Ruckstuhl and Norris, 2009).
Rapidly rising temperatures have the capacity to affect the entire hydrological cycle. A feedback mechanism of major importance in this respect is the temperature–moisture feedback: rising temperatures result in increasing evaporation and precipitation, which in turn leads to an intensification of the entire hydrological cycle (Huntington, 2006; Held and Soden, 2000). Lehmann et al. (2015) indicate that a “thermally driven moisture increase has significantly contributed to the intensification of extreme rainfalls since the 1980s”.
Against the background of recent changes in temperature, precipitation, and frequencies in zonal circulation, and following Labat et al. (2004), we suggest that rapid increases in temperatures in recent decades have resulted in an increased sea–land transport of moisture and increases in precipitation and runoff. Signals possibly overlap with changes in moisture transport due to varying frequencies in zonal circulation and blocking days.
At gauge Wasserburg, in contrast to other gauges investigated, high QYEAs do not increase. We suspect that in this case, high discharges are also controlled by snowmelt processes rather than by liquid rainfall. Furthermore, investigated rain gauges might not depict changes in precipitation in the complex Alpine topography of the catchment. In the High Rhine basin up to gauge Basel, large fractions of the basin are located outside the Alpine ridge and liquid precipitation plays an important role throughout the year. Therefore, impacts of changes in snow cover, reservoir constructions and effects of more (intense) rainfall all seem to be detectable in measured discharge (Fig. 4b4). Changes in snow cover and river regulations, which decrease runoff seasonality, seem to primarily affect QYEAs below a level of 0.85, and more intense rainfall events increase the magnitude of higher QYEAs.
We investigate daily observational data from key river gauges and meteorological stations located in central Europe covering the time frame 1869–2016. Investigated time series stand out by the exceptional length and quality of their continuous recordings. A cascading sequence of analytical tools is used to extract high-resolution signals of long-term changes. In order to acquire a comprehensive picture of long-term changes, we combine quantile sampling with moving average trend statistics and empirical mode decomposition. Given that the recordings have sufficient length and quality, presented tools enable investigations of high resolution and provide detailed insights into underlying trend patterns. A very high quality of the time series is required to prevent non-climatic factors, such as changes in observation practices or site relocation, from affecting the determination of trends (Begert et al., 2005; Scherrer et al., 2016; Begert and Frei, 2018). A sufficient length of the time series is vital to be able to distinguish between natural climate variability and signals of climate change. When adopting strict criteria regarding data length and data quality, the number of stations suitable for analysis strongly decreases. A small database limits the significance of attained results, though. This is a trade-off we need to accept in order to ensure full functionality of presented analytical tools. Consistent results for stations and parameters investigated make us confident that even if the number of stations is limited, we will attain meaningful results that are worth discussing.
The seasonality of the analysed snow-dominated rivers decreases. We suspect river regulations, particularly reservoir constructions, to be the main driver of detected changes. Reservoirs are filled during summer when discharge is high and storages depleted during low flow in winter (e.g. Belz et al., 2007; Meile et al., 2011). In recent decades, runoff changes induced by reservoir constructions seem to overlap with changes in Alpine snowpacks (Laternser and Schneebeli, 2003; Scherrer et al., 2004). Rising temperature reduces seasonal snow covers and the seasonal redistribution of runoff from winter to summer. An exact separation of effects of reservoirs and changes in snow cover and investigations of possible counterbalancing interactions are still pending and are the focus of future research. Furthermore, we suspect that detected decreases in discharge during summer and autumn in the Lower Rhine region at gauge Cologne are the result of a downstream propagation of the Alpine signal, possibly further overlapping with increasing evaporation rates in the basin.
In addition, our results hint at more (intense) rainfall in recent decades, particularly during winter. Detected changes in precipitation seem to intensify high discharges. The detected increase in precipitation (intensity) is not a gradual one over the entire time frame, but rather follows a U-shape (decline until the 1940s, then increase). Further research is necessary to pin down underlying mechanisms of detected changes in precipitation and runoff. We suspect that detected signals might be due to an increase in sea–land transport of moisture, particularly during winter, being part of a recent intensification of the entire hydrological cycle (Huntington, 2006; Held and Soden, 2000; Lehmann et al., 2015; Labat et al., 2004). Temperature-driven increases in moisture and precipitation possibly overlap with natural multi-decadal variations in sea–land–moisture transport (Parker et al., 2007; Kerr, 2000; Häkkinen et al., 2011; Peings and Magnusdottir, 2014; Bárdossy and Caspary, 1990; Scherrer et al., 2006; Pavan et al., 2000).
Over recent decades, hydrological regimes have been changing at a very fast pace. Some progress has been made in extracting long-term signals of change in hydro-climatic data. However, further studies investigating long-term changes in river runoff focusing on the detection of underlying mechanisms and the disentanglement of their effects are of great urgency and importance.
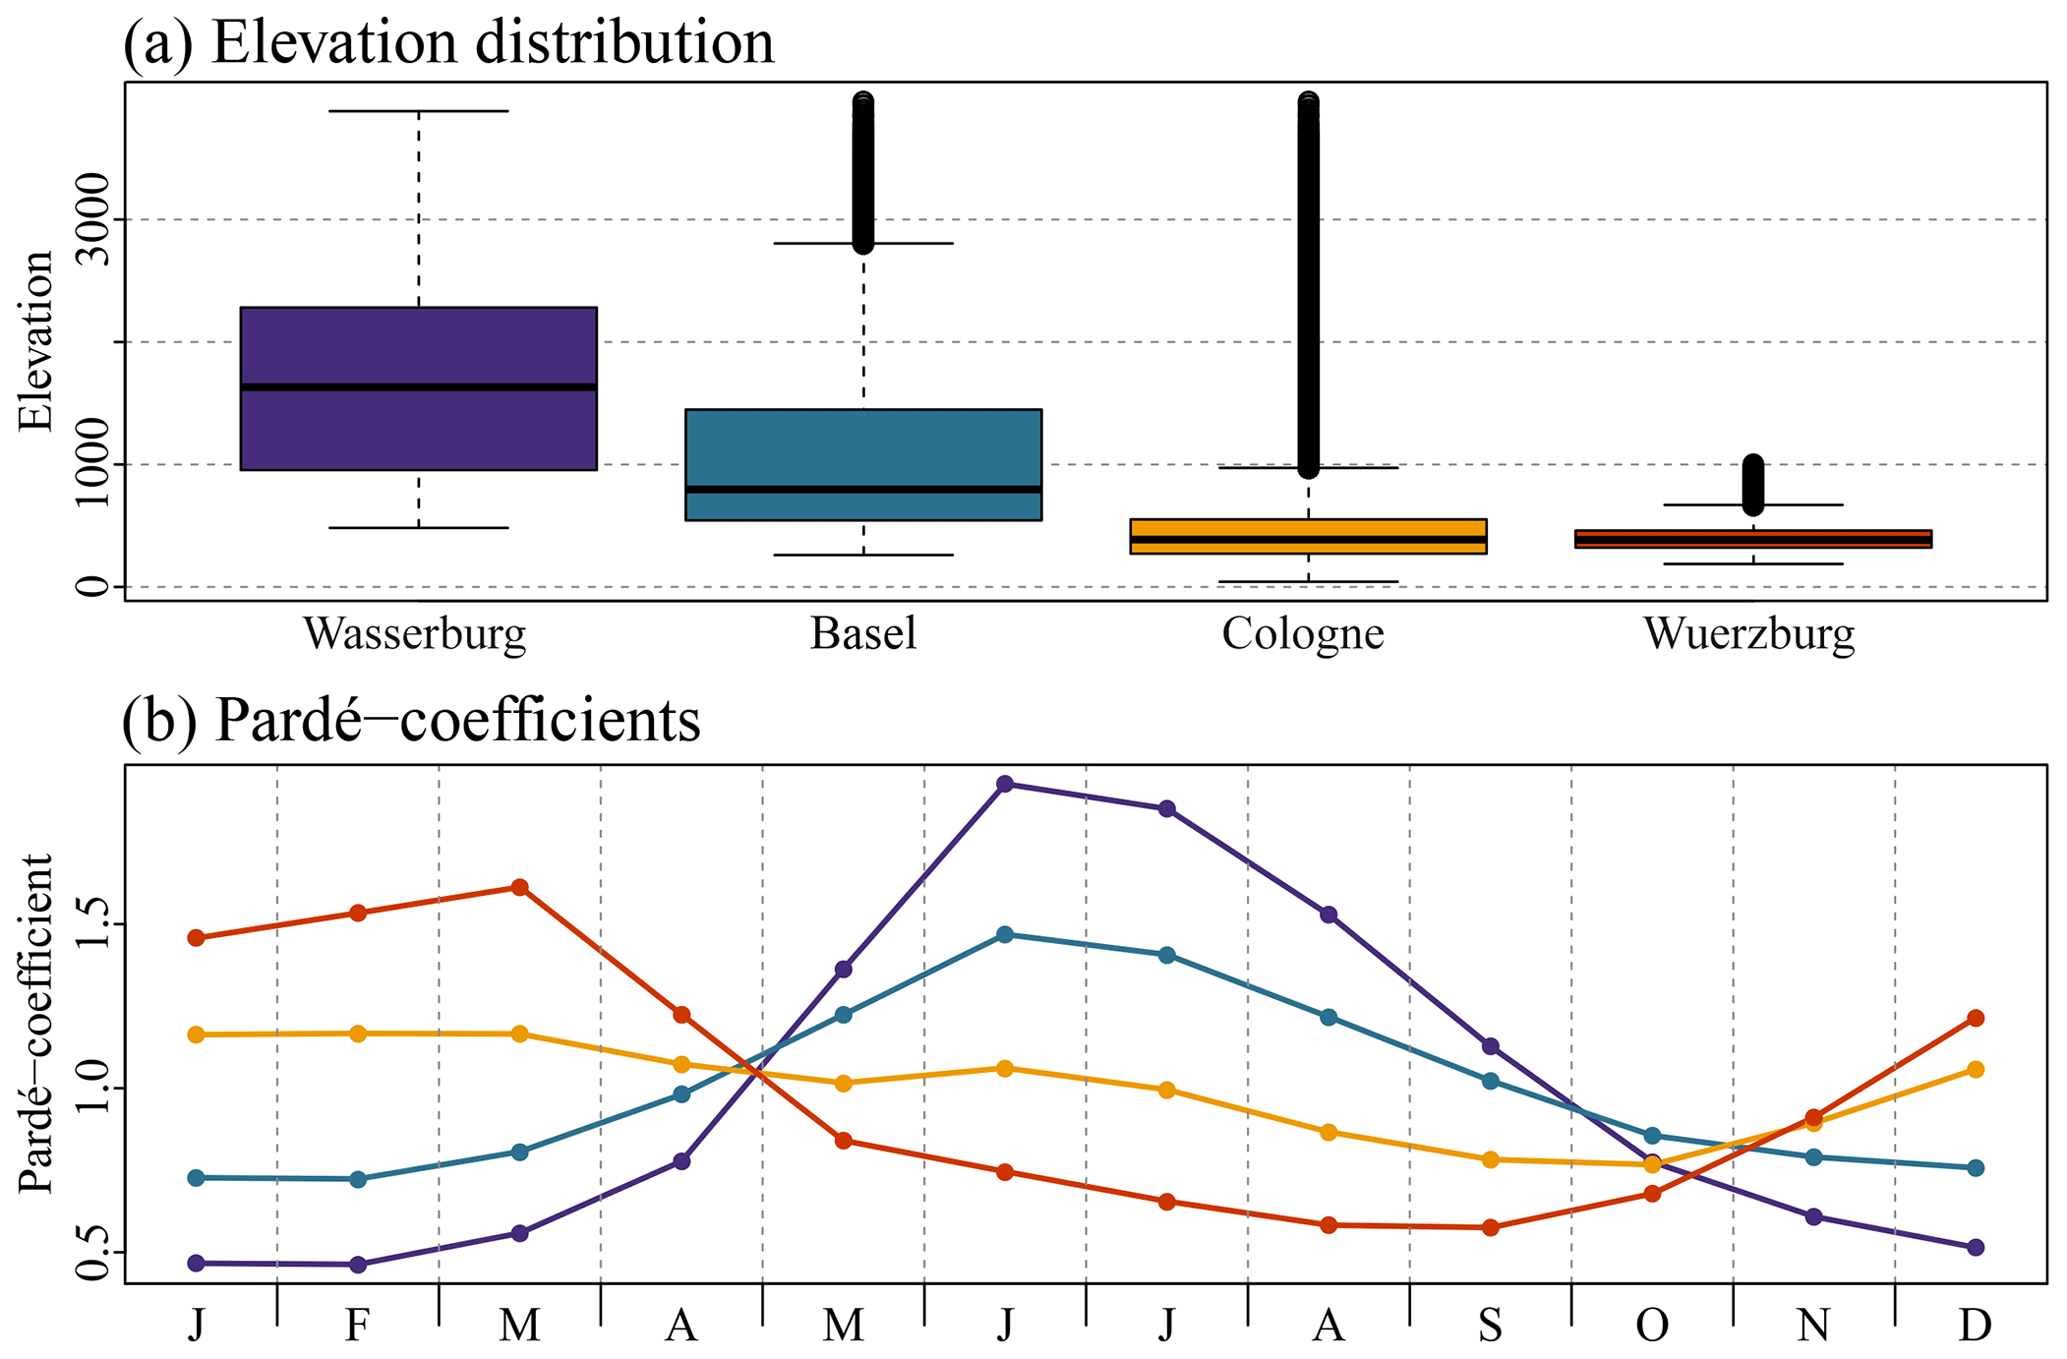
Figure A1Elevation distribution (raster cells at 500 m resolution calculated based on EU-DEM v.1.1 by the EU Copernicus Programme) and Pardé coefficients (mean monthly discharge divided by the mean annual discharge) (Pardé, 1933; Spreafico and Weingartner, 2005) for investigated river basins Wasserburg, Basel, Cologne and Würzburg.
Table A1Additional climate stations investigated: station name, location (WSG 84), altitude (m), daily resolution time series investigated with temperature (T) and precipitation (P) and data source Federal Office of Meteorology and Climatology of Switzerland (MeteoSwiss).
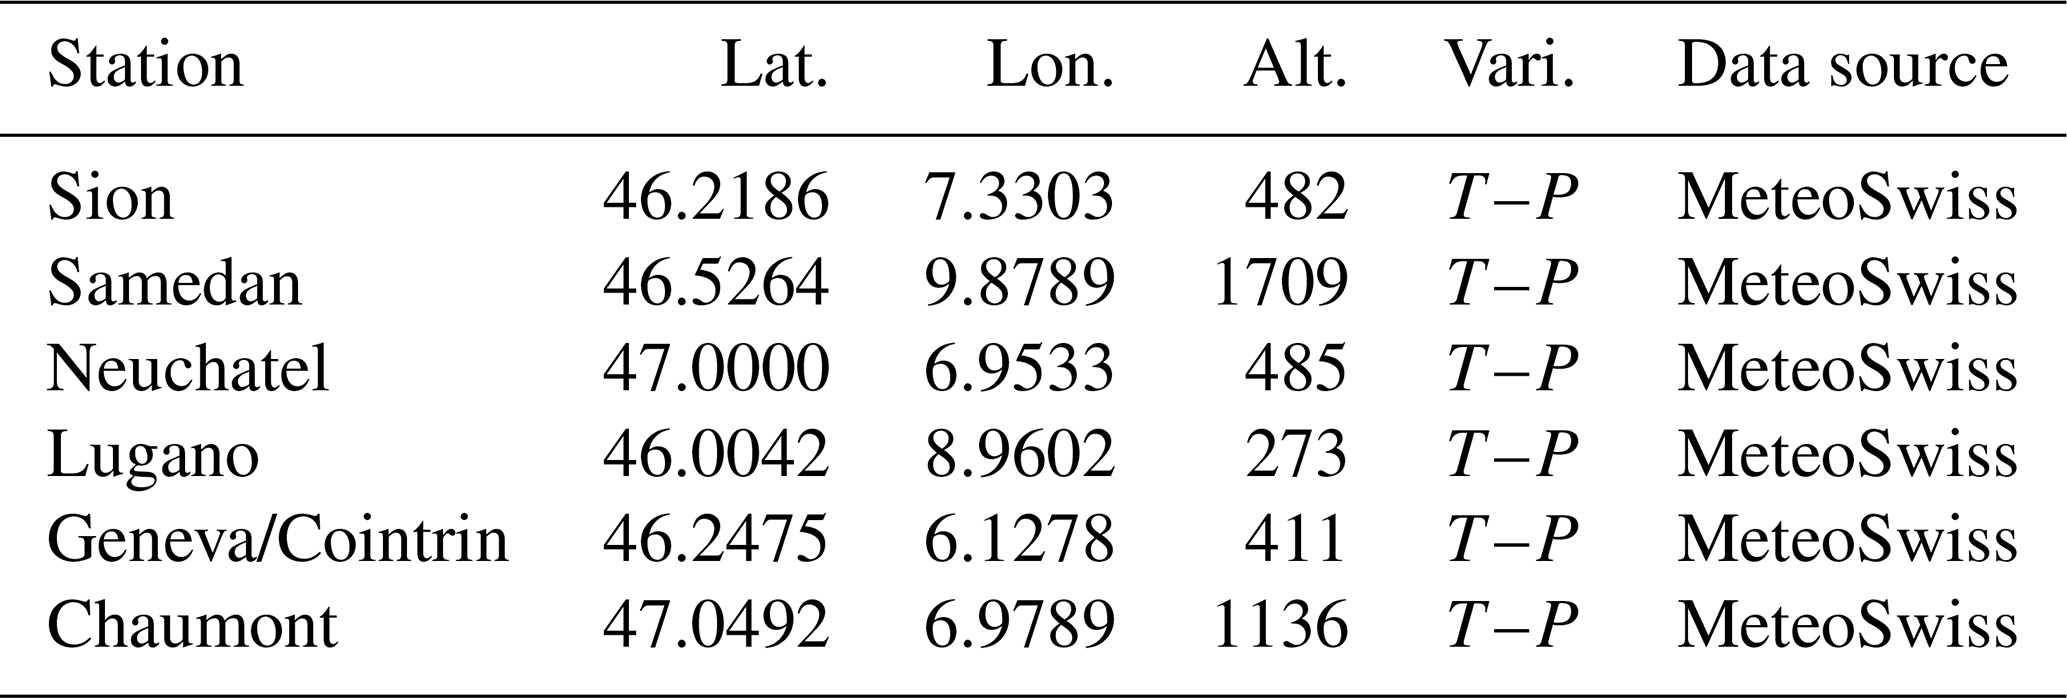
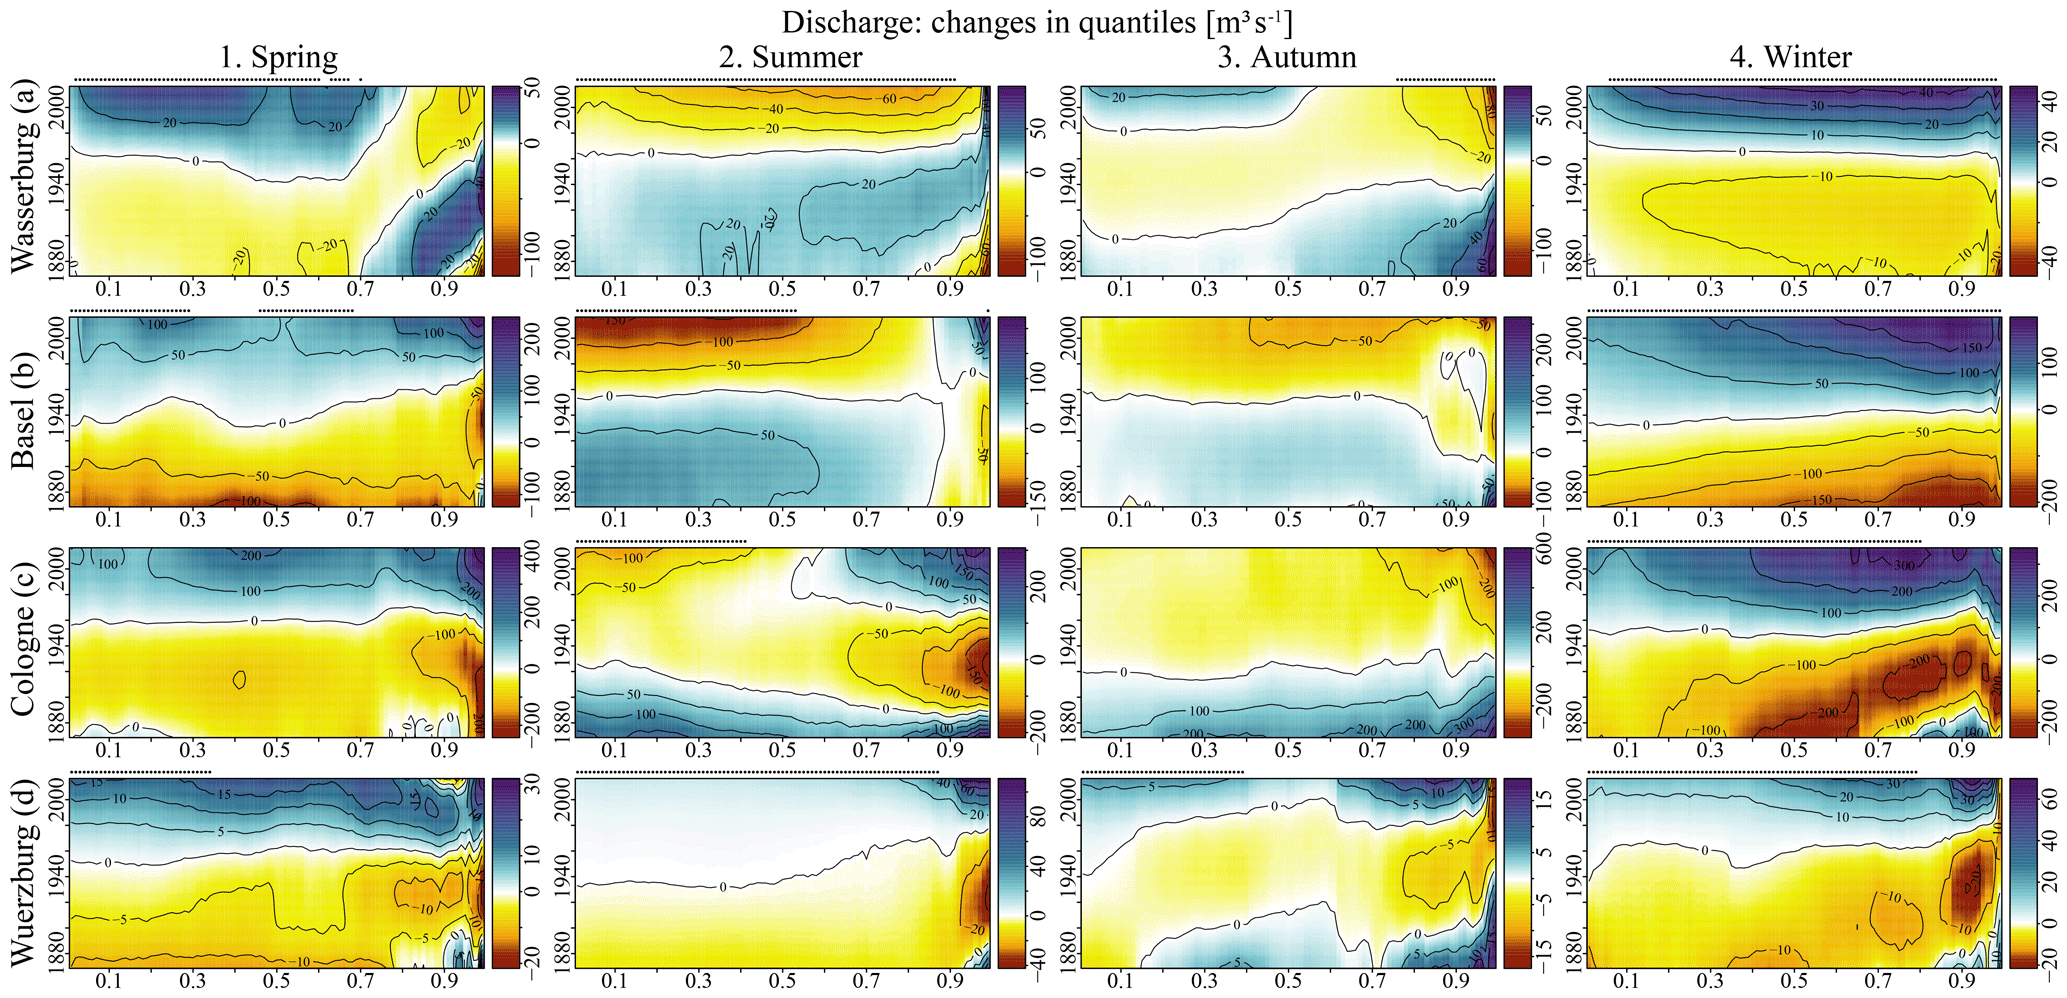
Figure B1Changes in quantiles for individual seasons (spring: March–May, summer: June–August, autumn: September–November and winter: December–February) for discharge measured at gauges Wasserburg (a), Basel (b), Cologne (c) and Würzburg (d). Points on top of the panels indicate days/probabilities with significant changes according to the Mann–Kendall trend test. Time frame investigated: 1869–2016.
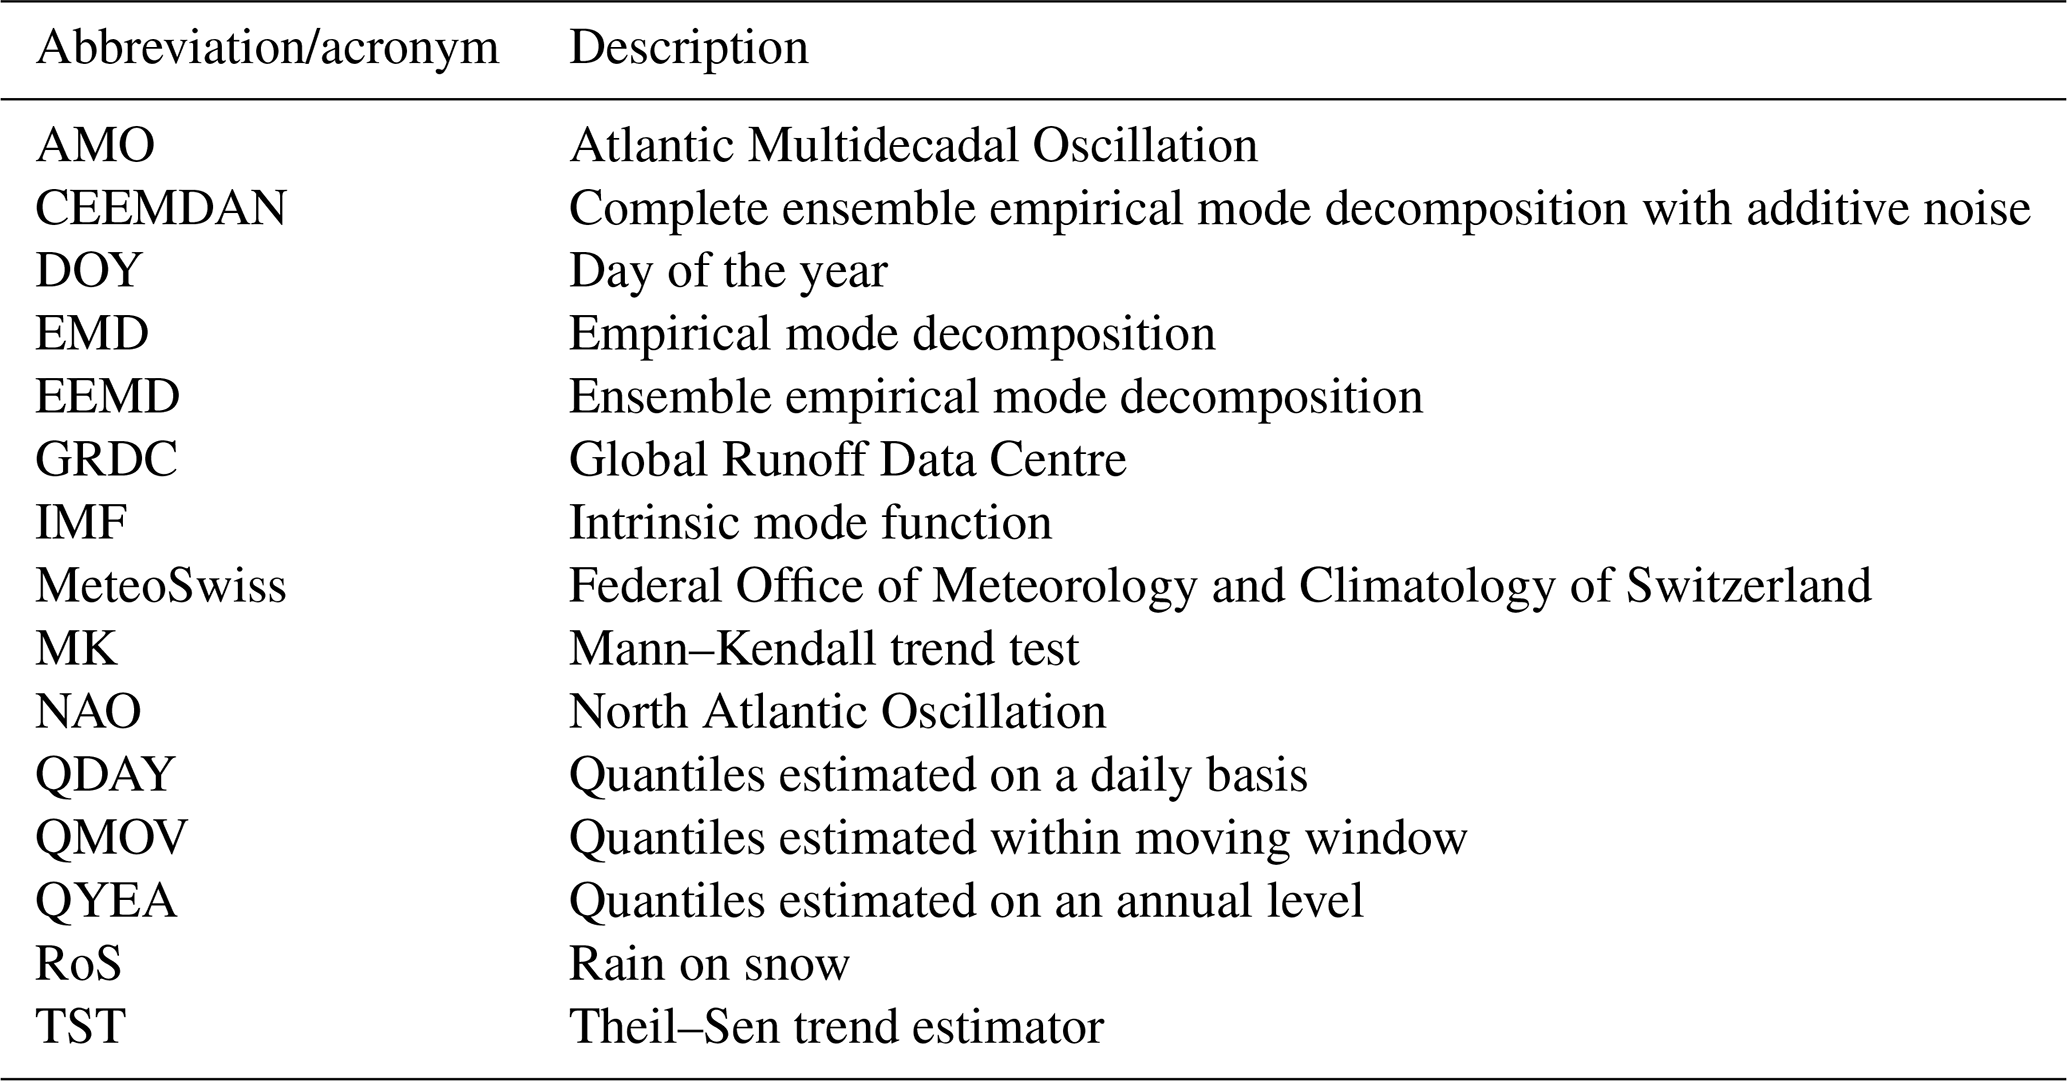
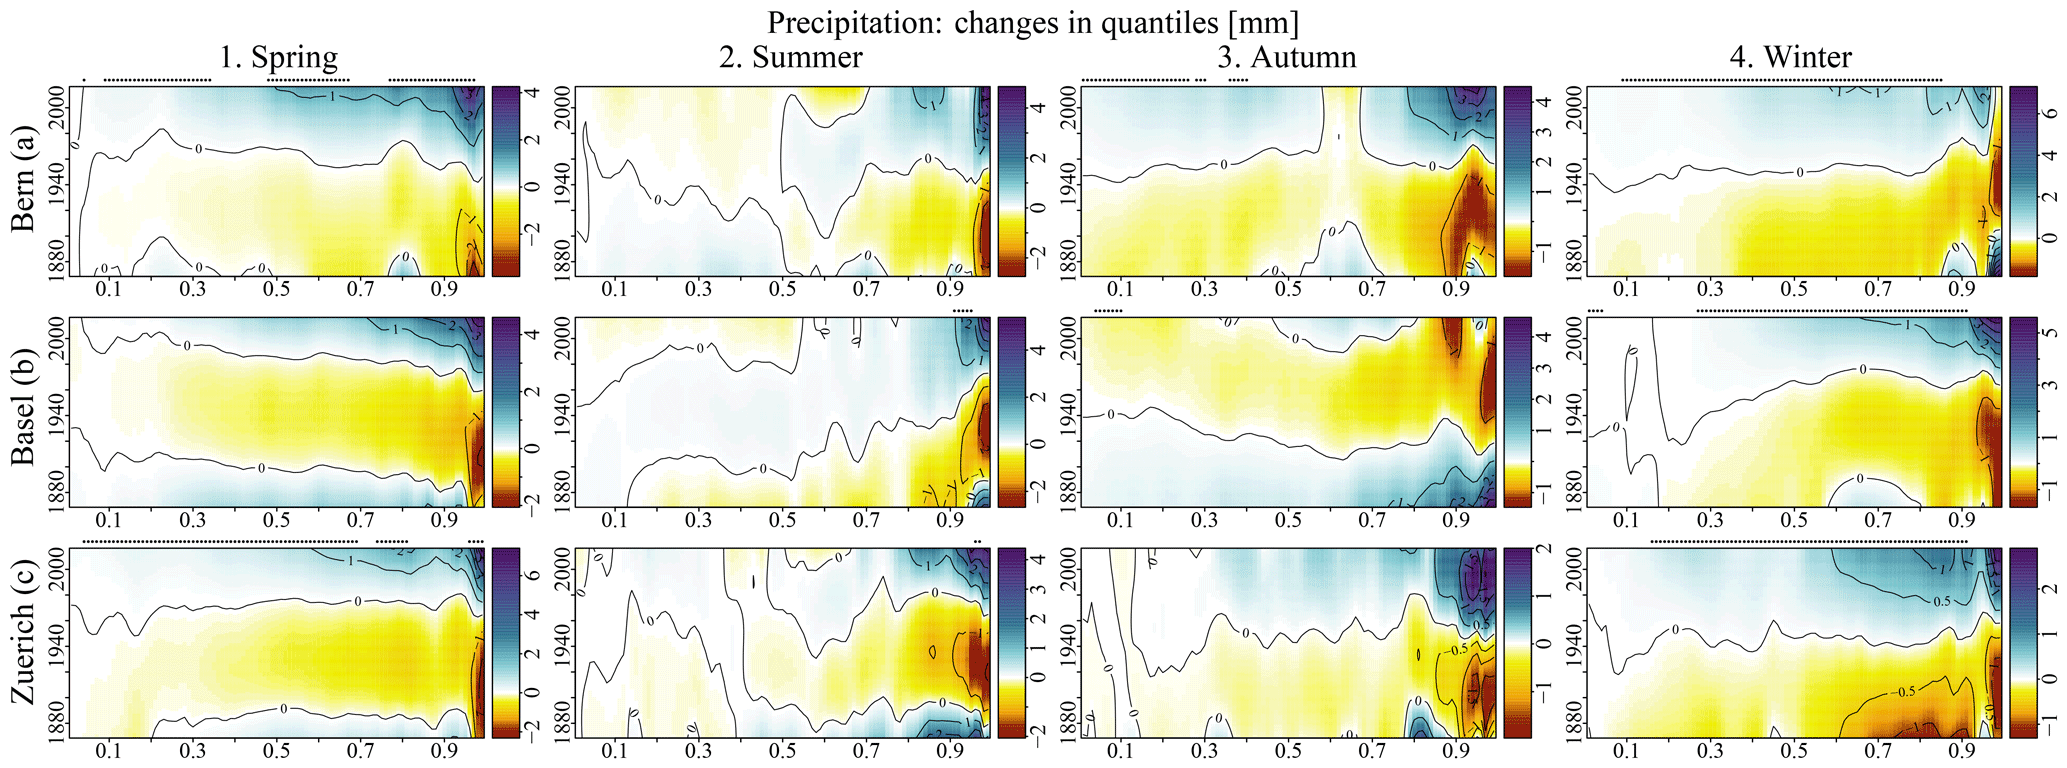
Figure C1Changes in quantiles for individual seasons (spring: March–May, summer: June–August, autumn: September–November and winter: December–February) for precipitation measured at stations Bern (a), Basel (b) and Zurich (c). Points on top of the panels indicate days/probabilities with significant changes according to the Mann–Kendall trend test. Time frame investigated: 1869–2016.

Figure D1Onset and evolution of changes and changes in quantiles for temperature and precipitation measured at stations Sion (a), Samedan (b), Neuchatel (c), Lugano (d), Geneva (e) and Chamont (f). Points on top of the panels indicate days/probabilities with significant changes according to the Mann–Kendall trend test. Time frame investigated: 1869–2016.
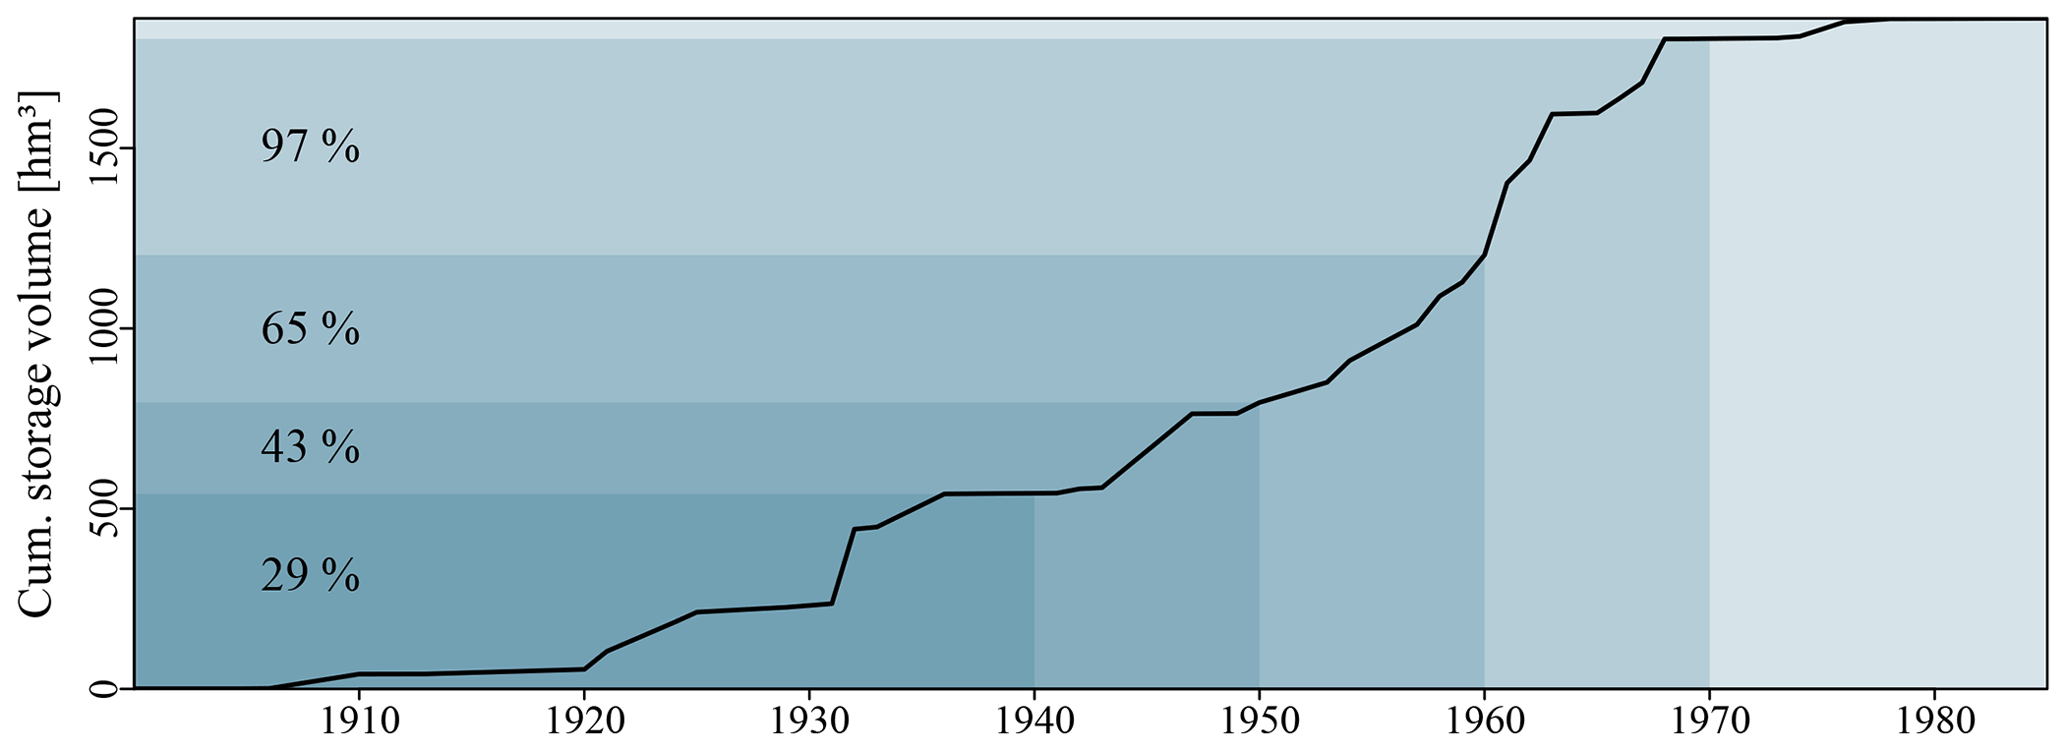
Figure E1Cumulative storage volume of large storage lakes (active storage volume more than 0.3 hm3) in the High Rhine basin until gauge Basel. The figure is based on information presented in Wildenhahn and Klaholz (1996). Time frame displayed: 1900–1985.

Figure F1Raster hydrograph for gauge Wasserburg. In recent decades, hydropeaking (weekly pattern) due to the operation of high-head storage hydropower stations imprinted. Time frame displayed: 1869–2016.
Climatological data used in this study were obtained from the Federal Office of Meteorology and Climatology of Switzerland, CH-8058 Zurich Airport (MeteoSwiss). Discharge data analysed were provided by the Global Runoff Data Centre, 56068 Koblenz, Germany (GRDC). Data analysis was carried out using the R statistical software (https://www.r-project.org/, last access: 7 April 2020; R Core Team, 2018).
ER conducted the analysis and wrote the manuscript. TF, GB and AB provided guidance in the process of data analysis and preparation of the manuscript.
The authors declare that they have no conflict of interest.
The Federal Office of Meteorology and Climatology of Switzerland (MeteoSwiss) and the Global Runoff Data Centre (GRDC) provided climatological and discharge data, respectively. The Copernicus Land Monitoring Service, implemented by the European Environmental Agency, provided the European Digital Elevation Model (EU-DEM), version 1.1.
This research was supported by the Deutsche Forschungsgemeinschaft (GRK 2043/1-P2) within the NatRiskChange research training group at the University of Potsdam (https://www.uni-potsdam.de/natriskchange/, last access: 7 April 2019).
This paper was edited by Jim Freer and reviewed by Massimiliano Zappa and one anonymous referee.
Bárdossy, A. and Caspary, H. J.: Detection of Climate Change in Europe by Analyzing European Atmospheric Circulation Patterns from 1881 to 1989, Theor. Appl. Climatol., 42, 155–167, https://doi.org/10.1007/BF00866871, 1990. a, b, c
Barnett, T. P., Adam, J. C., and Lettenmaier, D. P.: Potential Impacts of a Warming Climate on Water Availability in Snow-Dominated Regions, Nature, 438, 303–309, https://doi.org/10.1038/nature04141, 2005. a
Begert, M. and Frei, C.: Long-Term Area-Mean Temperature Series for Switzerland – Combining Homogenized Station Data and High Resolution Grid Data, Int. J. Climatol., 38, 2792–2807, https://doi.org/10.1002/joc.5460, 2018. a
Begert, M., Schlegel, T., and Kirchhofer, W.: Homogeneous Temperature and Precipitation Series of Switzerland from 1864 to 2000, Int. J. Climatol., 25, 65–80, https://doi.org/10.1002/joc.1118, 2005. a, b, c, d
Belz, J. U., Brahmer, G., Buiteveld, H., Engel, H., Grabher, R., Hodel, H., Krahe, P., Lammersen, R., Larina, M., Mendel, H.-G., Meuser, A., Müller, G., Plonka, B., Pfister, L., and van Vuuren, W.: Das Abflussregime des Rheins und seiner Nebenflüsse im 20. Jahrhundert. Analyse, Veränderungen und Trends, Tech. Rep. Bericht Nr. I-22, Internationale Kommission fur die Hydrologie des Rheingebietes (KHR), Utrecht, Netherlands, 2007. a, b, c
Berghuijs, W. R., Harrigan, S., Molnar, P., Slater, L. J., and Kirchner, J. W.: The Relative Importance of Different Flood-Generating Mechanisms Across Europe, Water Resour. Res., 55, 4582–4593, https://doi.org/10.1029/2019WR024841, 2019. a
Birsan, M.-V., Molnar, P., Burlando, P., and Pfaundler, M.: Streamflow Trends in Switzerland, J. Hydrol., 314, 312–329, https://doi.org/10.1016/j.jhydrol.2005.06.008, 2005. a, b, c
Blöschl, G., Hall, J., Parajka, J., Perdigão, R. A. P., Merz, B., Arheimer, B., Aronica, G. T., Bilibashi, A., Bonacci, O., Borga, M., Čanjevac, I., Castellarin, A., Chirico, G. B., Claps, P., Fiala, K., Frolova, N., Gorbachova, L., Gül, A., Hannaford, J., Harrigan, S., Kireeva, M., Kiss, A., Kjeldsen, T. R., Kohnová, S., Koskela, J. J., Ledvinka, O., Macdonald, N., Mavrova-Guirguinova, M., Mediero, L., Merz, R., Molnar, P., Montanari, A., Murphy, C., Osuch, M., Ovcharuk, V., Radevski, I., Rogger, M., Salinas, J. L., Sauquet, E., Šraj, M., Szolgay, J., Viglione, A., Volpi, E., Wilson, D., Zaimi, K., and Živković, N.: Changing climate shifts timing of European floods, Science, 357, 588–590, https://doi.org/10.1126/science.aan2506, 2017. a
Blöschl, G., Hall, J., Viglione, A., Perdigão, R. A. P., Parajka, J., Merz, B., Lun, D., Arheimer, B., Aronica, G. T., Bilibashi, A., Boháč, M., Bonacci, O., Borga, M., Čanjevac, I., Castellarin, A., Chirico, G. B., Claps, P., Frolova, N., Ganora, D., Gorbachova, L., Gül, A., Hannaford, J., Harrigan, S., Kireeva, M., Kiss, A., Kjeldsen, T. R., Kohnová, S., Koskela, J. J., Ledvinka, O., Macdonald, N., Mavrova-Guirguinova, M., Mediero, L., Merz, R., Molnar, P., Montanari, A., Murphy, C., Osuch, M., Ovcharuk, V., Radevski, I., Salinas, J. L., Sauquet, E., Šraj, M., Szolgay, J., Volpi, E., Wilson, D., Zaimi, K., and Živković, N.: Changing climate both increases and decreases European river floods, Nature, 573, 108–111, https://doi.org/10.1038/s41586-019-1495-6, 2019. a
Bosshard, T., Carambia, M., Goergen, K., Kotlarski, S., Krahe, P., Zappa, M., and Schär, C.: Quantifying uncertainty sources in an ensemble of hydrological climate-impact projections, Water Resour. Res., 49, 1523–1536, https://doi.org/10.1029/2011WR011533, 2013. a
Bronaugh, D. and Werner, A.: Zyp: Zhang + Yue-Pilon Trends Package, R package version 0.10-1, Pacific Climate Impacts Consortium, University of Victoria, Victoria, Canada, 2013. a
Bronstert, A., Bárdossy, A., Bismuth, C., Buiteveld, H., Disse, M., Engel, H., Fritsch, U., Hundecha, Y., Lammersen, R., Niehoff, D., and Ritter, N.: Multi-scale modelling of land-use change and river training effects on floods in the Rhine basin, River Res. Appl., 23, 1102–1125, https://doi.org/10.1002/rra.1036, 2007. a
Coumou, D. and Rahmstorf, S.: A decade of weather extremes, Nat. Clim. Change, 2, 491–496, https://doi.org/10.1038/nclimate1452, 2012. a
Duethmann, D. and Blöschl, G.: Why has catchment evaporation increased in the past 40 years? A data-based study in Austria, Hydrol. Earth Syst. Sci., 22, 5143–5158, https://doi.org/10.5194/hess-22-5143-2018, 2018. a
Farinotti, D., Pistocchi, A., and Huss, M.: From dwindling ice to headwater lakes: could dams replace glaciers in the European Alps?, Environ. Res. Lett., 11, 054 022, https://doi.org/10.1088/1748-9326/11/5/054022, 2016. a
Frei, C. and Schär, C.: Detection Probability of Trends in Rare Events: Theory and Application to Heavy Precipitation in the Alpine Region, J. Climate, 14, 1568–1584, https://doi.org/10.1175/1520-0442(2001)014<1568:DPOTIR>2.0.CO;2, 2001. a
Frei, C., Davies, H. C., Gurtz, J., and Schär, C.: Climate dynamics and extreme precipitation and flood events in Central Europe, Integrated Assessment, 1, 281–300, https://doi.org/10.1023/A:1018983226334, 2000. a
Freudiger, D., Kohn, I., Stahl, K., and Weiler, M.: Large-scale analysis of changing frequencies of rain-on-snow events with flood-generation potential, Hydrol. Earth Syst. Sci., 18, 2695–2709, https://doi.org/10.5194/hess-18-2695-2014, 2014. a
Häkkinen, S., Rhines, P. B., and Worthen, D. L.: Atmospheric Blocking and Atlantic Multidecadal Ocean Variability, Science, 334, 655–659, https://doi.org/10.1126/science.1205683, 2011. a, b, c
Hanson, R. T., Dettinger, M. D., and Newhouse, M. W.: Relations between climatic variability and hydrologic time series from four alluvial basins across the southwestern United States, Hydrogeol. J., 14, 1122–1146, https://doi.org/10.1007/s10040-006-0067-7, 2006. a
Held, I. M. and Soden, B. J.: Water Vapor Feedback and Global Warming, Annu. Rev. Energ. Env., 25, 441–475, https://doi.org/10.1146/annurev.energy.25.1.441, 2000. a, b
Huang, N. E., Shen, Z., Long, S. R., Wu, M. C., Shih, H. H., Zheng, Q., Yen, N.-C., Tung, C. C., and Liu, H. H.: The Empirical Mode Decomposition and the Hilbert Spectrum for Nonlinear and Non-Stationary Time Series Analysis, P. Roy. Soc. A-Math. Phy., 454, 903–995, https://doi.org/10.1098/rspa.1998.0193, 1998. a
Huang, N. E., Shen, Z., and Long, S. R.: A NEW VIEW OF NONLINEAR WATER WAVES: The Hilbert Spectrum, Annu. Rev. Fluid Mech., 31, 417–457, https://doi.org/10.1146/annurev.fluid.31.1.417, 1999. a
Huntington, T. G.: Evidence for intensification of the global water cycle: Review and synthesis, J. Hydrol., 319, 83–95, https://doi.org/10.1016/j.jhydrol.2005.07.003, 2006. a, b
Hyndman, R. J. and Fan, Y.: Sample Quantiles in Statistical Packages, Am. Stat., 50, 361–365, https://doi.org/10.2307/2684934, 1996. a
Kendall, M.: Rank correlation methods, 4 edn., Griffin, Charles, London, 1975. a, b
Kerr, R. A.: A North Atlantic Climate Pacemaker for the Centuries, Science, 288, 1984–1985, https://doi.org/10.1126/science.288.5473.1984, 2000. a, b, c
Kormann, C., Francke, T., Renner, M., and Bronstert, A.: Attribution of high resolution streamflow trends in Western Austria – an approach based on climate and discharge station data, Hydrol. Earth Syst. Sci., 19, 1225–1245, https://doi.org/10.5194/hess-19-1225-2015, 2015. a, b, c
Kreyling, J. and Henry, H. A. L.: Vanishing winters in Germany: soil frost dynamics and snow cover trends, and ecological implications, Clim. Res., 46, 269–276, https://doi.org/10.3354/cr00996, 2011. a
Labat, D., Goddéris, Y., Probst, J. L., and Guyot, J. L.: Evidence for global runoff increase related to climate warming, Adv. Water Resour., 27, 631–642, https://doi.org/10.1016/j.advwatres.2004.02.020, 2004. a, b
Laternser, M. and Schneebeli, M.: Long- term snow climate trends of the Swiss Alps (1931–99), Int. J. Climatol., 23, 733–750, https://doi.org/10.1002/joc.912, 2003. a, b, c, d
Lavers, D., Prudhomme, C., and Hannah, D. M.: European precipitation connections with large-scale mean sea-level pressure (MSLP) fields, Hydrolog. Sci. J., 58, 310–327, https://doi.org/10.1080/02626667.2012.754545, 2013. a
Lehmann, J., Coumou, D., and Frieler, K.: Increased record-breaking precipitation events under global warming, Climatic Change, 132, 501–515, https://doi.org/10.1007/s10584-015-1434-y, 2015. a, b, c
Luukko, P. J. J., Helske, J., and Räsänen, E.: Introducing libeemd: a program package for performing the ensemble empirical mode decomposition, Computation. Stat., 31, 545–557, https://doi.org/10.1007/s00180-015-0603-9, 2016. a, b, c
Maniak, U.: Einführung Hydrologie und Wasserwirtschaft, in: Hydrologie und Wasserwirtschaft: Eine Einführung für Ingenieure, edited by: Maniak, U., Springer Berlin Heidelberg, Berlin, Heidelberg, https://doi.org/10.1007/978-3-662-49087-7_1, 1–19, 2016. a
Mann, H. B.: Nonparametric Tests Against Trend, Econometrica, 13, 245–259, https://doi.org/10.2307/1907187, 1945. a
Marty, C.: Regime shift of snow days in Switzerland, Geophys. Res. Lett., 35, L12501, https://doi.org/10.1029/2008GL033998, 2008. a, b
Marty, C., Schlögl, S., Bavay, M., and Lehning, M.: How much can we save? Impact of different emission scenarios on future snow cover in the Alps, The Cryosphere, 11, 517–529, https://doi.org/10.5194/tc-11-517-2017, 2017. a
Meile, T., Boillat, J.-L., and Schleiss, A. J.: Hydropeaking indicators for characterization of the Upper-Rhone River in Switzerland, Aquat. Sci., 73, 171–182, https://doi.org/10.1007/s00027-010-0154-7, 2011. a, b, c, d
Merz, R. and Blöschl, G.: A process typology of regional floods, Water Resour. Res., 39, 1340, https://doi.org/10.1029/2002WR001952, 2003. a
Moberg, A., Jones, P. D., Lister, D., Walther, A., Brunet, M., Jacobeit, J., Alexander, L. V., Della‐Marta, P. M., Luterbacher, J., Yiou, P., Chen, D., Tank, A. M. G. K., Saladié, O., Sigró, J., Aguilar, E., Alexandersson, H., Almarza, C., Auer, I., Barriendos, M., Begert, M., Bergström, H., Böhm, R., Butler, C. J., Caesar, J., Drebs, A., Founda, D., Gerstengarbe, F.-W., Micela, G., Maugeri, M., Österle, H., Pandzic, K., Petrakis, M., Srnec, L., Tolasz, R., Tuomenvirta, H., Werner, P. C., Linderholm, H., Philipp, A., Wanner, H., and Xoplaki, E.: Indices for daily temperature and precipitation extremes in Europe analyzed for the period 1901–2000, J. Geophys. Res.-Atmos., 111, D22106, https://doi.org/10.1029/2006JD007103, 2006. a
Mueller, E. N. and Pfister, A.: Increasing occurrence of high-intensity rainstorm events relevant for the generation of soil erosion in a temperate lowland region in Central Europe, J. Hydrol., 411, 266–278, https://doi.org/10.1016/j.jhydrol.2011.10.005, 2011. a
Murawski, A., Vorogushyn, S., Bürger, G., Gerlitz, L., and Merz, B.: Do Changing Weather Types Explain Observed Climatic Trends in the Rhine Basin? An Analysis of Within- and Between-Type Changes, J. Geophys. Res.-Atmos., 123, 1562–1584, https://doi.org/10.1002/2017JD026654, 2018. a
Musselman, K. N., Clark, M. P., Liu, C., Ikeda, K., and Rasmussen, R.: Slower snowmelt in a warmer world, Nat. Clim. Change, 7, 214–219, https://doi.org/10.1038/nclimate3225, 2017. a, b
Norris, J. R. and Wild, M.: Trends in aerosol radiative effects over Europe inferred from observed cloud cover, solar “dimming,” and solar “brightening”, J. Geophys. Res.-Atmos., 112, D08214, https://doi.org/10.1029/2006JD007794, 2007. a, b
Pardé, M.: Fleuves et rivières, Armand Colin, Paris, 1933. a
Parker, D., Folland, C., Scaife, A., Knight, J., Colman, A., Baines, P., and Dong, B.: Decadal to multidecadal variability and the climate change background, J. Geophys. Res.-Atmos., 112, D18115, https://doi.org/10.1029/2007JD008411, 2007. a, b
Pavan, V., Tibaldi, S., and Branković, Č.: Seasonal prediction of blocking frequency: Results from winter ensemble experiments, Q. J. Roy. Meteor. Soc., 126, 2125–2142, https://doi.org/10.1002/qj.49712656708, 2000. a, b
Peings, Y. and Magnusdottir, G.: Forcing of the wintertime atmospheric circulation by the multidecadal fluctuations of the North Atlantic ocean, Environ. Res. Lett., 9, 034018, https://doi.org/10.1088/1748-9326/9/3/034018, 2014. a, b, c, d
Pfister, C., Weingartner, R., and Luterbacher, J.: Hydrological winter droughts over the last 450 years in the Upper Rhine basin: a methodological approach, Hydrolog. Sci. J., 51, 966–985, https://doi.org/10.1623/hysj.51.5.966, 2006. a, b
Pérez Ciria, T., Labat, D., and Chiogna, G.: Detection and interpretation of recent and historical streamflow alterations caused by river damming and hydropower production in the Adige and Inn river basins using continuous, discrete and multiresolution wavelet analysis, J. Hydrol., 578, 124021, https://doi.org/10.1016/j.jhydrol.2019.124021, 2019. a
R Core Team: R: A Language and Environment for Statistical Computing, R Foundation for Statistical Computing, Vienna, Austria, 2018. a, b
Rössler, O., Froidevaux, P., Börst, U., Rickli, R., Martius, O., and Weingartner, R.: Retrospective analysis of a nonforecasted rain-on-snow flood in the Alps – a matter of model limitations or unpredictable nature?, Hydrol. Earth Syst. Sci., 18, 2265–2285, https://doi.org/10.5194/hess-18-2265-2014, 2014. a
Ruckstuhl, C. and Norris, J. R.: How do aerosol histories affect solar “dimming” and “brightening” over Europe?: IPCC-AR4 models versus observations, J. Geophys. Res.-Atmos., 114, D00D04, https://doi.org/10.1029/2008JD011066, 2009. a
Ruckstuhl, C., Philipona, R., Behrens, K., Coen, M. C., Dürr, B., Heimo, A., Mätzler, C., Nyeki, S., Ohmura, A., Vuilleumier, L., Weller, M., Wehrli, C., and Zelenka, A.: Aerosol and cloud effects on solar brightening and the recent rapid warming, Geophys. Res. Lett., 35, L12708, https://doi.org/10.1029/2008GL034228, 2008. a
Schädler, B. and Weingartner, R.: Impact of Climate Change on Water Resources in the Alpine Regions of Switzerland, in: The Handbook of Environmental Chemistry, Alpine Waters, edited by: Bundi, U., Springer Berlin Heidelberg, Berlin, Heidelberg, https://doi.org/10.1007/978-3-540-88275-6_3, 59–69, 2010. a, b
Scheifinger, H., Menzel, A., Koch, E., and Peter, C.: Trends of spring time frost events and phenological dates in Central Europe, Theor. Appl. Climatol., 74, 41–51, https://doi.org/10.1007/s00704-002-0704-6, 2003. a
Scherrer, S. C., Appenzeller, C., and Laternser, M.: Trends in Swiss Alpine Snow Days: The Role of Local- and Large-Scale Climate Variability, Geophys. Res. Lett., 31, L13215, https://doi.org/10.1029/2004GL020255, 2004. a, b
Scherrer, S. C., Croci-Maspoli, M., Schwierz, C., and Appenzeller, C.: Two-Dimensional indices of atmospheric blocking and their statistical relationship with winter climate patterns in the Euro-Atlantic region, Int. J. Climatol., 26, 233–249, https://doi.org/10.1002/joc.1250, 2006. a, b
Scherrer, S. C., Begert, M., Croci-Maspoli, M., and Appenzeller, C.: Long series of Swiss seasonal precipitation: regionalization, trends and influence of large-scale flow, Int. J. Climatol., 36, 3673–3689, https://doi.org/10.1002/joc.4584, 2016. a, b, c, d, e
Schmidli, J. and Frei, C.: Trends of heavy precipitation and wet and dry spells in Switzerland during the 20th century, Int. J. Climatol., 25, 753–771, https://doi.org/10.1002/joc.1179, 2005. a
Schmocker-Fackel, P. and Naef, F.: Changes in flood frequencies in Switzerland since 1500, Hydrol. Earth Syst. Sci., 14, 1581–1594, https://doi.org/10.5194/hess-14-1581-2010, 2010. a
Schönwiese, C.-D. and Rapp, J.: Climate trend atlas of Europe based on observations 1891–1990, Springer Science & Business Media, Dordrecht, Netherlands, https://doi.org/10.1007/978-94-015-8818-8, 1997. a
Sen, P. K.: Estimates of the Regression Coefficient Based on Kendall's Tau, J. Am. Stat. Assoc., 63, 1379–1389, https://doi.org/10.1080/01621459.1968.10480934, 1968. a, b
Simpkins, G.: Snow-related water woes, Nat. Clim. Change, 8, 945, https://doi.org/10.1038/s41558-018-0330-7, 2018. a
Sodemann, H. and Zubler, E.: Seasonal and inter-annual variability of the moisture sources for Alpine precipitation during 1995–2002, Int. J. Climatol., 30, 947–961, https://doi.org/10.1002/joc.1932, 2010. a, b
Speich, M. J. R., Bernhard, L., Teuling, A. J., and Zappa, M.: Application of bivariate mapping for hydrological classification and analysis of temporal change and scale effects in Switzerland, J. Hydrol., 523, 804–821, https://doi.org/10.1016/j.jhydrol.2015.01.086, 2015. a
Spreafico, M. and Weingartner, R.: The Hydrology of Switzerland – Selected aspects and results, Water Series no. 7, FOWG Reports, Berne, 2005. a
Stahl, K., Weiler, M., Kohn, I., Freudiger, D., Seibert, J., Vis, M., Gerlinger, K., and Böhm, M.: The snow and glacier melt components of streamflow of the river Rhine and its tributaries considering the influence of climate change, Synthesis Report I-25, International Commission for the Hydrology of the Rhine Basin, Lelystad, Netherlands, 2016. a, b, c, d, e
Stein, O.: The variability of Atlantic–European blocking as derived from long SLP time series, Tellus A, 52, 225–236, https://doi.org/10.3402/tellusa.v52i3.12263, 2000. a
Stewart, I. T.: Changes in snowpack and snowmelt runoff for key mountain regions, Hydrol. Process., 23, 78–94, https://doi.org/10.1002/hyp.7128, 2009. a, b
Sui, J. and Koehler, G.: Rain-on-snow induced flood events in Southern Germany, J. Hydrol., 252, 205–220, https://doi.org/10.1016/S0022-1694(01)00460-7, 2001. a
Theil, H.: A Rank-Invariant Method of Linear and Polynomial Regression Analysis, P. Natl. Acad. Sci. USA, 53, Part I: 386–392, Part II: 521–525, Part III: 1397–1412, 1950. a, b
Torres, M. E., Colominas, M. A., Schlotthauer, G., and Flandrin, P.: A complete ensemble empirical mode decomposition with adaptive noise, in: 2011 IEEE International Conference on Acoustics, Speech and Signal Processing (ICASSP), IEEE, Prague, Czech Republic, https://doi.org/10.1109/ICASSP.2011.5947265, 4144–4147, 2011. a
Truffer, B., Markard, J., Bratrich, C., and Wehrli, B.: Green Electricity from Alpine Hydropower Plants, Mt. Res. Dev., 21, 19–25, https://doi.org/10.1659/0276-4741(2001)021[0019:GEFAHP]2.0.CO;2, 2001. a
Verbunt, M., Zwaaftink, M. G., and Gurtz, J.: The hydrologic impact of land cover changes and hydropower stations in the Alpine Rhine basin, Ecol. Model., 187, 71–84, https://doi.org/10.1016/j.ecolmodel.2005.01.027, 2005. a
Vincent, L. A., Zhang, X., Bonsal, B. R., and Hogg, W. D.: Homogenization of Daily Temperatures over Canada, J. Climate, 15, 1322–1334, https://doi.org/10.1175/1520-0442(2002)015<1322:HODTOC>2.0.CO;2, 2002. a
Wagner, B., Hauer, C., Schoder, A., and Habersack, H.: A review of hydropower in Austria: Past, present and future development, Renewable and Sustainable Energy Reviews, 50, 304–314, https://doi.org/10.1016/j.rser.2015.04.169, 2015. a
Weingartner, R. and Aschwanden, H.: Abflussregimes als Grundlage zur Abschätzung von Mittelwerten des Abflusses, Hydrologischer Atlas der Schweiz – Tafel 5.2, Federal Office for the Environment, Bern, 1992. a
Wesemann, J., Holzmann, H., Schulz, K., and Herrnegger, M.: Behandlung künstlicher Speicher und Überleitungen in der alpinen Niederschlags-Abfluss-Vorhersage, Österreichische Wasser- und Abfallwirtschaft, 70, 485–496, https://doi.org/10.1007/s00506-018-0501-9, 2018. a
Wetter, O., Pfister, C., Weingartner, R., Luterbacher, J., Reist, T., and Trösch, J.: The Largest Floods in the High Rhine Basin since 1268 Assessed from Documentary and Instrumental Evidence, Hydrolog. Sci. J., 56, 733–758, https://doi.org/10.1080/02626667.2011.583613, 2011. a, b, c, d
Weusthoff, T.: Weather Type Classification at MeteoSwiss – Introduction of new automatic classification schemes, Arbeitsbericht MeteoSchweiz Nr. 235, Bundesamt für Meteorologie und Klimatologie MeteoSchweiz, Zurich, 2011. a
Wielke, L.-M., Haimberger, L., and Hantel, M.: Snow cover duration in Switzerland compared to Austria, Meteorol. Z., 13, 13–17, https://doi.org/10.1127/0941-2948/2004/0013-0013, 2004. a
Wild, M., Ohmura, A., and Makowski, K.: Impact of global dimming and brightening on global warming, Geophys. Res. Lett., 34, L04702, https://doi.org/10.1029/2006GL028031, 2007. a
Wildenhahn, E. and Klaholz, U.: Große Speicherseen Im Einzugsgebiet Des Rheins, Tech. Rep. Bericht Nr. II-10, Internationale Kommission fur die Hydrologie des Rheingebietes (KHR), Koblenz, 1996. a, b, c, d
Wildi, W., Dominik, J., Loizeau, J.-L., Thomas, R. L., Favarger, P.-Y., Haller, L., Perroud, A., and Peytremann, C.: River, reservoir and lake sediment contamination by heavy metals D downstream from urban areas of Switzerland, Lakes & Reservoirs: Science, Policy and Management for Sustainable Use, 9, 75–87, https://doi.org/10.1111/j.1440-1770.2004.00236.x, 2004. a
Wirth, E.: Die Großschiffahrtsstraße Rhein-Main-Donau. Ein Weg Für Südosteuropa? – Kritische Bestandsaufnahme und Zukunftsperspektiven, Mitteilungen der Fränkischen Geographischen Gesellschaft, Erlangen-Nürnberg, Bd. 42, 33–102, 1995. a
Word Commision on Dams: Dams and Development: A New Framework for Decision-Making: The Report of the World Commission on Dams, Earthscan, London, 2000. a
Wu, X., Che, T., Li, X., Wang, N., and Yang, X.: Slower Snowmelt in Spring Along With Climate Warming Across the Northern Hemisphere, Geophys. Res. Lett., 45, 12331–12339, https://doi.org/10.1029/2018GL079511, 2018. a
Wu, Z. and Huang, N. E.: Ensemble Empirical Mode Decomposition: A Noise-Assisted Data Analysis Method, Advances in Adaptive Data Analysis, 01, 1–41, https://doi.org/10.1142/S1793536909000047, 2009. a
Wu, Z., Huang, N. E., Long, S. R., and Peng, C.-K.: On the Trend, Detrending, and Variability of Nonlinear and Nonstationary Time Series, P. Natl. Acad. Sci. USA, 104, 14889–14894, https://doi.org/10.1073/pnas.0701020104, 2007. a
Zubler, E. M., Scherrer, S. C., Croci-Maspoli, M., Liniger, M. A., and Appenzeller, C.: Key climate indices in Switzerland; expected changes in a future climate, Climatic Change, 123, 255–271, https://doi.org/10.1007/s10584-013-1041-8, 2014. a