the Creative Commons Attribution 4.0 License.
the Creative Commons Attribution 4.0 License.
Real-time monitoring of nitrate in soils as a key for optimization of agricultural productivity and prevention of groundwater pollution
Shlomi Arnon
Ofer Dahan
Lack of real-time information on nutrient availability in cultivated soils inherently leads to excess application of fertilizers in agriculture. As a result, nitrate, which is a soluble, stable, and mobile component of fertilizers, leaches below the root zone through the unsaturated zone and eventually pollutes the groundwater and other related water resources. Rising nitrate concentration in aquifers is recognized as a worldwide environmental problem that contributes to water scarcity. The development of technologies for continuous in situ measurement of nitrate concentration in soils is essential for optimizing fertilizer application and preventing water resource pollution by nitrate. Here we present a conceptual approach for a monitoring system that enables in situ and continuous measurement of nitrate concentration in soil. The monitoring system is based on absorbance spectroscopy techniques for direct determination of nitrate concentration in soil porewater without pretreatment, such as filtration, dilution, or reagent supplementation. A new analytical procedure was developed to improve measurement accuracy while eliminating the typical measurement interference caused by soil dissolved organic carbon. The analytical procedure was tested at four field sites over 2 years and proved to be an effective tool for nitrate analysis when directly applied on untreated soil solution samples. A soil nitrate-monitoring apparatus, combining specially designed optical flow cells with soil porewater-sampling units, enabled, for the first time, real-time continuous measurement of nitrate concentration in soils. Real-time, high-resolution measurement of nitrate concentration in the soil has revealed the complex variations in soil nitrate concentrations in response to fertigation pattern. Such data are crucial for optimizing fertilizer application and reducing pollution potential of groundwater.
- Article
(3842 KB) - Full-text XML
- Companion paper
-
Supplement
(792 KB) - BibTeX
- EndNote
Pollution of water resources by nitrate from agricultural sources is one of the main reasons for freshwater disqualification worldwide (Jin et al., 2012; Liu et al., 2005; Orban et al., 2010; Thorburn et al., 2003). In many cases, severe eutrophication of surface water bodies, including streams, lakes, and even coastal waters of seas and oceans has been attributed to the inflow of nitrate contaminated groundwater and stream water (Anderson et al., 2002). As such, the US Environmental Protection Agency (EPA) regards nitrate contamination in groundwater as an event requiring immediate action, while a Nitrates Directive was established by the European Community to prevent water pollution by nitrate (EPA US and Office of Water, 1994; European Community, 1991).
Water resource pollution by nitrate seems to be primarily caused by excessive application of agricultural fertilizers (Kourakos et al., 2012; Liao et al., 2012; Osenbruck et al., 2006). Nitrate concentration in soil porewater often changes rapidly, on a timescale of hours to days (Dahan et al., 2014). These rapid changes are dictated by irrigation–precipitation pattern, fertilization and cultivation methods, plant uptake, and natural soil biochemical processes (Oren et al., 2004; Thompson et al., 2007; Vázquez et al., 2006). Šimůnek and Hopmans (2009) suggested a passive nitrate uptake model with threshold root-zone nitrate concentration (Cmax), which, in combination with the root water uptake, sets the maximum nitrate uptake from the root zone. The model imposed a jump in nitrate deep leaching when concentration exceeded the threshold values (C > Cmax). As such, monitoring of nitrate concentration can serve as controller increasing N use efficiency and decreasing groundwater contaminations. Furthermore, when the plants growing phases along with its temporal variations in nutrient requirements are taken into consideration, nitrate monitoring in the soil can help timing fertilizer application and increase agricultural productivity (Tedone et al., 2018). Values of Cmax for different crops were reported between 88 to 200 ppm nitrate (Kurtzman et al., 2013; Levy et al., 2017). Soil nitrate concentration is commonly estimated through measurement of soil porewater samples, which are obtained using a suction cup or soil sample extraction (Abdulkareem et al., 2015; Dahan et al., 2009; Evett and Parkin, 2005). The porewater sample or soil sample extract is then analyzed for nitrate by standard laboratory procedures, or with special kits for quick analysis in the field (Liebig et al., 1996). These measurement methods are not in line with the timescale of N-fertilizer mobilization, consumption, and transformation dynamics in agricultural soils. Since there are as of yet no “on-shelf” technical means for real-time continuous measurement of nutrient concentrations in the soil, farmers tend to apply an excess amount of N-fertilizer as common practice. The direct outcome is a continuous flux of nitrate from the root zone, through the unsaturated zone, to the groundwater (Burow et al., 2010; Fisher and Healy, 2008; Kurtzman et al., 2013; Oren et al., 2004; Scanlon et al., 2007).
Two main technologies are currently available for real-time analysis of nitrate in water samples: optical dip probes, based on ultraviolet (UV) absorbance spectroscopy, and ion-selective electrode (ISE) dip probes (De Marco et al., 2007). Nitrate analysis in aqueous solution by UV absorbance spectroscopy is a common technique that has been implemented for several decades (Meyerstein and Treinin, 1961; Moorcroft, 2001), based on the principle that when electromagnetic energy, such as UV light, propagates through aqueous samples, a fraction of that energy can be transferred to some of the dissolved ions through the transition of electrons between different energy levels (West, 2014). The intensity of the energy absorbed by the ions is proportional to their concentration in the solution. UV absorbance spectroscopy has been found highly effective for measuring nitrate concentration directly from aqueous samples, as it does not require any addition of reagents, thus making it less time-consuming and more reliable than other spectral techniques (Ferree and Shannon, 2001). This method is considered more stable and robust than the ISE probe method because UV absorbance spectroscopy is not sensitive to changes in temperature, pH, or salinity of the water solution (Edwards et al., 2001). Tuli et al. (2009) demonstrated the ability to measure nitrate at 235 nm. Moo et al. (2016) showed nitrate measurements at 302 nm, and Michael et al. (2017) measured nitrate concentration at 200 and 220 nm.
The simplicity and robustness of UV absorbance spectroscopy for measuring nitrate concentration in water samples make it potentially applicable for in situ application in soil. Tuli et al. (2009) suggested an in situ method for monitoring nitrate in saturated media by measuring the nitrate concentration in a solution held inside a stainless-steel porous cup. In their proposed method, the porous cup is filled with deionized water and then lowered into a reservoir containing nitrate solution. An optical dip probe is then placed inside the porous cup to perform the spectral analyses. The suggested setup has shown great potential for in situ monitoring of nitrate concentration. However, the time required for the solution inside the porous cup to reach equilibrium with the surrounding solution (up to 60 h) negates the use of this apparatus for measuring nitrate concentration at high time resolution when placed in the soil. Moreover, the equilibrium times are expected to become significantly longer when the measurement is conducted in unsaturated soils (Riga and Charpentier, 1998).
Although UV absorbance spectroscopy for nitrate analysis is very common, it has some limitations when applied to natural water samples, which contain a variable concentration of dissolved organic carbon (DOC). Shaw et al. (2014) studied the possible interference in UV absorbance spectroscopy for nitrate analyses by the different ions that are commonly found in water samples that originated from natural sources. They showed that the main interference is caused by DOC, with the nitrate absorbance signal being completely quenched above 50 ppm DOC (Shaw et al., 2014). As a result, absorption-signal masking by DOC, which is commonly found in agricultural soils, can prevent the use of UV absorbance-based methods for nitrate evaluation in water samples (Fig. 1).
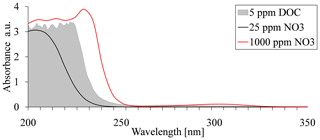
Figure 1Absorption spectra of nitrate at concentrations of 25, 1000, and 5 ppm dissolved organic carbon (DOC).
The interference caused by DOC can often be reduced by applying the dual-wavelength correction scheme (Armstrong, 1963). In this method, nitrate concentration is estimated through the value of twice the absorbance at 275 nm deducted from the absorbance value at 220 nm. However, this method can only be used when the absorbance at 275 nm is lower than 5 % of the absorbance measured at 220 nm. An additional method that accounts for DOC interference is second-derivative spectroscopy, wherein the second derivative of the absorption spectrum is plotted with respect to the wavelength (Causse et al., 2017; Crumpton et al., 1992; Ferree and Shannon, 2001; Simal et al., 1985). When this technique is applied on aqueous nitrate solution, an absorbance peak will emerge at ∼224 nm, enabling a quantitative measurement of the nitrate in the examined solution. Ferree and Shannon (2001) reported the ability to measure nitrate concentration in water samples from wetlands and treated wastewater which contained up to 77 ppm DOC. However, a primary condition of the analyses is that the samples be at a concentration lower than 44.3 ppm nitrate. Yet, since nitrate concentration in cultivated and fertilized soils may vary through a wide range of tens to thousands of parts per million, following fertilization cycles, a dilution of the samples would be necessary to measure nitrate by the second-derivative spectroscopy technique, thus making this method less applicable for continuous in situ measurement.
In this paper, we present a novel technique for measuring nitrate concentration in soil porewater based on UV absorbance spectroscopy technique. The method is based on scanning the absorption spectrum and identifying an optimal wavelength for repetitive measurements of nitrate concentration in the soil porewater that overcomes the typical analytical interference by DOC. The analytical procedure is combined with a novel approach that enables continuous measurement of the UV absorption spectrum in an optical flow cell connected to a porous interface to enable continuous in situ monitoring of nitrate concentration in the soil. We believe that the proposed monitoring technology could open a new avenue for precision fertilization and optimization of crop production while reducing the risks associated with nitrate pollution of groundwater.
In order to develop an analytical procedure capable of carrying continuous measurement of nitrate concentration in the soil, porewater samples were collected from various typical cultivated sites and analyzed for their chemical composition and spectral characteristics. The analytical spectral procedure developed on the basis of the spectral characteristics of the soil porewater was then tested in soil columns, which were equipped with a specially designed optical setup for continuous measurement of nitrate concentration in the soil.
2.1 Selected agricultural sites
Four typical agricultural fields were selected: (i) organic and (ii) conventional greenhouses for vegetable crops, (iii) an open crop field with rotating seasonal crops, and (iv) a citrus orchard. All sites were located in the agricultural area of Israel's coastal plain. The porewater samples were collected by vadose zone-monitoring systems (VMSs) that have been operating at these sites continuously for more than 9 years. The VMS includes a porewater sampler that is permanently installed in the unsaturated zone under the cultivated fields. Accordingly, variations in the chemical characteristics of the soil porewater may be detected continuously at the same spot in the subsurface over many years. A detailed description of the VMSs at each site can be found in Dahan et al. (2014), Turkeltaub et al. (2014, 2015, 2016), and in Sect. S1 in the Supplement. Additional information on the research site locations, crop types, and irrigation and fertilization regimes can be found in Sect. S2. The porewater-sampling ports at each site are distributed at various depths, ranging from 1 to 21 m (Table S3 in the Supplement). In this study, soil water samples were collected in four sampling campaigns: (i) August 2015, (ii) September 2015, (iii) January 2017, and (iv) February 2017. Note that the VMS sampling ports are permanently installed at the site and therefore enable repeat sampling from the exact locations for many years, while the agricultural activity on land surface remains undisturbed.
2.2 Spectral and chemical characteristics of the soil porewater
Samples were analyzed for nitrate concentration with a Dionex ICS-5000 ion chromatograph and the Analytik Jena TOC, DOC, TN, DN multi N/C 2100S TOC/TN analyzer for DOC and total nitrogen (TN) concentration. Spectral analyses of the samples were performed with a Thermo Scientific Evolution 201/220 Desktop laboratory spectrophotometer. Double-distilled water (DDW) was used as a reference/baseline for the analyses. The samples were held in a standard 5 mL quartz cuvette with an optical path of 10 mm and were scanned over a broad spectrum of 190–1000 nm. The analytical procedure for UV spectral analysis of nitrate concentration in porewater samples usually requires colloid filtration, dilution, and sometimes spiking with the target constituent or supplementary reagents. However, since the purpose of this study was to develop an analytical protocol that enables in situ measurement of nitrate concentration through spectral analyses of the soil porewater, the samples were analyzed without any additional preparation (i.e., dilution or filtration). The porewater samples were then examined for absorption at a few specific wavelengths that have been previously suggested for direct nitrate measurement in untreated soil water: (i) 302 nm (Moo et al., 2016), (ii) 235 nm (Shaw et al., 2014; Tuli et al., 2009), and (iii) where the absorbance used for calibration equals the absorbance at 220 nm after subtraction of twice the absorbance at 275 nm (hereafter 220/275 nm) (Armstrong, 1963). An additional measurement at 220 nm, as suggested by Michael et al. (2017), was also carried out, but there was no significant difference in absorption characteristics compared to the 220/275 nm method. Therefore, the data from this test are not presented.
In order to validate our suggested method's resistance to measurement drift, which may occur in response to changes in the solution chemical matrix, a second spectral analysis was performed. This analysis was carried out in a Spark 10M multimode microplate reader spectrophotometer at wavelengths of 200 to 1000 nm. Absorbance was defined by the Lambert–Beer equation (Eq. 1):
where I is the light intensity after passing through the examined solution, and I0 is the light intensity after passing through a reference sample (blank).
The accuracy of the suggested method was determined by fitting a linear regression model to the absorbance and the nitrate concentration (measured by ion chromatography) data. The model fit, coefficient of determination (R2), and its corresponding P values were obtained using the fitlm function in MATLAB.
2.3 Optical flow cell
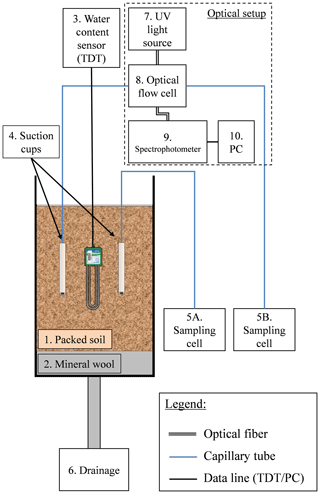
In order to enable continuous in situ measurement of nitrate concentration in the soil, a monitoring concept was developed in which the spectral absorption of the soil porewater is measured in an optical flow cell (Fig. 2) (a patent is pending on the methodology described in this article). The optical setup consists of a UV lamp and UV–VIS spectrometer, designed to measure transmission and absorbance between 190 and 850 nm. A special feature in SpectroWiz (StellarNet software) was used to prevent possible measurement drift. A StellarNet SL3 deuterium light source was used as continuous-wave UV light source. The spectrometer and UV lamp were connected to a flow cell using optical fibers and collimating lenses. The optical flow cell was connected at one end to a customized suction cup, which enables continuous sampling of the soil porewater under a low flow rate (a few milliliters per hour). At the other end, the flow cell was connected to a sampling cell. Charging the sampling cell with low pressure draws a continuous flux of porewater from the soil through the optical flow cell to the sampling cell. The system is designed to function under a small dead volume (4–6 mL) by reducing the suction cup's inner volume and using small-diameter tubing (inner diameter 1.6 mm). Porewater solution that flows from the suction cup through the optical cell accumulates in the sampling cell, and it is used later to determine nitrate concentration by standard laboratory procedure.
2.4 Column experiment
The monitoring system for continuous measurement of nitrate concentration in the soil was tested in two sets of column experiments. The first was conducted to test the ability of the optical setup to measure nitrate concentration in the soil under controlled conditions. In this experiment, 18 L of clean (low organic matter) sandy loam was packed in a 50 cm long column. Two identical customized suction cups and one water-content sensor (TDT, Acclima) were placed at a depth of 22 cm in the soil column. One of the suction cups was connected to the flow cell and the other directly to its sampling cell (Fig. 2). The column was irrigated daily with 1 L of fresh tap water (equivalent to about 14 mm), where one of the irrigation cycles was enriched with 1000 ppm nitrate (as KNO3). In this experiment, nitrate concentration of the soil porewater was measured continuously using absorption spectroscopy technique in the optical flow cell and compared to the concentration in the porewater samples that were accumulated in the two sampling cells and in the column drainage. The second experiment was conducted using agricultural soils in three soil columns packed with fine sandy loam, dark clay soil, and fine sandy loam mixed with 10 % commercial compost, respectively. The experiments were conducted in all three columns under similar irrigation, fertilization, and monitoring setups (Table S4). The irrigation regimes in the column experiments were designed to ensure unsaturated conditions, similar to agricultural soils (immediate drainage and no flooding conditions). Water content in the column experiment varied between 15 % and 16.5 % in the sandy loam, which is equivalent to a water potential of 850 to 950 mbar. To ensure continuous water flux from the soil to the optical sensor a pressure between 600 and 800 mbar (absolute values) was applied to the suction cups.
3.1 UV absorption characteristics of agricultural soil porewater
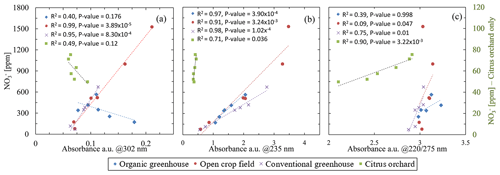
Nitrate concentration plotted against absorbance at the selected wavelengths for all the porewater samples had shown inconsistencies between the nitrate concentration to the absorbance values (Fig. 3). At 302 nm (Fig. 3a), a reasonable correlation between the absorbance and nitrate concentration was obtained for the open crop field (R2=0.99) and conventional greenhouse (R2=0.95), whereas poor correlations were obtained for the other two fields: organic greenhouse (R2=0.39) and citrus orchard (R2=0.49). Partial improvement was achieved at 235 nm (Fig. 3b), with R2 values of 0.97, 0.91, and 0.98 for the organic greenhouse, open field crop, and conventional greenhouse, respectively. However, a poor correlation was obtained for water samples from the orchard (R2=0.71). Moreover, a close inspection of the absorbance of water samples from the open crop field showed a strong shift in absorbance values at nitrate concentrations exceeding 1000 ppm. This phenomenon was observed in repeat analyses of additional water samples (Fig. S5 in the Supplement). With the 220/275 nm method (Fig. 3c), poor correlations between absorbance values and nitrate concentration were observed at most sites (R2=0.39, 0.09, 0.75 for organic greenhouse, open field crop, and conventional greenhouse, respectively); however, for the orchard site, the correlation was improved compared to the other methods, reaching R2=0.9. Note that one of the porewater samples from the organic greenhouse (from 13.3 m below the surface with 171.36 ppm nitrate) did not meet the requirements of the 220/275 nm absorbance ratio and is therefore not included in Fig. 3c. None of the methods based on specified wavelengths seemed robust enough for direct analysis of untreated soil water obtained from various fields with different soils.
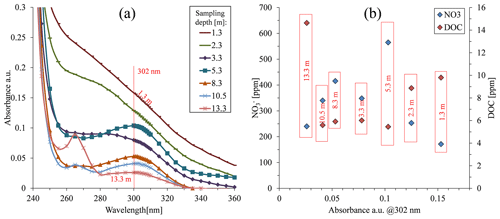
Figure 4Absorbance in the 300 nm region of samples taken under the organic greenhouse. Both nitrate and dissolved organic carbon (DOC) concentration values are presented.
Several reasons could account for the observed mismatch between absorbance values and nitrate concentration at the various sites. At short wavelengths, such as 220 nm, absorbance is typically very high (Fig. 1); therefore, the measurement is very sensitive to low nitrate concentrations. At high nitrate concentrations, however, absorption saturation occurs, and the absorbance is no longer indicative of increased concentrations. Accordingly, in agricultural soils, where nitrate concentration may vary from tens to thousands of parts per million, as demonstrated in the water samples obtained from sites used for this research, the shorter wavelengths are less applicable for direct analysis (i.e., the samples need to be diluted). This explains the low correlation found for 220/275 nm and the low sensitivity to high concentration at 235 nm. The 300 nm region is typically characterized by low absorption rates for nitrate (Fig. 1), thereby reducing the potential for signal saturation. As such, it is more ideal for measuring nitrate at high concentrations. Our measurements at 302 nm were insensitive to the low nitrate concentrations (49.7–75.4 ppm) at the orchard site. Furthermore, significant mismatch was observed for the organic greenhouse, even though the nitrate concentration at this site was relatively high, ranging from 171 to 520 ppm (Fig. 3a). This mismatch was expressed as increasing absorption values, regardless of the nitrate concentration. The main reason for the increased absorption could be attributed to signal masking as a result of the presence of DOC, which is commonly found in agricultural soil porewater (Jones and Willett, 2006; Kalbitz et al., 2000). Nevertheless, a closer look at the absorption pattern showed that different sites may have appropriate calibration curve for nitrate concentrations at different wavelengths, which implies the possibility of adopting a unique wavelength for each site.
3.2 DOC and nitrate concentrations impact on the UV absorption spectra
The absorption spectrum of porewater samples obtained from various depths under the organic greenhouse showed the highest absorbance for samples from cells located at a depth of 1.3 m (Fig. 4a), despite having the lowest nitrate concentration in the sample batch (Fig. 4b). Although the high absorbance values might be attributed to the presence of DOC, these water samples did not have the highest DOC concentration. On the other hand, the water sample at a depth of 13.3 m, which did have the highest DOC concentration of the current batch (Fig. 4b), showed the lowest absorbance value (Fig. 4a). This peculiar behavior was found consistently in subsequent sampling campaigns (Fig. S6). Thus, it could be deduced then that the DOC absorption characteristics are not impacted solely by the overall DOC concentration but also influenced by the specific characteristics of the various organic compounds composing the overall DOC. Accordingly, different soils at different sites could potentially be characterized by different organic compounds in their specific DOC “soup”, which could therefore have its own typical absorption spectrum.
3.3 Nitrate vs. DOC UV absorption spectrum
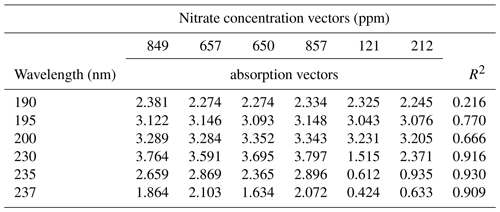
The attempts to measure nitrate concentration at a specific wavelength (302, 235, and 220/275 nm) showed inconsistencies between the absorption characteristics and nitrate concentration, attributed to absorption saturation and the presence of DOC. However, DOC concentration was not always correlated with absorbance. As a result, a new approach was adopted to better assess the effect of nitrate and DOC concentrations on the absorption spectra. In this approach, the coefficient of determination (R2) between a set of nitrate/DOC concentration vectors and their corresponding absorbance vectors was calculated for the entire spectrum (Fig. 5, Table 1 and Fig. S7).
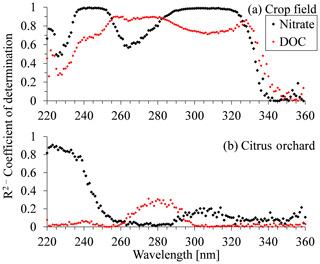
Figure 5Coefficient of determination (R2) for nitrate and dissolved organic carbon (DOC) plotted against wavelength in the UV region for (a) crop field station and (b) citrus orchard.
Table 1Nitrate concentration vectors obtained by ion chromatography for the conventional greenhouse porewater samples, along with their corresponding absorption vectors at different wavelengths. The R2 column shows the correlation strength between the two vectors.
The coefficients of determination (R2) vs. wavelength, for both nitrate and DOC concentrations, are shown in Fig. 5a for the open crop field and Fig. 5b for the citrus orchard samples. The R2 values for nitrate in the crop field show an increase at 225 nm, reaching a plateau (R2 > 0.99) between 235 and 250 nm. They then decreased to a minimum value of 0.57 at 264 nm and rose again to a second, high-value plateau (> 0.9) between 290 and 320 nm. However, the R2 pattern for the DOC concentrations in the crop field differed from that for nitrate. In some sections (220–235 and 225–360 nm), the trends were positively correlated, whereas in others (250–325 nm) they were either negatively correlated or not correlated (Fig. 5a). Unlike the case of the open crop field, where two distinct high R2 value plateaus were visible, analysis of the citrus orchard R2 values showed only a narrow area with high R2 values between the wavelengths of 220 and 230 nm. Here, the high R2 values (> 0.8) were only reached at 220–235 nm, whereas for the rest of the spectrum, the correlation was very poor (< 0.4) (Fig. 5b). On the other hand, at this site, R2 values for the DOC remained very low (< 0.3) over the entire spectrum. A similar R2 vs. wavelength analysis was carried out for the other fields, and the trend in R2 for each field seemed to show unique behavior (Fig. S7).
The wavelength regions with high R2 values showed a higher correlation between the targeted chemical concentration (nitrate or DOC) and absorbance values. Thus, absorbance values in those areas had greater potential for measuring the targeted constituent's concentration. For example, in the open crop field, the areas of the two distinct high R2 plateaus (Fig. 5a) hold high potential for measuring nitrate concentrations in soil porewater collected from that field. Between the two sections of high correlation to nitrate concentration, at around 267 nm, absorbance values were correlated with DOC concentration, meaning that this area of the spectrum is expected to have a high DOC masking effect. These characteristics were unique to the open crop field. In the citrus orchard (Fig. 5b), for example, the data series associated with nitrate concentration presents high potential for estimating nitrate concentration at wavelengths between 220 and 230 nm. Moreover, the low R2 values for the DOC curve suggest that the DOC chemical composition in the citrus orchard porewater samples does not have much effect on the UV absorbance absorption spectrum over a greater section of the spectrum.
Although DOC concentration in porewater at the different sites in this study was rather similar (Table S8), the DOC impact on the absorption spectrum was very different at each site. It was assumed that these variations are due to the composition of the various organic molecules making up the DOC in the different fields. DOC is a general term folding thousands of different organic molecules within it. Accordingly, the specific chemical composition of the DOC may be affected by various factors, such as differences in soil type, crop type, differences in the applied fertilizers, and local climate (Kalbitz et al., 2000). For example, regardless of the proximity between DOC concentration values in the citrus orchard and the open crop field, the presence of DOC did not cause similar interference in the spectral analyses of the porewater at those sites. In fact, in the crop field, where DOC concentrations were slightly lower than those in the citrus orchard, the presence of DOC had a much higher impact on the absorption spectra of the porewater samples taken from the crop field compared to samples taken from the citrus orchard. Nevertheless, every field site can be characterized by wavelength regions that have greater potential for measuring nitrate concentration and those that might be more susceptible to interference by DOC or other constituents in the solution (Fig. 5). This phenomenon opens the way to a new concept, whereby a wavelength can be determined that is uniquely suited to measuring nitrate in each field while avoiding possible interference related to other natural water constituents, such as DOC.
3.4 Determination of optimal wavelength for site-specific calibration
The observed variations in the coefficients of determination for nitrate and DOC concentrations at different wavelengths (Fig. 5) led to the adoption of an innovative strategy for analyzing nitrate concentration by absorbance spectroscopy. The new analytical procedure was designed to overcome the measurement inconsistencies associated with estimations of nitrate concentration using absorbance spectroscopy methods with a fixed wavelength (Fig. 3).
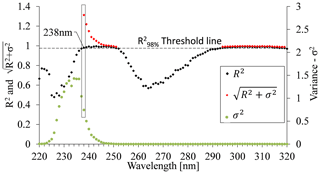
Figure 6Relationship between coefficient of determination (R2), variance (σ2), and the UV spectrum for the open crop field. was calculated only for values where R2 exceeded the set threshold at . The maximum calculated value was determined as the optimal wavelength and was set to 238 nm.
A two-step procedure was used to determine the optimal wavelength for nitrate concentration measurements in soil porewater samples at specific sites. The first step consisted of creating a set of candidate wavelengths that show high potential for measuring nitrate concentration. This was achieved by plotting the R2 values of absorbance intensities of known nitrate concentrations vs. wavelength (Fig. 5). The candidate wavelengths were then screened to satisfy two requirements:
-
R2 test. An initial screening of the wavelength range was performed by setting a threshold value that is within 98 % of the maximum R2 value in the tested batch (Fig. 6). Wavelengths showing R2 values below that threshold were rejected, while the wavelengths displaying R2 values above the threshold were used to form a set of candidate wavelengths for a site-specific calibration equation. In this example, , so the R2 threshold value was set to .
-
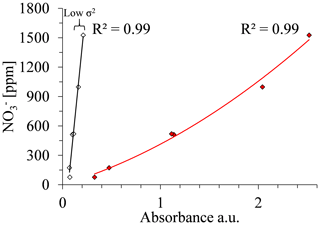
Variance (σ2). A high R2 can be achieved also with wavelengths in which the sensitivity of the absorbance to nitrate concentration is extremely high and therefore where absorbance could not be used for estimating nitrate concentrations. Therefore, the variance of the absorbance values that correlate well with the range of nitrate concentrations uses a second criterion for choosing the best wavelength. Calibration curves can be calculated for various of wavelengths, for example where 238 and 300 nm showed high R2 values of 0.9792 and 0.9869, respectively, at the open crop field. Either wavelength could be used to set up a suitable calibration curve. However, the calibration curve related to 300 nm had a much steeper slope, indicating lower variance (σ2) compared to the calibration curve related to 238 nm (Fig. 7). The slope of the calibration curve, which reflects σ2, has a high impact on the sensitivity of the analyses to measurement errors. Accordingly, with a sharp slope calibration curve (low σ2), as in the case of 300 nm for the crop field, a slight variation in absorbance will result in greater errors in the estimated nitrate concentration values. Hence, the strength of the calibration curve cannot be estimated solely by the coefficient of determination (R2). Accordingly, the second parameter, variance (σ2), which is derived from the measured absorbance values, was used to quantify the sensitivity of a calibration curve to measurement errors.
The site-specific optimal wavelength was determined by combining the R2 and σ2 values for each wavelength; the square root of the sum of the two criteria's values (Eq. 2) was calculated for those wavelengths that have R2 values above the set threshold. Figure 6 shows that, at a wavelength of 238 nm, a peak point on the curve emerges, indicating that it is the most suitable wavelength for spectral analysis of nitrate concentration for this particular site (open crop field).
Application of this procedure to determine the optimal wavelengths for all fields used in this study enabled establishing a specific calibration curve for each site. Plotting the nitrate concentration as obtained by ion chromatograph against absorbance values at multiple wavelengths (organic greenhouse at 231 nm and R2=0.99, open crop field at 238 nm and R2=0.99, conventional greenhouse at 234 nm and R2=0.99, and citrus orchard at 223 nm and R2=0.98) showed very high correlations. In this case, each of the fields was successfully assigned to an individual calibration curve, generated by the most suitable wavelength for that specific site. Figure 6 shows information for the open crop field station; further information for the two-step procedure's application to the other field stations is presented in Sect. S9. Note that the poorly correlated data in Fig. 3 and the highly correlated data in Fig. 8 were produced from same absorption spectra of the same water samples. The only difference is that the data in Fig. 3 were created by application of fixed wavelengths of known methods, whereas the highly correlated data in Fig. 8 were created on the basis of an analytical procedure that searches for a site-specific optimal wavelength.
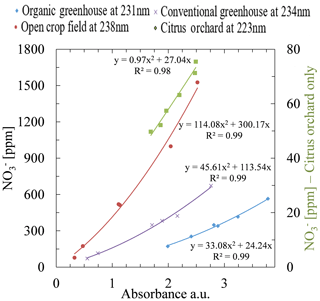
Figure 8Calibration equations for the four study sites. As can be seen on the chart legend, each of the sites has its own unique optimal wavelength for estimating nitrate concentration. Note that the right ordinate shows a lower concentration range than the left ordinate and is associated only with the citrus orchard.
3.5 Stability and consistency of the specific calibration curves
The robustness of the suggested monitoring concept is primarily dependent on the temporal stability of the site-specific calibration equations, as it gained from the previously described calibration procedure. There are two main reasons for calibration drift: (i) drift in the optical apparatus due to light source degradation or intensity fluctuations and (ii) changes in the porewater solution matrix chemical composition, which might lead to absorbance-signal masking or other interference patterns in the spectral analyses.
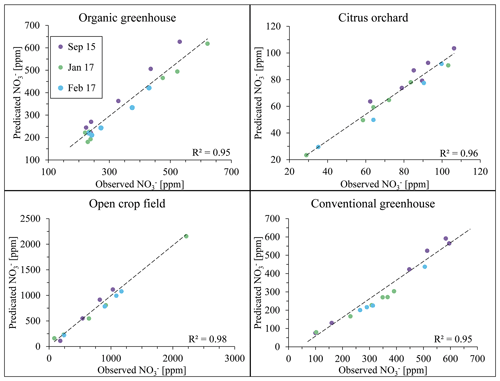
Figure 9Evaluation of nitrate concentration at the four study sites between the years 2015 and 2017. Note that data points from August 2015 are not plotted as they were used to form the calibration equation for the analyses of the remaining sampling campaigns.
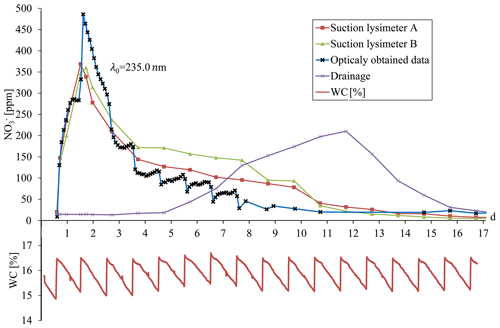
Figure 10Breakthrough curves plotted for physically sampled solution and calculated nitrate concentration, as obtained automatically by the optical setup. The bottom curve shows the soil water content as obtained by the water-content sensor (TDT).
The data collected from August 2015 samples were used as input for the site-specific algorithm. As the algorithm output, a calibration equation at different wavelengths was obtained for each field site. The stability of these calibration equations had been tested on samples from additional sampling campaigns later in 2015, and in 2017, where results from standard laboratory analyses (observed nitrate concentrations) were plotted in reference to the result of the calibration equation, obtained in August 2015 (predicted nitrate concentration). Figure 9 shows a good correlation between the predicted and observed values with general R2 > 0.9. It is therefore suggested that the initial calibration equation which was determined by the spectral analytical procedure 2 years earlier (2015) was still valid for nitrate concentration estimations, regardless of the changes in agricultural activity between growing seasons. It may therefore be deduced that establishment of a site-specific calibration curve that is based on the adoption of a site-specific wavelength can be used for long-duration monitoring of nitrate in soil porewater, as long as stability of the UV light source is maintained.
3.6 Real-time monitoring of nitrate concentration in the soil
3.6.1 Nitrate breakthrough curve during the controlled column experiment
Nitrate breakthrough in the soil column was established by continuous measurement of nitrate concentration, as obtained from the UV absorption spectrum in the optical flow cell, and by daily measurement of nitrate concentration (by a laboratory method) in water samples obtained from two suction lysimeters and from the column drainage (Fig. 10). Daily sampling of the suction lysimeters and drainage exhibited the expected breakthrough curve, with the drainage showing delayed breakthrough and a lower maximum concentration compared to the two lysimeters, which were practically identical. Ultimately, the continuous measurement of nitrate concentration in the soil provided outstanding explicit data on the complexity of its temporal variation in the soil. In general, the nitrate breakthrough curve generated by the optical nitrate sensor was fairly consistent, showing similar concentration and variation trends. Moreover, the data obtained by the optical nitrate sensor revealed the real complexities of the changes in nitrate concentration with respect to the dynamics of water percolation in response to the irrigation events. The breakthrough curve obtained by the optical nitrate sensor exhibited a higher maximum concentration than those obtained by the lysimeters. This, however, might be attributed to the obvious fact that the samples being collected by the lysimeter represent daily averaged values of a cumulative sample, while the optical nitrate sensor provides continuous online measurements of the soil porewater. Sampling the soil solution as a cumulative sample, as with the suction lysimeters, will miss the temporal fluctuations in soil nitrate concentration. A closer look at the breakthrough curve structure for the high-time-resolution measurement of nitrate concentration in the soil porewater reveals rapid changes in nitrate concentration following irrigation and soil-wetting cycles (Fig. 10). The relationship between the irrigation events and the rapid changes in nitrate concentration is directly attributed to mechanisms controlling water flow and solute transport within the porous domain. Obviously, this phenomenon is of great importance and relevance to the soil and hydrological sciences, as regards solute and contaminant transport. However, further analysis of this phenomenon was beyond the scope of the presented study.
3.6.2 Real-time measurement of nitrate concentration in agricultural soil
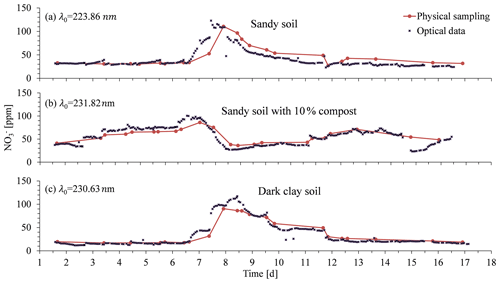
Following the controlled column experiment, which proved the ability to carry out continuous spectral absorption measurements in soil porewater, and following the analytical procedure that enabled developing a site-specific calibration curve, a column experiment was performed with agricultural soils. These experiments were conducted under conditions similar to those of the controlled experiment, where irrigation was applied on a daily basis with one of the cycles being replaced with a nitrate-enriched solution (1000 ppm). The breakthrough curves of nitrate obtained by the optical nitrate sensor were then compared with those from water samples obtained by suction lysimeters (Fig. 11). The breakthrough curves obtained from the column experiments in all soils were based on the spectral analytical procedure for determining optimal wavelengths for measuring nitrate concentration. Accordingly, the optimal wavelengths were set to 231.82 nm for the dark clay soil, 230.66 nm for the sandy loam, and 223.86 nm for the sandy loam mixed with compost.
Outstanding similarity was found between the optical sensor-calculated data and the nitrate concentrations from the laboratory analysis. Accordingly, the correlation coefficients for the regression of the physically vs. optically obtained data showed high values: , , , and . Moreover, the automatically obtained high-resolution real-time measurements provided the first observation of rapid changes in nitrate concentration correlated to the irrigation patterns. Such observations could not have been made in the agricultural environment, where soil solution sampling can be practically performed only at much longer time intervals, or even under the exclusive conditions available for a controlled scientific experiment, where only daily sampling of the suction lysimeter is possible.
The lack of online in situ instrumentation for monitoring nutrient availability in the soil often results in excess application of nitrogen fertilizers. Consequent nitrate leaching from the root zone to the deep unsaturated zone can result in severe groundwater pollution. Our newly developed optical sensor enables, for the first time, continuous in situ measurement of nitrate concentrations in the soil. The new monitoring concept was based on the application of UV absorption techniques to porewater obtained continuously from the soil. To avoid spectral interference by DOC, an analytical procedure that scans the entire UV spectrum was used to determine a site-specific optimal wavelength and calibration equation for nitrate concentration measurements. Applying the analytical procedure to the soil porewater from the different agricultural sites revealed that each site can be characterized by a single optimal wavelength that enables repetitive nitrate measurements. The spectral analysis procedure was then combined with an optical flow cell to form an optical soil nitrate sensor (patent pending). The sensor was tested in a series of column experiments showing outstanding ability to measure nitrate concentration accurately at high time resolution in all tested soils. This work provides a scientific basis for the development of a nitrate-monitoring system that would be capable of providing high-resolution in situ nitrate concentration measurements in soils while minimizing possible interference from the presence of DOC. We believe that this innovative technique, along with future developments and upscaling, will be able to deliver online data for farmers on the availability of soil nitrate for their growing crops. By having real-time information on nitrate concentrations in the soil, farmers can accurately adjust fertilizer-application regimes according to the plants' needs in their concurrent growing phase to maximize yields and reduce the potential for groundwater contamination by nitrate.
Since there is a considerably large quantity of data in the form of CSV files, XLSX files, and MATLAB programming codes in this work, we find it inconvenient to edit it in a publishable way. However, we would be happy to share our data upon request. For further information, please contact eladyes@post.bgu.ac.il.
The supplement related to this article is available online at: https://doi.org/10.5194/hess-23-3997-2019-supplement.
EY conducted the experiment, analyzed the data, and wrote most of this paper. SA assisted in developing the monitoring system at the electrical and optical engineering levels. OD helped with designing the experimental concept and setup while having a major contribution to the writing process and data analyses.
The authors declare that they have no conflict of interest.
The authors wish to express their great appreciation to Michael Kugel, who stood behind each and every technical aspect of the project while providing outstanding solutions for laboratory and field experiments.
This research has been supported by KAMIN Framework (Israeli Innovation Authority, grant no. 63347), Marcus Foundation, and the Israeli Ministry of Agriculture and Rural Development (Eugene Kandel Knowledge Centers) as part of the program “The Root of the Matter: The root zone knowledge center for leveraging modern agriculture”.
This paper was edited by Nunzio Romano and reviewed by two anonymous referees.
Abdulkareem, J., Abdulkadir, A., and Abdu, N.: A Review of Different Types of Lysimeter Used in Solute Transport Studies, Int. J. Plant Soil Sci., 8, 1–14, https://doi.org/10.9734/IJPSS/2015/18098, 2015.
Anderson, D. M., Glibert, P. M., and Burkholder, J. M.: Harmful algal blooms and eutrophication: Nutrient sources, composition, and consequences, Estuaries, 25, 704–726, https://doi.org/10.1007/BF02804901, 2002.
Armstrong, F. A. J.: Determination of Nitrate in Water by Ultraviolet Spectrophotometry, Anal. Chem., 35, 1292–1294, https://doi.org/10.1021/ac60202a036, 1963.
Burow, K. R., Nolan, B. T., Rupert, M. G., and Dubrovsky, N. M.: Nitrate in groundwater of the United States, 1991–2003, Environ. Sci. Technol., 44, 4988–4997, https://doi.org/10.1021/es100546y, 2010.
Causse, J., Thomas, O., Jung, A. V., and Thomas, M. F.: Direct DOC and nitrate determination in water using dual pathlength and second derivative UV spectrophotometry, Water Res., 108, 312–319, https://doi.org/10.1016/j.watres.2016.11.010, 2017.
Crumpton, W. G., Isenhart, T. M., and Mitchell, P. D.: Nitrate and organic N analyses with second-derivative spectroscopy, Limnol. Oceanogr., 37, 907–913, https://doi.org/10.4319/lo.1992.37.4.0907, 1992.
Dahan, O., Talby, R., Yechieli, Y., Adar, E., Lazarovitch, N., and Enzel, Y.: In Situ Monitoring of Water Percolation and Solute Transport Using a Vadose Zone Monitoring System, Vadose Zone J., 8, 916, https://doi.org/10.2136/vzj2008.0134, 2009.
Dahan, O., Babad, A., Lazarovitch, N., Russak, E. E., and Kurtzman, D.: Nitrate leaching from intensive organic farms to groundwater, Hydrol. Earth Syst. Sci., 18, 333–341, https://doi.org/10.5194/hess-18-333-2014, 2014.
De Marco, R., Clarke, G., and Pejcic, B.: Ion-selective electrode potentiometry in environmental analysis, Electroanalysis, 19, 1987–2001, https://doi.org/10.1002/elan.200703916, 2007.
Edwards, A. C., Hooda, P. S., and Cook, Y.: Determination of nitrate in water containing dissolved organic carbon by ultraviolet spectroscopy, Int. J. Environ. Anal. Chem., 80, 49–59, https://doi.org/10.1080/03067310108044385, 2001.
EPA US and Office of Water: Is Your Drinking Water Safe?, Publ. number (810 F94002), available at: https://nepis.epa.gov/Exe/ZyPURL.cgi?Dockey=20001R5L.txt (last access: 12 February 2019), 1994.
European Community: Council directive concerning the protection of water against pollution caused by nitrates from agricultural sources, Off. J. Eur. Community (91/676/EEC), Legis. 1375/1-375/8, 1991.
Evett, S. R. and Parkin, G. W.: Advances in Soil Water Content Sensing, Vadose Zone J., 4, 986, https://doi.org/10.2136/vzj2005.0099, 2005.
Ferree, M. A. and Shannon, R. D.: Evaluation of a second derivative UV/visible spectroscopy technique for nitrate and total nitrogen analysis of wastewater samples, Water Res., 35, 327–332, https://doi.org/10.1016/S0043-1354(00)00222-0, 2001.
Fisher, L. H. and Healy, R. W.: Water Movement within the Unsaturated Zone in Four Agricultural Areas of the United States, J. Environ. Qual., 37, 1051, https://doi.org/10.2134/jeq2006.0561, 2008.
Jin, Z., Pan, Z., Jin, M., Li, F., Wan, Y., and Gu, B.: Determination of nitrate contamination sources using isotopic and chemical indicators in an agricultural region in China, Agric. Ecosyst. Environ., 155, 78–86, https://doi.org/10.1016/j.agee.2012.03.017, 2012.
Jones, D. L. and Willett, V. B.: Experimental evaluation of methods to quantify dissolved organic nitrogen (DON) and dissolved organic carbon (DOC) in soil, Soil Biol. Biochem., 38, 991–999, https://doi.org/10.1016/j.soilbio.2005.08.012, 2006.
Kalbitz, K., Solinger, S., Park, J. H., Michalzik, B., and Matzner, E.: Controls on the dynamics of dissolved organic matter in soils: a review, Soil Sci., 165, 277–304, https://doi.org/10.1097/00010694-200004000-00001, 2000.
Kourakos, G., Klein, F., Cortis, A., and Harter, T.: A groundwater nonpoint source pollution modeling framework to evaluate long-term dynamics of pollutant exceedance probabilities in wells and other discharge locations, Water Resour. Res., 48, W00L13, https://doi.org/10.1029/2011WR010813, 2012.
Kurtzman, D., Shapira, R. H., Bar-Tal, A., Fine, P., and Russo, D.: Nitrate fluxes to groundwater under citrus orchards in a Mediterranean climate: Observations, calibrated models, simulations and agro-hydrological conclusions, J. Contam. Hydrol., 151, 93–104, https://doi.org/10.1016/j.jconhyd.2013.05.004, 2013.
Levy, Y., Shapira, R. H., Chefetz, B., and Kurtzman, D.: Modeling nitrate from land surface to wells' perforations under agricultural land: Success, failure, and future scenarios in a Mediterranean case study, Hydrol. Earth Syst. Sci., 21, 3811–3825, https://doi.org/10.5194/hess-21-3811-2017, 2017.
Liao, L., Green, C. T., Bekins, B. A., and Böhlke, J. K.: Factors controlling nitrate fluxes in groundwater in agricultural areas, Water Resour. Res., 48, W00L09, https://doi.org/10.1029/2011WR011008, 2012.
Liebig, M. A., Doran, J. W., and Gardner, J. C.: Evaluation of a field test kit for measuring selected soil quality indicators, Agron. J., 88, 683–686, https://doi.org/10.2134/agronj1996.00021962008800040030x, 1996.
Liu, G. D., Wu, W. L., and Zhang, J.: Regional differentiation of non-point source pollution of agriculture-derived nitrate nitrogen in groundwater in northern China, Agric. Ecosyst. Environ., 107, 211–220, https://doi.org/10.1016/j.agee.2004.11.010, 2005.
Meyerstein, D. and Treinin, A.: Absorption spectra of in solution, Trans. Faraday Soc., 57, 2104–2112, https://doi.org/10.1039/TF9615702104, 1961.
Michael, J. P., Koshnick, N. C., Justin Stewart, W., and John Paul, S.: Measurement of nitrate-nitrogen concentration in soil based on absorption spectroscopy, Patent No. US 9.255, 878 B2, USA, 2017.
Moo, Y. C., Matjafri, M. Z., Lim, H. S., and Tan, C. H.: New development of optical fibre sensor for determination of nitrate and nitrite in water, Optik (Stuttg), 127, 1312–1319, https://doi.org/10.1016/j.ijleo.2015.09.072, 2016.
Moorcroft, M.: Detection and determination of nitrate and nitrite: a review, Talanta, 54, 785–803, https://doi.org/10.1016/S0039-9140(01)00323-X, 2001.
Orban, P., Brouyère, S., Batlle-Aguilar, J., Couturier, J., Goderniaux, P., Leroy, M., Maloszewski, P., and Dassargues, A.: Regional transport modelling for nitrate trend assessment and forecasting in a chalk aquifer, J. Contam. Hydrol., 118, 79–93, https://doi.org/10.1016/j.jconhyd.2010.08.008, 2010.
Oren, O., Yechieli, Y., Böhlke, J. K., and Dody, A.: Contamination of groundwater under cultivated fields in an arid environment, central Arava Valley, Israel, J. Hydrol., 290, 312–328, https://doi.org/10.1016/j.jhydrol.2003.12.016, 2004.
Osenbruck, K., Fiedler, S., Knoller, K., Weise, S. M., Sultenfuss, J., Oster, H., and Strauch, G.: Timescales and development of groundwater pollution by nitrate in drinking water wells of the Jahna-Aue, Saxonia, Germany, Water Resour. Res., 42, W12416, https://doi.org/10.1029/2006wr004977, 2006.
Riga, P. and Charpentier, S.: Ionic-Equilibrium Time inside Ceramic Cups in Unsaturated Porous Media, Soil Sci. Soc. Am. J., 62, 574–579, https://doi.org/10.2136/sssaj1998.03615995006200030003x, 1998.
Scanlon, B. R., Jolly, I., Sophocleous, M., and Zhang, L.: Global impacts of conversions from natural to agricultural ecosystems on water resources: Quantity versus quality, Water Resour. Res., 43, W03437, https://doi.org/10.1029/2006WR005486, 2007.
Shaw, B. D., Wei, J. B., Tuli, A., Campbell, J., Hopmans, J. W., Buelow, M., Parikh, S. J., and Dabach, S.: Analysis of Ion and Dissolved Organic Carbon Interference on Soil Solution Nitrate Concentration Measurements Using Ultraviolet Absorption Spectroscopy, Vadose Zone J., 13, https://doi.org/10.2136/vzj2014.06.0071, 2014.
Simal, J., Lage, M. A., and Iglesias, I.: Second derivative ultraviolet spectroscopy and sulfamic acid method for determination of nitrates in water, J. Assoc. Off. Anal. Chem., 68, 962–964, 1985.
Šimůnek, J. and Hopmans, J. W.: Modeling compensated root water and nutrient uptake, Ecol. Modell., 220, 505–521, https://doi.org/10.1016/j.ecolmodel.2008.11.004, 2009.
Tedone, L., Ali, S. A., and De Mastro, G.: Optimization of Nitrogen in Durum Wheat in the Mediterranean Climate: The Agronomical Aspect and Greenhouse Gas (GHG) Emissions, Nitrogen in Agriculture – Updates, 131–162, IntechOpen, London, 2018.
Thompson, R. B., Martínez-Gaitan, C., Gallardo, M., Giménez, C., and Fernández, M. D.: Identification of irrigation and N management practices that contribute to nitrate leaching loss from an intensive vegetable production system by use of a comprehensive survey, Agric. Water Manag., 89, 261–274, https://doi.org/10.1016/j.agwat.2007.01.013, 2007.
Thorburn, P. J., Biggs, J. S., Weier, K. L., and Keating, B. A.: Nitrate in groundwaters of intensive agricultural areas in coastal Northeastern Australia, Agric. Ecosyst. Environ., 94, 49–58, https://doi.org/10.1016/S0167-8809(02)00018-X, 2003.
Tuli, A., Wei, J. B., Shaw, B. D., and Hopmans, J. W.: In Situ Monitoring of Soil Solution Nitrate: Proof of Concept, Soil Sci. Soc. Am. J., 73, 501–509, https://doi.org/10.2136/sssaj2008.0160, 2009.
Turkeltaub, T., Dahan, O., and Kurtzman, D.: Investigation of Groundwater Recharge under Agricultural Fields Using Transient Deep Vadose Zone Data, Vadose Zone J., 13, 4, https://doi.org/10.2136/vzj2013.10.0176, 2014.
Turkeltaub, T., Kurtzman, D., Russak, E. E., and Dahan, O.: Impact of switching crop type on water and solute fluxes in deep vadose zone, Water Resour. Res., 51, 9828–9842, https://doi.org/10.1002/2015WR017612, 2015.
Turkeltaub, T., Kurtzman, D., and Dahan, O.: Real-time monitoring of nitrate transport in the deep vadose zone under a crop field – implications for groundwater protection, Hydrol. Earth Syst. Sci., 20, 3099–3108, https://doi.org/10.5194/hess-20-3099-2016, 2016.
Vázquez, N., Pardo, A., Suso, M. L., and Quemada, M.: Drainage and nitrate leaching under processing tomato growth with drip irrigation and plastic mulching, Agric. Ecosyst. Environ., 112, 313–323, https://doi.org/10.1016/j.agee.2005.07.009, 2006.
West, W.: Absorption of electromagnetic radiation, McGraw-Hill Educ., https://doi.org/10.1036/1097-8542.001600, 2014.


