the Creative Commons Attribution 4.0 License.
the Creative Commons Attribution 4.0 License.
 | 14 Aug 2019
Modeling the high-resolution dynamic exposure to flooding in a city region
Xuehong Zhu
Qiang Dai
Dawei Han
Shaonan Zhu
Shuliang Zhang
Urban flooding exposure is generally investigated with the assumption of stationary disasters and disaster-hit bodies during an event, and thus it cannot satisfy the increasingly elaborate modeling and management of urban floods. In this study, a comprehensive method was proposed to simulate dynamic exposure to urban flooding considering residents' travel behavior. First, a flood simulation was conducted using the LISFLOOD-FP model to predict the spatiotemporal distribution of flooding. Second, an agent-based model was used to simulate residents' movements during the urban flooding period. Finally, to study the evolution and patterns of urban flooding exposure, the exposure of population, roads, and buildings to urban flooding was simulated using Lishui, China, as a case study. The results showed that water depth was the major factor affecting total urban exposure in Lishui. Urban exposure to fluvial flooding was concentrated along the river, while exposure to pluvial flooding was dispersed throughout the area (independent from the river). Additionally, the population distribution on weekends was more variable than on weekdays and was more sensitive to floods. In addition, residents' response behavior (based on their subjective consciousness) may result in increased overall exposure. This study presents the first fully formulated method for dynamic urban flood exposure simulation at a high spatiotemporal resolution. The quantitative results of this study can provide fundamental information for urban flood disaster vulnerability assessment, socioeconomic loss assessment, urban disaster risk management, and emergency response plan establishment.
- Article
(10180 KB) - Full-text XML
-
Supplement
(155 KB) - BibTeX
- EndNote


Storm flooding has become increasingly frequent and severe with the intensification of global warming and the rising frequency of extreme weather events (Dankers and Feyen, 2008; Hammond et al., 2015). Urban floods have become major natural disasters in many cities around the world and have created serious threats to human life and social and economic activities (Gain et al., 2015). Effectively coping with floods and their adverse effects is an important part of disaster prevention and mitigation as well as disaster risk management (Rahman, 2014). Non-engineering measures such as exposure assessment are currently the main way of managing urban flooding risk (Chen et al., 2015). Exposure refers to the presence of people, livelihoods, environmental services and resources, and infrastructure or to the economic, social, or cultural assets in places that could be adversely affected by natural disasters (IPCC, 2012). Urban flood disasters are caused by the adverse effects of heavy rain and other factors on the city system in certain disaster-prone environments. These events consist of three parts: disaster-causing factors, disaster-prone environments, and disaster-hit bodies (Shi, 1996).
The characteristics of flood disasters and building environments and the distribution of population and socioeconomic resources are the key factors for evaluating urban flood exposure due to the dynamic evolution of urban floods and disaster-hit bodies. The methods used for evaluating exposure to urban flooding at a certain time or period vary due to changes in the disaster-hit bodies, study areas, and data acquisition methods (Röthlisberger et al., 2017). Index-based methods are commonly used for comprehensive exposure evaluation (Mahe et al., 2005; Mansur et al., 2016; Guo et al., 2014). Statistical methods based on historical disaster data are also utilized (Moel et al., 2011).
With respect to spatial considerations, the currently implemented method for estimation of disaster exposure adopts the administrative boundaries of socioeconomic data, which are organized as research units (Yin, 2009). Consequently, natural elements that have higher spatial resolutions must be compromised due to the lower spatial resolution of human elements like population (Yang et al., 2013). Therefore, a comprehensive and sophisticated geographic research unit has not been established, thus resulting in simulation results applicable only to macro-scale planning and decision making. Hence, the estimation of disaster exposure needs to incorporate greater spatial heterogeneity and resolution.
Besides enhancement of the spatial scale, dynamic temporal simulation of disaster exposure has gained increasing attention. Specifically, the dynamic evolution of disaster exposure at the macro timescale considers exposure distribution as well as its variation during different development periods (Weis et al., 2016). Therefore, this method is relatively mature and has led to abundant research results. At the micro timescale, disaster-causing factors and disaster-hit bodies represented by populations are constantly varying. On the one hand, spatiotemporal changes in disaster-causing factors (rainfall) result in corresponding dynamic changes in the characteristics (water depth and velocity) of urban flood disasters. On the other hand, daily travel activities of urban residents, such as commuting between residential and work or study areas, cause a dynamic spatiotemporal distribution of the population. At the same time, the exposure to urban flooding changes dramatically over a short period of time. To avoid or reduce disaster risks, casualties, and property losses, different individuals are likely to adopt different adaptive behaviors, such as delaying or canceling travel plans, while the government is likely to adopt organizational actions such as issuing warnings and evacuating residents (Wan and Wang, 2017; Parker et al., 1995). Thus, the dynamic simulation of exposure requires the dynamic space–time simulation of variations in the disaster, and disaster-hit bodies, as well as interactions between them.
Modeling of the spatiotemporal changes in natural disasters mainly uses the disaster system simulation method (Werren et al., 2016). A wide variety of existing hydrological or hydrodynamic models capable of simulating fluvial or pluvial flooding are available, including the Storm Water Management Model (SWMM) (Rossman, 2015), LISFLOOD (Bates and De Roo, 2000), MIKE-SHE (DHI, 2000), MIKE-11 (Havnø et al., 1995), MOUSE (Lindberg et al., 1989), HEC-RAS (Brunner, 2008), and HEC-HMS (Charley et al., 1995). Change simulations of the disaster-hit body (population) can use methods based on individual spatiotemporal data (Liang et al., 2015). Although this can acquire human positions and movement tracks, it is difficult to identify the purpose of human activities, such that human disaster response behavior cannot be accurately simulated.
Some modeling techniques, often collectively referred to as social simulation, have been successfully used to represent the behaviors of humans and organizations. These include event and fault trees, Bayesian networks, microsimulation, cellular automata, system dynamics, and agent-based models (ABMs). Research methods based on ABMs have been gradually introduced to the field of natural disaster risk assessment as these can simulate population distribution as well as interactions among the population (as the disaster victims), hazard factors, and disaster-prone environments (W. Yin et al., 2016). Current research has used the ABM to simulate human responses to disasters, which, in turn, have been used in natural disaster risk research (Johnstone, 2012; Huang et al., 2015). Nevertheless, the simulation results do not reflect the exposure characteristics of the disaster-hit bodies and their dynamic changes (Dawson et al., 2011).
Therefore, the objectives of this study were to develop a novel method using the LISFLOOD-FP model (Sect. 3.1) and an ABM (Sect. 3.2) to simulate the exposure of urban populations, roads, and buildings to flooding under varying conditions and subsequently implement the method as a pilot in a real city. Several scenarios, including diverse flooding types and various responses of residents to flooding, were considered in this regard. Additionally, dynamic features of the real world were incorporated to improve the micro exposure analysis. This method was subsequently applied to an urban area as a case study. Exposure simulation is a useful tool for estimating disaster vulnerability and assessing losses, and the quantitative results under different scenarios of this study are likely to benefit relevant government agencies in assessing risk, issuing warnings, and planning emergency responses to urban natural disasters. In particular, considering the dynamic distribution of the population under flooding, a more reasonable mitigation measure can be taken to minimize casualties.
In this study, Lishui City in Zhejiang Province, China, was considered as the study region because of the availability of the required data and flooding history. The urban district of Lishui is a largely hilly and mountainous area, and the Oujiang River traverses its southern and eastern parts. The study area is located in the central district of Lishui, covers an area of 43.4 km2, and has a large population of about 71 673 (Fig. 1). The frequencies of heavy rainstorms and persistent concentrated rainfall events rise sharply in May and June during the Meiyu flood period, which often results in flood disasters. On August 20, 2014, a heavy rainfall event lasting a few days produced a once-in-50-years flood in Lishui and caused considerable loss of property.

Figure 1Location of the study area (a) and a digital elevation model indicating the specific details of the study area (b).
The datasets used in this study included a digital elevation model; river, road, building, and population data; and observation data consisting of river discharge and water level. Travel survey data from a questionnaire (see Supplement) were used to generate daily routines. Additionally, traffic flow and water accumulation data were used for validation. Table 1 describes the sources and uses of the datasets.

The travel survey data used in this study were taken from a face-to-face questionnaire survey conducted from 8 to 14 July 2018. A total of 25 subdistricts were selected based on sample selection. According to the distribution of the subdistricts, the investigators were divided into five groups of at least four investigators per group. In each group, a senior researcher monitored the survey process, coordinated questionnaire collection, and checked the completeness and validity of the questionnaires collected. Before each interview, the investigators explained the purpose of the investigation and confidentiality principles. The respondents in the study participated voluntarily, and were allotted enough time to answer the questionnaire. In total, 623 questionnaires were distributed, 589 were collected, and 500 valid responses were selected after excluding incomplete questionnaires (the response rate was 80.3 %). The distribution of the social characteristics of the respondents coincided with the actual population distribution in the study area.
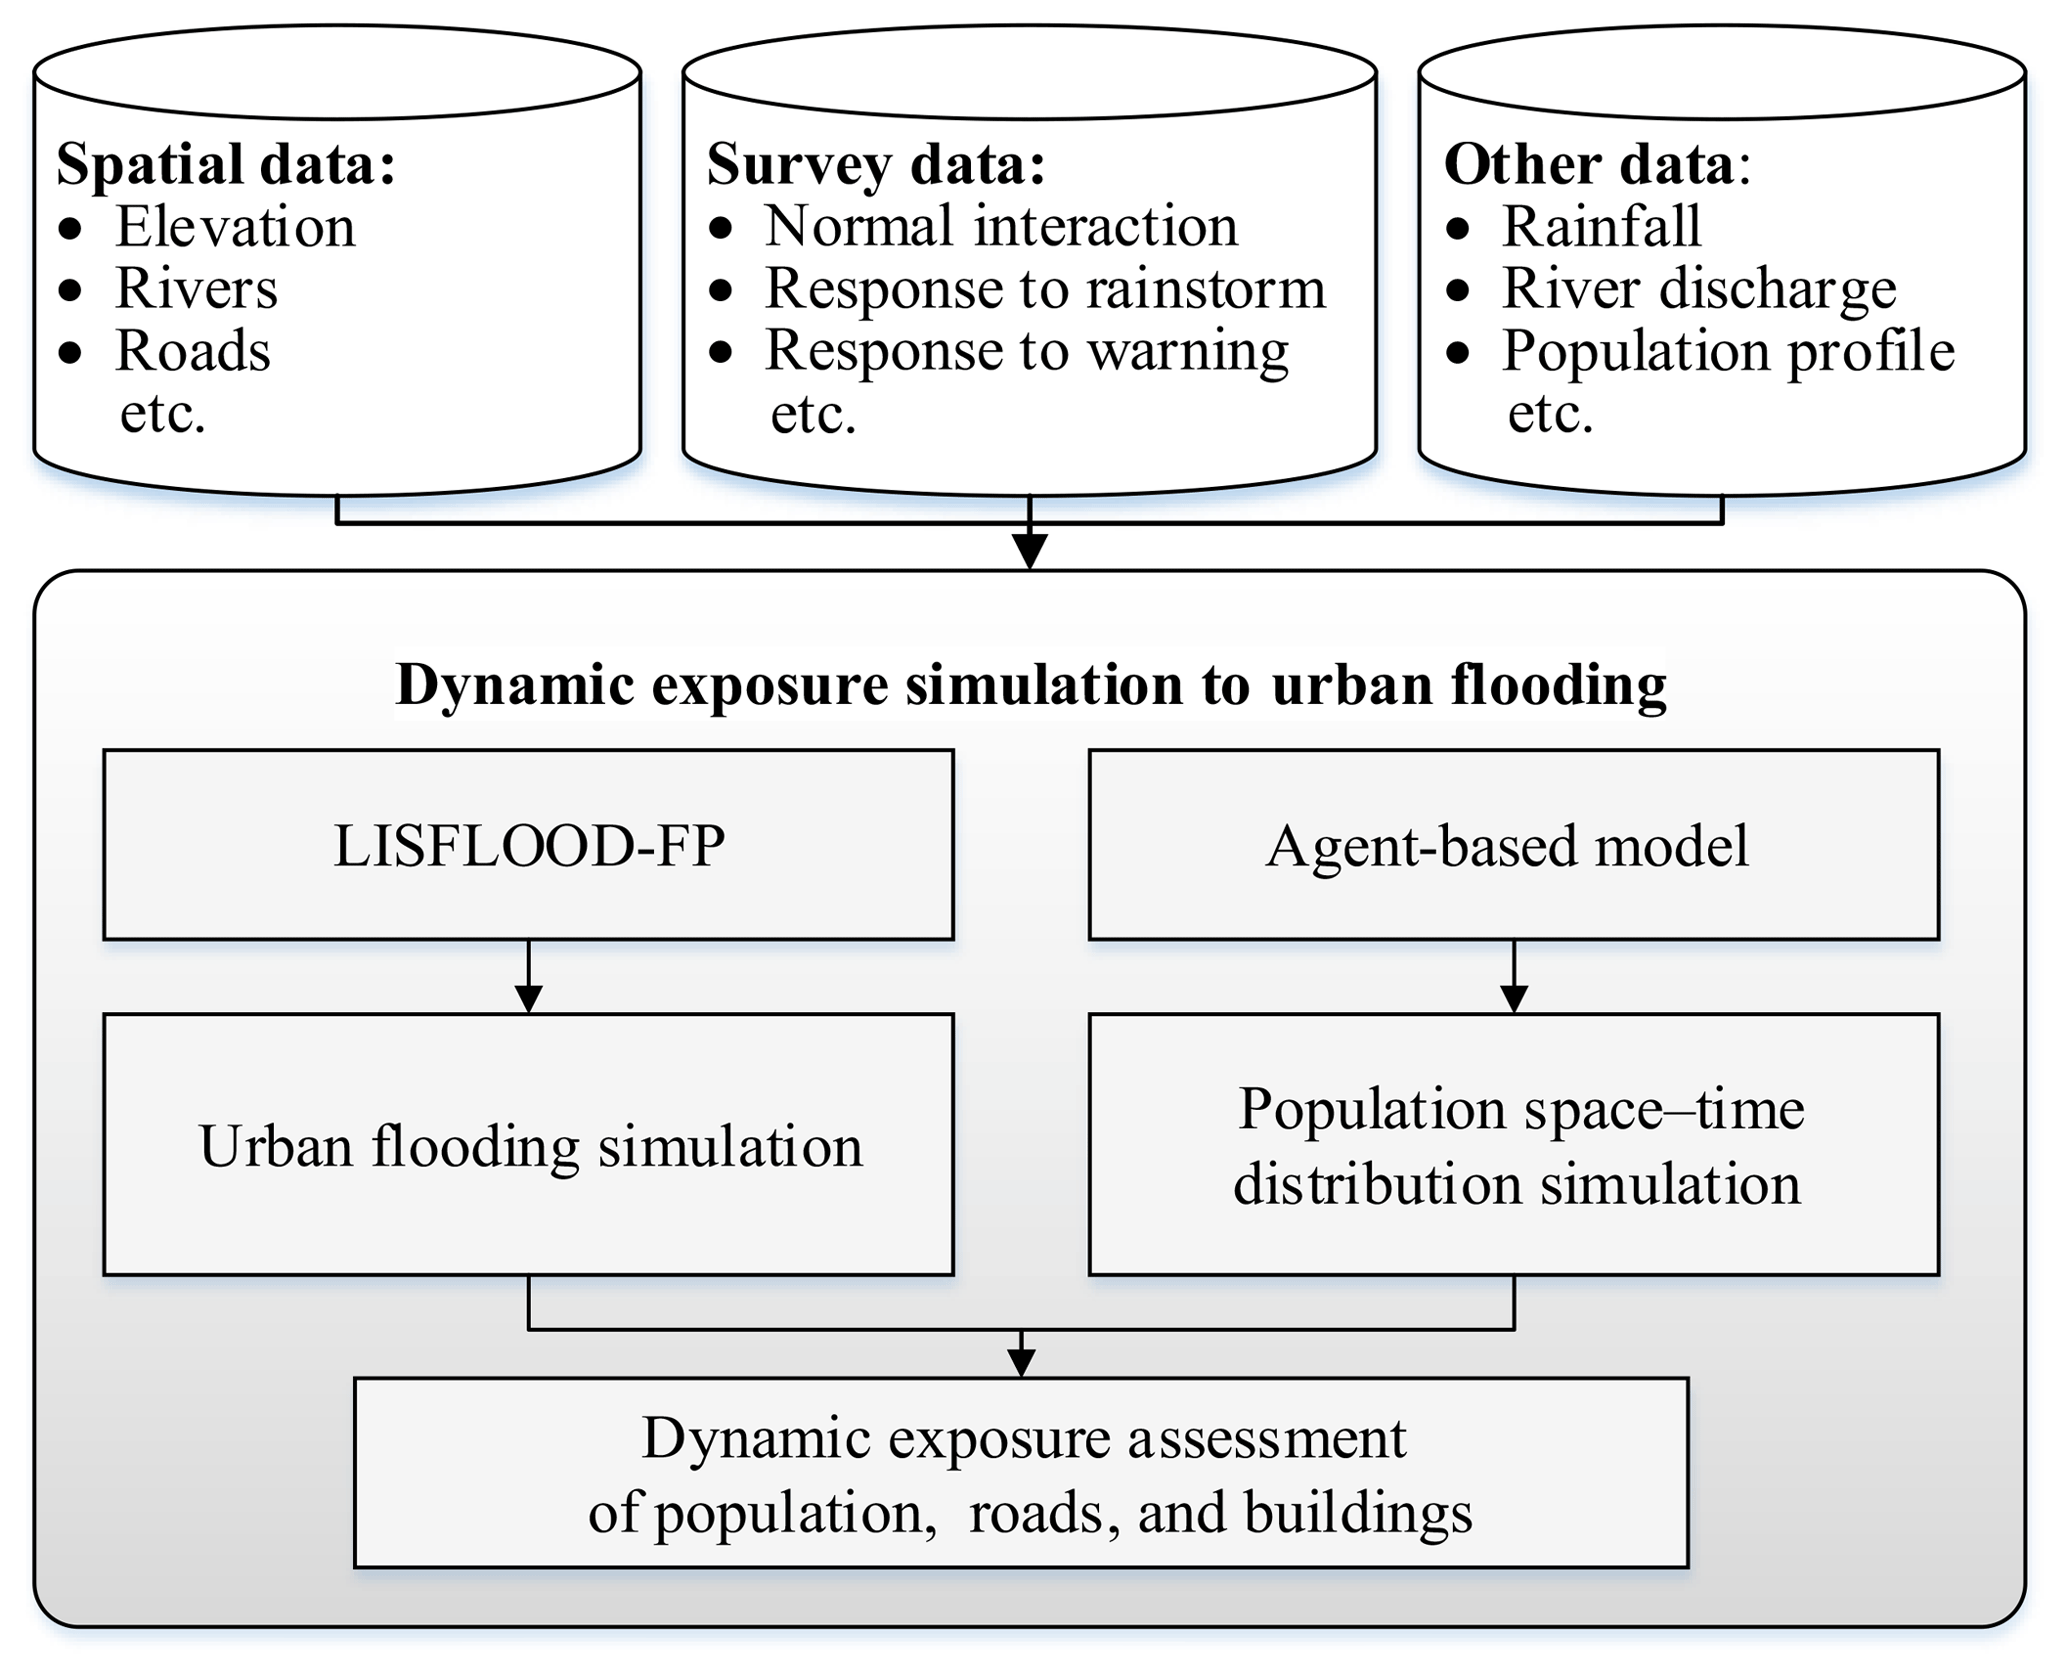
This study comprised three aspects: disaster simulation, human activity simulation, and dynamic exposure assessment (Fig. 2). The first step included fluvial and pluvial flooding simulation based on the LISFLOOD-FP model. The simulation of human activity utilized ABM to obtain the spatiotemporal distribution of the population under different scenarios. Finally, the developed model was combined with the results of the previous two steps to assess the dynamic exposure of the population, roads, and buildings to urban flooding.
3.1 Flood models
LISFLOOD-FP (Bates et al., 2013) is a coupled 1-D and 2-D hydraulic model based on a raster grid and was designed for research purposes at the University of Bristol. LISFLOOD-FP uses a square grid as the computational grid to simulate one-dimensional river hydraulic changes and two-dimensional floodplain hydraulic changes. The applicability of the model has been verified by several studies (Horritt and Bates, 2002; Bates and De Roo, 2000). Therefore, the LISFLOOD-FP model was chosen for the simulation of fluvial and pluvial flooding.
Floodplain flows were described in terms of the continuity and momentum equations discretized over a grid of square cells, which allowed the model to represent 2-D dynamic flow fields for the floodplain. It assumed that the flow between two cells was simply a function of the free surface height difference between those cells:
where hi,j is the free surface height of water at node (i, j), Δx and Δy are the cell dimensions, n is the effective grid-scale Manning's friction coefficient for the floodplain, and Qx and Qy describe the volumetric flow rates between the floodplain cells in the x and y directions, respectively. The flow depth, hflow, represents the depth through which water can flow between two cells, and d is defined as the difference between the highest free surface height of water in the two cells and the highest bed elevation.
The types of flooding simulated in this study included pluvial and fluvial floods. The input of the model included DEM, rainfall, channel, and floodplain friction data. When it comes to fluvial flooding simulations, boundary conditions including river, water level, and river discharge were also needed. The output data were water depth and water velocity in the x and y directions, respectively. Due to the lack of hourly rainfall observation data, we used designed rainfall data for pluvial flood simulation (Dai et al., 2015). Synthetic rainfall data for a return period of 50 years were simulated using the Chicago hyetograph method (CHM) (Cen et al., 1998; Dai et al., 2014). The rainfall data were determined using the rainstorm intensity formula (Eq. 3), rainfall duration time.
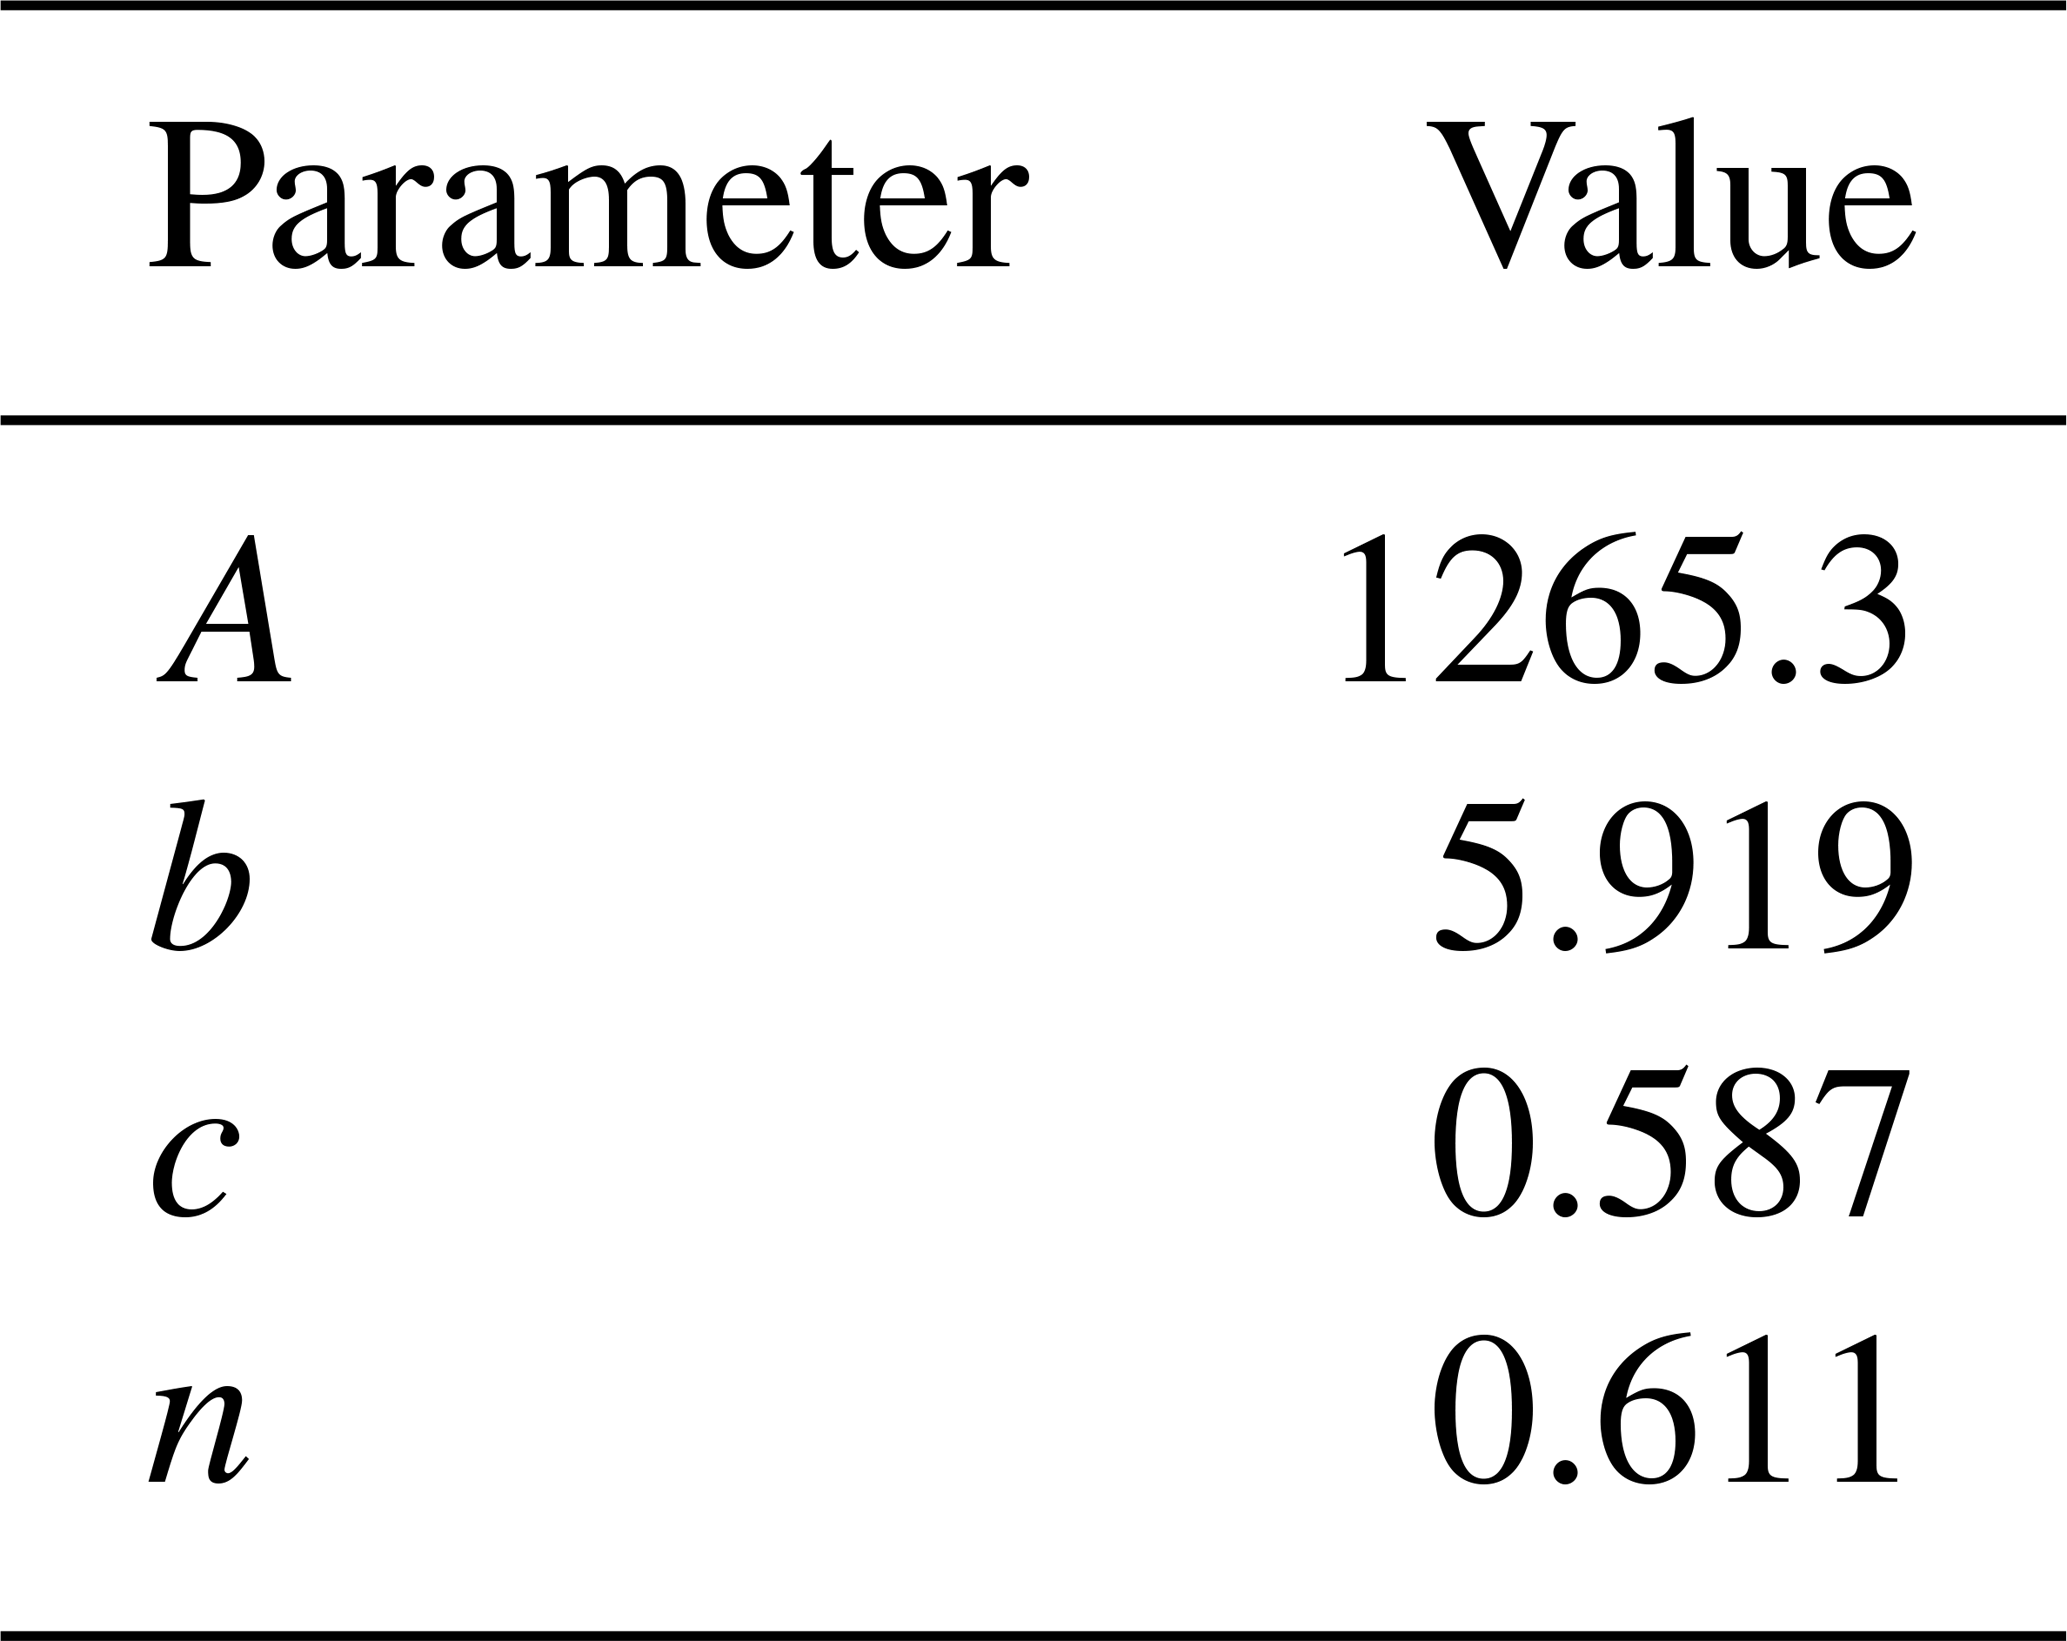
where i is the rainfall intensity (mm min−1), P is the return period, and t is the time. A, b, c, and n are parameters related to the characteristics of the local rainstorm and need solutions. A is the rainfall parameter (i.e., the 1 min design rainfall (mm) over a 10-year return period), c is the rainfall variation parameter (dimensionless), b is the rainfall duration correction parameter (i.e., the time constant (min) that can be added to convert the curve into a straight line after logarithmic calculation of the two sides of the rainstorm intensity formula), n is the rainstorm attenuation index (which is related to the return period). Additionally, the rainfall duration was 6 h (06:00 to 00:00 LT), and the accumulated rainfall was 148.59 mm. The parameters A, b, c, and n were estimated from the rainstorm intensity formula for Lishui City obtained from the “Zhejiang City Rainstorm Intensity Formula Table” published by the Hangzhou Municipal Planning Bureau (Table 2). The rainfall simulation results are shown in Fig. 3. The river discharge and water level input data for fluvial flood simulation utilized observational data from Lishui's once-in-50-years flood in 2014, provided by the Liandu Hydrological Station (Fig. 3b). The flow data for the Daxi and Haoxi Rivers on 20 August 2014 were obtained from the Xiaobaiyan and Huangdu stations, respectively, and the observational data for water levels at the outlets were those for the Kaitan Dam.
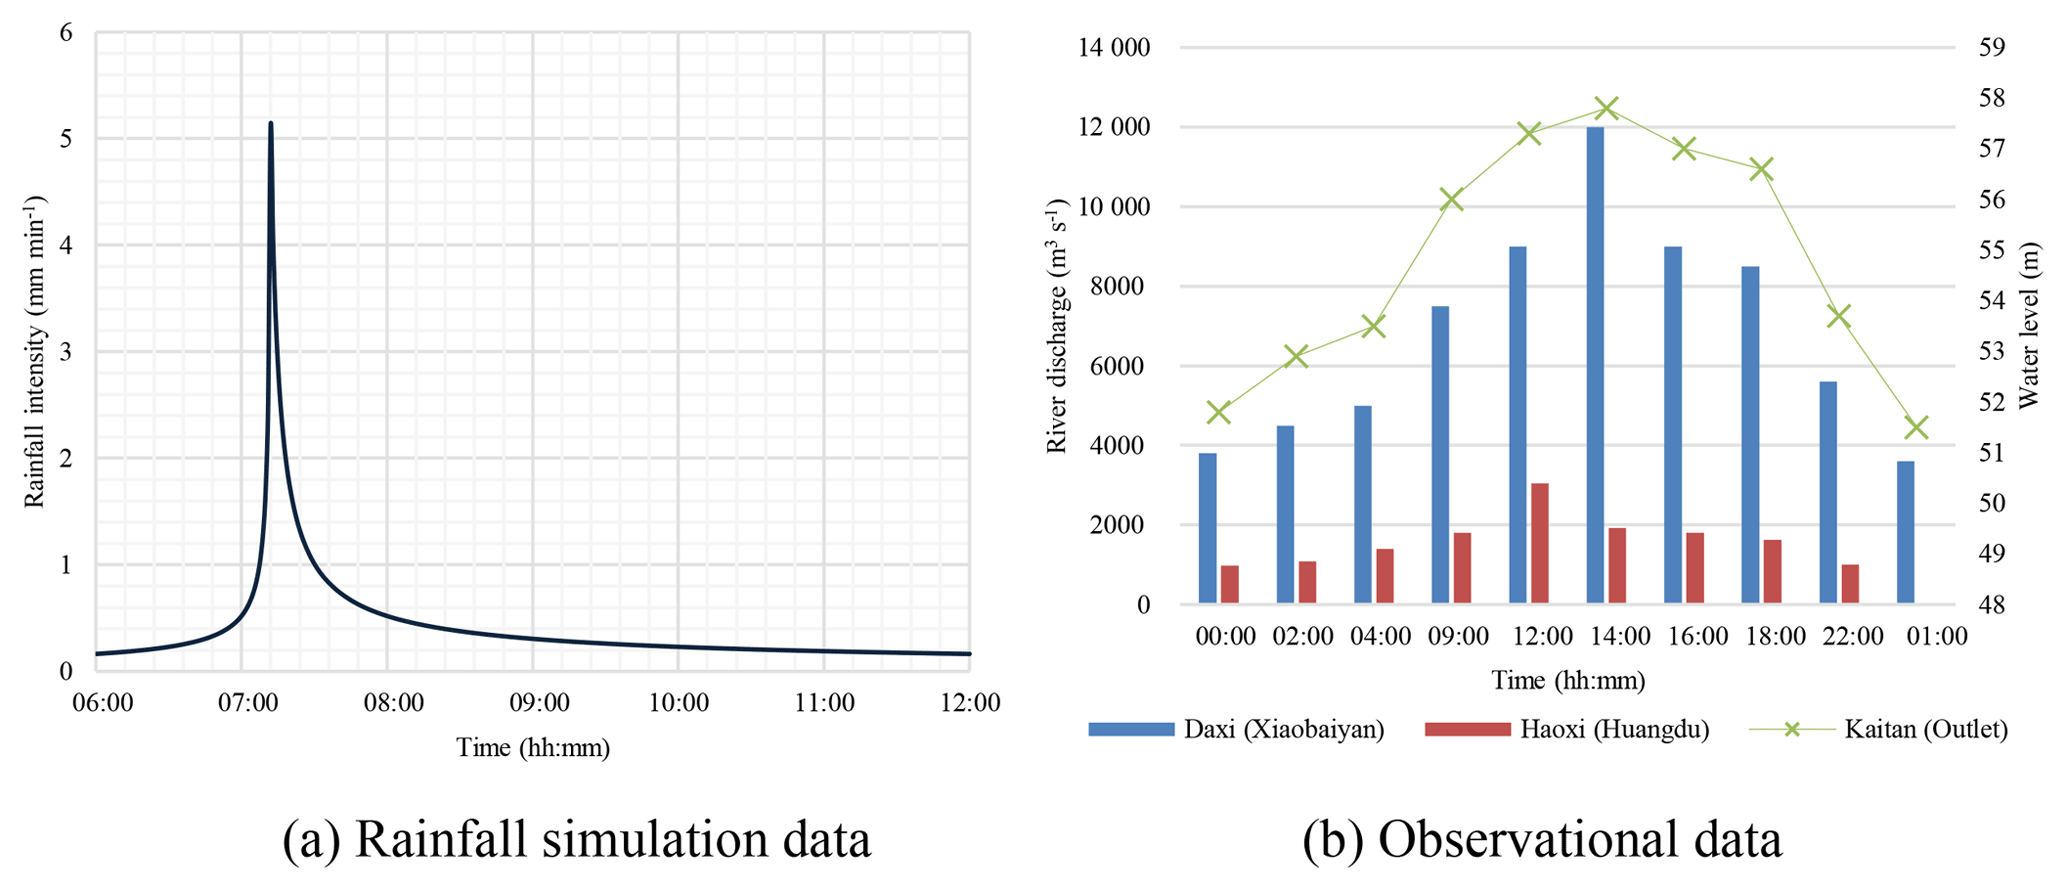
Figure 3Rainfall simulation results based on the CHM method, and observational data used for fluvial flood simulation.
3.2 Spatiotemporal simulation of population distribution
An ABM is a computational method for simulating the actions and interactions of autonomous decision-making entities in a network or system to subsequently assess their effects on the system as a whole. Individuals and organizations represent agents, each of which individually assesses its situation and makes decisions based on a set of rules. Agents may execute various behaviors appropriate for the system component they represent (such as producing or consuming). Therefore, an ABM consists of a system of agents and the relationships between them. Even a simple ABM can exhibit complex behavior patterns because a series of simple interactions between individuals may result in more complex system-scale outcomes that could not have been predicted just by aggregating individual agent behaviors. The ABM of residents' travels established in this study included two core elements (agents and activities) and two basic elements (blocks and networks). Individual movements were simulated by defining the activity patterns of different types of residents, allowing us to obtain the distribution of the population at each moment.
Residents were independent individuals with subjectivity, abstracted as agents in this study. Only a limited number of agent classifications were used to reduce the number of agent types. The types of agents were classified according to the social characteristics of the residents. Age and gender characteristics mainly affect the ability of people to respond to disasters. The self-help abilities of minors under 18 years of age and residents older than 60 years are generally poor. In the event of natural disasters, they are generally categorized as the objects of help. The middle age group (18–60 years old) generally has greater physical strength with a better ability to cope with disasters. Unemployed people are more vulnerable to natural disasters. On the one hand, their living environments and resistance to disasters are poor; on the other hand, their economic conditions are limited, which impedes recovery after the disaster and seriously affects their daily life in the short term. Education level is related to the possibility of the individual receiving early warning information. Individuals with higher education levels are more likely to respond to early warning information and are more aware of disasters than others (Terti et al., 2015; Shabou et al., 2017). Additionally, different travel modes have different effects on the activity patterns of people as well as on exposure levels when disasters occur. Therefore, the agent types were divided according to age, gender, employment status, education level, and travel mode.
Activities were classified as work, study, recreation, shopping, at-home, and travel. An activity pattern consisted of a series of activities to describe the spatiotemporal distribution of the agent. The location and scope of an agent were restricted to blocks and networks. Different types of agents indicated different activity patterns, and the same agent type could also indicate different activity patterns in different scenarios. The travel survey data were used according to the demographic properties of the agent to generate synthetic daily routines. To capture the variability in the travel survey and the uncertainties in behavior, synthetic daily routines were described in probabilistic terms based on the activity patterns derived from survey data. The probability of residents' activity patterns was estimated by (1) classifying residents according to their social characteristics, (2) summarizing their daily activity patterns and estimating the probability of each activity, and (3) using their reported flood risk perception to calculate expected changes in activity patterns during disaster scenarios and estimate the probability of different responses being taken by different types of residents. Figure 4 presents an example of the synthetic daily routine of an agent with the following demographic characteristics: male agent, aged 18–60 years, and employed. In this example, the agent started the day at 08:00 LT on a weekday. The agent then had a 0.8 probability of going straight to work, subsequently going home, and so on.
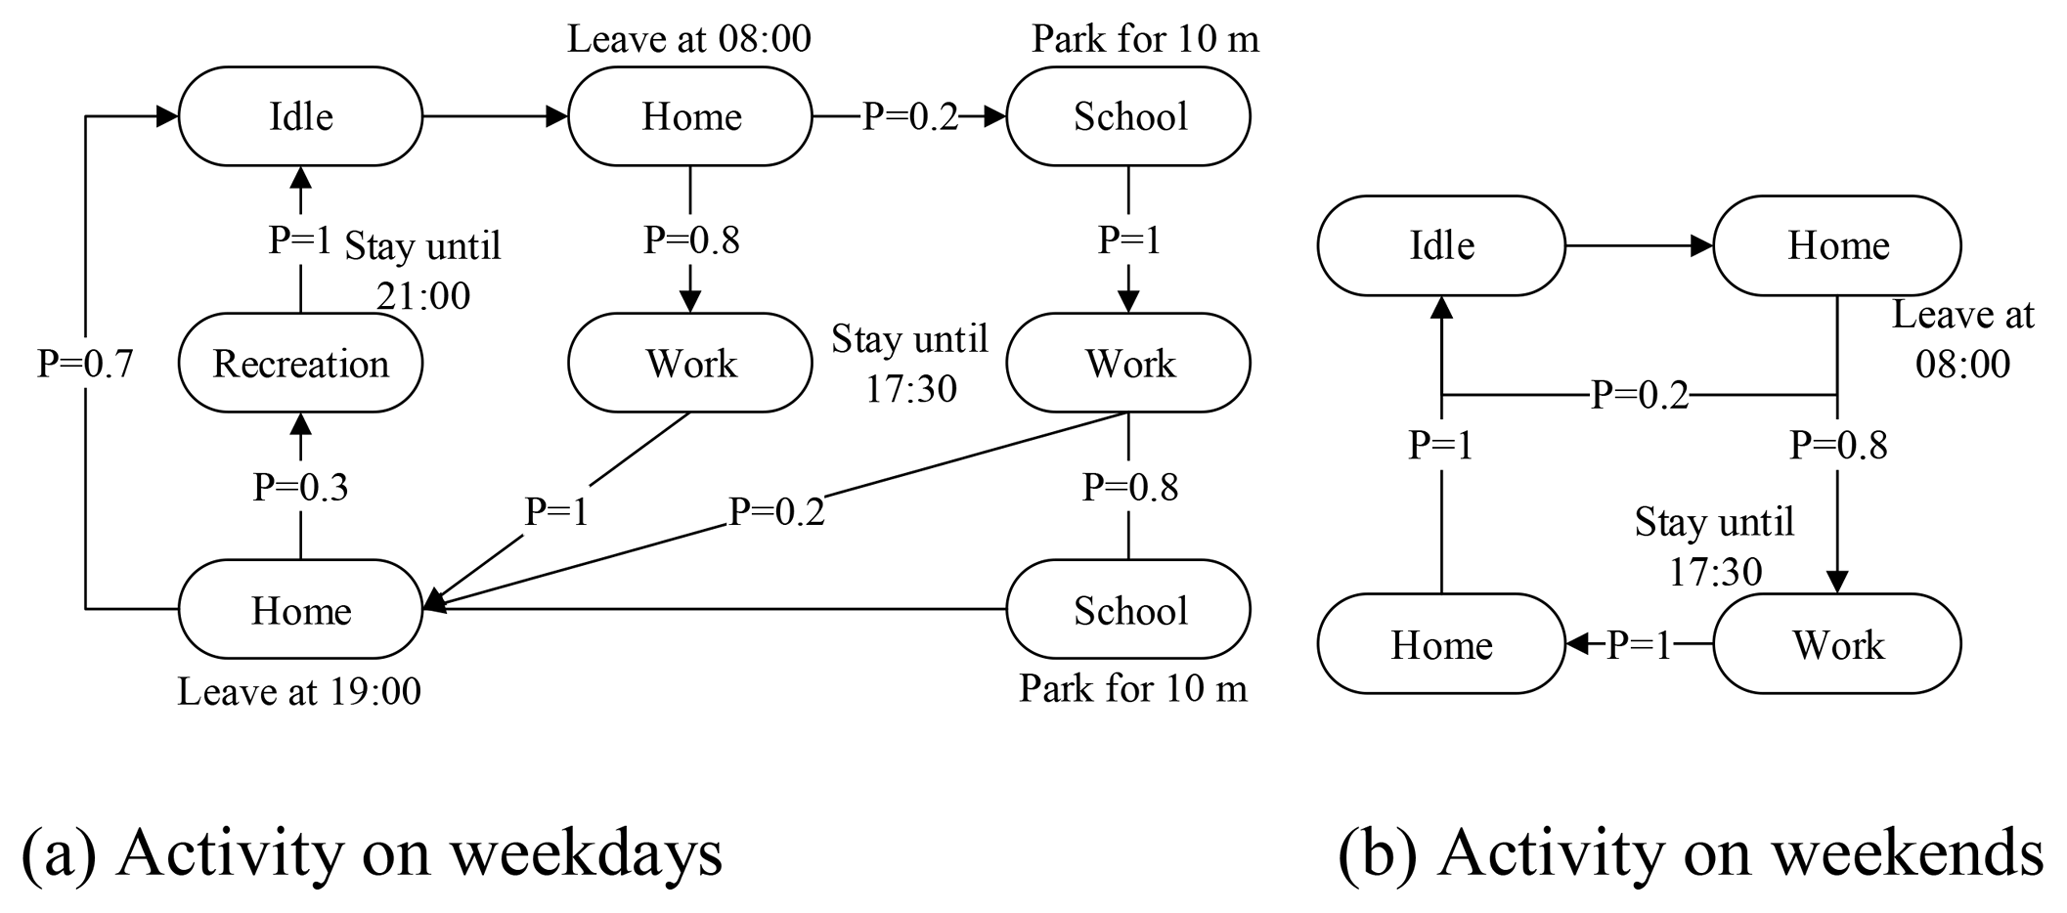
Figure 4A synthetic daily routine generated from the travel survey and census data for an employed male agent aged 18–60 years.
The study area was discretized into many blocks to improve the spatial resolution of the exposure results. The major factors that affect the flood exposure are considered, including rivers, roads, land use, and buildings. The discretization procedure was conducted with geographic information system (GIS) tools (intersection and editing tools of the ArcGIS software) (Lü et al., 2018). Blocks, the smallest unit of exposure, were defined as activity locations for agents and were divided into five categories: residential area, school, company, recreational area, and river. Residential areas were subdivided into classes I–IV according to the type of building.
In this study, the network referred to roads and restricted the spatial travel scope of an intelligent agent. Rural roads, highways, and urban roads (including main roads, sub-trunk roads, and their branches) were included in the network. The route selection criteria were defined once the different activities from each individual's schedule were located, and road section attributes were specified. Although various factors are involved in the route selection process, several studies have indicated that minimizing travel time is the principal criterion (Papinski et al., 2009; Ramming, 2001; Bekhor et al., 2006). Here, a simple but effective shortest-path method was used. The classical Dijkstra algorithm is a single-source shortest-path algorithm that provides trees of minimal total length and time in a connected set of nodes (Dijkstra, 1959). The activity pattern attributions concerned only the starting times and durations of the activity sequences, thus indicating that the travel duration for each individual was computed based on the distance between the different activity locations. Therefore, the implemented schedules may be distorted compared to the assigned schedules in terms of travel durations (Terti et al., 2015). We can get the departure and destination block of each stage according to the activity patterns and then calculate the shortest path, consisting of a series of road sections. At each moment, the block in which the agent is located is calculated. If on the road, according to differences in the speed of walking, riding a bus, or driving a car, the road section location is calculated. During flooding, this is similar in every aspect except the activity patterns.
3.3 Impacts of disasters on anthropogenic activities
This study accounted for the adaptability or adjustment behavior of residents to disasters during the disaster event. The type of activity and its sensitivity to disaster affected the residents' disaster response behavior. Recreation and shopping activities were easier to cancel and postpone than work and study (Cools et al., 2010). The sensitivities of residents to disasters depended on their socioeconomic characteristics and risk factors such as disaster- (flood-)related knowledge and experience. People with higher education levels are more knowledgeable about disasters and are more likely to receive early warning information and take effective measures (Terti et al., 2015). Additionally, it is easier for workers to ignore the risks of a disaster (Ruin et al., 2007; Drobot et al., 2007). Therefore, this study accounted for the impacts of education level on the response behavior of residents to disaster events.
The impacts of a disaster on population distribution were determined by defining different activity patterns and their changing probabilities. Figure 5 shows activity patterns during different disaster scenarios for employed adult men who had received higher education. The “bad weather” scenario was similar to the “daily activity” pattern. For instance, the change in travel probability during “bad weather” due to a rainstorm reflected the adaptive behavior of residents. The “warning” scenario assumed that the government had issued early warning information at 08:00 LT, that schools had suspended classes on weekdays, and that the resident responses were stronger than those to the “bad weather” scenario, thereby resulting in a greater difference in activity patterns.
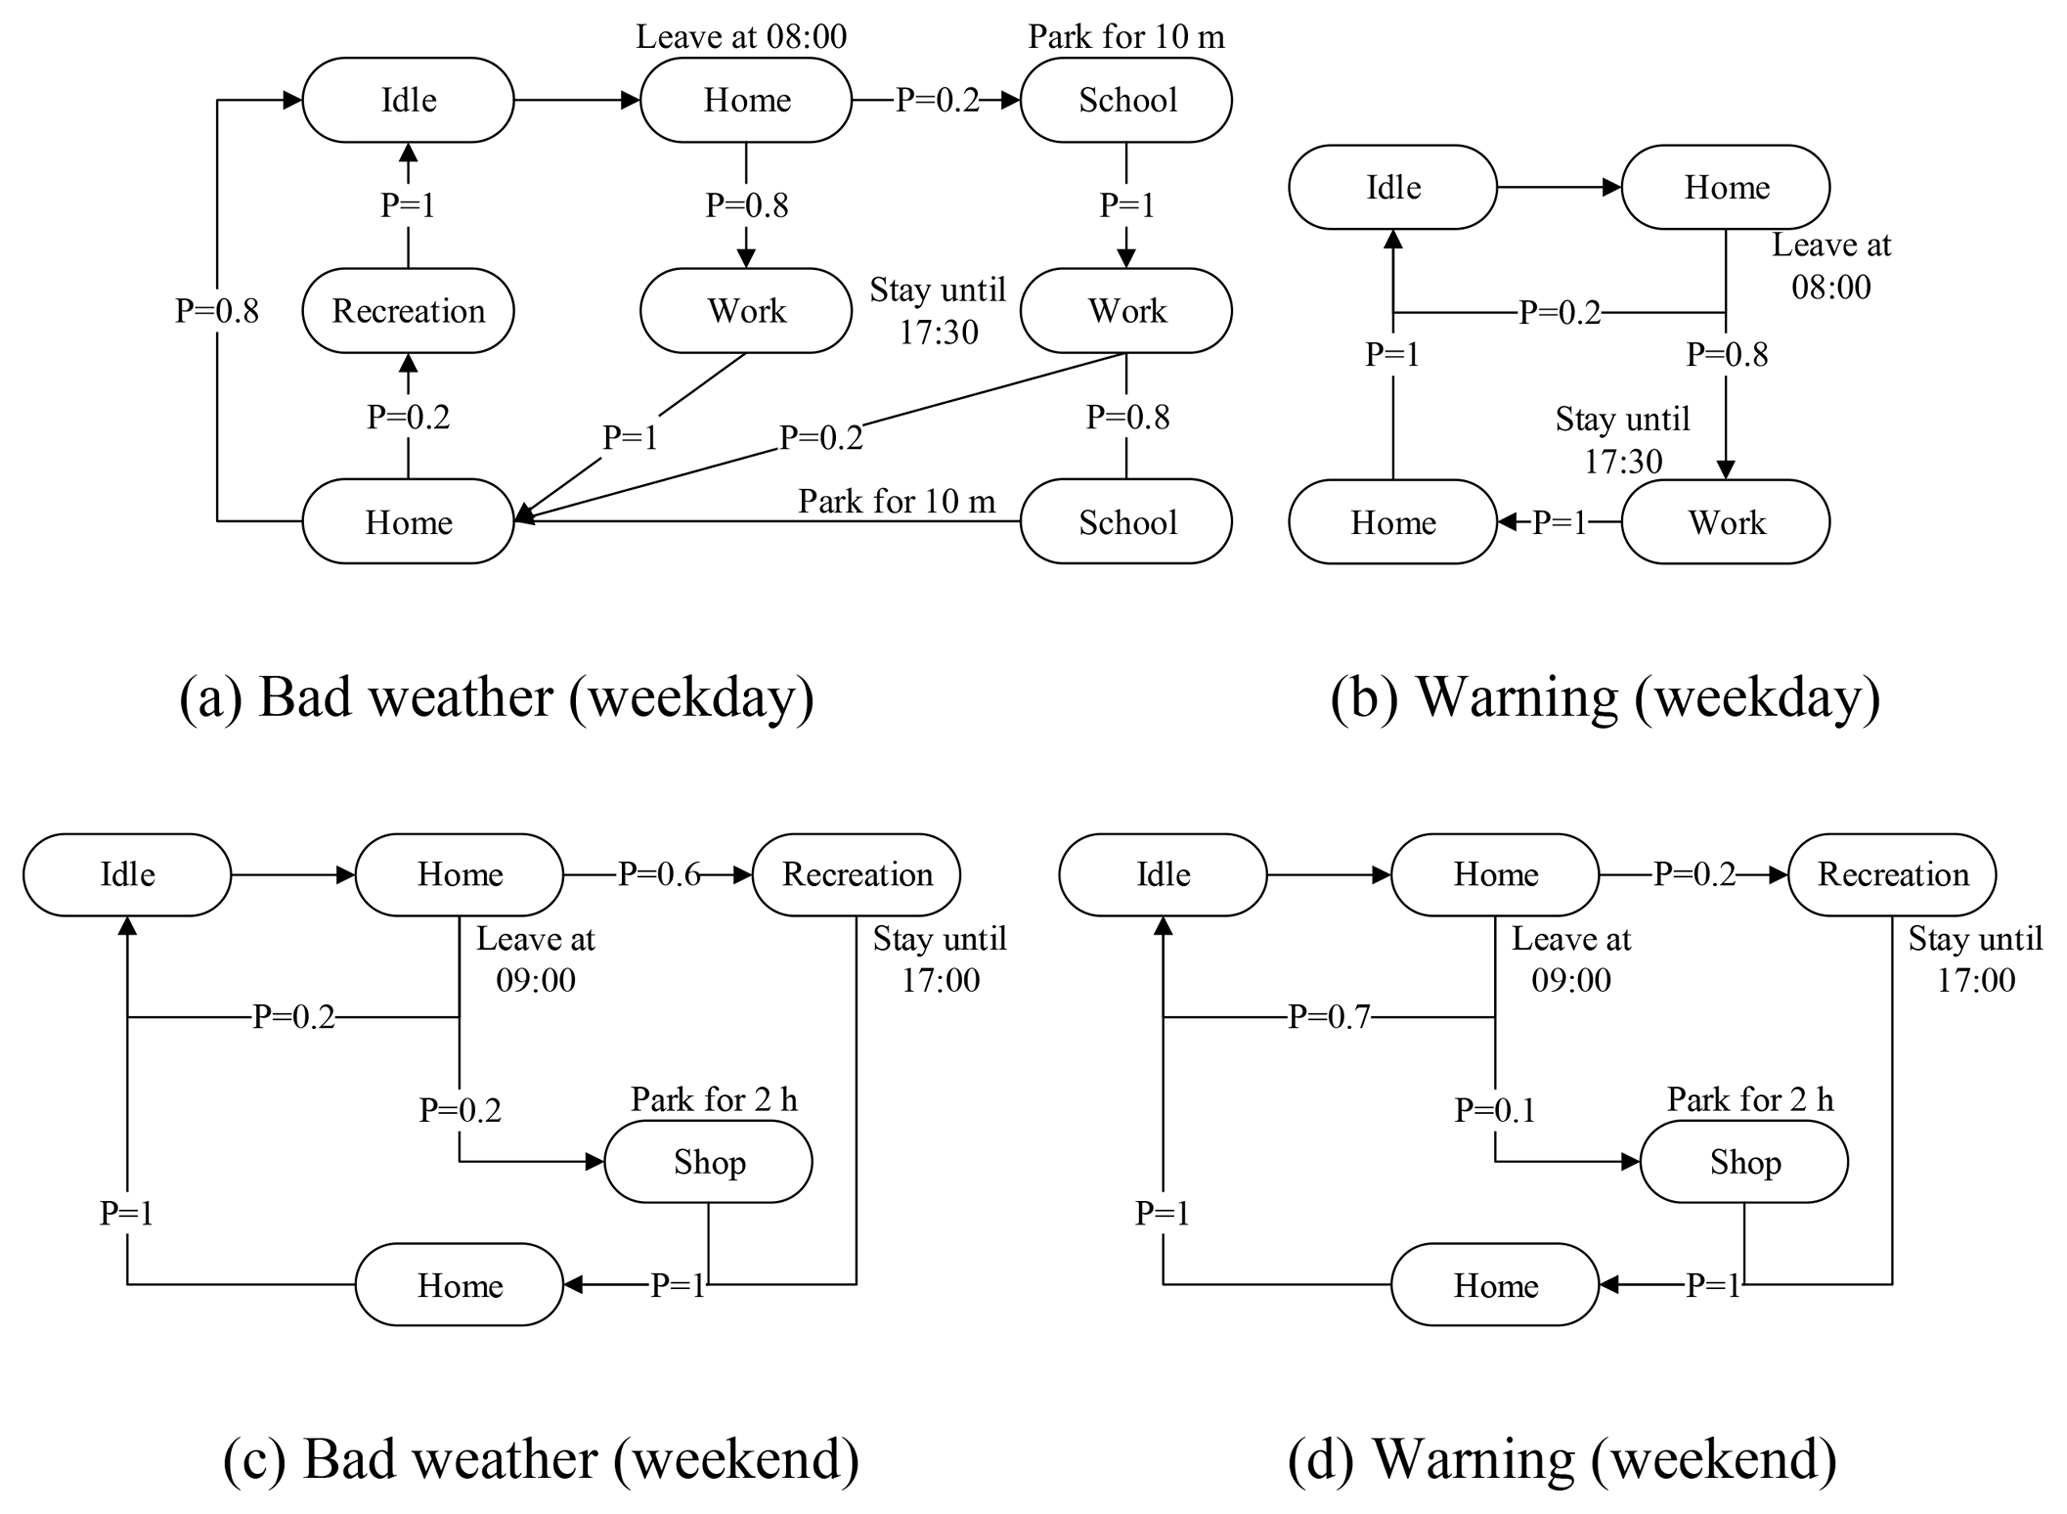
Figure 5Activity patterns for an employed male agent aged 18–60 years and highly educated during disaster scenarios. (a) Bad weather (weekday), (b) Warning (weekday), (c) Bad weather (weekend), (d) Warning (weekend).
3.4 Dynamic exposure assessment
The dynamic exposure was calculated based on the simulations of spatiotemporal distributions of the population and flooding. Therefore, the exposure at each moment was calculated according to the population distribution and flood data at that time. Based on the data availability, this study focused only on three types of disaster-hit bodies, i.e., population, roads, and buildings.
3.4.1 Population
Population exposure generally refers to the population exposed to the impacts of disaster events and is characterized by regional population size or density. This study selected the exposed population and accounted for vulnerable groups and road users. Age was the primary factor impacting vulnerability. Specifically, the young (people under the age of 18 years) and the elderly (people over 60 years old) were the vulnerable groups.
3.4.2 Roads
As the basic skeleton of a city, roads are not only the media for daily travel of passengers and freight transportation but are also disaster-hit bodies (J. Yin et al., 2016), as they are vulnerable to flood disasters. This study selected the number and lengths of exposed roads to reflect road exposure.
3.4.3 Buildings
Aggravation of urban flooding has made building flooding more common in urban areas, resulting in loss of internal property and construction structures. Additionally, the dynamic state of building exposure is related to the safety of both the building as well as the surrounding population. In this study, the area of the exposed building and the depth of accumulated water in the building were considered as the building exposure.
3.5 Scenario design
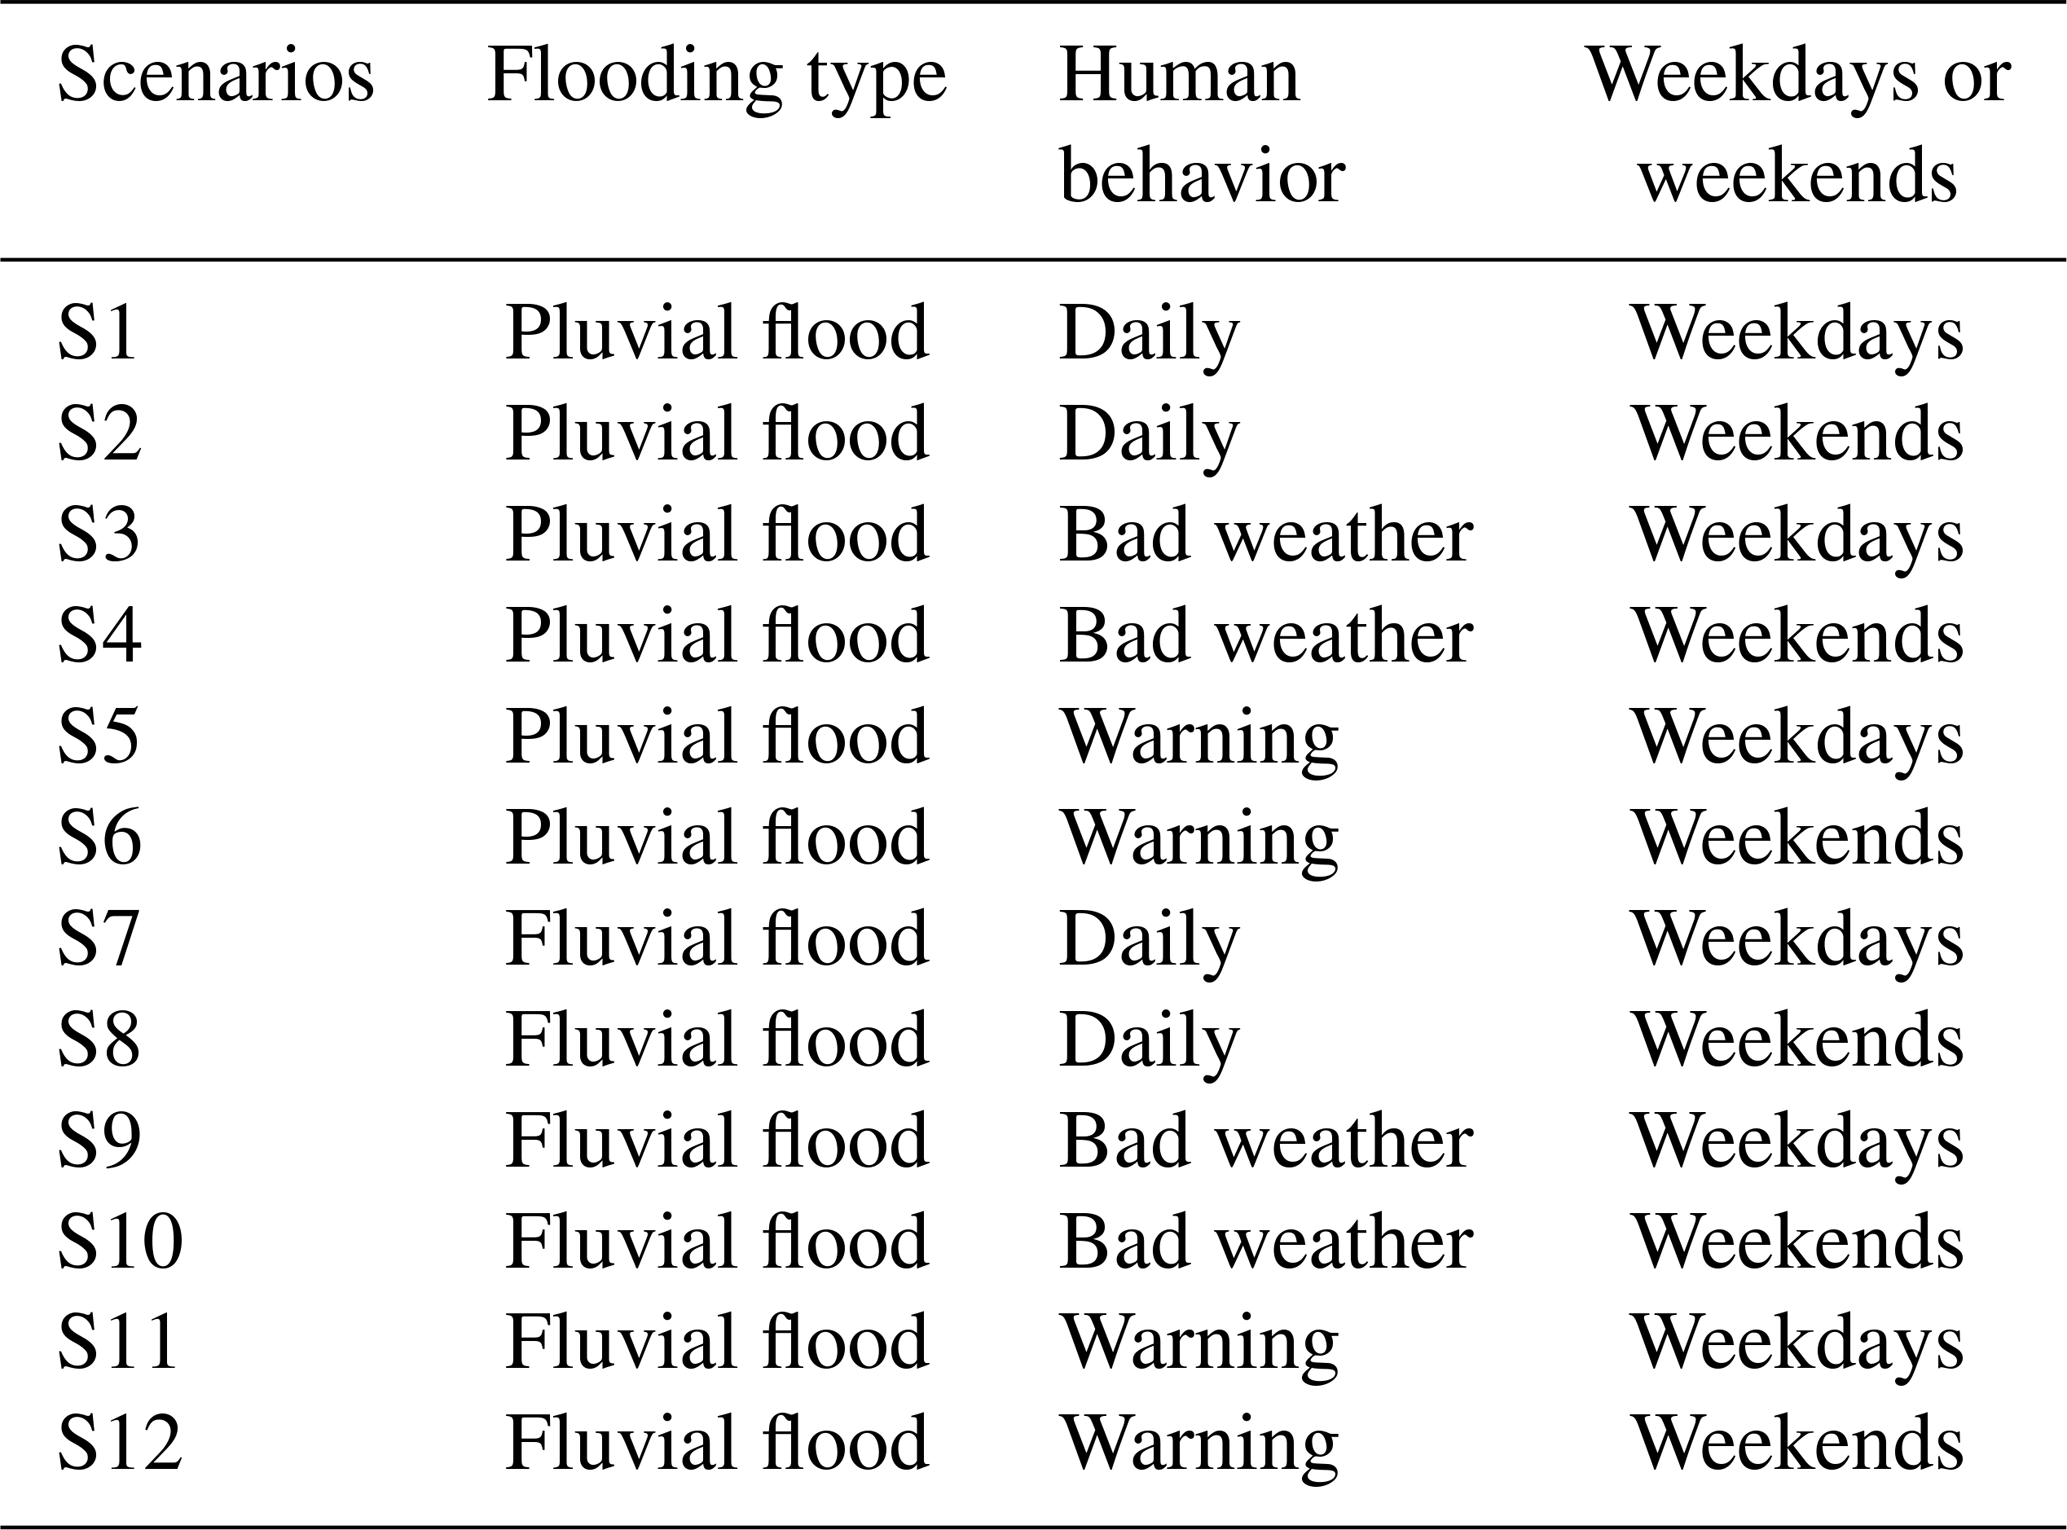
The daily behaviors of people are characterized by certain patterns with regard to daily, weekly, monthly, and annual cycles. The rainstorm (“bad weather”) and disaster response measures adopted by the organization (“warning”) are likely to affect people's daily behaviors. Therefore, 12 scenarios, representing different flooding types and human activities, were designed in this study (Table 3). S1, S2, S7, and S8 were control groups that indicated human activity with no rain and no warning, while the rest of the scenarios were experimental groups.
3.6 Model implementation and parameter setting
GIS, an important spatial data management and analysis technology, plays an important role in dynamic exposure analysis of urban floods. In addition, the Python programming language is being increasingly adopted by researchers due to its simplicity, readability, and flexible usability. Therefore, the model was developed using the Visual Studio Code software (Visual Studio Code, 2018) and Python programming language (Python, 2018). The development of the graphical user interface (GUI), GIS module, and drawing module used Qt (Qt, 2018), Geopandas (Geopandas, 2018), and Matplotlib (Matplotlib, 2018), respectively.
(i) Block generation
Blocks are irregular vector units whose size represents spatial resolution. Therefore, the spatial resolution of the results is related to the study area and data. In this study, the study area was divided into 237 blocks based on the method introduced in Sect. 3.3, with a minimum area of 2731.64 m2. The block types and their spatial distributions are shown in Figs. 6 and 7, respectively. Most of the blocks in the study area were categorized as residential areas, while blocks of recreational areas were few and concentrated.

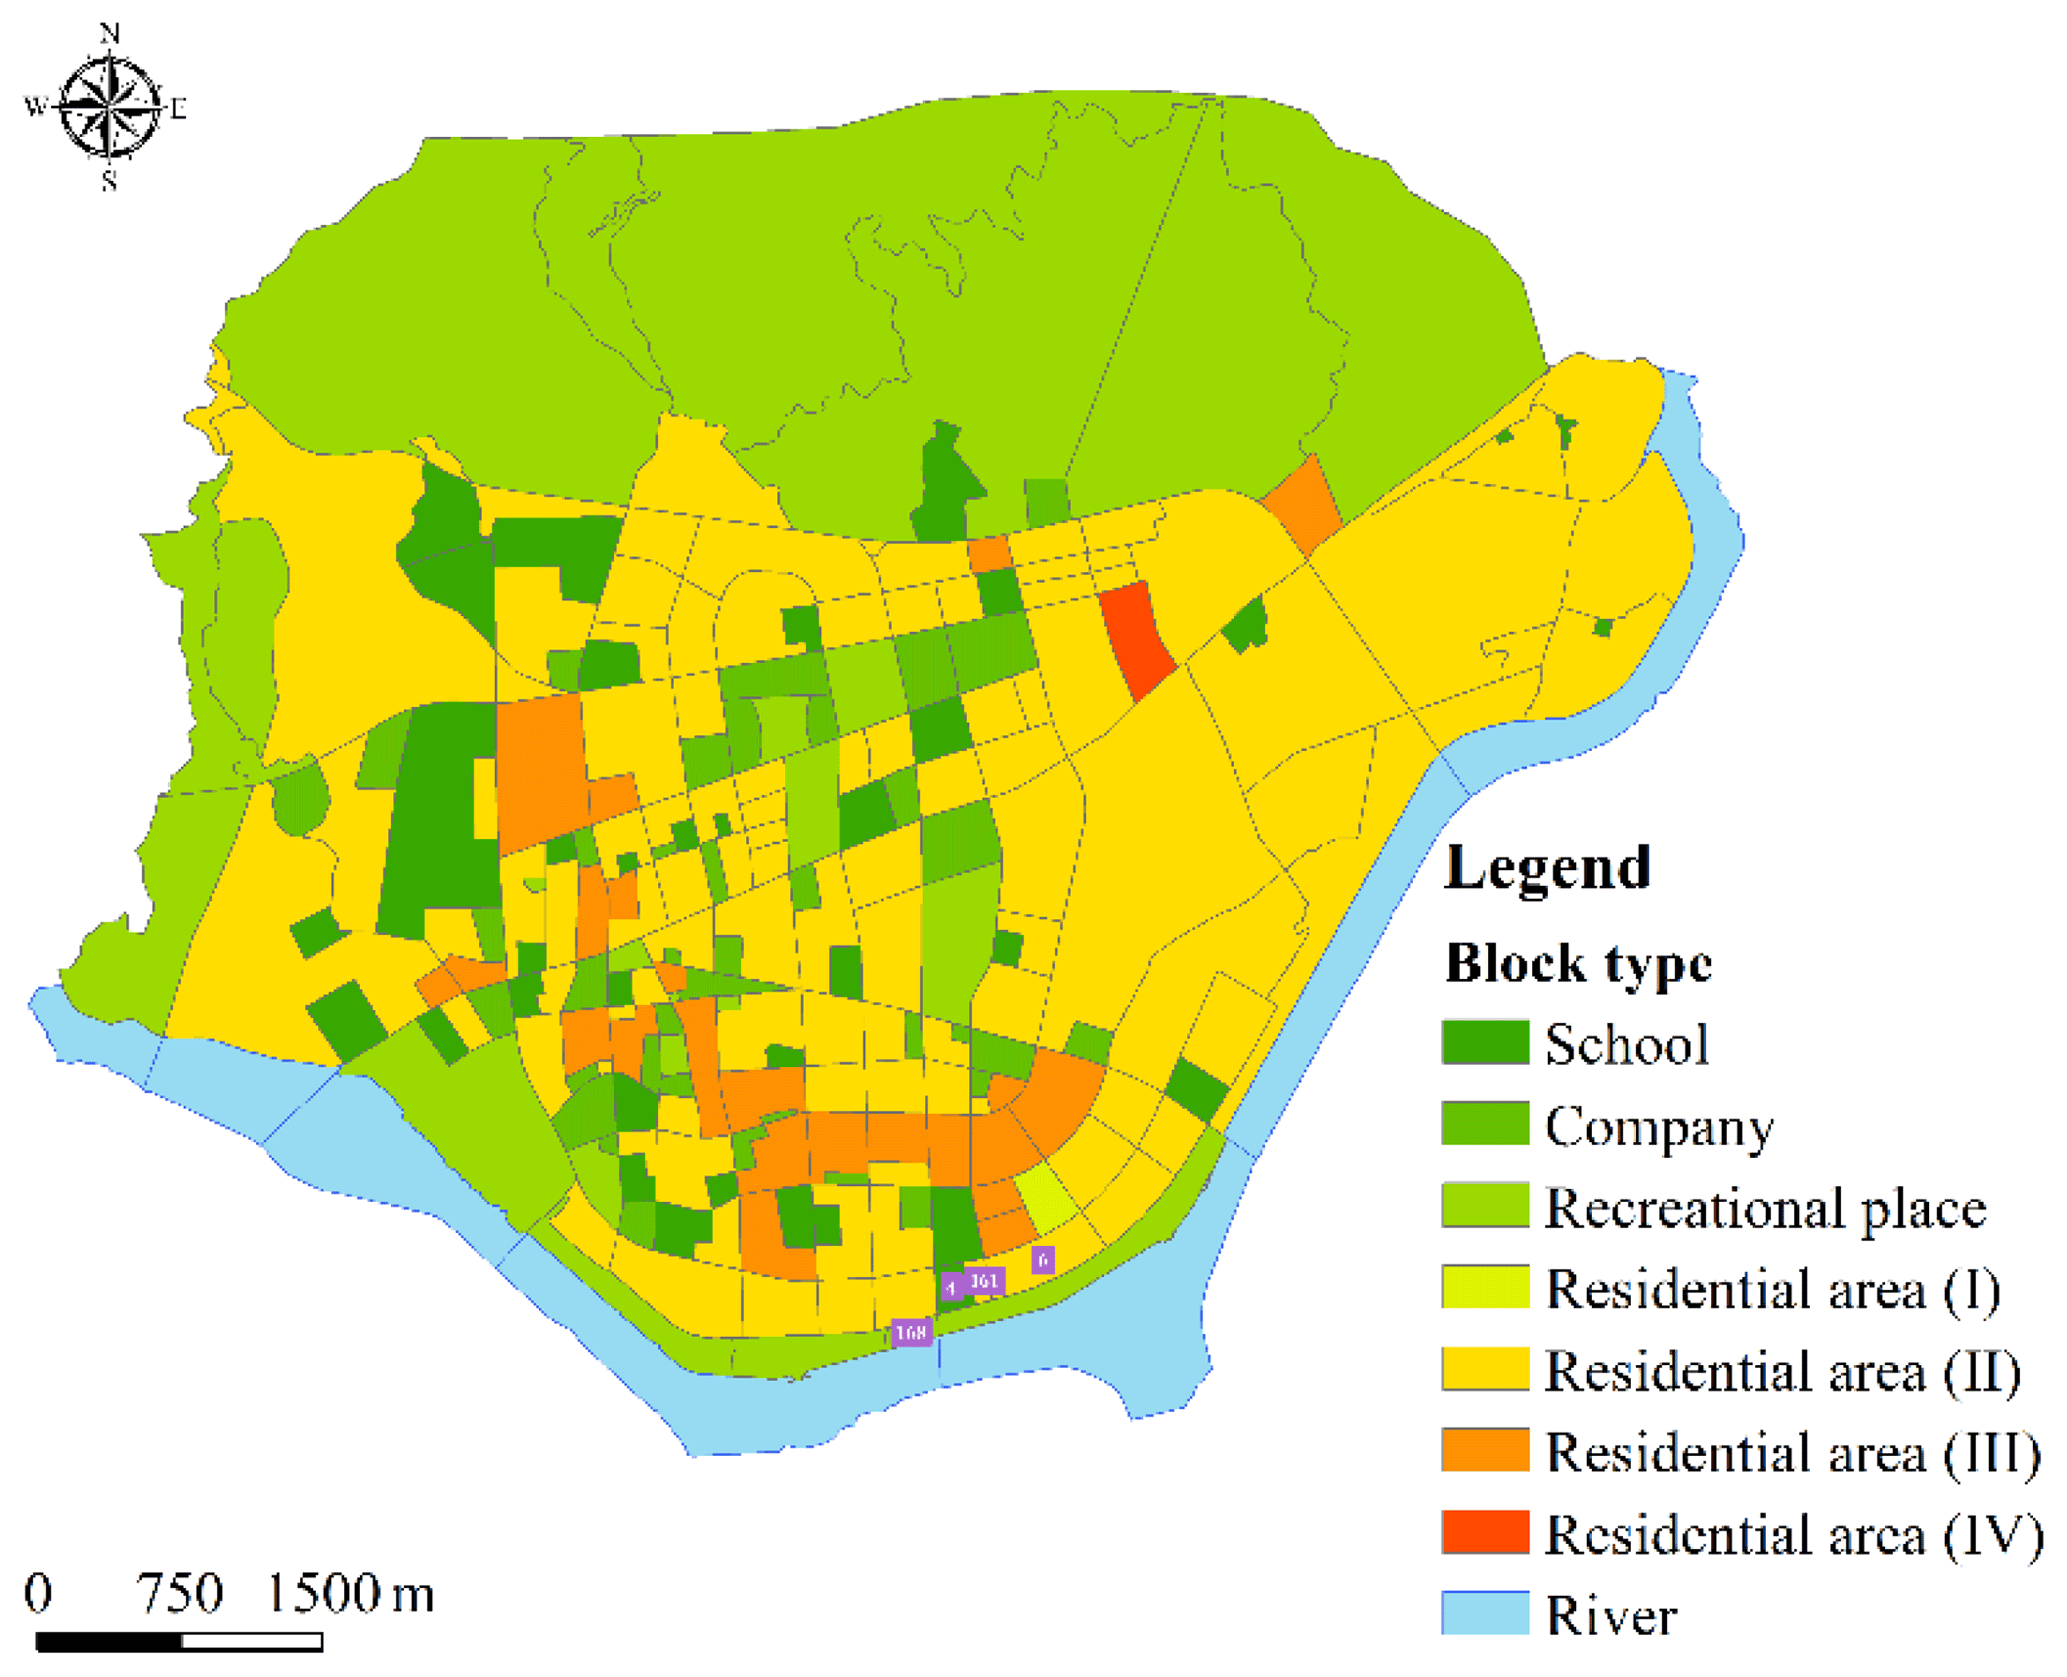
Figure 7Spatial distribution of blocks.
(ii) Parameter setting
To reduce the number of agent types, only a limited number of agent classes were used. The distribution of population characteristics for Liandu District is shown in Table 4. The agents were divided into 18 types for normal daily (non-disaster) scenarios (S1, S2, S7, and S8) and 24 types for disaster scenarios (other scenarios except S1, S2, S7, and S8) based on the influence of education level on the individual disaster response behavior (Fig. 8).
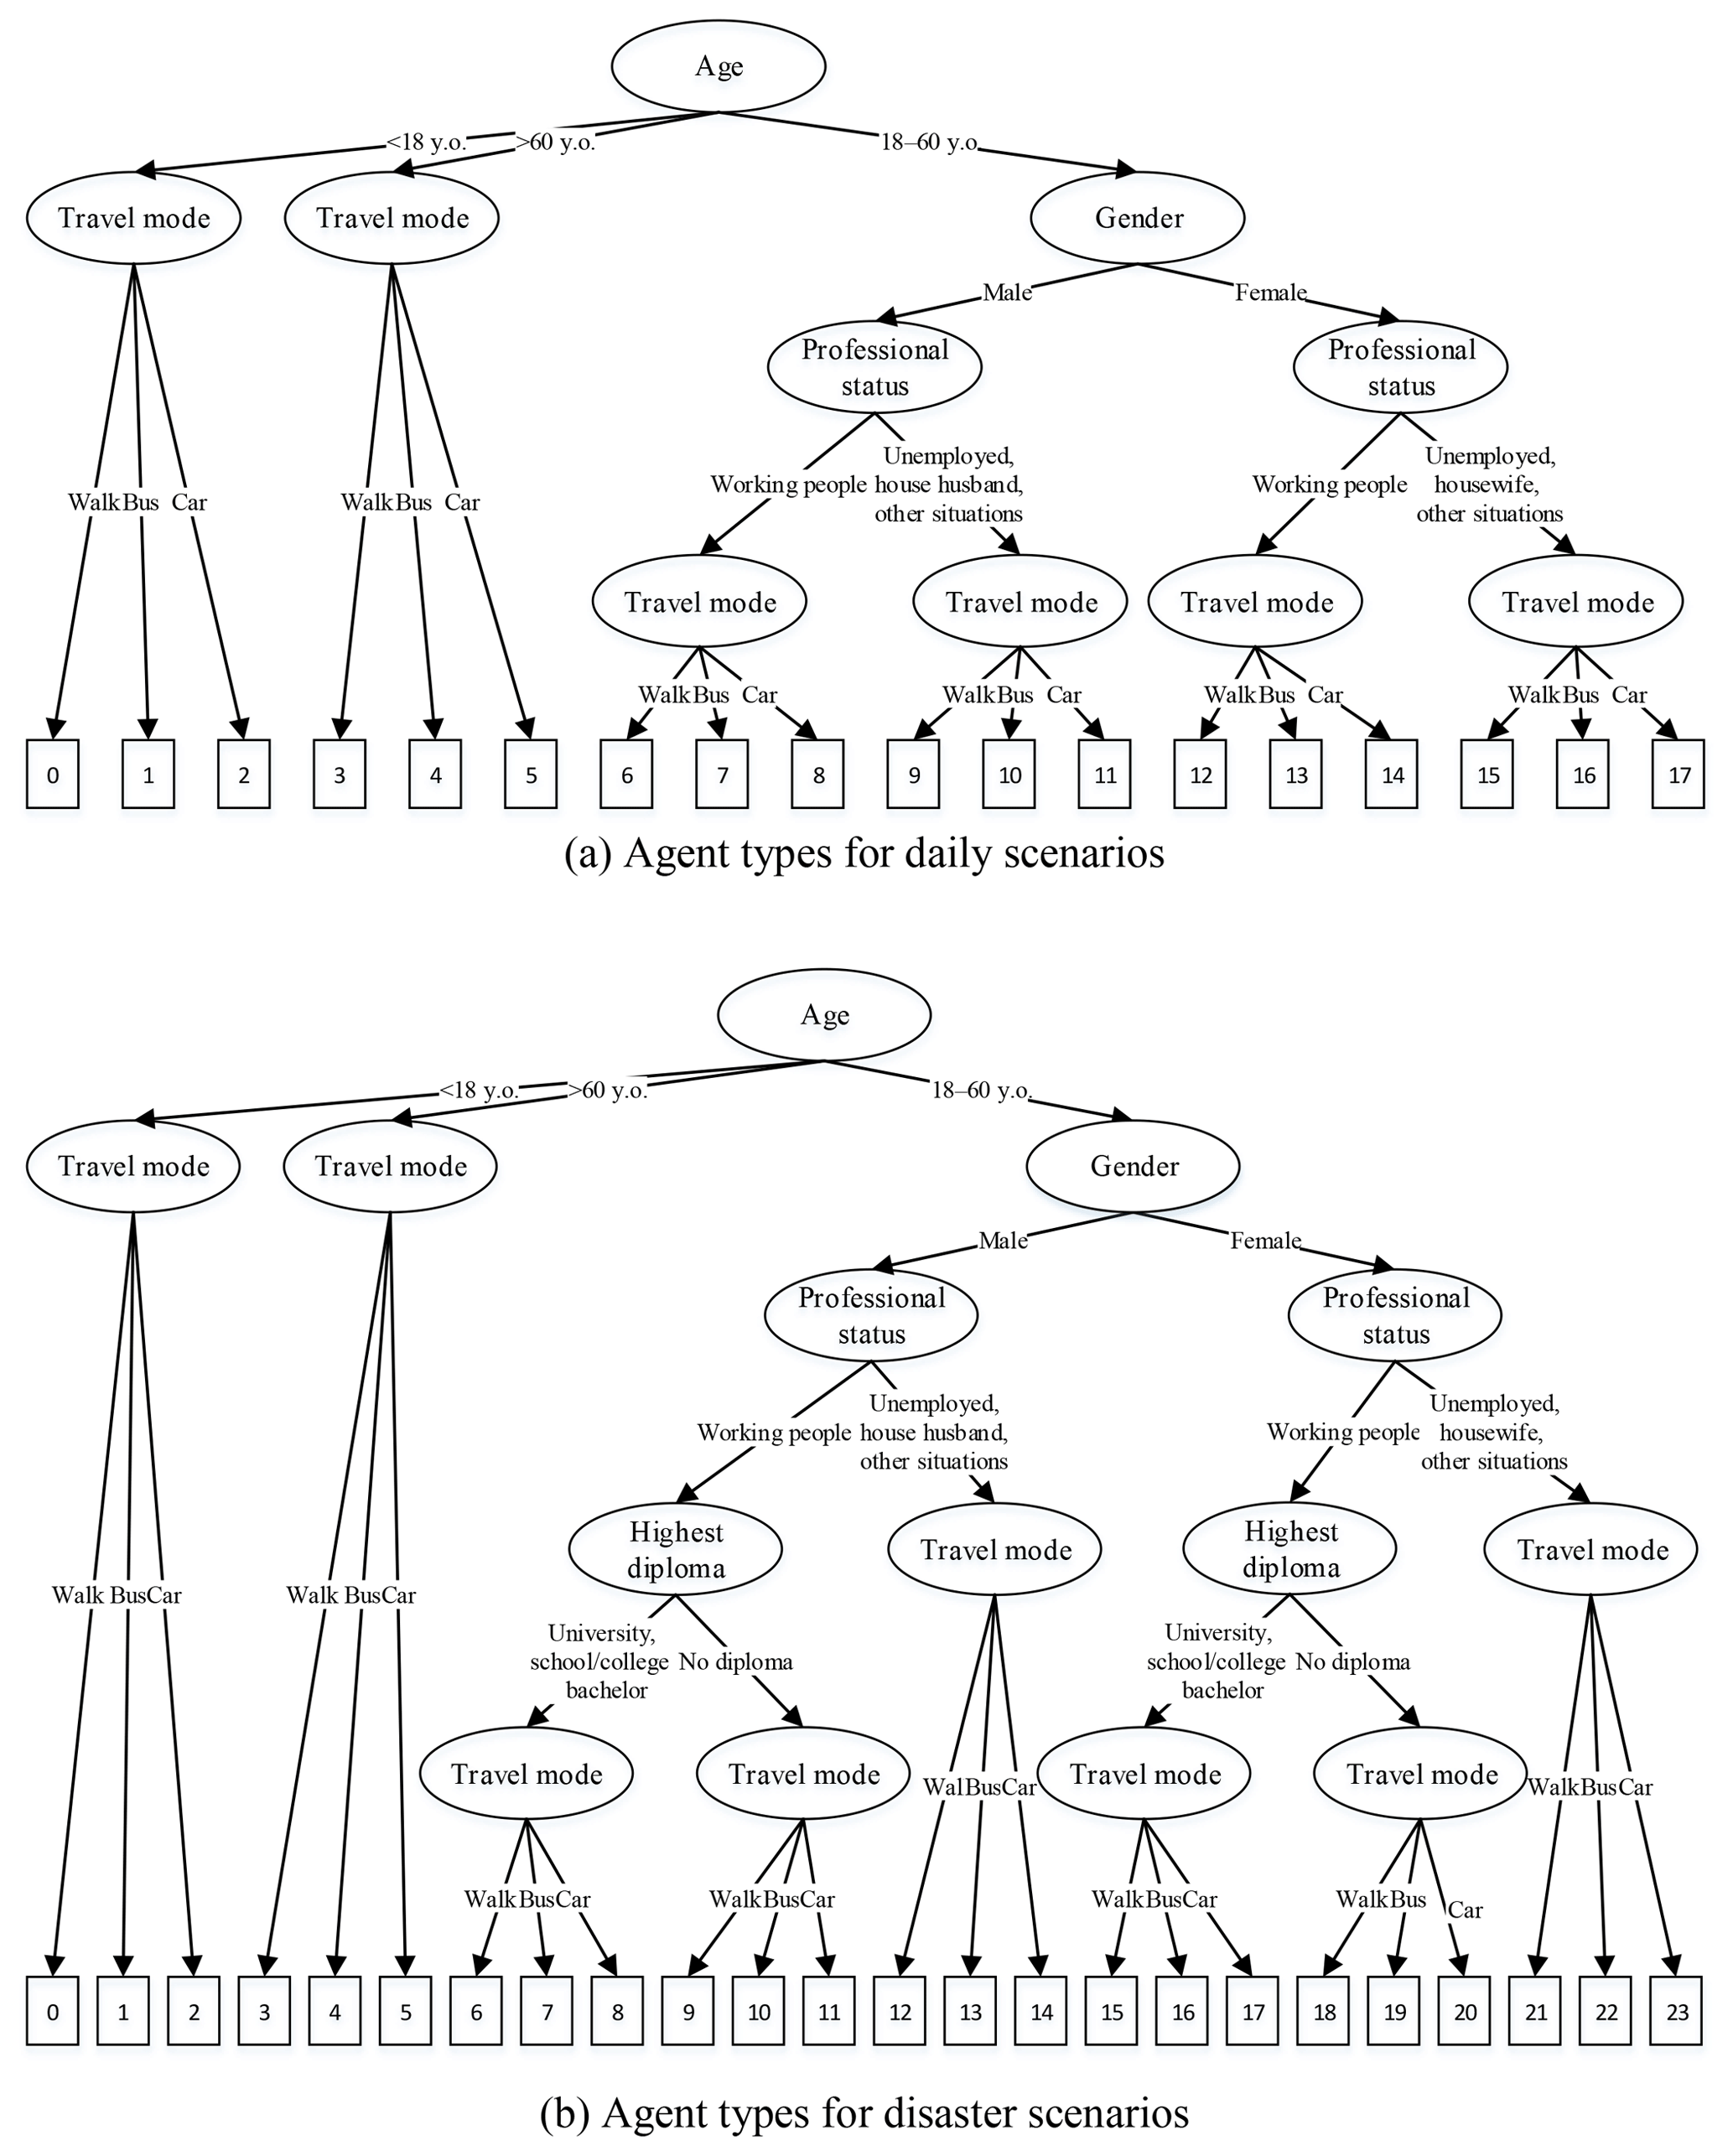
Figure 8Agent types for daily and disaster scenarios. Daily scenarios refer to S1, S2, S7, and S8. Others are disaster scenarios.
Table 4Sociodemographic characteristics of the study area population.
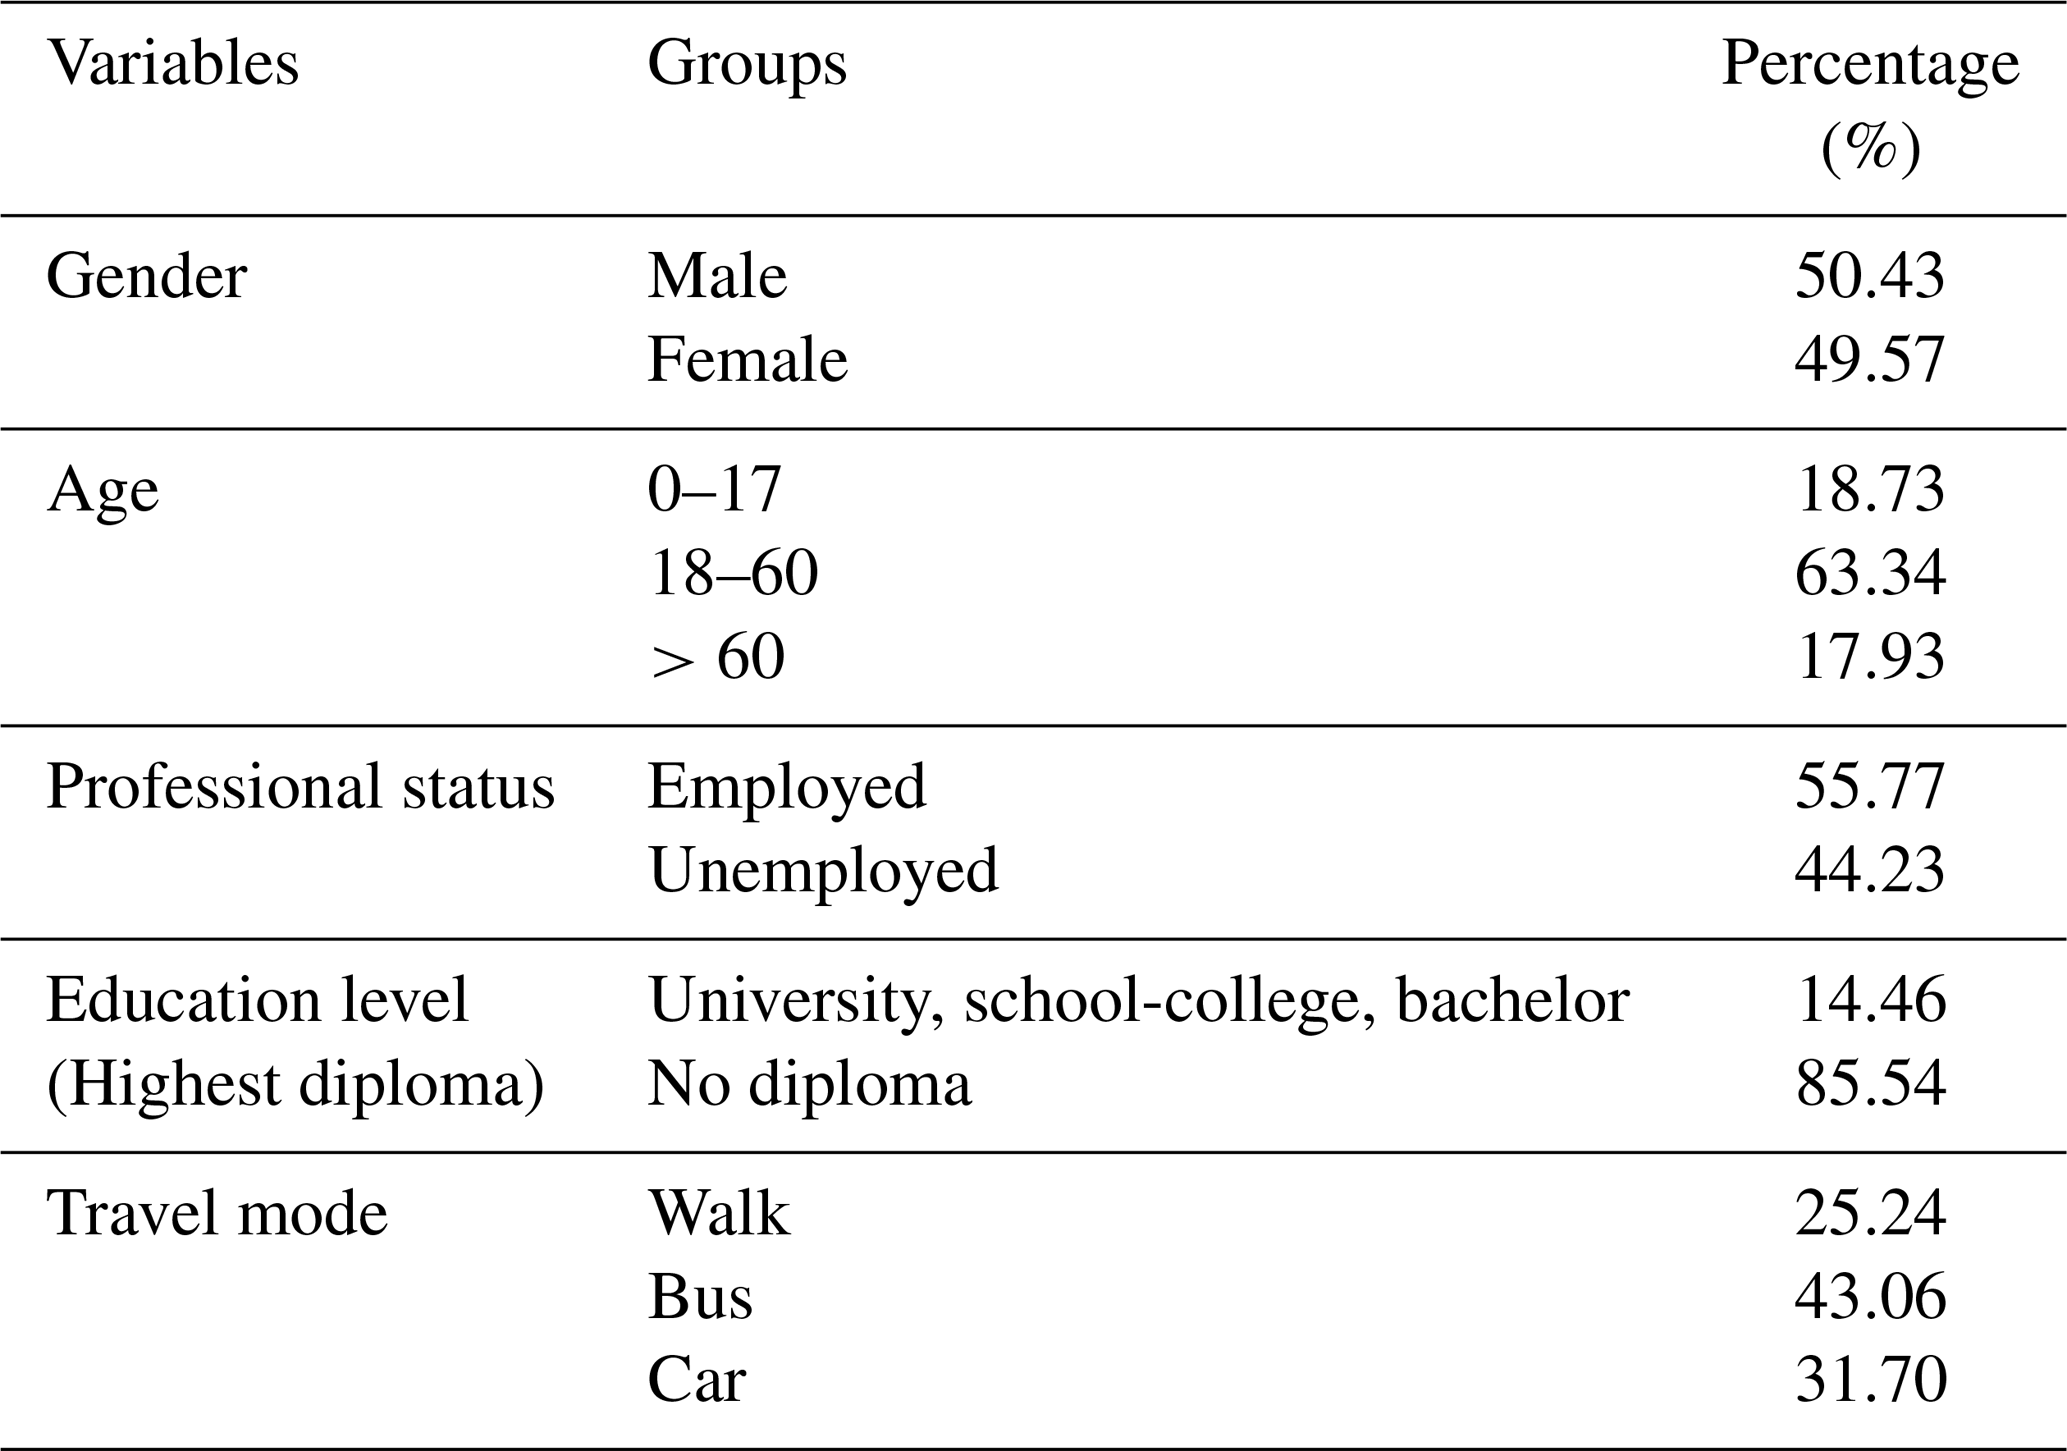
Note: data are drawn from the 2015 Lishui Statistical Yearbook and 2015 Liandu Yearbook.
Since the census data did not identify individuals by address, each simulation began by creating an agent population with the same distributions of age, gender, employment, education level, and travel mode that was randomly located within the residential area. The synthetic daily routines were described in probabilistic terms to capture the variability present in the travel survey and other uncertainties in behavior. The probabilities of all daily activities for all agents were generated based on the travel survey.
(iii) Exposure threshold
Although flood fatalities can occur through a number of mechanisms, such as physical trauma, heart attack, or electrocution, drowning accounts for two-thirds of the fatalities (Jonkman and Kelman, 2005). Previous research has established that the probability of death or serious injury as a result of exposure to flooding (Abt et al., 1989; Karvonen et al., 2000; Lind et al., 2004; Jonkman and Penning-Rowsell, 2008) is dominated by (1) the depth of floodwater and (2) the velocity of floodwater. Additionally, the rate of water level rise can also play an important role in this regard. However, other factors, such as age, fitness level, height, and weight of the individual, are also important for determining their vulnerability to disasters. A comprehensive review of flood-related casualty data and methods used to assess the risk of death or serious harm caused by flooding was provided by the DEFRA and Environment Agency (2003) and Jonkman and Penning-Rowsell (2008). In this study, rather than predicting mortality (which is subject to random factors as well as those mentioned previously), exposure to floodwater depths of 25 cm or greater under relatively fast-flowing (2.5 m s−1 or greater) conditions was established as the threshold for the most vulnerable people (DEFRA and Environment Agency, 2003). This provided a conservative estimate of individuals vulnerable to floodwater rather than an estimate of mortality (Dawson et al., 2011).
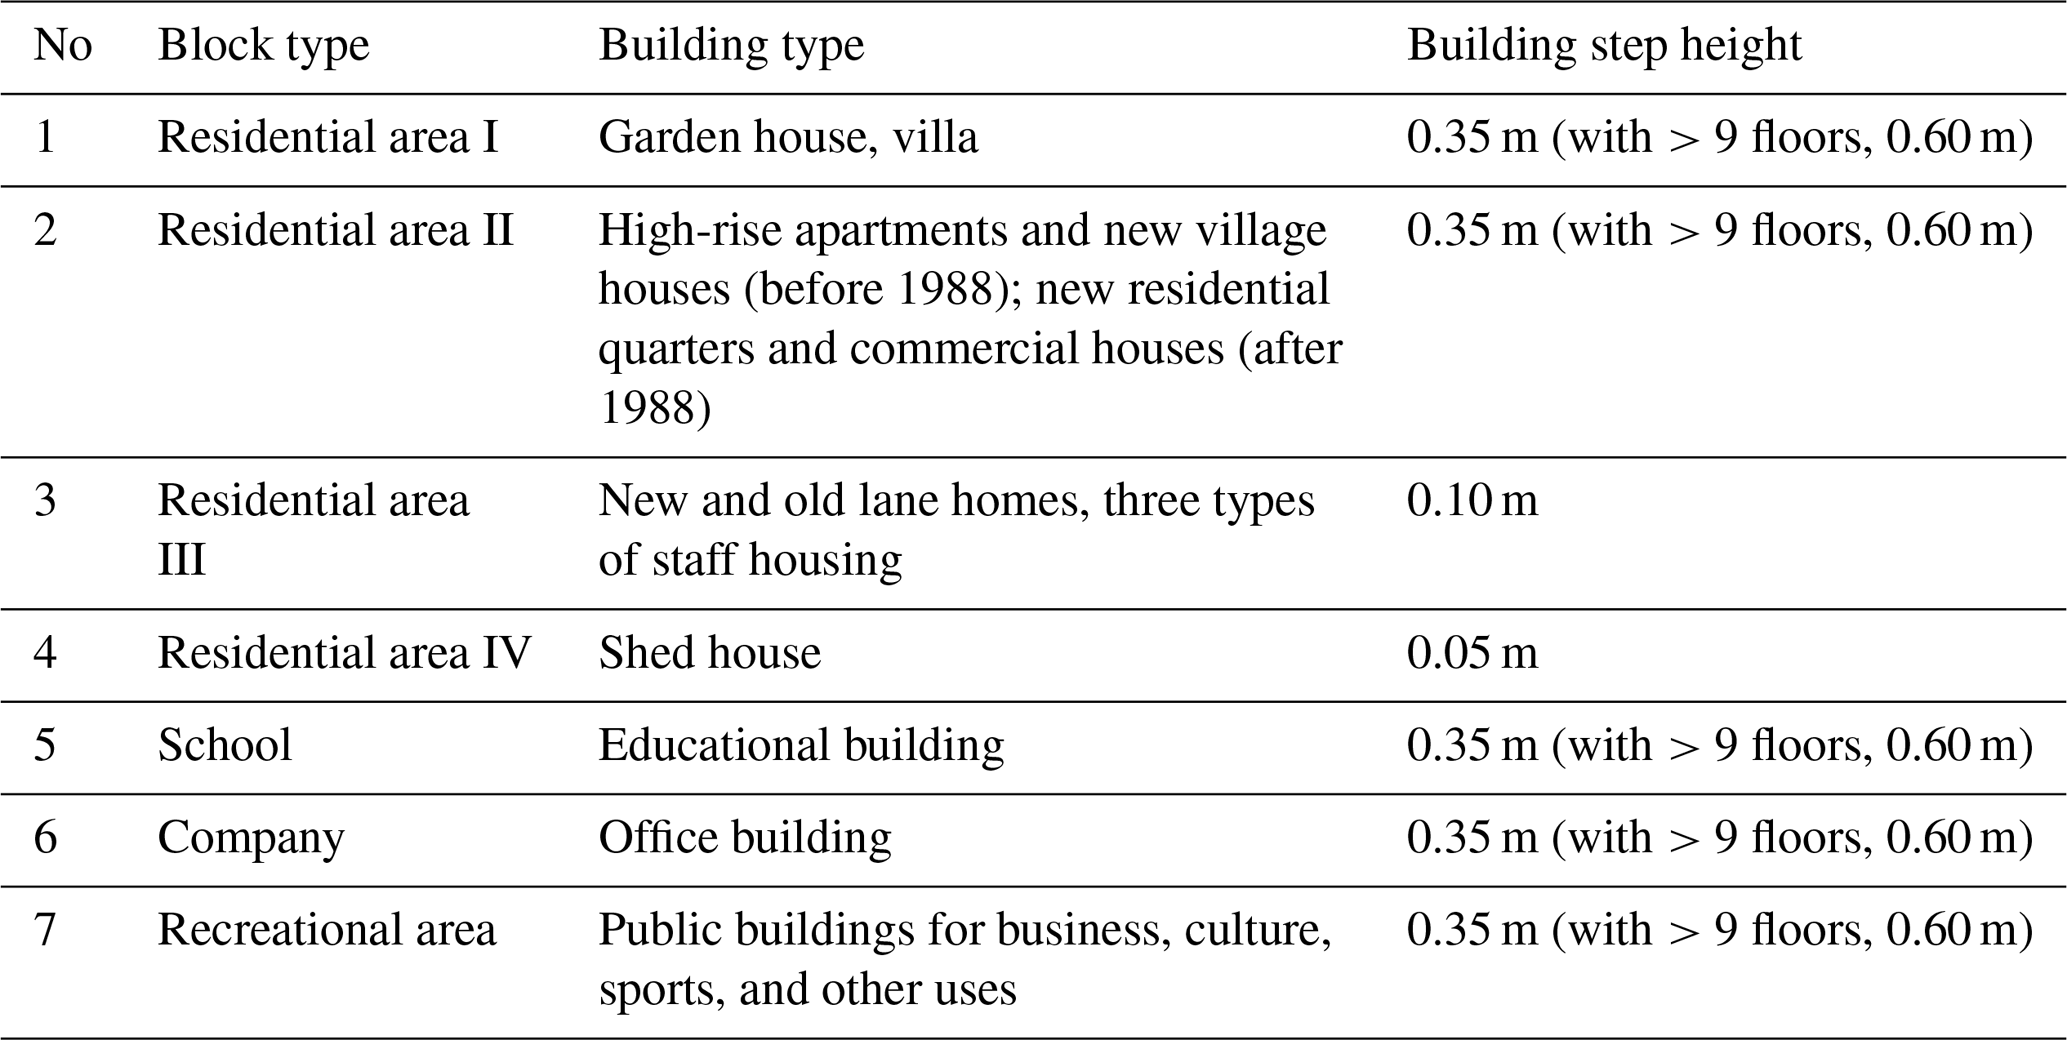
Since building steps (thresholds) exert a blocking effect on shallow flooding, they are likely to reduce the degree of flooding by restricting the flood water to the outside of the building, thereby reducing the exposure of the building. Therefore, this study assigned building step height to corresponding block types according to the architectural design standards of China and the actual conditions of the study area (Table 5). Therefore, the exposure of the building was determined according to the depth of the flood and the height of the building steps. The depth of the water entering the building was the difference between the depth of the flood and the height of the steps.
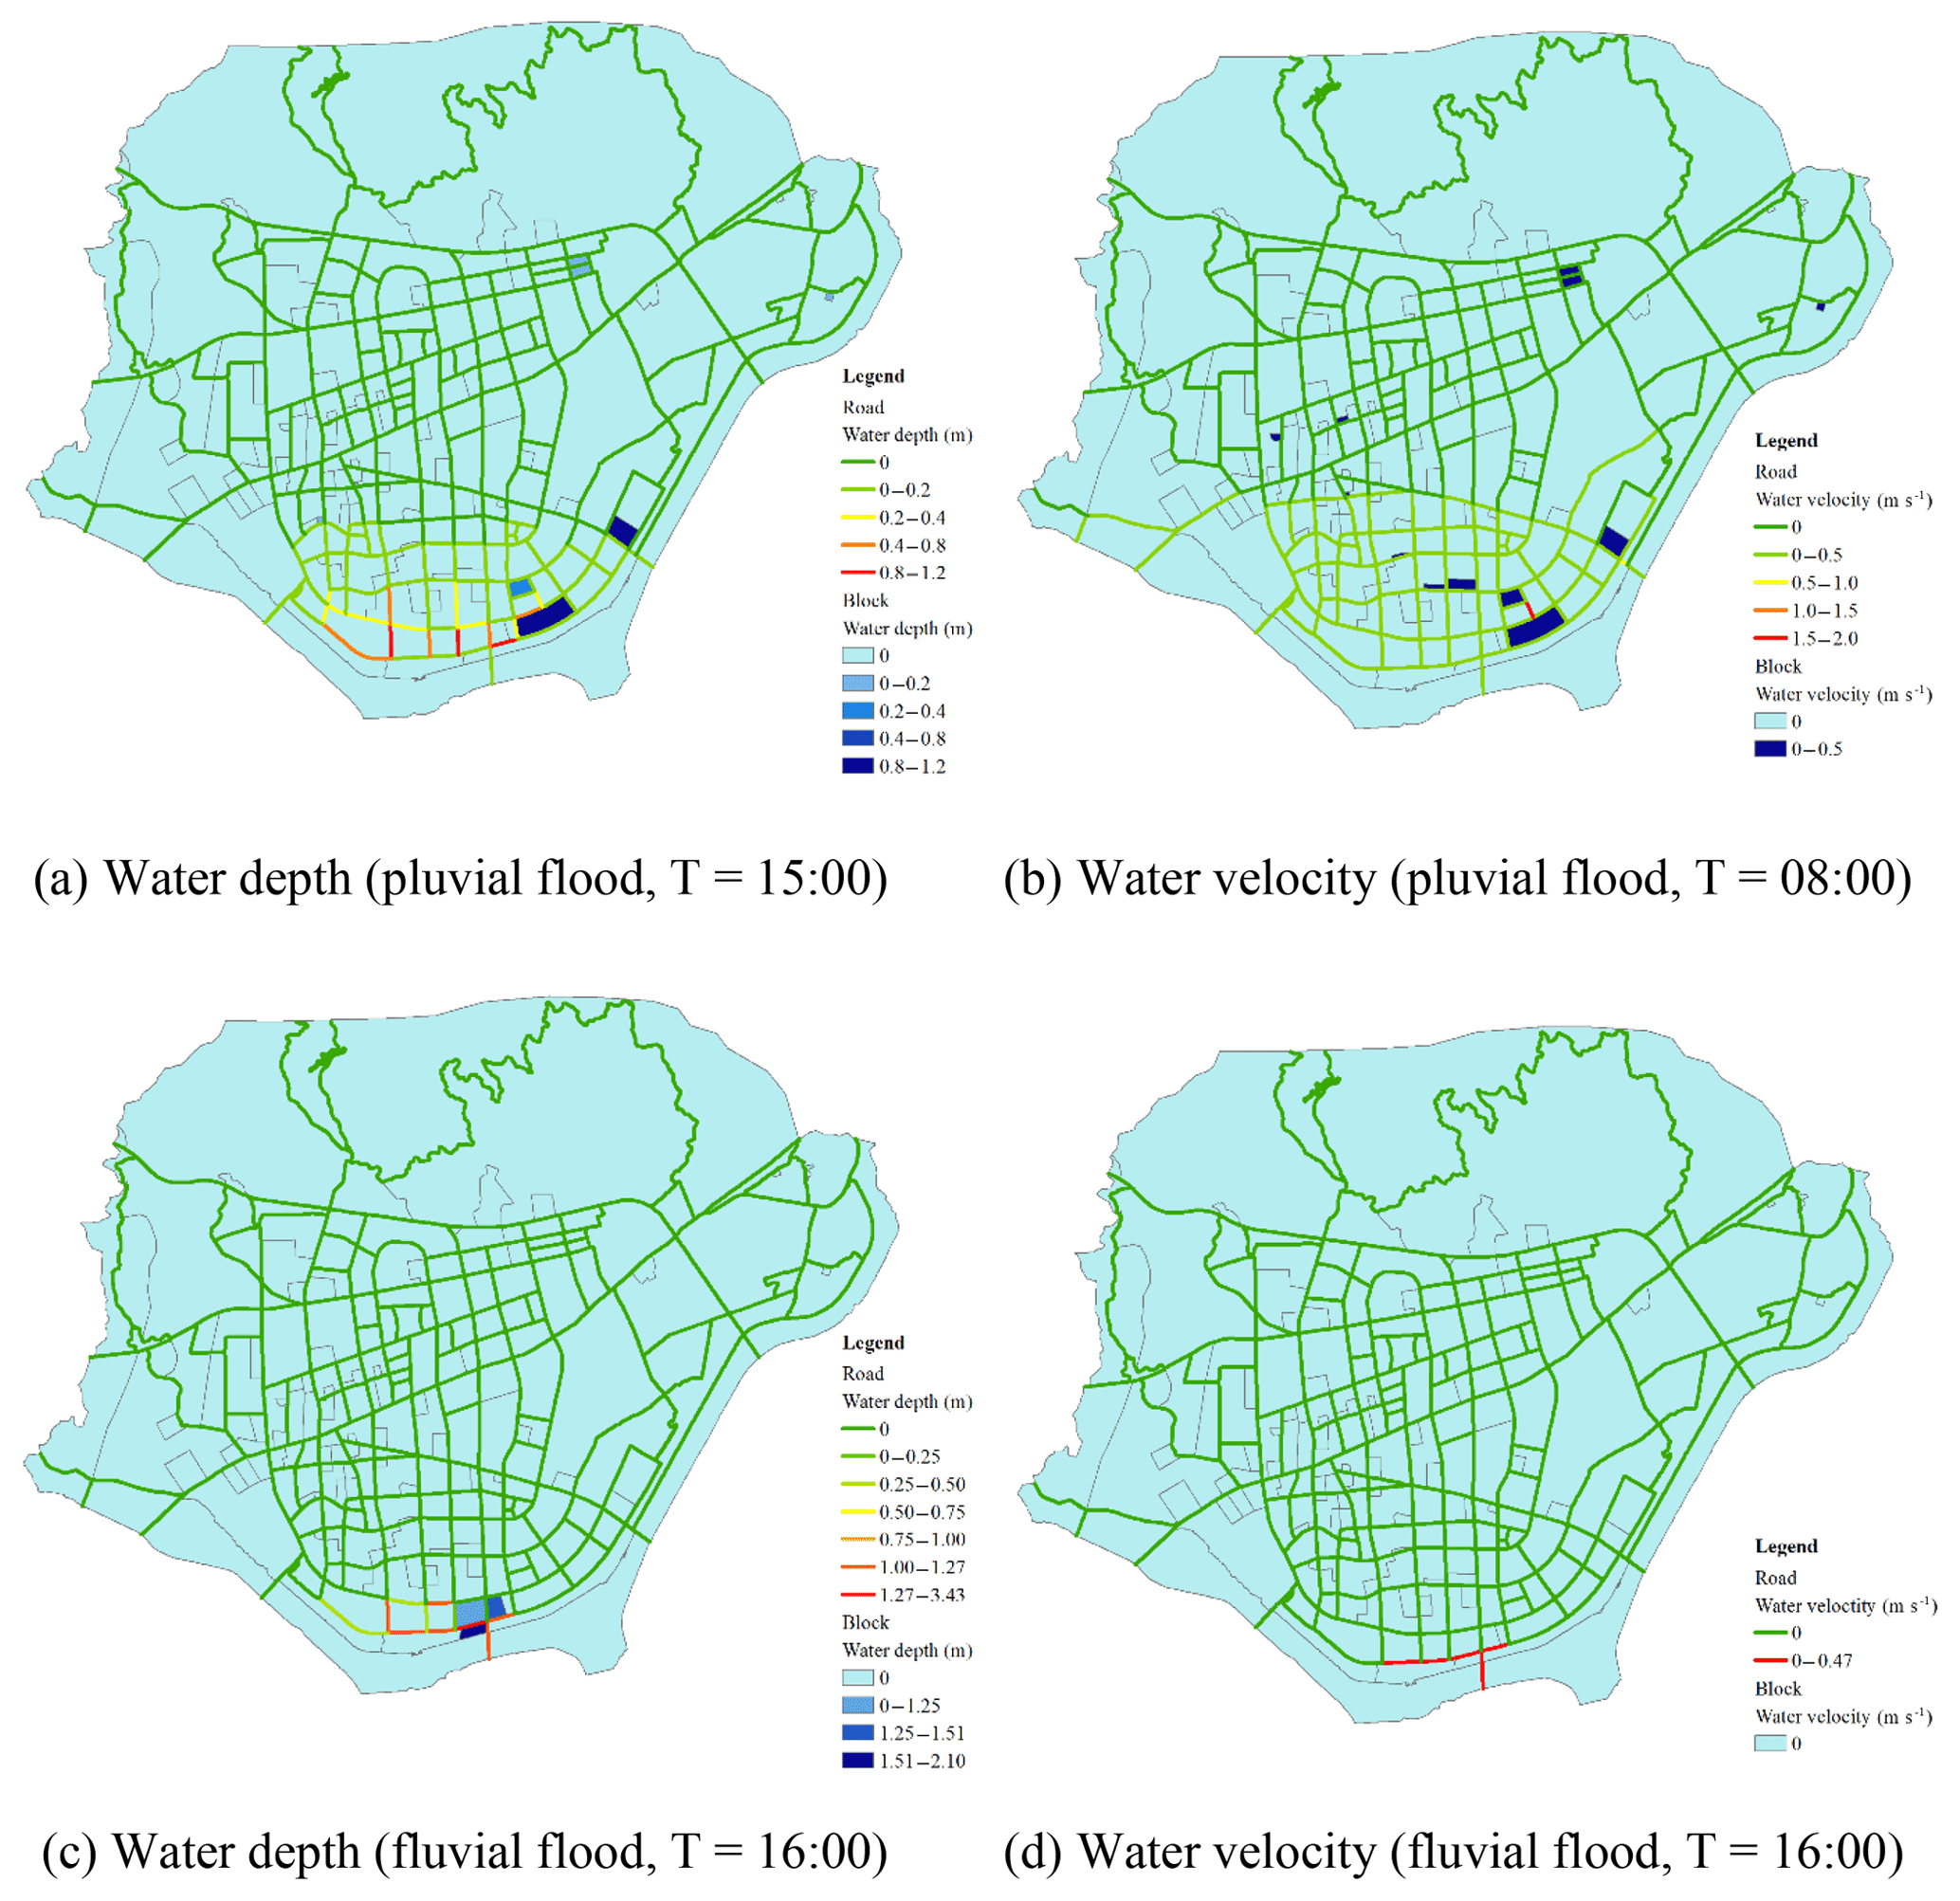
Figure 9Map of accumulated water depths and velocities. T means time here.
4.1 Flood simulation
The temporal resolution of flood simulation results was unified with other output results for half an hour. Figure 9 indicates the accumulated water depths and velocities of pluvial and fluvial floods in the study area. As is evident, the pluvial and fluvial floods had significant impacts, and the urban area near the Oujiang River was the most severely flooded. Additionally, water also accumulated in the inner areas of the city, mainly on roads, in the case of pluvial flood disasters. The variations in water depth and velocity for seven severely flooded areas (including blocks and roads) are presented in Fig. 10. Evident spatiotemporal variations in flooding were observed and water depth was the major factor affecting the total urban exposure to flooding in Lishui.
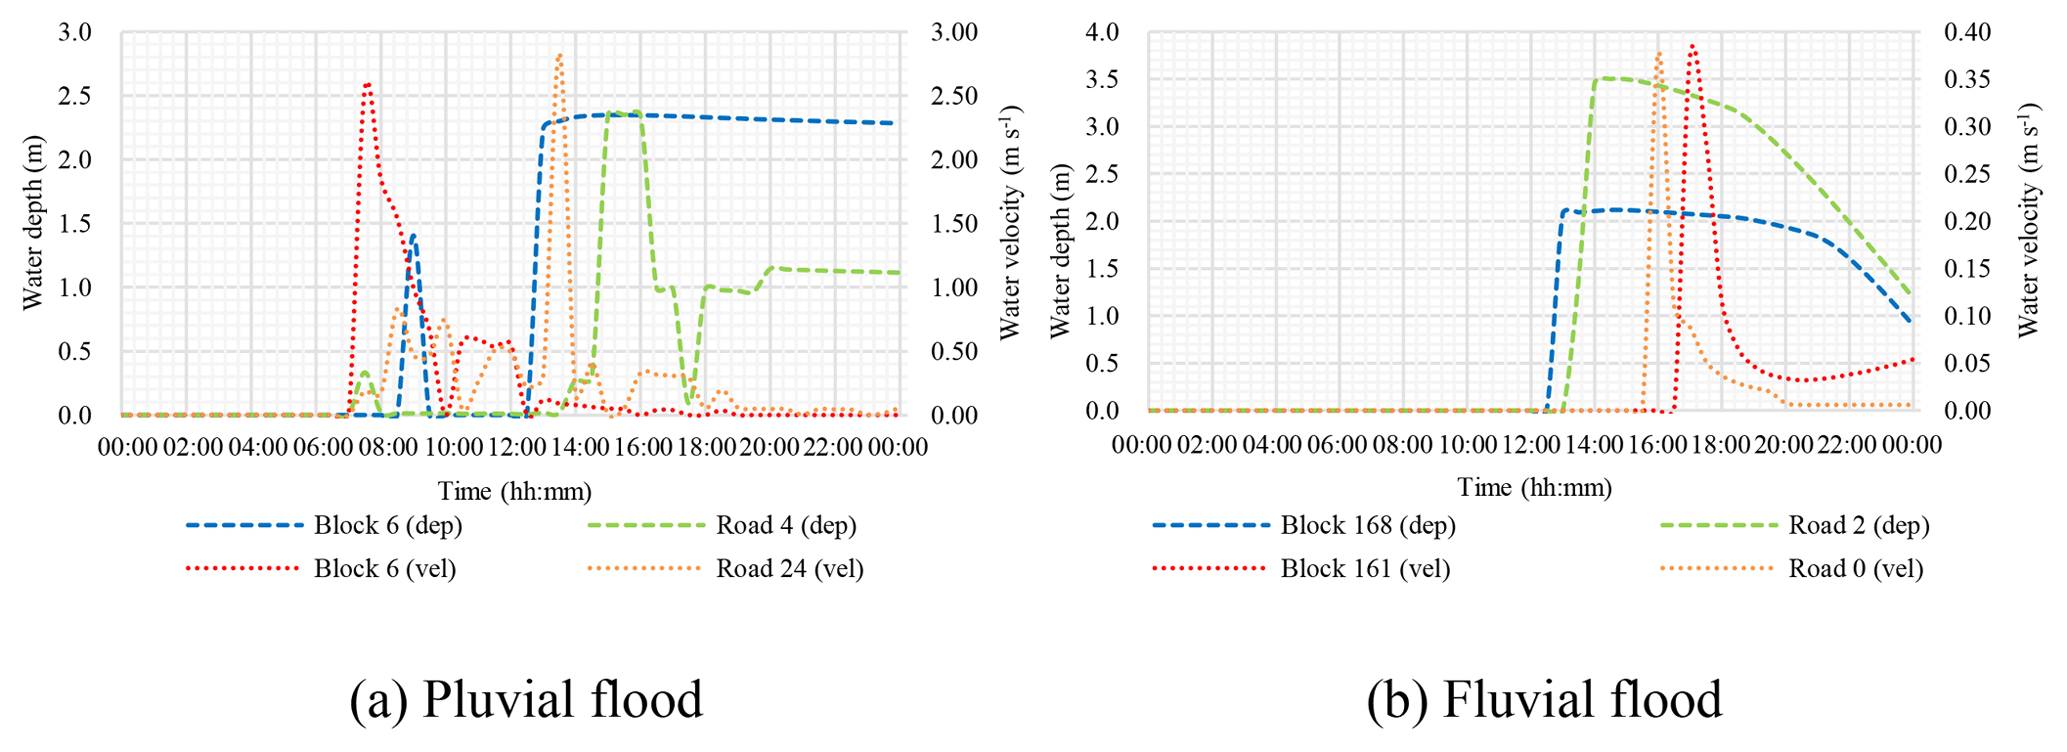
Figure 10Changes in the surface water depths and velocities for eight severely flooded areas. The “dep” indicates water depth, and “vel” indicates water velocity.
The flood simulation results were indirectly validated by actual water accumulation points. During the once-in-50-years flood in 2014, the city had 10 flooded roads and 18 water accumulation points. The actual hydrological points selected according to the study area and the urban flooding results simulated by the prototype system are indicated in Fig. 11.
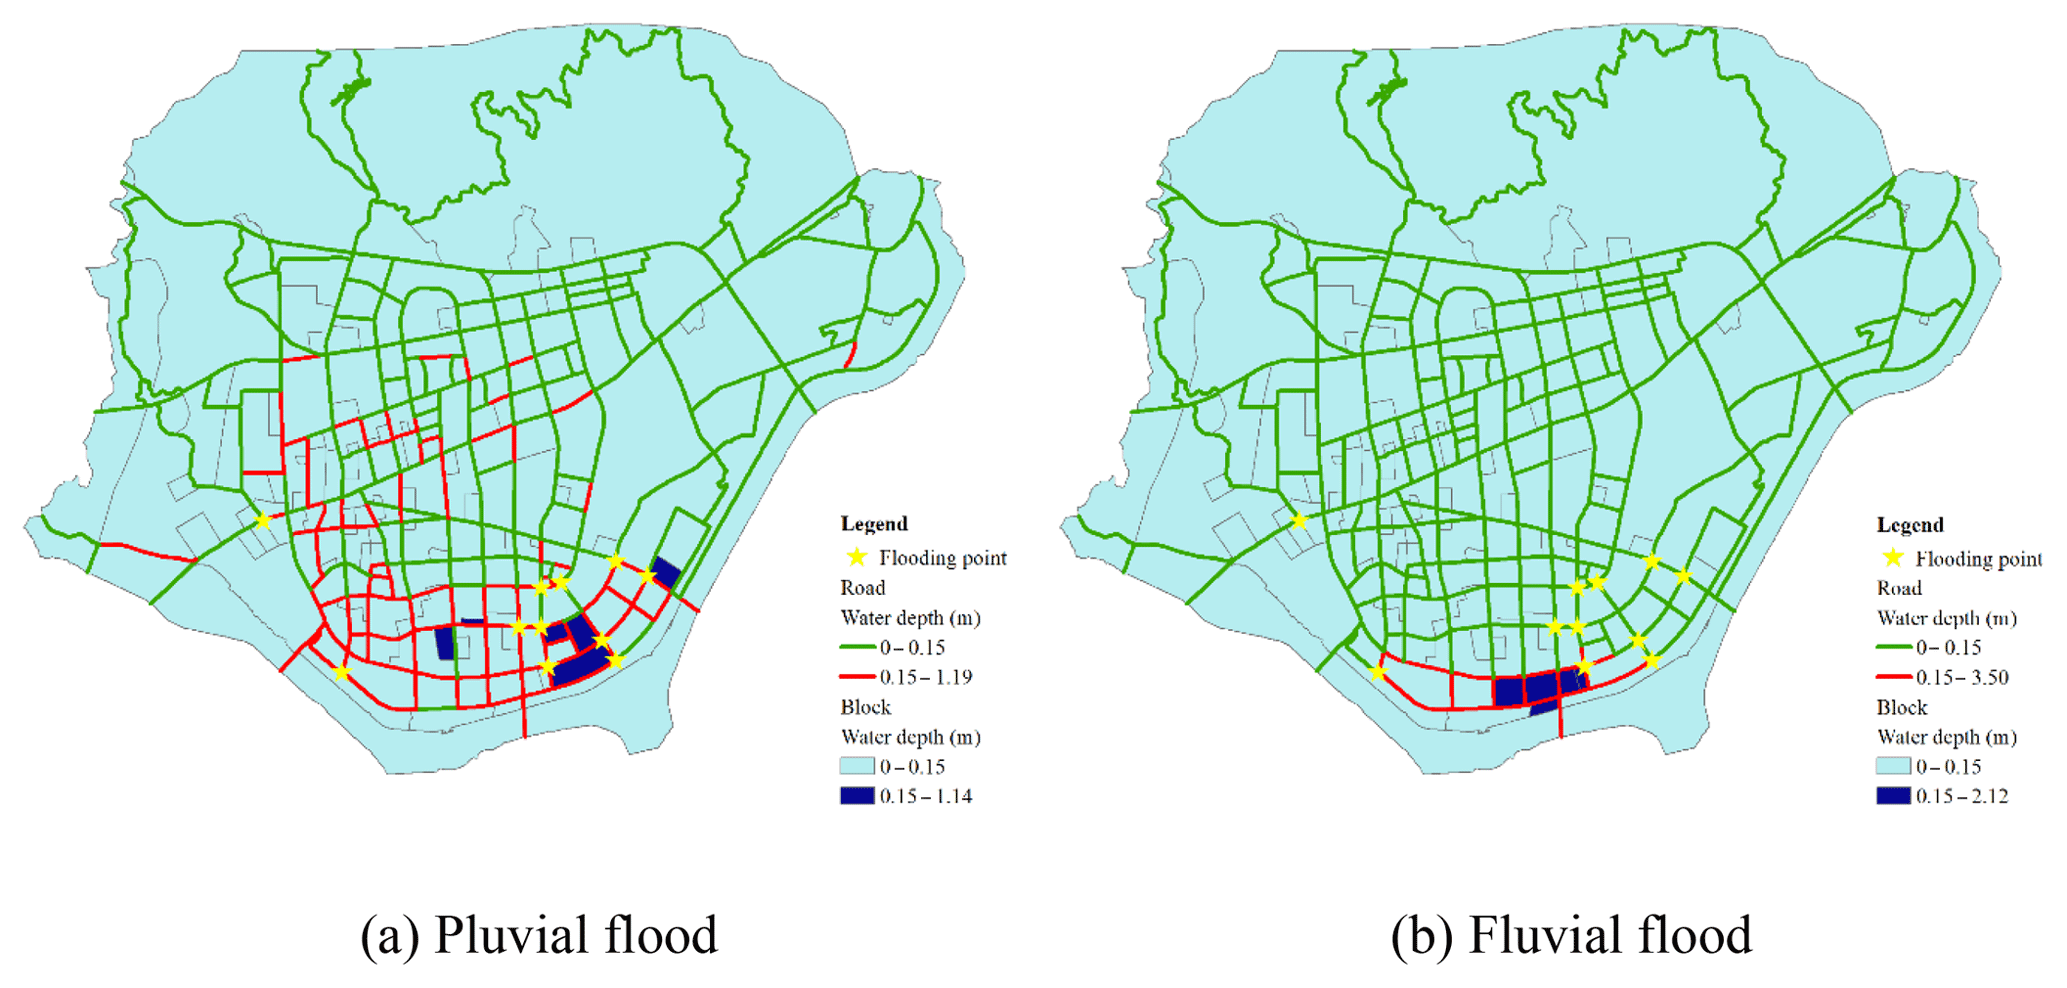
Figure 11Map of the flooded area indicating the flooding simulation and the real flood in 2014. The information for the flooded area was provided by Lishui City Housing and Urban-Rural Construction Bureau.
To avoid overlapping with the simulated water accumulation results for roads, the actual flooding points in the figure only included road junctions, and the entirety of Gucheng Road (Lutang Street to Dayou Street section) and Liyang Street (which connected the senior middle school to the Sanyan Temple section) was represented by corresponding intersection points. Figure 11 indicates that both the simulation results and the actual water accumulation points were mainly distributed along the river. The simulated water accumulation area (Fig. 11a) included roads in the center of the city and was larger than the actual flooding area. This difference could be attributed to different definitions of “water accumulation”. The simulation results presented in Fig. 11 included all areas where the accumulated water depth during the flooding period was greater than 15 cm. The actual water accumulation point was defined as one experiencing rainfall greater than 50 mm over a 24 h period. Additionally, it was characterized by the water accumulation depth of the road reaching 15 cm (the meteorological department issued a blue rainstorm warning at this level), the water withdrawal time reaching 1 h, and the water accumulation scope value being greater than 50 m2. Certain gaps existed between the observational data and the actual river discharge, since the observation station was far from the study area. Hence, the results indicated that the simulated water accumulation area during the fluvial flood (Fig. 11b) was smaller than that of the actual situation.
4.2 Simulation of the spatiotemporal distribution of population
The spatial and temporal resolutions of the modeling results could be adapted to the study area. The area of the minimum block was 2731.64 m2. The temporal resolution of the results was half an hour, which could be set to 10 min or even 1 min according to the requirements. Additionally, no accurate traffic model was used to simulate agents' movements on roads for two reasons: (1) to improve efficiency and (2) because we did not pay attention to high temporal-resolution human movements (such as 1 min or 1 s), but only focused on the population distribution for a period of time, so the temporal resolution requirement of human activities was low.
The spatiotemporal population distribution was simulated based on six scenarios: (1) daily, weekday (S1, S7); (2) daily, weekend (S2, S8); (3) bad weather, weekday (S3, S9); (4) bad weather, weekend (S4, S10); (5) warning, weekday (S5, S11); (6) warning, weekend (S6, S12). Figure 12 indicates the population variation for blocks and roads for the six scenarios. Figure 12a indicates that, among the three weekend scenarios, the population in the playground (Block 77) changed more than the population in the company (Block 113). Figure 12b indicates that the population on the roads was volatile, and the morning peak hour during the weekend was delayed by an hour in comparison to that during the weekdays. The population distribution in the study area is shown in Fig. 13. The population was unevenly distributed and concentrated in recreational and residential areas over the weekend. However, the population distribution on weekdays was relatively uniform. The population distribution on weekends was more variable than that on weekdays and was more sensitive to floods. The concurrent population distribution for the six scenarios changed significantly during the weekend, while the distribution for weekdays changed little.
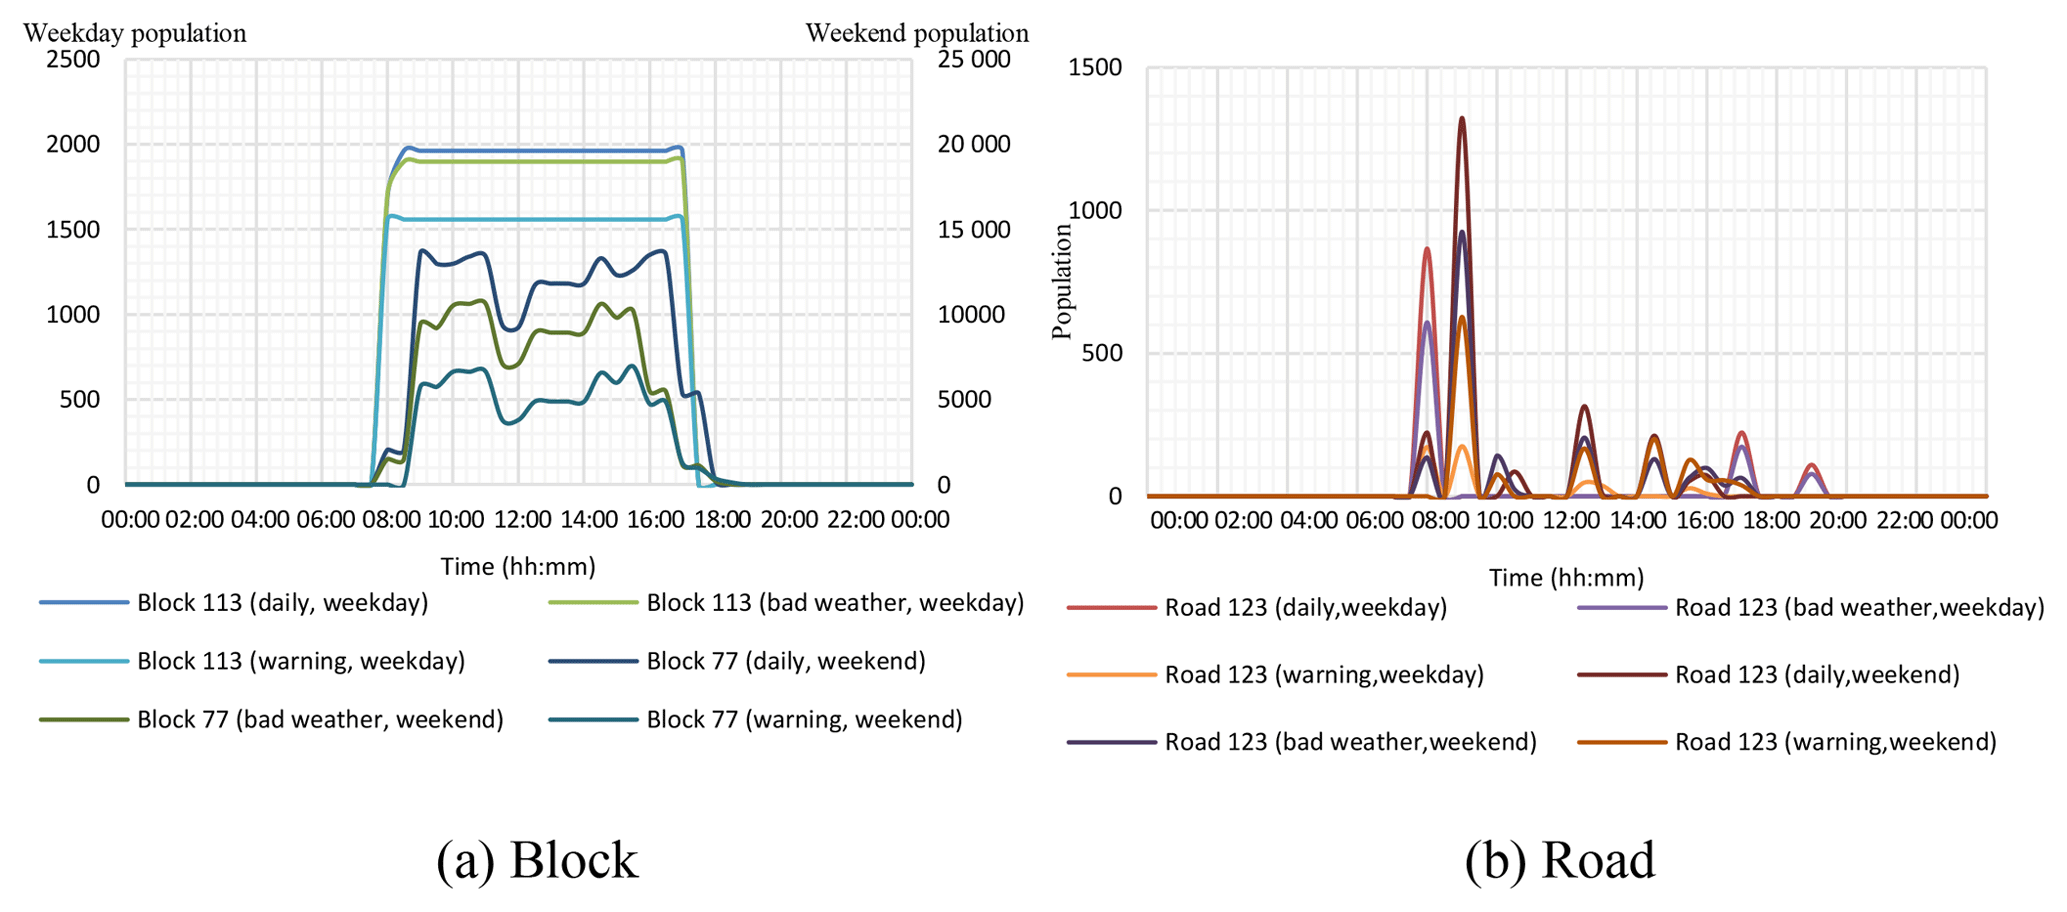
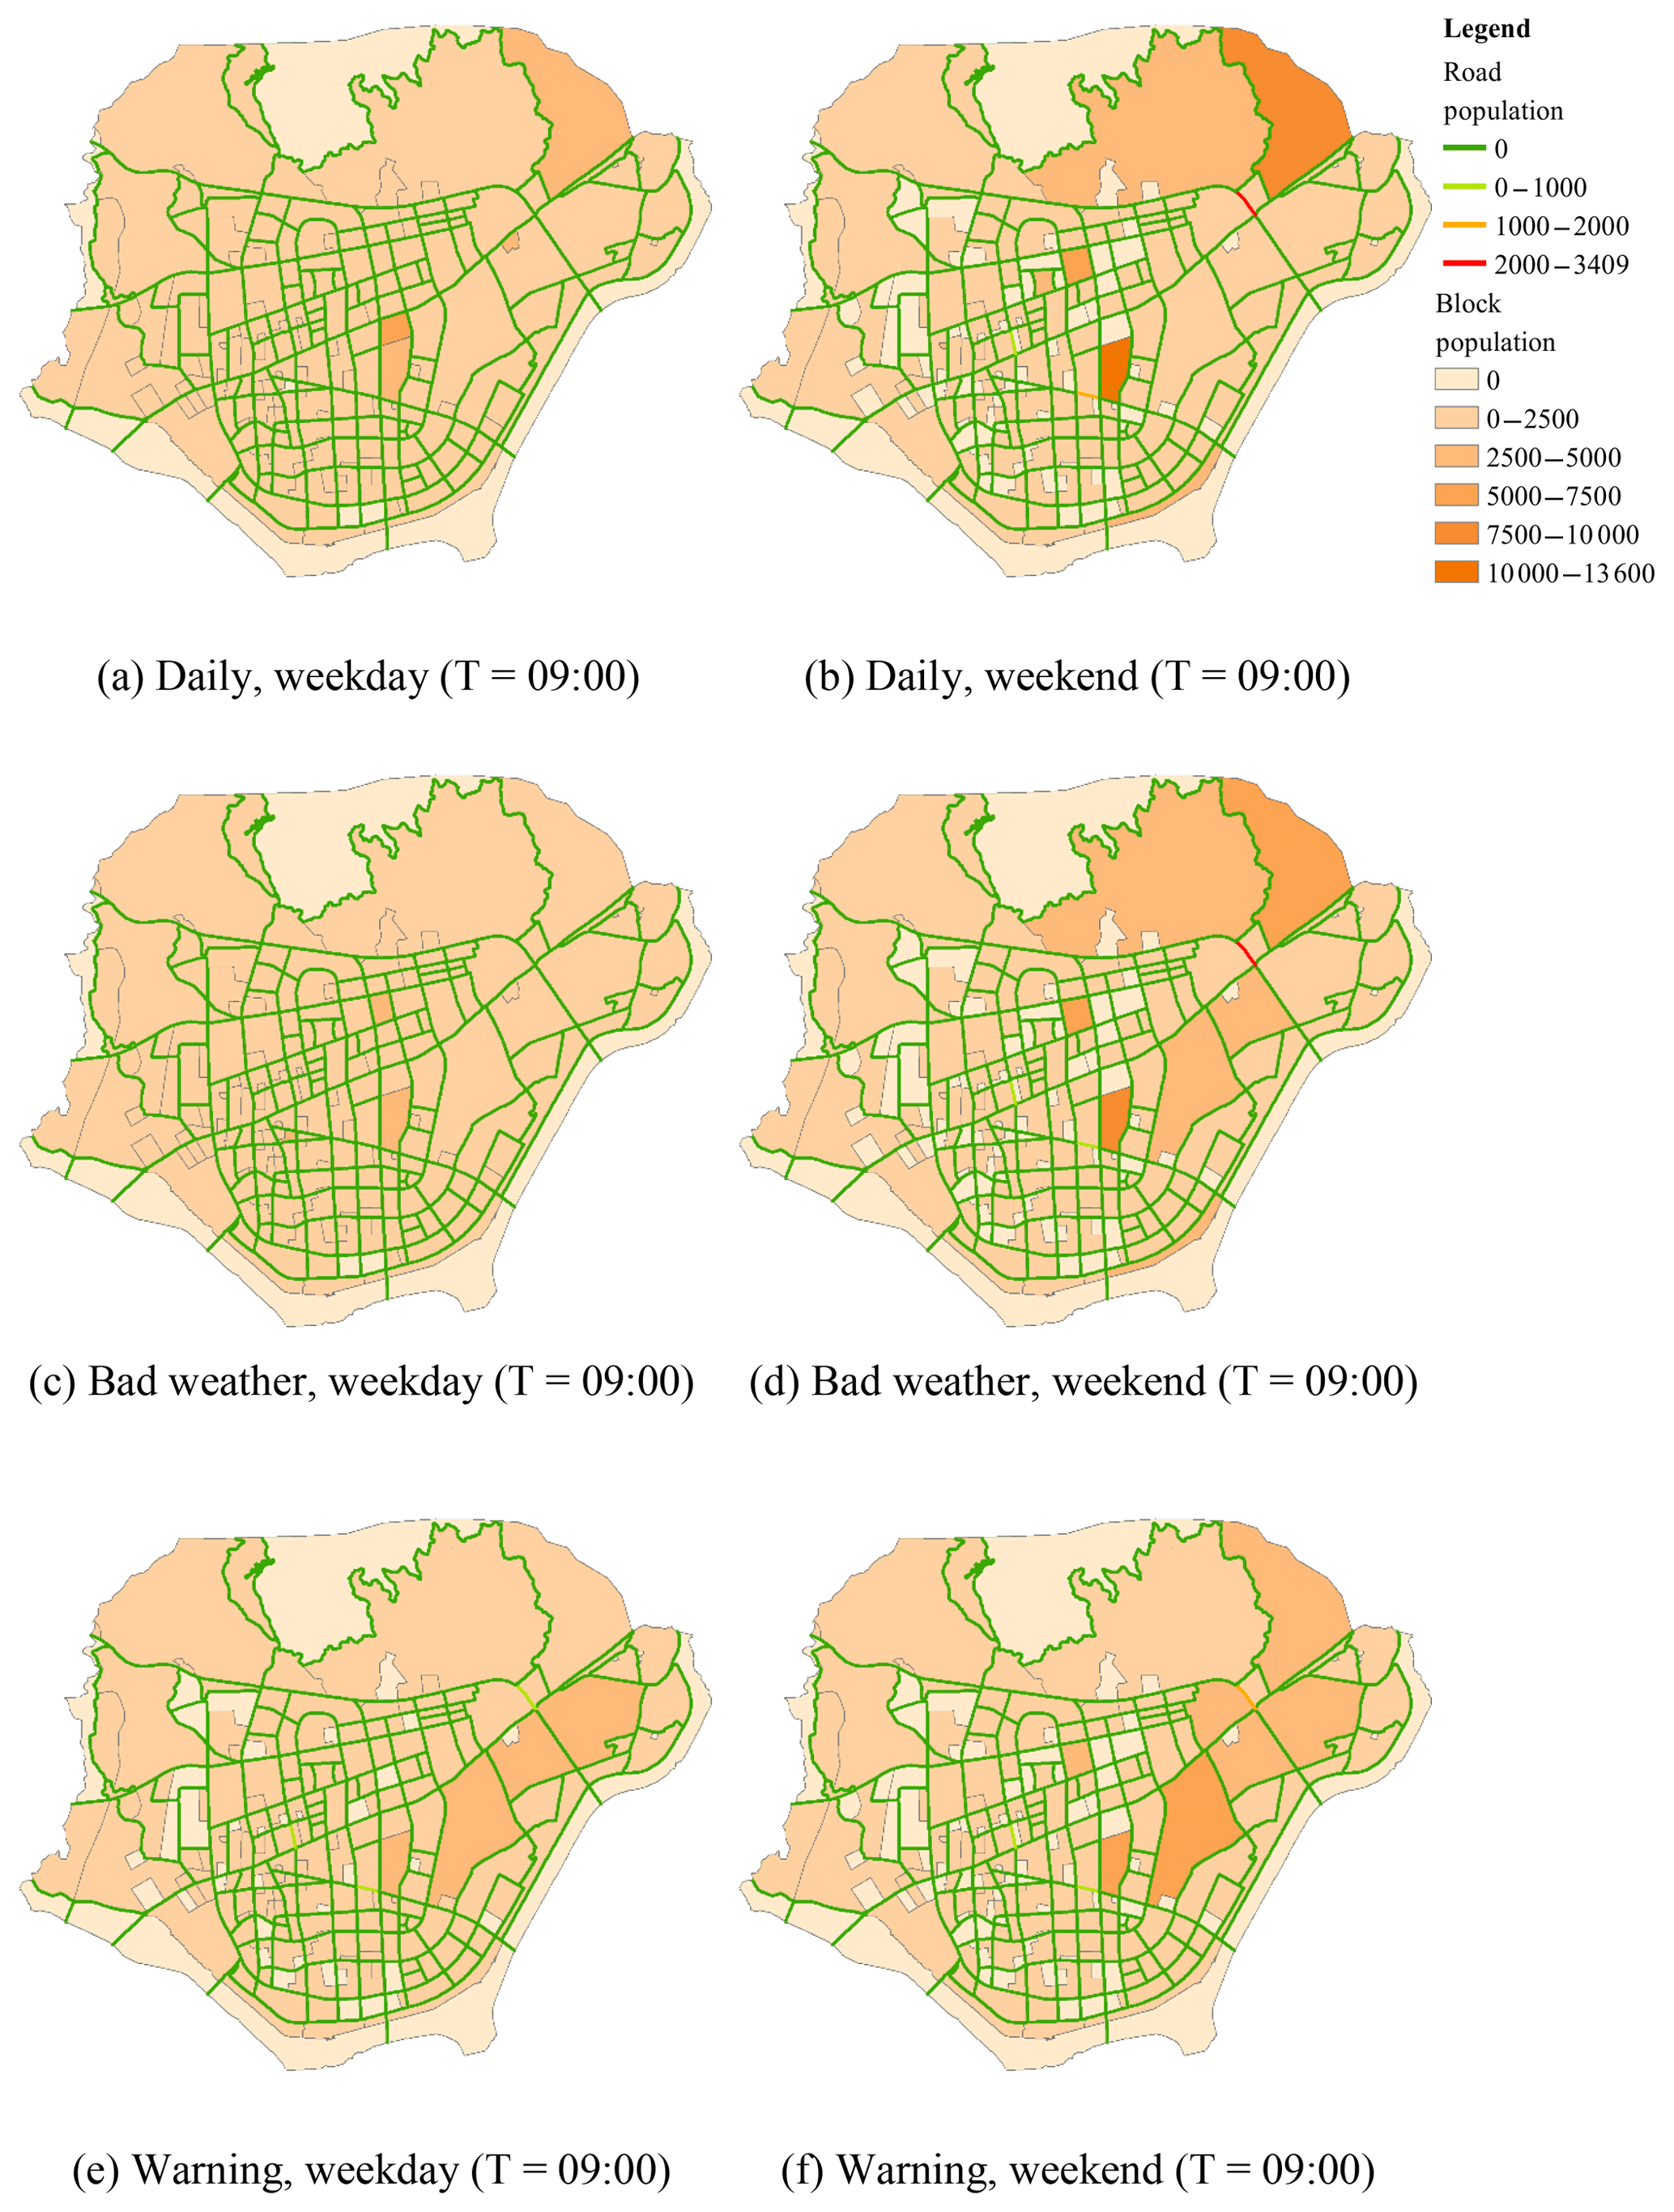
Figure 13Population distribution for the six scenarios. T means time here.
Figures 12 and 13 indicate that the population change patterns were different for different block types. The daily routines of most people started from the residential area (home) in the morning, followed by school or company blocks during weekdays and recreational areas during weekends, and, finally, concluded with a return to the residential area at night. During the occurrence of rainstorms or the reception of warning messages, different types of people reacted differently (continuing, postponing, or canceling the originally planned activities). Vulnerable people, such as the elderly, children, and the homeless, were more likely to cancel travel plans. Additionally, recreational activities were more likely to be canceled than were study and work activities.
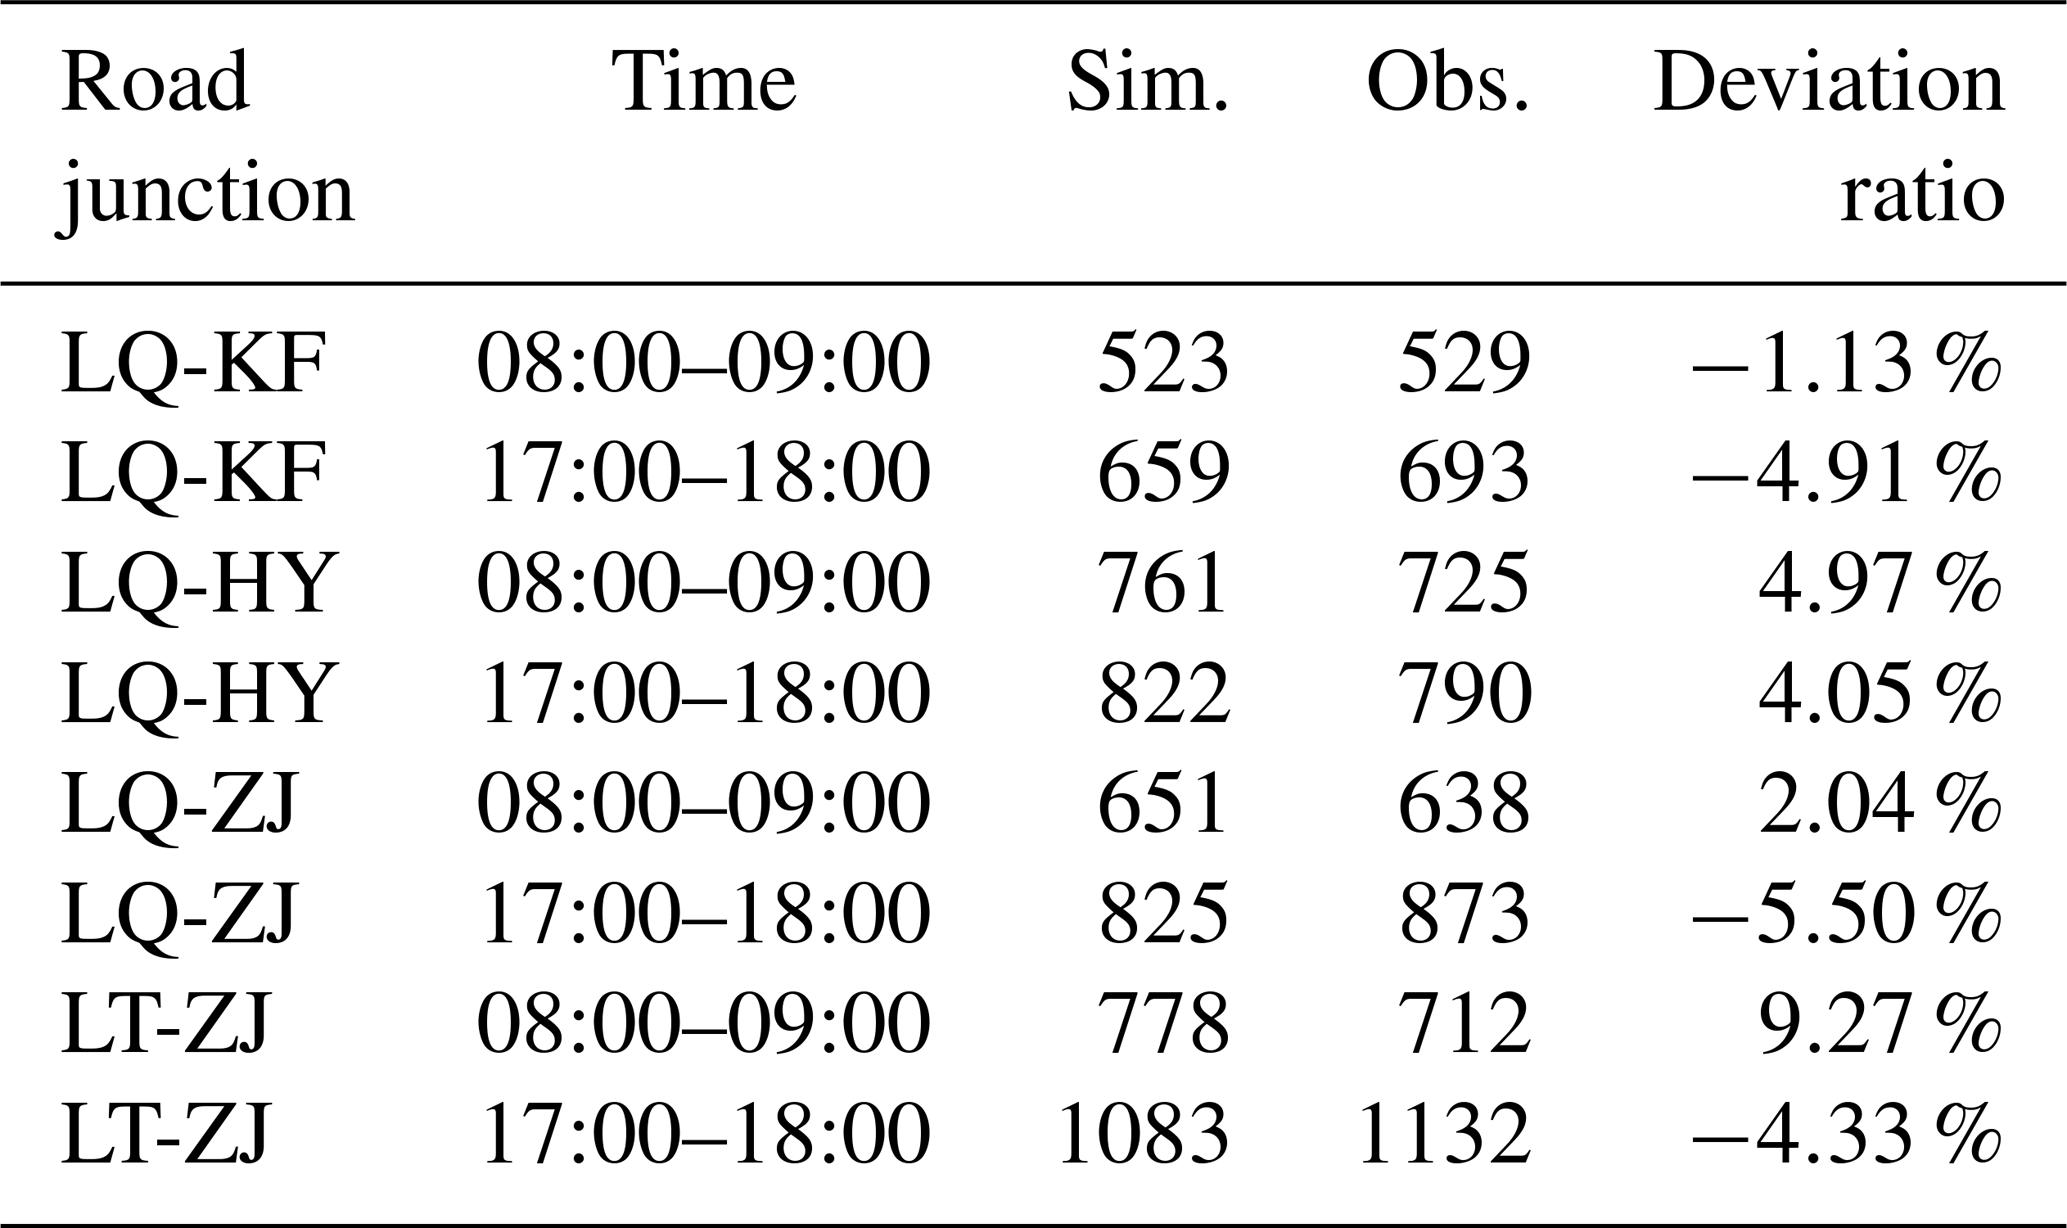
The reliability of the simulation of the spatiotemporal population distribution was indirectly verified by utilizing traffic flow data. Due to the lack of data for 2014, we used traffic flow data from 24 June to 7 July 2017. The simulated total number of residents passing the four intersections (such as the junction of the Liqing and Huayuan roads) and the actual measured traffic flow at the intersections during the morning and evening peak hours on weekdays and weekends are shown in Tables 6 and 7, where “Sim.” means simulation results, “Obs.” means measured values (multi-day average results), “LQ” is Liqing Road, “KF” is Kaifa Road, “HY” is Huayuan Road, “ZJ” is Zijin Road, and “LT” is Lutang Street. The deviation ratio was calculated as (Sim. − Obs.) ∕ Obs.
Table 6Traffic flow and population simulation results during peak hours on weekdays.
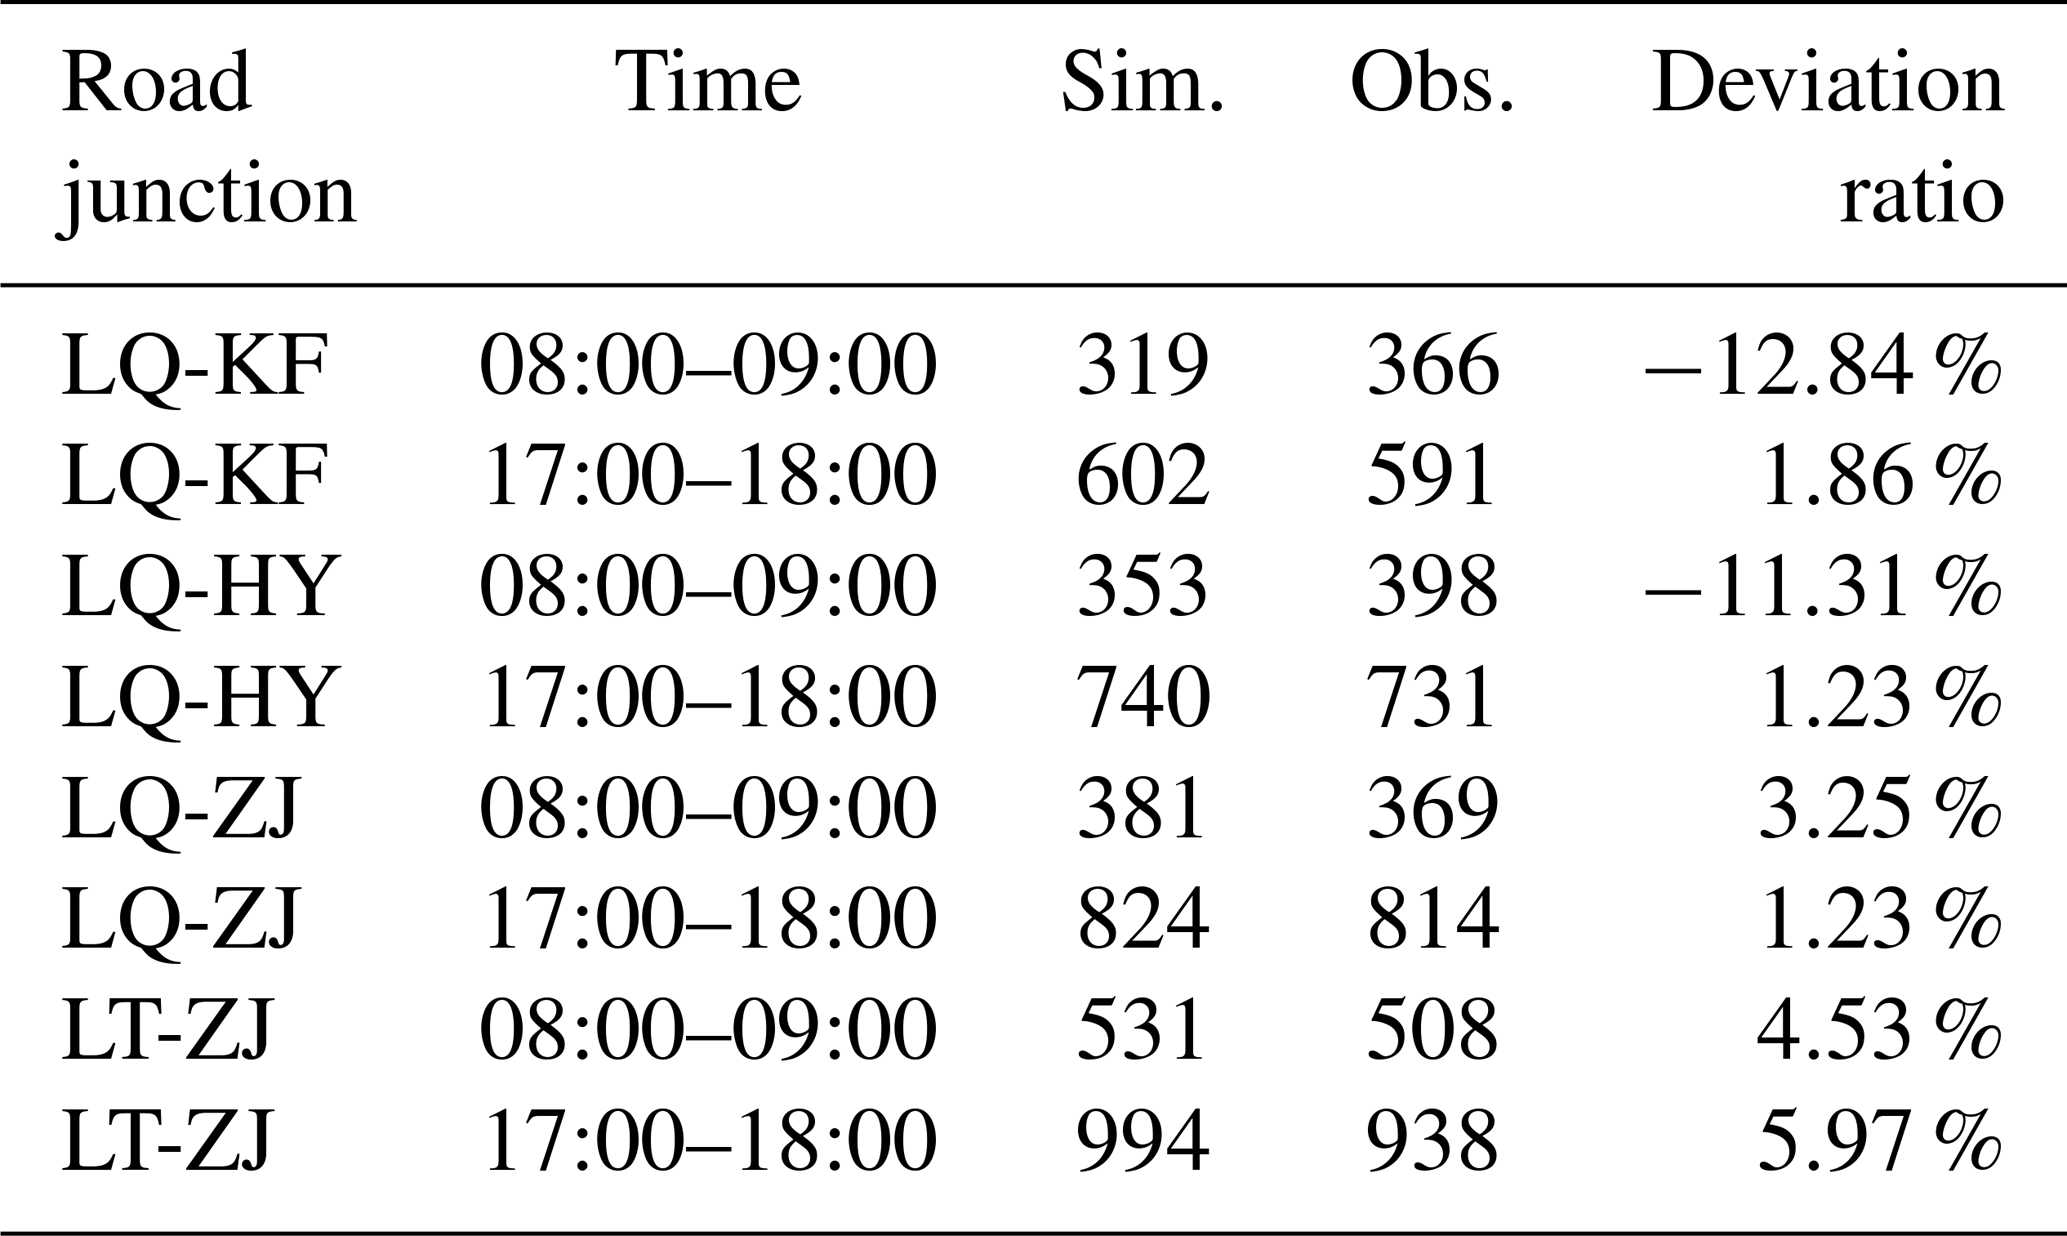
In theory, the simulated value should be much larger than the measured value, since the former indicates the number of people while the latter represents the number of cars and buses. However, as indicated in Tables 6 and 7, the simulated value was close to the measured value. This could be attributed to the assumption that the study area was closed and the simulated population was the number of permanent residents, excluding the migrant population. In reality, the number of migrants in the urban area during daytime is large owing to its geographical location. Moreover, this study simplified human activities when simulating the spatiotemporal distribution of the population. Therefore, the number of pedestrians on the road was small. However, there was a deviation ratio of about ±5 % between the simulated value and the measured value, except for three deviation ratios of about ±10 %. Therefore, the simulation method for the spatiotemporal distribution of population is feasible, and the results are reliable.
Table 7Traffic flow and population simulation results during peak hours on weekends.
4.3 Dynamic exposure assessment
Figure 14 presents the population exposure variation for two selected areas. The difference between pluvial and fluvial flood scenarios could be attributed to differences in the changes and degrees of water accumulation. Figure 14a indicates that population exposure was the highest for the daily scenario, followed by the bad weather scenario and minimum warning scenario. However, as indicated in Fig. 14b, the population was most exposed to both weekend and weekday warning scenarios. This is due to the assumption that the disaster response behavior adopted by residents was to reduce travel, i.e., the refuge of residents was the residential area. Additionally, the response was not based on the exposure of the residential area. Therefore, when residential areas, such as Block 6, were exposed to floods, the residents chose to reduce travel, thus resulting in an increase in the population of residential areas and consequently increasing the population exposure. Thus, if the government informs the residents of Block 6 in advance about the location of appropriate shelters, the exposed population will be effectively reduced. The method proposed in this study can also help determine vulnerable populations and road users in the exposed blocks.
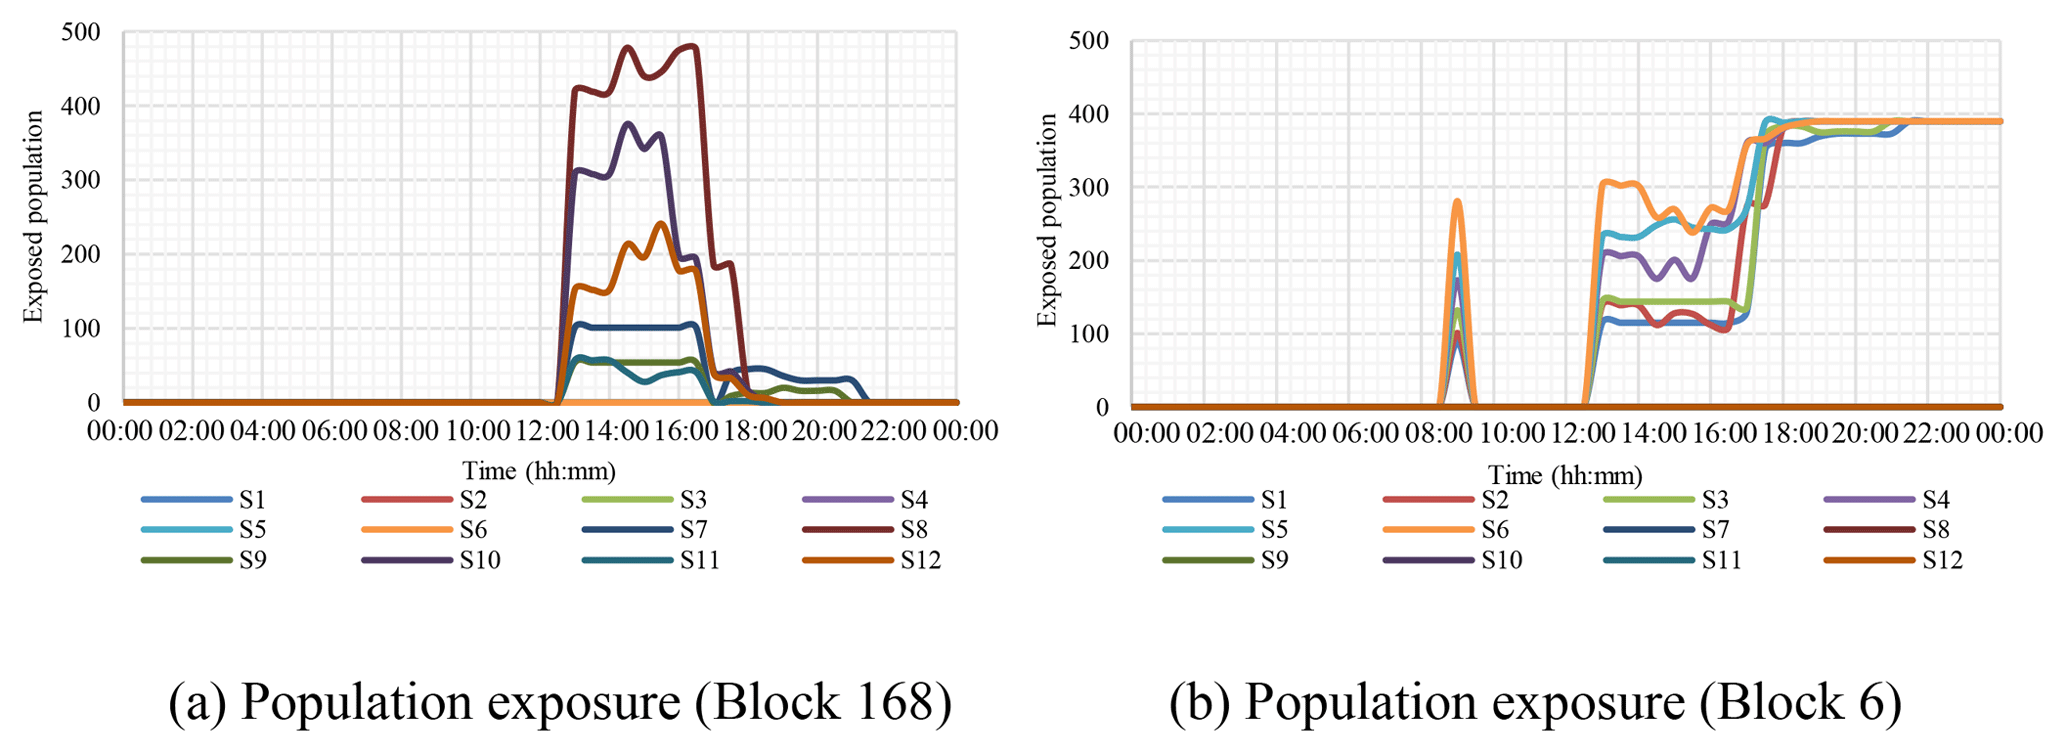
Figure 14Changes in the population exposure of two blocks for the 12 scenarios. Block 168 was a recreational area, and Block 6 was a residential area.
Figure 15 presents variations in the road and building exposures of two selected areas with serious flooding. The road and building exposures for the study area are presented in Fig. 16. It can be concluded that road and building exposures during pluvial and fluvial floods also varied with the flood depth. The urban area exposed to fluvial floods was concentrated along the river, while that exposed to pluvial floods was relatively dispersed and independent. Additionally, the exposed road length of the block fluctuated, while the buildings were either entirely exposed or not exposed. Furthermore, the area of the road affected by pluvial and fluvial floods was greater than that of the buildings. As indicated in Fig. 16, exposed buildings were present only in a few areas (3 blocks for pluvial flooding and 4 blocks for fluvial flooding), while roads were affected in several areas (19 blocks for pluvial flooding and 15 blocks for fluvial flooding). In addition, buildings were the least exposed due to high thresholds or the number of building steps designed and built in recent years, while roads and population were severely affected by floods.
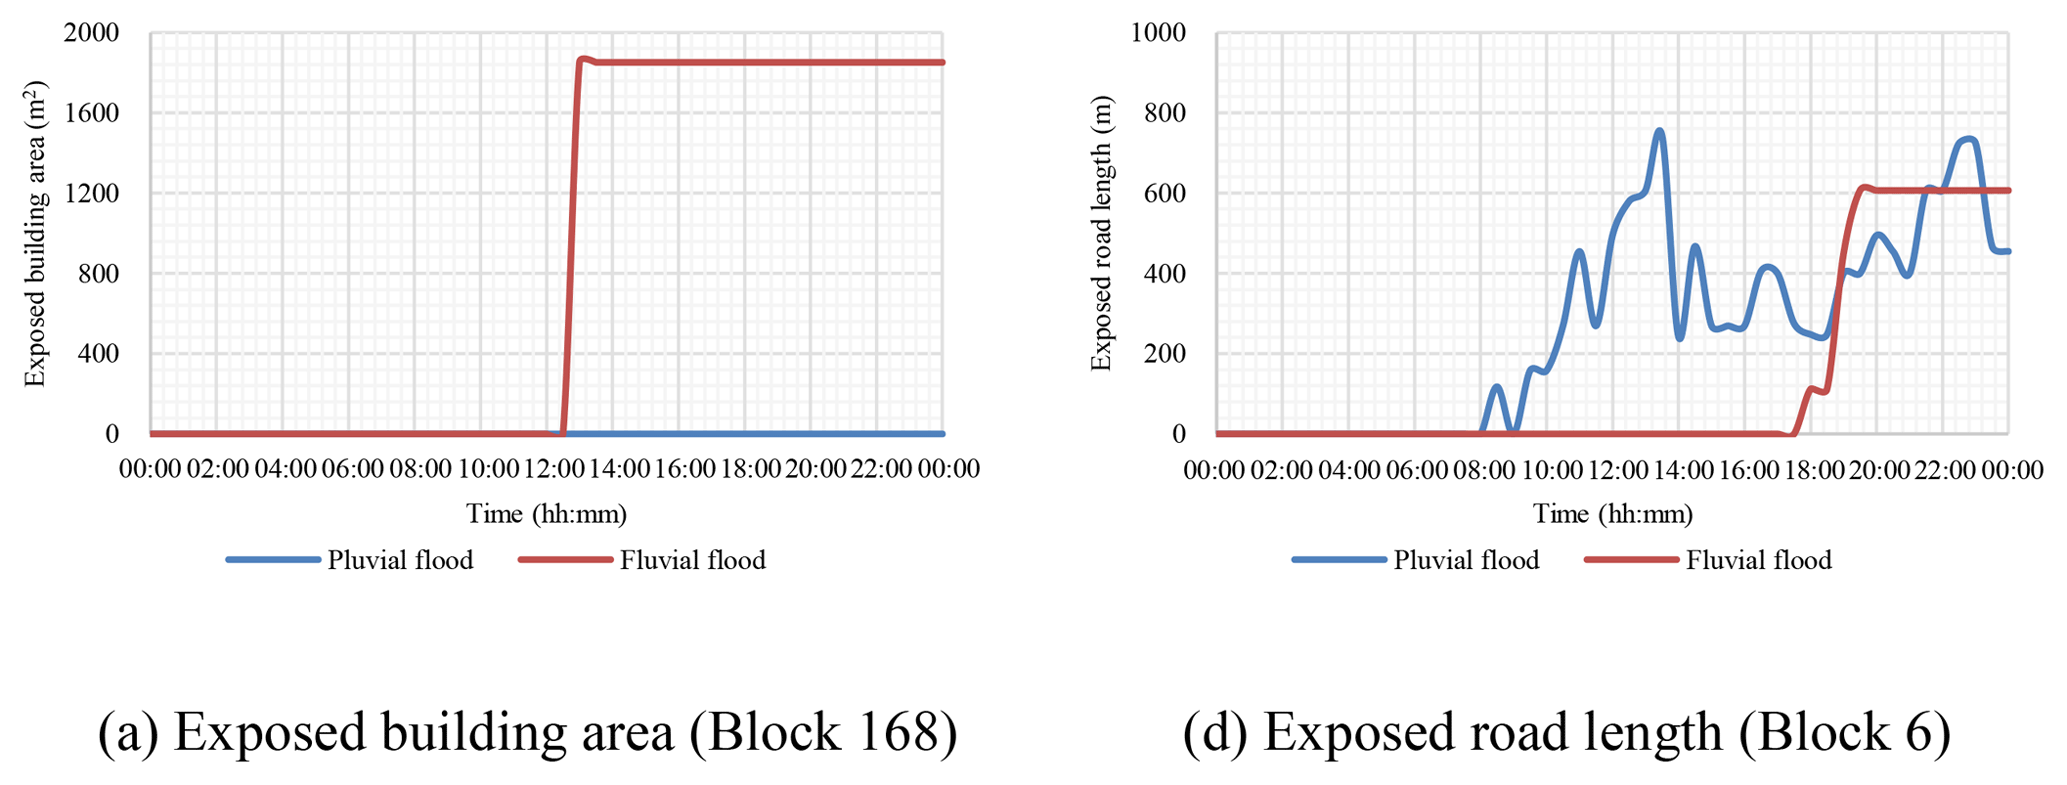
Figure 15Changes in road and building exposures in severely flooded blocks. The exposed road length and building area represent road and building exposures, respectively.

Figure 16Map of road and building exposures. T means time here.
Urban flooding considerably impacts the life of residents, in terms of both daily commuting and casualties. This study proposed a method for obtaining high-resolution dynamic exposure to urban flooding. First, the spatiotemporal distributions of pluvial and fluvial floods were simulated by the LISFLOOD-FP model. Second, the responses of residents to bad weather and government measures (warnings) were incorporated to develop an ABM to simulate residents' activities during flooding. Finally, urban exposure during different flood scenarios was comprehensively simulated and was based on the population and hydrological simulation results, road and building data, and the case study of the Lishui urban district.
The high-resolution dynamic exposure of population, roads, and buildings to flooding estimated using the proposed method can play a significant role in assessing hazard risk and loss, thus supporting government efforts toward disaster risk management. As flood exposure constantly changes over short periods of time, such simulations allow the government to reasonably formulate emergency plans to minimize casualties and property losses while providing effective reference information for residents.
This study had four major findings. First, water depth was the major factor affecting total urban exposure to flooding in Lishui. Second, the population distribution on weekends was more variable than that on weekdays and was more sensitive to floods. Third, urban areas exposed to fluvial floods were concentrated along the river, while those to pluvial floods were relatively dispersed and independent. Roads had more blocks exposed to fluvial floods (8 %) than pluvial floods (6 %). Fourth, staying home was not the best individual choice, so residents' response behavior based on their subjective consciousness may result in increased overall exposure. This suggests that simple governmental alerts relating to the occurrence of urban flooding are insufficient for reducing urban exposure to flood hazards.
It should be noted that there is no comprehensive way to verify the proposed method because parameters of human behavior and psychological processes are difficult (or, to some extent, impossible) to obtain. In this study, the proposed method was verified indirectly. The actual traffic information for each road intersection was collected and compared with the simulated population results. Additionally, the information for actual water accumulation points was compared with the simulated water accumulation results.
However, a few limitations persist. For instance, considerable uncertainties regarding the use and design of the ABM exist. These include differences in the responses of residents of the same type to disasters in the same scenario. Therefore, based on the survey data, we designed simplified activity patterns, which are consistent with the actual situation of the study area. Moreover, simplification of the behavior patterns and disaster responses of residents is inevitable, resulting in differences between the simulation results and reality.
Based on the analysis of the indirect validation results, we also found several problems. Since the migrant population and the exchange between the city and the outside were not considered, the simulated road population was small, so we needed to use real-time traffic data (such as taxi trajectories and card data from public transportation) to calibrate activity patterns to obtain more realistic population distribution results. Moreover, the actual water accumulation point information cannot be completely consistent with the simulation result because of its definition; therefore the simulation result can only be roughly verified. We need more abundant and accurate historical hazard data to fine-tune the flood simulation results. Our study focused more on the explorative method, while the result is just an application case. Due to the limitation of the study area and data, the current results are quite general in an early stage. The method proposed also has many areas in need of improvements, such as the design of ABM. Therefore, future studies should focus on optimizing the proposed method and practical case studies, which may produce more informative results.
The geography, hydrological observation, water accumulation points and traffic flow data in Lishui city were provided by Lishui City Housing and Urban-Rural Construction Bureau, Liandu Hydrological Station, and Lishui City Transportation Bureau, respectively. These data are not publicly available because of governmental restrictions. The 1 km grid population data are available online at http://www.geodata.cn (National Earth System Science Data Sharing Infrastructure and National Science & Technology Infrastructure of China, 2010). The population profiles are available online at http://tjj.lishui.gov.cn (Lishui Municipal Statistics Bureau and Survey Office of the National Bureau of Statistics of China in Lishui, 2014). Data provided by the local government and other model-simulated data in this paper are available from the authors upon request (zhuxuehong816@163.com).
The supplement related to this article is available online at: https://doi.org/10.5194/hess-23-3353-2019-supplement.
XZ and QD were responsible for setting up the experiments, completing most of the experiments, and writing the paper. DH and SLZ principally conceived the idea and design of the study and provided financial support. LZ performed the flood simulation. SNZ was responsible for the development of the model.
The authors declare that they have no conflict of interest.
This study was supported by the National Key R & D Program of China (nos. 2018YFB0505500, 2018YFB0505502) and National Natural Science Foundation of China (nos. 41771424, 41871299, 41631175). Dawei Han and Lu Zhuo were supported by Newton Fund via Natural Environment Research Council (NERC) and Economic and Social Research Council (ESRC) (NE/N012143/1).
This research has been supported by the National Key R & D Program of China (grant nos. 2018YFB0505500 and 2018YFB0505502), the National Natural Science Foundation of China (grant nos. 41771424, 41871299 and 41631175), and the Newton Fund via Natural Environment Research Council (NERC) and the Economic and Social Research Council (ESRC) (grant no. NE/N012143/1).
This paper was edited by Xing Yuan and reviewed by three anonymous referees.
Abt, S., Wittier, R., Taylor, A., and Love, D.: Human Stability In A High Flood Hazard Zone, J. Am. Water Resour. Assoc., 25, 881–890, https://doi.org/10.1111/j.1752-1688.1989.tb05404.x, 1989.
Bates, P. D. and De Roo, A. P. J.: A simple raster-based model for flood inundation simulation, J. Hydrol., 236, 54–77, https://doi.org/10.1016/S0022-1694(00)00278-X, 2000.
Bates, P., Trigg, M., Neal, J., and Dabrowa, A.: LISFLOOD-FP User manual, Code release 5.9.6, School of Geographical Sciences, University of Bristol, Bristol, UK, available at: https://www.bristol.ac.uk/media-library/sites/geography/migrated/documents/lisflood-manual-v5.9.6.pdf (last access: March 2019), 2013.
Bekhor, S., Ben-Akiva, M. E., and Ramming, M. S.: Evaluation of choice set generation algorithms for route choice models, Ann. Operat. Res., 144, 235–247, https://doi.org/10.1007/s10479-006-0009-8, 2006.
Brunner, G. W.: HEC-RAS River Analysis System User's Manual Version 4.0, Report CPD-68,, US Army Corps of Engineers, Hydrologic Engineering Center, USA, 2008.
Cen, G., Shen, J., and Fan, R.: Research on rainfall pattern of urban design storm, Adv. Water Sci., 9, 41–46, https://doi.org/10.14042/j.cnki.32.1309.1998.01.007, 1998.
Charley, W., Pabst, A., and Peters, J.: The Hydrologic Modeling System (HEC-HMS): Design and Development Issues, Technical Paper No. 149, Hydrological Engineering Center, US Army Corps of Engineers, USA, 1995.
Chen, Y., Zhou, H., Zhang, H., Du, G., and Zhou, J.: Urban flood risk warning under rapid urbanization, Environ. Res., 139, 3–10, https://doi.org/10.1016/j.envres.2015.02.028, 2015.
Cools, M., Moons, E., Creemers, L., and Wets, G.: Changes in travel behavior in response to weather conditions: do type of weather and trip purpose matter?, Transport. Res. Rec.: J. Transport. Res. Board, 2157, 22–28, https://doi.org/10.3141/2157-03, 2010.
Dai, Q., Han, D., Rico-Ramirez, M. A., and Srivastava, P. K.: Multivariate Distributed Ensemble Generator: A new scheme for ensemble radar precipitation estimation over temperate maritime climate, J. Hydrol., 511, 17–27, 2014.
Dai, Q., Rico-Ramirez, M. A., Han, D., Islam, T., and Liguori S.: Probabilistic radar rainfall nowcasts using empirical and theoretical uncertainty models, Hydrol. Process., 29, 66–79, 2015.
Dankers, R. and Feyen, L.: Climate change impact on flood hazard in Europe: An assessment based on high-resolution climate simulations, J. Geophys. Res.-Atmos., 113, D19105, https://doi.org/10.1029/2007JD009719, 2008.
Dawson, R. J., Peppe, R., and Wang, M.: An agent-based model for risk-based flood incident management, Nat. Hazards, 59, 167–189, https://doi.org/10.1007/s11069-011-9745-4, 2011.
DEFRA and Environment Agency: Flood risks to people phase 1: R & D Technical Report FD2317, DEFRA, London, 2003.
DHI – Danish Hydraulic Institute: MIKE SHE Water movement user manual, DHI Water & Environment, Denmark, 2000.
Dijkstra, E. W.: A note on two problems in connexion with graphs, Numer. Math., 1, 269–271, 1959.
Drobot, S. D., Benight, C., and Gruntfest, E. C.: Risk factors for driving into flooded roads, Environ. Hazards, 7, 227–234, https://doi.org/10.1016/j.envhaz.2007.07.003, 2007.
Gain, A. K., Mojtahed, V., Biscaro, C., Balbi, S., and Giupponi, C.: An integrated approach of flood risk assessment in the eastern part of Dhaka City, Nat. Hazards, 79, 1499–1530, https://doi.org/10.1007/s11069-015-1911-7, 2015.
Geopandas: GeoPandas 0.5.1 – GeoPandas 0.5.1 documentation, available at: http://geopandas.org/ (last access: March 2019), 2018.
Guo, E., Zhang, J., Ren, X., Zhang, Q., and Sun, Z.: Integrated risk assessment of flood disaster based on improved set pair analysis and the variable fuzzy set theory in central Liaoning Province, China, Nat. Hazards, 74, 947–965, https://doi.org/10.1007/s11069-014-1238-9, 2014.
Hammond, M. J., Chen, A. S., Djordjević, S., Butler, D., and Mark, O.: Urban flood impact assessment: A state-of-the-art review, Urban Water J., 12, 14–29, https://doi.org/10.1080/1573062X.2013.857421, 2015.
Havnø, K., Madsen, M. N., and Dørge, J.: MIKE 11 – a generalized river modelling package, in: Computer models of watershed hydrology, Water Resources Publications, Colorado, 733–782, 1995.
Horritt, M. S. and Bates, P. D.: Evaluation of 1D and 2D numerical models for predicting river flood inundation, J. Hydrol., 268, 87–99, https://doi.org/10.1016/S0022-1694(02)00121-X, 2002.
Huang, H., Fan, Y., Yang, S., Li, W., Guo, X., Lai W., and Wang H.: A multi-agent based theoretical model for dynamic flood disaster risk assessment, Geogr. Res., 34, 1875–1886, 2015.
IPCC.: Summary for Policymakers. I, ie Change Adaptation. A Special Report of Working Groups I and II of the Intergovernmental Panel on Climate Change, Cambridge University Press, Cambridge, UK, and New York, NY, USA, 3–21, 2012.
Johnstone, M. A.: Life safety modelling framework and performance measures to assess community protection systems: application to tsunami emergency preparedness and dam safety management, PhD thesis, University of British Columbia, British Columbia, 2012.
Jonkman, S. N. and Kelman, I.: An analysis of the causes and circumstances of flood disaster deaths, Disasters, 29, 75–97, https://doi.org/10.1111/j.0361-3666.2005.00275.x, 2005.
Jonkman, S. N. and Penning-Rowsell, E.: Human Instability in Flood Flows 1, J. Am. Water Resour. Assoc., 44, 1208–1218, https://doi.org/10.1111/j.1752-1688.2008.00217.x, 2008.
Karvonen, R. A., Hepojoki, A., Huhta, H. K., and Louhio, A.: The use of physical models in dam-break analysis, RESCDAM Final Report, Helsinki University of Technology, Helsinki, Finland, 2000.
Liang, Y., Wen, J., Du, S., Xu, H., and Yan J.: Spatial-temporal Distribution Modeling of Population and its Applications in Disaster and Risk Management, J. Catastrophol., 30, 220–228, https://doi.org/10.3969/j.issn.1000-811X.2015.04.038, 2015.
Lind, N., Hartford, D., and Assaf, H.: Hydrodynamic models of human stability in a flood, J. Am. Water Resour. Assoc., 40, 89–96, https://doi.org/10.1111/j.1752-1688.2004.tb01012.x, 2004.
Lindberg, S., Nielsen, J. B., and Carr, R.: An integrated PC-modelling system for hydraulic analysis of drainage systems, in: Watercomp'89: The First Australasian Conference on Technical Computing in the Water Industry, Institution of Engineers, Australia, p. 127, 1989.
Lishui Municipal Statistics Bureau and Survey Office of the National Bureau of Statistics of China in Lishui: Lishui Statistical Yearbool, China Statistics Press, available at: http://tjj.lishui.gov.cn (last access: March 2019), 2014.
Lü, G., Batty, M., Strobl, J., Lin, H., Zhu, A. X., and Chen, M.: Reflections and speculations on the progress in Geographic Information Systems (GIS): a geographic perspective, Int. J. Geogr. Inform. Sci., 33, 346–367, https://doi.org/10.1080/13658816.2018.1533136, 2018.
Mahe, G., Paturel, J. E., Servat, E., Conway, D., and Dezetter, A.: The impact of land use change on soil water holding capacity and river flow modelling in the Nakambe River, Burkina-Faso, J. Hydrol., 300, 33–43, https://doi.org/10.1016/j.jhydrol.2004.04.028, 2005.
Mansur, A. V., Brondízio, E. S., Roy, S., Hetrick, S., Vogt, N. D., and Newton, A.: An assessment of urban vulnerability in the Amazon Delta and Estuary: a multi-criterion index of flood exposure, socio-economic conditions and infrastructure, Sustainabil. Sci., 11, 625–643, https://doi.org/10.1007/s11625-016-0355-7, 2016.
Matplotlib: Matplotlib: Python plotting – Matplotlib 3.1.1 documentation, available at: https://matplotlib.org/ (last access: March 2019), 2018.
Moel, H. D., Aerts, J. C., and Koomen, E.: Development of flood exposure in the Netherlands during the 20th and 21st century, Global Environ. Change, 21, 620–627, https://doi.org/10.1016/j.gloenvcha.2010.12.005, 2011.
National Earth System Science Data Sharing Infrastructure and National Science & Technology Infrastructure of China: 1 km grid population data, availablea at: http://www.geodata.cn (last access: March 2019), 2010
Papinski, D., Scott, D. M., and Doherty, S. T.: Exploring the route choice decision-making process: A comparison of planned and observed routes obtained using person-based GPS, Transport. Res. Pt. F, 12, 347–358, https://doi.org/10.1016/j.trf.2009.04.001, 2009.
Parker, D., Fordham, M., Tunstall, S., and Ketteridge, A. M.: Flood warning systems under stress in the United Kingdom, Disaster Prevent. Manage.: Int. J., 4, 32–42, https://doi.org/10.1108/09653569510088050, 1995.
Python: Welcome to Python.org, available at: https://www.python.org/ (last access: March 2019), 2018.
Qt: Qt | Cross platform software development for embedded & desktop, available at: https://www.qt.io/ (last access: March 2019), 2018.
Rahman, A.-U.: Disaster risk management, Flood Perspective, VDM Verlag Publishing Co. Ltd, Germany, 2014.
Ramming, M. S.: Network knowledge and route choice, Unpublished PhD Thesis, Massachusetts Institute of Technology, Massachusetts, 2001.
Rossman, L. A.: Storm water management model user's manual Version 5.1 EPA-600/R-14/413b[z], National Risk Management Laboratory Laboratory Office of Research and Development US Environmental Protection Agency, available at: https://nepis.epa.gov/Exe/ZyPDF.cgi/P100N3J6.PDF?Dockey=P100N3J6.PDF (last access: March 2019), 2015.
Röthlisberger, V., Zischg, A. P., and Keiler, M.: Identifying spatial clusters of flood exposure to support decision making in risk management, Sci. Total Environ., 598, 593–603, https://doi.org/10.1016/j.scitotenv.2017.03.216, 2017.
Ruin, I., Gaillard, J. C., and Lutoff, C.: How to get there? Assessing motorists' flash flood risk perception on daily itineraries, Environ. Hazards, 7, 235–244, https://doi.org/10.1016/j.envhaz.2007.07.005, 2007.
Shabou, S., Ruin, I., Lutoff, C., Debionne, S., Anquetin, S., Creutin, J. D., and Beaufils, X.: MobRISK: a model for assessing the exposure of road users to flash flood events, Nat. Hazards Earth Syst. Sci., 17, 1631–1651, https://doi.org/10.5194/nhess-17-1631-2017, 2017.
Shi, P.: Theory and practice of disaster study, J. Nat. Disasters, 4, 8–19, 1996.
Terti, G., Ruin, I., Anquetin, S., and Gourley, J. J.: Dynamic vulnerability factors for impact-based flash flood prediction, Nat. Hazards, 79, 1481–1497, https://doi.org/10.1007/s11069-015-1910-8, 2015.
Visual Studio Code: Visual Studio Code – Code Editing, Redefined, available at: https://code.visualstudio.com/ (last access: March 2019), 2018.
Wan, H. and Wang, J.: Analysis of Public Adaptive Behaviors to Drought and Flood Disasters in Middle Reaches of Weihe River: A Case Study on Qishan County of Shaanxi Province, Acta Agricult. Jiangxi, 29, 107–111, https://doi.org/10.19386/j.cnki.jxnyxb.2017.05.21, 2017.
Weis, S. W. M., Agostini, V. N., Roth, L. M., Gilmer, B., Schill, S. R., Knowles, J. E., and Blyther, R.: Assessing vulnerability: an integrated approach for mapping adaptive capacity, sensitivity, and exposure, Climatic Change, 136, 615–629, https://doi.org/10.1007/s10584-016-1642-0, 2016.
Werren, G., Reynard, E., Lane, S. N., and Balin, D.: Flood hazard assessment and mapping in semi-arid piedmont areas: a case study in Beni Mellal, Morocco, Nat. Hazards, 81, 481–511, https://doi.org/10.1007/s11069-015-2092-0, 2016.
Yang, X., Yue, W., and Gao, D.: Spatial improvement of human population distribution based on multi-sensor remote-sensing data: an input for exposure assessment, Int. J. Remote Sens., 34, 5569–5583, https://doi.org/10.1080/01431161.2013.792970, 2013.
Yin, J., Yu, D., and Wilby, R.: Modelling the impact of land subsidence on urban pluvial flooding: A case study of downtown Shanghai, China, Sci. Total Environ., 544, 744–753, https://doi.org/10.1016/j.scitotenv.2015.11.159, 2016.
Yin, W., Yu, H., Cui, S., and Wang, J.: Review on methods for estimating the loss of life induced by heavy rain and floods, Prog. Geogr., 35, 148–158, https://doi.org/10.18306/dlkxjz.2016.02.002, 2016.
Yin, Z.: Research of urban natural disaster risk assessment and case study, PhD thesis, East China Normal University, Shanghai, China, 2009.