the Creative Commons Attribution 4.0 License.
the Creative Commons Attribution 4.0 License.
 | 12 Jul 2019
Using R in hydrology: a review of recent developments and future directions
Louise J. Slater
Guillaume Thirel
Shaun Harrigan
Olivier Delaigue
Alexander Hurley
Abdou Khouakhi
Ilaria Prosdocimi
Claudia Vitolo
Katie Smith
The open-source programming language R has gained a central place in the hydrological sciences over the last decade, driven by the availability of diverse hydro-meteorological data archives and the development of open-source computational tools. The growth of R's usage in hydrology is reflected in the number of newly published hydrological packages, the strengthening of online user communities, and the popularity of training courses and events. In this paper, we explore the benefits and advantages of R's usage in hydrology, such as the democratization of data science and numerical literacy, the enhancement of reproducible research and open science, the access to statistical tools, the ease of connecting R to and from other languages, and the support provided by a growing community. This paper provides an overview of a typical hydrological workflow based on reproducible principles and packages for retrieval of hydro-meteorological data, spatial analysis, hydrological modelling, statistics, and the design of static and dynamic visualizations and documents. We discuss some of the challenges that arise when using R in hydrology and useful tools to overcome them, including the use of hydrological libraries, documentation, and vignettes (long-form guides that illustrate how to use packages); the role of integrated development environments (IDEs); and the challenges of big data and parallel computing in hydrology. Lastly, this paper provides a roadmap for R's future within hydrology, with R packages as a driver of progress in the hydrological sciences, application programming interfaces (APIs) providing new avenues for data acquisition and provision, enhanced teaching of hydrology in R, and the continued growth of the community via short courses and events.
- Article
(2987 KB) - Full-text XML
-
Supplement
(50 KB) - BibTeX
- EndNote
- Included in Encyclopedia of Geosciences


In recent decades, the hydrological sciences, like many other disciplines, have witnessed major changes due to the growth of diverse data archives and the development of computational resources. Hydrology has benefited from the increase in publicly accessible data, including (a) observational river flow archives (Hannah et al., 2011) such as the World Meteorological Organization's Global Runoff Data Centre, which currently includes more than 9500 stations from 161 countries, (b) gridded reanalysis climate data products such as Copernicus's ERA-Interim (Dee et al., 2011) or ERA5 (Hersbach et al., 2018; Copernicus Climate Change Service, 2018), (c) measurements from sensors and satellites, such as total water storage variations from the Gravity Recovery and Climate Experiment (GRACE; Tapley et al., 2004) or snow cover area from NSIDC MODIS (Hall and Riggs, 2016), and (d) catchment attributes such as the Global Streamflow Indices and Metadata Archive (Do et al., 2018) or national datasets such as GAGES-II (Falcone, 2011) and CAMELS (Addor et al., 2017). Together, these datasets have facilitated the investigation of many catchments as well as interdisciplinary research linking meteorology, climatology, hydrology, and the earth sciences.
In addition to the availability of large-scale data archives, the increase in computational power and uptake of programming languages have also been a major driver of change in the discipline. Increasingly, hydrologists are using data science approaches to derive process insights from large and complex datasets (e.g. Guo, 2017). The ability to explore and mine these datasets has facilitated a move from in-depth experiments in single catchments towards large-sample studies (e.g. Villarini et al., 2009; Berghuijs et al., 2014; Slater et al., 2015; Archfield et al., 2016; Blöschl et al., 2017; Blum et al., 2017; Harrigan et al., 2018). By applying an analysis to many catchments, or grouping those with similar characteristics, hydrologists have been able to test the broad applicability of hydrological theories and draw systematic insights about hydrological processes (e.g. Blöschl et al., 2013). Large-sample studies are increasingly being employed to develop novel (conceptual and/or physical) models that are applicable across diverse catchment conditions, thereby improving process understanding and leading to more robust predictions (e.g. Gupta et al., 2014). At the same time, a broad range of well-established lumped (e.g. GR4J; Perrin et al., 2003) and semi-distributed (e.g. TOPMODEL, Beven, 1997) models of the hydrological cycle – many of which were initially developed in older languages such as Fortran – have now been incorporated into R packages. Some of them have been translated into R, and others remain in their initial languages, e.g. SWAT (Neistsch et al., 2005). The uptake of empirical, conceptual, and physically based computational hydrological models as well as the growth of large-sample studies have driven the emergence of a field that can be described as computational hydrology (e.g. Hutton et al., 2016; Melsen et al., 2017): a scientific paradigm that allows hydrologists to explore hydrological questions with a computational approach. Computational hydrology aims to develop reproducible hydrological analyses that can be applied to many catchments, with the aim of generating novel and systematic process insights that improve our physical understanding of the hydrological cycle. The field differs somewhat from both hydroinformatics (e.g. Abbott et al., 1991), which has a greater focus on information and communication technologies and/or black-box approaches to address water-related issues, and geocomputation, (e.g. Openshaw and Abrahart, 2000; Lovelace et al., 2019), which uses similar computational techniques for spatial data analysis.
The growth of computational hydrology has been enhanced by the development of the open-source programming language R, originally developed for statistical computing by Ross Ihaka and Robert Gentleman in the 1990s (Ihaka and Gentleman, 1996; R Core Team, 2018) and supported by an enthusiastic and rapidly growing online community. As a free multiplatform language, R is highly versatile and has a wide range of uses, including data acquisition and provisioning, manipulation, analysis, modelling, statistics, visualization, and even well-developed geospatial and geographic information system (GIS) applications. R can be used for generating reports, making interactive presentations for teaching or conferences, or even prototyping dashboards and web applications. One of the greatest strengths of R is its extremely active community of users, who, in the past 25 years, have developed and released in the public domain more than 14 000 packages spanning many scientific disciplines. The Comprehensive R Archive Network (CRAN; https://cran.r-project.org) is the main repository for these packages, hosted by a network of FTP and web servers around the world. The abrupt increase in the number of hydrological package updates in 2018–2019 exemplifies the growing importance of the language in hydrology and strengthening of the community (Fig. 1). These developments have allowed the R language to fit comfortably in production-ready ecosystems (e.g. web applications) and take advantage of cutting-edge technologies and tools for improving reproducibility, testing, and continuous integration.

Figure 1The number of R packages available on CRAN (1997–2019).
All packages are shown in (a), and hydrology packages only (defined as those that include the string “hydro” within the package metadata; erroneous packages containing terms like hydrocarbon were removed) are shown in (b).
Bar colours indicate number of packages published based on
(1) date of first release (grey bars; https://cran.r-project.org/src/contrib/Archive/) and
(2) date of last publication – i.e. most recent publication date of packages that are currently available on CRAN (black bars; https://cran.r-project.org/web/packages/available_packages_by_date.html).
In both cases each package is counted only once; for example the package hydroTSM was first released in 2010 (grey), but its most recent update was in 2017 (black).
The script to produce this figure is provided in the Supplement.
Data were downloaded from CRAN on 23 June 2019; thus the year 2019 is incomplete.
This paper aims to provide a broad overview of the utility of R in the hydrological sciences and of important developments in recent years. In Sect. 2 we provide a summary of the many benefits and advantages of using R in hydrology. In Sect. 3 we describe some of the key hydrological packages that have been developed by the community as well as general packages of broad application in the sciences. In Sect. 4 we discuss some of the challenges that the hydrologic R users (R-Hydro) community faces, including tools and solutions to overcome these challenges. Finally, in Sect. 5 we list some of the future directions to strengthen the computational hydrology community.
2.1 Democratizing open science and numerical literacy
One of the principal advantages of R is its ease of use, resulting from typically detailed documentation, a large number of online resources, object-oriented programming (the language is organized around objects with unique attributes), functional programming (the code can be written with functions to facilitate modularity and avoid changing-state data), and the availability of the source code under the open-source license. Further, R can be run on all major operating systems (i.e. Microsoft Windows, macOS, and Linux), making it ideal for institutional or personal use. In contrast with compiled languages, such as C or Fortran, R is an interpreted language, which means that the code can be written and executed line by line. In practice this means that achieving a basic hydrological analysis can be as simple as writing a sequence of commands for reading a file, cleaning the data, and plotting a graph. These sequences of commands are typically collated in an R Script; together, multiple scripts may constitute a hydrological workflow (see Fig. 3). A high level of documentation and support exists for each of the tasks within a hydrological workflow, including a diverse range of packages (see Sect. 3). R users may search for R-relevant content (such as expressions, packages, and functions) using the dedicated Internet search engine, RSeek (https://rseek.org), as well as generalist search engines. For many R newcomers, the initial hurdle is finding the time required to gain a basic understanding of R itself; but these efforts pay off rapidly as one learns how to find solutions on the Internet (see Sect. 2.5) and to navigate help files provided within R.

Figure 2The EGU short course Using R in Hydrology, 11 April 2018.

One of the advantages of writing a script is that it can be reused and improved incrementally over time so that the author never has to repeat a task manually (in contrast to point-and-click software that lacks a programmatic interface). Moreover, the same script can be reused repeatedly by different people to reproduce a given result (avoiding duplication of efforts) or to analyse different data, e.g. different catchments, different types of gridded data, or the same data at different points in time. Thus, scripts written in R (or other languages) have wide-ranging benefits, as they facilitate the testing and quality control of the scientific workflow, can be shared and improved by a team of users, lessen the risk of making manual mistakes, and significantly enhance the speed with which analyses can be conducted and updated.
Recent developments in R have contributed to enhancing open science and numerical literacy in the hydrological sciences. R's ease of access and use has improved what might be termed “scientific computing literacy” within the hydrological community. Volunteer projects such as the Software Carpentry (Wilson, 2006, 2014) have been teaching basic computing skills to researchers since 1998, and R now forms a central part of their training. Over the past decade or so, R has become one of the core tools for scientific computation in hydrology. Hosted instances of R allow the user to run R and RStudio® (an integrated development environment – IDE; described in greater detail in Sect. 4.2) in the cloud, i.e. in a web browser rather than locally on one's own computer. These hosted instances have made the language more accessible to non-specialists due to the large range of pre-installed packages. Importantly, the RStudio Cloud (https://rstudio.cloud/) has recently been developed to make it easy for professionals, hobbyists, trainers, teachers, and students to do, share, teach, and learn data science using R and provides many learning materials, including interactive tutorials covering the basics of data science, cheat sheets for working with popular R packages, and a guide to using RStudio Cloud. Such hosted instances of R remove the initial hurdle of installing R and the required packages (i.e. the technicalities) and ultimately make scientific work more accessible.
The R-Hydro community has developed a number of platforms to share computational hydrology analyses, and code is increasingly being shared via repositories (see Sect. 5.1).
Code and results can be published as traditional media (e.g. as articles, supplemental material, scripts, packages, or computational environments) or on the web via blog posts, snippets, or tutorial documents, allowing users to engage interactively.
The “literate programming” paradigm (i.e. interspersing snippets of code and written text within a unique document; see Knuth, 1984) has also become increasingly popular due to the development of dashboards and online publishing platforms.
Dashboards are interfaces that may include a group of related data visualizations such as charts, graphs, tables, and maps (e.g. Fig. 6).
They can be fixed (e.g. a non-interactive web page) or dynamic (e.g. allowing users to alter input values and see how outputs change virtually in real time).
Hydrologists have increasingly employed dashboards to display their analyses in an interactive, user-friendly manner, using packages such as plotly, a graphing library that makes publication-quality graphs online (Sievert, 2018), the shiny web application framework (Chang et al., 2015), shinydashboard (Chang and Borges Ribeiro, 2018), or the flexdashboard package (Iannone et al., 2018).
Additionally, free services such as RPubs (a free web-publishing platform; https://rpubs.com) and the aforementioned plotly enable the publishing of these static or interactive documents and visualizations online.
In doing so, these publishing services facilitate immediate interaction and knowledge transfer.

Figure 4An example of a figure in a paper produced in R with the package ggplot2 using the facet_grid function, which allows the user to split a dataset by categories (rows and columns). Here, a probabilistic time-series GAMLSS model of flood frequency at one gauging station in Ohio, USA, is shown for four different seasons (rows) and two peak-over-threshold quantities (columns: two to four peaks per year). The probabilistic model is plotted in the background as colour ribbons (using geom_ribbon), and the observed values are plotted in the foreground as grey circles (geom_point). Source: Neri et al. (2019).
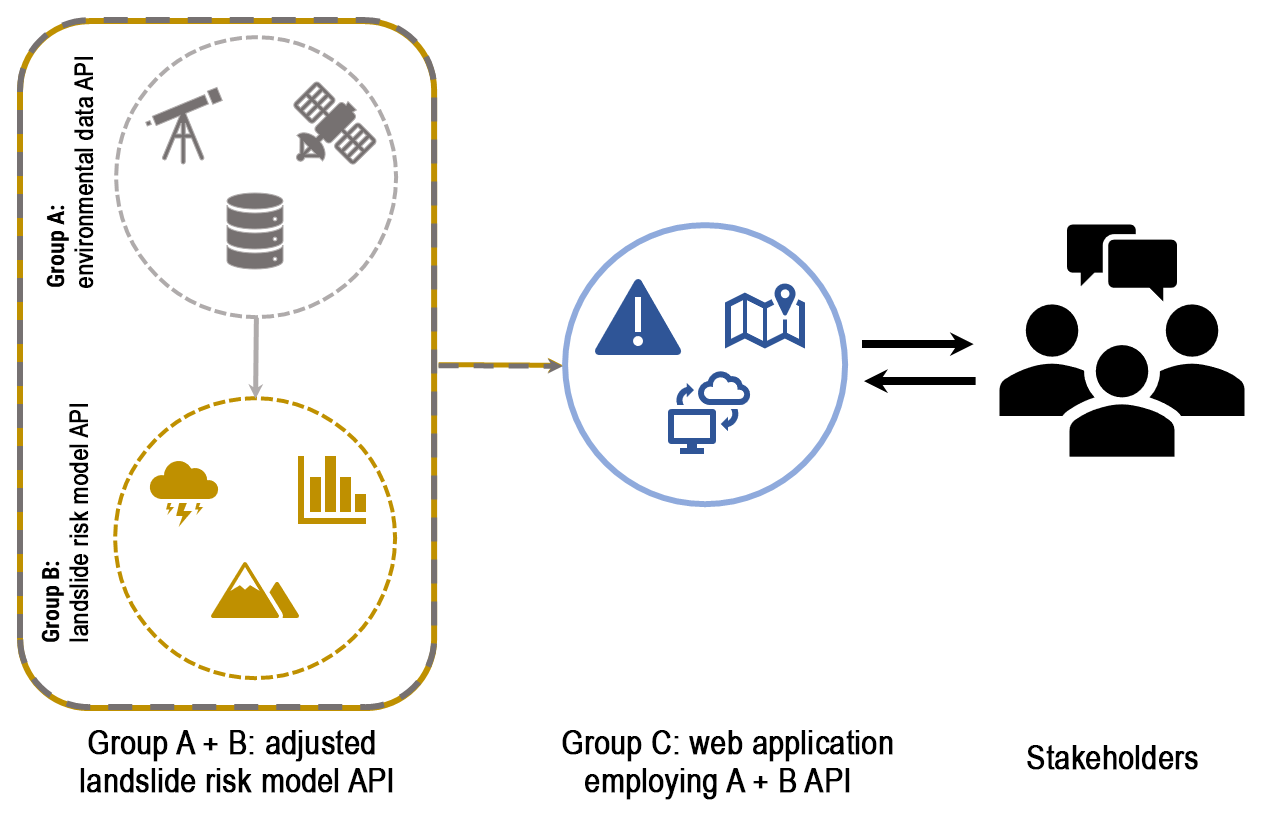
Figure 5Use-case scenario for implementation of APIs developed within hydrological sciences. Group A collates the most recent earth- and ground-based observations of land cover, topography, and climate data for an in-house project yet allows an API to interact with an analysis-ready, spatially explicit dataset for their region of interest. Group B is interested in geomorphological processes and has developed a model to predict likely occurrence of mass movements, which they also provide access to via an API. During a period of extreme rainfall over a scientifically unrelated region, both groups decide to adjust their methods and API to provide pertinent data (group A), which feed into predictions of landslide risk (group B). Finally, a disaster relief organization (group C) can swiftly act and use the outputs from the adapted API (A + B) to develop a simple web application with maps and warnings for use by the general public in the affected area.
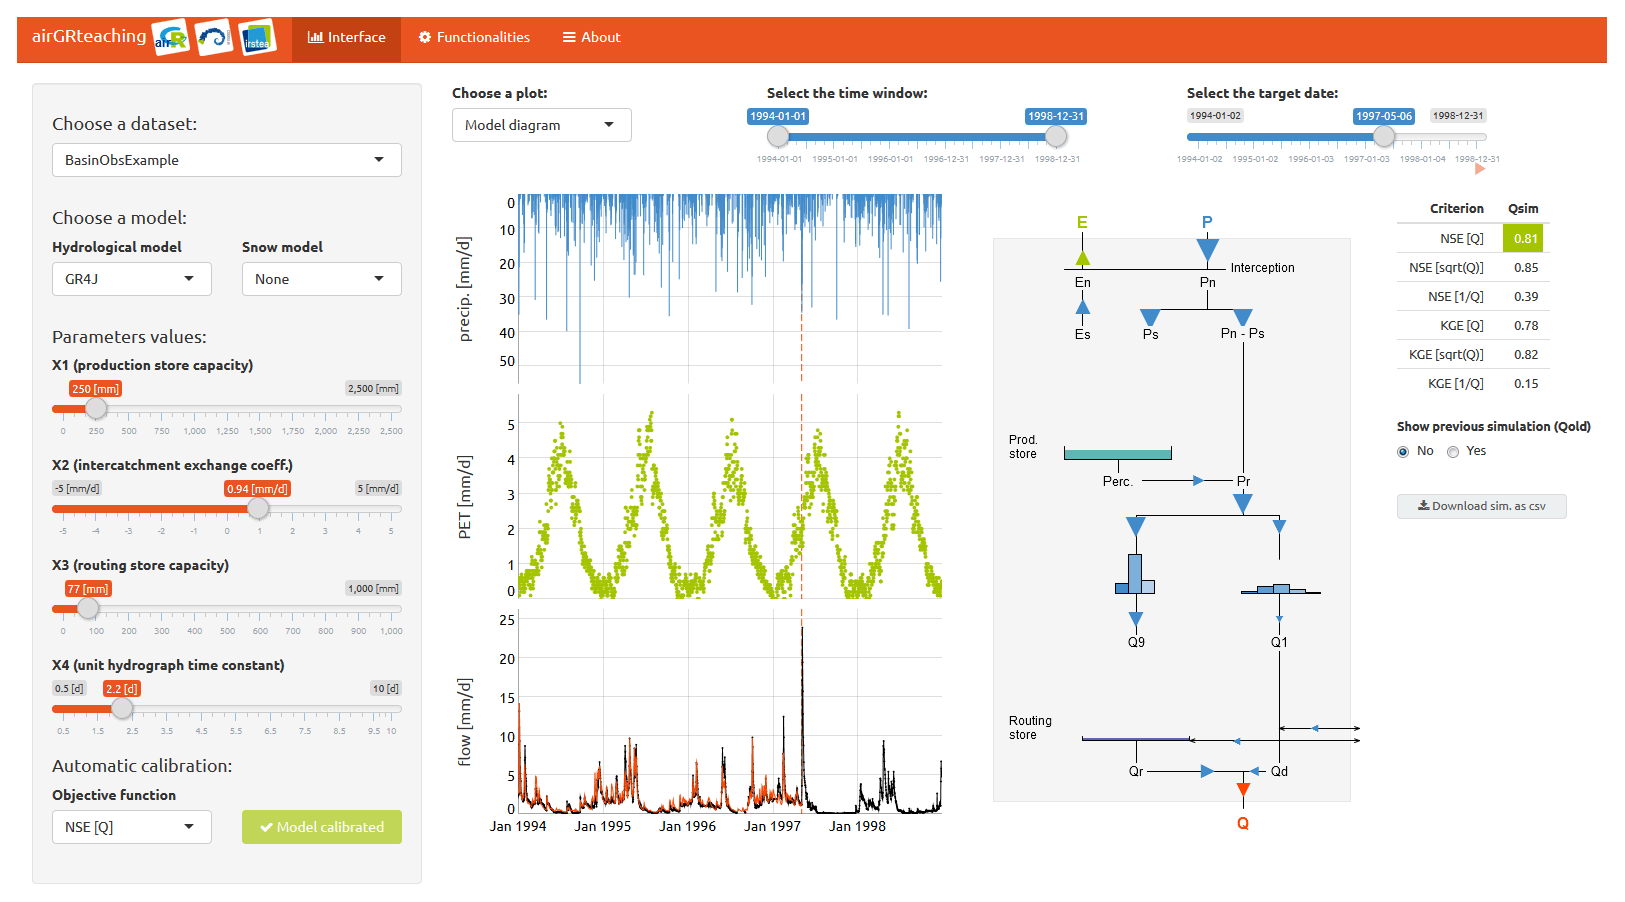
Figure 6The airGRteaching interface that is used for teaching hydrological modelling.
Students can choose a catchment dataset and a hydrological model and activate a snow model on the top left panel of the interface.
Modifying the parameters values (on the left) by using the sliding bars will automatically update the graphs and scores displayed (on the right).
This interface highlights in an interactive manner the basic principle of the rainfall–runoff relationship and its description in hydrological models.
At the bottom left of the interface, an objective function can be chosen and an automatic calibration procedure can be launched within the interface.
2.2 Enhancing reproducible hydrological research and open science
Reproducibility is a key feature of the scientific method and can be broadly defined as the ability for the community to reproduce and verify previous findings. Encouraging reproducible practices helps reduce the likelihood of errors (methods can be tested by other researchers) while increasing the uptake of any positive developments within a discipline (Hutton et al., 2016). However, scientific research is increasingly under fire for its lack of reproducibility due to an inadequate methodology description (Ceola et al., 2015) and model and data availability. True reproducibility requires more than the mere repeatability of results with the same computer code and data: one must also be able to reproduce a study's conclusions when testing the theory with different data or a different model set-up (Melsen et al., 2017).
The open-source nature of R packages and the CRAN repository set-up are one key added value of R to reproducible geoscientific research (Pebesma et al., 2012).
The CRAN repository ensures the traceability of past analyses by archiving former versions of the packages compiled on any platform (https://cran.r-project.org).
In addition, packages are citeable in reports and papers together with their version number, allowing the user to track which code was used.
The package developers are also “traceable” on the CRAN via their ORCID (Open Research and Contributor ID) number, which provides an indication of whether they also authored any corresponding scientific papers.
The CRAN Task Views provide guides to the packages and tools that exist on CRAN for the different disciplines.
Note that many packages are submitted to online repositories such as GitHub that never make it to CRAN for a range of reasons, but this does not necessarily make them less reliable.
The Task Views provide a list of tools which can enhance reproducibility in R (see https://cran.r-project.org/web/views/ReproducibleResearch.html).
Relying on well-established publishing platforms such as CRAN and GitHub has promoted the use of best practice in writing R code.
Packages such as rhub (Csárdi, 2017) provide code checks for packages on certain operating systems, while roxygen2 helps users create documentation for their R packages (Wickham et al., 2018a).
Other initiatives, such as rOpenSci (carefully vetted scientific R software tools; see https://ropensci.org) and their code peer review, have facilitated the implementation of best practice whilst holding authors to scientific scrutiny.
Journals in the field of hydrology such as Hydrology and Earth System Sciences, Water Resources Research, and the American Society of Civil Engineers (ASCE) journals Journal of Water Resources Planning and Management and Journal of Hydrologic Engineering now actively encourage authors to publish the data and computer codes underlying the results presented in their papers. The journal Nature states that a manuscript can be rejected if the code used to generate new analyses cannot be provided to the editors and reviewers. Despite the advantages of sharing hydrological code, few computational hydrologists do this because cleaning and annotating the code places an additional burden on the publishing time frame. However, it is reasonable to assume that as more journals require submission of codes with papers, the community of computational hydrologists (and associated fields) will continue to grow and strengthen the field. In addition to the sharing of open-source code, reproducibility experts also advocate the use of software tool sets such as version control, scripting, container technology, and computational notebooks to enhance the reproducibility of scientific results (Perkel, 2018). Hydrological tutorials, vignettes, or teaching documents increasingly implement literate programming (Sect. 2.1), where the code and results are described in plain English within the same document or web page.
In the hydrological sciences, several ongoing open scientific initiatives can be noted other than the R packages that are discussed in Sect. 3. These initiatives include the HydroShare web-based system for sharing hydrologic data and models, which allows hydrologists to visualize, analyse, and work with data and models on the HydroShare website (e.g. creating and publishing a web app resource; Essawy et al., 2018). Additionally, the Sharing Water-related Information to Tackle Changes in the Hydrosphere for Operational Needs (SWITCH-ON) virtual laboratory aims to explore the potential of open data for water security and management (Ceola et al., 2015). The reproducibility agenda has benefited from strong political and financial support, with European Union projects like FOSTER Plus (Fostering the practical implementation of Open Science in Horizon 2020 and beyond) that aim to encourage open science. The European Commission's Science with and for Society programme, implemented as part of Horizon 2020 (European Commission, 2015, p. 17), similarly noted that the reuse of research data generated with public funding should have beneficial impacts for science, the economy, and society. As such, open science is expected to encourage interdisciplinary research and is considered a key approach to tackle the grand challenges of our time.
2.3 Providing statistical tools for hydrology
There are many different types of software for statistical analysis, but R is still considered the most powerful and popular language and environment for statistical computing. For example, a search for the word “statistics” on Stack Overflow, the question and answer website for programmers, on 18 May 2019 generated 12 339 results with the tag “R”, 9582 results with Python, 4916 with Java, 2623 with C#, and 48 with Fortran. R is GNU S, a language which can be described as the modern implementation of the S language (Becker and Chambers, 1984; Chambers, 1998), and is specifically optimized for statistical computing. In addition to the standard statistical techniques within base-R (i.e. the inbuilt basic functions that define R as a language), R also provides access to a large variety of advanced and recent statistical packages, which have been developed by its user community of statisticians and statistically minded scientists working in a range of research fields. When comparing R with other similar open-source languages, users often describe R's unique selling point as the vast number of statistical packages which liken it to a free, community-driven statistical software.
The statistical and graphical packages provided in R are particularly useful for the hydrological sciences and include techniques such as linear and non-linear modelling, statistical tests, time-series analysis, classification, or clustering. A description of specific statistical packages relevant to hydrology is provided in Sect. 3.6.
2.4 Connecting R to and from other languages
Many different programming languages are used in hydrology, including older languages such as Fortran, developed in the 1950s (e.g. Backus, 1978), and C in 1972 (e.g. Ritchie, 1993); proprietary commercial languages, e.g. MATLAB®, initially released in 1984 (MathWorks, 2018); and more recent open-source languages like Python, which appeared in 1990 (e.g. Sanner et al., 1999; Guttag, 2013), R in 1993 (e.g. R Core Team, 2018; Ihaka, 1998), and Julia in 2012 (Bezanson et al., 2012).
S and R were both built using algorithms implemented mostly in Fortran and sometimes in C (Chambers, 2016, p. 55), which is why R can be connected natively to both languages. Interconnections between R and other languages can be very useful for taking advantage of each language's strengths or using pre-existing scripts that were originally written in other languages.
For example, C and Fortran are both efficient in performing loop tasks. This is the reason why the apply function loops are coded in C. The airGR hydrological models (Coron et al., 2017, 2018) also make use of Fortran in order to take advantage of its CPU efficiency.
R can also be connected to different languages using a range of packages, e.g. C++ (package Rcpp; Eddelbuettel and Balamuta, 2017) and Java (package rJava; Urbanek, 2018).
Connections to Python can be achieved with the packages
reticulate (Allaire et al., 2018b),
rPython (Bellosta, 2015),
rJython (Grothendieck and Bellosta, 2012), and
XRPython (Chambers, 2017).
Additionally, R can also be connected to
JavaScript (e.g. package V8; Ooms, 2017),
MATLAB (e.g. package R.matlab; Bengtsson, 2018),
or Julia (packages JuliaCall and XRJulia; Chambers, 2018; Li, 2018).
Conversely, connecting other languages to R is also possible.
For example, rpy2 (Gautier, 2018) is the Python interface to the R language and runs an embedded R, providing access from Python using R's own C application programming interface (API).
The Python library pyRserve (Heinkel, 2017) also connects Python with R using Rserve (a TCP/IP server which allows other programs to use facilities of R).
The RCall package allows users to call R from Julia (Bates et al., 2015).
2.5 Interacting with the R-Hydro community: scientific resources and courses
One of the major advantages of R is the extensive user community, which provides ample support to newcomers through various initiatives and is growing at a fast pace. R-Hydro beginners are strongly encouraged to join the discussion on various R-related topics on social media. On Twitter, the “#rstats” community is particularly active, and users are exposed to communication about a range of new packages and recent developments. Stack Overflow (https://stackoverflow.com) is the go-to online discussion forum for any user, from beginners to expert developers, and provides code snippets to solve a wide range of common problems. In addition, the R Project also offers thematic mailing lists (https://www.r-project.org/mail.html), relating to usage (R-help), package development (R-package-devel), and language development (R-devel), in order to help others, report bugs, or propose solutions. More recent but already extremely active is the RStudio Community forum (https://community.rstudio.com), which includes users interested in RStudio-developed applications and packages.
A wide range of scientific resources, including online manuals and tutorials in several languages, have been developed by the community. The rOpenSci project (https://ropensci.org) brings together a community of volunteers who promote the open development of packages in a non-profit initiative by reviewing scientific R packages before they are uploaded to CRAN. rOpenSci has contributed notably to the development of best practice through free code reviews and targeted or invited blog posts. Resources can be found in many places online, such as the Journal of Open Source Software (JOSS), which hosts a wealth of short papers documenting R packages.
Short courses, i.e. voluntary training sessions for R users run during conferences like the European Geosciences Union (EGU) General Assembly, have also grown in popularity in the hydrological community in recent years (Fig. 2). Since the 2017 EGU General Assembly, the Using R in Hydrology short course has been organized in conjunction with the Young Hydrologic Society (YHS; https://younghs.com) as part of the annual Hydrological Sciences division programme. The core aim of the short course is to bring together the R-Hydro community, including both users who are learning to program and advanced users who are either teaching computational hydrology or developing packages for hydrological analysis. Recent advances in R for hydrology applications are demonstrated during the short course, and a platform for open discussion between guest speakers and course participants is provided. By rotating topics each year, a valuable repository of slides, code examples, and follow-up material is provided to the community on GitHub (https://github.com/hydrosoc; see Sect. 5.6 for further information). It is also worth noting that a regular short course is also run at the EGU on R package development. In addition to the EGU, other regular conferences and meetings such as those run by the International Association of Hydrological Sciences (IAHS) and the Prediction in Ungauged Basins (PUB; PUB Summer School) also organize R courses during their meetings. The IAHS Statistical Hydrology (STAHY) commission regularly organizes workshops and short courses on various statistical topics, which typically come with a computer-based component in R.
Finally, it is worth mentioning that the continued growth of the R community is supported by the R Consortium (https://www.r-consortium.org/about), a group with an open-source governance and foundation model that supports the worldwide community of users, maintainers, and developers of R software. The R Consortium provides support to the community in multiple ways. One example of such support is the grant programme run by the R Consortium's Infrastructure Steering Committee (ISC), which funds development of projects seeking to promote improvement of the R infrastructure and to achieve long-term stability of the R community.
R is an ever-growing environment, as can be seen in the number of R packages that are developed every year (Fig. 1). There are now hydrological packages for every step of a standard hydrological workflow (Fig. 3); we describe each of these steps in subsequent sections.
3.1 Setting up a repository and finding the right packages
Setting up a repository with version control (i.e. a reviewable and restorable history) at the start of a research project has many advantages. A repository is a structured set of files that will track edits any team member makes to the project, similar to the track-changes function in common word processors. In R, version control can be implemented quite simply by connecting RStudio with Git or Subversion through hosting services like Bitbucket, GitHub, GitLab (which are like Dropbox for code). There are just a few initial steps to set up a repository. These include (1) creating a local directory (folder) to host your (RStudio) project, (2) creating a Git or a Subversion repository online, and (3) linking the two. Beyond those three steps, all the user needs to do is regularly commit (i.e. save) their code together with a very brief summary of the changes made. These changes can then be uploaded, updating and synchronizing the online repository with labelled annotations (username and timestamp). The repository can be public or private, with different levels of administrator access for users. Many tutorials on how to set up a repository in R can be found online. One example is the Software Carpentry course on R for Reproducible Scientific Analysis (https://swcarpentry.github.io/r-novice-gapminder/), which also provides valuable suggestions on how to structure a project repository (e.g. with read-only source data, disposable generated data, and folders such as “scr” for scripts and “doc” for documentation).
Once a project folder or repository has been set up, one might need to identify the most useful R packages and functions for the task at hand. CRAN Task Views were recently developed to provide thematic lists of the packages that are most relevant to specific disciplines. The Hydrology Task View for “Hydrological Data and Modelling” (https://cran.r-project.org/web/views/Hydrology.html) was published to the CRAN in January 2019 and lists over a hundred packages under the following categories:
-
Data retrieval. This includes hydrological data sources (surface or groundwater, both quantity and quality) and meteorological data (e.g. precipitation, radiation, and temperature, both measurements and reanalysis).
-
Data analysis. This includes data tidying (e.g. gap filling, data organization, and quality control), hydrograph analysis (functions for working with streamflow data, including flow statistics, trends, and biological indices), meteorology (functions for working with meteorological and climate data), and spatial data processing.
-
Modelling. This includes process-based modelling (scripts for preparing inputs and outputs and running process-based models) and statistical modelling (hydrology-related statistical models).
Additionally, many of the other 38 Task Views that were available in January 2019 were relevant to hydrology (https://cran.r-project.org/web/views). For example, the Environmetrics Task View contains a Hydrology and Oceanography section, and the High-Performance and Parallel Computing with R Task View can also be useful for hydrologists using large amounts of data. Other relevant Task Views cover a range of topics such as time-series analysis, machine learning, or spatial analysis.
One last way of discovering relevant and useful hydrological packages is social media, such as Twitter, where many hydrologists share their most recent publications as well as links to useful resources and packages. Some of the Twitter handles that highlight relevant packages for computational hydrology include the USGS group supporting R scientific programming (https://twitter.com/USGS_R) or the rOpenSci page (https://twitter.com/ropensci).
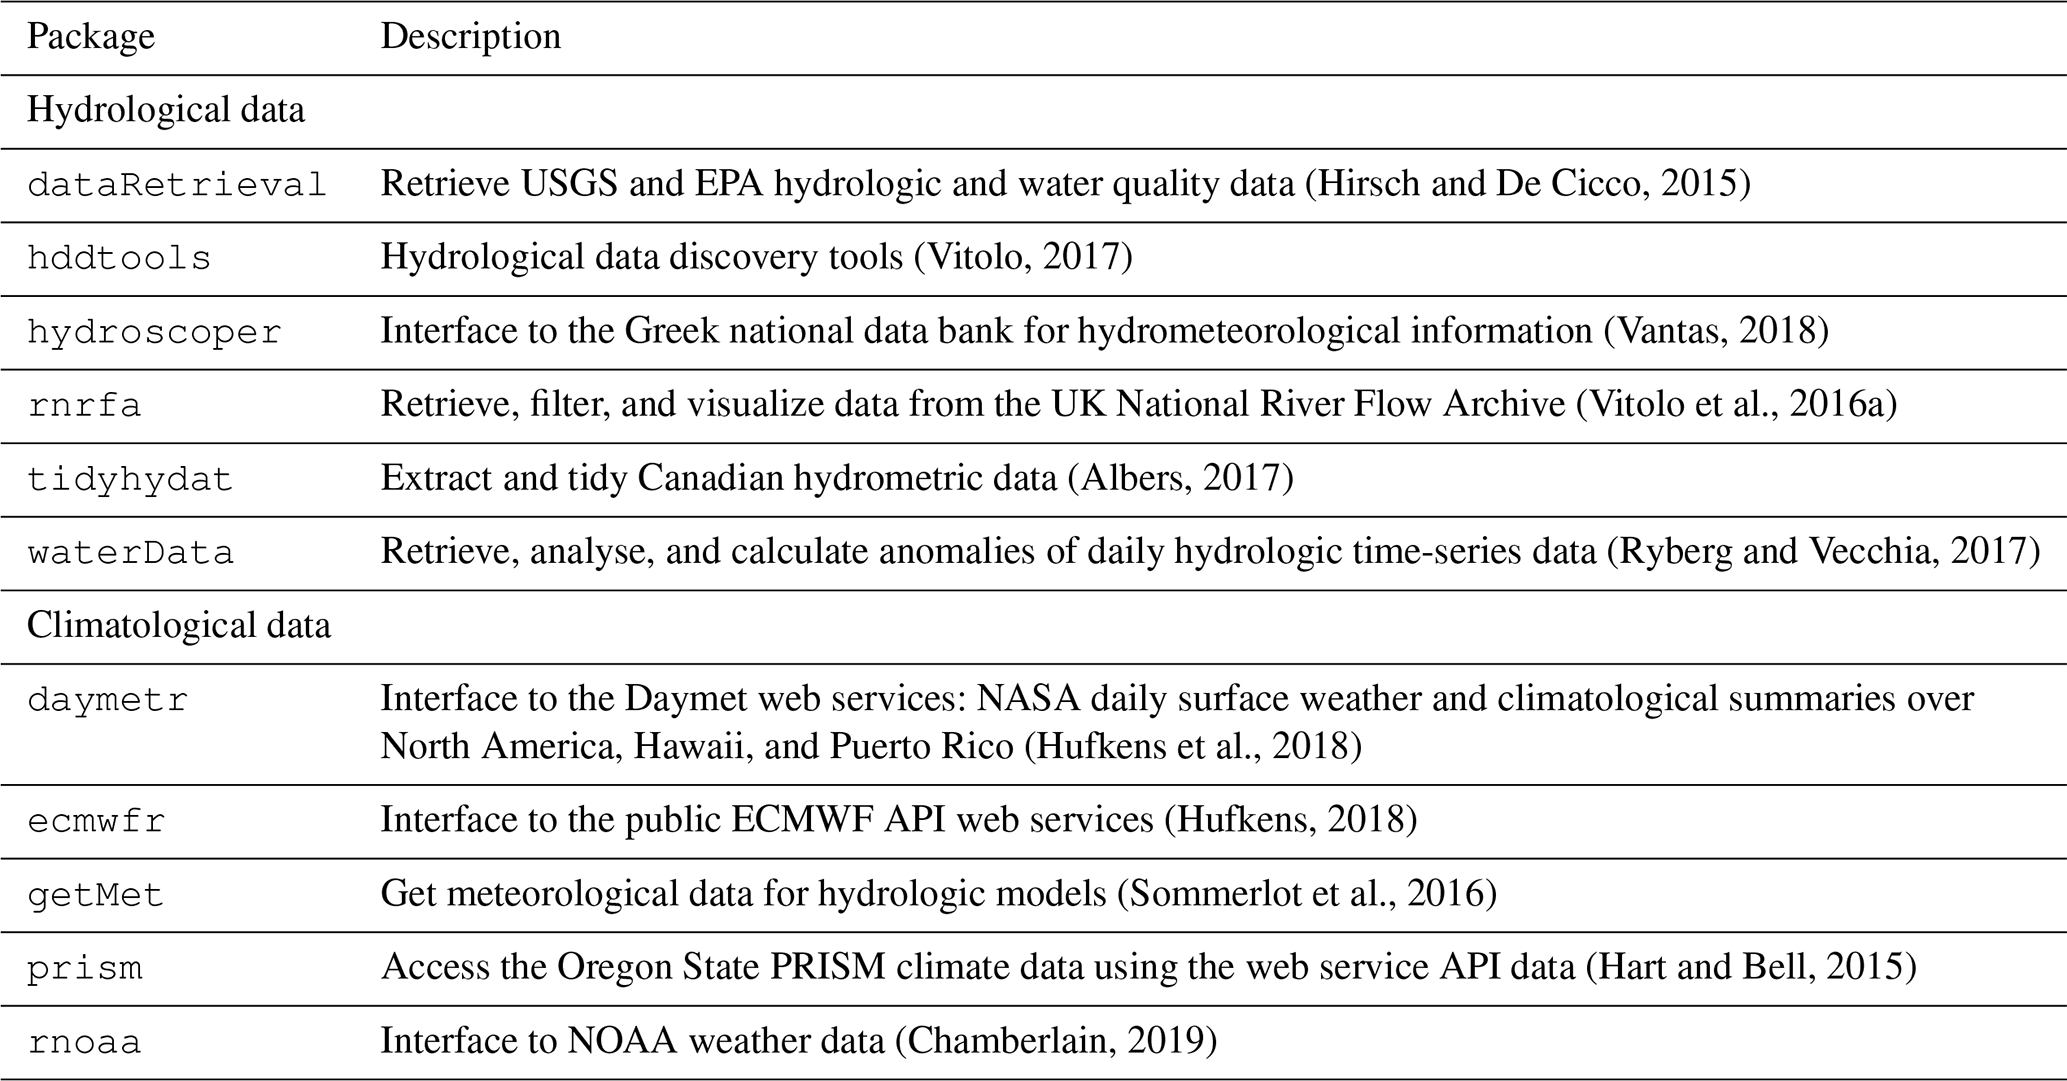
3.2 Packages for retrieving hydro-meteorological data
One of the most useful computational advances in recent years has been the development of packages designed specifically to retrieve data from online hydrological archives.
Different packages have been designed for importing hydrometric data from repositories such as dataRetrieval for the US Geological Survey (USGS) National Water Information System (Hirsch and De Cicco, 2015) or rnrfa for the UK's National River Flow Archive (Vitolo et al., 2016a).
Many of these packages provide vignettes that illustrate how to use the functions.
For example, the USGS's waterData package allows the user to import USGS daily hydrological data from the USGS web services, plot time-series data, fill in missing values, or visualize anomalies over a range of timescales (e.g. 1 year, 30 d, or 1 d) in just a few lines of code (see the waterData package vignette on the CRAN; Ryberg and Vecchia, 2017).
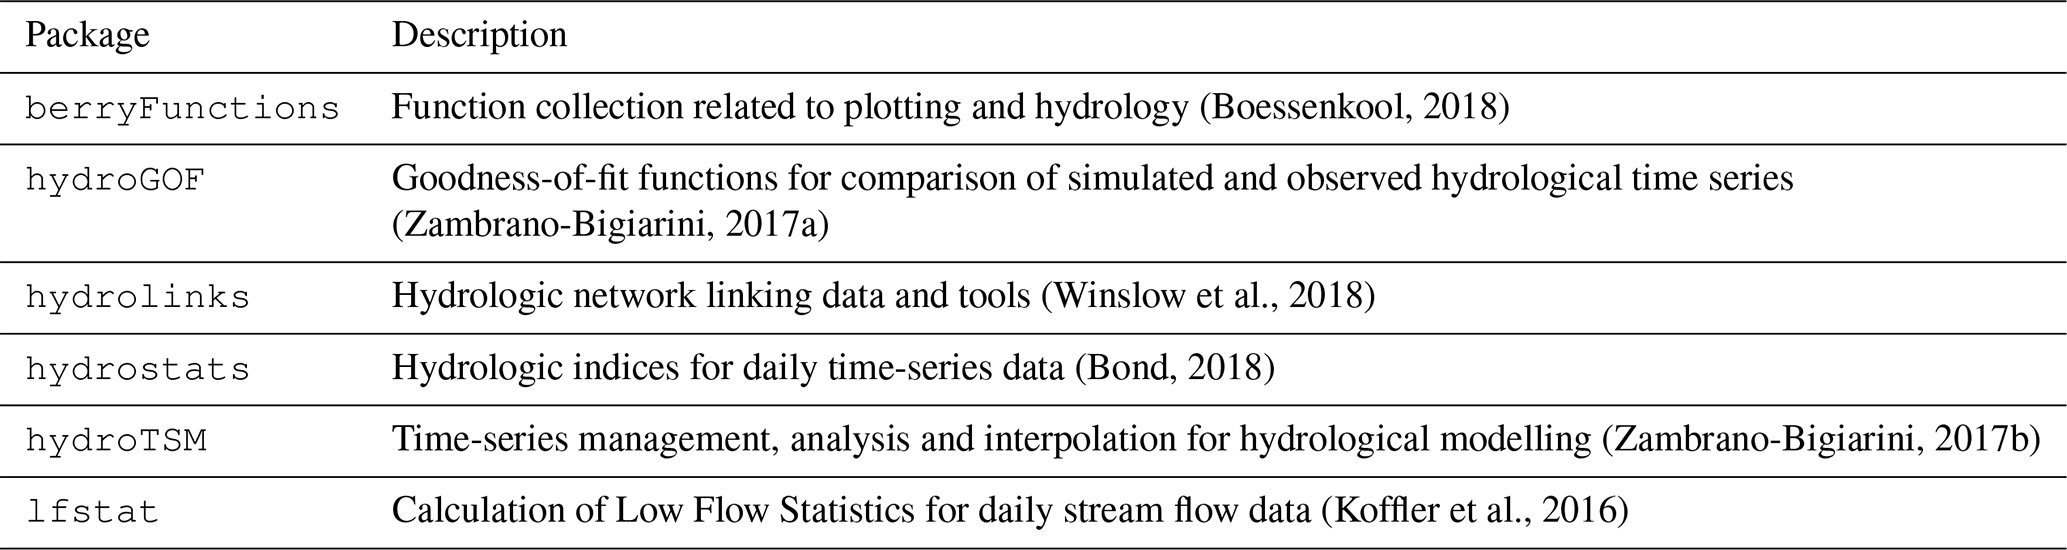
Other relevant packages are listed in Table 1.
Additionally, many data retrieval packages that are relevant to hydrological analyses have been developed by related scientific disciplines, such as meteorology and climatology.
In the future it seems likely that most water and meteorological agencies around the world will facilitate access to these data via APIs and open-source packages (see Sect. 5.4 for further information on APIs and the possible future of hydro-meteorological data provision).
Table 1 is far from exhaustive, and there are many other relevant packages that are available on CRAN.
For example, the new ecmwfr package provides a straightforward interface to the public ECMWF Web API Services and the Copernicus Climate Data Store (CDS), where open datasets such as the ERA5 reanalysis are openly available (Hufkens, 2018).
Table 1Examples of packages for hydrological and/or meteorological data retrieval. See the Hydrology Task View for latest additions (https://cran.r-project.org/web/views/Hydrology.html).
3.3 Packages for reading, manipulating, and cleaning the data
Once data have been retrieved or downloaded, a broad range of packages are available for reading different types of data and their associated metadata.
However, these packages are not specifically hydrological and so will be discussed here with brevity.
Note that in many cases, for example with the dataRetrieval package, the data are imported directly into the R workspace.
Basic data formats such as csv and txt can be read with base-R (read.table function) or with additional packages that form part of the tidyverse package suite (Wickham, 2017), which facilitate reading a range of formats including XLS(x), TSV, and FWF (e.g. package readr; Wickham et al., 2018b).
The rio package facilitates data import and export by making assumptions about data structure from the file extension (Chan et al., 2018).
For reading or writing netCDF files, a number of packages like ncdf4 (Pierce, 2017), easyNCDF (BSC-CNS and Manubens, 2017), stars (Pebesma, 2018b), or raster (Hijmans, 2017) can be used.
GRIB files can also be handled with packages such as raster or gribr (Wendt, 2018).
There is still relatively minimal support for Open Geospatial Consortium (OGC) services in R, although there are some packages such as sos4R (of which a new version is expected to be released on CRAN soon), ows4R (Blondel, 2018b), or geometa (Blondel, 2018a).
Observed hydro-climatological time-series data typically need to be “cleaned” because they suffer from various data gaps and errors. For an overview of the different issues with hydrological data, see Wilby et al. (2017). This step may involve handling missing data, checking data completeness, reshaping and aggregating data, or converting strings to date format. We do not develop this section specifically because these are general tasks in R. However, for overviews and tutorials on manipulating and cleaning hydrological data, we point the reader to published resources from the Using R in Hydrology workshop (see Sect. 5.6).
3.4 Packages for extracting driving data, spatial analysis, and cartography
In the past, R may have been a less powerful alternative to the more established spatial software for processing large datasets and extracting information. Now, however, R can be parallelized more easily than other software (harnessing the power of multiple processor cores to handle large datasets) and can integrate GIS analyses within a complete, automated hydrological workflow, which includes data processing steps (before or after any GIS analyses) and any subsequent statistical analyses. It is this integration of GIS as one step within the hydrological workflow that makes R extremely attractive. As a result, in recent years, R has become the go-to method for geocomputation and geostatistics and can now be used as a GIS in its own right. Multiple books have been published on the topic of spatial analysis and mapping with R (Brunsdon and Comber, 2015) or, more broadly, geocomputation with R (Lovelace et al., 2019), which includes topics such as reading and writing geographic data and making maps in R.
Many methods are now implemented within R for handling vectorial data, with packages such as sp (Pebesma and Bivand, 2005; Bivand et al., 2013) for plotting data as maps or, for spatial selection, the package rgdal (Pebesma and Bivand, 2005; Bivand et al., 2013), which provides bindings to the Geospatial Data Abstraction Library (GDAL) for reading and writing data and access to projection and transformation operations from the PROJ.4 (Urbanek, 2012) library, package rgeos (Bivand and Rundel, 2018), which provides an interface to the Geometry Engine Open Source (GEOS) library for geometrical operations, or package sf (Pebesma, 2018a), which provides support for simple features to encode spatial vector data.
Version 3.0 of ggplot2 offers support for visualizing sf objects directly with a specific geometric object (geom_sf), which allows users to visualize spatial data (raster and shape files) easily.
There is also a range of packages for handling raster data, like raster (Hijmans, 2017), which can be used to read, write, manipulate, analyse, and model gridded spatial data, and stars (Pebesma, 2018b) for reading, manipulating, writing, and plotting spatio-temporal arrays.
With all these packages, R now has full cartography and mapping functionality and can produce sophisticated maps that are either static or interactive.
Packages such as cartography (Giraud and Lambert, 2016) or tmap (Tennekes, 2018) can both be used for creating symbols, choropleth, or other types of maps and for facilitating the visualization of spatial data distributions in thematic maps.
These two packages are quite similar in content but not in form: cartography uses the painter's model, while tmap uses The Grammar of Graphics and allows users to draw static and dynamic maps with the same code.
Additionally, ggmap (Kahle and Wickham, 2013) is commonly used for visualizing, geolocating, and routing spatial data on top of static maps such as Google Maps; RgoogleMaps is used to interact with Google Maps, while the JavaScript leaflet (Cheng et al., 2018) library can be used for creating interactive web maps.
R software can also be linked to a range of other GIS software to take advantage of specific capabilities.
R can access ArcGIS geoprocessing tools (ESRI, 2018) by building an interface between R and the ArcPy Python side package using the RPyGeo package (Brenning et al., 2018b).
R can also call wrappers for GDAL–OGR utilities (GDAL Development Team, 2018) using gdalUtils (Greenberg and Mattiuzzi, 2018).
There are also interpreted interfaces between the GRASS GIS (GRASS Development Team, 2019) and R from within the GRASS environment or from R using the packages spgrass6 (Bivand, 2016) or rgrass7 (Bivand, 2018).
R can be integrated with the QGIS software (QGIS Development Team, 2018) using RQGIS (Muenchow et al., 2017) or with SAGA GIS (SAGA Development Team, 2008) using RSAGA (Brenning et al., 2018a).
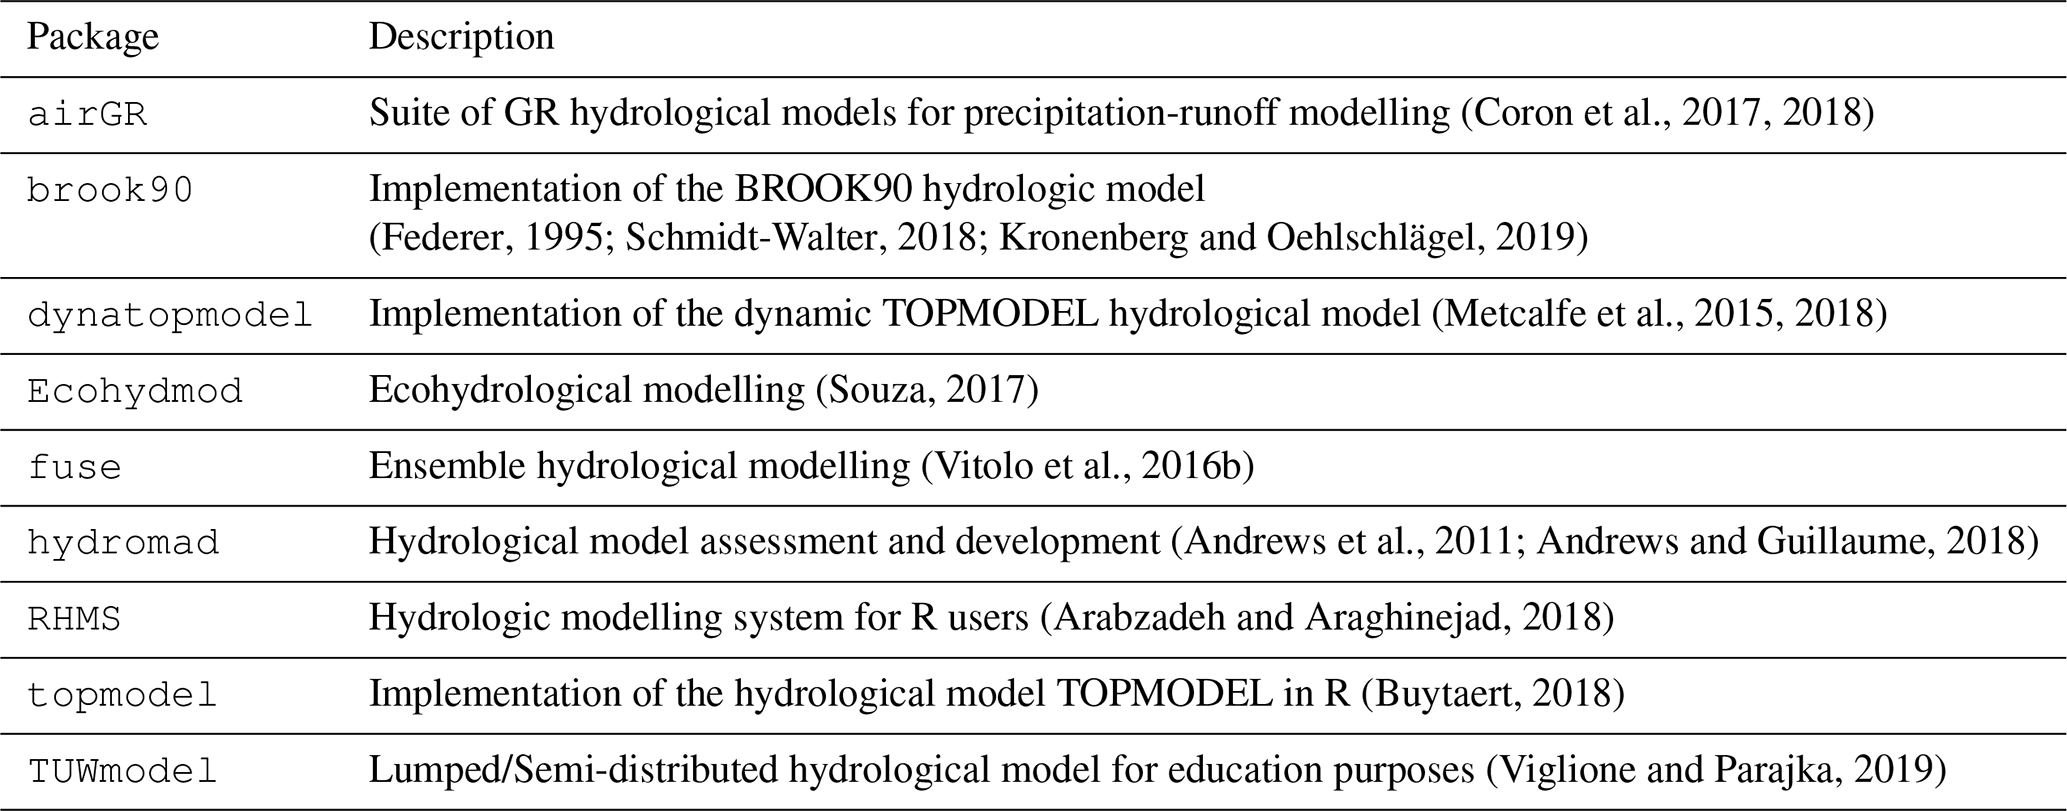
Table 2Examples of packages for hydrological modelling. See the Hydrology Task View for latest additions: https://cran.r-project.org/web/views/Hydrology.html.
3.5 Packages for hydrological modelling
The next step in a typical hydrological workflow is to conduct hydrological modelling by using the data inputs prepared in previous steps. Hydrological modelling often proceeds by simplifying hydrological processes to test hypotheses about the water cycle, manage water resources, reconstruct incomplete flow time series, predict extreme events (floods or low flows), or anticipate the effects of future climatic or anthropogenic changes. In Table 2 we highlight some of the key packages that facilitate the implementation of certain hydrological models in R. As R can be used for every step within the hydrological modelling process, from importing and cleaning data to exploratory analyses, data modelling, data analysis, and graphical visualization, it represents an ideal language for hydrological modellers.
Several well-known hydrological models are provided in these packages, such as the HBV model in the TUWmodel package (Viglione and Parajka, 2019), TOPMODEL in the packages topmodel (Buytaert, 2018) and dynatopmodel (Metcalfe et al., 2015, 2018), SWAT in SWATmodel (Fuka et al., 2014), GR4J in airGR (Coron et al., 2017, 2018), and hydromad (Andrews et al., 2011; Andrews and Guillaume, 2018).
Some packages also include degree-day snow models (e.g. airGR, hydromad, and TUWmodel) that are used in nival basins to simulate the accumulation and melt of the snowpack, which greatly impacts the flow regimes.
Many of the models included in these packages are lumped (i.e. consider the catchment as a single unit with area-averaged variables) or conceptual (i.e. provide a simplified representation of the physical processes with empirical equations describing the interactions between the processes) models.
Some packages, such as TUWmodel and topmodel, allow a spatial distribution of the hydrological processes. TUWmodel, for instance, allows the user to implement a semi-distributed application with differentiation into elevation zones, while topmodel allows the user to make topographic index classes from a topographic index map.
The FUSE model (Clark et al., 2008), originally implemented in Fortran, is still actively developed and also has a dedicated R package called fuse (Vitolo et al., 2016b) that is a re-implementation of the FUSE 2011 model.
The vast majority of the models in the above packages are deterministic; however, the fuse package can also provide ensembles of conceptual lumped hydrological models, and the hydromad package is intended to provide a flexible framework for assembling different soil moisture accounting and routing schemes.
The above packages typically allow the user to run the hydrological models, and usually provide some sample input data, with executable examples.
Some packages provide optimization algorithms, criteria calculation, and dedicated plotting functions (e.g. airGR and RHMS).
Developing hydrological modelling packages in R is relatively straightforward because of the language's flexibility;
additionally, as discussed in Sect. 2.4, R can be connected to other programming languages.
This property allows R users to embed model codes that already exist into R and provides a more friendly environment, as many packages ease the analysis of data and model simulations.
3.6 Packages for hydrological statistics
R was initially developed as a statistical computing language and is still the primary language in which novel statistical methods are coded and distributed.
Statistical approaches are employed for an extremely wide range of tasks in hydrology, and it is virtually impossible to give complete coverage of all possible packages that might be useful to hydrologists.
The skimr package provides compact and flexible summaries of data; it can be used with pipes and displays nicely in the console.
Many estimating procedures can be carried out using the base-R stats package, which includes, for example, correlation analysis and Mann–Kendall testing, linear regression, Poisson regression, and Gamma regression.
There are also generalist packages for non-parametric trend tests such as trend (Pohlert, 2018), which includes a broad range of tests for trend detection, correlation, and detection of change points or non-randomness.
Many general modelling packages have been found to be useful by hydrologists, for example mgcv (Wood, 2017), VGAM (Yee et al., 2015), and GAMLSS (Rigby and Stasinopoulos, 2005), which implements generalized additive regression models for a large number of distributional families. While mgcv can be useful for more complex smoothing approaches (e.g. tensor product smooths or varying coefficient models), the focus of GAMLSS is to develop flexible models for a large class of distributions which are not part of the exponential family of distributions, allowing for parameters other than the location to be modelled as a smooth function of the covariates of interest. A hydrologist might therefore choose which package to use depending on the most likely distribution of the data which are being analysed and the complexity of the analysis.
The caret package (Kuhn et al., 2018) is more commonly used for predictive modelling and machine learning, as it allows the user to develop an impressive range of predictive models (e.g. neural networks, deep learning, and decision trees).
There are many packages available for common hydrological tasks.
A comprehensive set of functions for carrying out extreme value analysis (Coles, 2001) can be found in the extRemes package (Gilleland and Katz, 2016), and a more complete overview can be found in the CRAN Extreme Value Analysis Task View.
nsRFA consists of a collection of statistical tools for objective (unsupervised) applications of the regional frequency analysis methods in hydrology (Viglione, 2018).
L-moments can be implemented using the lmom Hosking (2019b) package, while the lmomRFA package (Hosking, 2019a) enables regional frequency analysis.
The lfstat (Koffler et al., 2016) package provides functions to compute statistics and plots for low flows similar to those in the manual on low-flow estimation and prediction (WMO, 2009).
Many of the standard model evaluation metrics are provided directly within these packages.
The caret package, for instance, imports other packages, such as ModelMetrics (Hunt, 2018), to facilitate model evaluation directly.
A range of packages have also been developed specifically for model evaluation.
The hydroGOF package (Zambrano-Bigiarini, 2017a) provides goodness-of-fit functions specifically for comparison of simulated and observed hydrological time series.
In Table 3 we present a brief overview of some other packages for hydrological statistics.
For a broader overview of available packages and further examples, we point the reader to the CRAN Task View on machine learning and statistical learning (https://cran.r-project.org/web/views/MachineLearning.html).
3.7 Packages for static and dynamic hydrological data visualization
Data visualizations play an important role in hydrological analysis: R makes them straightforward to implement and allows considerable flexibility.
R includes three main families of graphics packages: a painter model, natively present in R and based on the S language's GR-Z model (Becker and Chambers, 1977), the trellis graphs (e.g. the lattice package; Sarkar, 2008) initially implemented in S, and The Grammar of Graphics (Wilkinson, 1999).
The last two families are both based on the grid package (R Core Team, 2018), a low-level abstraction layer that allows the development of graphical packages with different philosophies, which means that the created graphics can be stored in objects to be updated and plotted again later.
base-R can produce publication-quality figures; it includes a series of functions and methods that allow the user to plot various types of visualizations and the output of statistical models.
Visualizations are produced in base-R using the graphics package (R Core Team, 2018), which relies on the philosophy of superimposing elements of the graphics (with no provision for deleting an element once it is drawn) and includes a range of functions to add straight lines, arrows, axes, boxes, grids, legends, or annotation to a plot.
While visualizations produced in base-R are highly customizable, other packages provide more consistent interactions and a suite of highly useful functions to summarize, highlight, and split and/or layer data with a minimal amount of code.
A community favourite is the package ggplot2, created by Wickham (2016b), which allows a high level of flexibility and “tuning” of the graphs depending on the users' needs.
ggplot2 is an implementation of The Grammar of Graphics and allows users to build almost any type of graphic (see the R graph gallery at https://www.r-graph-gallery.com).
ggplot2 also contains functions like “facets” (https://plot.ly/ggplot2/facet), which allow the user to split and plot the data by categories in many different rows or columns.
Figure 4 provides a hydrological example of faceting where a statistical model is visualized for different seasons (rows) and different peak-over-threshold quantities (columns).
Dynamic charts – where the user can, for instance, hover over one or multiple points to read the associated data or metadata (e.g. a hydrometric station number or the value of a point) – have also grown in popularity in hydrological analyses in recent years.
These dynamic graphics are particularly useful in inspecting data, such as outliers, or explaining an analysis when teaching hydrology in the classroom (e.g. by zooming in on different parts of a time series).
Dynamic graphics including maps can be created by using the plotly package (Sievert, 2018), a graphic library that allows the user to make graphs interactive with minimal extra code.
A number of JavaScript-based visualization libraries can also help achieve dynamic graphics.
For interactive time-series data requiring axis display features such as zooming and panning and highlighting of series and points, the dygraphs package (Vanderkam et al., 2018) provides an interface to the JavaScript charting library.
The manipulate package (Allaire, 2014) allows the user to easily add sliders and other control tools to otherwise static plots.
Other JavaScript-based packages include rbokeh (Hafen and Continuum Analytics, Inc., 2016), which provides an interface to Bokeh, allowing the user to create web-based plots with hover and dynamic functionalities.
rAmCharts (Thieurmel et al., 2018) creates interactive charts based on the amCharts JavaScript library, while the highcharter (Kunst, 2017) package is based on the Highcharts JavaScript library of graphics.
Examples of all of these implementations (including leaflet, dygraphs, plotly, rbokeh, highchart, and other visualization libraries) can be found at https://www.htmlwidgets.org.
We encourage the reader to explore these HTML widgets, as they show how simple it is to implement dynamic graphics with just a line or two of R code.
Choosing the appropriate colour gradients for hydrological graphs and maps is key. It is widely accepted now that certain colour schemes, and notably the infamous rainbow colour scale, are poor choices for data visualization (Light and Bartlein, 2004; Stauffer et al., 2015). The rainbow scheme has been shown to distort perceptions of data and alter meaning by creating false boundaries between values; additionally it is not colourblind-safe, and other alternatives like perceptually uniform colour maps have been suggested (Crameri, 2018). The R language is strong in the area of colour gradients, and there are many colourblind-friendly palettes available for hydrology that follow effective data visualization guidelines (Kelleher and Wagener, 2011).
There are both manually defined and predefined palettes using packages such as RColourBrewer (Neuwirth, 2014), colorspace (Zeileis et al., 2019), colorRamps (Keitt, 2012), or viridis (Garnier, 2018).
For example, the colorspace package can be used for colour palettes based on hue chroma luminance (HCL colour palettes are based on how humans perceive colour, in contrast to the RGB colour space, which is based on technical demands of TV/computer screens) in meteorological visualizations (Stauffer et al., 2015).
3.8 Packages for creating presentations and documents
A vast array of packages have been developed in R for creating dynamic presentations and documents, which are particularly useful for illustrating hydrological concepts.
Dynamic interfaces and web-based applications can be created with shiny (Chang et al., 2015), such as the airGRteaching (Delaigue et al., 2018a, b) interface (Fig. 6; see Sect. 5.5).
R can also be used to generate animated GIF files for presentations, for example to highlight temporal changes in land cover or reservoir levels from earth observation.
GIFs can be created using, for example,
gganimate (Pedersen, 2018) to animate ggplot2 and create videos and animated image files or
caTools (Tuszynski, 2018) for reading and writing GIF and ENVI (flat-binary raster files with an accompanying ASCII header file) files.
Additionally, various packages have been designed to produce interactive maps, such as
leaflet (Cheng et al., 2018),
leafletR (Graul, 2016),
plotGoogleMaps (Kilibarda and Bajat, 2012), or
googleVis (Gesmann and de Castillo, 2011).
R also offers many tools for creating websites or blog posts, with packages like
rmarkdown (Allaire et al., 2018c),
blogdown (Xie et al., 2017), or
pkgdown (Wickham and Hesselberth, 2018).
Presentations, books, reports, and documents can be generated in LaTeX, or Markdown, natively with Sweave functionalities or with packages such as knitr (Xie, 2018), markdown (Allaire et al., 2018a), rmarkdown (Allaire et al., 2018c),
pagedown (to paginate the HTML output of R Markdown with CSS for printing; Xie and Lesur, 2019), or
bookdown (Xie, 2016).
These packages facilitate the automation of such documents (e.g. monthly reports) through in-line text tokens that are dynamically linked to data in R's workspace.
4.1 Hydrological libraries, documentation, and vignettes
For most hydrologists who are new to R, the initial hurdle is understanding how to install libraries and use packages to explore their own datasets. The book R packages (Wickham, 2015) is freely available online and explains everything from the basic installation of packages to the role of metadata, understanding documentation, the role of vignettes, and best practice on GitHub (one common collaboration and version control platform).
R packages centralized on CRAN are structured similarly, with a reference manual, source code, a license file, and other common elements. The code and documentation of all packages is verified before they are uploaded to CRAN. R packages ideally provide two forms of documentation: a short form (help pages) and a long form (vignettes), which are both complementary and serve different purposes (Wickham, 2015). The help pages explain what each function does, describe the required input and the produced output, and usually include a section with executable examples. Vignettes, in contrast, are tutorials that illustrate how R packages and their functions are used, often with discussion of the outputs. However, not all packages include a link to a vignette on the CRAN repository, as this is not compulsory. Developing clear and useful vignettes is one of the key challenges in facilitating the uptake of new packages and methods; in fact these are key to reducing the misuse of software and ensuring that the package users understand the methods. Use cases can be written as blog posts or tutorial-style papers, with explanation of how to correctly interpret and implement a specific method and helping the community move forward.
4.2 Integrated development environments (IDEs): facilitating the use of R
IDEs are software applications that are used to facilitate coding by providing the code editor, compiler, or interpreter and debugger within a single graphical user interface (GUI). A range of IDEs exist for R, such as Eclipse – StatET, (an Eclipse-based IDE; e.g. des Riviêres and Wiegand, 2004; Wahlbrink, 2016), Emacs Speaks Statistics (ESS; an add-on package for GNU Emacs; Rossini et al., 2004), Microsoft's R Tools for Visual Studio (RTVS; a plug-in for the Microsoft Visual Studio IDE; e.g. Beard, 2016), RKWard (which integrates with the KDE desktop environment; Rödiger et al., 2012), Tinn-R (a replacement for the basic code editor designed to replace Rgui; Faria et al., 2008), or Vim or Neovim (a terminal-based working environment designed to facilitate working in a pure command-line interface; e.g. Neil, 2018).
The RStudio IDE (RStudio Team, 2018) is the most popular of the IDEs. RStudio facilitates the uptake of R by hydrologists by providing a helpful research tool and training environment to new and experienced programmers alike. RStudio is available in two editions: an open-source edition and an enterprise edition with a commercial license. Both can run on a desktop (RStudio Desktop) or server (RStudio Server) and can be installed on different platforms (Windows, macOS, and Linux). Most hydrologists use the free RStudio Desktop edition, although university departments and companies increasingly offer server editions too. RStudio's features include a console; a syntax-highlighting editor that supports direct code execution; integrated R help and documentation; support for version control systems; and tools for plotting, history, debugging, and workspace management.
The RStudio environment makes it straightforward for hydrologists to conduct a range of tasks (e.g. visualize data; create dynamic graphs or web applications with shiny; use version control; or develop and view R Markdown presentations, for example in LaTeX, HTML, or presentation slides), all within the IDE.
Other advantages of RStudio include the easy access to the help window, the ease of package management and updating, code debugging, or even the easy development of packages in one location.
All of these benefits contribute to facilitating open hydrological science.
RStudio version 1.2 includes many new features to help interact with other programming platforms, such as the reticulate (Allaire et al., 2018b) and r2d3 (Luraschi and Allaire, 2018) packages, which make it easy to call Python and D3 from within R sessions and R Notebooks.
An exhaustive list of features can be found on the RStudio website (https://www.rstudio.com/products/RStudio).
4.3 Big data and parallel computing challenges in hydrology
In the early years of R, the software was unable to handle large data files exceeding millions of rows or complex data formats.
However, both of these limitations have since been overcome.
Some of the early packages for handling large data files include bigmemory (Kane et al., 2013) or biganalytics (Emerson and Kane, 2016), where matrices are allocated to shared memory and use memory-mapped files.
More recently, the package data.table (Dowle and Srinivasan, 2018) has gained increasing popularity for enhanced data frames, allowing fast aggregation of large data (e.g. 100 GB in RAM) or fast ordered joins.
In hydrology, some of the spatial data handling packages are particularly relevant, such as the sf package (Pebesma, 2018a) for large shape files or the feather (Wickham, 2016a) package for feather files, a lightweight binary columnar data store designed for maximum speed.
Database connections can be established using a range of packages such as RPostgreSQL (Conway et al., 2017) or RSQLite (Müller et al., 2018).
Distributed data frames can be implemented using packages such as sparklyr (Luraschi et al., 2018).
As the volume of available data increases and hydrologists use a greater number of models and ensembles, parallel computing – where many calculations are carried out simultaneously instead of sequentially – has become an essential tool in computational hydrology and has sped up analyses.
For instance, instead of using traditional for-loops (an approach where one action is carried out over a dataset iteratively), the data may be broken down into groups (e.g. by year or by season), and functions can be applied to each group in parallel.
The performance boosts that can be achieved by parallelizing the code (i.e. using more than one core at a time) are considerable.
Even without access to a high-performance computer or cluster, it is possible to perform hydrological tasks faster, since most local machines now have between 4 to 16 cores.
R has multiple facilities and packages for enabling the parallelization of code execution.
At the most simple level, base-R functions like lapply and sapply can be used to apply a specific function to a vector or list input, which can speed up analyses considerably.
For instance, the base-R parallel package for distributed computing provides methods to access additional computational power by allocating available processing cores into a cluster.
The foreach (Microsoft and Weston, 2017) and doParallel (Microsoft Corporation and Weston, 2018) packages can also be used together to execute “for-each” loops in parallel.
Other packages that are widely used for parallel computing in hydrology and other areas include the snowfall (Knaus, 2015) package, which facilitates the development of parallel R programs, e.g. by including extended error checks.
Additionally, some packages have parallel functionalities that are integrated directly within the package, such as the h2o package (LeDell et al., 2018) that provides an interface to H2O, a scalable platform offering parallelized implementations of supervised and unsupervised machine learning algorithms.
As we have shown above, the development of R fosters progress in hydrology. In this section we discuss what we perceive as some of the future avenues for enhancing hydrological research or operational hydrological practice with R and how we can achieve these as a community.
5.1 Sharing R code with the community
Open research practices bring significant benefits to researchers (McKiernan et al., 2016), such as increases in citations, media attention, potential collaborators, job opportunities, and funding opportunities. Most importantly, sharing code increases the likelihood that an approach will be used by other scientists in their research and saves new users the trouble of “reinventing the wheel” and writing codes that have already been developed by others. There are many different platforms for sharing and publishing R code such as GitHub, Figshare, and RPubs or Plotly (also for dashboards and interactive plots). To obtain a DOI, users may wish to use repositories such as Zenodo, a general purpose open-access repository which allows researchers in the sciences and humanities to deposit datasets, research software, and create reports. The data publisher PANGAEA, additionally, is specifically tailored to archiving, publishing, and reuse of data in earth and environmental sciences. For further guidance, some of these platforms are discussed in the code and data policy section of the open-access journal Geoscientific Model Development.
5.2 R packages as a driver of progress in hydrology
The consistent stream of new R packages has been a great driver for progress not only in hydrology but even in science more broadly, as packages favour the uptake and development of methods.
Additionally, the open-source nature of R packages means that different users can contribute feedback to R package developers and help enhance existing code.
R users can raise issues for certain packages directly on online platforms hosting the repositories (such as GitHub or GitLab) to foster an online-documented discussion with the package developers (generating interaction in the community). Package authors can also add a bug report link or an email address in their package description file (common best practice for developers) to specify how they prefer to receive bug reports.
This feedback between users and developers is one key route to scientific progress.
Users can identify issues or suggest improvements by commenting on online collaboration platforms (e.g. GitHub or GitLab) or by emailing the developer or maintainer.
Most packages are hosted on these repository hosting platforms before becoming available via the CRAN archive, ensuring that a certain standard and best practice are met.
Although CRAN itself does not have any mechanism to check the quality or cleanness of the code, there is a suite of packages that are used to (i) ensure clean code and documentation that follow a widely accepted style guide, such as the lintr (Hester, 2018), goodpractice (Csardi and Frick, 2018), and hunspell (Ooms, 2018) packages and to (ii) rigorously test the functions against predefined outcomes, using for example the testthat package (Wickham, 2011).
In comparison with GitHub, CRAN is an organized repository which provides executables for several platforms, whereas finding an hydrological R package on GitHub can be difficult. The comparison between the two is somewhat like visiting a curated art auction versus an antique store. Additionally, CRAN has more thorough checks and gives visibility and/or searchability to a package, also signalling that the author intends to maintain the package over the long term.
Developing an R package requires a structured approach, just like writing a scientific paper. There are many generalist resources for writing R packages, such as the R package book (see http://r-pkgs.had.co.nz; Wickham, 2015) or a suite of video tutorials on YouTube. The main requirements for publishing a package are listed on the CRAN website. Providing documentation and tutorials, e.g. via blog posts or good README files, is essential. Package authors can also provide user-friendly and modular functions to aid maintenance and future development (e.g. through external contributions or suggested changes on online platforms). The RHub service also provides a “build and check” service for R packages (Csárdi, 2017).
Authoring hydrology-based R packages that can stand up to scientific scrutiny and ensure user-friendliness is not a minor task, and such investment should be recognized within the community. Fuelling the development and dissemination of new R-based methods is therefore the joint responsibility of developers, authors, and journal editors. If developers include digital object identifiers (DOIs) as well as instructions for citation within their software, then authors can subsequently cite these packages. The adequate reference or references can be obtained with the citation function for every package. The references generally comprise a reference to the package (with CRAN link and package version, which is key for encouraging reproducibility) and sometimes also include an additional journal paper reference. If both are available, then ideally both must be cited to provide recognition of computational scientists' contribution to the hydrological community and to enhance the reproducibility of the research. Editors might also support reproducibility via special issues or sections for technical notes. Dedicated software journals such as the Journal of Open Source Software can be used to publish brief, technical descriptions of R packages. Any potential apprehensions for publishing such methods (e.g. due to a lack of scientific scrutiny) can be alleviated through software peer review initiatives such as those provided by rOpenSci. It is worth noting that when writing new packages, the open-source approach has both pitfalls (risk of errors in new packages) and strengths (community review and range of tests that can be implemented via the above-mentioned packages).
5.3 Harmonizing hydrological workflows
One of the main challenges today for hydrological workflow harmonization is to standardize calls for data which are structured in different ways by data providers around the world. While the number of packages for hydrological data retrieval has grown considerably (see Table 1), the packages are structured differently because they were set up independently and because the underlying hydrological and hydrometric datasets differ from country to country. As more nations develop similar hydrological data acquisition packages, we believe it would be worth implementing a common syntax and data output form. For example, it would be ideal to use consistent APIs and output objects across packages. Suggesting the “ideal” format is beyond the scope of this paper, but a potential task force might be set up to help draft a way forward for the community. There is currently no effort to combine data retrieval packages from different regions, but it might be worth implementing a meta-package with functions that convert hydrometric data from other packages to a standard format or one for hydrological models to be run within the same framework. Additionally, the growing tendency towards data standardization at the global level may facilitate the development of consistent data retrieval packages. Examples of global data standards include WaterML, the Open Geospatial Consortium standards for hydrological time series, or TimeseriesML, a more generic candidate standard currently under discussion. As more water agencies and data providers adopt such standards, it will become much easier to develop consistent data retrieval packages, and in theory we may no longer require different packages for data retrieval because the only component that should change is the server endpoint.
5.4 APIs: hydrological data acquisition and provision
APIs play a key role in hydrological data acquisition and provision and are likely to become increasingly important in the future.
An API is a set of code which usually includes subroutine definitions, communication protocols, and tools for building software and interacting with different datasets.
APIs are specific to the use case by definition, but the interface is often provided in HTTP (i.e. web protocol) so that requests and responses can be made and received by a wide range of languages or systems.
For R users, hydrological interaction with HTTP APIs usually comes in the form of data acquisition packages such as the aforementioned packages rnrfa (Vitolo et al., 2016a), tidyhydat (Albers, 2017), or daymetr (Hufkens et al., 2018).
These packages provide means of posting requests via the R command line and then return an R object for subsequent manipulation.
Internally, the source code translates all inputs and outputs to and from HTTP.
Programmatically accessing a variety of vast online resources (i.e. data) in this way has considerably advanced our understanding of the earth sciences.
Recent developments, however, have opened up a new, and arguably under-utilized, approach to APIs for the R community: rather than exploiting an existing interface, R users can now increasingly rely on a set of tools to develop and make their own APIs accessible for use by third parties via HTTP.
Noteworthy projects here are OpenCPU (client and scalable cloud implementation; Ooms, 2014) and RStudio's plumbr package (Lawrence and Wickham, 2018).
API development is likely to become a major avenue of future advances in scientific computing within the hydrological community as well as interaction beyond the scientific realm.
Such APIs can provide access to the latest raw or analysis-ready data, methods, or even entire (statistical) models written in R.
The simplicity and ubiquitous implementation of HTTP have vast implications, of which we highlight four. (1) Common issues with interoperability between languages can be overcome, and more attention can be afforded to gaining insights rather than developing (often convoluted) language bridges (termed a “separation of concerns”; Heineman and Council, 2001). This means, for the first time, that fully seamless interaction between research groups working in different languages is possible (e.g. between R, Python, and MATLAB). (2) Computational infrastructure can be scaled with comparatively little technical knowledge, increasing R's aptitude to a wider range of applications. (3) Outputs can be made accessible to third parties with or without a deeper understanding of the underlying science. (4) Empirical data are rarely “clean”, and scientific computing hence has to be adaptable: R source code can be altered to account for changing data, while maintaining a standardized, public-facing API. To highlight potential strengths of such APIs, we provide a brief, interdisciplinary use-case scenario rooted in natural hazard management and hydrological sciences in Fig. 5.
5.5 Teaching hydrology in R
Due to its relative ease of use and open-source nature, R is increasingly being used as an interactive tool for teaching in the hydrological sciences. Many examples of typical hydrological analyses can be found online as tutorials (see for example, Hurley, 2018). The USGS also publish relevant examples as a hydrological blog at https://owi.usgs.gov/blog, which may be of interest to the community.
R packages such as airGRteaching or TUWmodel have also recently been developed to facilitate teaching of hydrological modelling.
The TUWmodel package (Viglione and Parajka, 2019) provides a lumped conceptual rainfall–runoff model based on the well-known HBV model (Bergström and Forsman, 1973) and is designed for educational purposes.
The airGRteaching package (Delaigue et al., 2018a, b) provides access to a suite of GR rainfall–runoff models such as GR4J for use by students with limited programming skills: only three basic functions are needed to prepare the data, calibrate a model, and run or evaluate a simulation, and a single function can produce plots directly using objects from the three previously mentioned functions.
In addition, a graphical shiny web application is included to explore data and model results with automatic updating of the plots and scores when the model parameters are modified by students; the app allows users to explore the internal fluxes and state variables of the models (Fig. 6).
Such tools can be used for understanding and illustrating the main hydrological processes and concepts and for relating them to hydrological models' components and parameters.
There is now an increasing number of online applications that allow beginners to learn R in a sandbox, i.e. a virtual space for testing coding online. Sandboxes are particularly useful for introducing basic methods in computational hydrology without having to master the technicalities of R. Examples of R sandboxes include the RStudio Cloud (https://rstudio.cloud), which can be used to learn, teach, or test R code. Another sandbox, initially called R-Fiddle, is now called datacamp-light (https://github.com/datacamp/datacamp-light). Many other R sandboxes can be found online. Thus, rather than installing R on multiple PCs, sandboxes can be used by educators or lecturers by asking students to connect directly to the web.
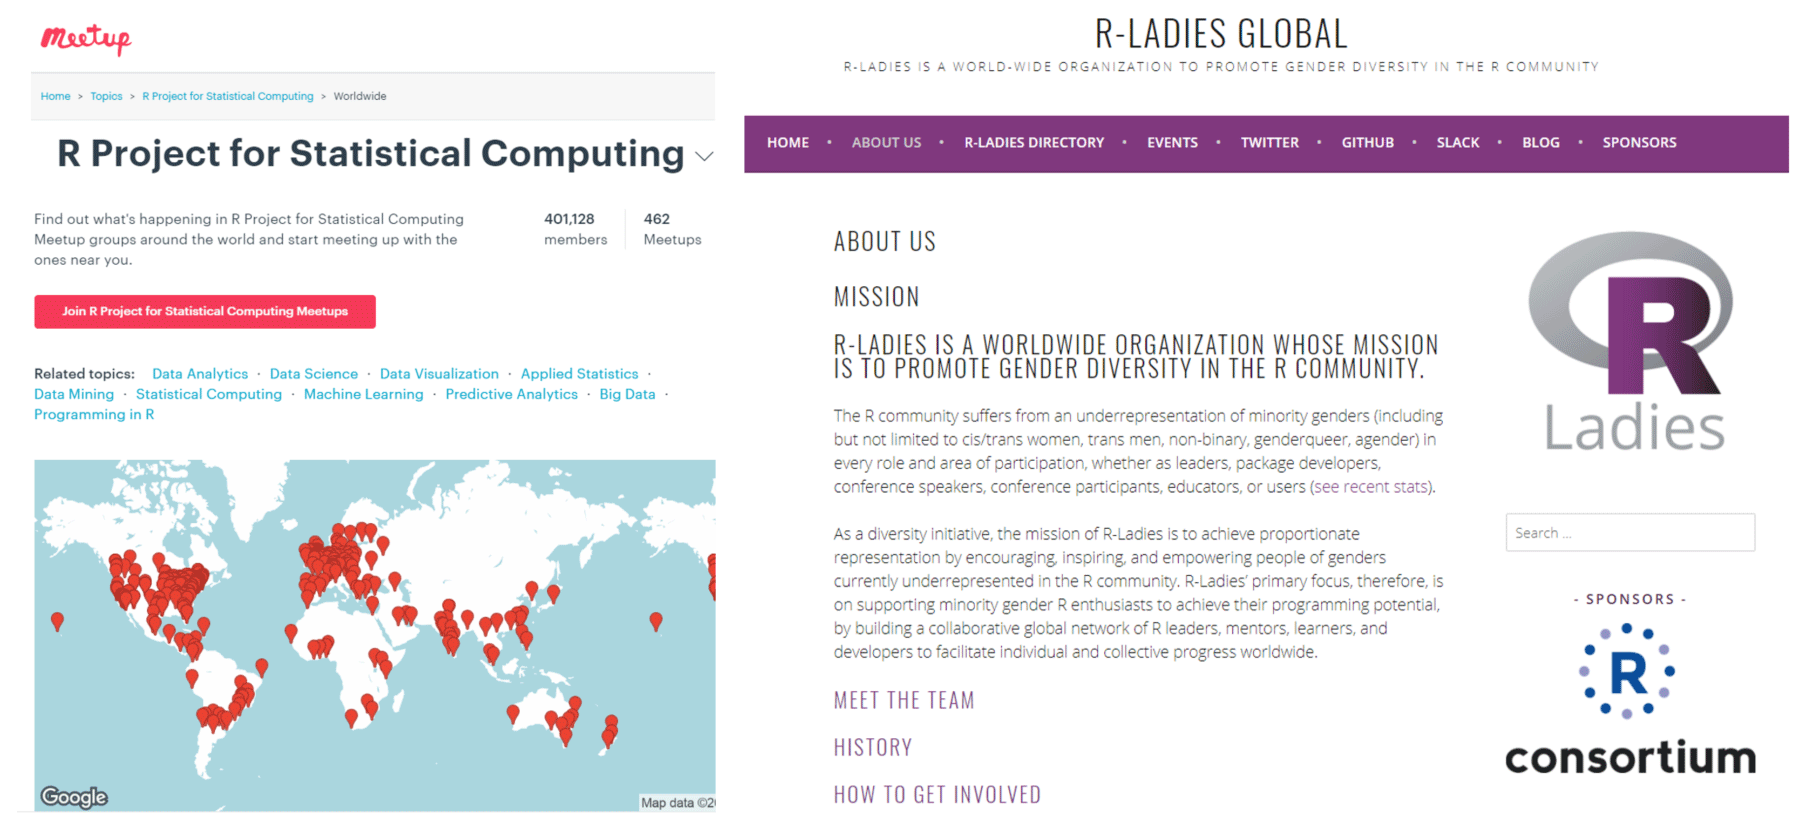
Figure 7The R community. Left: the R meet-up groups (https://www.meetup.com/topics/r-project-for-statistical-computing). Right: the R-Ladies global organization (https://rladies.org/about-us).
5.6 Developing the community: short courses, help desks, and meet-up events
This paper reflects the strong collective desire to develop the community of computational hydrologists in R. As mentioned in Sect. 2.5, the R-Hydro community has been meeting regularly in recent years at the EGU General Assembly during the short course Using R in Hydrology. This course is run annually by the YHS and is typically attended by a wide range of hydrologists, ranging from beginners to more experienced users (Fig. 2). The resources and teaching presentations from the short course are made available to the community online on the YHS GitHub pages (https://github.com/hydrosoc/) and archived on the Zenodo repository (see Boessenkool et al., 2017; Slater et al., 2018; Hurley et al., 2019). These presentations include a range of topics, such as obtaining, cleaning, and visualizing hydrological data with R; parallel and high-performance computing for hydrologists; automating tasks; using R Shiny with hydrological data; modelling the hydrological cycle in snow-dominated catchments; community-led initiatives; using R as a GIS; discharge time-series visualization; extreme value statistics; hydrological modelling; trend analysis; accessing hydrological data using web APIs; extracting gridded netCDF data; report generation; and other hydrological tasks in R.
Many other R conferences will be of relevance to the readers, including the useR! conference, RStudio, satuRdays, or eRum. These conferences are not specific to hydrology and earth sciences but usually have some discipline-specific sessions as well as sessions and short courses of general interest for learning R, including best practice, spatial analysis, and statistical methods. Many of these conferences also stream the talks and/or make resources available after the event.
The global reach of R meet-up groups has also grown rapidly, such as the official R user group meet-up (http://r-users-group.meetup.com). Many local initiatives for R users have regular meet-ups and seminar series and can be found either on the meet-up website or on social media web pages, such as Twitter (e.g. https://twitter.com/rusersoxford). There is also an ongoing push for greater inclusivity of under-represented groups in programming, as exemplified by the rapid growth of the global R-Ladies movement (Fig. 7).
In addition, the computational community has been trying to provide support to other programmers by running coding help desks such as at the American Geophysical Union (AGU) 2018 fall meeting in the career centre. Geoscientist volunteers ran the desk in 2018 to provide perspective and advice to other coders, with a range of short, 10 min tutorials on topics such as keeping track of code versions with GitHub, making high-quality plots, or using a new package or library. We anticipate that such help desks, short courses, and meet-up sessions will continue to help grow the computational hydrology community in future years.
Over the last decade, the open-source programming language R has acquired a central role in hydrological research as well as in the operational practice of hydrology. With the rapidly increasing number of packages that are now available for every step of the hydrological workflow, R facilitates a broad range of hydrological analyses from start to finish. This paper provides an overview of the use of the open-source programming language R in hydrology by describing these packages as well as the influence of R on the discipline. Both the flexible nature of the language and the diverse range of computational, visualization, and modelling tools (physically based and statistical) have facilitated the testing of hydrological theories over a range of spatial and temporal scales as well as interactive teaching of hydrology within the classroom.
By sharing codes, proposing new packages, or contributing to the improvement of existing packages, we believe that the R-Hydro community will continue to facilitate further advances in hydrology, with wide-ranging improvements of hydrological theory, models, and tools. These new computational tools and approaches are essential to achieving long-term goals in hydrology such as the IAHS Science Plan for the decade 2013–2022, “Panta Rhei: Change in hydrology and society”, which seeks to improve the assessment, attribution, and modelling of hydrological change. The rise of computational hydrology also plays a key role in enhancing the reproducibility of science and the computational literacy of both scientists and practitioners. Within scientific research labs, we anticipate that committing code to a repository will become standard practice, as will the submission and review of code along with papers, as part of the scientific publication process. In the future, as open-source programming, data science, and computational modelling become more widespread in schools and universities, it is plausible to expect that R will continue to play an increasing role in hydrology.
The data used to create Fig. 1 are publicly available; code to download the data and reproduce the figure is provided as a Supplement to this paper. All URLs mentioned in the paper were last accessed on 23 June 2019.
The supplement related to this article is available online at: https://doi.org/10.5194/hess-23-2939-2019-supplement.
All authors co-wrote the paper.
The authors declare that they have no conflict of interest
We thank two anonymous reviewers, Michael Stoelzle, and Paul Astagneau for comments that improved the paper. We also thank all those who have contributed to the R-Hydro community and the R community more broadly, whether by developing and sharing their code or helping and teaching others to use these tools. In particular, we thank the guest speakers who participated in the Using R in Hydrology EGU short course.
This paper was edited by Erwin Zehe and reviewed by Michael Stoelzle and two anonymous referees.
Abbott, M. B.: Hydroinformatics: information technology and the aquatic environment, Avebury Technical, Aldershot, 1991. a
Addor, N., Newman, A. J., Mizukami, N., and Clark, M. P.: The CAMELS data set: catchment attributes and meteorology for large-sample studies, Hydrol. Earth Syst. Sci., 21, 5293–5313, https://doi.org/10.5194/hess-21-5293-2017, 2017. a
Albers, S.: tidyhydat: Extract and Tidy Canadian Hydrometric Data, The Journal of Open Source Software, 2, 511, https://doi.org/10.21105/joss.00511, 2017. a, b
Allaire, J.: manipulate: Interactive Plots for RStudio, available at https://CRAN.R-project.org/package=manipulate, r package version 1.0.1, 2014. a
Allaire, J., Horner, J., Xie, Y., Marti, V., and Porte, N.: markdown: “Markdown” Rendering for R, available at: https://CRAN.R-project.org/package=markdown, r package version 0.9, 2018a. a
Allaire, J., Ushey, K., and Tang, Y.: reticulate: Interface to “Python”, available at: https://CRAN.R-project.org/package=reticulate, R package version 1.10, 2018b. a, b
Allaire, J., Xie, Y., McPherson, J., Luraschi, J., Ushey, K., Atkins, A., Wickham, H., Cheng, J., and Chang, W.: rmarkdown: Dynamic Documents for R, available at: https://CRAN.R-project.org/package=rmarkdown, R package version 1.10, 2018c. a, b
Andrews, F. and Guillaume, J.: hydromad: Hydrological Model Assessment and Development, available at: http://hydromad.catchment.org, R package version 0.9-26, 2018. a, b
Andrews, F., Croke, B., and Jakeman, A.: An open software environment for hydrological model assessment and development, Environ. Modell. Softw., 26, 1171–1185, https://doi.org/10.1016/j.envsoft.2011.04.006, 2011. a, b
Arabzadeh, R. and Araghinejad, S.: RHMS: Hydrologic Modelling System for R Users, available at: https://CRAN.R-project.org/package=RHMS, R package version 1.4, 2018. a
Archfield, S. A., Hirsch, R. M., Viglione, A., and Blöschl, G.: Fragmented patterns of flood change across the United States, Geophys. Res. Lett., 43, 10–232, https://doi.org/10.1002/2016GL070590, 2016. a
Backus, J.: The history of Fortran I, II, and III, ACM Sigplan Notices, 13, 165–180, 1978. a
Bates, D., Lai, R., Byrne, S., and contributors: RCall package, available at: https://github.com/JuliaInterop/RCall.jl, 2015. a
Beard, B.: Setup and Installation of R Tools for Visual Studio, in: Beginning SQL Server R Services, 33–71, Apress, Berkeley, CA, 2016. Beard, B., 2016. Setup and Installation of R Tools for Visual Studio. In Beginning SQL Server R Services (pp. 33-71). Apress, Berkeley, CA. a
Becker, R. A. and Chambers, J. M.: GR-Z: A System of Graphical Subroutines for Data Analysis, in: Computer Science and Statistics, 409–415, U.S. Dept. of Commerce, National Bureau of Standards: for sale by the Supt. of Docs., U.S. Govt. Print. Off., Gaithersburg, Maryland, 1977. a
Becker, R. A. and Chambers, J. M.: S: an interactive environment for data analysis and graphics, The Wadsworth statistics/probability series, Wadsworth Advanced Book Program, Belmont, California, 1984. a
Bellosta, C. J. G.: rPython: Package Allowing R to Call Python, available at: https://CRAN.R-project.org/package=rPython, r package version 0.0-6, 2015. a
Bengtsson, H.: R.matlab: Read and Write MAT Files and Call MATLAB from Within R, available at: https://CRAN.R-project.org/package=R.matlab, r package version 3.6.2, 2018. a
Berghuijs, W., Woods, R., and Hrachowitz, M.: A precipitation shift from snow towards rain leads to a decrease in streamflow, Nat. Clim. Change, 4, 583, https://doi.org/10.1038/nclimate2246, 2014. a
Bergström, S. and Forsman, A.: Development of a conceptual deterministic rainfall-runoff model, Nordic Hydrol., 4, 147–170, https://doi.org/10.2166/nh.1973.0012, 1973. a
Beven, K.: TOPMODEL: a critique, Hydrol. Process., 11, 1069–1085, https://doi.org/10.1002/(SICI)1099-1085(199707)11:9<1069::AID-HYP545>3.0.CO;2-O, 1997. a
Bezanson, J., Karpinski, S., Shah, V. B., and Edelman, A.: Julia: A fast dynamic language for technical computing, arXiv preprint arXiv:1209.5145, 2012. a
Bivand, R.: spgrass6: Interface between GRASS 6 and R, available at: http://CRAN.R-project.org/package=spgrass6, R package version 0.8-9, 2016. a
Bivand, R.: rgrass7: Interface Between GRASS 7 Geographical Information System and R, available at: https://CRAN.R-project.org/package=rgrass7, R package version 0.1-12, 2018. a
Bivand, R. and Rundel, C.: rgeos: Interface to Geometry Engine – Open Source (“GEOS”), available at: https://CRAN.R-project.org/package=rgeos, R package version 0.4-2, 2018. a
Bivand, R., Pebesma, E., and Gomez-Rubio, V.: Applied spatial data analysis with R, Use R!, 2 edn., available at: http://www.asdar-book.org, Springer, New York, 2013. a, b
Blondel, E.: geometa: Tools for Reading and Writing ISO/OGC Geographic Metadata, available at: https://CRAN.R-project.org/package=geometa, R package version 0.4-0, 2018a. a
Blondel, E.: ows4R: Interface to OGC Web-Services (OWS), available at: https://CRAN.R-project.org/package=ows4R, R package version 0.1-0, 2018b. a
Blöschl, G., Sivapalan, M., Savenije, H., Wagener, T., and Viglione, A.: Runoff prediction in ungauged basins: synthesis across processes, places and scales, Cambridge University Press, Cambridge, 2013. a
Blöschl, G., Hall, J., Parajka, J., Perdigão, R. A. P., Merz, B., Arheimer, B., Aronica, G. T., Bilibashi, A., Bonacci, O., Borga, M., Čanjevac, I., Castellarin, A., Chirico, G. B., Claps, P., Fiala, K., Frolova, N., Gorbachova, L., Gül, A., Hannaford, J., Harrigan, S., Kireeva, M., Kiss, A., Kjeldsen, T. R., Kohnová, S., Koskela, J. J., Ledvinka, O., Macdonald, N., Mavrova-Guirguinova, M., Mediero, L., Merz, R., Molnar, P., Montanari, A., Murphy, C., Osuch, M., Ovcharuk, V., Radevski, I., Rogger, M., Salinas, J. L., Sauquet, E., Šraj, M., Szolgay, J., Viglione, A., Volpi, E., Wilson, D., Zaimi, K., and Živković, N.: Changing climate shifts timing of European floods, Science, 357, 588–590, https://doi.org/10.1126/science.aan2506, 2017. a
Blum, A. G., Archfield, S. A., and Vogel, R. M.: On the probability distribution of daily streamflow in the United States, Hydrol. Earth Syst. Sci., 21, 3093–3103, https://doi.org/10.5194/hess-21-3093-2017, 2017. a
Boessenkool, B.: berryFunctions: Function Collection Related to Plotting and Hydrology, available at: https://CRAN.R-project.org/package=berryFunctions, R package version 1.17.0, 2018. a
Boessenkool, B., Harrigan, S., Smith, K., and Klotz, D.: Using R in Hydrology, EGU2017 Short Course, Zenodo, https://doi.org/10.5281/zenodo.2554019, 2017. a
Bond, N.: hydrostats: Hydrologic Indices for Daily Time Series Data, available at: https://CRAN.R-project.org/package=hydrostats, R package version 0.2.6, 2018. a
Brenning, A., Bangs, D., and Becker, M.: RSAGA: SAGA Geoprocessing and Terrain Analysis, available at: https://CRAN.R-project.org/package=RSAGA, R package version 1.3.0, 2018a. a
Brenning, A., Polakowski, F., and Becker, M.: RPyGeo: ArcGIS Geoprocessing via Python, available at: https://CRAN.R-project.org/package=RPyGeo, R package version 1.0.0, 2018b. a
Brunsdon, C. and Comber, L.: An introduction to R for spatial analysis and mapping, Sage, Los Angeles, available at: https://uk.sagepub.com/en-gb/eur/an-introduction-to-r-for-spatial-analysis-and-mapping/book241031, 2015. a
BSC-CNS and Manubens, N.: easyNCDF: Tools to Easily Read/Write NetCDF Files into/from Multidimensional R Arrays, available at: https://CRAN.R-project.org/package=easyNCDF, R package version 0.0.4, 2017. a
Buytaert, W.: topmodel: Implementation of the Hydrological Model TOPMODEL in R, available at: https://CRAN.R-project.org/package=topmodel, R package version 0.7.3, 2018. a, b
Ceola, S., Arheimer, B., Baratti, E., Blöschl, G., Capell, R., Castellarin, A., Freer, J., Han, D., Hrachowitz, M., Hundecha, Y., Hutton, C., Lindström, G., Montanari, A., Nijzink, R., Parajka, J., Toth, E., Viglione, A., and Wagener, T.: Virtual laboratories: new opportunities for collaborative water science, Hydrol. Earth Syst. Sci., 19, 2101–2117, https://doi.org/10.5194/hess-19-2101-2015, 2015. a, b
Chamberlain, S.: rnoaa: “NOAA” Weather Data from R, available at: https://CRAN.R-project.org/package=rnoaa, r package version 0.8.4, 2019. a
Chambers, J. M.: Programming with data: A guide to the S language, Springer Science & Business Media, New York, USA, 469 p., 1998. a
Chambers, J. M.: Extending R, The R series, Chapman and Hall/CRC Press, Boca Raton, London, New York, 2016. a
Chambers, J. M.: XRPython: Structured Interface to “Python”, available at: https://CRAN.R-project.org/package=XRPython, r package version 0.8, 2017. a
Chambers, J. M.: XRJulia: Structured Interface to Julia, available at: https://CRAN.R-project.org/package=XRJulia, R package version 0.7.7, 2018. a
Chan, C.-h., Chan, G. C. H., Leeper, T. J., and Becker, J.: rio: A Swiss-army knife for data file I/O, r package version 0.5.16, 2018. a
Chang, W. and Borges Ribeiro, B.: shinydashboard: Create Dashboards with “Shiny”, available at: https://CRAN.R-project.org/package=shinydashboard, r package version 0.7.1, 2018. a
Chang, W., Cheng, J., Allaire, J., Xie, Y., and McPherson, J.: Shiny: web application framework for R, 2015. a, b
Cheng, J., Karambelkar, B., and Xie, Y.: leaflet: Create Interactive Web Maps with the JavaScript “Leaflet” Library, available at: https://CRAN.R-project.org/package=leaflet, R package version 2.0.2, 2018. a, b
Clark, M. P., Slater, A. G., Rupp, D. E., Woods, R. A., Vrugt, J. A., Gupta, H. V., Wagener, T., and Hay, L. E.: Framework for Understanding Structural Errors (FUSE): A modular framework to diagnose differences between hydrological models, Water Resour. Res., 44, 12, 2008. a
Coles, S.: An Introduction to Statistical Modeling of Extreme Values, Springer Series in Statistics, available at: https://www.springer.com/gp/book/9781852334598, Springer-Verlag, London, 2001. a
Conway, J., Eddelbuettel, D., Nishiyama, T., Prayaga, S. K., and Tiffin, N.: RPostgreSQL: R Interface to the “PostgreSQL” Database System, available at: https://CRAN.R-project.org/package=RPostgreSQL, R package version 0.6-2, 2017. a
Copernicus Climate Change Service: Climate Data Store, available at: https://cds.climate.copernicus.eu, 2018. a
Coron, L., Thirel, G., Delaigue, O., Perrin, C., and Andréassian, V.: The Suite of Lumped GR Hydrological Models in an R package, Environ. Modell. Softw., 94, 166–171, https://doi.org/10.1016/j.envsoft.2017.05.002, 2017. a, b, c
Coron, L., Perrin, C., Delaigue, O., Thirel, G., and Michel, C.: airGR: Suite of GR Hydrological Models for Precipitation-Runoff Modelling, available at: https://CRAN.R-project.org/package=airGR, R package version 1.0.10.11, 2018. a, b, c
Crameri, F.: Geodynamic diagnostics, scientific visualisation and StagLab 3.0, Geosci. Model Dev., 11, 2541–2562, https://doi.org/10.5194/gmd-11-2541-2018, 2018. a
Csárdi, G. and Frick, H.: goodpractice: Advice on R Package Building, available at: https://CRAN.R-project.org/package=goodpractice, r package version 1.0.2, 2018. a
Csárdi, G.: rhub: Connect to “R-hub”, available at: https://CRAN.R-project.org/package=rhub, R package version 1.0.2, 2017. a, b
Dee, D. P., Uppala, S. M., Simmons, A. J., Berrisford, P., Poli, P., Kobayashi, S., Andrae, U., Balmaseda, M. A., Balsamo, G., Bauer, P., Bechtold, P., Beljaars, A. C. M., van de Berg, L., Bidlot, J., Bormann, N., Delsol, C., Dragani, R., Fuentes, M., Geer, A. J., Haimberger, L., Healy, S. B., Hersbach, H., Hólm, E. V., Isaksen, L., Kållberg, P., Köhler, M., Matricardi, M., McNally, A. P., Monge-Sanz, B. M., Morcrette, J.-J., Park, B.-K., Peubey, C., de Rosnay, P., Tavolato, C., Thépaut, J.-N., and Vitart, F.: The ERA-Interim reanalysis: Configuration and performance of the data assimilation system, Q. J. Roy. Meteor. Soc., 137, 553–597, https://doi.org/10.1002/qj.828, 2011. a
Delaigue, O., Coron, L., and Brigode, P.: airGRteaching: Teaching Hydrological Modelling with GR (Shiny Interface Included), available at: https://CRAN.R-project.org/package=airGRteaching, R package version 0.2.3.2, 2018a. a, b
Delaigue, O., Thirel, G., Coron, L., and Brigode, P.: airGR and airGRteaching: Two Open-Source Tools for Rainfall-Runoff Modeling and Teaching Hydrology, in: HIC 2018. 13th International Conference on Hydroinformatics, edited by: Loggia, G. L., Freni, G., Puleo, V., and Marchis, M. D., vol. 3 of EPiC Series in Engineering, 541–548, EasyChair, https://doi.org/10.29007/qsqj, 2018b. a, b
des Riviêres, J. and Wiegand, J.: Eclipse: A platform for integrating development tools, IBM Syst. J., 43, 371–383, 2004. a
Do, H. X., Gudmundsson, L., Leonard, M., and Westra, S.: The Global Streamflow Indices and Metadata Archive (GSIM) – Part 1: The production of a daily streamflow archive and metadata, Earth Syst. Sci. Data, 10, 765–785, https://doi.org/10.5194/essd-10-765-2018, 2018. a
Dowle, M. and Srinivasan, A.: data.table: Extension of “data.frame”, available at: https://CRAN.R-project.org/package=data.table, R package version 1.11.6, 2018. a
Eddelbuettel, D. and Balamuta, J. J.: Extending extitR with extitC++: A Brief Introduction to extitRcpp, PeerJ Preprints, 5, e3188v1, https://doi.org/10.7287/peerj.preprints.3188v1, 2017. a
Emerson, J. W. and Kane, M. J.: biganalytics: Utilities for “big.matrix” Objects from Package “bigmemory”, available at: https://CRAN.R-project.org/package=biganalytics, R package version 1.1.14, 2016. a
ESRI: ArcGIS Desktop Release 10.6, Redlands, CA, Environmental Systems Research Institute, ESRI Inc., 2018. a
Essawy, B., Goodall, J., Zell, W., Voce, D., Morsy, M., Sadler, J., Yuan, Z., and Malik, T.: Integrating scientific cyberinfrastructures to improve reproducibility in computational hydrology: Example for HydroShare and GeoTrust, Environ. Modell. Softw., 105, 217–229, https://doi.org/10.1016/j.envsoft.2018.03.025, 2018. a
European Commission: Science with and for Society, available at: http://ec.europa.eu/research/participants/data/ref/h2020/wp/2018-2020/main/h2020-wp1820-swfs_en.pdf, 2015. a
Falcone, J.: GAGES-II: Geospatial Attributes of Gages for Evaluating Streamflow, US Geological Survey, Reston, VA, https://doi.org/10.3133/70046617, 2011. a
Faria, J., Grosjean, P., and Jelihovschi, E.: Tinn-R-GUI/Editor for R language and environment statistical computing, available at: http://sourceforge. net/projects/tinn-r, 2008. a
Federer, C.: BROOK90: a simulation model for evaporation, soil water and streamflow, 1995. a
Fuka, D. R., Walter, M. T., Steenhuis, T. S., and Easton, Z. M.: SWATmodel: A multi-OS implementation of the TAMU SWAT model, available at: https://CRAN.R-project.org/package=SWATmodel, r package version 0.5.9, 2014. a
Garnier, S.: viridis: Default Color Maps from “matplotlib”, available at: https://CRAN.R-project.org/package=viridis, r package version 0.5.1, 2018. a
Gautier, L.: rpy2: Python interface to the R language (embedded R), available at: https://pypi.org/project/rpy2, python library version 2.9.5, 2018. a
GDAL Development Team: GDAL – Geospatial Data Abstraction Library, Version 2.4.0, Open Source Geospatial Foundation, available at: https://www.gdal.org/, 2018. a
Gesmann, M. and de Castillo, D.: googleVis: Interface between R and the Google Visualisation API, The R Journal, 3, 40–44, 2011. a
Gilleland, E. and Katz, R. W.: extRemes 2.0: An Extreme Value Analysis Package in R, J. Stat. Softw., 72, 1–39, https://doi.org/10.18637/jss.v072.i08, 2016. a
Giraud, T. and Lambert, N.: cartography: Create and Integrate Maps in your R Workflow, Journal of Open Source Software, 4, 54, https://doi.org/10.21105/joss.00054, 2016. a
GRASS Development Team: Geographic Resources Analysis Support System (GRASS GIS) Software, Open Source Geospatial Foundation, USA, available at: http://grass.osgeo.org/, 2019. a
Graul, C.: leafletR: Interactive Web-Maps Based on the Leaflet JavaScript Library, available at: http://cran.r-project.org/package=leafletR, R package version 0.4-0, 2016. a
Greenberg, J. A. and Mattiuzzi, M.: gdalUtils: Wrappers for the Geospatial Data Abstraction Library (GDAL) Utilities, available at: https://CRAN.R-project.org/package=gdalUtils, R package version 2.0.1.14, 2018. a
Grothendieck, G. and Bellosta, C. J. G.: rJython: R interface to Python via Jython, available at: https://CRAN.R-project.org/package=rJython, r package version 0.0-4, 2012. a
Guo, H.: Big Earth data: A new frontier in Earth and information sciences, Big Earth Data, 1, 4–20, https://doi.org/10.1080/20964471.2017.1403062, 2017. a
Gupta, H. V., Perrin, C., Blöschl, G., Montanari, A., Kumar, R., Clark, M., and Andréassian, V.: Large-sample hydrology: a need to balance depth with breadth, Hydrol. Earth Syst. Sci., 18, 463–477, https://doi.org/10.5194/hess-18-463-2014, 2014. a
Guttag, J. V.: Introduction to computation and programming using Python, MIT Press, Cambridge, MA, 2013. a
Hafen, R. and Continuum Analytics, Inc.: rbokeh: R Interface for Bokeh, available at: https://CRAN.R-project.org/package=rbokeh, R package version 0.5.0, 2016. a
Hall, D. K. and Riggs, G. A.: MODIS/Terra Snow Cover Daily L3 Global 0.05Deg CMG, Version 6, NASA National Snow and Ice Data Center Distributed Active Archive Center, Boulder, Colorado, USA, https://doi.org/10.5067/MODIS/MOD10C1.006, 2016. a
Hannah, D., Demuth, S., van Lanen, H., Looser, U., Prudhomme, C., Rees, G., Stahl, K., and Tallaksen, L.: Large-scale river flow archives: importance, current status and future needs, Hydrol. Process., 25, 1191–1200, https://doi.org/10.1002/hyp.7794, 2011. a
Harrigan, S., Hannaford, J., Muchan, K., and Marsh, T. J.: Designation and trend analysis of the updated UK Benchmark Network of river flow stations: The UKBN2 dataset, Hydrol. Res., 49, 552–567, 2018. a
Hart, E. M. and Bell, K.: prism: Download data from the Oregon prism project, R package version 0.0.6, https://doi.org/10.5281/zenodo.33663, 2015. a
Heinkel, R.: pyRserve: A Python client to remotely access the R statistic package via network, available at: https://pypi.org/project/pyRserve, python library version 0.9.1, 2017. a
Heineman, G. T. and Councill, W. T.: Component-based software engineering: putting the pieces together, Addison-Wesley, Boston, London, xliii, 818 p., 2001. a
Hersbach, H., de Rosnay, P., Bell, B., Schepers, D., Simmons, A., Soci, C., Abdalla, S., Alonso-Balmaseda, M., Balsamo, G., Bechtold, P., Berrisford, P., Bidlot, J.-R., de Boisséson, E., Bonavita, M., Browne, P., Buizza, R., Dahlgren, P., Dee, D., Dragani, R., Diamantakis, M., Flemming, J., Forbes, R., Geer, A. J., Haiden, T., Hólm, E., Haimberger, L., Hogan, R., Horányi, A., Janiskova, M., Laloyaux, P., Lopez, P., Munoz-Sabater, J., Peubey, C., Radu, R., Richardson, D., Thépaut, J.-N., Vitart, F., Yang, X., Zsótér, E., and Zuo, H.: Operational global reanalysis: progress, future directions and synergies with NWP, ERA Report Series, available at: https://www.ecmwf.int/node/18765, 2018. a
Hester, J.: lintr: A “Linter” for R Code, available at: https://CRAN.R-project.org/package=lintr, R package version 1.0.3, 2018. a
Hijmans, R. J.: raster: Geographic Data Analysis and Modeling, available at: https://CRAN.R-project.org/package=raster, r package version 2.6-7, 2017. a, b
Hirsch, R. M. and De Cicco, L. A.: User guide to Exploration and Graphics for RivEr Trends (EGRET) and dataRetrieval: R packages for hydrologic data, chap. A10, U.S. Geological Survey, Reston, VA, available at: https://pubs.usgs.gov/tm/04/a10, 2015. a, b
Hosking, J. R. M.: Regional Frequency Analysis using L-Moments, available at: https://CRAN.R-project.org/package=lmomRFA, R package, version 3.2, 2019a. a
Hosking, J. R. M.: L-Moments, R package, version 2.8, 2019b. a
Hufkens, K.: ecmwfr: Interface to the public “ECMWF” Web Services, available at: https://github.com/khufkens/ecmwfr, R package version 0.0.2, 2018. a, b
Hufkens, K., Basler, D., Milliman, T., Melaas, E. K., and Richardson, A. D.: An integrated phenology modelling framework in R: modelling vegetation phenology with phenor, Methods Ecol. Evol., 9, 1–10, https://doi.org/10.1111/2041-210X.12970, 2018. a, b
Hunt, T.: ModelMetrics: Rapid Calculation of Model Metrics, available at: https://CRAN.R-project.org/package=ModelMetrics, r package version 1.2.2, 2018. a
Hurley, A.: Processing, modelling and visualizing hydrological data in R (Version 1.1.1), Zenodo, https://doi.org/10.5281/zenodo.2553998, 2018. a
Hurley, A., Slater, L., Thirel, G., Barker, L., Vitolo, C., Prosdocimi, I., and Harrigan, S.: Using R in Hydrology at EGU2019, https://doi.org/10.5281/zenodo.3236979, 2019. a
Hutton, C., Wagener, T., Freer, J., Han, D., Duffy, C., and Arheimer, B.: Most computational hydrology is not reproducible, so is it really science?, Water Resour. Res., 52, 7548–7555, https://doi.org/10.1002/2016WR019285, 2016. a, b
Iannone, R., Allaire, J., and Borges, B.: flexdashboard: R Markdown Format for Flexible Dashboards, available at: https://CRAN.R-project.org/package=flexdashboard, R package version 0.5.1.1, 2018. a
Ihaka, R.: R: Past and future history, Computing Science and Statistics, 30, 392–396, 1998. a
Ihaka, R. and Gentleman, R.: R: a language for data analysis and graphics, J. Comput. Graph. Stat., 5, 299–314, 1996. a
Kahle, D. and Wickham, H.: ggmap: Spatial Visualization with ggplot2, The R Journal, 5, 144–161, 2013. a
Kane, M. J., Emerson, J., and Weston, S.: Scalable Strategies for Computing with Massive Data, J. Stat. Softw., 55, 1–19, 2013. a
Keitt, T.: colorRamps: Builds color tables, available at: https://CRAN.R-project.org/package=colorRamps, r package version 2.3, 2012. a
Kelleher, C. and Wagener, T.: Ten guidelines for effective data visualization in scientific publications, Environ. Modell. Softw., 26, 822–827, 2011. a
Kilibarda, M. and Bajat, B.: plotGoogleMaps: the R-based web-mapping tool for thematic spatial data, GEOMATICA, 66, 37–49, 2012. a
Knaus, J.: snowfall: Easier cluster computing (based on snow), available at: https://CRAN.R-project.org/package=snowfall, R package version 1.84-6.1, 2015. a
Knuth, D. E.: Literate programming, Computer J., 27, 97–111, 1984. a
Koffler, D., Gauster, T., and Laaha, G.: lfstat: Calculation of Low Flow Statistics for Daily Stream Flow Data, available at: https://CRAN.R-project.org/package=lfstat, R package version 0.9.4, 2016. a, b
Kronenberg, R. and Oehlschlägel, L. M.: Implementation of the BROOK90 model in R, available at: https://github.com/rkronen/Brook90_R, 2019. a
Kuhn, M., Wing, J., Weston, S., Williams, A., Keefer, C., Engelhardt, A., Cooper, T., Mayer, Z., Kenkel, B., the R Core Team, Benesty, M., Lescarbeau, R., Ziem, A., Scrucca, L., Tang, Y., Candan, C., and Hunt, T.: caret: Classification and Regression Training, available at: https://CRAN.R-project.org/package=caret, R package version 6.0-81, 2018. a
Kunst, J.: highcharter: A Wrapper for the “Highcharts” Library, available at: https://CRAN.R-project.org/package=highcharter, R package version 0.5.0, 2017. a
Lawrence, M. and Wickham, H.: plumbr: Mutable and dynamic data models, RStudio, R package, version 0.6.9, available at: http://CRAN.R- project.org/package=plumbr, 2018. a
LeDell, E., Gill, N., Aiello, S., Fu, A., Candel, A., Click, C., Kraljevic, T., Nykodym, T., Aboyoun, P., Kurka, M., and Malohlava, M.: h2o: R Interface for “H2O”, available at: https://CRAN.R-project.org/package=h2o, R package version 3.20.0.8, 2018. a
Li, C.: JuliaCall: Seamless Integration Between R and “Julia”, available at: https://CRAN.R-project.org/package=JuliaCall, R package version 0.16.0, 2018. a
Light, A. and Bartlein, P. J.: The end of the rainbow? Color schemes for improved data graphics, Eos, Transactions American Geophysical Union, 85, 385–391, 2004. a
Lovelace, R., Nowosad, J., and Münchow, J.: Geocomputation with R, Chapman and Hall/CRC Press, Boca Raton, London, New York, available at: https://geocompr.robinlovelace.net/, 2019. a, b
Luraschi, J. and Allaire, J.: r2d3: Interface to “D3” Visualizations, available at: https://CRAN.R-project.org/package=r2d3, R package version 0.2.3, 2018. a
Luraschi, J., Kuo, K., Ushey, K., Allaire, J., and The Apache Software Foundation: sparklyr: R Interface to Apache Spark, available at: https://CRAN.R-project.org/package=sparklyr, R package version 0.9.3, 2018. a
MathWorks: Company Overview, available at: https://www.mathworks.com/content/dam/mathworks/tag-team/Objects/c/company-fact-sheet-8282v18.pdf, 2018. a
McKiernan, E., Bourne, P., Brown, C., Buck, S., Kenall, A., Lin, J., McDougall, D., Nosek, B., Ram, K., Soderberg, C., Spies, J., Thaney, K., Updegrove, A., Woo, K., and Yarkoni, T.: How open science helps researchers succeed, eLife, 5, 1–19, https://doi.org/10.7554/eLife.16800, 2016. a
Melsen, L., Torfs, P., Uijlenhoet, R., and Teuling, A.: Comment on “Most computational hydrology is not reproducible, so is it really science?” by Christopher Hutton et al., Water Resour. Res., 53, 2568–2569, https://doi.org/10.1002/2016WR020208, 2017. a, b
Metcalfe, P., Beven, K., and Freer, J.: Dynamic TOPMODEL: A new implementation in R and its sensitivity to time and space steps, Environ. Modell. Softw., 72, 155–172, https://doi.org/10.1016/j.envsoft.2015.06.010, 2015. a, b
Metcalfe, P., Beven, K., and Freer, J.: dynatopmodel: Implementation of the Dynamic TOPMODEL Hydrological Model, available at: https://CRAN.R-project.org/package=dynatopmodel, R package version 1.2.1, 2018. a, b
Microsoft and Weston, S.: foreach: Provides Foreach Looping Construct for R, available at: https://CRAN.R-project.org/package=foreach, R package version 1.4.4, 2017. a
Microsoft Corporation and Weston, S.: doParallel: Foreach Parallel Adaptor for the “parallel” Package, available at: https://CRAN.R-project.org/package=doParallel, R package version 1.0.14, 2018. a
Muenchow, J., Schratz, P., and Brenning, A.: RQGIS: Integrating R with QGIS for Statistical Geocomputing, The R Journal, 9, 409–428, available at: https://rjournal.github.io/archive/2017/RJ-2017-067/RJ-2017-067.pdf, 2017. a
Müller, K., Wickham, H., James, D. A., and Falcon, S.: RSQLite: “SQLite” Interface for R, available at: https://CRAN.R-project.org/package=RSQLite, R package version 2.1.1, 2018. a
Neil, D.: Modern Vim: Craft Your Development Environment with Vim 8 and Neovim, Pragmatic Bookshelf, available at: https://www.oreilly.com/library/view/modern-vim/9781680506006/?ar, 2018. a
Neistsch, S. L., Arnold, J. G., Kiniry, J. R., and Williams, J. R.: “Soil Water Assessment Tool Theoretical Documentation (version 2005)”, available at: https://swat.tamu.edu/media/1290/swat2000theory.pdf, Grassland Soil and Water Research Laboratory, Temple, Texas, 2005. a
Neri, A., Villarini, G., Slater, L. J., and Napolitano, F.: On the statistical attribution of the frequency of flood events across the US Midwest, Adv. Water. Resour., 127, 225–236, https://doi.org/10.1016/j.advwatres.2019.03.019, 2019. a
Neuwirth, E.: RColorBrewer: ColorBrewer Palettes, available at: https://CRAN.R-project.org/package=RColorBrewer, r package version 1.1-2, 2014. a
Ooms, J.: The OpenCPU system: Towards a universal interface for scientific computing through separation of concerns, arXiv preprint arXiv:1406.4806, 2014. a
Ooms, J.: V8: Embedded JavaScript Engine for R, available at: https://CRAN.R-project.org/package=V8, 2017. a
Ooms, J.: hunspell: High-Performance Stemmer, Tokenizer, and Spell Checker, available at: https://CRAN.R-project.org/package=hunspell, r package version 3.0, 2018. a
Openshaw, S. and Abrahart, R. J.: GeoComputation, vol. 24, Taylor & Francis, London, New York, 2000. a
Pebesma, E.: Simple Features for R: Standardized Support for Spatial Vector Data, The R Journal, available at: https://journal.r-project.org/archive/2018/RJ-2018-009/index.html, 2018a. a, b
Pebesma, E.: stars: Scalable, Spatiotemporal Tidy Arrays, available at: https://CRAN.R-project.org/package=stars, R package version 0.2-0, 2018b. a, b
Pebesma, E. and Bivand, R.: Classes and methods for spatial data in R, R News, 5, 9–13, 2005. a, b
Pebesma, E., Nüst, D., and Bivand, R.: The R software environment in reproducible geoscientific research, Eos, Transactions American Geophysical Union, 93, 163–163, 2012. a
Pedersen, T. L.: gganimate: Create easy animations with ggplot2, available at: https://github.com/thomasp85/gganimate, 2018. a
Perkel, J. M.: A toolkit for data transparency takes shape, Nature, 560, 513–515, https://doi.org/10.1038/d41586-018-05990-5, 2018. a
Perrin, C., Michel, C., and Andréassian, V.: Improvement of a parsimonious model for streamflow simulation, J. Hydrol., 279, 275–289, https://doi.org/10.1016/S0022-1694(03)00225-7, 2003. a
Pierce, D.: ncdf4: Interface to Unidata netCDF (Version 4 or Earlier) Format Data Files, available at: https://CRAN.R-project.org/package=ncdf4, R package version 1.16, 2017. a
Pohlert, T.: trend: Non-Parametric Trend Tests and Change-Point Detection, available at: https://CRAN.R-project.org/package=trend, R package version 1.1.1, 2018. a
QGIS Development Team: QGIS Geographic Information System, Open Source Geospatial Foundation Project, available at: http://qgis.osgeo.org, 2018. a
R Core Team: R: A Language and Environment for Statistical Computing, R Foundation for Statistical Computing, Vienna, Austria, available at: http://www.R-project.org, 2018. a, b, c, d
Rigby, R. A. and Stasinopoulos, D. M.: Generalized additive models for location, scale and shape, with discussion, Applied Statistics, 54, 507–554, 2005. a
Ritchie, D. M.: The development of the C language, ACM Sigplan Notices, 28, 201–208, 1993. a
Rödiger, S., Friedrichsmeier, T., Kapat, P., Michalke, M.: RKWard: a comprehensive graphical user interface and integrated development environment for statistical analysis with R, J. Stat. Softw., 49, 1–34, 2012. a
Rossini, A. J., Heiberger, R. M., Sparapani, R. A., Maechler, M., and Hornik, K.: Emacs speaks statistics: A multiplatform, multipackage development environment for statistical analysis, J. Comput. Graph. Stat., 13, 247–261, 2004. a
RStudio Team: RStudio: Integrated Development Environment for R, RStudio, Inc., Boston, MA, available at: http://www.rstudio.com/, 2018. a
Ryberg, K. R. and Vecchia, A. V.: waterData: Retrieval, Analysis, and Anomaly Calculation of Daily Hydrologic Time Series Data, available at: https://CRAN.R-project.org/package=waterData, R package version 1.0.8, 2017. a, b
SAGA Development Team: System for Automated Geoscientific Analyses (SAGA GIS), Germany, available at: http://www.saga-gis.org/, 2008. a
Sanner, M. F.: Python: a programming language for software integration and development, J. Mol. Graph. Model., 17, 57–61, 1999. a
Sarkar, D.: Lattice: Multivariate Data Visualization with R, Use R!, Springer, New York, available at: http://lmdvr.r-forge.r-project.org, 2008. a
Schmidt-Walter, P.: brook90r, https://doi.org/10.5281/zenodo.1433677, 2018. a
Sievert, C.: plotly for R, available at: https://plotly-book.cpsievert.me, 2018. a, b
Slater, L., Harrigan, S., Gauster, T., Hurley, A., Thirel, G., and Vitolo, C.: Using R in Hydrology, EGU2018 Short Course, Zenodo, https://doi.org/10.5281/zenodo.2554009, 2018. a
Slater, L. J., Singer, M. B., and Kirchner, J. W.: Hydrologic versus geomorphic drivers of trends in flood hazard, Geophys. Res. Lett., 42, 370–376, https://doi.org/10.1002/2014GL062482, 2015. a
Sommerlot, A., Fuka, D., and Easton, Z.: getMet: Get Meteorological Data for Hydrologic Models, available at: https://CRAN.R-project.org/package=getMet, R package version 0.3.2, 2016. a
Souza, R.: Ecohydmod: Ecohydrological Modelling, available at: https://CRAN.R-project.org/package=Ecohydmod, R package version 1.0.0, 2017. a
Stauffer, R., Mayr, G. J., Dabernig, M., and Zeileis, A.: Somewhere over the rainbow: How to make effective use of colors in meteorological visualizations, B. Am. Meteorol. Soc., 96, 203–216, 2015. a, b
Tapley, B. D., Bettadpur, S., Ries, J. C., Thompson, P. F., and Watkins, M. M.: GRACE measurements of mass variability in the Earth system, Science, 305, 503–505, https://doi.org/10.1126/science.1099192, 2004. a
Tennekes, M.: tmap: Thematic Maps in R, J. Stat. Softw., 84, 1–39, https://doi.org/10.18637/jss.v084.i06, 2018. a
Thieurmel, B., Marcelionis, A., Petit, J., Salette, E., and Robert, T.: rAmCharts: JavaScript Charts Tool, available at: https://CRAN.R-project.org/package=rAmCharts, R package version 2.1.9, 2018. a
Tuszynski, J.: caTools: Tools: moving window statistics, GIF, Base64, ROC AUC, etc., available at: https://CRAN.R-project.org/package=caTools, R package version 1.17.1.1, 2018. a
Urbanek, S.: proj4: A simple interface to the PROJ.4 cartographic projections library, available at: https://CRAN.R-project.org/package=proj4, R package version 1.0-8, 2012. a
Urbanek, S.: rJava: Low-Level R to Java Interface, available at: https://CRAN.R-project.org/package=rJava, R package version 0.9-10, 2018. a
Vanderkam, D., Allaire, J., Owen, J., Gromer, D., and Thieurmel, B.: dygraphs: Interface to “Dygraphs” Interactive Time Series Charting Library, available at: https://CRAN.R-project.org/package=dygraphs, R package version 1.1.1.6, 2018. a
Vantas, K.: hydroscoper: R interface to the Greek National Data Bank for Hydrological and Meteorological Information, The Journal of Open Source Software, 3, 1–7, https://doi.org/10.21105/joss.00625, 2018. a
Viglione, A.: nsRFA: Non-Supervised Regional Frequency Analysis, available at: https://CRAN.R-project.org/package=nsRFA, r package version 0.7-14, 2018. a
Viglione, A. and Parajka, J.: TUWmodel: Lumped/Semi-Distributed Hydrological Model for Educational Purposes, R package version 1.0-2, 2019. a, b, c
Villarini, G., Serinaldi, F., Smith, J. A., and Krajewski, W. F.: On the stationarity of annual flood peaks in the continental United States during the 20th century, Water Resour. Res., 45, 1–17, 2009. a
Vitolo, C.: hddtools: Hydrological Data Discovery Tools, The Journal of Open Source Software, 2, 56, https://doi.org/10.21105/joss.00056, 2017. a
Vitolo, C., Fry, M., and Buytaert, W.: rnrfa: An R package to Retrieve, Filter and Visualize Data from the UK National River Flow Archive, The R Journal, 8, 102–116, 2016a. a, b, c
Vitolo, C., Wells, P., Dobias, M., and Buytaert, W.: fuse: An R package for ensemble Hydrological Modelling, The Journal of Open Source Software, 1, 52, https://doi.org/10.21105/joss.00052, 2016b. a, b
Wahlbrink, S.: Eclipse Plug-In for R: StatET [Software], 2016. a
Wendt, N.: gribr: R interface for GRIB files using ECMWF ecCodes, available at: https://github.com/nawendt/gribr, r package version 1.2.2, 2018. a
Wickham, H.: testthat: Get Started with Testing, The R Journal, 3, 5–10, 2011. a
Wickham, H.: R packages: organize, test, document, and share your code, O'Reilly Media, Sebastopol, available at: http://r-pkgs.had.co.nz, 2015. a, b, c
Wickham, H.: feather: R Bindings to the Feather “API”, available at: https://CRAN.R-project.org/package=feather, R package version 0.3.1, 2016a. a
Wickham, H.: ggplot2: Elegant Graphics for Data Analysis, Use R!, Springer, New York, available at: http://ggplot2.org, 2016b. a
Wickham, H.: tidyverse: Easily Install and Load the “Tidyverse”, available at: https://CRAN.R-project.org/package=tidyverse, R package version 1.2.1, 2017. a
Wickham, H. and Hesselberth, J.: pkgdown: Make Static HTML Documentation for a Package, available at: https://CRAN.R-project.org/package=pkgdown, R package version 1.3.0, 2018. a
Wickham, H., Danenberg, P., and Eugster, M.: roxygen2: In-Line Documentation for R, available at: https://CRAN.R-project.org/package=roxygen2, r package version 6.1.1, 2018a. a
Wickham, H., Hester, J., and Francois, R.: readr: Read Rectangular Text Data, available at: https://CRAN.R-project.org/package=readr, r package version 1.3.1, 2018b. a
Wilby, R. L., Clifford, N. J., De Luca, P., Harrigan, S., Hillier, J. K., Hodgkins, R., Johnson, M. F., Matthews, T. K. R., Murphy, C., Noone, S. J., Parry, S., Prudhomme, C., Rice, S. P., Slater, L. J., Smith, K. A., and Wood, P. J.: The “dirty dozen” of freshwater science: detecting then reconciling hydrological data biases and errors, Wiley Interdisciplinary Reviews: Water, 4, e1209, https://doi.org/10.1002/wat2.1209, 2017. a
Wilkinson, L.: The Grammar of Graphics, Statistics and Computing, 1st edn., Springer, New York, 1999. a
Wilson, G.: Software carpentry: getting scientists to write better code by making them more productive, Comput. Sci. Eng., 8, 66–69, 2006. a
Wilson, G.: Software Carpentry: lessons learned, F1000Research, 3, available at: https://software-carpentry.org/lessons, 2014. a
Winslow, L. A., Hahn, T. H., Princiotta, S. D., Leach, T. H. and Rose, K. C.: Characterizing hydrologic networks: Developing a tool to enable research of macroscale aquatic networks, Environ. Modell. Softw., 104, 94–101, 2018. a
WMO: Manual on low flow estimation and prediction, Geneva, 2009. a
Wood, S. N.: Generalized additive models: an introduction with R, Texts in statistical science, 2nd edn., Chapman and Hall/CRC Press, Boca Raton, London, New York, 2017. a
Xie, Y.: bookdown: Authoring Books and Technical Documents with R Markdown, The R series, available at: https://github.com/rstudio/bookdown, Chapman and Hall/CRC Press, Boca Raton, London, New York, 2016. a
Xie, Y.: knitr: A General-Purpose Package for Dynamic Report Generation in R, available at: https://yihui.name/knitr, R package version 1.20, 2018. a
Xie, Y. and Lesur, R.: pagedown: Paginate the HTML Output of R Markdown with CSS for Print, available at: https://CRAN.R-project.org/package=pagedown, r package version 0.1, 2019. a
Xie, Y., Hill, A. P., and Thomas, A.: blogdown: Creating Websites with R Markdown, The R series, Chapman and Hall/CRC Press, Boca Raton, London, New York, available at: https://github.com/rstudio/blogdown, 2017. a
Yee, T. W., Stoklosa, J., and Huggins, R. M.: The VGAM Package for Capture-Recapture Data Using the Conditional Likelihood, J. Stat. Softw., 65, 1–33, https://doi.org/10.18637/jss.v065.i05, 2015. a
Zambrano-Bigiarini, M.: hydroGOF: Goodness-of-fit functions for comparison of simulated and observed hydrological time series, https://doi.org/10.5281/zenodo.840087, R package version 0.3-10, 2017a. a, b
Zambrano-Bigiarini, M.: hydroTSM: Time Series Management, Analysis and Interpolation for Hydrological Modelling, https://doi.org/10.5281/zenodo.839864, R package version 0.5-1, 2017b. a
Zeileis, A., Fisher, J. C., Hornik, K., Ihaka, R., McWhite, C. D., Murrell, P., Stauffer, R., and Wilke, C. O.: colorspace: A Toolbox for Manipulating and Assessing Colors and Palettes, arXiv 1903.06490, arXiv.org E-Print Archive, available at: http://arxiv.org/abs/1903.06490, 2019. a
- Abstract
- Introduction: the rapid rise of R in hydrology
- The benefits and advantages of using R in hydrology
- R packages in a typical hydrological workflow
- Challenges and solutions when using R in hydrology
- A roadmap for the future of R in hydrology
- Conclusions
- Data availability
- Author contributions
- Competing interests
- Acknowledgements
- Review statement
- References
- Supplement
- Article
(2987 KB) - Full-text XML
- Abstract
- Introduction: the rapid rise of R in hydrology
- The benefits and advantages of using R in hydrology
- R packages in a typical hydrological workflow
- Challenges and solutions when using R in hydrology
- A roadmap for the future of R in hydrology
- Conclusions
- Data availability
- Author contributions
- Competing interests
- Acknowledgements
- Review statement
- References
- Supplement