the Creative Commons Attribution 4.0 License.
the Creative Commons Attribution 4.0 License.
 | 26 Mar 2019
Unraveling the hydrological budget of isolated and seasonally contrasted subtropical lakes
Chloé Poulin
Bruno Hamelin
Christine Vallet-Coulomb
Guinbe Amngar
Bichara Loukman
Jean-François Cretaux
Jean-Claude Doumnang
Abdallah Mahamat Nour
Guillemette Menot
Florence Sylvestre
Pierre Deschamps
Complete understanding of the hydrological functioning of large-scale intertropical watersheds such as the Lake Chad basin is becoming a high priority in the context of climate change in the near future and increasing demographic pressure. This requires integrated studies of all surface water and groundwater bodies and of their quite-complex interconnections. We present here a simple method for estimating the annual mean water balance of sub-Sahelian lakes subject to high seasonal contrast and located in isolated regions with no road access during the rainy season, a situation which precludes continuous monitoring of in situ hydrological data.
Our study focuses for the first time on two lakes, Iro and Fitri, located in the eastern basin of Lake Chad. We also test the approach on Lake Ihotry in Madagascar, used as a benchmark site that has previously been extensively studied by our group.
We combine the δ18O and δ2H data that we measured during the dry season with altimetry data from the SARAL satellite mission in order to model the seasonal variation of lake volume and isotopic composition. The annual water budget is then estimated from mass balance equations using the Craig–Gordon model for evaporation. We first show that the closed-system behavior of Lake Ihotry (i.e., precipitation equal to evaporation) is well simulated by the model. For lakes Iro and Fitri, we calculate evaporation to influx ratios (E∕I) of 0.6±0.3 and 0.4±0.2, respectively. In the case of the endorheic Lake Fitri, the estimated output flux corresponds to the infiltration of surface water toward the surface aquifer that regulates the chemistry of the lake. These results constitute a first-order assessment of the water budget of these lakes, in regions where direct hydrological and meteorological observations are very scarce or altogether lacking.
Finally, we discuss the implications of our data on the hydro-climatic budget at the scale of the catchment basins. We observe that the local evaporation lines (LELs) obtained on both lake and aquifer systems are slightly offset from the average rainfall isotopic composition monitored by IAEA at N'Djamena (Chad), and we show that this difference may reflect the impact of vegetation transpiration on the basin water budget. Based on the discussion of the mass balance budget we conclude that, while being broadly consistent with the idea that transpiration is on the same order of magnitude as evaporation in those basins, we cannot derive a more precise estimate of the partition between these two fluxes, owing to the large uncertainties of the different end-members in the budget equations.
- Article
(5363 KB) - Full-text XML
- BibTeX
- EndNote


In the Sahel, the combined effects of population growth, land degradation and changes in rainfall patterns have already resulted in the significant deterioration of soil and water resources (UNEP and ICRAF, 2006). Following the severe droughts that ravaged the region in the 1970s and 1980s, an increase in rainfall patterns has been observed in central and western Africa since the 1990s (Nicholson, 2005; Lebel and Ali, 2009; Ali and Lebel, 2009; Nicholson, 2013). There is no consensus to date on precipitation trends over the Sahel strip for the 21st century (Druyan, 2011; Christensen et al., 2013; Biasutti et al., 2018), leading to large uncertainties in the evolution of surface water bodies such as the iconic Lake Chad. In sub-Sahelian areas, surface water bodies such as ephemeral ponds or perennial lakes form crucial reservoirs for agriculture and human activities, which renders the understanding of their hydrological functioning essential to socio-economic previsions. These reservoirs are fed during the rainy season by surface runoff. Many studies have shown a global increase in surface runoff over the last decades despite a general precipitation decline (Descroix et al., 2009; Gardelle et al., 2010). This paradoxical runoff response highlights the role of land clearance and soil crusting in controlling hydrological regimes in the Sahelian and Sudanian regions (Leblanc et al., 2008). Surface water bodies are thus vulnerable to climate variability but are also highly impacted by changes in land use and land cover.
In this study, we investigate for the first time lakes Iro and Fitri, two perennial lakes in the Sudanian and Sahelian regions of the Lake Chad basin. Besides their importance for local sedentary and nomadic populations, the study of their hydrological functioning may provide pertinent small-scale analogs of Lake Chad itself and help test the respective influence of the different forcing parameters and processes, thus constituting potential sentinel systems for future evolutions. Indeed, understanding the hydrology of Lake Chad and the origin of its strong surface variability has been the focus of a large number of studies (Fontes et al., 1970; Carmouze, 1969; Olivry et al., 1996; Bouchez et al., 2016; Bader et al., 2011), but predicting its future behavior in response to climate change remains a challenge owing to the complexities of its hydrography and to the extremely diverse characteristics of the various compartments of its catchment (Lemoalle et al., 2012).
The study of intertropical lakes raises specific difficulties related to their intrinsic characteristics, such as extremely high evaporation rates, huge seasonal variations of fluxes that lead to large fluctuations of lake level and surface, and seasonal changes in hydrologic configuration that result from ephemeral ponds and humid zones which flood during the wet season. Moreover, an even more compelling problem stems from the logistical impossibility of reaching the field sites during the wet season, when the trails are inaccessible for several months. As a consequence, there is a general lack of critical data for the high-water period, which impedes the inference of seasonal ranges of variation and thus of annual average values, meaning that standard hydrological and hydrogeological approaches remain highly unconstrained.
In addition, long-term hydrological monitoring of the watersheds is often lacking (Sivapalan et al., 2003; Wohl et al., 2012). Remote sensing techniques have been developed to compensate for this lack of data in order to determine lake storage capacities (Liebe et al., 2005; Rodrigues et al., 2012), or to calculate a hydrological budget with regular water height measurements (Gal et al., 2016). Alternative methods, such as the Thornthwaite–Mather procedure (Collick et al., 2009; Steenhuis and Van der Molen, 1986), are also efficient for estimating water budgets in remote areas, but require precise precipitation data, which remain unavailable in many areas. For instance, in the two cases studied here, only one meteorological station is present in each of the two huge catchments (195 000 km2 for Iro Lake, and 96 000 km2 for Lake Fitri).
In this context, geochemical and isotopic data can provide us with independent quantitative constraints to determine the dynamic and water balance of each lake. In particular, the isotopic composition of water, expressed as δ18O and δ2H, has been extensively used to identify the sources of groundwater recharge, to quantify mixing processes (Friedman et al., 1964; Dinçer, 1968; Gat and Gonfiantini, 1981; Krabbenhoft et al., 1990; Gat, 1996; Delalande et al., 2005; Gat and Airey, 2006; Sacks et al., 2014) and to estimate water budgets (Gibson et al., 2002; Mayr et al., 2007; Vallet-Coulomb et al., 2008; Delalande et al., 2008; Gibson et al., 2017). In the case of intertropical lakes, however, the very large variations of isotopic composition induced by the seasonal cycle represent a very serious hurdle for mass balance calculations. Recently, Cui et al. (2018) reviewed a number of case studies where detailed hydrographic and isotopic monitoring had been obtained on different lakes under various climates in order to identify the most representative period for sampling during the seasonal cycle in each case, in the hope of obtaining a representative long-term perspective on lake water balance. This study confirms that each lake has a specific response depending on its climate and hydrologic context, which is unpredictable without extensive monitoring.
The objectives of our study are twofold. First, we propose combining point isotopic data with altimetry imagery in order to provide quantitative constraints at the lake scale on the hydrological budget (i.e., evaporation to influx ratio) of Iro Lake and Lake Fitri, with a proper assessment of uncertainties. We show that it is possible to take into account seasonal variability, beginning with limited dry season measurements, and we discuss the related error propagation which has seldom been considered in similar previous studies. We first explain our approach and test it on the well-documented case of Lake Ihotry in Madagascar, which has previously been extensively studied by our group (Vallet-Coulomb et al., 2006a, b, 2008). After validation on this benchmark site, we apply the same method to the original data that we obtained from the Chadian lakes Iro and Fitri in order to establish a first-order local hydrologic budget of these water bodies.
Secondly, we discuss the possibility of using these data to investigate the hydro-climatic budget at the larger scale of the entire watersheds of these lakes and, in particular, the partitioning between transpiration and evaporation at the basin scale, as has recently been described by several authors (Gibson et al., 2008; Jasechko et al., 2013).
2.1 Lakes Iro and Fitri, Chad
Lakes Iro (10.1∘ N; 19.4∘ E) and Fitri (12.8∘ N; 17.5∘ E) belong to two different sub-catchments in the central part of the Lake Chad basin (Fig. 1). Although today it is very shallow, Iro Lake likely originated as a meteoric impact (Garvin, 1986). It is close to the outlet of the Bahr Salamat watershed (195 000 km2), a sub-catchment of the Chari–Logone rivers (90 % of the Lake Chad water supply). Bahr Salamat draws its source in Darfur (western Sudan) and feeds Iro Lake during the rainy season through a seasonal defluent (Fig. 2; Billon et al., 1974). Lake Fitri (Fig. 3) can be considered a miniature analog of Lake Chad. It is the endorheic terminal lake of the Batha catchment (96 000 km2), which lies entirely in the Sahel zone. Albeit a permanent lake during most of the 20th century, it dried out in 1901 and again in 1973 (Lemoalle, 1987). These two lakes are thus located under two different climates: Sahelo-Sudanian for Iro and Sahelian for Fitri. Both are characterized by a rainy season from June to September, followed by a dry season, with an annual rainfall of 765 mm yr−1 at the Am Timan station upstream of Iro Lake and 360 mm yr−1 at Ati station upstream of Lake Fitri (annual averages between 1960 and 2014, data from the Direction of Water Resources and Meteorology: DREM, Chad). Precipitations are brought by the African Monsoon, and characterized by a large inter-annual as well as inter-decadal variability: during the 1950s and 1960s the area received heavy precipitation, while in the 1970s and 1980s it endured severe repeated droughts. The mean annual temperatures are 27 and 28 ∘C for lakes Iro and Fitri, respectively, and their relative mean annual humidity is 50 % and 40 % (data from Am Timan station, relating to the period between 1966 and 1976 for Iro Lake; and from Ati station between 1960 and 2004 for Lake Fitri, Boyer et al., 2006). Piche evaporimeter data were recorded between 1961 and 1988 at the Birao station (same latitude as Iro but further east) in Central African Republic, giving a 1.8 m yr−1 evaporative flux (DREM).
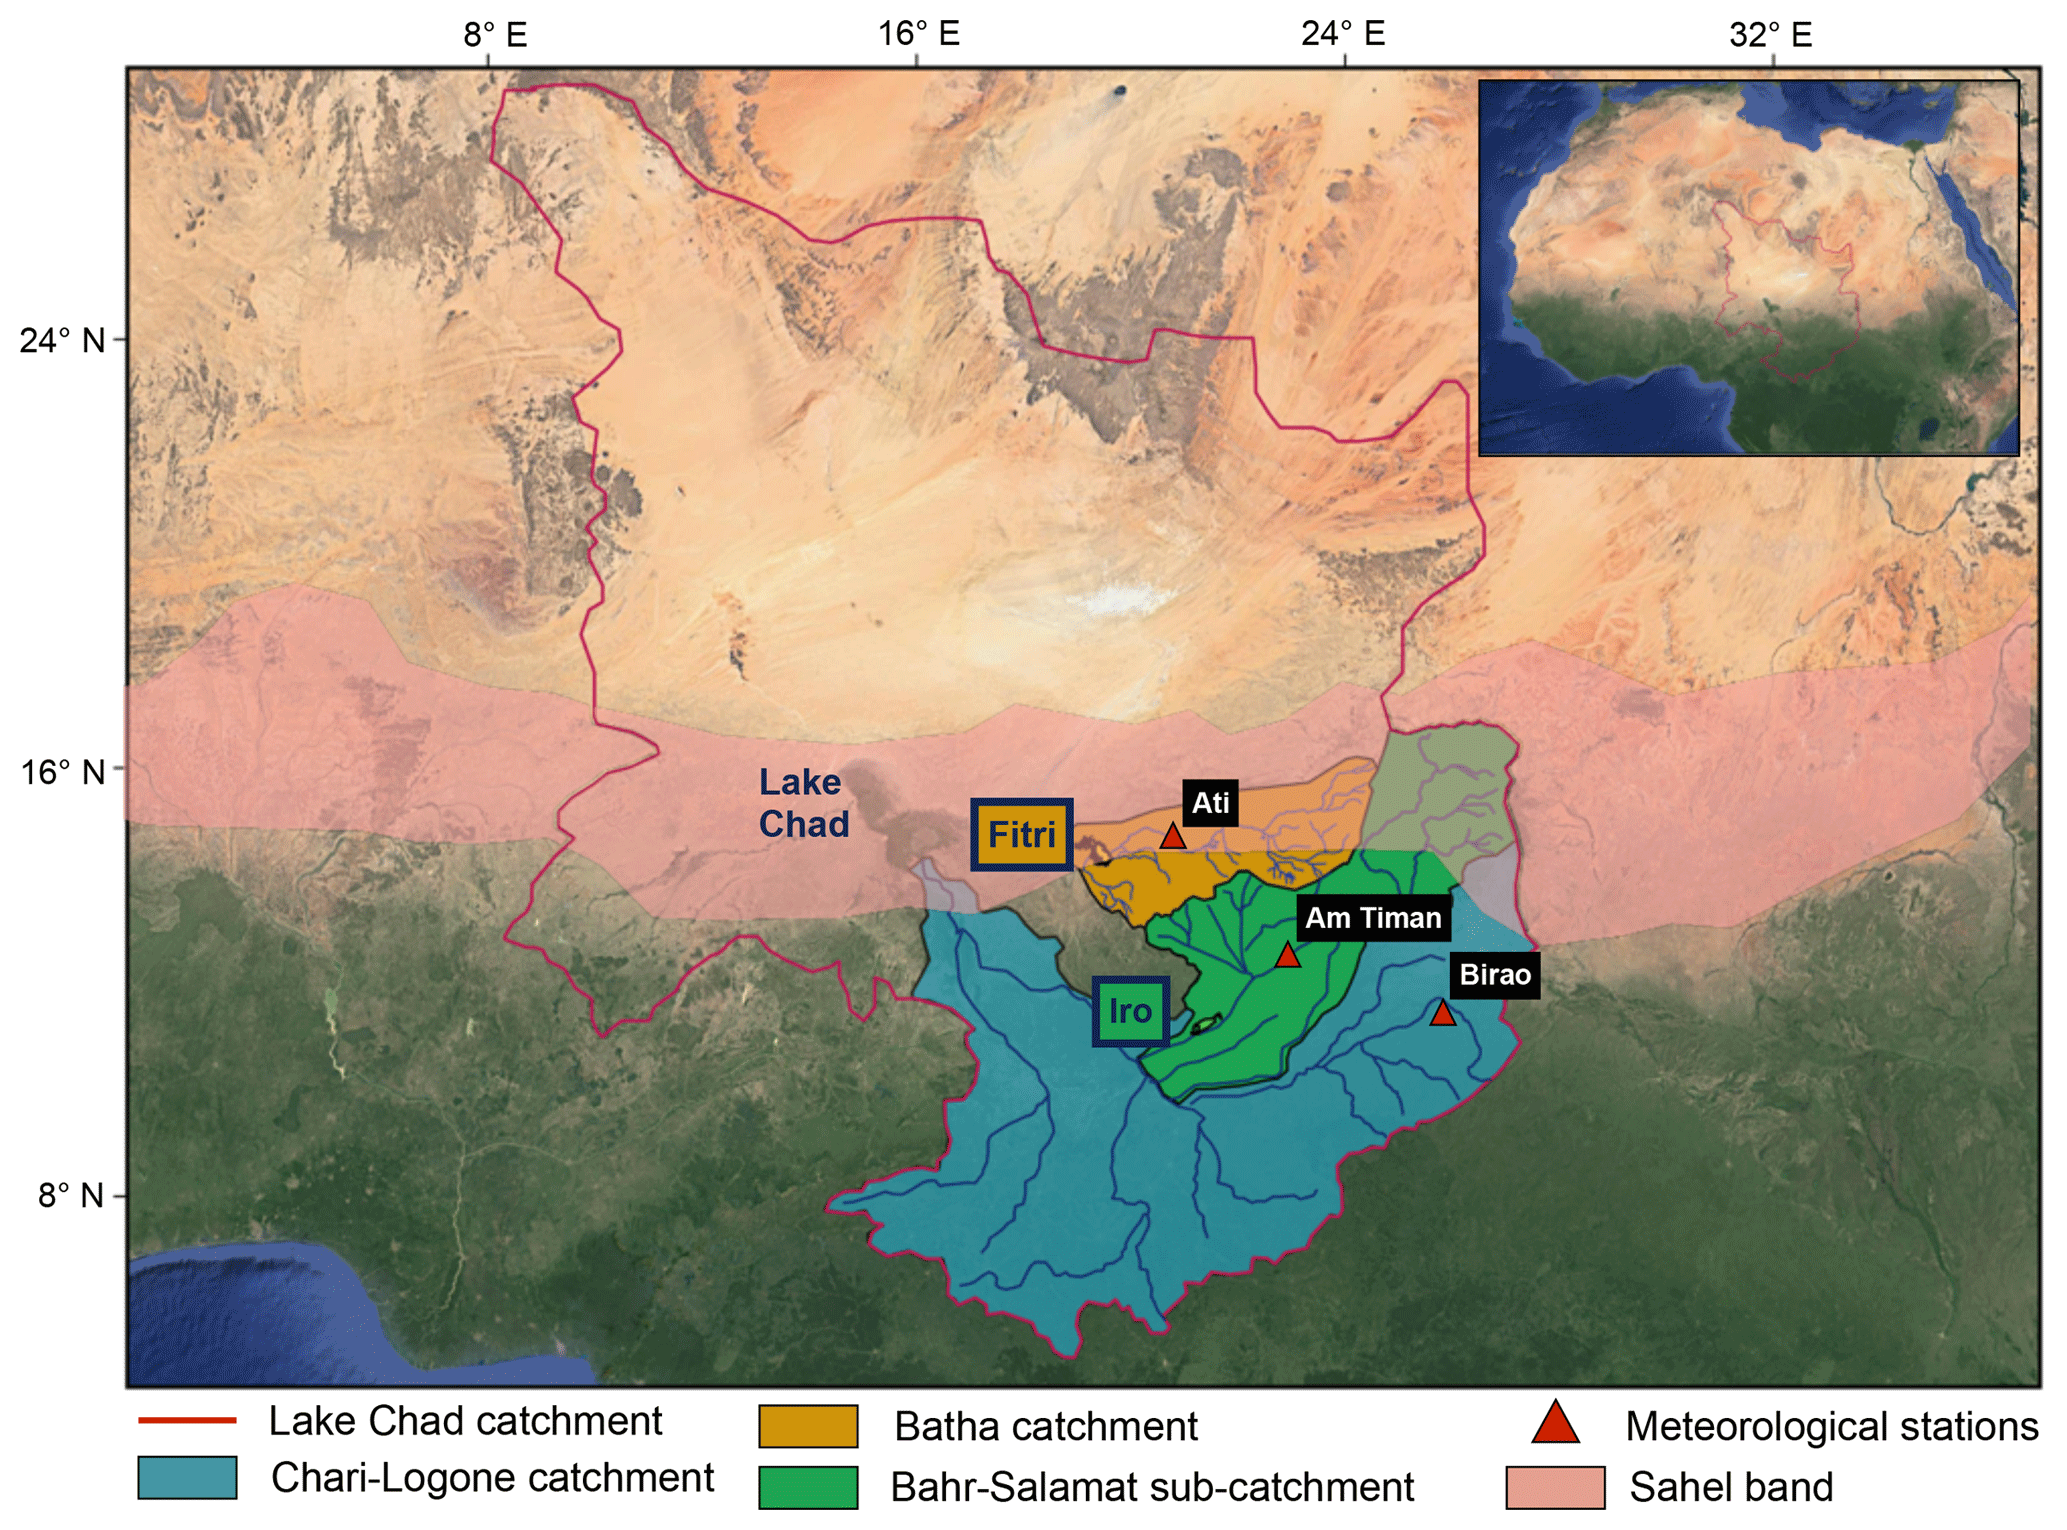
Figure 1Lake Chad basin (red line) is crossed by the Sahel strip (pink), which delineates the arid northern part and the humid southern part. It is constituted by two main catchments: the Chari–Logone rivers feeding Lake Chad (blue) and the Batha River feeding Lake Fitri (orange). The Bahr Salamat river (green) is a sub-catchment of the Chari–Logone rivers and feeds Iro Lake. Data from three meteorological stations (red triangles) have been used for this study.
Fluvial flow rates were measured on the Bahr Azoum, upstream of Iro Lake in the Bahr Salamat catchment (ORSTOM data from 1953 to 1966, then DREM until 1973) and upstream of Lake Fitri in the Batha catchment, between 1955 and 1993 (SIEREM data, Boyer et al., 2006). These rivers (also locally called “Bahrs”) flow over the Quaternary deposits of the Chad basin. A small number of granitic inselbergs outcrop around the two lakes, along with laterite surfaces especially at Iro Lake. The superficial aquifers are imbedded in sand–clay sedimentary deposits. In the area of Iro Lake, the phreatic aquifer in connection with the surface network is uniformly shallow (5–30 m) (Schneider, 2004). Lake Fitri is at the eastern fringe of the Quaternary aquifer of the Lake Chad basin (Leblanc et al., 2007). This sedimentary aquifer is characterized by major piezometric depressions with amplitudes of more than 60 m, such as the Chari-Baguirmi depression that is located west of Lake Fitri (Abderamane et al., 2013). Around the lake, the water table is at 10–15 m depth at Ati toward the north and at a depth of 50 m 20 km westward from the lake.
The two lakes are surrounded mainly by hydromorphic or halomorphic vertisols (soil map ORSTOM, 1968). Hydromorphic soils are constantly flooded during the rainy season (Gillet, 1969), which allows the growth of flood recession crops (in particular, sorghum, locally called “berbere”). Vegetation forms acacia-dominated savannah (Acacia seyal and Acacia sieberiana) and Combretum sudan savannah (Combretum glutinosum and Terminalia avicennioides) around Iro Lake (Gillet, 1969), as well as a steppe with Acacia senegal and Acacia tortilis at Lake Fitri.
The regions of Guéra (Iro Lake) and Batha (Lake Fitri) each hosts half a million people (RGPH, 2009). These lakes form important economic poles in their respective regions with various activities: agriculture, fishing, livestock farming and more recently gold mining in the south of Lake Fitri. These multiple activities can be sources of conflict when their distribution areas overlap and may also increase pressure on resources.
2.2 Lake Ihotry, SW Madagascar
Lake Ihotry is located in SW Madagascar. It is a small lake (between 68 and 115 km2) located in an endorheic karstified limestone watershed covering 3000 km2 (Grillot and Arthaud, 1990). The climate is semi-arid and is characterized by a strong contrast between dry and rainy seasons. Precipitations occur between December and March and are about 800 mm yr−1. Climatic conditions are thus quite similar to those observed around the Chadian lakes. Half the input to Lake Ihotry comes from the Befandriana River and associated hyporheic fluxes, and the other 50 % enters as direct rainfall (Vallet-Coulomb et al., 2008). Water balance analysis shows that Lake Ihotry is a closed-system lake, with evaporation representing 99 % of the output (Vallet-Coulomb et al., 2006b). By contrast with lakes Chad, Iro and Fitri, Lake Ihotry is a saline lake with a conductivity ranging between 7000 and 23 000 µS cm−1.
The hydrologic cycle and isotopic data of this lake have been regularly monitored and analyzed through several seasonal cycles, leading to a well-constrained hydrological and isotopic model (Vallet-Coulomb et al., 2006a, b, 2008), which thus constitutes a valuable benchmark for our approach.
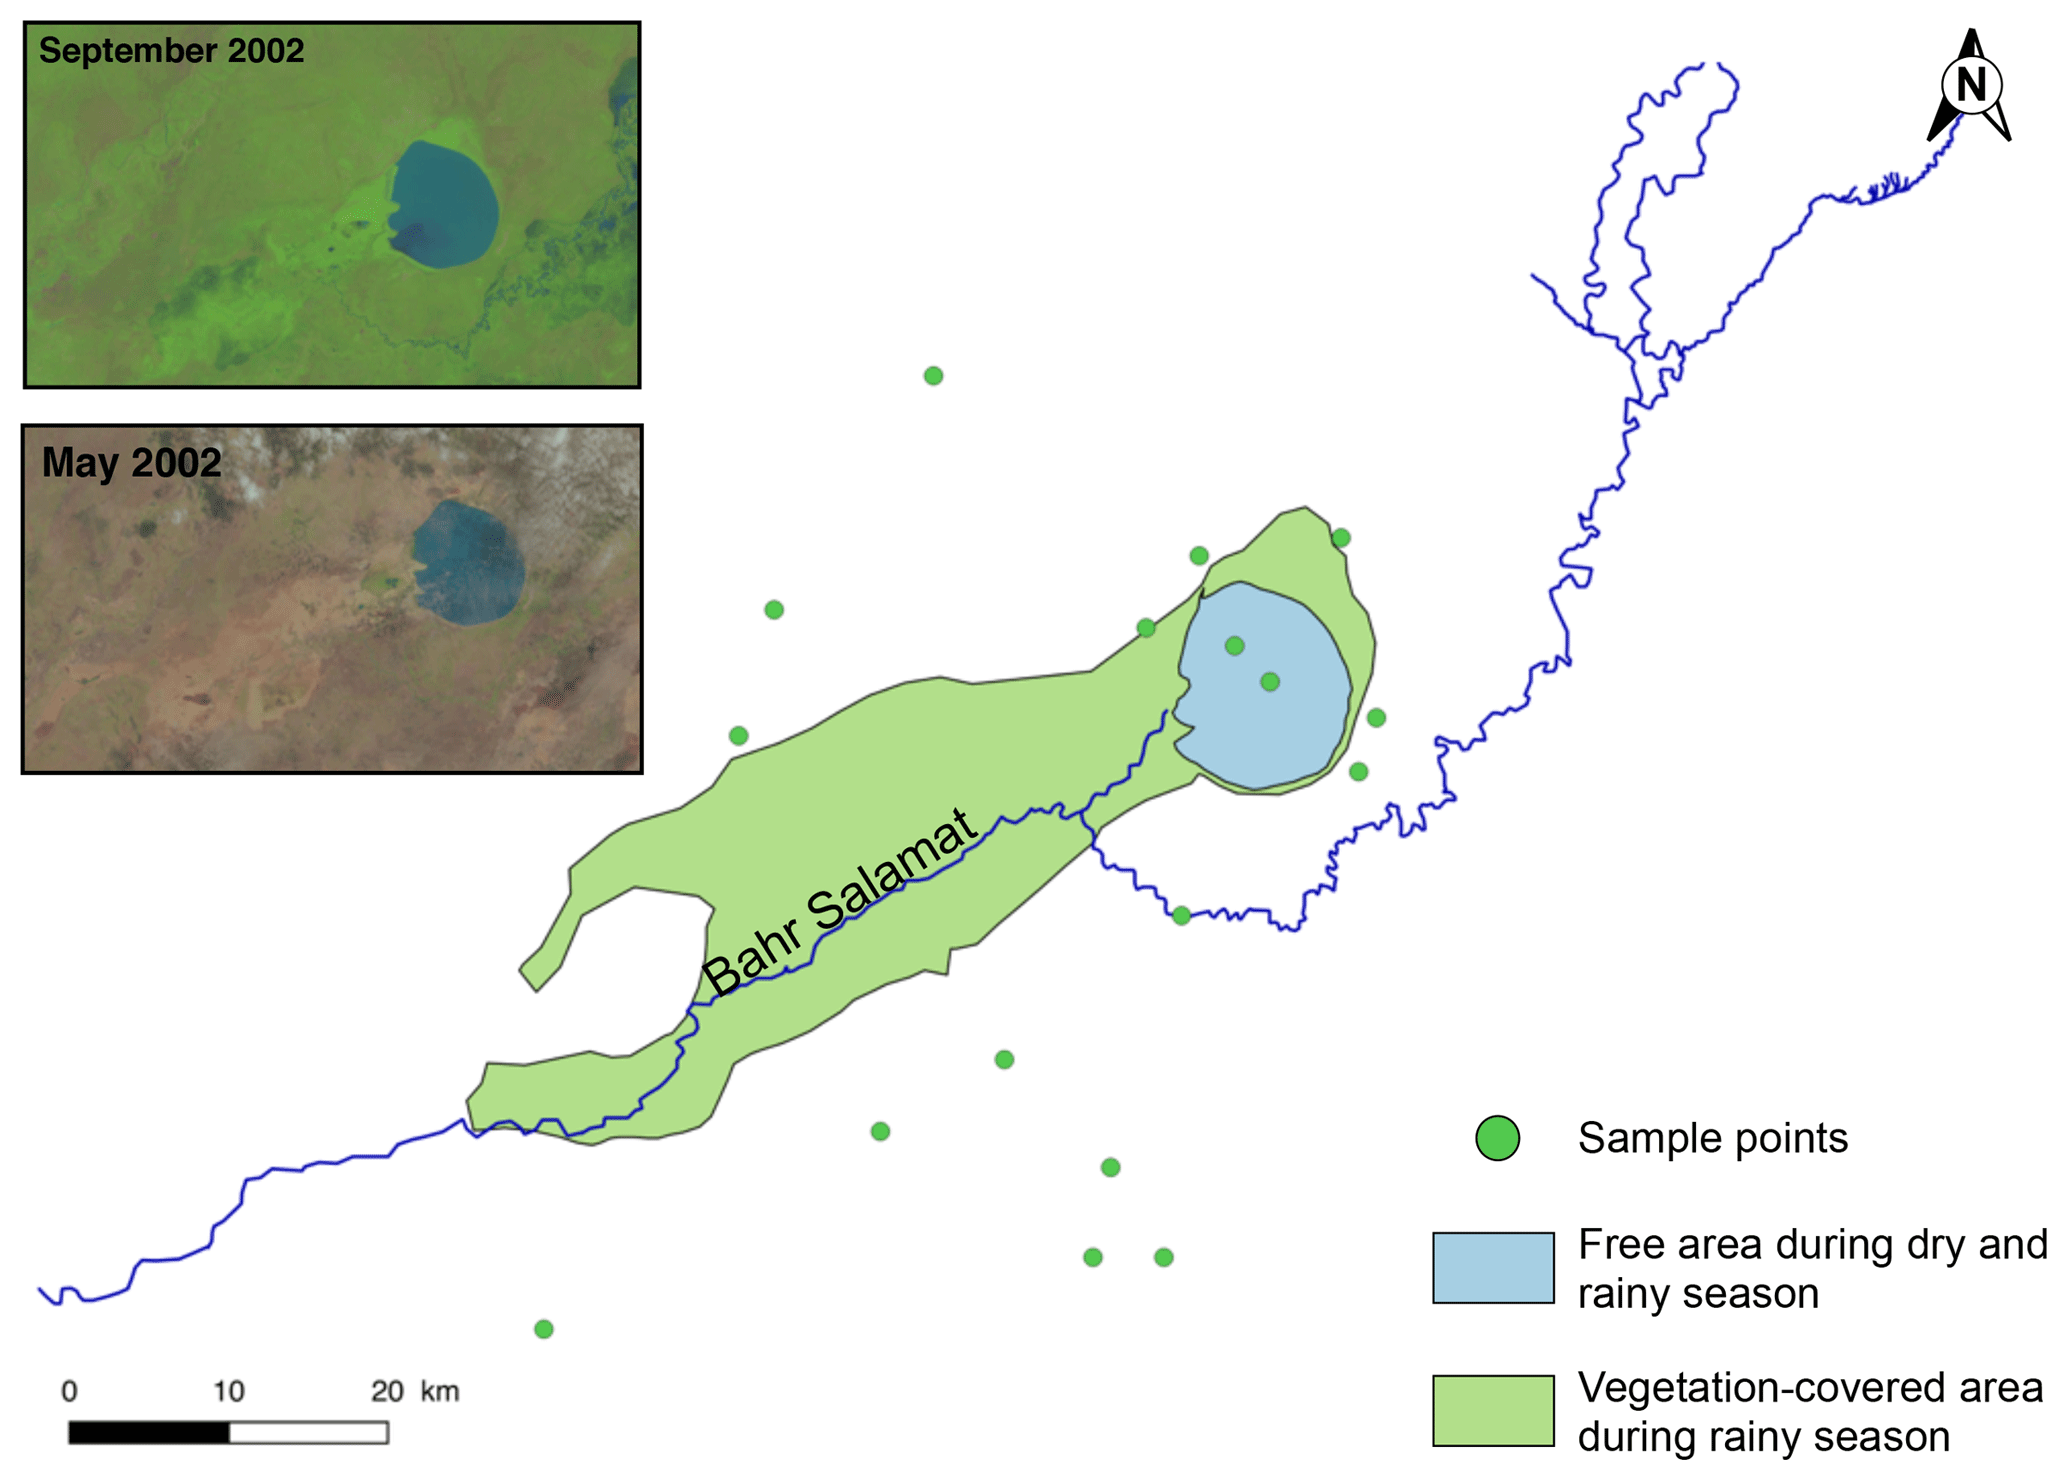
Figure 2Landsat 7 pictures of Iro Lake during the wet season (September) and at the end of the dry season (May). The states of the lake are represented in blue for open water and in green for vegetation covering the flood plain during the rainy season. Only a portion of the Bahr Salamat river feeds the lake. Green dots represent the sampled water during April 2015.
Samples were collected for geochemical analyses during two field campaigns, on Lake Fitri at the end of February 2015 and on Iro Lake in April 2015. At each sampling point (Figs. 2 and 3), physicochemical parameters were measured, and surface waters and groundwaters were collected for stable isotopes, major ions and other isotopic analyses. Only stable isotope analyses are presented and discussed here. A total of 33 groundwater samples were collected (14 for Iro Lake and 19 for Lake Fitri) and 4 surface water samples (2 for each lake). The Bahr Salamat was also sampled upstream of the defluent that feeds Iro Lake, and one sample from the Chari River was taken upstream of the confluent of the Bahr Salamat. The Batha River was dry at this period.
Stable isotope measurements were performed at CEREGE using cavity ring-down laser spectrometry (PICARRO L1102-i) for low-salinity samples (<1000 µS cm−1). The high-salinity samples (>1000 µS cm−1) were analyzed on a dual-inlet Delta Plus mass spectrometer, after equilibration with CO2 (10 h at 291 K) and H2 (2 h at 291 K with a platinum catalyst), for δ18O and δ2H, respectively, in an automated HDO Thermo Finnigan equilibrating unit. The isotopic ratios are reported in per mil (‰) versus VSMOW, normalized to the VSMOW2–VSLAP2 scale using three laboratory standards, following the IAEA reference sheet IAEA (2009). Each analysis has been duplicated, or further repeated when necessary, and the total uncertainty is less than ±0.15 ‰ (1σ) and ±1 ‰ (1σ) for δ18O and δ2H, respectively.
In order to survey the lake surface variations, we used Landsat 7 and Landsat 8 monthly satellite images (NASA Landsat program, 1999 and 2013). Water level changes can be measured using satellite altimetry. This technique was designed to study water level changes over the oceans, but can also be used over lakes and rivers. Since 1992 a large number of altimetry missions have been launched. The nadir altimeter emits pulses toward the nadir and the distance between the altimeter and the Earth's surface can then be measured by calculating the time it takes to receive the echo as it rebounds from the reflecting surface. When the precise orbit of the satellite is known, this calculation can then be used to determine the water height of lakes or rivers (Crétaux et al., 2016) in studies of continental hydrology. Altimetry data from the AltiKa altimeter on board the SARAL satellite were used to track the lake level variations between 2013 and 2015.
4.1 Hydrologic budget at the lake scale
In this section, we recall the basic principle of the determination of the ratio E∕I between evaporation (E) and influx (I) and explain our handling of the isotopic budget equations. The water mass balance and the isotopic mass balance of a homogeneous lake at steady state is given by
where I is the flux of water flowing in, either as precipitation, surface runoff or groundwater. E is the evaporation flux, and Q is the outflow. δI and δQ are the amount-weighted average isotopic compositions of inflow and outflow, which can both be measured directly, at least as far as surface inflow is concerned. Physical outflow does not cause any isotopic fractionation: the outflow has thus the same isotopic signature as the lake (δQ = δL). δE is the isotopic composition of the evaporation flux leaving the lake.
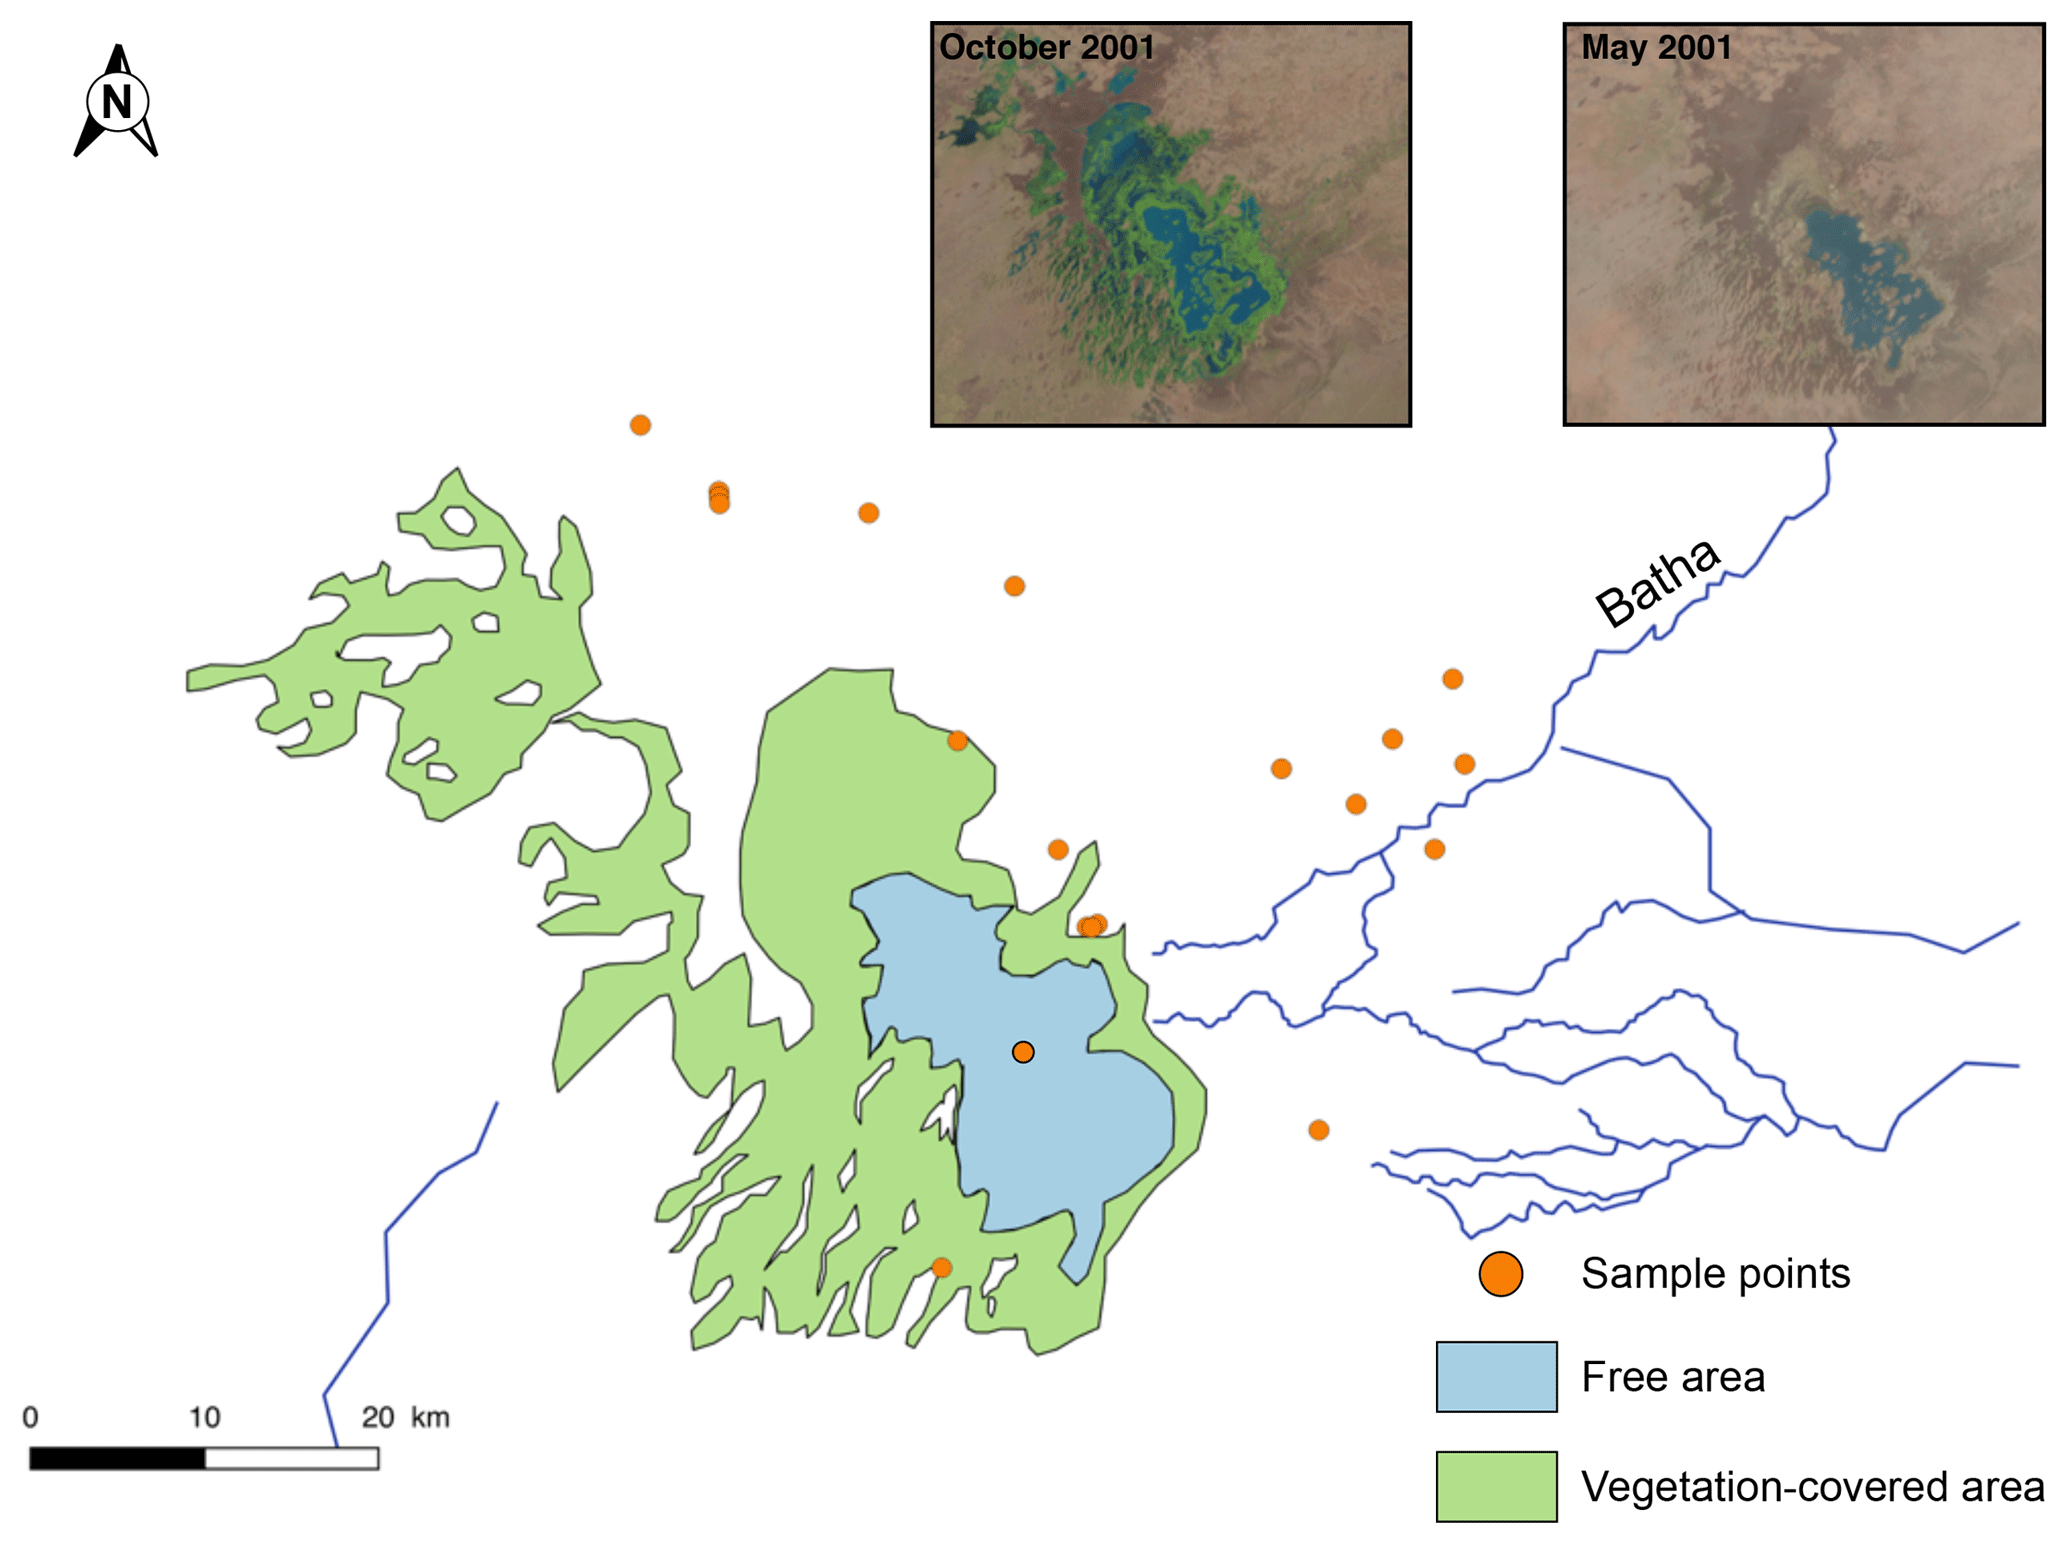
Figure 3Landsat 7 pictures of Lake Fitri during the wet season (October) and at the end of the dry season (May). The states of the lake are represented in blue for open water during both wet and dry seasons and in green for vegetation covering the largest area during the rainy season. The Batha River is the main tributary, and orange dots represent the sampled water during January 2015.
By combining Eqs. (1) and (2), the evaporation to inflow ratio (E∕I) can be expressed as
The evaporation flux leaving the lake is depleted in heavy isotopes relative to the lake and depends to a large degree on kinetic fractionation processes. It is traditionally calculated using the Craig–Gordon model (Craig and Gordon, 1965):
where δE is expressed as a function of equilibrium (α, ϵ*) and kinetic (ϵK) fractionation factors, the relative humidity (h) and the isotopic composition of the atmospheric vapor (δa). The values and the calculation of these different factors have been discussed extensively by several authors and are listed in the Appendix. The seasonal variations of h are obtained from regional weather stations. The value of δa can be measured in the field either with a cryogenic trap device (Fontes et al., 1970; Krabbenhoft et al., 1990; Salamalikis et al., 2015) or more recently by laser spectrometry (Tremoy et al., 2012). Since these measurements remain relatively rare, an alternative is to assume as a first approximation that δa is in isotopic equilibrium with the precipitation, and then to discuss the sensitivity of the results with respect to this assumption:
Calculated from steady-state values, or from average values integrated over the annual cycle, the E∕I ratio allows us to discriminate between lakes behaving as closed systems, i.e., where evaporation is the only water output (), and open-system lakes from which water can exit as surface or underground flow (). Cases where would thus indicate lakes that are not in steady state and are progressively drying out.
This approach has been used extensively in previous studies (Zuber, 1983; Gibson et al., 1993, 2002; Mayr et al., 2007; Yi et al., 2008; Brock et al., 2009), especially for inter-comparisons between lake hydrological budgets at a regional scale, assuming that the seasonal variations of lake level and composition can be neglected by comparison with the regional gradients (Gibson et al., 2002). On the other hand, in regions with high seasonal contrast in lake level between wet and dry seasons, it is essential to have access to annual integrated values in order to solve Eq. (3). Therefore, regular monitoring of lake level and isotopic composition, as well as of inflow and outflow measurements, is required. However, for lakes that cannot be monitored for logistical reasons, such as the two Chadian lakes investigated here, we show below that a first-order estimate of the water balance can be assessed from dry season isotopic data alone, with the addition of lake level satellite data.
Indeed, for any given lake for which the regional values of δa, h and δI are known, we can calculate the isotopic composition characteristic of the closed-system situation (δL−closed) by combining Eq. (4) with the steady-state condition δE = δI:
The isotopic composition measured during the dry season, δL−dry, can then be compared to this δL−closed value. For a lake where , we can deduce that the mean annual value of δL, which is always lower than δL−dry, is thus also lower than δL−closed. This means that the lake is “open”, with a significant outflow, and the application of Eq. (3) leads to a maximum value of E∕I.
In a second step, a more precise E∕I value can be obtained, based on seasonal lake volume variations estimated from satellite data. For this purpose, a model value of the isotopic composition of the lake at the end of the wet season (δL−wet) must be obtained. The simplest case is that of a closed-system lake, when the flux of evaporation can be neglected compared to the inflow during periods of wet season lake level increase. In this case,
with .
Vwet is the maximum volume of the lake at high stand, and Vdry is the low-stand volume at the end of the dry season. In cases where the outflow is not negligible during the wet season, and considering constant inflow and outflow (Qin and Qout, respectively) during the wet season, the equation becomes
with .
More complex situations with time-variable fluxes and non-negligible evaporation during infilling would require using a complete finite-difference model based on a priori assumptions on the respective proportions of the different flows over time:
where all the terms may vary with time, and should be adjusted to fit the observed value of δL, and when the time variation of the volume (V) obtained from satellite observations is known.
4.2 Hydrological budget at the catchment scale
In parallel to the characterization of a lake's hydrological regime, it is also important to evaluate possible hydro-climatic inferences at the scale of the entire catchment, especially with respect to the influence of evaporation and transpiration on the water balance. Gibson et al. (2008) and Jasechko et al. (2013) proposed an attribution method based on solving the three end-member equations between transpiration (T), evaporation (E) and outflow (Q), using the property that, though transpiration does not fractionate water isotopes, evaporation does induce strong fractionation. The solution of this equation for a steady-state catchment without additional inflow from upstream is
P is the average precipitation over the catchment, and δE is the isotopic composition of the evaporation flux, obtained again with the Craig–Gordon model and the lake isotopic composition. Jasechko et al. (2013) assumed that δL can be considered to be representative of all the surface water over the catchment. The value of δT was calculated as the average rainfall composition over the seasonal cycle, weighted by the NDVI index (normalized difference vegetation index) (Curran and Steven, 1983; Defries and Townshend, 1994), used as a proxy of transpiration intensity. The results obtained from this approach as they pertain to lakes Iro and Fitri are discussed below.
Lakes Iro and Fitri, along with Lake Chad itself, share the common characteristic of all being fresh-water lakes in spite of the very high evaporation rate in the Sahel region, with dry season conductivity values of 170 and 140 µS cm−1, respectively, and a similar pH of 8. By contrast, groundwaters around the two lakes are, in general, more saline, although greatly variable, with conductivity ranging randomly between 65 and 1012 µS cm−1 at Iro Lake and between 705 and 14 000 µS cm−1 at Lake Fitri. Measured pH values are more acidic around Iro Lake (5< pH <7) than around Lake Fitri (6.5< pH <8.5).
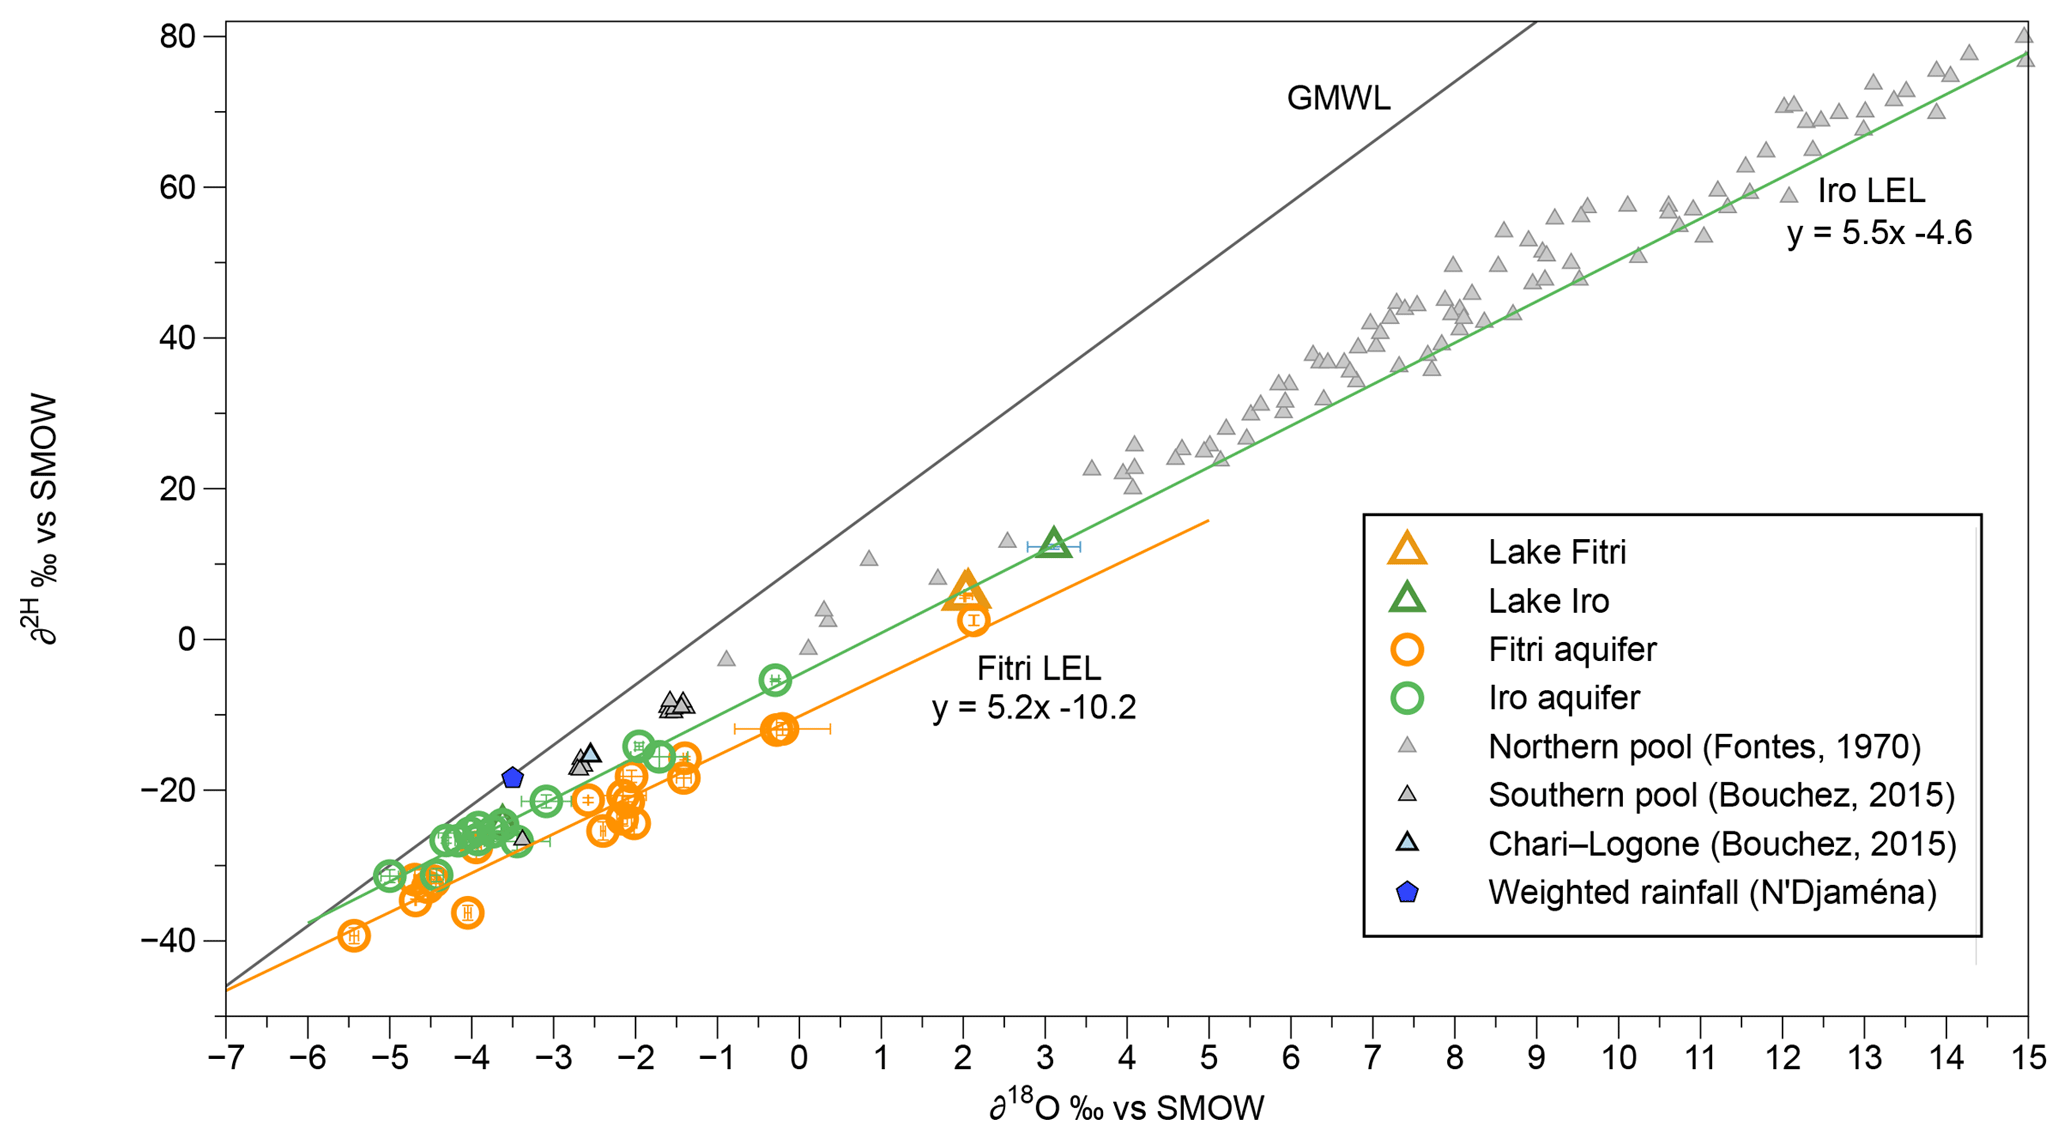
Figure 4Relation between δ18O and δ2H (‰ vs. SMOW, Standard Mean Ocean Water) for surface water and groundwater samples from Iro Lake and Lake Fitri. Iro Lake's groundwater (green) forms a local evaporation line (LEL) on which the data from Iro Lake and Lake Fitri are plotted (triangles). Lake Fitri's groundwater forms another LEL below that of Iro Lake. In grey, Lake Chad data (Fontes et al., 1970) trace their own LEL (), which can be seen above the two previous lines. The weighted rainfall (from N'Djamena IAEA station) is in blue and the associated local meteoric water line (LMWL) equation is .
The lakes' stable isotopes compositions are (+3.11 ‰, +12.3 ‰) for δ18O and δ2H at Iro Lake in April and (+2.04 ‰, +5.8 ‰) at Lake Fitri in February. In the δ2H versus δ18O diagram (Fig. 4), these compositions plot far to the right of the global meteoric water line (GMWL), with deuterium-excess (d-excess) values of −12 ‰ and −10 ‰, respectively, typical of evaporated lake waters (see Jasechko et al., 2013, for a global compilation).
As is traditionally observed in the semi-arid zone (Gaye and Edmunds, 1996; Weyhenmeyer et al., 2000; Lamontagne et al., 2005; Gonçalvès et al., 2015) the groundwater data around the two lakes form two local evaporation lines (LELs), with a slope lower than the GMWL and the most depleted values plotting on or close to it (Fig. 4). A noticeable feature is that, while the two lines are very close, they are nevertheless significantly distinct from one another, with a similar range of variation (between −5 ‰ and 0 ‰ for δ18O at Iro Lake and between −5 ‰ and +2 ‰ at Lake Fitri) and similar slopes (5.5±0.3 and 5.2±0.3), but with a distinctly lower intercept (Fig. 4). Although the two alignments are well defined, it is noteworthy that the data from Lake Fitri show more scatter than do those from Iro Lake, especially in the most depleted values (MSWD =6.0 and 33, respectively). Finally, it must be pointed out that the lakes' compositions both plot on Iro Lake LEL, suggesting a direct connection and continuity between surface water (lake and river) and aquifer at Iro Lake, but implying a more complex situation at Lake Fitri.
The local meteoric water line (LMWL) closest to our study sites is given by the rain samples collected at the IAEA station of N'Djamena between 1962 and 2015. The data are more or less continuous between 1963 and 2015, with a total of 78 months being recorded. The slope of the alignment is 6.3±0.2 with a large range of variation between −10 ‰ and +10 ‰ for δ18O. Such a low slope is generally considered to be a signature of a strong evaporation of rain droplets during their atmospheric cycle (Dansgaard, 1964; Gat, 1996). Interestingly, the precipitation-weighted average (−3.53 ‰, −18.4 ‰; d-excess =6.5 ‰) calculated over this period is significantly more enriched than the values found at the intersection of the local meteoric water line and the two LELs of lakes Iro (−5.83 ‰; −36.6 ‰; d-excess =3.9 ‰) and Fitri (−7.21 ‰; −47.7 ‰; d-excess ‰) (Fig. 4).
Figure 4 also compares our results with the data published on Lake Chad's northern pool (Fontes et al., 1970) and southern pool (Bouchez et al., 2016). All these data lie above the LEL of Iro Lake, with data from the northern pool being very enriched (between −0.8 ‰ and +15 ‰ for δ18O and between −2.8 ‰ and +77 ‰ for δ2H). By comparison, the southern pool is more depleted (between −3.3 ‰ and −1.5 ‰ for δ18O and between −26 ‰ and −10 ‰ for δ2H). The isotopic composition of the Chari–Logone rivers (−2.55 ‰ for δ18O and −15.4 ‰ for δ2H), measured in November 2011 and between January 2013 and August 2014 (Bouchez et al., 2016; Mahamat Nour et al., 2017), traces the same trend as Lake Chad LEL.
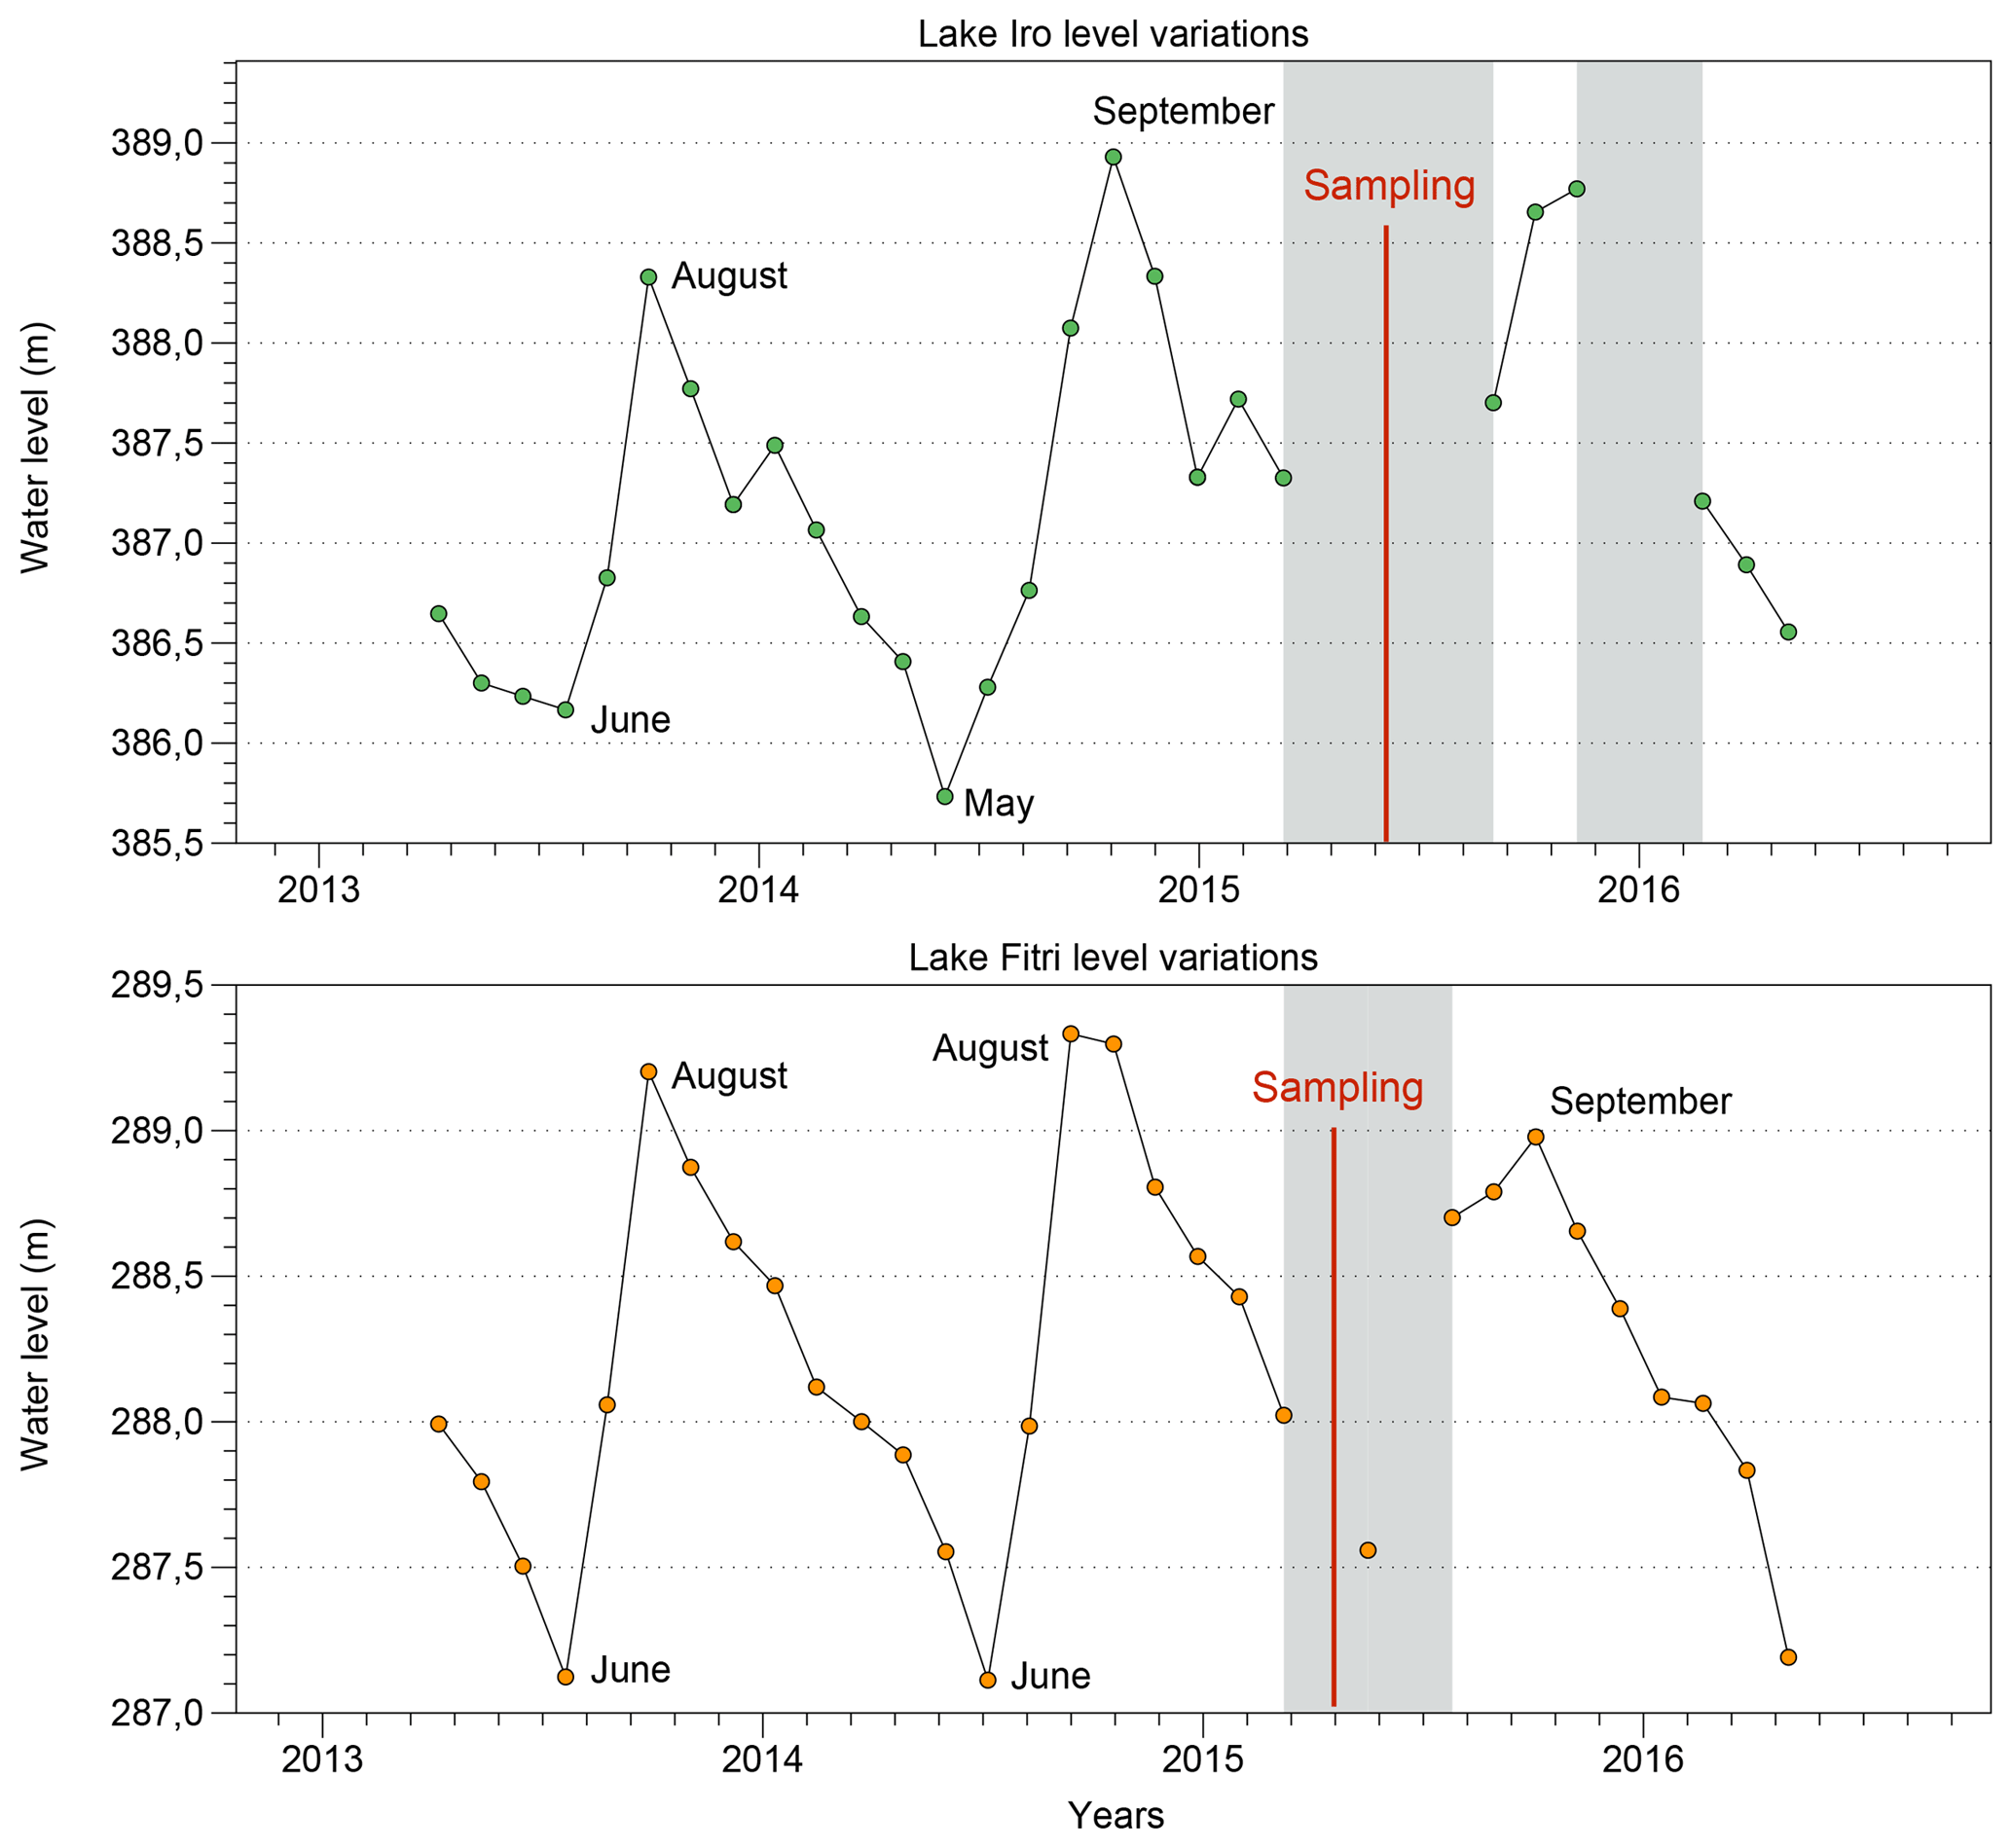
Figure 5Lake level variations from altimetry data (SARAL satellite) for Iro Lake (in green) and Lake Fitri (in orange). Data cover the period from 2013 to the beginning of 2016. The grey zones represent a lack of data, and the red line indicates the period of sampling. Variations in lake level show a maximum of 3.5 m for Iro and of 2.5 m for Fitri during 2014. The maximum level is observed around August and September, and the minimum is in May–June for both lakes.
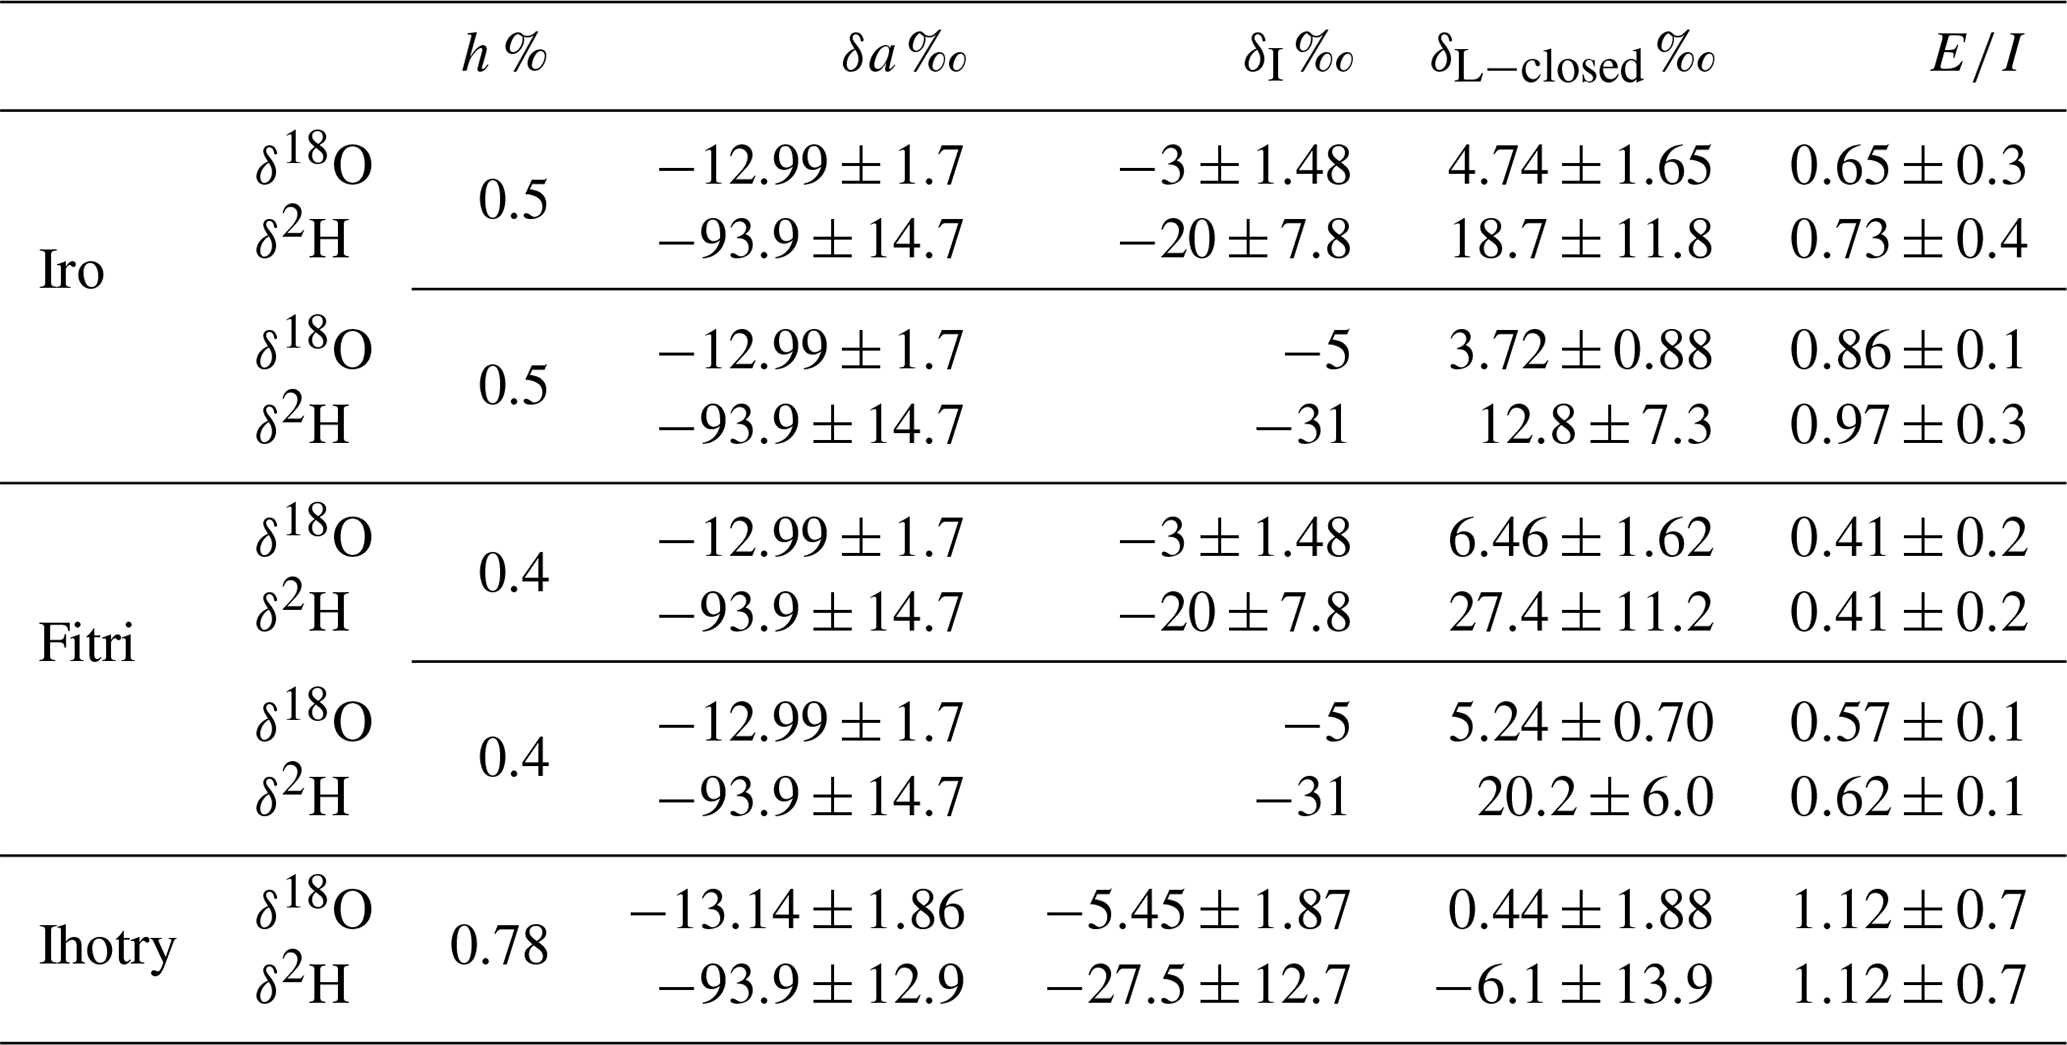
Table 1Uncertainties in δL−closed and E∕I, for the three lakes studied, propagated from 1σ standard deviations for δa and δI.
Altimetry data show amplitudes between 2 and 3 m for the lake level variations at Iro Lake in the years 2013 and 2014 (year 2015 is incomplete). The measured maximum occurs in August and September and the minimum in May and June for these 2 years. For the same period, an amplitude of 2 m was found for Lake Fitri, with a maximum in September and a minimum in June (Fig. 5). Since the water depth measured during the field campaign at Iro Lake in April 2015 was 2 m and was uniform across the transect, these satellite observations show that the increase in water depth during the wet season was in excess of a factor of 2. By contrast, the free water surface (≈100 km2), clearly visible on Landsat 7 and Landsat 8 images (Fig. 2), shows only minor changes during the year. This suggests that the extra 2 m of water added to the lake in summer is in fact spread over a large area adjacent to the lake itself that is covered by vegetation tolerant to seasonal flooding. The slightly lighter color observed on the satellite images around the lake (Fig. 2) is likely diagnostic of this surface, which we can therefore estimate on the order of 600 km2 (i.e., about 6 times larger than the dry season lake surface). The related change in volume is by a factor of 6, determined by inverse-distance-weighted interpolation and assuming a linear decrease in the depth toward the edges.
Similarly, Lake Fitri also undergoes large seasonal variations of its surface: more than 1000 km2 wide during its high level, it can shrink to less than 200 km2 at its low level (Fig. 3). Based on the bathymetry measured during the second campaign (February 2016) (2.5 m maximum depth in the western part of the lake), the related change in volume is of a factor of 4 for the year 2016.
6.1 Water balance of the lakes
The results obtained from Eqs. (1) to (9) on the three lakes Ihotry, Iro and Fitri are listed in Table 1 and discussed below. The propagation of uncertainties is discussed specifically in Sect. 6.1.3, after presentation of the raw data.
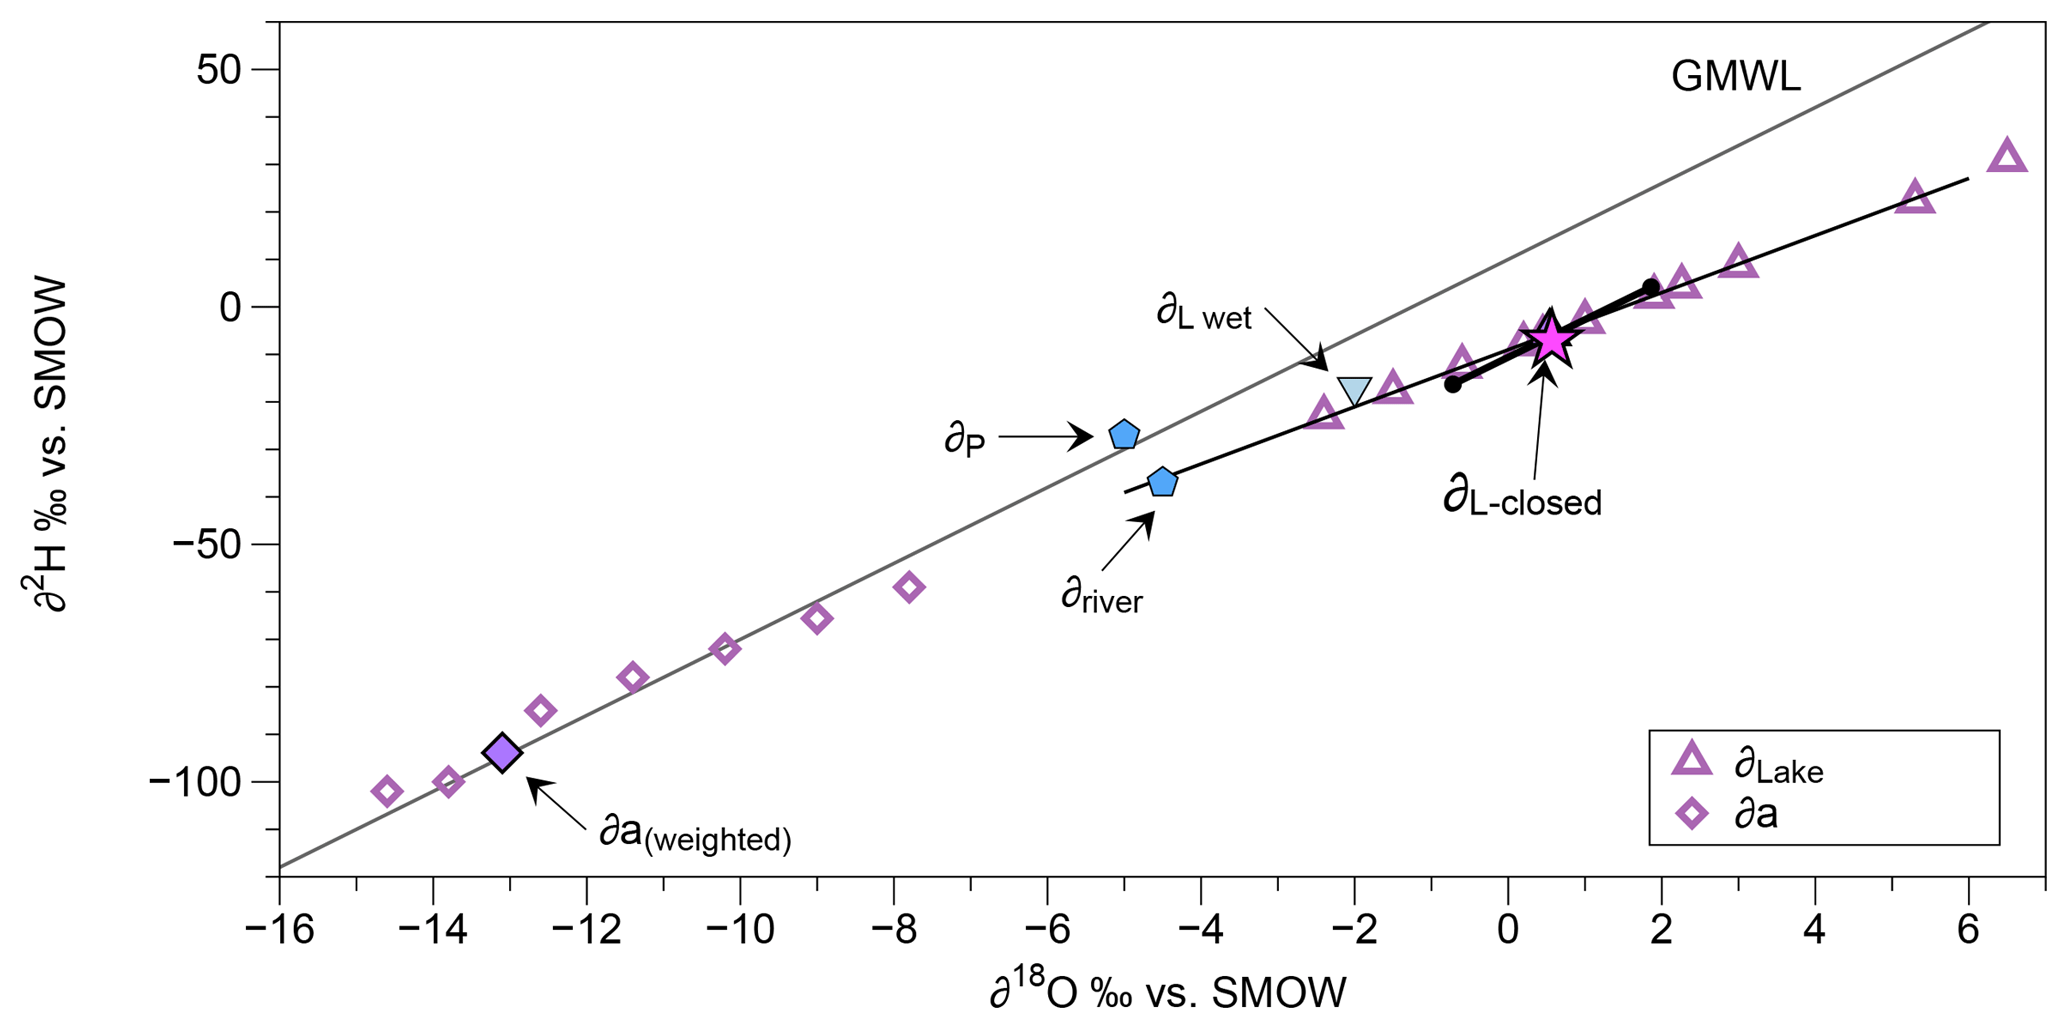
Figure 6Representation of δL−closed for Lake Ihotry. Purple triangles represent Lake Ihotry isotopic composition over a year, and the purple diamonds are the atmospheric isotopic composition (δa) over a year (the solid one represents the δa-weighted average). δP is the rainfall isotopic composition above Lake Ihotry and δriver is the isotopic composition of the Befandriana River which feeds Lake Ihotry. The pink star represents the δL−closed, calculated according to Eq. (6). The blue triangle is the δL−wet, calculated using Eq. (9). The black line around δL−closed represents the associated uncertainties.
6.1.1 Lake Ihotry, SW Madagascar
The calculation of δL−closed (Eq. 7) gives +0.44 ‰ and −6.1 ‰ values for δ18O and δ2H (Fig. 6). The mean values of δL−dry measured during the 3-year study are +5.44 ‰ and +26.7 ‰ for δ18O and δ2H, which are thus significantly higher than δL−closed (Fig. 6). The values of δL−wet calculated by Eq. (8) (closed-system lake) are δ18O ‰ and δ2H ‰, which are very close to the average isotopic composition observed in March for Lake Ihotry (Vallet-Coulomb et al., 2006b). We are thus in the situation where δL−wet < δL−closed < δL−dry, which is compatible with the diagnostic of a closed-system lake.
In the case of Lake Ihotry, for which we have a regular monitoring of the water flows and isotopic composition over 3 years at a monthly timescale, we can push the analysis further by calculating a precise mean value of δL weighted by the output flows. The values we obtain for δL (δ18O ‰ and δ2H ‰ ) are very close to δL−closed, which confirms both the closed lake conclusion and the reliability of the method.
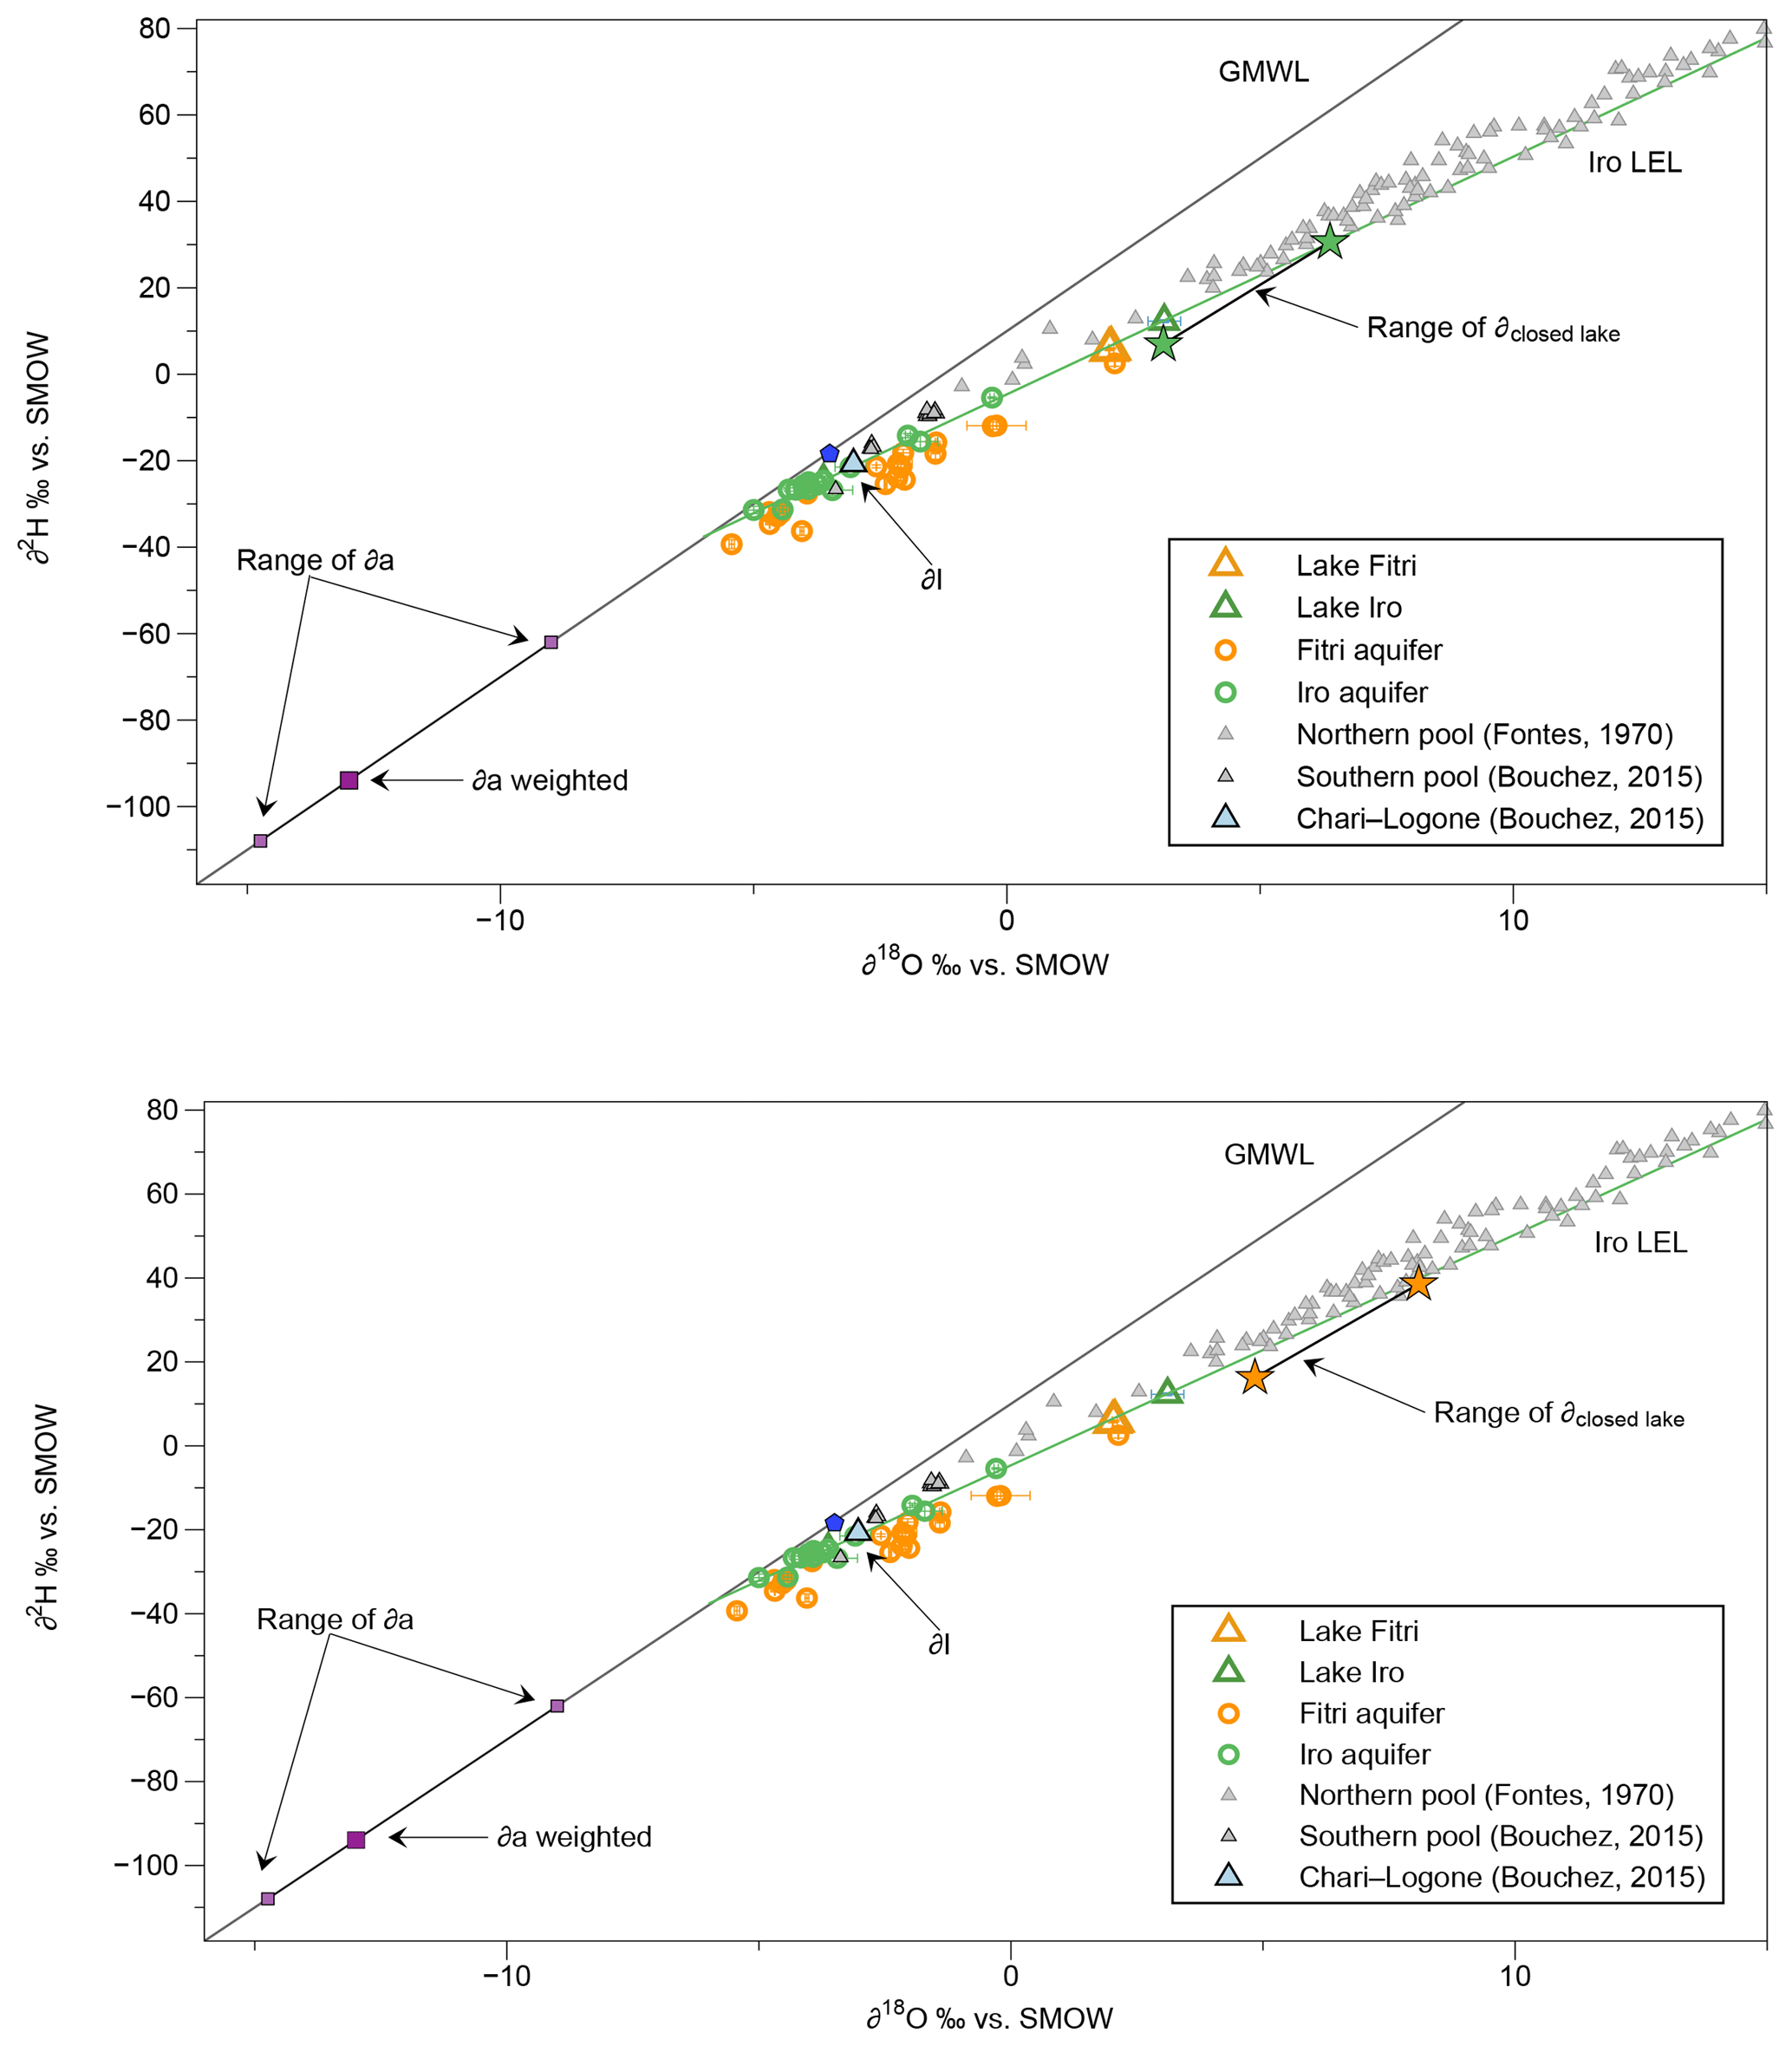
Figure 7Representation of δL−closed variations for Iro Lake and Lake Fitri (green and orange stars, respectively). They are slightly below Iro Lake's local evaporation line (LEL), in green, formed by Iro Lake's groundwater (green circles). Iro Lake and Lake Fitri (green and orange triangles) plot on this LEL, but Lake Fitri's groundwater (orange circles) plots just below. Purple dots represent the atmospheric isotopic composition (δa). δI is the isotopic composition entering the system for Iro Lake surface water and groundwater and for Lake Fitri surface water only. We took ±1σ for δa and δI to represent the range of variations of δL−closed.
6.1.2 Iro and Fitri
The same approach is then applied to lakes Iro and Fitri. The results are shown in Fig. 7. Depending on the different assumptions that we can use for the values of the parameters δI and δa (Table 1), δL−closed can vary between +3 ‰ and +6 ‰ for δ18O, and between +11 ‰ and +30 ‰ for δ2H for Iro Lake. For Lake Fitri, the values range between +5‰ and +7 ‰ for δ18O and between +18 ‰ and +34 ‰ for δ2H. These values are in both cases definitely higher than those measured on the lakes: we are in the case where δL−dry < δL−closed, which is characteristic of open lake systems. The resulting maximum E∕I value for Iro Lake is , calculated with either δ18O or δ2H. For Lake Fitri, we find . However, since the sample was collected in the middle rather than at the end of the dry season, δL−dry is most probably higher than our measured value, and the corresponding E∕I result can only be taken as a lower estimate.
This maximum E∕I value can then be combined with the ΔV∕Vdry value estimated from the satellite data, to calculate the range of δL−wet values based on Eq. (9) (δL−wet ‰; −9.8 ‰ for δ18O and δ2H), keeping in mind that this is a first-order approximation, based on the simplifying assumption of constant flux and negligible evaporation during the rainy season. Finally, the arithmetic mean between δL−dry and δL−wet (0.19 ‰ for δ18O and −4.2 ‰ for δ2H) provides an average value of the isotopic composition of the lake, from which a ratio is calculated for Iro Lake.
These results can be confronted with the scarce hydrological information available on the studied systems. For Iro Lake, based on the 1.8 m yr−1 mean evaporation recorded at the Birao station (SIEREM), and assuming an average surface of the lake of 350 km2 (halfway between the dry and wet season surfaces), we can estimate that the mean flux of vapor escaping the lake (E) is on the order of 5.108 m3 yr−1. The inflow (I) is then between 17 and 31 m3 s−1 (after subtraction of the minor contribution of direct rainfall on the lake surface), and the outflow (Q) is between 6 and 11 m3 s−1. These figures are thus coherent with the average flow of 30 m3 s−1 measured on the Bahr Azoum at the Am Timan station between 1953 and 1975.
For Lake Fitri, using the evaporation of about 2 m yr−1, similar to that calculated on the southern pool of Lake Chad under the same climatic condition (Bouchez et al. 2016), we obtain a flux on the order of 16.108 m3yr−1 and an inflow between 43 and 110 m3 s−1. The maximum flow rate recorded at the Ati station between 1956 and 1993 was 66 m3 s−1, corresponding to the maximum rainfall of 571 mm yr−1 over this watershed in 1962 (DREM). It must be noted that the river dried out completely during the drought episodes of the 1980s. Furthermore, the flows recorded at Ati are not fully representative of the total flux feeding the lake, since a multitude of barely quantifiable streams reach the lake downstream of the gauging station, contributing to the larger calculated flows. The calculated outflow Q is between 14 and 36 m3 s−1. Since the lake is endorheic, this flux must be feeding the surrounding Quaternary aquifer. This infiltration allows for its chemical regulation (i.e., maintenance of low salinity), as it is the case for Lake Chad (Carmouze, 1969; Bouchez et al., 2016). However, as we pointed out above, the isotopic composition of the lake water does not plot exactly on the LEL defined by the groundwater samples (Fig. 4), suggesting that the surface water is in some way disconnected from the aquifers in this case. This question is briefly referred to below when considering the basin-scale budget, but requires a more extended study including radioactive tracers.
6.1.3 Evaluation of uncertainties
In order to evaluate the sensitivity of our conclusions to the choice of values of the three principal parameters used in Eq. (4) (h, δI and δa), below we discuss separately the influence of each of them on the results. An illustration of this discussion is given in Fig. 8, where δL−closed and E∕I are plotted against δI for various values of δa and h (grey polygon).

Figure 8Final δ18O uncertainties in δL−closed and E∕I calculated by taking ±1σ for δa and δI. The green dot represents the E∕I and δL−closed average value, and the green polygon is the associated uncertainty. δa is the mean annual value (Jasechko et al., 2013) weighted by evaporation flux (DREM data) and δI is the Chari–Logone rivers' mean annual value weighted by flow rate (Bouchez et al., 2016). The red point represents the δL−closed and E∕I values for δI taken at the intersection between Iro Lake's LEL and the GMWL. The grey polygon represents the E∕I uncertainties by taking h±5 %.
h: relative humidity
The relative humidity is relatively constant at Lake Ihotry (75 %–81 %, Vallet-Coulomb et al., 2006b), but shows a large range of seasonal variation at lakes Iro and Fitri (25 %–77 % and 16 %–75 %, respectively). Average values weighted by the regional evaporation fluxes can be calculated from SIEREM data (Boyer et al., 2006), as well as their standard deviation ( %, 1σ, for Iro Lake and %, 1σ, for Lake Fitri over 10 years), and the corresponding uncertainty is reported as dotted lines in Fig. 8.
δa: isotopic composition of the atmospheric moisture
The isotopic composition of the atmospheric moisture is the least constrained parameter because of the scarcity of measurements, leading to a poor understanding of its variations. Tremoy et al. (2012) published the only continuous time series available in the Sahel strip, carried out by laser spectrometry in Niamey (Niger). The results show a large variation during the seasonal cycle (−15 ‰ < δ18OV ‰) with two minima periods: one from August to September during the rainy season and the other in January during the coldest month. The maximum occurs in May, at the end of the dry season. These variations are interpreted in terms of regional climatology, as a function of seasonal displacement of continental air masses, and of the increase in convective activity during summer. In addition to these synoptic effects, atmospheric vapor may also contain a significant fraction of local recycling from lake evaporation (Gat et al., 1994). For Lake Ihotry, Vallet-Coulomb et al. (2008) showed that the lake isotopic balance implies that the isotopic composition of the atmospheric vapor varied between −13.8 ‰ and −7.8 ‰ for δ18O during the annual cycle. For Lake Ihotry and Niamey, the values of δa calculated by assuming equilibrium between precipitation and atmospheric vapor are close to the seasonal minimum value. For Lake Ihotry, we used the average of the model δa values, weighted by the evaporative fluxes (Vallet-Coulomb et al., 2006b) ( ‰ and ‰ in δ18O and δ2H), and for lakes Iro and Fitri, the average of the data from (Tremoy et al., 2012), again weighted by the regional evaporative fluxes ( ‰ and ‰). The use of the data of Niamey for these two lakes was previously used on Lake Chad by Bouchez et al. (2016) and is justified by the strong correlation between the δ18O measurements in Niamey and the LMDZ-iso model outputs for the Sahel strip (Tremoy et al., 2012). The resulting range of uncertainty is illustrated in Fig. 8 in the case of Iro Lake and listed in Table 1 for lakes Ihotry and Fitri.
δI: isotopic composition of influx
The assumption of δI≈δP is questionable for large catchments where the isotopic composition of the rivers may be more or less marked by evaporation. In the case of lakes Iro and Fitri, in the absence of isotopic data for their main river inflows, we chose the most depleted groundwater value, close to the intersection between the GMWL and the LEL, as our first-guess estimate for δI. This constitutes a minimum value and thus gives a maximum result for E∕I (Table 1). However, recent studies of the Chari–Logone rivers have shown that the weighted annual average composition of the river is distinctly enriched by ca. 2 ‰ compared with the intercept between the LEL and the local meteoric water line (Mahamat Nour et al., 2017). Assuming a similar shift for the Bahr Salamat and Batha rivers, and again estimating the uncertainty from the averages weighted by the river fluxes, we obtain lower E∕I values of 0.65±0.3 for Iro Lake and 0.41±0.2 for Lake Fitri (Fig. 8, Table 1). These values constitute our preferred estimate, until further characterization of these rivers.
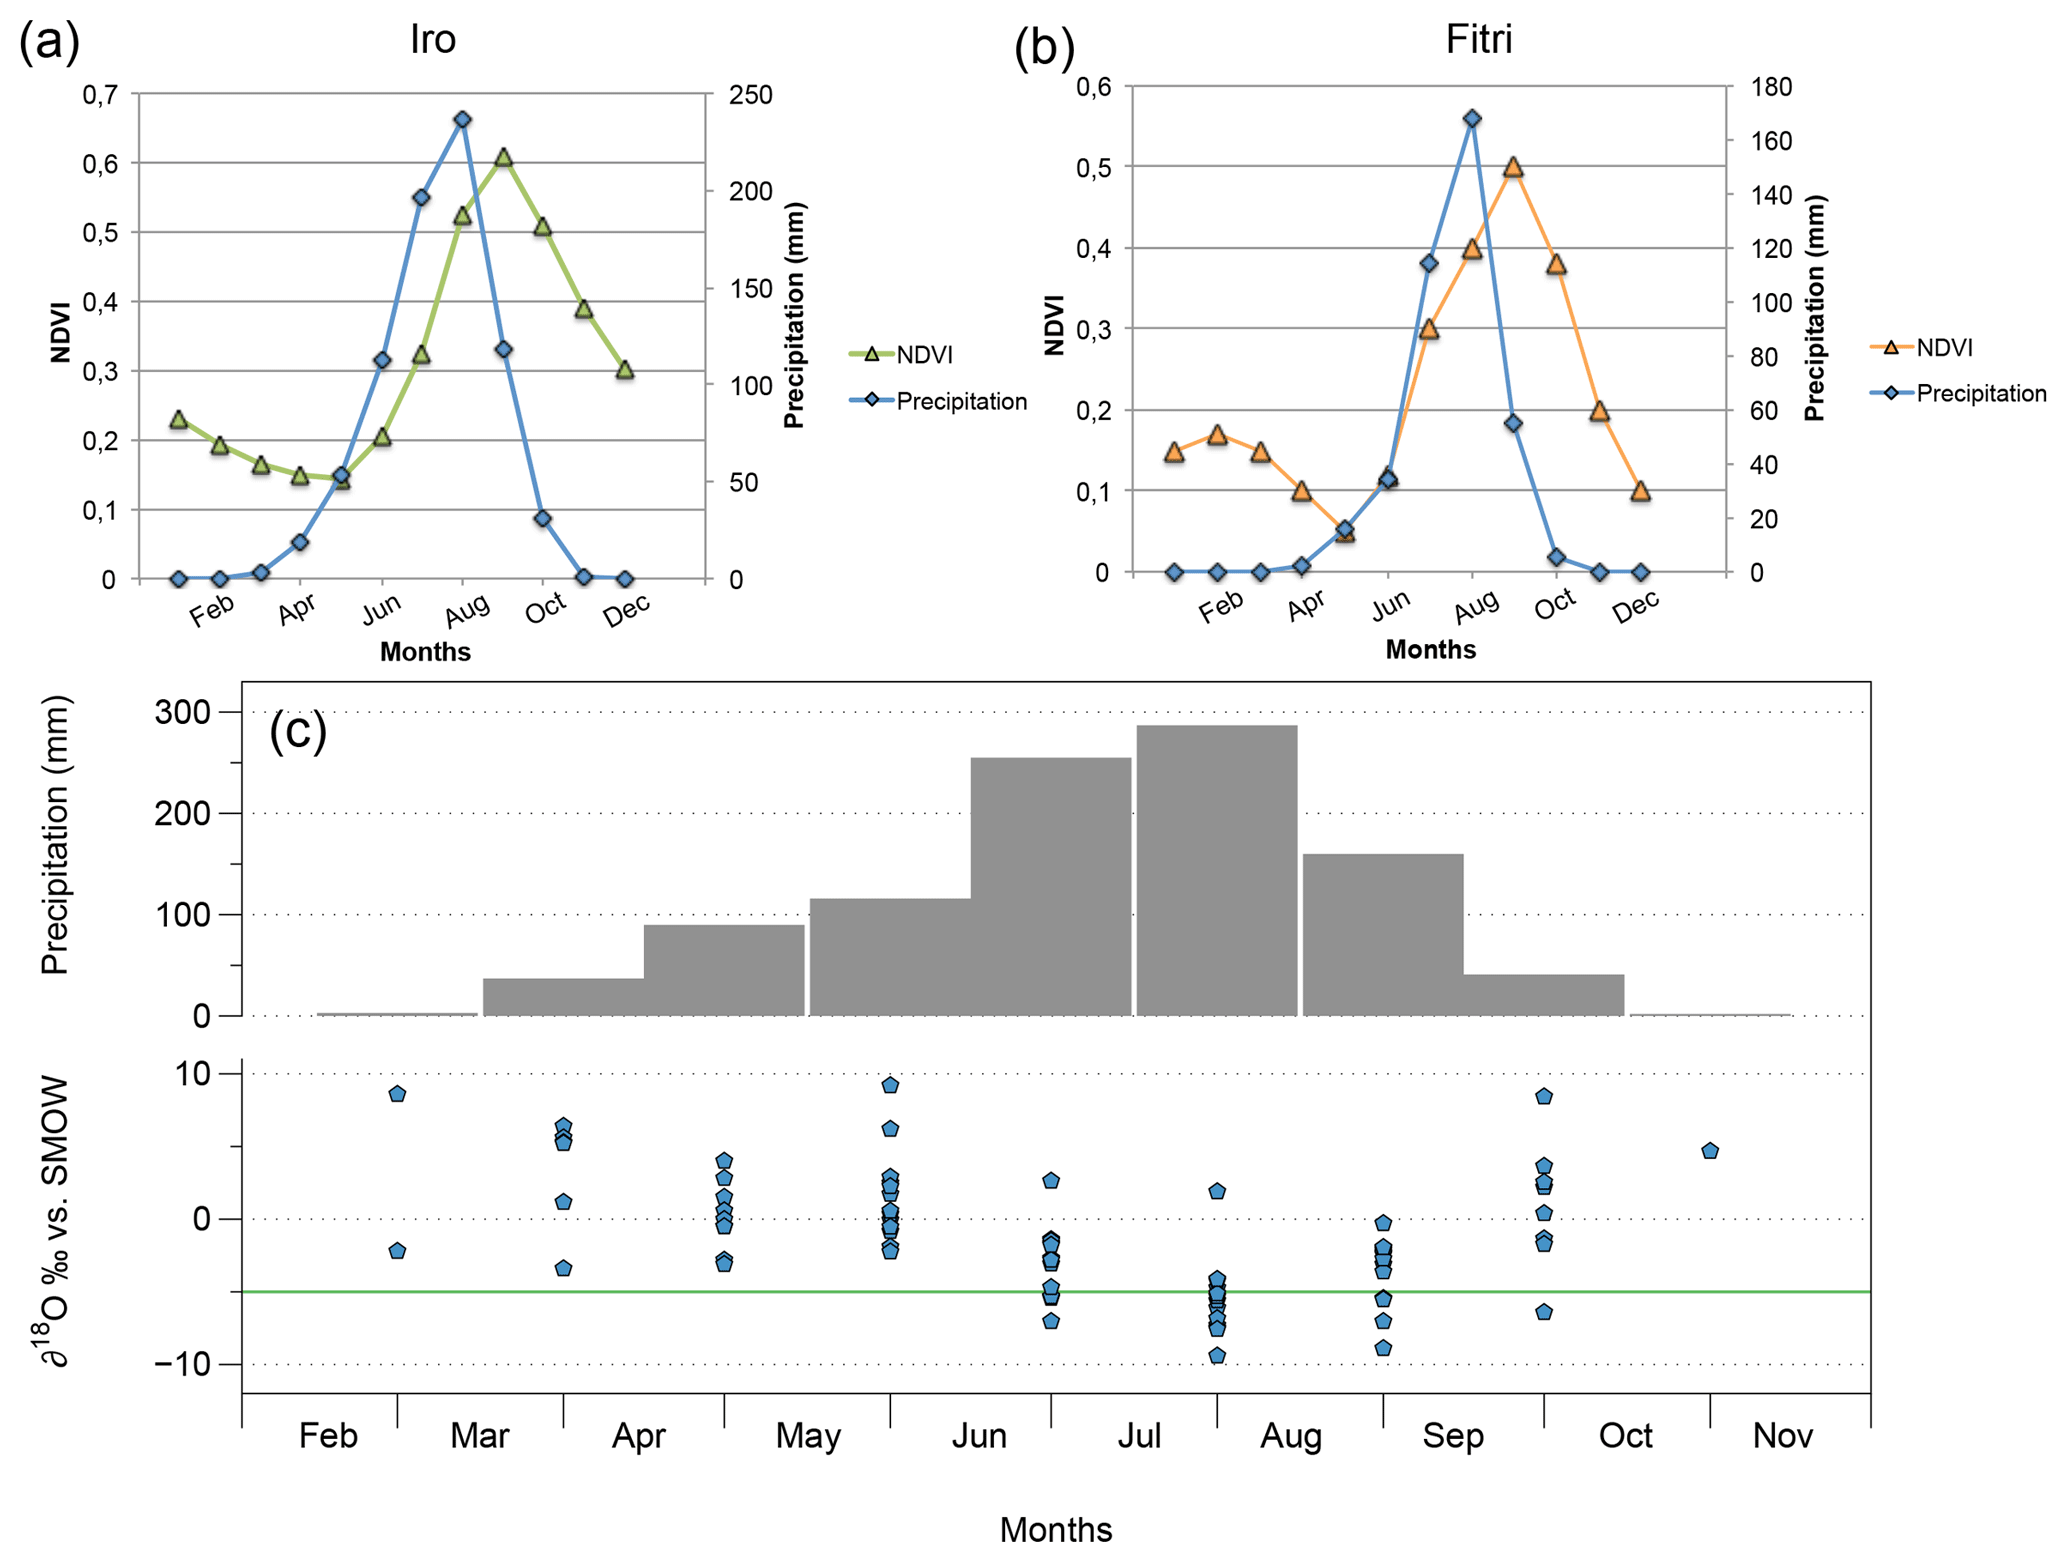
Figure 9(a) and (b) represent the monthly average precipitation (blue) over a year at the Am Timan and Ati station for Iro Lake and Lake Fitri, respectively. Green and orange symbols represent the NDVI (normalized difference vegetation index) evolution over a year. For both catchments, a 1-month delay between the maximum precipitation and the maximum NDVI is observed. (c) The grey bars represent the monthly average precipitation. The blue dots represent the precipitation isotopic signature evolution (δ18O) month by month and the green line is δI (taken at the intersection between GMWL and LEL). The maximum of precipitation corresponds to a depleted isotopic signature (Dansgaard effect).
6.2 Water balance at the catchment scale
We underlined the existence of three different LELs, close to but distinct from each other for the three watersheds of lakes Chad, Iro and Fitri, which thus constitute independent entities (Fig. 4). The parallel slopes of those lines in δ2H versus δ18O are readily explained by a similar set of values of the different parameters of the Craig and Gordon model at the watershed scale. On the other hand, interpreting the different intercepts for the three evaporation lines is more speculative.
The first assumption we make is to assign a specific rainfall isotopic composition to each catchment, corresponding to the intercept of the LEL with the GMWL. This implies that small climatic differences exist between the catchments and that they remain stable over the catchment on timescales comparable to the water residence time. Such differences could be attributed to different orographic effects among the catchments and/or to a north–south gradient (Terzer et al., 2013). This interpretation can also be seen as coherent with the difference noted between (i) the weighted average rainfall isotopic composition at N'Djamena between 1962 and 2015 (−3.5 ‰ for δ18O) and (ii) the evaporation lines of lakes Iro and Fitri.
However, an alternative hypothesis can be to ascribe the difference to a different partition between transpiration and evaporation in the different catchments, following the approach outlined by Jasechko et al. (2013). Indeed, in all cases where the rainfall composition varies during the season and the vegetation growth cycle is out of phase with precipitation, different values are obtained between δT and δP. This is indeed the case for the N'Djamena IAEA station data set, as illustrated in Fig. 9. We observe a large variation from −10 ‰ to +10 ‰ for the δ18O of the rain, between the beginning and the end of the rainy season, with the heavy rainfall between July and August being the most depleted due to the “amount effect” (Dansgaard, 1964). The NDVI lags behind rainfall by about a month, and δT and δP are thus significantly different (−1 ‰ versus ‰ in δ18O).
The consequence of this difference between δT and δP is that the composition of the water entering the lake–aquifer system (δI) is different from δP, as observed for lakes Iro and Fitri. In particular, this may explain the apparent disconnection between the lake and the aquifer at Fitri, if the aquifer is preferentially recharged by the heavier summer rains and thus imprinted by their more depleted signature. In principle, the T∕P ratio can be calculated from this difference by using the mass balance budget:
This gives for the watershed of Iro Lake and 0.43 for Lake Fitri. However, this result is clearly strongly model dependent, based on the type of assumption adopted to estimate δT, directly related to the assessment of water depth removal by the vegetation and thus to the residence time within the soil before respiration (Dawson, 1996).
Table 2Values used for the calculation of transpiration according to Eq. (11) for the three lakes studied. Other data from Lake Chad come from (Bouchez et al., 2016), and data from Lake Ihotry are from Vallet-Coulomb et al. (2008).
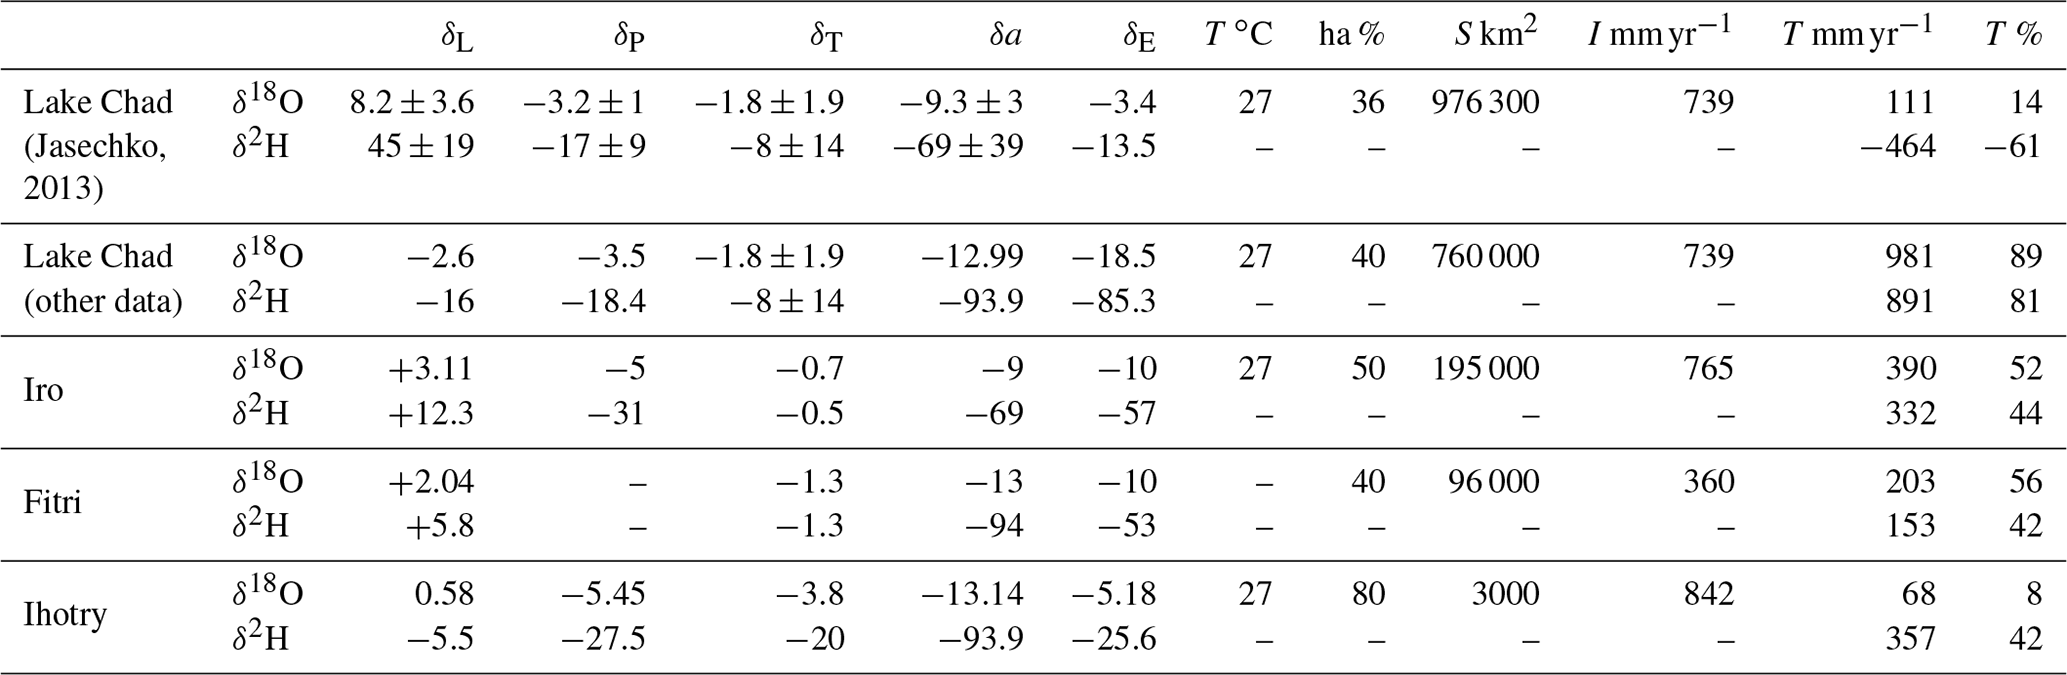
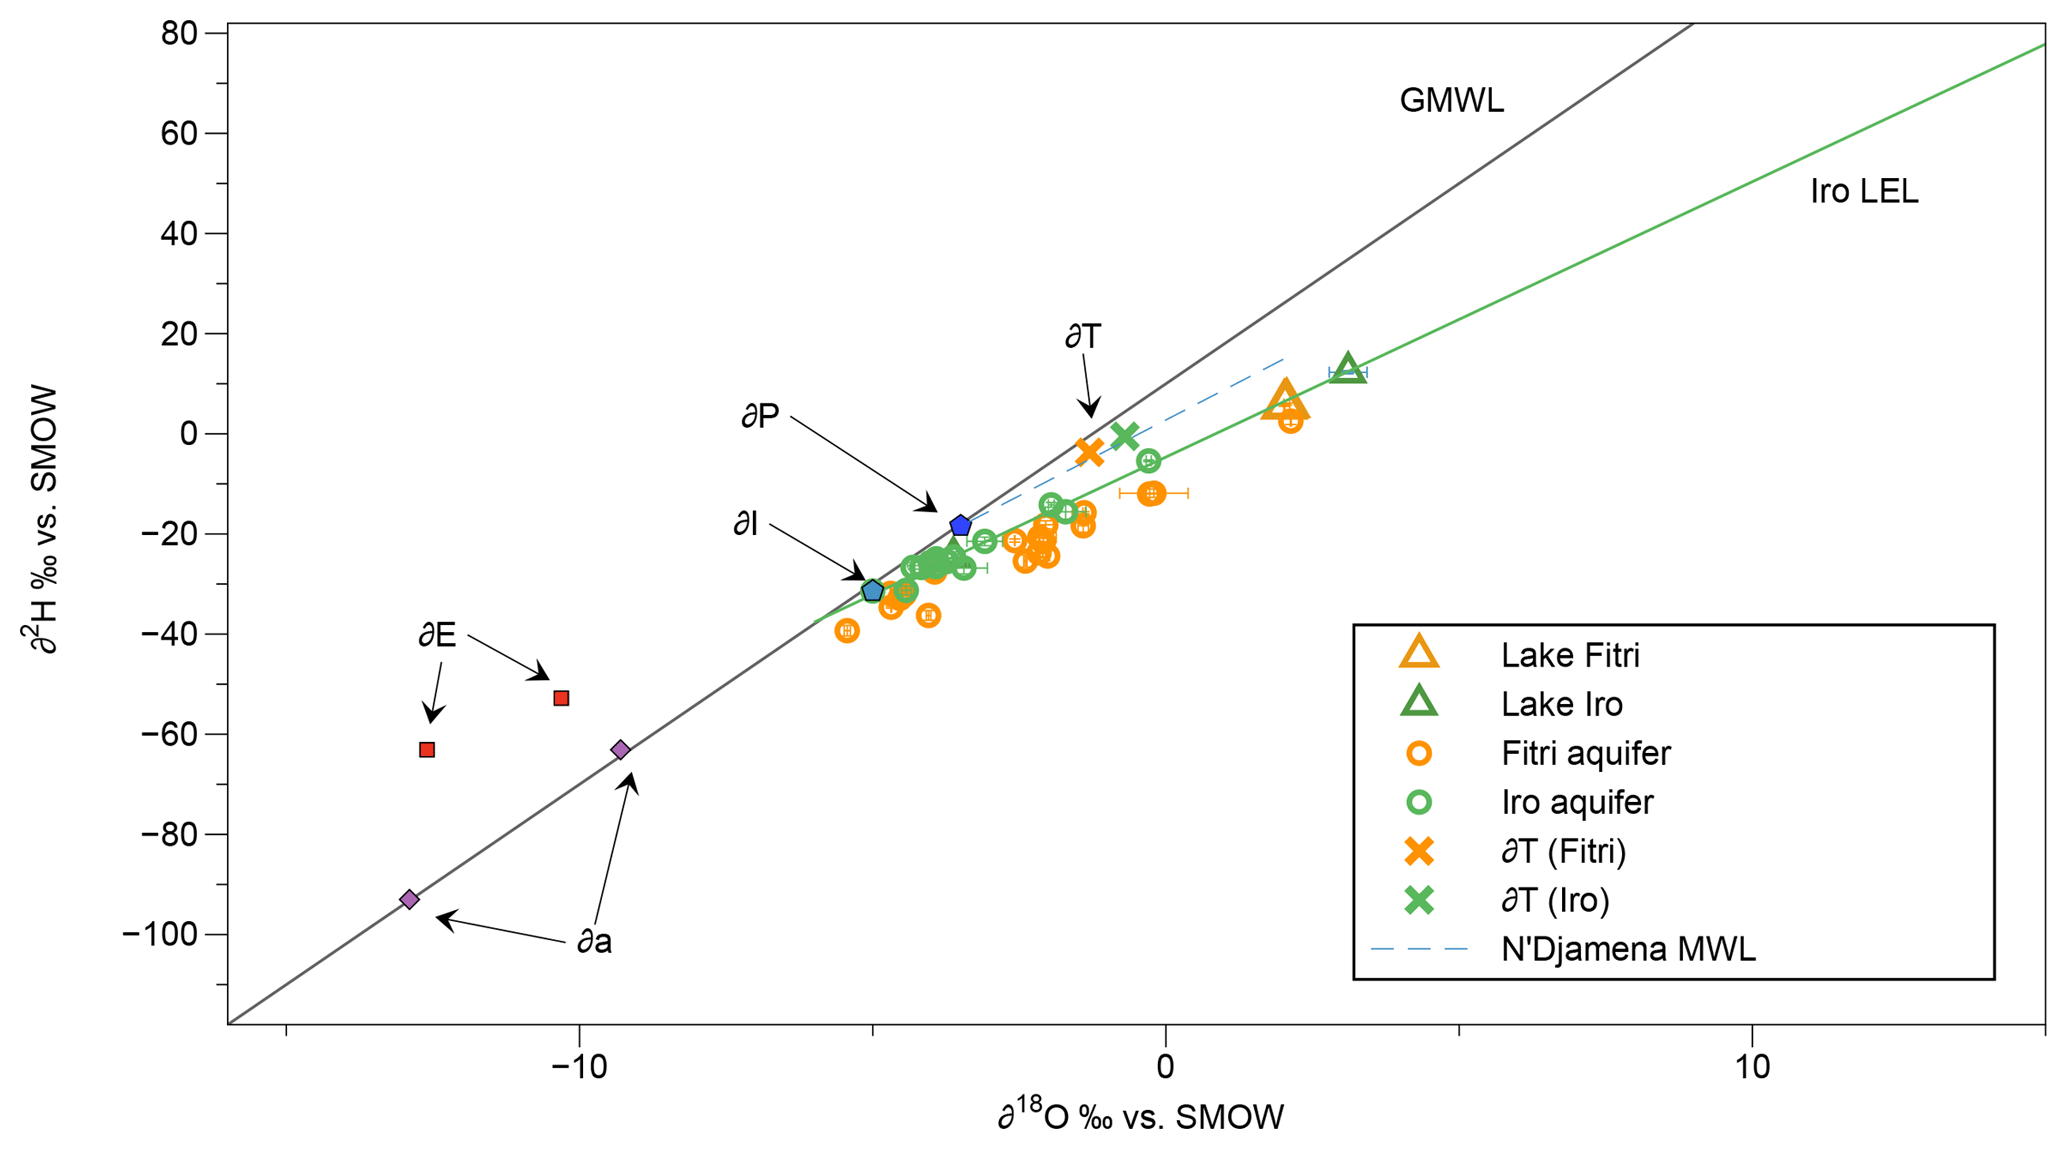
Figure 10Representation of δT values. Green and orange circles represent, respectively, groundwater of Iro Lake and of Lake Fitri, while triangles indicate lake water. δI is the water entering the system for Iro Lake surface water and groundwater and for Lake Fitri surface water only. δP is the weighted annual rainfall at N'Djamena and δT is the transpiration isotopic composition calculated according to Jasechko et al. (2013). δa represents the minimum and the maximum values of atmospheric isotopic composition and δE indicates the minimum and the maximum values of evaporated isotopic composition, calculated according to the Craig–Gordon model.
Alternatively, the approach adopted by Jasechko et al. (2013) was to solve Eq. (11) using values measured at the catchment outlet for Q and at local weather stations for P. The results of this calculation are presented in Table 2 for the three lakes studied here and illustrated in Fig. 10. For the catchment of Iro Lake, we took the measured flow rate of the Bahr Salamat river as a representative value of Q and a flow rate equal to zero for the endorheic catchments of lakes Fitri and Ihotry. The results suggest that transpiration (T) represents half of the water balance of the catchment in every scenario ().
However, a closer examination of the weight of the different terms in Eq. (11) stresses the limitations of this method, as already highlighted by several authors (Schlaepfer et al., 2014; Coenders-Gerrits et al., 2014). First, using the lake isotopic composition as a representative value for the entire surface water of the whole catchment is highly speculative: indeed, it is very unlikely that the balance between evaporation and runoff will be the same between the lake itself and the soil and stream water of the watershed. We can illustrate the strong sensitivity of the calculated T∕P ratio upon the δL value: for example, in the case of Iro Lake, if the mean isotopic composition of the aquifer – rather than that of the lake – is taken as a representative value, the T∕P ratio increases from 0.42 to 0.77. By comparison, the δT value is a much less stringent parameter in this case.
This problem of representativeness is even more clearly illustrated in the case of Lake Fitri. We have shown above that the value of δL, and thus of δE, corresponds to . Therefore, associating this value of δL with a Q value of zero, typical of an endorheic basin, lacks coherence, which shows that the results obtained on the lake cannot be extrapolated to the catchment scale.
Finally, another serious problem appears for the catchment of a closed-system lake, such as Lake Ihotry, for which Eq. (11) becomes
In this case, as discussed above, the water balance implies that δI = δE . We are thus faced once again with a simple mixing equation between P, T and I, the solution of which is totally subordinated to the choice of δT and even becomes totally undetermined in the case of δT = δP.
Our study illustrates the possibility of deriving quantitative constraints on isolated intertropical lakes, in the absence of hydrological monitoring, through the coupling of dry season isotopic data with satellite imagery. We validated the method on Lake Ihotry in Madagascar by confirming the closed-system behavior of this endorheic lake. For lakes Iro and Fitri, two sub-catchments in the Lake Chad basin, we obtained E∕I ratios of 0.6±0.3 and 0.4±0.2 and evaluated a maximum range of uncertainty depending on the choice of parameter values. For both cases, the model inflow rate is on the same order as the scarce gauging measurements reported upstream on the Bahr Salamat river for Iro Lake and on the Batha River for Lake Fitri. In the case of Lake Fitri, there is no identified surface outflow, so the outflow that we calculate necessarily feeds the groundwater reservoir, providing a mechanism that controls the low salinity of the lake, as is the case for Lake Chad (Bouchez et al., 2016). In both cases, these water fluxes represent a small part of the total precipitation on the basin (<1 % and 10 %). These model E∕I ratios and water fluxes are coherent with the freshwater character of these lakes, as is observed for the southern pool of Lake Chad itself, in spite of the high evaporation rate of the Sahel region.
In terms of isotopic composition, the three sub-catchments show distinct local evaporation lines with similar slopes but slightly different intercepts. The mean rainfall composition at N'Djamena for 1962–2015 plots on the line of the Lake Chad data. The data from the lake and from the surrounding groundwater plot on a single line for Iro Lake, while they are slightly offset for Lake Fitri, suggesting some disconnection between surface and aquifer waters in this second case. These differences may be attributable to small climatic variations between the catchments. An alternative explanation could be the partition of the rain between groundwater recharge and river runoff along seasonal variations. This may be the consequence of the isotopic partitioning between evaporation and transpiration fluxes at the scale of the whole watershed. Both assumptions would benefit from regular monitoring of the lakes and the regional precipitation.
Our results on the two Chadian lakes and on Lake Ihotry enable us to test the method proposed by Jasechko et al. (2013) to estimate vegetation transpiration fluxes at the catchment scale. Although broadly compatible with the conclusion that transpiration dominates the water balance of these catchments, the results can only be considered to be semi-quantitative, owing to the large uncertainties resulting from the questionable representativeness of the lakes as to the total surface water of the catchment, especially for endorheic and closed basins such as lakes Fitri and Ihotry. In particular, this method does not permit a detailed comparison between sub-catchments under different climates.
As a whole, this study confirms the great interest of these shallow fresh-water lakes as miniature analogs of Lake Chad itself (with an outflux toward the aquifer in the case of Lake Fitri), making them important targets in the establishment of future large-scale monitoring programs of the hydro-climatic evolution in the Sahel region.
The data are available upon request from the corresponding author.
The evaporation isotopic composition is classically calculated by using the Craig and Gordon model (Craig and Gordon, 1965):
δL is the lake isotopic composition, δa is the atmospheric isotopic composition and h is the relative humidity in %. α is the equilibrium fractionation factor between liquid water and water vapor, which depend on temperature. Some authors proposed closed formulas depending on temperature (Majoube, 1971; Horita and Wesolowski, 1994). ϵ* is the total fractionation coefficient: .
ϵK is the kinetic fractionation: . CK can be calculated as a function of turbulent parameters: , with n=0.5 for an average turbulent flow (Gonfiantini, 1986). CD has been experimentally determined by Merlivat (1978): ‰ and ‰. θ can be equal to 1 for a small water surface, where evaporation fluxes do not disrupt air humidity. It has been demonstrated that θ=0.88 for American northern lakes and θ=0.5 for the Mediterranean Sea (Gat et al., 1994; Gat, 1995, 1996). For this study we chose θ=0.5 as used for Lake Chad and discussed in Bouchez et al. (2016).
The authors declare that they have no conflict of interest.
This work was part of FSP GELT (Fonds de Solidarité Prioritaire “Grands
Ecosystèmes Lacustres Tchadiens”) program funded by the French Ministry
of Foreign Affairs. We thank people from the Iro and Fitri regions as well as
the local authorities of Chad for support and collaboration during fieldwork.
Special thanks to Hassan Mahamat Absakine, Sultan of Fitri and the Chief of
Iro for their hospitality to the GELT teams. Pierre Deschamps and Florence
Sylvestre specifically acknowledge Olivier D'Hont and Françoise Gianviti from the SCAC of
the French Ambassy in Chad as well as the CNRD for making
field trips in Iro and Fitri areas possible. We also thank Christine Raimond, Dankbet Zakinet, Leonor Gonzales, and Kelly Nkouka for their support in the field organization. This
work is a contribution to Labex OT-Med (no. ANR-11-LABX-0061), funded by the
Excellence Initiative of Aix-Marseille Université (A*MIDEX) and
supported by the Equipex ASTER-CEREGE of the French Investissement d'Avenir
program. We thank Tammo Steenhuis and one other anonymous reviewer
for their valuable comments which significantly improved the manuscript.
Edited by: Laurent Pfister
Reviewed
by: Tammo Steenhuis and one anonymous referee
Abderamane, H., Razack, M., and Vassolo, S.: Hydrogeochemical and isotopic characterization of the groundwater in the Chari-Baguirmi depression, Republic of Chad, Environ. Earth Sci., 69, 2337–2350, https://doi.org/10.1007/s12665-012-2063-7, 2013. a
Ali, A. and Lebel, T.: The Sahelian standardized rainfall index revisited, Int. J. Climatol., 29, 1705–1714, https://doi.org/10.1002/joc.1832, 2009. a
Bader, J.-C., Lemoalle, J., and Leblanc, M.: Modèle hydrologique du Lac Tchad, Hydrolog. Sci. J., 56, 411–425, https://doi.org/10.1080/02626667.2011.560853, 2011. a
Biasutti, M., Voigt, A., Boos, W. R., Braconnot, P., Hargreaves, J. C., Harrison, S. P., Kang, S. M., Mapes, B. E., Scheff, J., Schumacher, C., Sobel, A. H., and Xie, S.-P.: Global energetics and local physics as drivers of past, present and future monsoons, Nat. Geosci., 11, 392–400, https://doi.org/10.1038/s41561-018-0137-1, 2018. a
Billon, B., Guiscafre, J., Herbaud, J., and Oberlin, G.: Le bassin du fleuve Chari, Monographies hydrologiques, ORSTOM, 1974. a
Bouchez, C., Goncalves, J., Deschamps, P., Vallet-Coulomb, C., Hamelin, B., Doumnang, J.-C., and Sylvestre, F.: Hydrological, chemical, and isotopic budgets of Lake Chad: a quantitative assessment of evaporation, transpiration and infiltration fluxes, Hydrol. Earth Syst. Sci., 20, 1599–1619, https://doi.org/10.5194/hess-20-1599-2016, 2016. a, b, c, d, e, f, g, h, i
Boyer, J., Dieulin, C., Rouche, N., Cres, A., Servat, E., Paturel, J., and Mahé, G.: SIEREM an environnmental information system for water resources, 5th World FRIEND Conference, La Havana, Cuba, 19–25, 2006. a, b, c
Brock, B. E., Yi, Y., Clogg-Wright, K. P., Edwards, T. W., and Wolfe, B. B.: Multi-year landscape-scale assessment of lakewater balances in the Slave River Delta, NWT, using water isotope tracers, J. Hydrol., 379, 81–91, https://doi.org/10.1016/j.jhydrol.2009.09.046, 2009. a
Carmouze, J.-P.: La salure globale et les salures spécifiques des eaux du lac Tchad, Cah. ORSTOM, 3, 3–14, available at: http://horizon.documentation.ird.fr/exl-doc/pleins_textes/cahiers/hydrobio/18063.pdf (last access: 2 March 2019), 1969. a, b
Christensen, J. H., Kanikicharla, K. K., Marshall, G., and Turner, J.: Climate phenomena and their relevance for future regional climate change, in: Climate Change 2013: The physical science basis. Contribution of Working Group I to the fifth Assessment of the Intergovernmental Panel on Climate Change, edited by: Stocker, T. F., Qin, D., Plattner, G.-K., Tignor, M. M. B., Allen, S. K., Boschung, J., Nauels, A., Xia, Y., Bex, V., and Midgley, P. M., 1217–1308, Cambridge University Press, Cambridge, available at: http://www.climatechange2013.org/images/report/WG1AR5_Chapter14_FINAL.pdf (last access: 2 March 2019), 2013. a
Coenders-Gerrits, A. M. J., van der Ent, R. J., Bogaard, T. A., Wang-Erlandsson, L., Hrachowitz, M., and Savenije, H. H. G.: Uncertainties in transpiration estimates, Nature, 506, E1–E2, https://doi.org/10.1038/nature12925, 2014. a
Collick, A. S., Easton, Z. M., Ashagrie, T., Biruk, B., Tilahun, S., Adgo, E., Awulachew, S. B., Zeleke, G., and Steenhuis, T. S.: A simple semi-distributed water balance model for the Ethiopian highlands, Hydrol. Process., 3718–3727, https://doi.org/10.1002/hyp.7517, 2009. a
Craig, H. and Gordon, L. I.: Stable Isotopes in Oceanographic Studies and Paleotemperatures, edited by: Tongiorgi, E., V. Lischi e Figli, Pisa, 9–130, 1965. a, b
Crétaux, J.-F., Abarca-del Río, R., Bergé-Nguyen, M., Arsen, A., Drolon, V., Clos, G., and Maisongrande, P.: Lake Volume Monitoring from Space, Surv. Geophys., 37, 269–305, https://doi.org/10.1007/s10712-016-9362-6, 2016. a
Cui, J., Tian, L., and Gibson, J. J.: When to conduct an isotopic survey for lake water balance evaluation in highly seasonal climates, Hydrol. Process., 32, 379–387, https://doi.org/10.1002/hyp.11420, 2018. a
Curran, P. J. and Steven, M. D.: Multispectral Remote Sensing for the Estimation of Green Leaf Area Index [and Discussion], Philos. T. R. Soc. S-A., 309, 257–270, 1983. a
Dansgaard, W.: Stable isotopes in precipitation, Tellus, 16, 436–468, https://doi.org/10.3402/tellusa.v16i4.8993, 1964. a, b
Dawson, T. E.: Determining water use by trees and forests from isotopic, energy balance and transpiration analyses: the roles of tree size and hydraulic lift, Tree Physiol., 16, 263–272, 1996. a
Defries, R. S. and Townshend, J. R. G.: NDVI-derived land cover classifications at a global scale, Int. J. Remote Sens., 15, 3567–3586, https://doi.org/10.1080/01431169408954345, 1994. a
Delalande, M., Bergonzini, L., Beal, F., Garcin, Y., Majule, A., and Williamson, D.: Contribution to the detection of Lake Masoko (Tanzania) groundwater outflow: isotopic evidence (18O, D)/Contribution à la détection des pertes souterraines du Lac Masoko (Tanzanie): évidences isotopiques (18O, D), Hydrolog. Sci. J., 50, 880, https://doi.org/10.1623/hysj.2005.50.5.867, 2005. a
Delalande, M., Bergonzini, L., and Massault, M.: Mbaka lakes isotopic (18O and 2H) and water balances: discussion on the used atmospheric moisture compositions, Isot. Environ. Healt. S., 44, 71–82, 2008. a
Descroix, L., Mahé, G., Lebel, T., Favreau, G., Galle, S., Gautier, E., Olivry, J.-C., Albergel, J., Amogu, O., Cappelaere, B., Dessouassi, R., Diedhiou, A., Le Breton, E., Mamadou, I., and Sighomnou, D.: Spatio-temporal variability of hydrological regimes around the boundaries between Sahelian and Sudanian areas of West Africa: A synthesis, J. Hydrol., 375, 90–102, https://doi.org/10.1016/j.jhydrol.2008.12.012, 2009. a
Dinçer, T.: The Use of Oxygen 18 and Deuterium Concentrations in the Water Balance of Lakes, Water Resour. Res., 4, 1289–1306, https://doi.org/10.1029/WR004i006p01289, 1968. a
Druyan, L. M.: Studies of 21st-century precipitation trends over West Africa, Int. J. Climatol., 31, 1415–1424, https://doi.org/10.1002/joc.2180, 2011. a
Fontes, J. C., Gonfiantini, R., and Roche, M.-A.: Deutérium et oxygène-18 dans les eaux du lac Tchad, in: Isotope Hydrology 1970, edited by: IAEA, V., 387–404, available at: http://www.documentation.ird.fr/hor/fdi:04791(last access: 2 March 2019), 1970. a, b, c, d
Friedman, I., Redfield, A. C., Schoen, B., and Harris, J.: The variation of the deuterium content of natural waters in the hydrologic cycle, Rev. Geophys., 2, 177–224, https://doi.org/10.1029/RG002i001p00177, 1964. a
Gal, L., Grippa, M., Hiernaux, P., Peugeot, C., Mougin, E., and Kergoat, L.: Changes in lakes water volume and runoff over ungauged Sahelian watersheds, J. Hydrol., 540, 1176–1188, https://doi.org/10.1016/j.jhydrol.2016.07.035, 2016. a
Gardelle, J., Hiernaux, P., Kergoat, L., and Grippa, M.: Less rain, more water in ponds: a remote sensing study of the dynamics of surface waters from 1950 to present in pastoral Sahel (Gourma region, Mali), Hydrol. Earth Syst. Sci., 14, 309–324, https://doi.org/10.5194/hess-14-309-2010, 2010. a
Garvin, J. B.: Possible impact structures in Central Africa, Lunar and Planetary Science Conference, 17, 249–250, 1986. a
Gat, J.: Oxygen and Hydrogen Isotopes in the Hydrologic Cycle, Annu. Rev. Earth Pl. Sc., 24, 225–262, https://doi.org/10.1146/annurev.earth.24.1.225, 1996. a, b, c
Gat, J., Bowser, C. J., and Kendall, C.: The contribution of evaporation from the Great Lakes to the continental atmosphere: estimate based on stable isotope data, Geophys. Res. Lett., 21, 557–560, https://doi.org/10.1029/94GL00069, 1994. a, b
Gat, J. R.: Stable isotopes of fresh and saline lakes, in: Physics and chemistry of lakes, edited by: Lerman, A., Imboden, D., and Gat, J., 139–165, Springer, 1995. a
Gat, J. R. and Airey, P. L.: Stable water isotopes in the atmosphere/biosphere/lithosphere interface: Scaling-up from the local to continental scale, under humid and dry conditions, Global Planet. Change, 51, 25–33, https://doi.org/10.1016/j.gloplacha.2005.12.004, 2006. a
Gat, J. R. and Gonfiantini, R. (Eds.): Stable isotope hydrology, No. 210, Technical reports series/International Atomic Energy Agency, Internat, Atomic Energy Agency, Vienna, 1981. a
Gaye, C. B. and Edmunds, W. M.: Groundwater recharge estimation using chloride, stable isotopes and tritium profiles in the sands of northwestern Senegal, Environ. Geol., 27, 246–251, https://doi.org/10.1007/BF00770438, 1996. a
Gibson, J. J., Edwards, T. W. D., Bursey, G. G., and Prowse, T. D.: Estimating Evaporation Using Stable Isotopes: Quantitative Results and Sensitivity Analysis for Two Catchments in Northern Canada, Hydrol. Res., 24, 79–94, 1993. a
Gibson, J. J., Prepas, E. E., and McEachern, P.: Quantitative comparison of lake throughflow, residency, and catchment runoff using stable isotopes: modelling and results from a regional survey of Boreal lakes, J. Hydrol., 262, 128–144, https://doi.org/10.1016/S0022-1694(02)00022-7, 2002. a, b, c
Gibson, J. J., Birks, S. J., and Edwards, T. W. D.: Global prediction of δA and δ2H-δ18O evaporation slopes for lakes and soil water accounting for seasonality, Global Biogeochem. Cy., 22, GB2031, https://doi.org/10.1029/2007GB002997, 2008. a, b
Gibson, J. J., Birks, S. J., Jeffries, D., and Yi, Y.: Regional trends in evaporation loss and water yield based on stable isotope mass balance of lakes: The Ontario Precambrian Shield surveys, J. Hydrol., 544, 500–510, https://doi.org/10.1016/j.jhydrol.2016.11.016, 2017. a
Gillet, H.: La végétation du parc national de Zakouma (Tchad) et ses rapports avec les grands mammifères, La Terre et la vie, available at: http://documents.irevues.inist.fr/handle/2042/58954 (last access: 2 March 2019), 1969. a, b
Gonçalvès, J., Vallet-Coulomb, C., Petersen, J., Hamelin, B., and Deschamps, P.: Declining water budget in a deep regional aquifer assessed by geostatistical simulations of stable isotopes: Case study of the Saharan “Continental Intercalaire”, J. Hydrol., 531, 821–829, https://doi.org/10.1016/j.jhydrol.2015.10.044, 2015. a
Gonfiantini, R.: Environmental isotopes in lake studies, in: Handbook of Environmental Isotope Geochemistry, edited by: Fritz, P. and Fontes, J.-C., B. Elsevier, Amsterdam, vol. 2, The Terrestrial Environment, 113–168, 1986. a
Grillot, J.-C. and Arthaud, F.: Extension neotectonics and karst morphologies in an intertropical zone: Madagascar, Geodin. Acta, 4, 121–131, https://doi.org/10.1080/09853111.1990.11105204, 1990. a
Horita, J. and Wesolowski, D. J.: Liquid-vapor fractionation of oxygen and hydrogen isotopes of water from the freezing to the critical temperature, Geochim. Cosmochim. Ac., 58, 3425–3437, 1994. a
IAEA: Reference Sheet for VSMOW2 and SLAP2 international measurement standards, available at: https://nucleus.iaea.org/rpst/Documents/VSMOW2_SLAP2.pdf (last access: 2 March 2019), 2009. a
Jasechko, S., Sharp, Z. D., Gibson, J. J., Birks, S. J., Yi, Y., and Fawcett, P. J.: Terrestrial water fluxes dominated by transpiration, Nature, 496, 347–350, https://doi.org/10.1038/nature11983, 2013. a, b, c, d, e, f, g, h, i
Krabbenhoft, D. P., Bowser, C. J., Anderson, M. P., and Valley, J. W.: Estimating groundwater exchange with lakes: 1. The stable isotope mass balance method, Water Resour. Res., 26, 2445–2453, https://doi.org/10.1029/WR026i010p02445, 1990. a, b
Lamontagne, S., Leaney, F. W., and Herczeg, A. L.: Groundwater-surface water interactions in a large semi-arid floodplain: implications for salinity management, Hydrol. Process., 19, 3063–3080, https://doi.org/10.1002/hyp.5832, 2005. a
Lebel, T. and Ali, A.: Recent trends in the Central and Western Sahel rainfall regime (1990–2007), J. Hydrol., 375, 52–64, https://doi.org/10.1016/j.jhydrol.2008.11.030, 2009. a
Leblanc, M., Favreau, G., Tweed, S., Leduc, C., Razack, M., and Mofor, L.: Remote sensing for groundwater modelling in large semiarid areas: Lake Chad Basin, Africa, Hydrogeol. J., 15, 97–100, https://doi.org/10.1007/s10040-006-0126-0, 2007. a
Leblanc, M. J., Favreau, G., Massuel, S., Tweed, S. O., Loireau, M., and Cappelaere, B.: Land clearance and hydrological change in the Sahel: SW Niger, Global Planet. Change, 61, 135–150, https://doi.org/10.1016/j.gloplacha.2007.08.011, 2008. a
Lemoalle, J.: Lac Fitri, in: African wetlands and shallow water bodies: region 4: Chad basin = Zones humides et lacs peu profonds d'Afrique: région 4: Bassin tchadien, edited by: Burgis, M., Symoens, J., and Lévêque, C., no. 211 in Travaux et Documents de l'ORSTOM, 275–277, ORSTOM, Paris, available at: http://www.documentation.ird.fr/hor/fdi:25352 (last access: 2 March 2019), 1987. a
Lemoalle, J., Bader, J.-C., Leblanc, M., and Sedick, A.: Recent changes in Lake Chad: Observations, simulations and management options (1973–2011), Global Planet. Change, 80–81, 247–254, https://doi.org/10.1016/j.gloplacha.2011.07.004, 2012. a
Liebe, J., Van de Giesen, N., and Andreini, M.: Estimation of small reservoir storage capacities in a semi-arid environment, Phys. Chem. Earth A, B, C, 30, 448–454, https://doi.org/10.1016/j.pce.2005.06.011, 2005. a
Mahamat Nour, A., Deschamps, P., Vallet-Coulomb, C., Poulin, C., Bouchez, C., Hamelin, B., Ginot, P., and Sylvestre, F.: Chemical and Isotopic Characterisation of the Chari and Logone Rivers, Lake Chad Basin: A Comparison between the 1970's and 2010's Fluxes, Goldschmidt conference, 2017. a, b
Majoube, M.: Fractionnement en oxygene-18 et en deuterium entre l'eau et sa vapeur, J. Chim. Phys, 68, 1423–1436, 1971. a
Mayr, C., Lücke, A., Stichler, W., Trimborn, P., Ercolano, B., Oliva, G., Ohlendorf, C., Soto, J., Fey, M., Haberzettl, T., Janssen, S., Schäbitz, F., Schleser, G. H., Wille, M., and Zolitschka, B.: Precipitation origin and evaporation of lakes in semi-arid Patagonia (Argentina) inferred from stable isotopes (18O, 2H), J. Hydrol., 334, 53–63, https://doi.org/10.1016/j.jhydrol.2006.09.025, 2007. a, b
Merlivat, L.: Molecular diffusivities of , HD16O, and in gases, J. Chem. Phys., 69, 2864–2871, https://doi.org/10.1063/1.436884, 1978. a
Nicholson, S.: On the question of the “recovery” of the rains in the West African Sahel, J. Arid Environ., 63, 615–641, https://doi.org/10.1016/j.jaridenv.2005.03.004, 2005. a
Nicholson, S. E.: The West African Sahel: A Review of Recent Studies on the Rainfall Regime and Its Interannual Variability, ISRN Meteorology, 2013, 1–32, https://doi.org/10.1155/2013/453521, 2013. a
Olivry, J., Chouret, A., Vuillaume, G., Lemoalle, J., and Bricquet, J.: Hydrologie du lac Tchad, ORSTOM Editions, Paris, 1996. a
Rodrigues, L. N., Sano, E. E., Steenhuis, T. S., and Passo, D. P.: Estimation of Small Reservoir Storage Capacities with Remote Sensing in the Brazilian Savannah Region, Water Resour. Manag., 26, 873–882, https://doi.org/10.1007/s11269-011-9941-8, 2012. a
Sacks, L. A., Lee, T. M., and Swancar, A.: The suitability of a simplified isotope-balance approach to quantify transient groundwater–lake interactions over a decade with climatic extremes, J. Hydrol., 519, 3042–3053, https://doi.org/10.1016/j.jhydrol.2013.12.012, 2014. a
Salamalikis, V., Argiriou, A. A., and Dotsika, E.: Stable isotopic composition of atmospheric water vapor in Patras, Greece: A concentration weighted trajectory approach, Atmos. Res., 152, 93–104, https://doi.org/10.1016/j.atmosres.2014.02.021, 2015. a
Schlaepfer, D. R., Ewers, B. E., Shuman, B. N., Williams, D. G., Frank, J. M., Massman, W. J., and Lauenroth, W. K.: Terrestrial water fluxes dominated by transpiration: Comment, Ecosphere, 5, 61, https://doi.org/10.1890/ES13-00391.1, 2014. a
Schneider, J. L.: Géologie, Archéologie, Hydrogéologie (de la République du Tchad), Jean Louis Schneider, 2, 2004. a
Sivapalan, M., Takeuchi, K., Franks, S. W., Gupta, V. K., Karambiri, H., Lakshmi, V., Liang, X., McDonnel, J. J., Mendiondo, E. M., O'Connell, P. E., Oki, T., Pomeroy, J. W., Schertzer, D., Uhlenbrook, S., and Zehe, E.: IAHS Decade on Predictions in Ungauged Basins (PUB), 2003–2012: Shaping an exciting future for the hydrological sciences, Hydrolog. Sci. J., 48, 857–880, https://doi.org/10.1623/hysj.48.6.857.51421, 2003. a
Steenhuis, T. S. and Van der Molen, W. H.: The Thornthwaite-Mather procedure as a simple engineering method to predict recharge, J. Hydrol., 84, 221–229, 1986. a
Terzer, S., Wassenaar, L. I., Araguás-Araguás, L. J., and Aggarwal, P. K.: Global isoscapes for δ18O and δ2H in precipitation: improved prediction using regionalized climatic regression models, Hydrol. Earth Syst. Sci., 17, 4713–4728, https://doi.org/10.5194/hess-17-4713-2013, 2013. a
Tremoy, G., Vimeux, F., Mayaki, S., Souley, I., Cattani, O., Risi, C., Favreau, G., and Oi, M.: A 1-year long δ18O record of water vapor in Niamey (Niger) reveals insightful atmospheric processes at different timescales, Geophys. Res. Lett., 39, L08805, https://doi.org/10.1029/2012GL051298, 2012. a, b, c, d
UNEP and ICRAF: Climate change and variability in the Sahel region: impacts and adaptation strategies in the agricultural sector, UNEP and ICRAF, Nairobi, Kenya, 2006. a
Vallet-Coulomb, C., Gasse, F., Robison, L., and Ferry, L.: Simulation of the water and isotopic balance of a closed tropical lake at a daily time step (Lake Ihotry, South-West of Madagascar), J. Geochem. Explor., 88, 153–156, https://doi.org/10.1016/j.gexplo.2005.08.103, 2006a. a, b
Vallet-Coulomb, C., Gasse, F., Robison, L., Van Campo, E., Chalié, F., and Ferry, L.: Hydrological modeling of tropical closed Lake Ihotry (SW Madagascar): Sensitivity analysis and implications for paleohydrological reconstructions over the past 4000 years, J. Hydrol., 331, 257–271, https://doi.org/10.1016/j.jhydrol.2006.05.026, 2006b. a, b, c, d, e, f
Vallet-Coulomb, C., Gasse, F., and Sonzogni, C.: Seasonal evolution of the isotopic composition of atmospheric water vapour above a tropical lake: Deuterium excess and implication for water recycling, Geochim. Cosmochim. Ac., 72, 4661–4674, https://doi.org/10.1016/j.gca.2008.06.025, 2008. a, b, c, d, e, f
Weyhenmeyer, C. E., Burns, S. J., Waber, H. N., Aeschbach-Hertig, W., Kipfer, R., Loosli, H. H., and Matter, A.: Cool glacial temperatures and changes in moisture source recorded in Oman groundwaters, Science, 287, 842–845, 2000. a
Wohl, E., Barros, A., Brunsell, N., Chappell, N. A., Coe, M., Giambelluca, T., Goldsmith, S., Harmon, R., Hendrickx, J. M. H., Juvik, J., McDonnell, J., and Ogden, F.: The hydrology of the humid tropics, Nat. Clim. Change, 2, 655–662, https://doi.org/10.1038/nclimate1556, 2012. a
Yi, Y., Brock, B. E., Falcone, M. D., Wolfe, B. B., and Edwards, T. W.: A coupled isotope tracer method to characterize input water to lakes, J. Hydrol., 350, 1–13, https://doi.org/10.1016/j.jhydrol.2007.11.008, 2008. a
Zuber, A.: On the environmental isotope method for determining the water balance components of some lakes, J. Hydrol., 61, 409–427, https://doi.org/10.1016/0022-1694(83)90004-5, 1983. a