the Creative Commons Attribution 4.0 License.
the Creative Commons Attribution 4.0 License.
 | 25 Oct 2018
HESS Opinions: How should a future water census address consumptive use? (And where can we substitute withdrawal data while we wait?)
Benjamin L. Ruddell
Despite the centrality of the water balance equation to hydrology and water resources, in 2018 we still lack adequate empirical observations of consumptive use of water by humans and their economy. It is therefore worth considering what we can do with the withdrawal-based water use data we already possess, and what future water census measurements would be required to more accurately quantify consumptive use for the most common mesoscale use cases. The limitations of the currently applied simple net consumptive use (SNCU) assumptions are discussed for several common use cases. Fortunately, several applied water management, economics, and policy questions can be sufficiently addressed using currently available withdrawal numbers in place of water consumption numbers. This discussion clarifies the broad requirements for an improved “stock and flow” census-scale data model for consumptive water use. While we are waiting for the eventual arrival of a more sophisticated water census, the withdrawal data we already possess are sufficient for some of our most important scientific and applied purposes.
- Article
(141 KB) - Full-text XML
- BibTeX
- EndNote


The “water balance”, or the volumetric conservation equation for water, lies at the heart of methods employed in the science of hydrology and the applications of water resource engineering. “Point”-scale flows of water in this equation may be expressed in either gross or net quantities, although there is a critical difference between the gross and net. All flows are gross in reality, and the net term is a theoretical abstraction which aggregates and combines multiple flows. The USGS National Water Census defines consumptive use as “The part of water withdrawn that is evaporated, transpired, (embedded) into products … consumed by humans or livestock, or otherwise removed from the immediate water environment.” (Maupin et al., 2014). Classical hydrologists define consumptive use of water using a control volume approach such that consumption is the net of gross withdrawal and gross return flow. The USGS definition implies in practice a relatively fine spatiotemporal boundary on the control volume. The two definitions may coincide, depending on the details. Whereas the classical hydrologist or water engineer can afford the luxury of fine-tuning the control volume and set of observations to fit the specific problem at hand, a water census must make hard choices about feasibility, cost, scale, and standardization of the census's water balance data model.
The US water census estimates annual water use by economic sector at an aggregated county scale, with data reported once every 5 years. The last national censuses of consumptive water use in the USA were in 1982 (Commerce, 1986) and in 1995 (Solley et al., 1998). The 1982 study covered manufacturing sector water withdrawal and discharge statistics for each state, region, and industry group but not the more important agricultural, energy, and urban sectors. The 1995 study covered consumptive use by all major sectors, domestic/commercial, industrial/mining, thermoelectric, and irrigation/livestock, and attempted to evaluate five types of in-channel and out-of-channel flows: withdrawal, delivery/release, conveyance loss, consumptive use, and return flow. However, the validity and precision of the consumptive use data available for the 1995 water census is questionable due to a lack of primary observations of return flows (Ward and Pulido-Velazquez, 2008; Qureshi et al., 2010; Gates et al., 2012), and those methods were dropped from newer studies. A single study of the Great Lakes region by the USGS established seasonal patterns of withdrawal and consumption of water in the spatially aggregated region, but found a very wide range of uncertainty for these data (Shaffer and Runkle, 2007). The forthcoming 2015 water use census employs improved methods of estimating and modeling consumptive use in the important thermoelectric and irrigated agricultural sectors (Diehl and Harris, 2014; Senay et al., 2016), but other sectors are still not addressed due to a lack of adequate primary data or methods for their estimation. It is generally believed that methods for thermoelectric power water use estimation are of higher quality than for other sectors, due to (a) the high quality of withdrawal data reporting to the Energy Information Administration, (b) discharge reporting and water temperature regulation by the Environmental Protection Agency, (c) the relatively “simple” nature of thermoelectric withdrawals, and (d) the relative precision with which thermoelectric power processes can be modeled by engineers (Averyt et al., 2008; Macknick et al., 2012). However, logical exceptions exist, even for the best-in-class thermoelectric power water census data model, such as the Palo Verde nuclear power plant in Arizona, which is cooled entirely by reclaimed wastewater from the Phoenix metropolitan area.
A recent US national water footprint study concluded that the precision of our existing census-style consumptive use coefficient data is so poor that it leaves us with little information on how human water withdrawals affect hydrological water balances on a national scale (Rushforth and Ruddell, 2018) – although such studies have been attempted (Averyt et al., 2013). Historical consumptive water use snapshots are inadequate because of severe limits on data quality and availability in most economic sectors and US regions. Most of these data are badly outdated because technological change in efficiency, process, and treatment beginning around 1980 has dramatically altered water use intensity. The US Clean Water Act's wastewater treatment regulations and costs have driven improvements in economic water use efficiencies. Some US states have better data, but most states barely meet the county-level water withdrawal reporting standards of the 5-year USGS national water use census (Maupin et al., 2014), and many US states systematically neglect reporting of groundwater use and return flows, especially by irrigated agriculture.
Classical hydrologists and water resource engineers tend to work at fine spatiotemporal scales and on problems that require highly precise but localized water balance data – for instance, when designing or operating a large dam. By contrast, water census data are more commonly employed by economists, policymakers, sociologists, industrial engineers, and researchers of broader coupled natural–human systems problems (CNH; Liu et al., 2007) at mesoscales and regional sociopolitical boundaries where these coupled systems most richly interact (Lant et al., 2018). The latter cohort currently faces a stark mid-term reality: the near-total lack of observations of consumptive water use by humans and their economy. Fortunately for the latter cohort, observations of human water withdrawal provide a partial but useful picture of the role of water in a coupled natural–human system. These withdrawal data are far more plentiful than consumption data at census scales (admittedly, water withdrawal observations still lag far behind the data available for other parts of the coupled natural–human system such as food, energy, or consumer data, even in data-rich regions like the USA). This difference between the abundance of consumption and withdrawal-based water use numbers exists for historical and cost reasons – but also because withdrawal observations are radically simpler in concept for real-world use cases.
Proposals for a Water Information Administration (WIA) or for an enhanced USGS water use census (Fishman, 2016; Michelsen et al., 2016; Perrone et al., 2015) may become a reality in the coming decades. Calls for an international “water internet” built on the Internet of Things may eventually be realized (Patterson et al., 2017). When these are built it will take decades longer to accumulate a useful history of water use. In the meantime, we face the possibility that the longitudinal, systematic, detailed, national-scale consumptive water use census data we need will not become available nationwide or globally until at least the middle of the 21st century. This opinion's author and most of its readers will be retired from water science by then. This gap raises two questions:
-
(Sect. 2) What is a proper census data model for consumptive water use?
-
(Sect. 3) When can census water withdrawal data replace consumptive use data?
Because of the lack of high-quality consumptive water use census data in the USA (and globally), and to inform the design of an eventual solution to this water data drought, we need to discuss what can and cannot be accomplished with existing census-scale water data. The scope of this discussion focuses on water-census-scale data in the USA (mesoscale, statistically aggregated) and on its applied uses in coupled natural–human systems management and policy, rather than on classical hydrology and water resource engineering science – although some of the discussion is relevant to classical applications, and to global water data efforts.
Although water use metering is not yet universal, water withdrawal reporting is mandatory in many US states and cities, especially for large water users (W, units of volume, mass, or their time rates). Water consumption or consumption coefficient data are not widely available (C). Calls for “net metering” of these water users' return flows (R) date back decades, based on the perceived need for consumptive water use data. A water user's consumptive use equation is , and a common reformulation employs the consumptive use coefficient (U) in place of R, yielding C=UW. The equation can be solved for a single user or a group of users. At first glance these equations appear trivial because only two measurements are required (either W and R or W and U), along with the point location in time and space, and the user's identity. But the reality is surprisingly complicated in concept, and this complication and its implied cost to census observations is the main reason why better consumptive water use data have not been collected in the past.
For clarity, this paper will coin a term for the water census style simplification of a water user's net effects on the natural environment's water balance: simple net consumptive use (SNCU; Fig. 1). The assumptions involved in SNCU water use accounting in a water census, as a special case of the standard control volume approach, are as follows:
-
spatial point scale control volume (which maximizes net use by minimizing return flows);
-
insignificant storage at the time constant (which tends to be valid only at longer timescales above the water year);
-
fast return flows relative to the time constant (a corollary to no. 2);
-
return to the source of withdrawal (at the same location and time; see no. 1 and no. 3);
-
return flows of similar quality to withdrawals; and
-
homogenous user groups where all aggregated individuals share similar use profiles and identity.

Figure 1The trivial, but confounding, simple net consumptive use case. Water is withdrawn (W), rapidly used by a single user or group of users, and then a smaller amount is returned (R) immediately to the exact point of withdrawal at sufficiently similar water quality. This is a convenient accounting for water resource management work, but it belies the significant complications involved in real-world water uses (see Fig. 2).
Figure 2 illustrates six of the more common “out-of-channel use” complications where simple net consumptive does not hold. In these six instances, and in other more obscure instances (e.g., see Solley et al., 1998), a more detailed water census data model is required to accurately measure the consumptive water use of a human user (or group of users) in the system. Each of these instances requires more than five observations to characterize (user, point location, time, W, R or U) because each is more complicated than the SNCU instance.
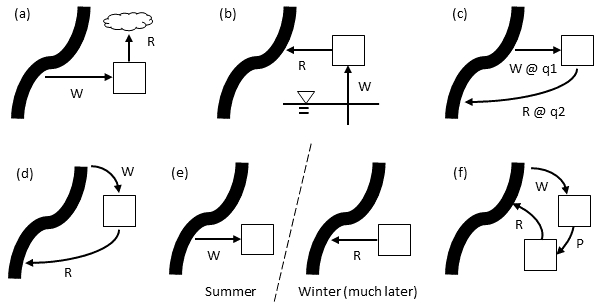
Figure 2Six common out-of-channel water use cases that confound a simple net consumptive use (SNCU) calculation (see Fig. 1): (a) return flow R to a different pool, for instance evaporative use of irrigation water, (b) return of groundwater withdrawal W to surface water, a special case of (a), (c) return at a different quality q2 compared to withdrawal q1, (d) return far downstream or upstream from the point of withdrawal, (e) return much later than withdrawal, implying storage, and (f) pass-through of P to a secondary user. The thick black line represents the “channel”, a surface water source like a river, the cloud represents the atmosphere, and the triangle-marked line represents groundwater. Arrows represent water withdrawals and returns.
It is easy to identify common cases in which a human water user would need to report more than five measurements in order to accurately characterize the impact of their water use on the wider coupled natural–human system – that is, cases that are not compatible with simple net consumptive use accounting. The largest out-of-channel consumptive water use in the USA and most world regions is irrigated agriculture, which is characterized by large withdrawals from surface water and groundwater stocks and large returns to the atmosphere via evaporation along with small returns to surface water and groundwater stocks via infiltration and runoff (Fig. 2a). Both runoff and infiltration flows are largely unmeasured for agriculture, although models and remote sensing have established good guesses for evaporation. Many municipalities withdraw from groundwater stocks and return treated wastewater to surface waters (Fig. 2b). As an example, Mayer et al. (2016) found that municipalities and industries in the Great Lakes region have a net-negative consumptive use of in-channel surface water on average (with important exceptions) because on average these users withdraw from groundwater and return to surface water. Many thermoelectric power plants and industrial users are characterized by large withdrawals from surface water stocks followed by the return of lower quality water (Fig. 2c), raising the issue of “grey” water footprints (Hoekstra et al., 2011) and of the need to separately account for stocks of differing quality (Ruddell et al., 2014). But many of these users are located near coastlines and make use of ocean or Great Lake water, mitigating local surface water impacts due to near-infinite availability. Gravity-fed irrigated agricultural projects often withdraw from surface water and return a smaller amount of flow a distance downstream, creating a localized dewatering impact along a reach of a stream (Fig. 2d). Water storage facilities can withdraw large amounts of water in one part of the water year and return it during another time; this can benefit surface flow management if floodwater is stored and used for dry season demands (Fig. 2e). Some users, especially public supply and water transfer operations, pass water through to secondary users (Fig. 2f). As often as not, more than one of these complications exist simultaneously. In-channel uses of water by human and natural users are also considerable; aquatic ecosystems and human recreationalists use water nonconsumptively within a stream channel. These uses could be considered to “withdraw” in the sense that they cannot exist without the flow rate, but the consumption coefficient of these uses is zero. Evaporative and infiltration losses from reservoirs can be a large in-channel consumptive use of water associated with the water supply, flood control, and hydroelectric services of dams. Reservoirs involve most of the complications in Fig. 2. The most common use cases require more conceptual sophistication than simple net consumptive use accounting can offer, and a more detailed networked data model is required to account for these cases.
Other challenges also exist. The true consumptive water use coefficient U tends to be smaller than the numbers published at census scales because there is a mathematical error in the usual employment of consumptive use at census scales. Consumptive use coefficients are typically quantified at the point scale of space and time (at the pipe), but the resulting point-scale consumptive use coefficient U is often erroneously employed at aggregated scales of space and time (e.g., the annual county scale). Given the circular nature of the water cycle, consumptive use generally (but not monotonically) declines with spatial and temporal scale, such that U=0 by definition over long timescales at global spatial scales (allowing for small gains and losses due to fuel cells, nuclear reactions, long-lasting pollution, and exchanges with outer space). For a nonpoint control volume V the coefficient U is actually a different variable than the point-scale U, so CV=UVWP and CP=UPWP, and UV≤UP in most cases. We know that UV for evaporative water uses like irrigation is roughly 0.9 for regional river basins or US states at annual timescales, closer to 0.5 for continental scales, and close to zero during intense convective precipitation weather events (Dirmeyer and Brubaker, 2007). Corrections need to be made for all scales coarser than the “immediate water environment” or point scale. Most coupled natural–human system work occurs at meso- and macroscales, not point scales (Scanlon et al., 2017; Lant et al., 2018). Most catchment hydrology applications operate at coarser scales than the immediate environment or point scale of space and time. A water census data model must therefore explicitly include spatiotemporal scale and control volume corrections, which is a tall order given the myriad scales at which census data are collected and at which their users do their science.
Additionally, the information quality of consumption data (R or U) must match W for these to be combined properly. In the USA and most global locations, we currently have much better W data than C data at census scales. The USGS water use census collects spatial water withdrawal data at the county resolution every 5 years. Our current consumptive use coefficient data for the USA come from a handful of studies of unrepresentative locations using outdated snapshots in time. But since C=UW, both W and U are equally weighted in the calculation of consumptive water use. If error is concentrated in the U term, W is likely to be dramatically more accurate than C. It is misleading and possibly incorrect to calculate spatially and temporally explicit consumptive water use C using a spatially and temporally nonrepresentative U because it is difficulty to appropriately qualify the errors introduced. The spatiotemporal information content comes from W, and what is provided by U is likely to be anti-informational.
A final challenge is the institutional and sociopolitical complexity involved in the implementation of a water census. For instance, the USGS is a single federal agency with a funded mandate to collect water use data nationwide. Collection of water consumption data requires participation by municipalities (for multiple urban uses) and environmental agencies (for water quality), along with the private sector and the census bureaus (for attribution of water use to economic purposes), and wastewater utilities (for return flows) in myriad local and state jurisdictions. Water withdrawal data, by contrast, is much simpler to collect because they only involve a state water supply agency, and/or direct surveys of water users, either of which may have records of simple withdrawal from the natural environment or from public supply. A census water data model for consumptive use must be capable of managing a much wider range of institutional contexts and data sources, as compared with a simple withdrawal data model or with the use of SNCU assumptions.
The complications presented in Fig. 2 should not surprise us because the natural water cycle is a looping network comprised of gross flows and water quality transformations. The water cycle is not a line or a point. The addition of the human economy makes this water network even more complicated. Accordingly, the proper water use data model is a network by which water is moved, stored, used, transferred between users, transformed in quality, and (sometimes) returned to the original water source – but just as often returned to a different source. As a result, in my opinion, the proper census water use data model for consumptive use must explicitly treat spatiotemporal scale, production of water, transfer of water, pass-through of water to other users, transformation of water quality, return flows to water stocks other than the source (i.e., negative consumption), storage, and delayed flow and use. This data model could be a “stock and flow” water accounting model (Ruddell et al., 2014; Maidment and Morehouse, 2002) and might include natural capital accounts of water (Costanza et al., 1997). This new data model should separate pass-through water producers and conveyers (e.g., the Central Arizona Project or a public supply utility) from the end users of water (e.g., factories, farmers, fish, power plants, or residents). This new water census data model is a challenging requirement for a water census to address, even approximately, for an entire country's retinue of water stocks and water users, or for the multiple scales at which the data are required by users. In many cases the primary data do not currently exist (other than withdrawal data), and even where they do there is a great deal of detailed accounting work necessary. Yet this is what we need from a future water census.
In my opinion, simple net consumptive use accounting is misleading in many census applications. However, a water census program measuring this broader spectrum of data is not likely to produce usable data resources in the short term, owing to the cost, complexity, and lead times involved. Where does this leave us in the short term? Fortunately, the water withdrawal numbers we already possess provide a substantial portion of the information we need to assess the human water economy and its effects on the natural environment at census scales. There are several instances in which researchers and managers could be well served by use of water withdrawal data as an approximation of, or even replacement for, consumptive water use data. As emphasized in the introduction, these instances emphasize mesoscale and census-scale applications, although in some cases fine-scale applications are warranted.
Most obviously, consider that withdrawal conservatively bounds consumption, especially in the simple net consumptive use case. In the simple net consumptive use case C is bounded between zero and W. This makes W a conservative estimate of C from the perspective of a water resource planner who is concerned with leaving adequate water in the channel. When W is small, C will also be small. Unless U is very small (U < 0.1), C and W are guaranteed to be on the same order of magnitude. In general, U is increasing over time in the USA due to rising water use and energy use efficiencies and increased recycling of water, so this rule U > 0.1 will generally be true except for the oldest thermoelectric and industrial facilities. U often approaches 1 (W=C) for irrigated agriculture, the largest water user worldwide and in the USA. Similar orders of magnitude is decent data quality when you consider that our current uncertainty regarding U for most water users is also order of magnitude. If we are dealing with one of the complicated situations considered in Fig. 2, neither W nor C are adequate, but in the simple net consumptive use case, W is often a decent conservative proxy for C. This is why the Michigan Water Withdrawal Assessment Process uses withdrawal-based water use estimates as a preliminary screen for potential aquatic ecosystem impacts of water use, but not as the final word for decisions (Hamilton and Seelbach, 2011). The use of W as a conservative bounded estimate for C is not helpful when we are studying water supply stress in water-stressed locations where W is a large fraction of available water because the difference between W and C can be critical for this application. But for other applications, and especially where simple net consumptive use assumptions are valid, the substitution of W for C is often useful, and may be a best practice if we have good W data but poor C data (as is currently the case for census-scale data).
Consider also that W is superior to C as an index of some types of impacts and risks associated with water use. Aquatic ecosystem impacts caused by water intake fish mortality is proportionate to W, not C. Thermoelectric, public supply, and industrial systems risk curtailment of operations if inadequate intake water is available (e.g., the withdrawal-to-availability index, WTA). If withdrawal requirements exceed available water, it does not help that C or U are small. Similarly, the operating capacity of a water diversion, transportation canal, or water supply tunnel is limited by its ability to withdraw and convey at a maximum rate, not by the amount of water it consumes. Consumption is a water supply risk factor at aggregated scales, and it contributes indirectly to the availability of water to support withdrawal. But for the granular water user at the local scale, these aspects of risk and impact are more proportionate to the rate of flow of water, rather than the volume of water consumed.
Water infrastructure cost is the most important example of a management decision conditioned heavily on withdrawal rates. Peak withdrawal rates are the main driver of our water infrastructure's fixed costs and are therefore a key variable in long-term economic decision-making and strategy for water supply infrastructure. While water census data will not be used for most local water infrastructure engineering work, water is a capital-intensive and infrastructure-heavy sector of the human economy and water infrastructure figures prominently in macroeconomic planning for which census data are heavily employed. At the local scale, capital and maintenance costs for pipes and pumps are engineered, sized, and priced on the basis of peak gross flow rates. Maintenance and administration costs on this infrastructure stock are largely fixed and proportionate to the capacity of the system. Sewerage and wastewater treatment costs are likewise proportionate to flow rates. Wholesale water prices and bulk water rights are priced using withdrawal rates, typically annual withdrawal rates. Higher withdrawal prices translate to reduced demand, and in some cases into reduced consumption. Some exceptions to this pattern involve attempts to price and pay for external costs, such as in the use of water banks where return flows are credited or the use of payments for the ecosystem services of water left in a stream or river. But in general, infrastructure costs correlate to W, more than to C, and W is the correct measure for analysis of cost and price.
Finally, water withdrawal rates influence water user behavior through water use pricing. For better or worse, most water deliveries are billed on a withdrawal basis (plus a connection fee covering fixed costs), and not on the basis of consumption. Most municipal water users are billed at marginal rates that cover marginal operating costs, and marginal operating costs for public water supply systems are dominated by electricity and chemical costs to pump and treat water (Clark et al., 1976). This is true for all kinds of water users, ranging from small residential users to the largest agricultural and industrial operations. In most cases the volume and price of a withdrawal is the only information visible to the customer in a water transaction. We know that marginal costs and prices strongly influence economic behavior, even for the least sophisticated residential water consumers (Arbués et al., 2003). There are exceptions, such as unmetered connection-fee billing in some older municipal water systems, and one could imagine a world with more sophisticated internal metering and billing that incorporates water use timing, quality, and net consumption. But, because withdrawal is what the users of public supply pay for on the margin, water customers are adjusting their behavior to economize withdrawal, not consumption. Customer water withdrawal data are therefore what water economists and pricing consultants usually need to do their work.
In summary, water withdrawal data can be substituted for, or even replace, water consumption data for several common census-scale applications of water data. In my opinion, these applications notably include (a) where a conservative (i.e., high) approximation for C is acceptable, (b) where risk, impact, and decision-making factors are proportionate to flow rates (rather than consumed volumes), (c) the design of water infrastructure where fixed capital costs which are often proportionate to peak flow rates, and (d) the economics of water users (especially in public supply systems). W should not replace C in circumstances where an accurate in-channel water balance is required, for example, on the Lower Colorado River basin, where a 5 % difference in consumption can trigger or avert a legal water emergency.
Our census-scale water research requires a significantly more detailed spectrum of water use data capable of resolving the complicated human–natural systems interface. That system, like the natural water cycle, is more of a circular network than a point or line. In some of the simplest special cases withdrawal-based numbers are approximately sufficient, and in most other cases simple net consumptive use is insufficient (Sect. 2). A water census data model capable of handling the most common cases of human water use must therefore go beyond the simple net consumptive use standard, and embrace a stock and flow data model that considers the complicated network of water users that store, pass through, and transform water. In retrospect, the decision of the USGS's National Water Census team to focus on a problem they could solve – publishing national water withdrawal data – would seem to have merit based on this argument. Surveys of water withdrawal are feasible and they approximately address many of the most important economic, sociohydrological, and CNH problems with a minimum of cost and complexity – at least at the aggregated mesoscales at which census data are published.
The UN Environmental Programme (UNEP, 2012) argues for a global need for improved water measurements, and the Water Framework Directive calls for comprehensive European reporting on water data (Kallis and Butler, 2001). Statistical services like FAO AQUASTAT, EUROSTAT, or the USGS Water Census contain results aggregated from bottom-up primary surveys of water users conducted by (usually) national and state government statistical and census agencies. Regardless of the technology used to organize the data (e.g., Bermudez and Arctur, 2011), primary surveys and observations are the foundation of water use science. Bottom-up survey methods produce true primary observations of water use, and are therefore distinct from, more valuable than, and generally more costly than, modeled estimates of water use. Most of the world's countries lack the resources for rigorous primary surveys of water use, but some excel in this area. For instance, Statistics Netherlands tracks water withdrawals by agricultural subcategory, industry category, and public water supply, including differentiation between withdrawals of surface water and groundwater (Graveland and Baas, 2012); the primary data come from agricultural (FADN), water utility (VEWIN), and environmental (AER) accounting sources. Centrally treated wastewater discharge in the Netherlands is separately tracked in government statistics, but one must individually address each manufacturer's AER to account for industrial wastewater discharge volumes and locations. Using these data, it is possible to assemble consumptive use data that are superior to availability in the USA, in the sense that industry discharge volume and location are directly reported and available annually (but not seasonally) at the point scale. The Australian Bureau of Meteorology identifies water storage, water use, and waste water return flow data as 3 of 12 key observations for good water data practices (BM, 2017).
An expanded future water census needs to go far beyond the development of better consumptive use coefficients at point-of-use scales. An expanded census needs to address spatiotemporal scale, production of water, transfer of water, pass-through of water to other users, separation of water producers/conveyers from end users, transformation of water quality, return flows to water stocks other than the source (i.e., negative consumption), storage, and delayed flow and use, using a stock and flow data model. This paper explains why, and provides guidance on some of the use cases that would need to be addressed by an improved water census. Some excellent groundwork on improved water use measurement has been laid recently (e.g., Diehl and Harris, 2014; Dunham et al., 2017). We need to build on recent work to define a standard for how each aspect of water use should be measured for the complicated cases that arise in coupled natural–human systems.
While we await those future advances, simple and widely available census-scale water withdrawal data are already available and useful for some important applications. The applications in which water withdrawal data can be substituted for or replace water consumption data tend to operate at meso- and macroscales, emphasizing considerations of systemic risk, infrastructure cost, and economics. I urge researchers, policymakers, article reviewers, and resource managers to confidently accept the use of withdrawal-based numbers, especially if the considerations in this paper are appropriately addressed.
No data sets were used in this article.
The author declares that there is no conflict of interest.
The authors acknowledge funding from the National Science Foundation,
ACI-1639529 and the Great Lakes Protection Fund, no. 946. The research and
opinion is that of the authors, and not necessarily of the funding agencies.
The authors acknowledge helpful conversations with Upmanu Lall of Columbia
University and Eric Evenson of the USGS (emeritus), as well as M. Heistermann
and anonymous reviewers of the manuscript.
Edited by: Erwin Zehe
Reviewed by: Rolf Hut and two anonymous referees
Arbués, F., Garcıa-Valiñas, M. Á., and Martınez-Espiñeira, R.: Estimation of residential water demand: a state-of-the-art review, J. Socio-Econ., 32, 81–102, 2003.
Averyt, K., Macknick, J., Rogers, J., Madden, N., Fisher, J., Meldrum, J., and Newmark, R.: Water use for electricity in the United States: An analysis of reported and calculated water use information for 2008, Environ. Res. Lett., 8, 015001, https://doi.org/10.1088/1748-9326/8/1/015001, 2008.
Averyt, K., Meldrum, J., Caldwell, P., Sun, G., McNulty, S., Huber-Lee, A., and Madden, N.: Sectoral contributions to surface water stress in the coterminous United States, Environ. Res. Lett., 8, 035046, https://doi.org/10.1088/1748-9326/8/3/035046, 2013.
Bermudez, L. E. and Arctur, D.: OGC Engineering Report: Water Information Services Concept Development Study, Open Geospatial Consortium, Document No. OGC 11-013r6, 2011.
BM: Good practice guidelines for water data management policy, World Water Data Initiative, Bureau of Meteorology, Melbourne, Australia, 2017.
Clark, R. M., Stevie, R., and Trygg, G.: The Cost of Municipal Water Supply: A Case Study (Vol. 1), US Environmental Protection Agency, Office of Research and Development, Municipal Environmental Research Laboratory, Water Supply Research Division, 1976.
Commerce: 1982 Census of Manufactures, Water Use in Manufacturing, U.S. Department of Commerce Bureau of the Census, March 1986, MC82-S-6, 1986.
Costanza, R., d'Arge, R., De Groot, R., Farber, S., Grasso, M., Hannon, B., and Raskin, R. G.: The value of the world's ecosystem services and natural capital, Nature, 387, https://doi.org/10.1038/387253a0, 1997.
Diehl, T. H. and Harris, M. A.: Withdrawal and consumption of water by thermoelectric power plants in the United States, 2010, U.S. Geological Survey Scientific Investigations Report 2014–5184, 28 pp., 2014.
Dirmeyer, P. A. and Brubaker, K. L.: Characterization of the global hydrologic cycle from a back-trajectory analysis of atmospheric water vapor, J. Hydrometeorol., 8, 20–37, 2007.
Dunham, C., Fuch, H., and Stratton, H.: Benefits of a National Survey on Water Demand: Existing Data and Reporting Recommendations, Lawrence Berkeley National Laboratory, December 2017, LBNL-2001085, 2017.
Fishman, C.: Water Is Broken. Data Can Fix It, The New York Times, March 17, available at: https://nyti.ms/22o8mRc (last access: 24 January 2018), 2016.
Gates, T. K., Garcia, L. A., Hemphill, R. A., Morway, E. D., and Elhaddad, A.: Irrigation Practices, Water Consumption, & Return Flows in Colorado's Lower Arkansas River Valley, Technical Completion Report No. 221, Colorado Water Institute, Technical Report No. TR12-10, Colorado Agricultural Experiment Station, 2012.
Graveland, C. and Baas, K.: Improvement of waterflows in the National Water Balance; Water Stocks; feasibility of Water Balances per River Basin, Statistics Netherlands, the Hague, 2012.
Hamilton, D. A. and Seelbach, P. W.: Michigan's water withdrawal assessment process and internet screening tool, Fisheries Division Special Report, 55, 2011.
Hoekstra, A. Y., Chapagain, A. K., Aldaya, M. M., and Mekonnen, M. M.: The water footprint assessment manual: Setting the global standard, Earthscan, London, UK, 2011.
Kallis, G. and Butler, D.: The EU Water Framework Directive: measures and implications, Water Policy, 3, 125–142, 2001.
Lant, C., Baggio, J., Konar, M., Mejia, A., Ruddell, B., Rushforth, R., Sabo, J. L., and Troy, T. J.: The US food–energy–water system: A blueprint to fill the mesoscale gap for science and decision-making, Ambio, 1–13, 2018.
Liu, J., Dietz, T., Carpenter, S. R., Alberti, M., Folke, C., Moran, E., and Ostrom, E.: Complexity of coupled human and natural systems, Science, 317, 1513–1516, 2007.
Macknick, J., Newmark, R., Heath, G., and Hallett, K.: Operational water consumption and withdrawal factors for electricity generating technologies: a review of existing literature, Environ. Res. Lett., 7, 045802, https://doi.org/10.1088/1748-9326/7/4/045802, 2012.
Maidment, D. R. and Morehouse, S.: Arc Hydro: GIS for water resources, Vol. 1, ESRI, Inc., 2002.
Maupin, M. A., Kenny, J. F., Hutson, S. S., Lovelace, J. K., Barber, N. L., and Linsey, K. S.: Estimated use of water in the United States in 2010, US Geological Survey, 2014.
Mayer, A., Mubako, S., and Ruddell, B. L.: Developing the greatest Blue Economy: Water productivity, fresh water depletion, and virtual water trade in the Great Lakes basin, Earth's Future, 4, 282–297, 2016.
Michelsen, A. M., Jones, S., Evenson, E., and Blodgett, D.: The USGS Water Availability and Use Science Program: Needs, Establishment, and Goals of a Water Census, J. Am. Water Resour. As., 52, 836–844, 2016.
Patterson, L., et al.: INTERNET OF WATER: Sharing and Integrating Water Data for Sustainability, The Aspen Institute, Washington, DC, ISBN: 0-89843-665-6, 2017.
Perrone, D., Hornberger, G., Vliet, O., and Velde, M.: A Review of the United States' Past and Projected Water Use, J. Am. Water Resour. As., 51, 1183–1191, 2015.
Qureshi, M. E., Schwabe, K., Connor, J., and Kirby, M.: Environmental water incentive policy and return flows, Water Resour. Res., 46, W04517, https://doi.org/10.1029/2008WR007445, 2010.
Ruddell, B. L., Adams, E. A., Rushforth, R., and Tidwell, V.C.: Embedded resource accounting for coupled natural-human systems: An application to water resource impacts of the western US electrical energy trade, Water Resour. Res., 50, 7957–7972, 2014.
Rushforth, R. R. and Ruddell, B. L.: A spatially detailed blue water footprint of the United States economy, Hydrol. Earth Syst. Sci., 22, 3007–3032, https://doi.org/10.5194/hess-22-3007-2018, 2018.
Scanlon, B. R., Ruddell, B. L., Reed, P. M., Hook, R. I., Zheng, C., Tidwell, V. C., and Siebert, S.: The food-energy-water nexus: Transforming science for society, Water Resour. Res., 53, 3550–3556, 2017.
Senay, G. B., Friedrichs, M., Singh, R. K., and Velpuri, M. N.: Evaluating Landsat 8 evapotranspiration for water use mapping in the Colorado River Basin, Remote Sens. Environ., 185, 171–185, https://doi.org/10.1016/j.rse.2015.12.043, 2016.
Shaffer, K. and Runkle, D. L.: Consumptive Water, Use Coefficients for the Great Lakes Basin and Climatically Similar Areas, US Geological Survey Reston, VA, 2007.
Solley, W. B., Pierce, R. R., and Perlman, H. A.: Estimate use of water in the United States in 1995, USGS Circular 1200, 71 pp., 1998.
UNEP: Measuring water use in a green economy, A Report of the Working Group on Water Efficiency to the International Resource Panel, edited by: McGlade, J., Werner, B., Young, M., Matlock, M., Jefferies, D., Sonnemann, G., Aldaya, M., Pfister, S., Berger, M., Farell, C., Hyde, K., Wackernagel, M., Hoekstra, A., Mathews, R., Liu, J., Ercin, E., Weber, J. L., Alfieri, A., Martinez-Lagunes, R., Edens, B., Schulte, P., von Wirén-Lehr, S., and Gee, D., ISBN: 978-92-807-3220-7, 2012.
Ward, F. A. and Pulido-Velazquez, M.:, Water conservation in irrigation can increase water use, P. Natl. Acad. Sci. USA, 105, 18215–18220, 2008.