the Creative Commons Attribution 4.0 License.
the Creative Commons Attribution 4.0 License.
 | 23 Oct 2018
Recent evolution and associated hydrological dynamics of a vanishing tropical Andean glacier: Glaciar de Conejeras, Colombia
Jorge Luis Ceballos
Katherine Peña
Jorge Lorenzo-Lacruz
Juan Ignacio López-Moreno
Glaciers in the inner tropics are rapidly retreating due to atmospheric warming. In Colombia, this retreat is accelerated by volcanic activity, and most glaciers are in their last stages of existence. There is general concern about the hydrological implications of receding glaciers, as they constitute important freshwater reservoirs and, after an initial increase in melting flows due to glacier retreat, a decrease in water resources is expected in the long term as glaciers become smaller. In this paper, we perform a comprehensive study of the evolution of a small Colombian glacier, Conejeras (Parque Nacional Natural de los Nevados) that has been monitored since 2006, with a special focus on the hydrological response of the glacierized catchment. The glacier shows great sensitivity to changes in temperature and especially to the evolution of the El Niño–Southern Oscillation (ENSO) phenomenon, with great loss of mass and area during El Niño warm events. Since 2006, it has suffered a 37 % reduction, from 22.45 ha in 2006 to 12 ha in 2017, with an especially abrupt reduction since 2014. During the period of hydrological monitoring (June 2013 to December 2017), streamflow at the outlet of the catchment experienced a noticeable cycle of increasing flows up to mid-2016 and decreasing flows afterwards. The same cycle was observed for other hydrological indicators, including the slope of the rising flow limb and the monthly variability of flows. We observed an evident change in the daily hydrograph, from a predominance of days with a purely melt-driven hydrograph up to mid-2016, to an increase in the frequency of days with flows less influenced by melt after 2016. Such a hydrological cycle is not directly related to fluctuations of temperature or precipitation; therefore, it is reasonable to consider that it is the response of the glacierized catchment to retreat of the glacier. Results confirm the necessity for small-scale studies at a high temporal resolution, in order to understand the hydrological response of glacier-covered catchments to glacier retreat and imminent glacier extinction.
- Article
(7144 KB) - Full-text XML
- BibTeX
- EndNote


1.1 Andean glaciers and water resources
Glacier retreat is one the most prominent signals of global warming; glaciers from most mountain regions in the world are disappearing or have already disappeared due to atmospheric warming (Vaughan et al., 2013). Of the retreating mountain glaciers worldwide, those located within the tropics are particularly sensitive to atmospheric warming (Chevallier et al., 2011; Kaser and Omaston, 2002). Their locations in the tropical region involve a larger energy forcing, in terms of received solar radiation, compared to other latitudes. Unlike glaciers in middle and high latitudes, which are subject to freezing temperatures during a sustained season, tropical glaciers may experience above-zero temperatures all year round, especially at the lowest elevations, involving constant ablation and rapid response of the glacier snout to climate variability and climate change (Francou et al., 2004; Rabatel et al., 2013). As a result of atmospheric warming since the mid-20th century, glaciers in the tropics are seriously threatened, and many of them have already disappeared (Vuille et al., 2008). Of the tropical glaciers, 99 % are located in the Central Andes and constitute a laboratory for glaciology (see review in Vuille et al., 2017), including studies of glacier response to climate forcing (e.g., Favier et al., 2004; Francou et al., 2003, 2004; López-Moreno et al., 2014), hydrological and geomorphological consequences of glacier retreat (Bradley et al., 2006; Chevallier et al., 2011; Kaser et al., 2010; López-Moreno et al., 2017; Ribstein et al., 1995; Sicart et al., 2011), and the vulnerability of populations to risks associated with glacier retreat (Mark et al., 2017). The glaciers in the most critical situation in the Andean mountains are perhaps those located in the inner tropics, including the countries of Ecuador, Venezuela and Colombia (Klein et al., 2006; Rekowsky, 2016). In the latter country, a constant glacier recession since the 1970s has been reported, with an acceleration since the 2000s (Ceballos et al., 2006; Rabatel et al., 2013), and most glaciers are in danger of disappearing in the coming years (Poveda and Pineda, 2009; Rabatel et al., 2017). In the outer tropics, the variability of glacier mass balance is highly dependent on seasonal precipitation; thus, during the wet season (December–February), freezing temperatures ensure seasonal snow cover that increases the glaciers' surface albedo and compensates mass balance losses of the dry season. In contrast, for glaciers of the inner tropics, ablation rates remain more or less constant throughout the year due to the absence of seasonal fluctuations of temperature and to a freezing level that is constantly oscillating within the glaciers' elevation ranges. Therefore, the mass balance of these glaciers is more sensitive to interannual variations of temperature, and they are much more sensitive to climate warming (Ceballos et al., 2006; Favier et al., 2004; Francou et al., 2004; Rabatel et al., 2013, 2017). In Colombia, this situation is further aggravated by the location of glaciers near or on the top of active volcanos. The hot pyroclastic material emitted during volcanic eruptions and the reduced albedo of glacier surfaces by the deposition of volcanic ash have notably contributed to rapid glacier recession in these areas (Granados et al., 2015; Huggel et al., 2007; Rabatel et al., 2013; Vuille et al., 2017).
Current glacier recession in the Andes involves the loss of natural scientific laboratories (Francou et al., 2003) and of landscape and cultural emblems of mountainous areas (IDEAM, 2012; Rabatel et al., 2017). But in more practical terms, the vanishing of glaciers has a major impact on the livelihoods of communities living downstream, including potential reduction of freshwater storage and changes in the seasonal patterns of water supply by downstream rivers (Kaser et al., 2010). Glaciers constitute natural water reservoirs in the form of ice accumulated during cold and wet seasons, and they provide water when ice melts during above-freezing temperature seasons. The hydrological importance of glaciers for downstream areas depends on the availability of other sources of runoff, including snowmelt and rainfall. Therefore, water supply by glaciers becomes critical for arid or semiarid regions downstream of the glacierized areas, buffering the lack of sustained precipitation or water provided by seasonal melt of snow cover (Rabatel et al., 2013; Vuille et al., 2008). Such is the case for the western slopes of the tropical Andes: in countries like Peru or Bolivia, with a high variability in precipitation and a sustained dry season, the contribution of glacier melt is crucial for socioeconomic activities and for water supply, especially since it is one of the main sources of water for the highly populated capital cities such as La Paz (Kaser et al., 2010; López-Moreno et al., 2014; Soruco et al., 2015; Vuille et al., 2017). In more humid or temperate regions (i.e., the Alps or western North America) the melt of seasonal snow cover provides the majority of water during the melt season (Beniston, 2012; Stewart et al., 2004) and glacier melt is a secondary contributor. However, even in this region, water availability can be subject to climate variability, and the occurrence of dry and warm periods that comprise thin and brief snow cover may involve glacier melt as the main source of water during such events (Kaser et al., 2010). In the inner tropics, glaciers may not constitute the main source of water for downstream populations, as the seasonal shift of the Intertropical Convergence Zone (Poveda et al., 2006) assures two humid seasons every year; however, the loss of water from glacier melt can affect the eco-hydrological functioning of the wetland ecosystems called “páramos”, which are positioned in the altitudinal tier located below that of the periglacial ecosystem (Rabatel et al., 2017). Agriculture and livestock in Colombian mountain communities are partly dependent on water from these important water reservoirs that provide water flow to downstream rivers, even during periods of less precipitation.
1.2 Hypothesis and objectives
The present work is focused on the hydrological dynamics of a Colombian glacier near extinction due to prolonged deglaciation. Hock et al. (2005) presented a summary of the effects of glaciers on streamflow compared to nonglacierized areas. The main characteristics of streamflow can be summarized as follows (Hock et al., 2005):
-
Specific runoff dependence on variability of glacier mass balance (in years of mass balance loss, total streamflow will increase as water is released from glacier storage; the opposite will happen in years of positive mass balance).
-
Seasonal runoff variation dependent on ablation and accumulation periods at latitudes with markedly variable temperature and/or precipitation seasonal patterns (in the case of temperature, this does not apply to glaciers in the inner tropics).
-
Large diurnal fluctuation in the absence of precipitation, as a result of the daily cycle of temperature and derived glacier melt.
-
Moderation of year-to-year variability (moderate percentages, of 10 % to 40 %, of ice cover fraction within the basin reduces variability to a minimum, but it becomes greater at both higher and lower glacierization levels).
-
Large glacierization involves a high correlation between runoff and temperature, whereas low levels of glacier cover increase runoff correlation with precipitation.
However, under warming conditions that lead to glacier retreat, the hydrological contribution of the glacier may notably change from the aforementioned characteristics. The retreat of a glacier is a consequence of prolonged periods of negative mass balance, the result of a disequilibrium in the accumulation–ablation ratio that involves an upward shift of the equilibrium line (the elevation at which accumulation and ablation volumes are equal) and an increase of the ablation area with respect to the accumulation area (Chevallier et al., 2011). As a result, the glacierized area is increasingly smaller compared to the nonglacierized area within the catchment in which the glacier is settled. Under such conditions of sustained negative mass balance, the hydrological response of the glacier will be a matter of timescales (Chevallier et al., 2011; Hock et al., 2005).The total runoff production of the retreating glacier comprises a tradeoff between two processes: on one side, an acceleration of glacier melt that will increase the volume of glacier outflows, independent of the volume precipitated as snowfall or rainfall; on the other side, water discharges from the catchment decrease because the water reservoir that represents the glacier is progressively emptying (Huss and Hock, 2018). Thus, the contribution of glacier melt to total water discharge will initially increase, as the first process will dominate over the other; however, after reaching a discharge peak, the second process dominates, leading to a decrease in water discharge until the glacier vanishes. In terms of runoff variability, there is also a different signal between initial and final stages of glacier retreat: on a daily basis, the typical diurnal cycle of glacier melt will exacerbate at the initial stages (larger difference between peak and base runoff) and will moderate at the final stages. However, in terms of year-to-year variability, there can be a reduction or increase at the initial stages, depending on the original glacierized area. And for the long term, increasing variability should be expected, as the water discharge will correlate with precipitation instead of temperature because the percentage of runoff from glacier melt decreases with decreasing glacierization (Hock et al., 2005).
It is expected that changes will be observed in the hydrological dynamics of vanishing glaciers, independently of climate drivers. Such hydrological changes may serve as indicators of glacier shrinkage, complementing others such as mass balance or areal observations. The objective of this work is to provide a comprehensive analysis of the hydrological dynamics of a glacierized basin, with the glacier in its last stages prior to extinction. Considering the abovementioned characteristics of the hydrology of retreating glaciers, the specific aim is to explore changes over time in streamflow dynamics, focusing on the daily cycle, and to discern whether such changes are driven by climate or are a result of the diminishing glacierized area within the basin.
The case study is a small glacier (see description in Sect. 2) in the central Colombian Andes and the catchment that drains the water at the snout of the glacier. It is one of the very few monitored glaciers in the tropical Andes (Mölg et al., 2017; Rabatel et al., 2017) and represents an ideal case, where the hydrological signal of the glacier can be studied in isolation from any environmental factors that may occur in the downstream areas. For this reason, the approach used (see Sect. 3.3) can be applied to similar environments, and the obtained results can be representative of expected hydrological dynamics in other glacierized areas in the Andes, with glaciers close to extinction.
Our study focuses on the Conejeras glacier, a very small ice mass (14 ha in 2017) that forms part of a larger glacier system called Nevado de Santa Isabel (1.8 km2), one of the six glaciers that still persist in Colombia. It is located in the Cordillera Central (the central range of the three branches of the Andean chain in Colombia) and, together with the glaciers of Nevado del Ruiz and Tolima, comprises the protected area called Parque Nacional Natural de los Nevados (Fig. 1). The summit of the Santa Isabel glacier reaches 5100 m, being the lowest glacier in Colombia. As a result, it is also the most sensitive to atmospheric warming and so it has been monitored since 2006 as part of the world network of glacier monitoring (IDEAM, 2012). The Santa Isabel glacier has been retreating since the 19th century, with an intensification of deglaciation since the middle of the 20th century. As a result, the glacier is now a set of separated ice fragments instead of a continuous ice mass, as it was a decade ago (IDEAM, 2012). One of the fragments, located at the northeast sector of the glacier, is the Conejeras glacier, which is the object of this study, whose elevation ranges between 4700 and 4895 m. In 2006, at the glacier terminus, hydro-meteorological stations were installed in order to measure glacier contribution to runoff, as well as air temperature and precipitation.
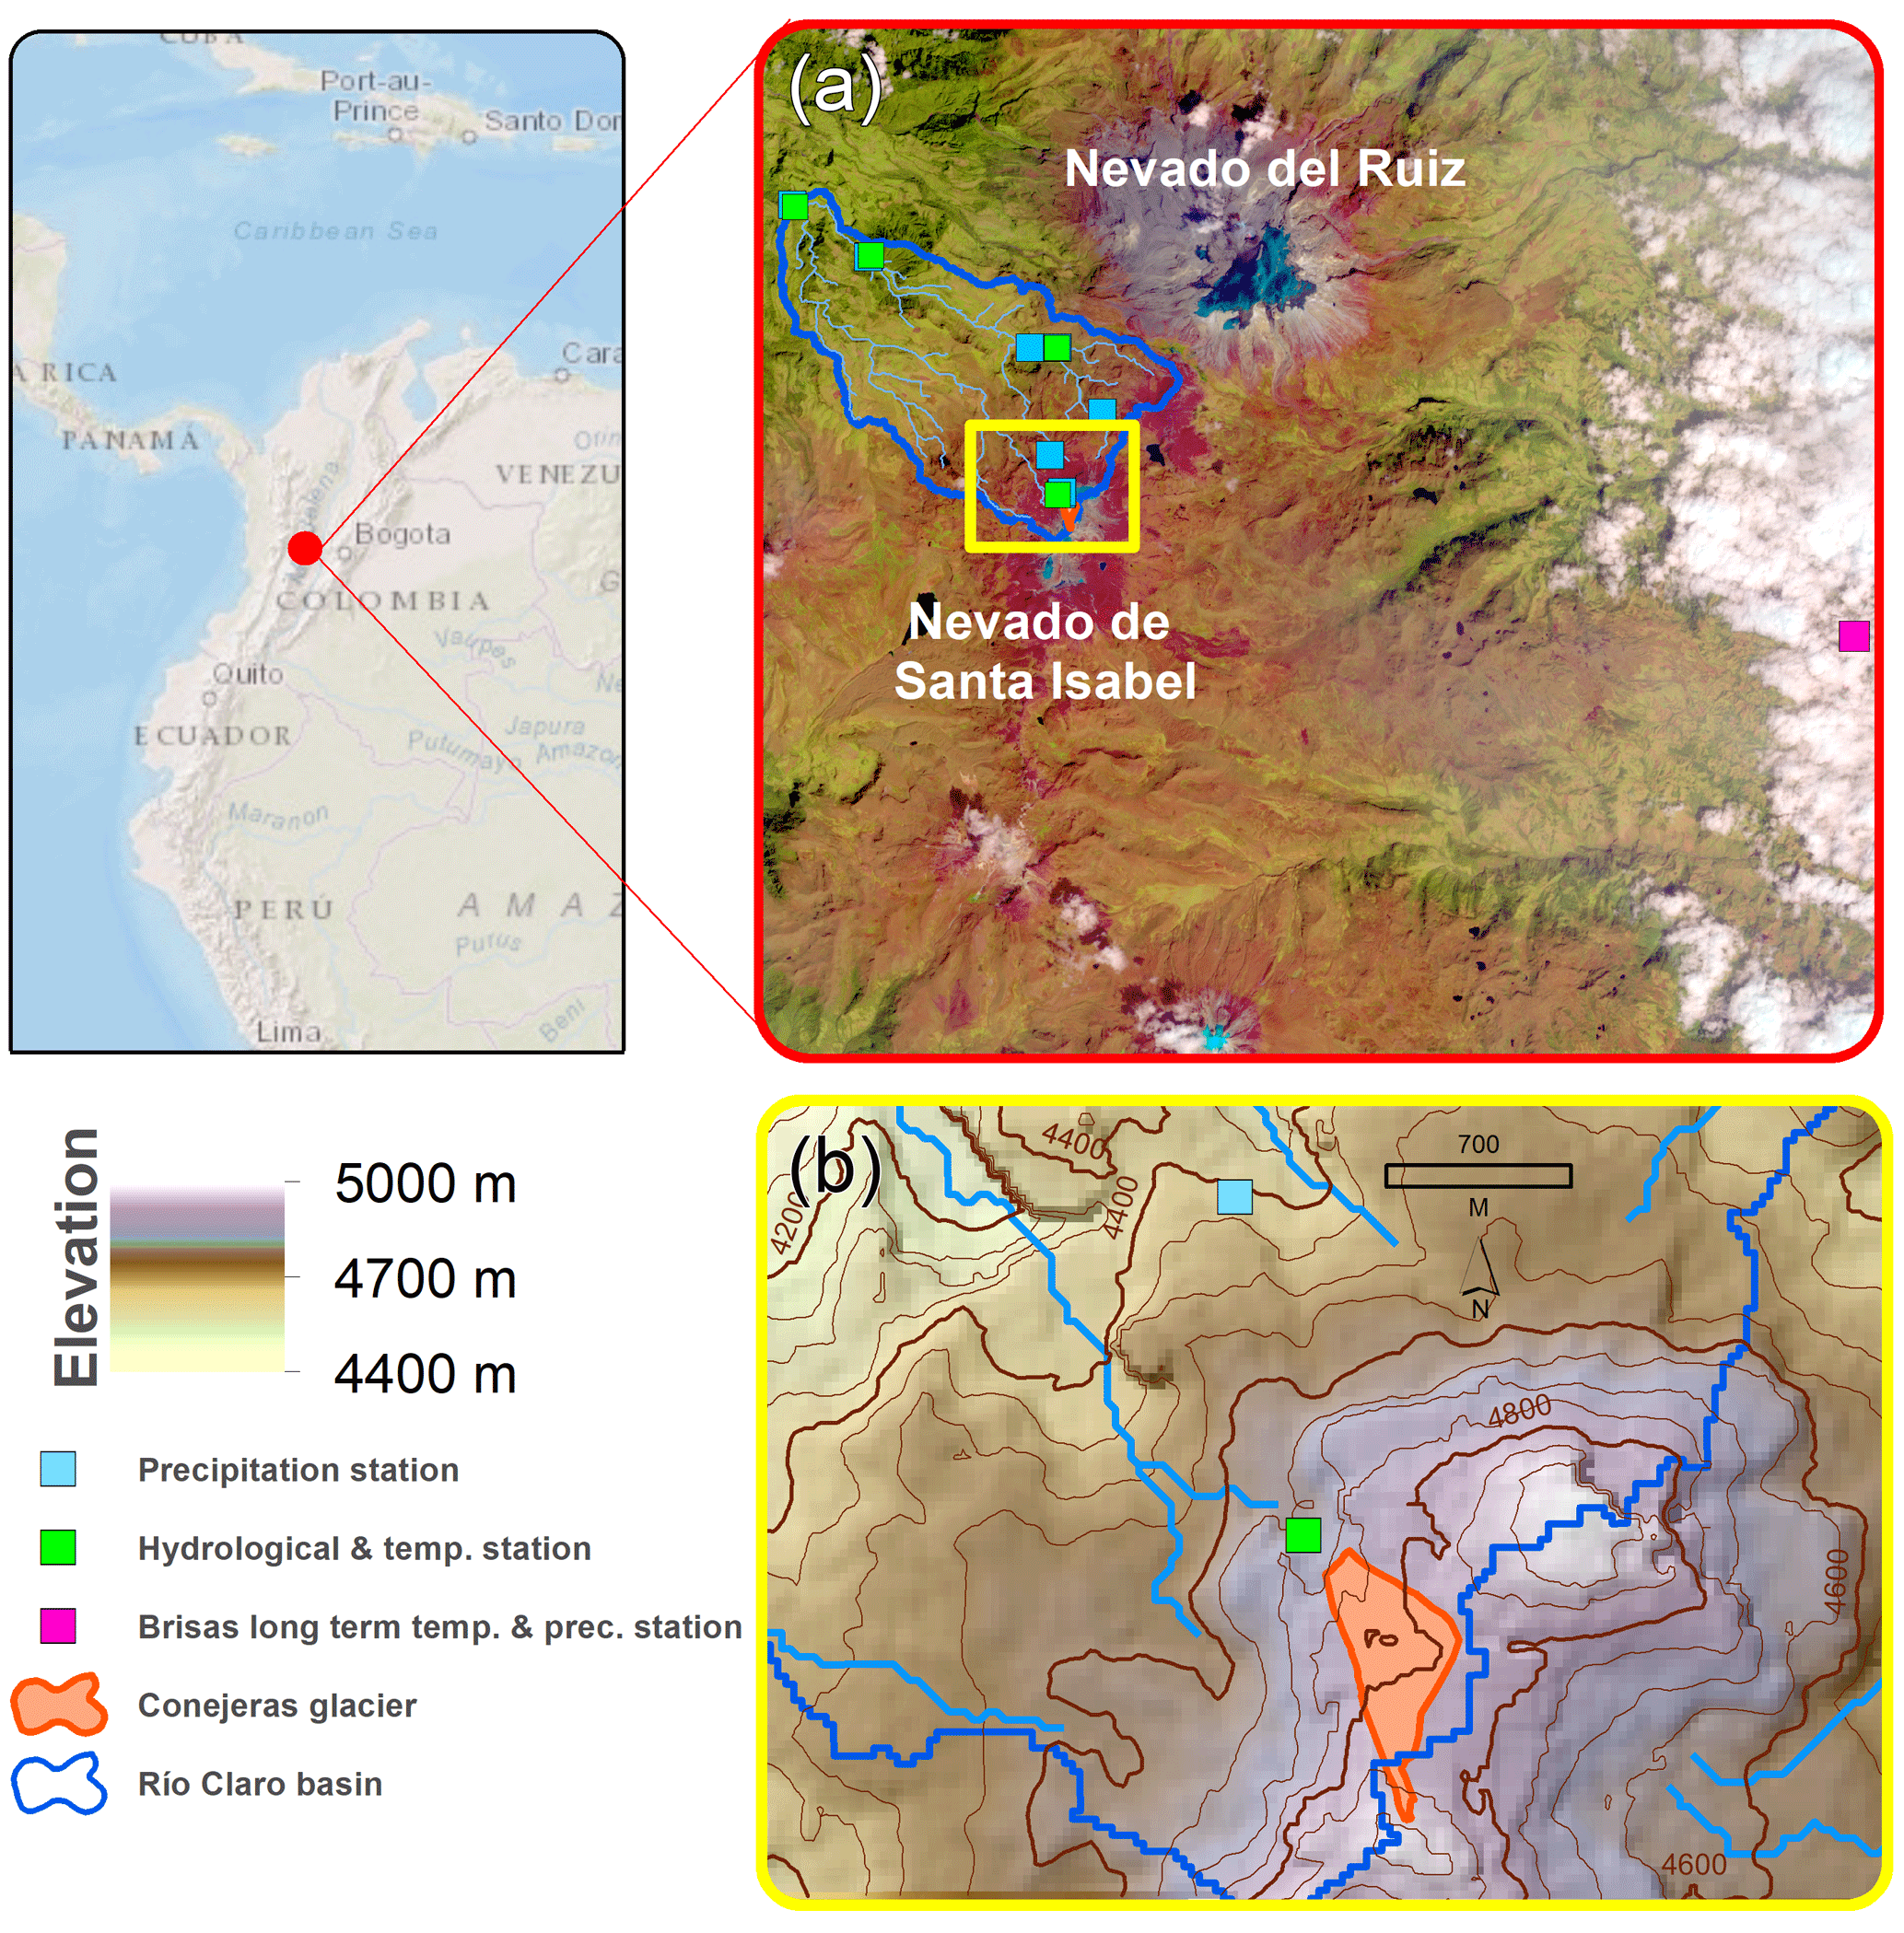
Figure 1Study area, showing the glaciers of the Parque Nacional Natural de los Nevados, and the Río Claro basin (a) and the Conejeras glacier with hydro-meteorological stations (b).
The Conejeras water stream is a tributary of one of the quebradas (Spanish for small mountain rivers in South American countries) flowing into the river Rio Claro. Thus, the Conejeras glacier corresponds to the uppermost headwaters of the Rio Claro basin (Fig. 1). The Rio Claro basin comprises an elevation range of 2700 to 4895 m and, from highest to lowest, presents a succession of typical Andean ecosystems: glacial (4700 to 4894), periglacial (4300–4700 m), páramo wetland ecosystem (3600 to 4300 m) and high-elevation tropical forest, bosque altoandino (2700 to 3600 m). Mean annual temperature at the glacier base is 1.3±0.7 ∘C, with very little seasonal variation, and precipitation sums reach 1025±50 mm annually, with two contrasted seasons (see Fig. 2) resulting from the seasonal migration of the Intertropical Convergence Zone (ITCZ, Poveda et al., 2006). During the dry seasons (December to January and June to August), mean precipitation barely reaches 75 mm per month, whereas during the wet seasons (March to May and September to October), values exceed 150 mm per month.
3.1 Hydrological and meteorological data
Meteorological and hydrological data used in the present work have been collected by the Institute for Hydrological, Meteorological and Environmental Studies of Colombia (IDEAM, Instituto de Hidrología, Meteorología y Estudios Ambientales), thanks to the automatic meteorological and gauge stations network in the Río Claro basin (Fig. 1).
The experimental site of the Río Claro basin has been monitored since 2009, with a network of meteorological and hydrological stations located at different tributaries of the Río Claro, covering an altitudinal gradient of 2700–4900 m a.s.l. As this research is focused on the upper catchment in which the glacier is located for the present study, we only used data from the stations located at the Conejeras glacier snout (Fig. 1, bottom map). This includes one stream gauge (with associated rating curve) measuring 15 min resolution water discharge (m3 s−1), one temperature station measuring hourly temperature (∘C) (both stations located at 4662 m a.s.l.), and one rain gauge measuring 10 min precipitation (mm; the station is located at 4413 m a.s.l.). Even though these data have been available since 2009, the sensors and loggers experienced technical problems; thus, numerous inhomogeneities, out-of-range values and empty records were present in the data series. From 2013, the technical problems were solved and the data are suitable for analysis. The period covered for analysis ranges from June 2013 to December 2017, a total of 56 months, and data were aggregated hourly, daily and monthly to perform statistical analyses. However, in order to obtain a wider perspective and to take advantage of the effort made by the IDEAM glaciologist, who conscientiously took mass balance measurements every month since 2006, also shown are trends and variability in climate – from a nearby meteorological station of the Colombian national network (Brisas) that contains data since 1982 – and glacier mass evolution for the longest time period available. The multivariate ENSO index (Wolter and Timlin, 1993, 1998), used for characterizing influence of the ENSO phenomenon on glacier evolution, has been downloaded from NOAA: https://www.esrl.noaa.gov/psd/enso/mei/table.html (last access: 15 December 2017).
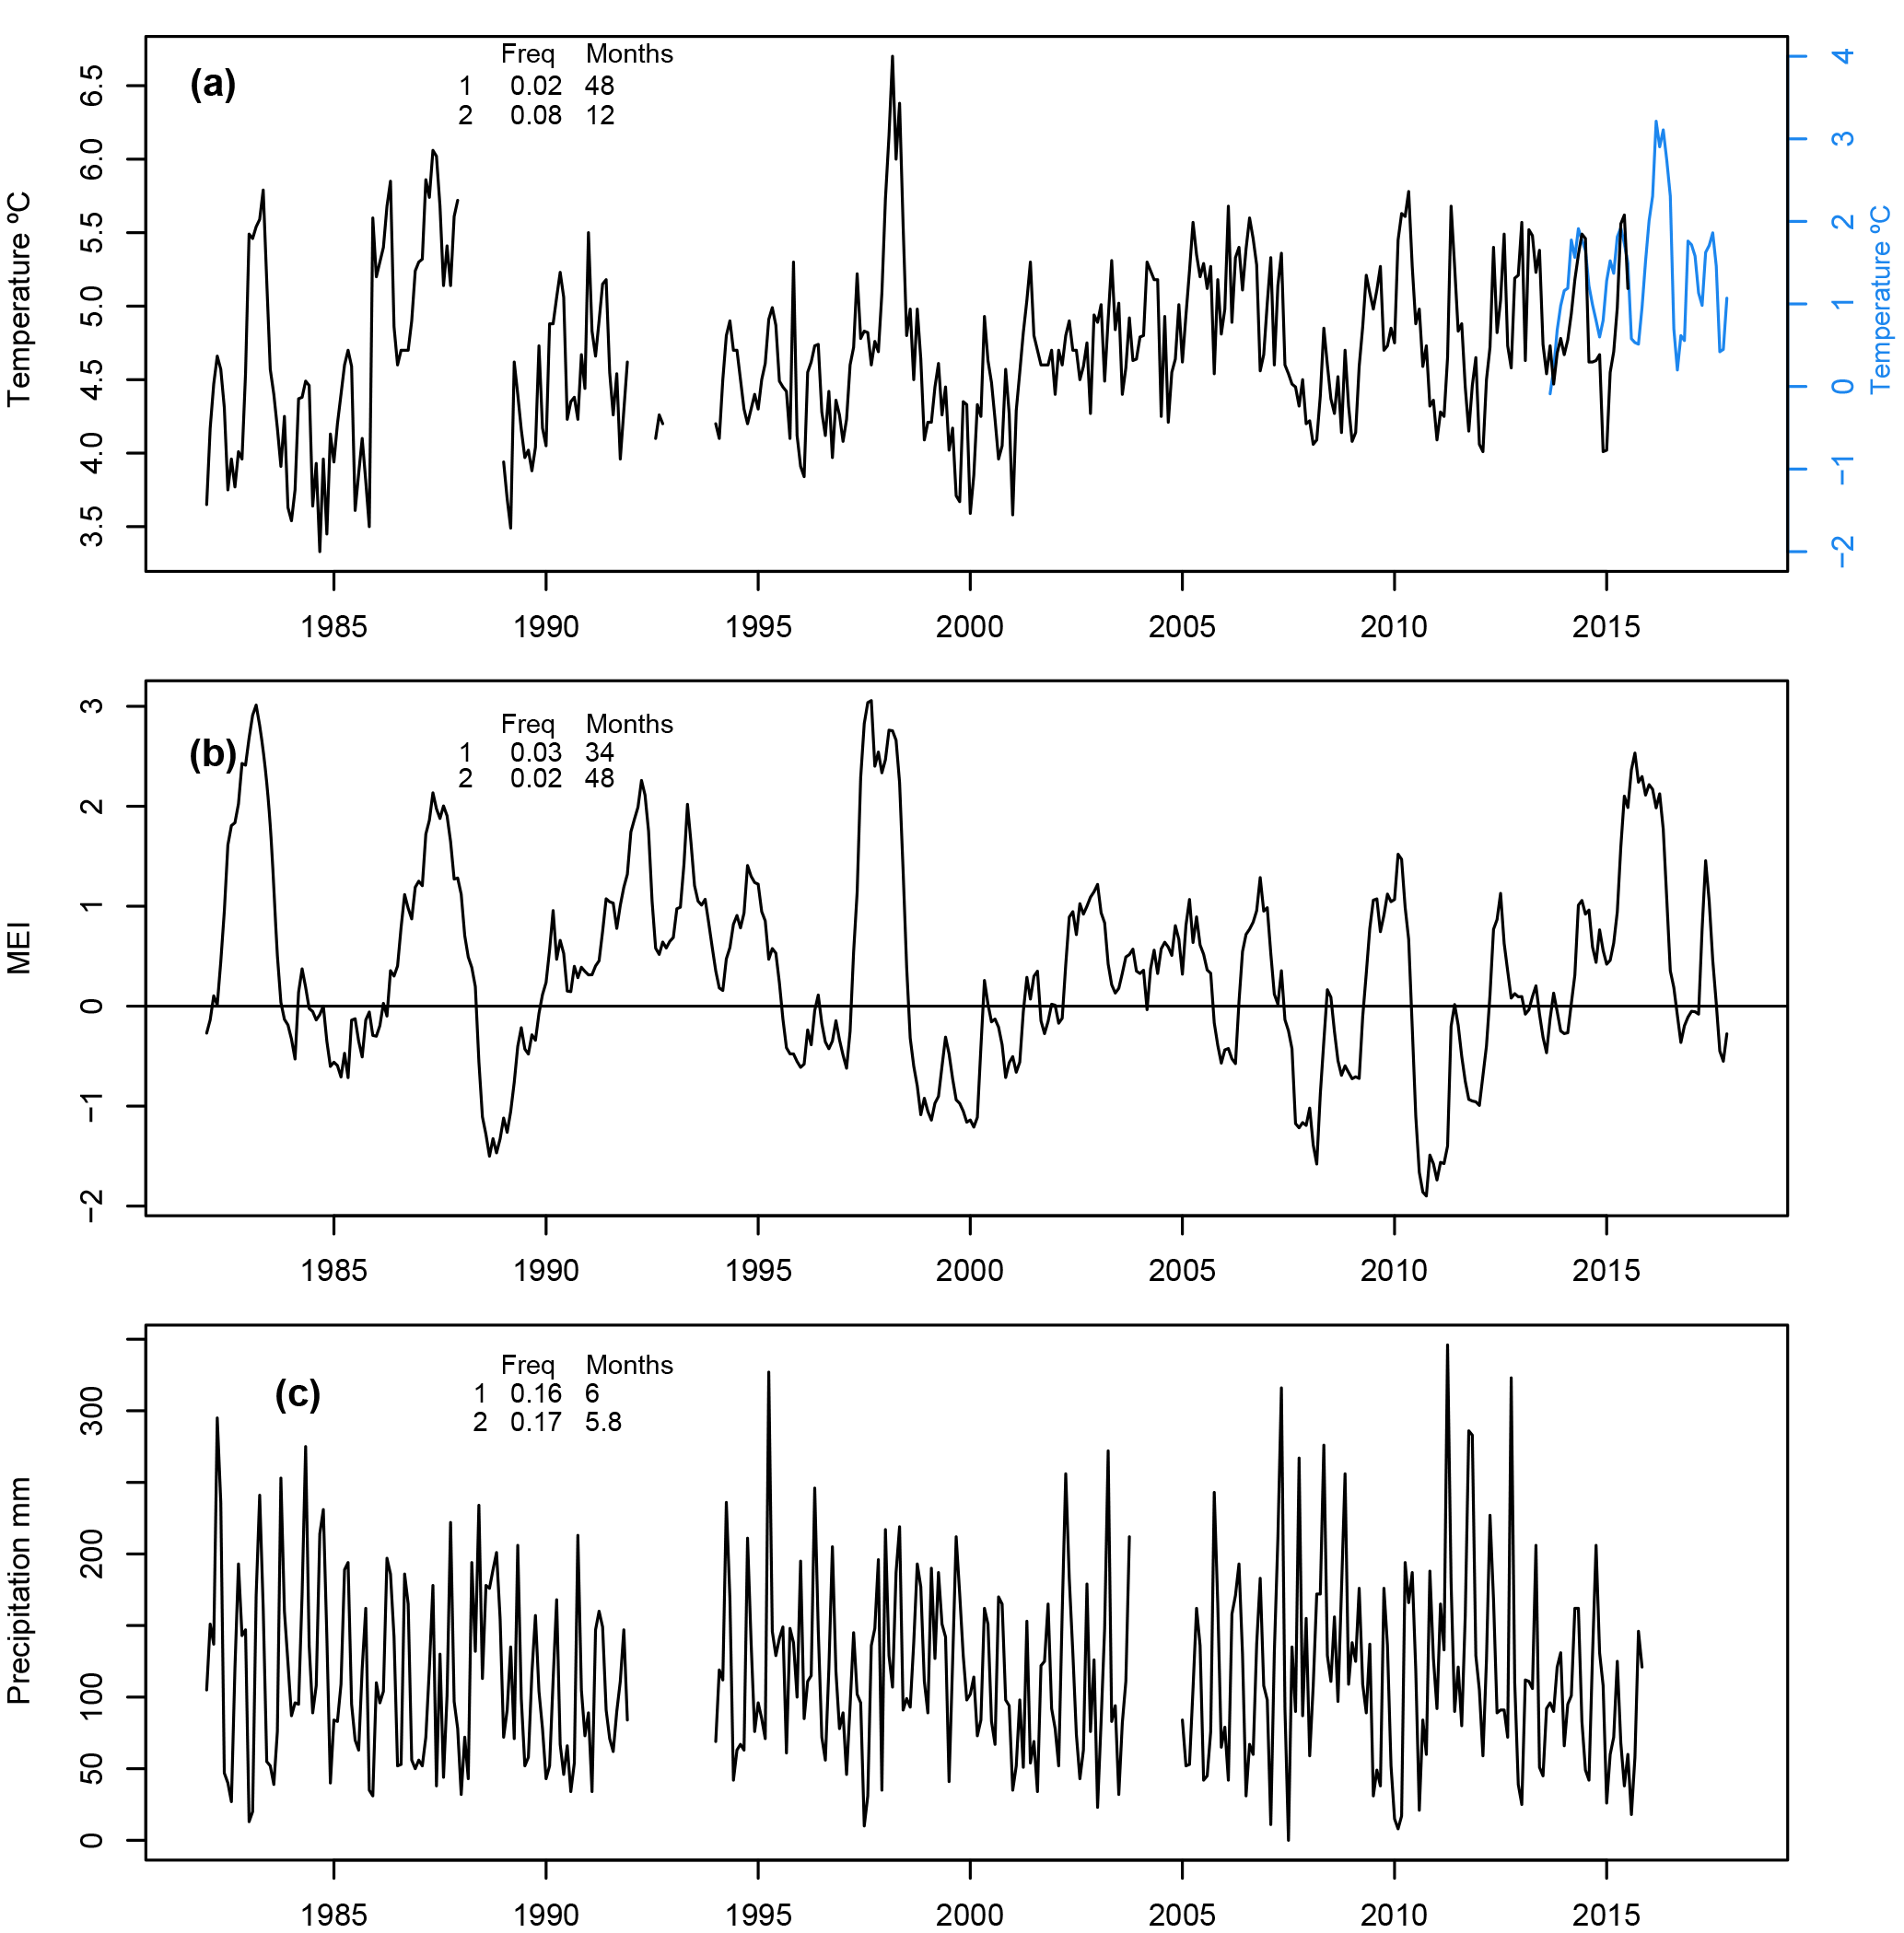
Figure 2Long-term evolution of climate variables in the study area: (a) monthly air temperature at the Brisas meteorological station (2721 m a.s.l.), 1982–2015 (black line), and the temperature at the glacier snout (note the difference in the range of values), 2013–2017 (blue line); (b) multivariate ENSO index; (c) monthly precipitation at the Brisas station, 1982–2015; The frequency and its equivalent in months (1∕frequency) of the two top spectral densities from spectral analysis is shown for temperature, MEI and precipitation monthly series.
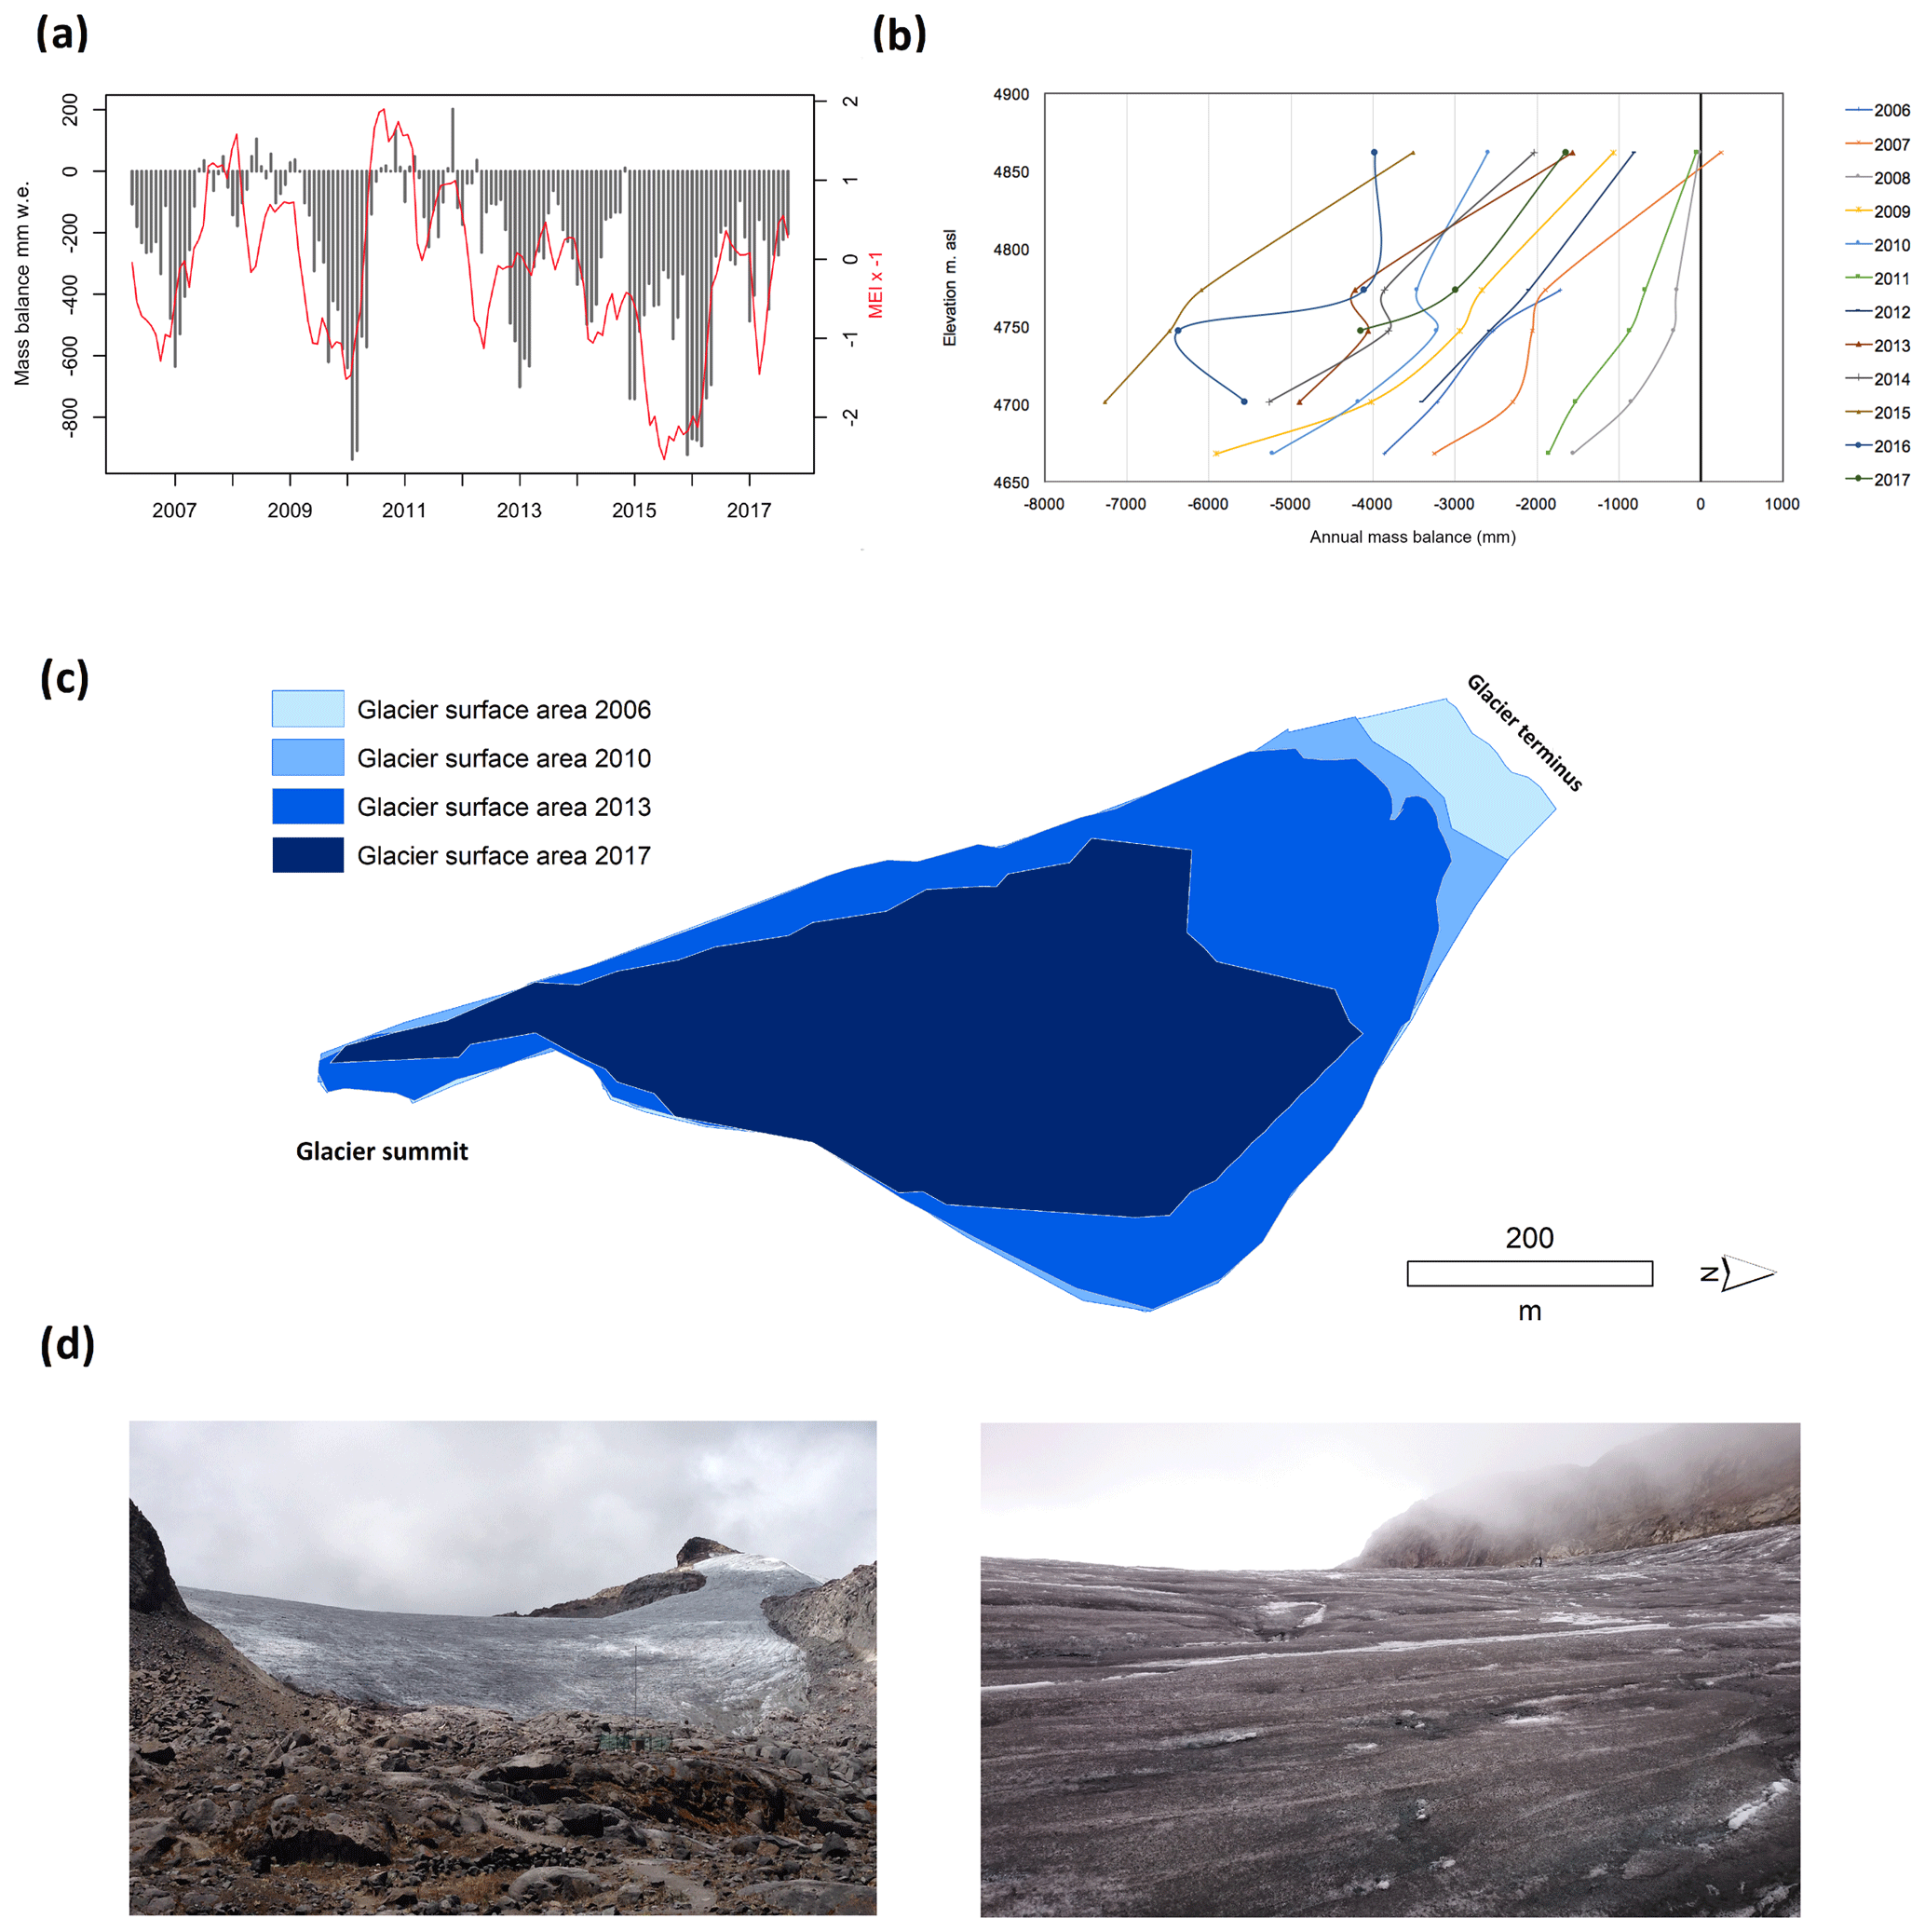
Figure 3Evolution of the Conejeras glacier: (a) monthly mass balance (mm w.e.) and Multivariate ENSO Index (not the inverted axis); (b) annual mass balance per altitudinal range; (c) extension of the glacier in hectares in 2006, 2010, 2013 and 2017. (d) Photographs of the glacier surface covered by volcanic ashes, taken in 2015 and 2016.
3.2 Glacier evolution data
The evolution of the Conejeras glacier (Fig. 3) has been monitored by the Department of Ecosystems of IDEAM. Since March 2006, a network of 14 stakes was installed on the Conejeras glacier to measure ablation and accumulation area. The 6–12 m long stakes are PVC pipes of 2 m in length. These 14 stakes are vertically inserted into the glacier at a depth not less than 5 m and they are roughly organized into six cross profiles at approximately 4670, 4700, 4750, 4780, 4830 and 4885 m a.s.l. Accumulation and ablation measurements are performed monthly. Typical measurements of the field surveys include stake readings (monthly), density measurement in snow and firn pits (once per year) and re-drilling of stakes (if required) to the former position. The entire methodology can be found in Mölg et al. (2017) and Rabatel et al. (2017). The mass balance data are calculated using the classical glaciological method that represents the water equivalent that a glacier gains or loses in a given time. These data are used to generate yearly mappings of mass balance and calculate the equilibrium line altitude (ELA), which is the altitude point where mass balance is equal to zero equivalent meters of water and separates the ablation and accumulation area in the glacier (Francou and Pouyaud, 2004).
Changes in glacier surface during the study period were computed by means of satellite imagery (Landsat and Sentinel constellations) for the years 2006, 2010, 2013 and 2017. Cloud-free cover Landsat TM images were selected for 2006 and 2010, and Landsat OLI and Sentinel images for 2013 and 2017 respectively. TOA (top of the atmosphere) reflectance was obtained using specific radiometric calibration coefficients for each image and sensor (Chander et al., 2009; Padró et al., 2017). BOA (bottom of the atmosphere) Reflectance was based on the dark object subtraction (DOS) approach (Chavez, 1988). The Normalized Difference Snow Index (NDSI) was used to discriminate snow and ice-covered areas from snow-free areas. The NDSI is expressed as the relationship between reflectance in the visible region and reflectance in the medium-infrared region (the specific bands vary among different sensors; e.g., TM bands 2 and 5). Pixels in the different images were classified as snow- or ice-covered areas when the NDSI was greater than 0.4 (Dozier, 1989).
3.3 Statistical analyses
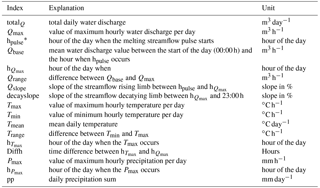
A number of indices were extracted from the streamflow, temperature and precipitation hourly series in order to assess changes in time in the hydrological output of the glacier and their relation to climate (Table 1). These daily indices were subject to statistical analyses, including correlation tests, monthly aggregation and assessment of changes over time.
Table 1Hydrologic and climatic indices computed from the hourly streamflow, temperature and precipitation series. * hpulse is computed as the hourly equivalent of the melting–runoff spring pulse proposed by Cayan et al. (2001) for daily data, i.e., the time of the day when the minimum cumulative streamflow anomaly occurs, which is equivalent to finding the hour after which most flows are greater than the daily average.
Since one of the main objectives of the paper is to characterize daily dynamics of streamflow and changes in time, a principal component analysis (PCA) was conducted in order to extract the main patterns of daily streamflow cycles. The data matrix for the PCA was then composed by streamflow hourly values in 1614 columns as variables (number of days) and 24 rows as cases (hours in a day). As the PCA does not allow the number of variables to exceed the number of cases, PCAs were performed on 25 bootstrapped random samples of days (n=23, with replacement); results showed that three principal components were stable throughout the samples (see Table 3 in Results sections). After the main PCs were extracted, calculation of correlation between each day of the time series and the selected PCs was determined. The PC that best correlated with the correspondent day was assigned to every day, obtaining a time series of the three PCs. This allowed assessment of changes in time of the main patterns of daily streamflow cycles observed.
4.1 Climatology and glacier evolution
The long-term climatic evolution of the study area is depicted in Fig. 2. The temperature and precipitation series (Fig. 2a, c, d) correspond to the Brisas meteorological station, which is located 25 km from the glacier, at 2721 m elevation. It therefore does not accurately represent the climate conditions at the glacier. It is, however, the closest meteorological station with available meteorological data to study long-term climate. The temperature record measured at the glacier snout (blue line) is included. It can be observed that despite the different range of values (temperatures at the glacier are 3.2 ∘C lower than at Brisas), there is a match in variability for the common period.
Long-term evolution of temperature does not show any significant trend or pattern from 1982 to 2015; however, a spectral analysis shows that the frequency with higher spectral density corresponds with a seasonality of 48 months, indicating a recurrent cycle every 4 years. By comparing Fig. 2a with Fig. 2b, there is a close match between temperature and evolution of the Multivariate ENSO Index (R=0.49), which also shows a high value of power spectra in the 48-month frequency cycle. Notwithstanding other factors whose analysis is far beyond the scope of this paper, it is evident that the evolution of temperature in the study area is highly driven by the ENSO phenomenon. Regarding precipitation (Fig. 2c), no long-term trend is observed, and the most evident pattern is the bi-modal seasonal regime, which is confirmed by the frequency analysis showing the highest power spectra in the 6-month cycle.
The evolution of the glacier since 2006 is shown in Fig. 3. Almost every month since measurements began in 2006, the glacier has lost mass (113 months), and very few months (20) recorded a positive mass balance. The global balance in this period is a loss of 34.4 m of water equivalent. For the sake of visual comparison, we have included the time series of MEI, and a close correspondence between the variables is observed (Fig. 3a). During the warm phases of ENSO (Niño events, values of MEI above 0.5), the glacier loses up to 600 mm w.e. per month, as in the Niño event of 2009–2010, when the glacier lost a total of 7000 mm w.e. One could surmise that during La Niña (cold phases of ENSO, MEI values < −0.5) the glacier could recuperate mass. In fact, when MEI values are negative, the glacier experiences much less decrease; however, even during the strongest La Niña events, the balance is negative, with just a few months having a positive balance (e.g., in the 2010–2011 La Niña, the glacier lost 1000 mm w.e.). This occurs because even during La Niña mean temperatures at the glacier are above zero (0.8±0.3 ∘C). The aforementioned agreement between ENSO and mass balance appears to break from 2012 onwards. There were two events of large mass balance loss around 2013–2014 that do not match with El Niño events. A local factor that can affect the glacier's mass balance independent of climatology is reduced albedo of the surface caused by the quantity of deposited ash that comes from the nearby Santa Isabel volcano. This variable has not been considered in the present study but there are two pictures of the glacier for visual evidence (Fig. 3d). This fact, together with prevalence of above-zero degrees at the elevation in which the glacier is located (see Fig. 2, top plot) has induced the large glacier recession observed between 2006 and 2017 (Fig. 3c). During this period, there has been a 37 % reduction, from 22.45 ha in 2006 to 12 ha in 2017. However, this reduction has been far from linear. As shown in Fig. 3b, mass balance losses during the first years of the monitoring period were, in general, less pronounced than in the latest years. In 2012, the ice mass retreated up the 4700 m elevation curve, and from then on the years with larger mass loss were 2015, 2016 and 2014.
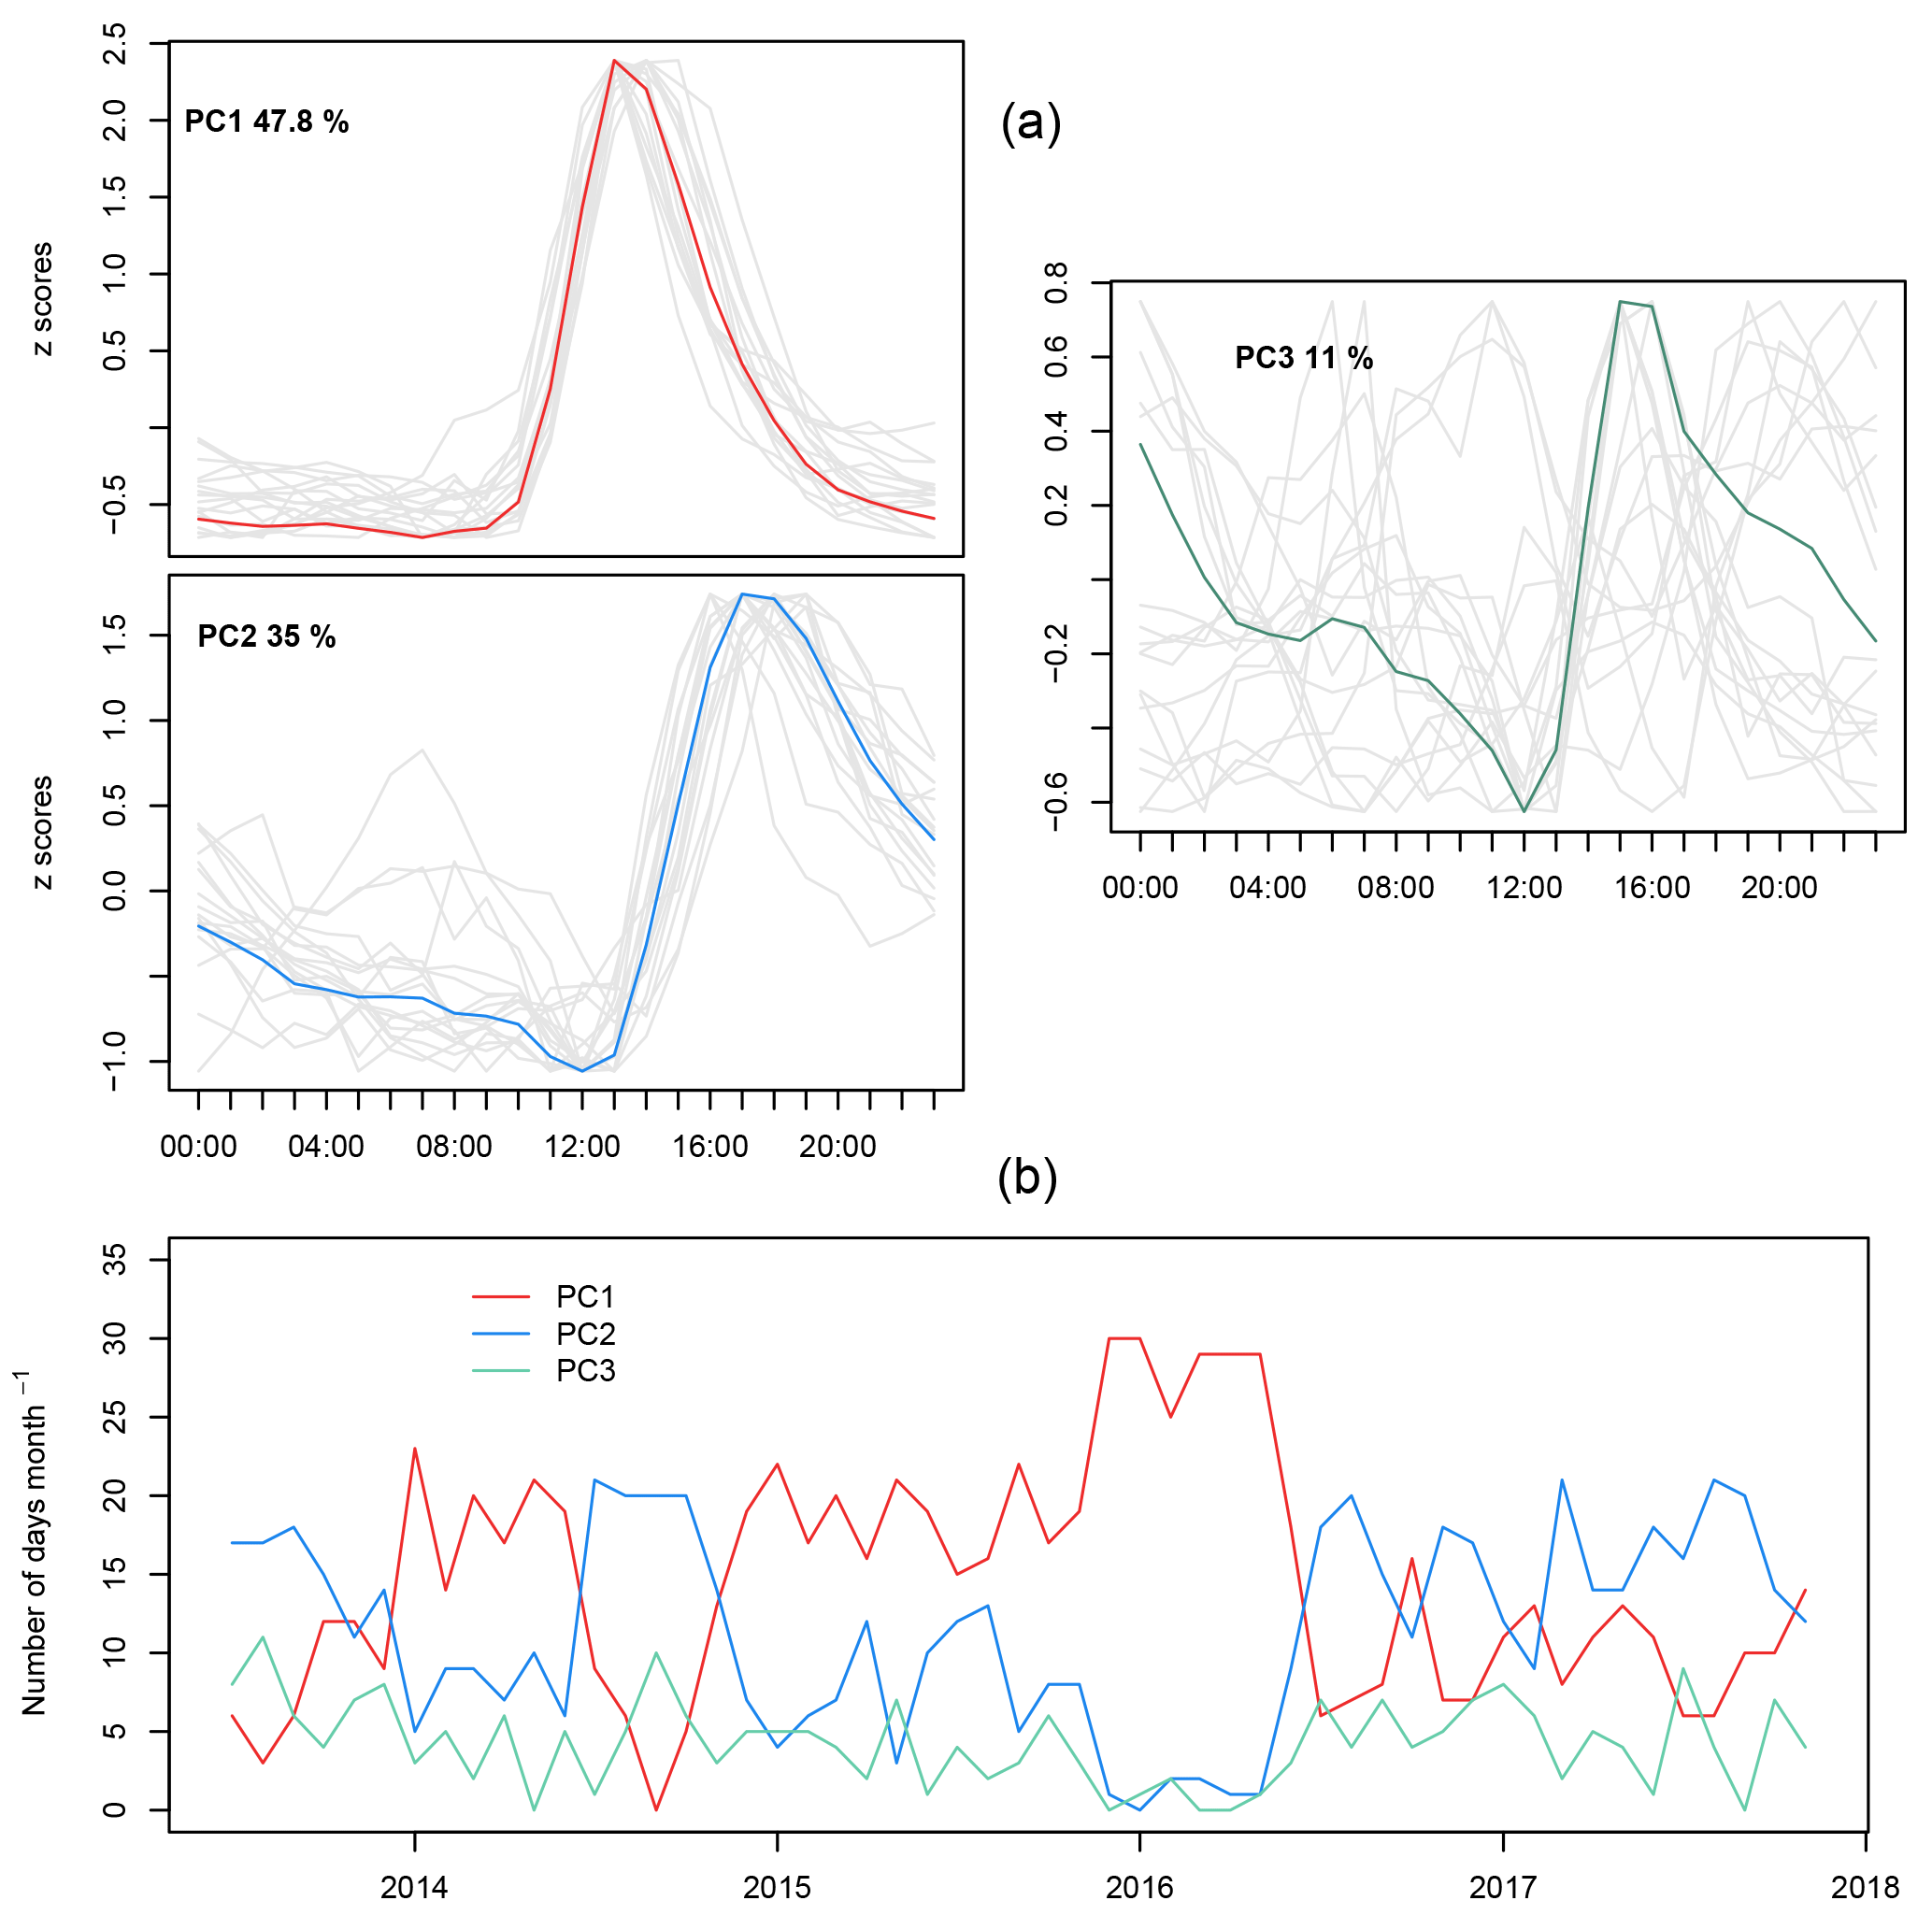
Figure 4Principal component analysis on hourly streamflow: (a) scores of the three main principal components (patterns of daily streamflow), with gray lines indicating the scores for each one of the 25 bootstrapped samples in the recursive PCA, and colored lines indicating the average. (b) Evolution of the number of days per month that show maximum correlation with each PC. Red corresponds to PC1, blue corresponds to PC2 and green corresponds to PC3.
Table 2Pearson correlation coefficient between daily hydrological indices and temperature for days with and without precipitation (left) and for days without precipitation (right) between July 2013 and June 2017. The correlation values correspond to the average obtained by 100 resampling iterations (n=99) of the correlation test. The symbols * and indicate that correlations are significant at 95 % and 99 % confidence respectively (two-tailed test).
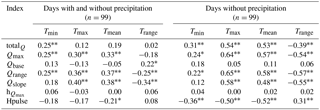
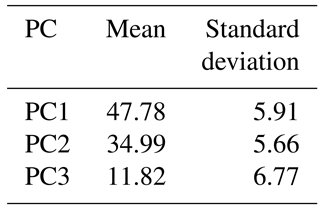
Table 3Mean and standard deviation of variance explained (%) by each PC throughout the 25 bootstrapped samples.
4.2 Hydrological dynamics
The water discharge of the Conejeras glacier is measured at a gauging station located 300 m from the glacier snout (when the station was installed in 2009, it was only 10 m away from the glacier snout). The water volume measured at this station is a combination of water from glacier melt and water from precipitation into the watershed area, although the former exerts a larger control in water discharge variability. Table 2 shows the correlation between hydrological and temperature indices for samples of days with precipitation, independent of the amount of fallen precipitation (left), and for samples of days without precipitation (right). On days without precipitation, most hydrological indices show significant correlation with temperature, except for the baseflow and h. The highest correlation values are found between Qmax, Qrange, Qslope and totalQ, with Tmax and Tmean (correlation values in the range of 0.5–0.65) indicating that the higher the temperatures, the more prominent the melting pulse of runoff. Tmin shows smaller and less significant correlation values. The hpulse also shows high correlation with temperature, but in this case in a negative fashion, indicating a later occurrence of the daily melting pulse when minimum temperatures and maximum temperatures are lower. On days with precipitation, correlation values are generally smaller, but in some cases they are still significant, such as those for Qmax, Qrange and Qslope.
A PCA performed on hourly streamflow data (in a recursive fashion; see Sect. 3.3 for explanation of the method) allowed procurement of the main patterns of daily flow, as well as changes in time during the study period. Three principal components were obtained, whose values of explained variance were stable throughout the 25 bootstrapped samples (Table 3). The first PC explained an average of 48±6 % of the variance throughout the 25 samples, and the second PC an average of 35±5.7 %. Together they account for 83 % of variance and they both showed a neat pattern of daily streamflows (Fig. 4a). The main difference between PC1 and PC2 is the time of the day when peak flows are reached and, hence, the time range when most daily flows occur. Thus, PC1 corresponds to days with an earlier melt pulse (towards 10:00 LT) and earlier peak flows (towards 14:00 LT), compared to PC2, with days of melt pulse at 13:00 LT and peak flows at 18:00 LT. The remaining PC explains a residual percentage of the variance and, unlike PC1 and PC2, does not show a stable streamflow pattern across the samples. However, it was decided to keep it, as it can help explain some peculiarities in the results. In Fig. 4b the evolution of the frequency (days per month) of days corresponding to each PC is shown. Although there is some degree of variability, the frequency of days with PC1 streamflow pattern increases over time and dominates over the frequency of PC2 and PC3 days. This is especially significant between 2015 and 2016, coinciding with an El Niño event. However, by mid-2016 the frequency of PC1 days drops considerably and the frequency of PC2 days increases at the same ratio. Thus, from mid-2016 to the end of the study period, they both maintain similar levels of frequency.
In order to understand the underlying factors of each PC, the frequency distribution of the climatic and hydrological indices for the days corresponding to each PC was computed, in the form of box plots (Fig. 5). From a hydrological point of view, PC1 better corresponds to days with higher total runoff and maximum runoff, and with a more pronounced slope in both the rising and decreasing limbs of the peak flow volume than PC2 and PC3. The variability (expressed by the amplitude of boxes in the box plots) of such hydrological indicators is, as well, higher amongst days of PC1, compared to days of PC2 and PC3. Base runoff is higher in PC1 but not significantly. The contrasted weight of climate may explain such hydrological differences between PCs: days of PC1 present significantly higher mean temperature (median = 1.7 ∘C) and maximum temperature (median = 3.8 ∘C) than days of PC2 (0.9 and 2.4 ∘C respectively) and PC3 (0.5 and 1.6 ∘C respectively). In contrast, precipitation is notably higher (and shows greater variability) in days grouped within PC3 (median = 1.9 mm day−1) and PC2 (2.2 mm day−1) compared to days of PC1 (0.3 mm day−1). To summarize, PC1 corresponds to a daily regimen of pure glacier melting, whereas PC2 and PC3 correspond to days with a lower glacier melting pulse with more (PC3) or less (PC2) influence of precipitation.
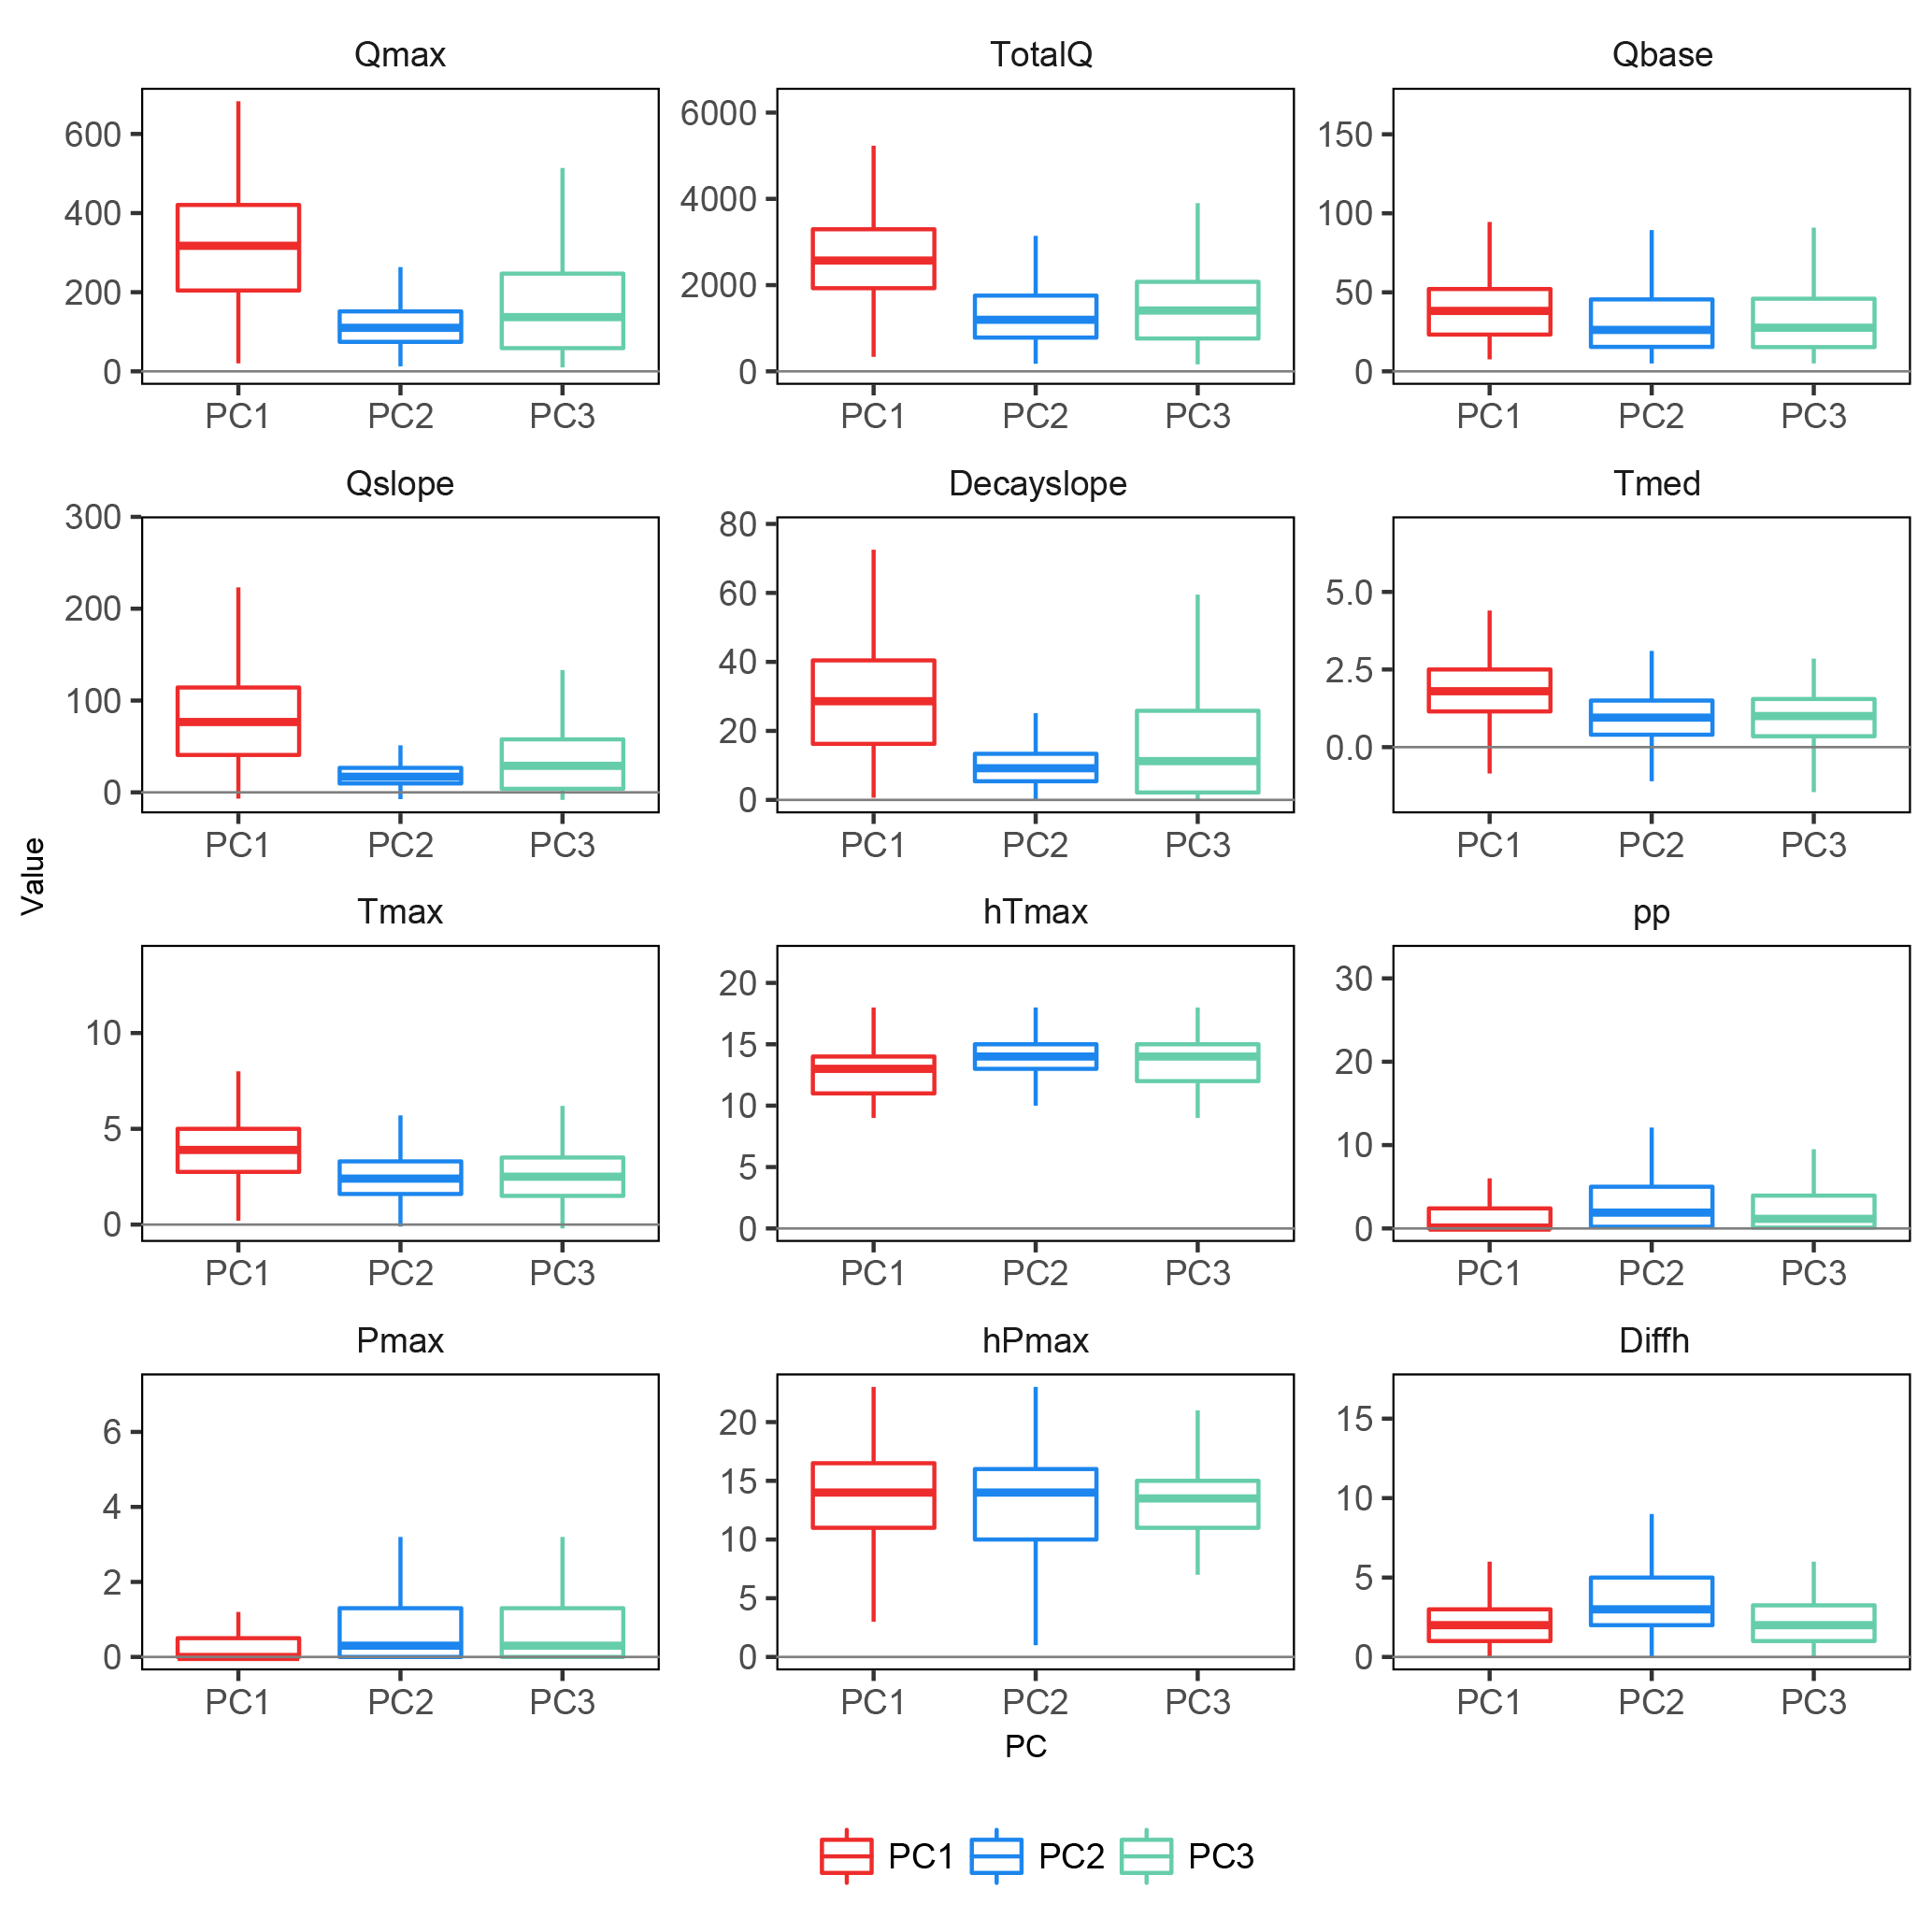
Figure 5Summary of the frequency distributions (box plots) of the hydrological and meteorological indicators for days grouped within PC1, PC2 and PC3.
In Fig. 4, a notable change occurs in the frequency of the two main patterns of hourly streamflow, PC1 and PC2, by mid-2016. Further details regarding changes in the hydrological yield of the glacier are shown in Fig. 6, which presents the evolution of the main hydrological indices computed, along with temperature, precipitation and glacier mass balance during the study period and averaged monthly. Total and maximum daily streamflow (totalQ and Qmax) depict an increase up to mid-2016, where they begin to decrease. During the last 18 months, they remain at low levels compared to previous months. This turning point seems to coincide in time with the 2015–2016 El Niño event, with higher-than-average temperatures and low levels of precipitation that led to an increasing mass balance loss and, therefore, increased flows. It is remarkable that streamflow increases and decreases in direct proportion to mass balance change, indicating the strong dependence of runoff to glacier melt. Similar evolution is observed in the difference between base flows and maximum flows (Qrange), as well as the slope of the rising limb of diurnal flows (Qslope), which are indicators of diurnal variability: they increase up to 2016 and decrease afterwards, which coincides with the change in the frequency of daily streamflow patterns in Fig. 6. The mean hour of the day at which maximum flows are reached (h) shows a steady evolution until mid-2016, when it begins to rise. This seems surprising when comparing it to the evolution of h (i.e., the hour of the day when maximum temperature is reached), which does not show any particular temporal pattern. Regarding the monthly variability of flows (third panel on the right, Fig. 6) the same turning point is observed, with a clear decrease in the coefficient of variation until 2016 and an increase afterwards. It is clear that a hydrological change has occurred at the outlet of the glacier, but the two most plausible drivers of change (temperature and precipitation, bottom plots of Fig. 6) do not seem to be responsible for it. They both are affected by the El Niño event, when temperatures increased and precipitation decreased; however, they do not show an increasing–decreasing temporal pattern before and after such an event. This leads to the hypothesis that the hydrological change observed at these last stages of the glacier's life is independent of climate.
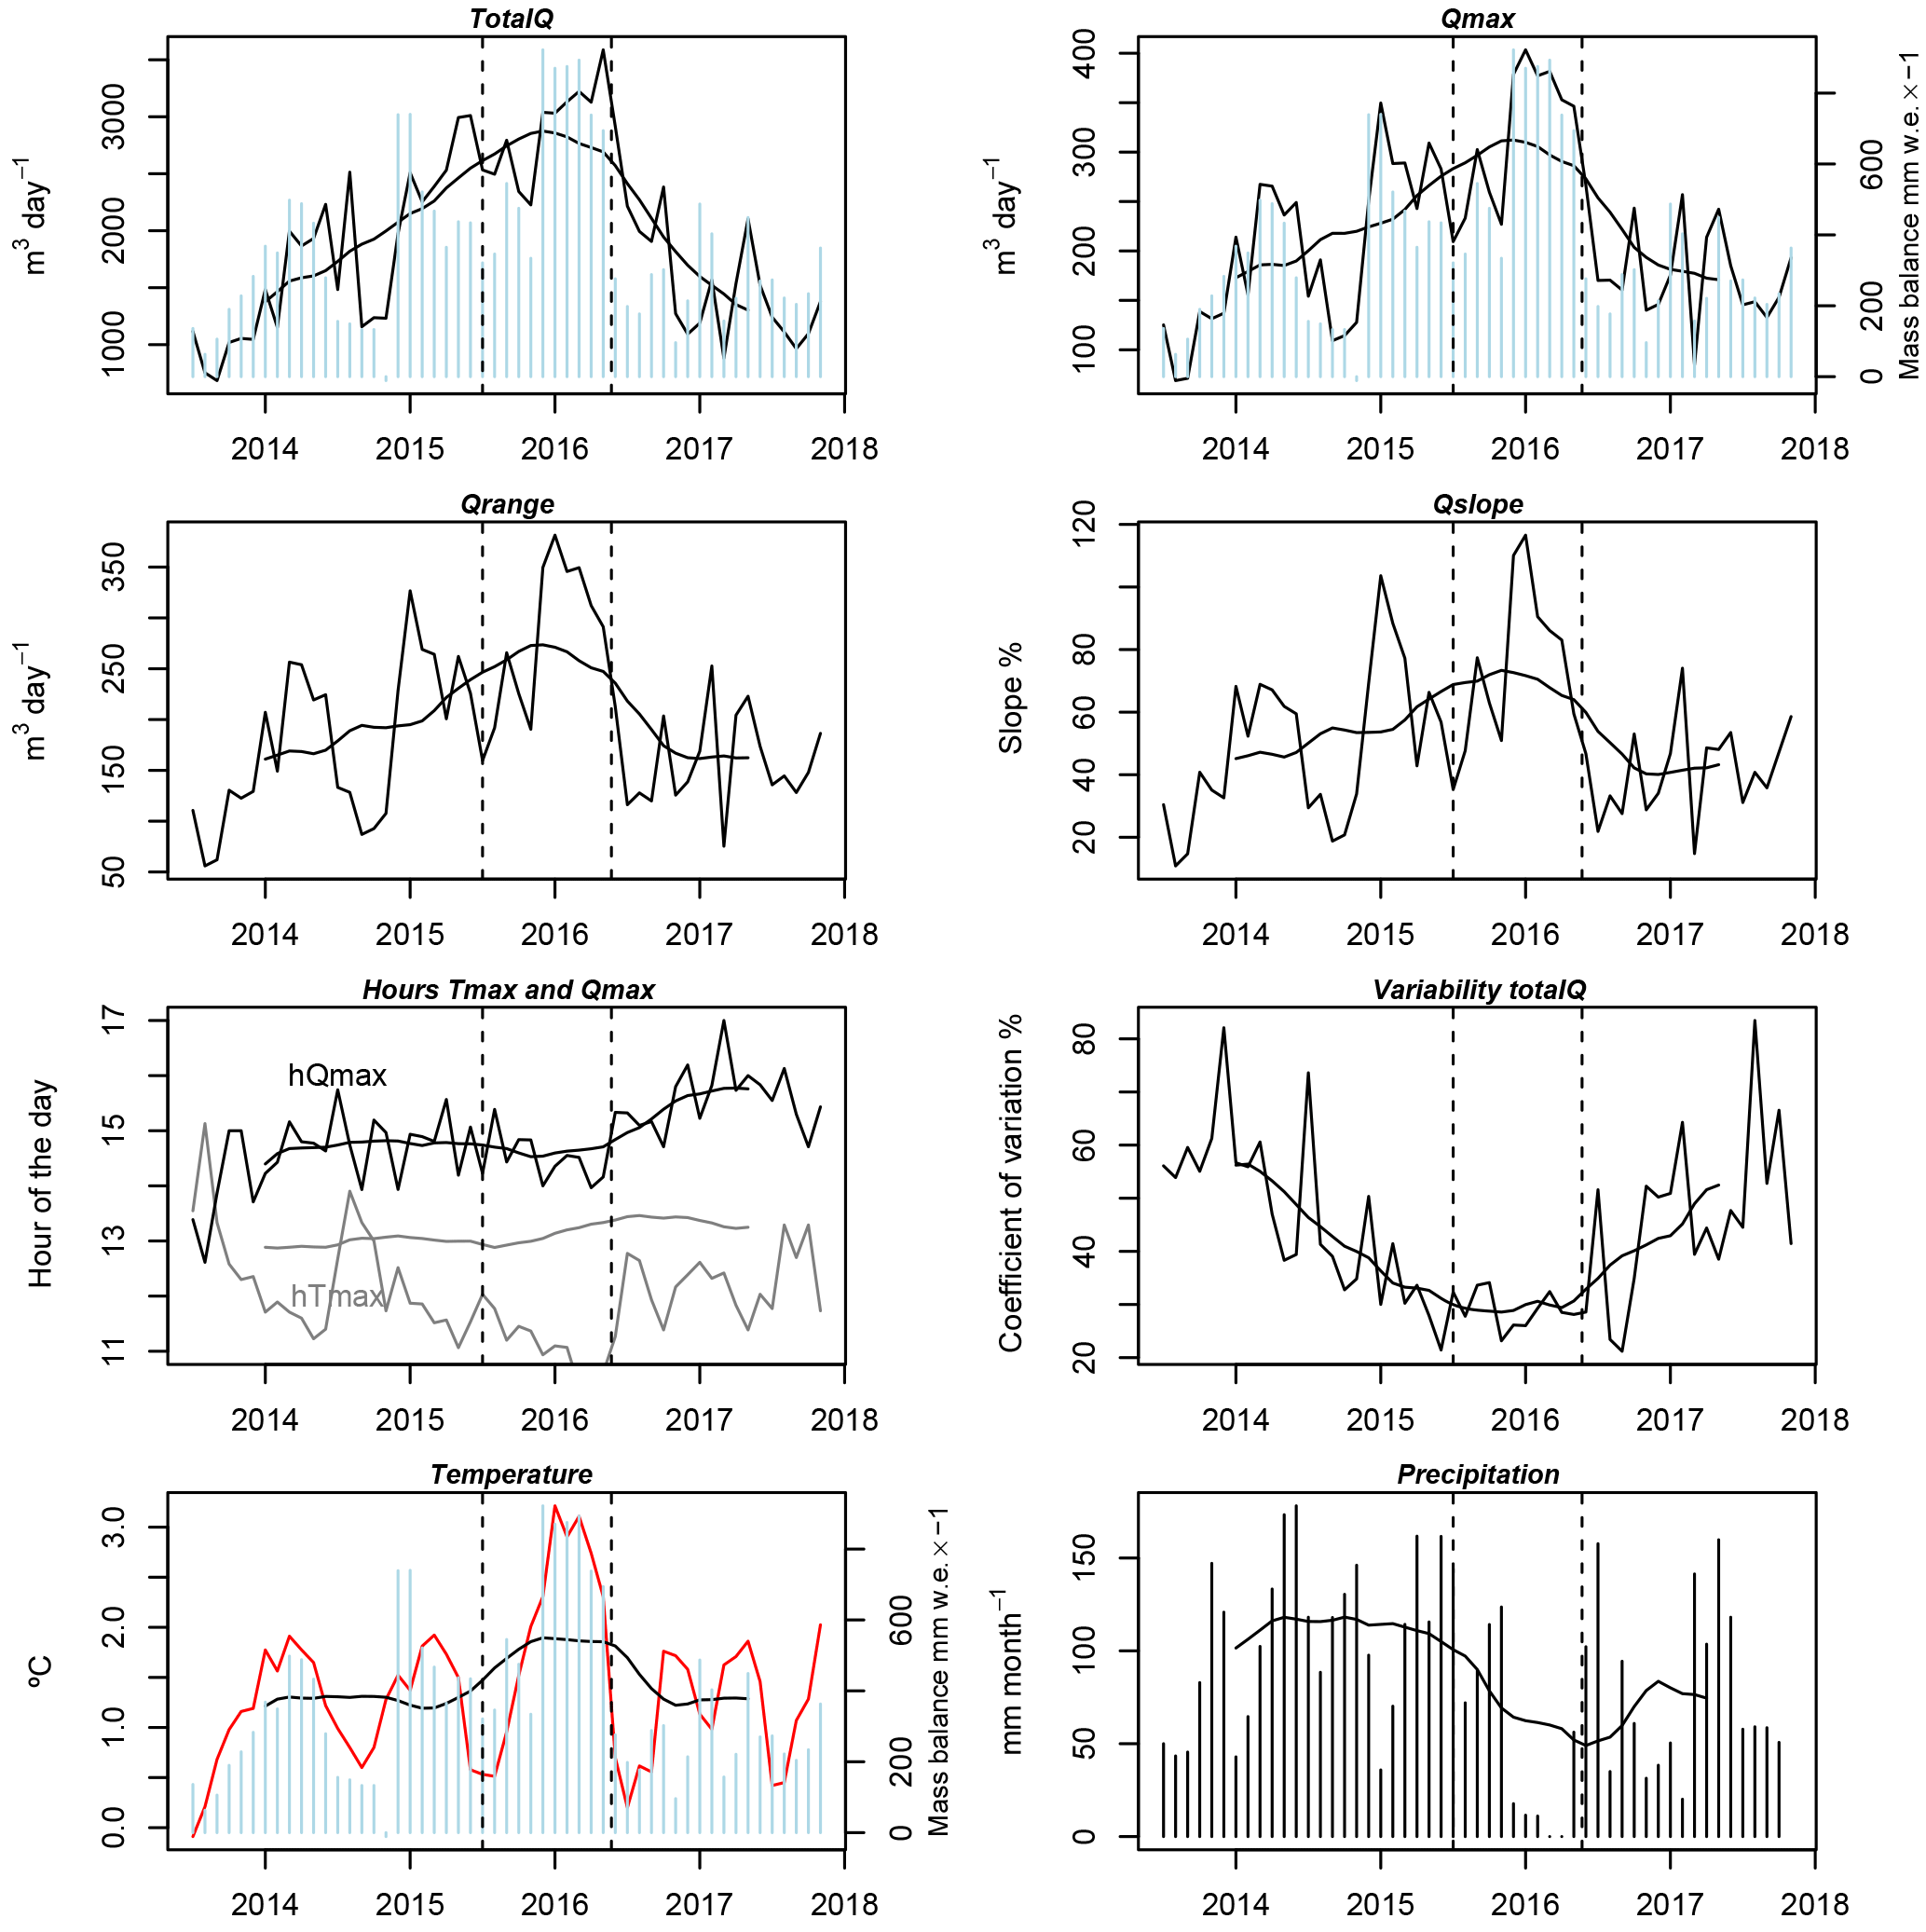
Figure 6Evolution of monthly averaged hydrological indices, temperature, precipitation and glacier mass balance (in blue bars), for the study period. Dashed lines indicate the 2015–2016 strong El Niño event. The 12-month window moving averages (black smooth lines) are shown to represent trends.
4.3 Changes in the runoff–climate relationship
In this section, the runoff is isolated from temperature and precipitation in order to determine if observed hydrological dynamics are driven by climate or are related to shrinkage of the glacier. Figure 7 shows the mean monthly runoff for days with temperatures lower and higher than 2 ∘C, i.e., water discharge series independent of temperature. Precipitation has also been added to the plot. It was noted that water discharge for days warmer than 2 ∘C is significantly higher than water discharge on days cooler than 2 ∘C. The characteristic evolution of runoff, with increasing amounts during most of the study period up to mid-2016 and decreasing runoff from that point onwards, was also observed. The same evolution occurs for both days below and days above 2 ∘C, and it occurs for very similar amounts of precipitation. This indicates that flows from the melting glacier are becoming less dependent on temperature, or climate in general, and more dependent on the size of the glacier. The box plots of Fig. 8 (bottom) confirm this observation by showing water volumes significantly higher before than after the breaking point, but also because the differences between water discharge at < 2 ∘C and water discharge at > 2 ∘C are also smaller (and not significant) after the breaking point, indicating the decreasing importance of temperature in the process of runoff production in the shrinking glacier.
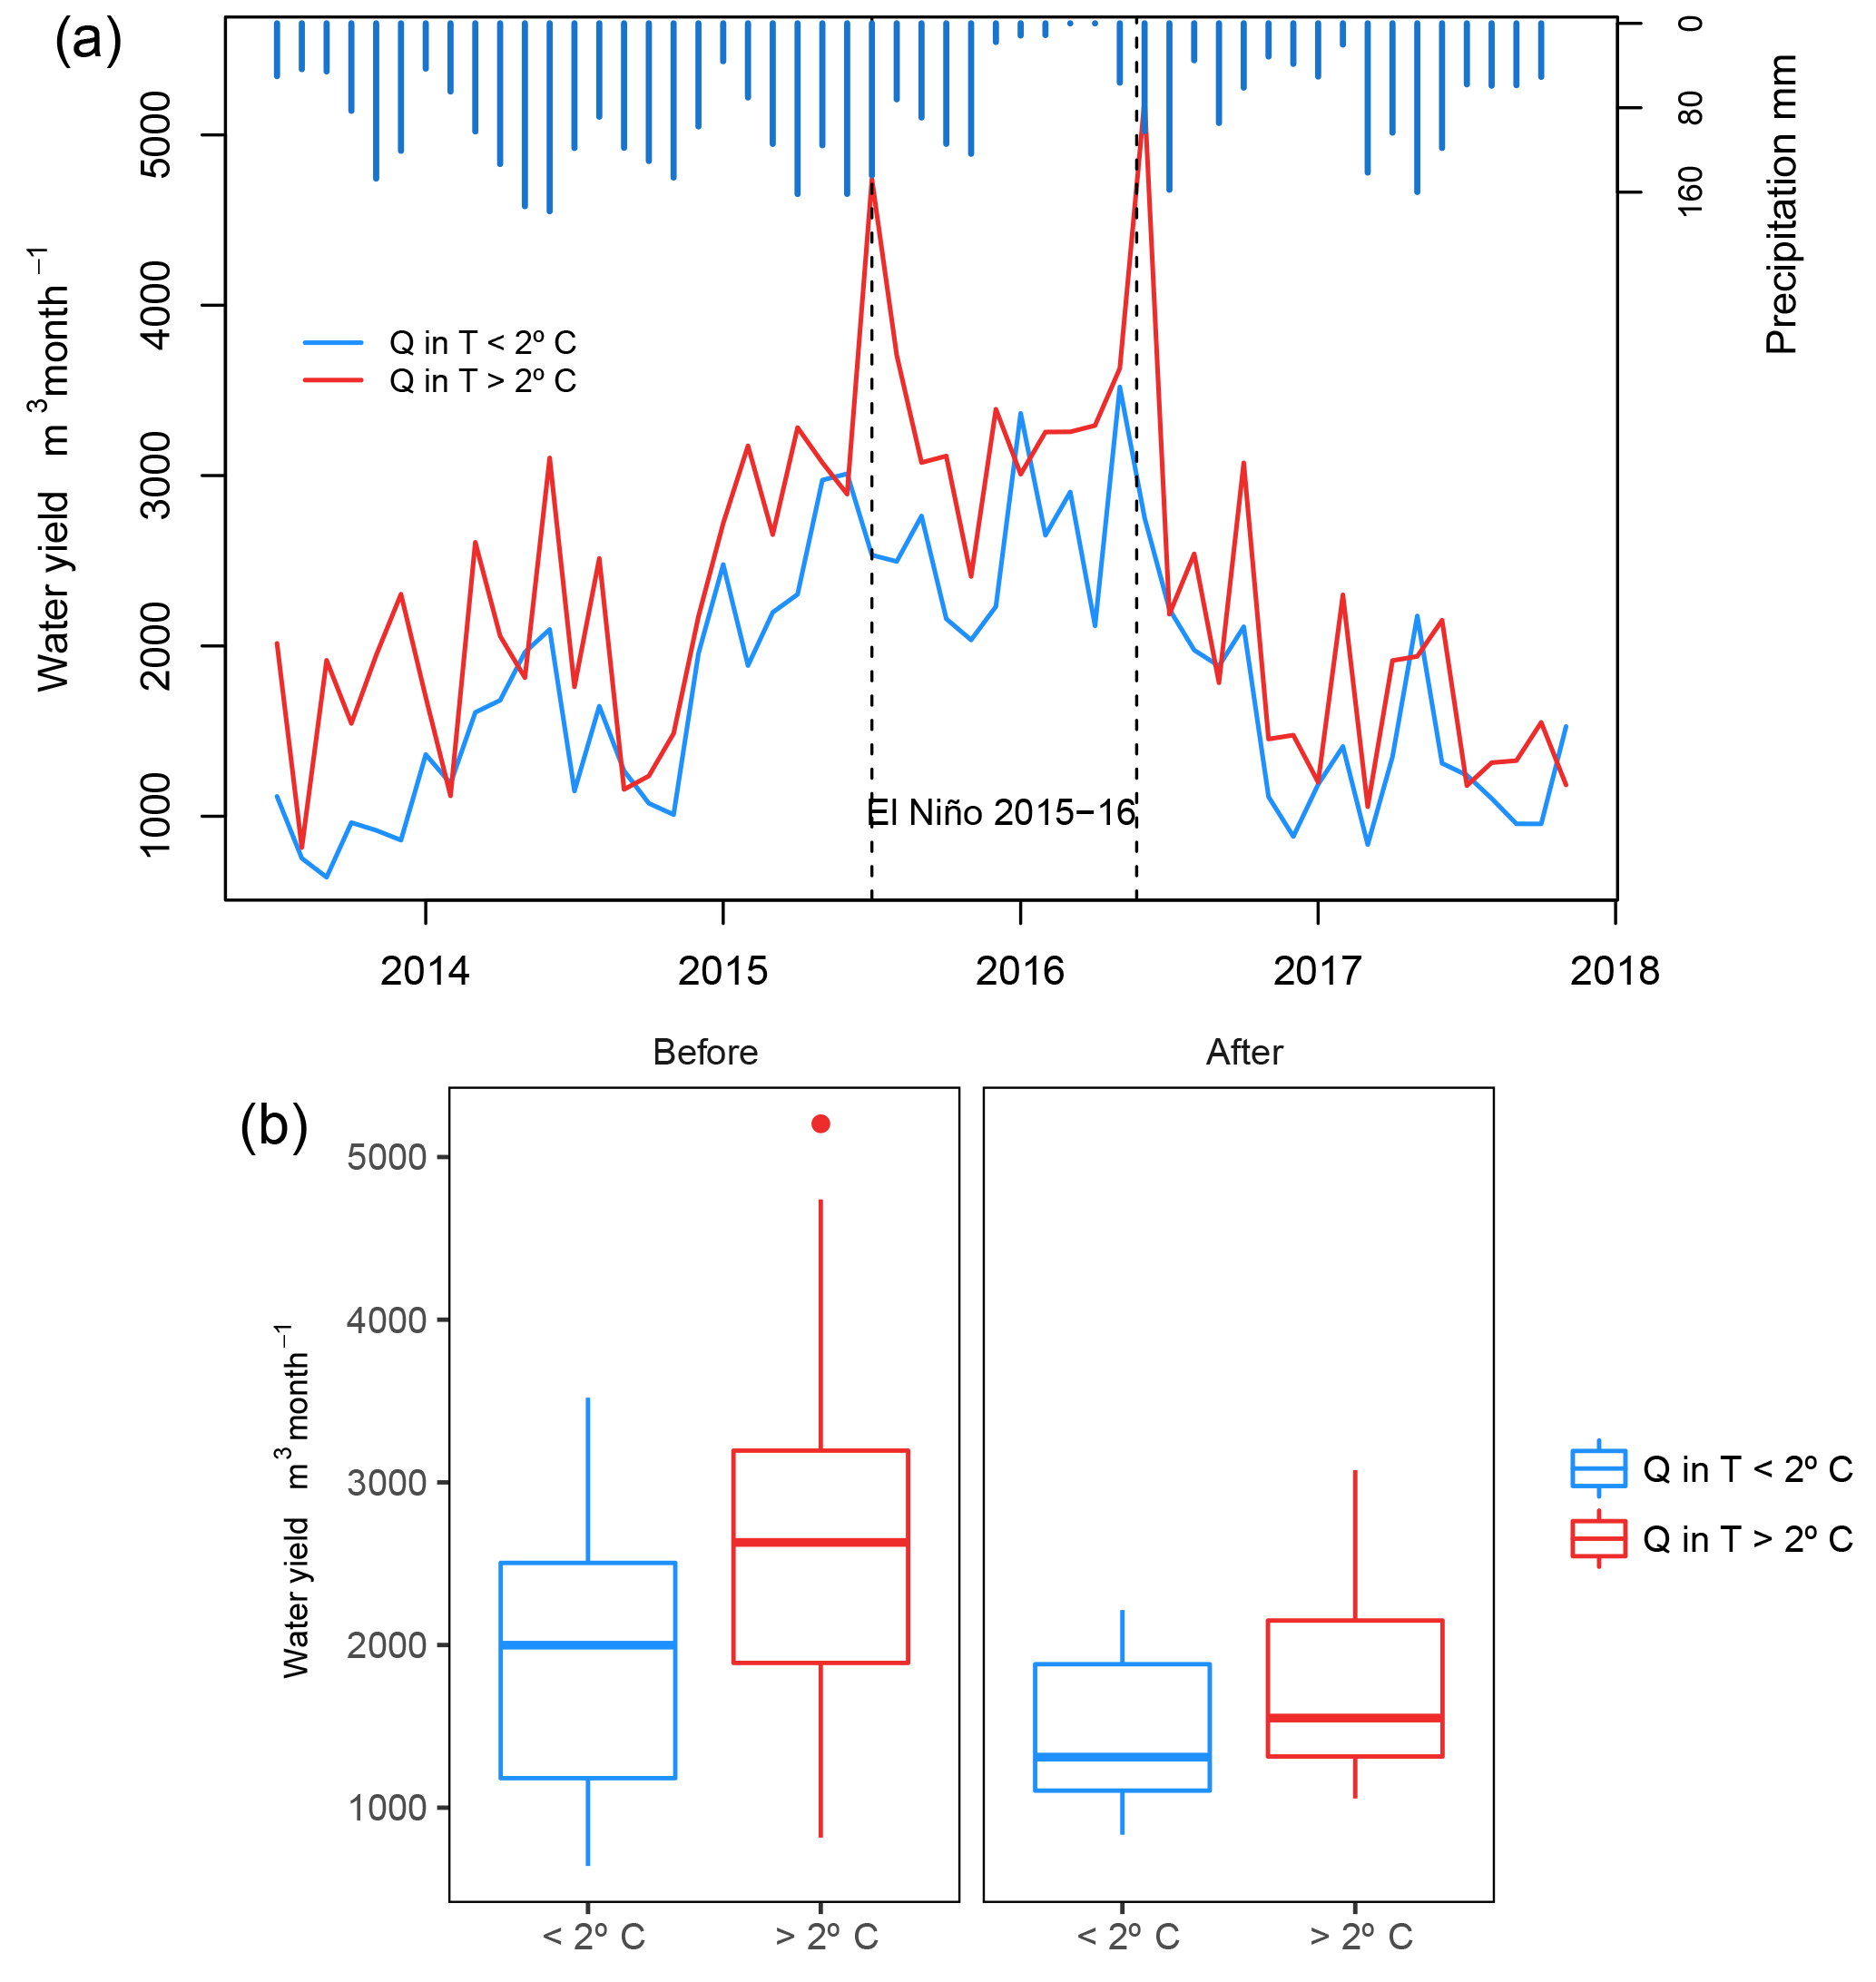
Figure 7Mean monthly water discharge (Q), for days with temperature lower than 2 ∘C (blue) and days with temperature higher than 2 ∘C (red): (a) interannual evolution with indication of El Niño 2015–2016 event (grey shading), breakpoint in water discharge evolution (dashed line) and monthly precipitation (blue bars); (b) comparative box plots for water discharge before and after breakpoint in May 2016.
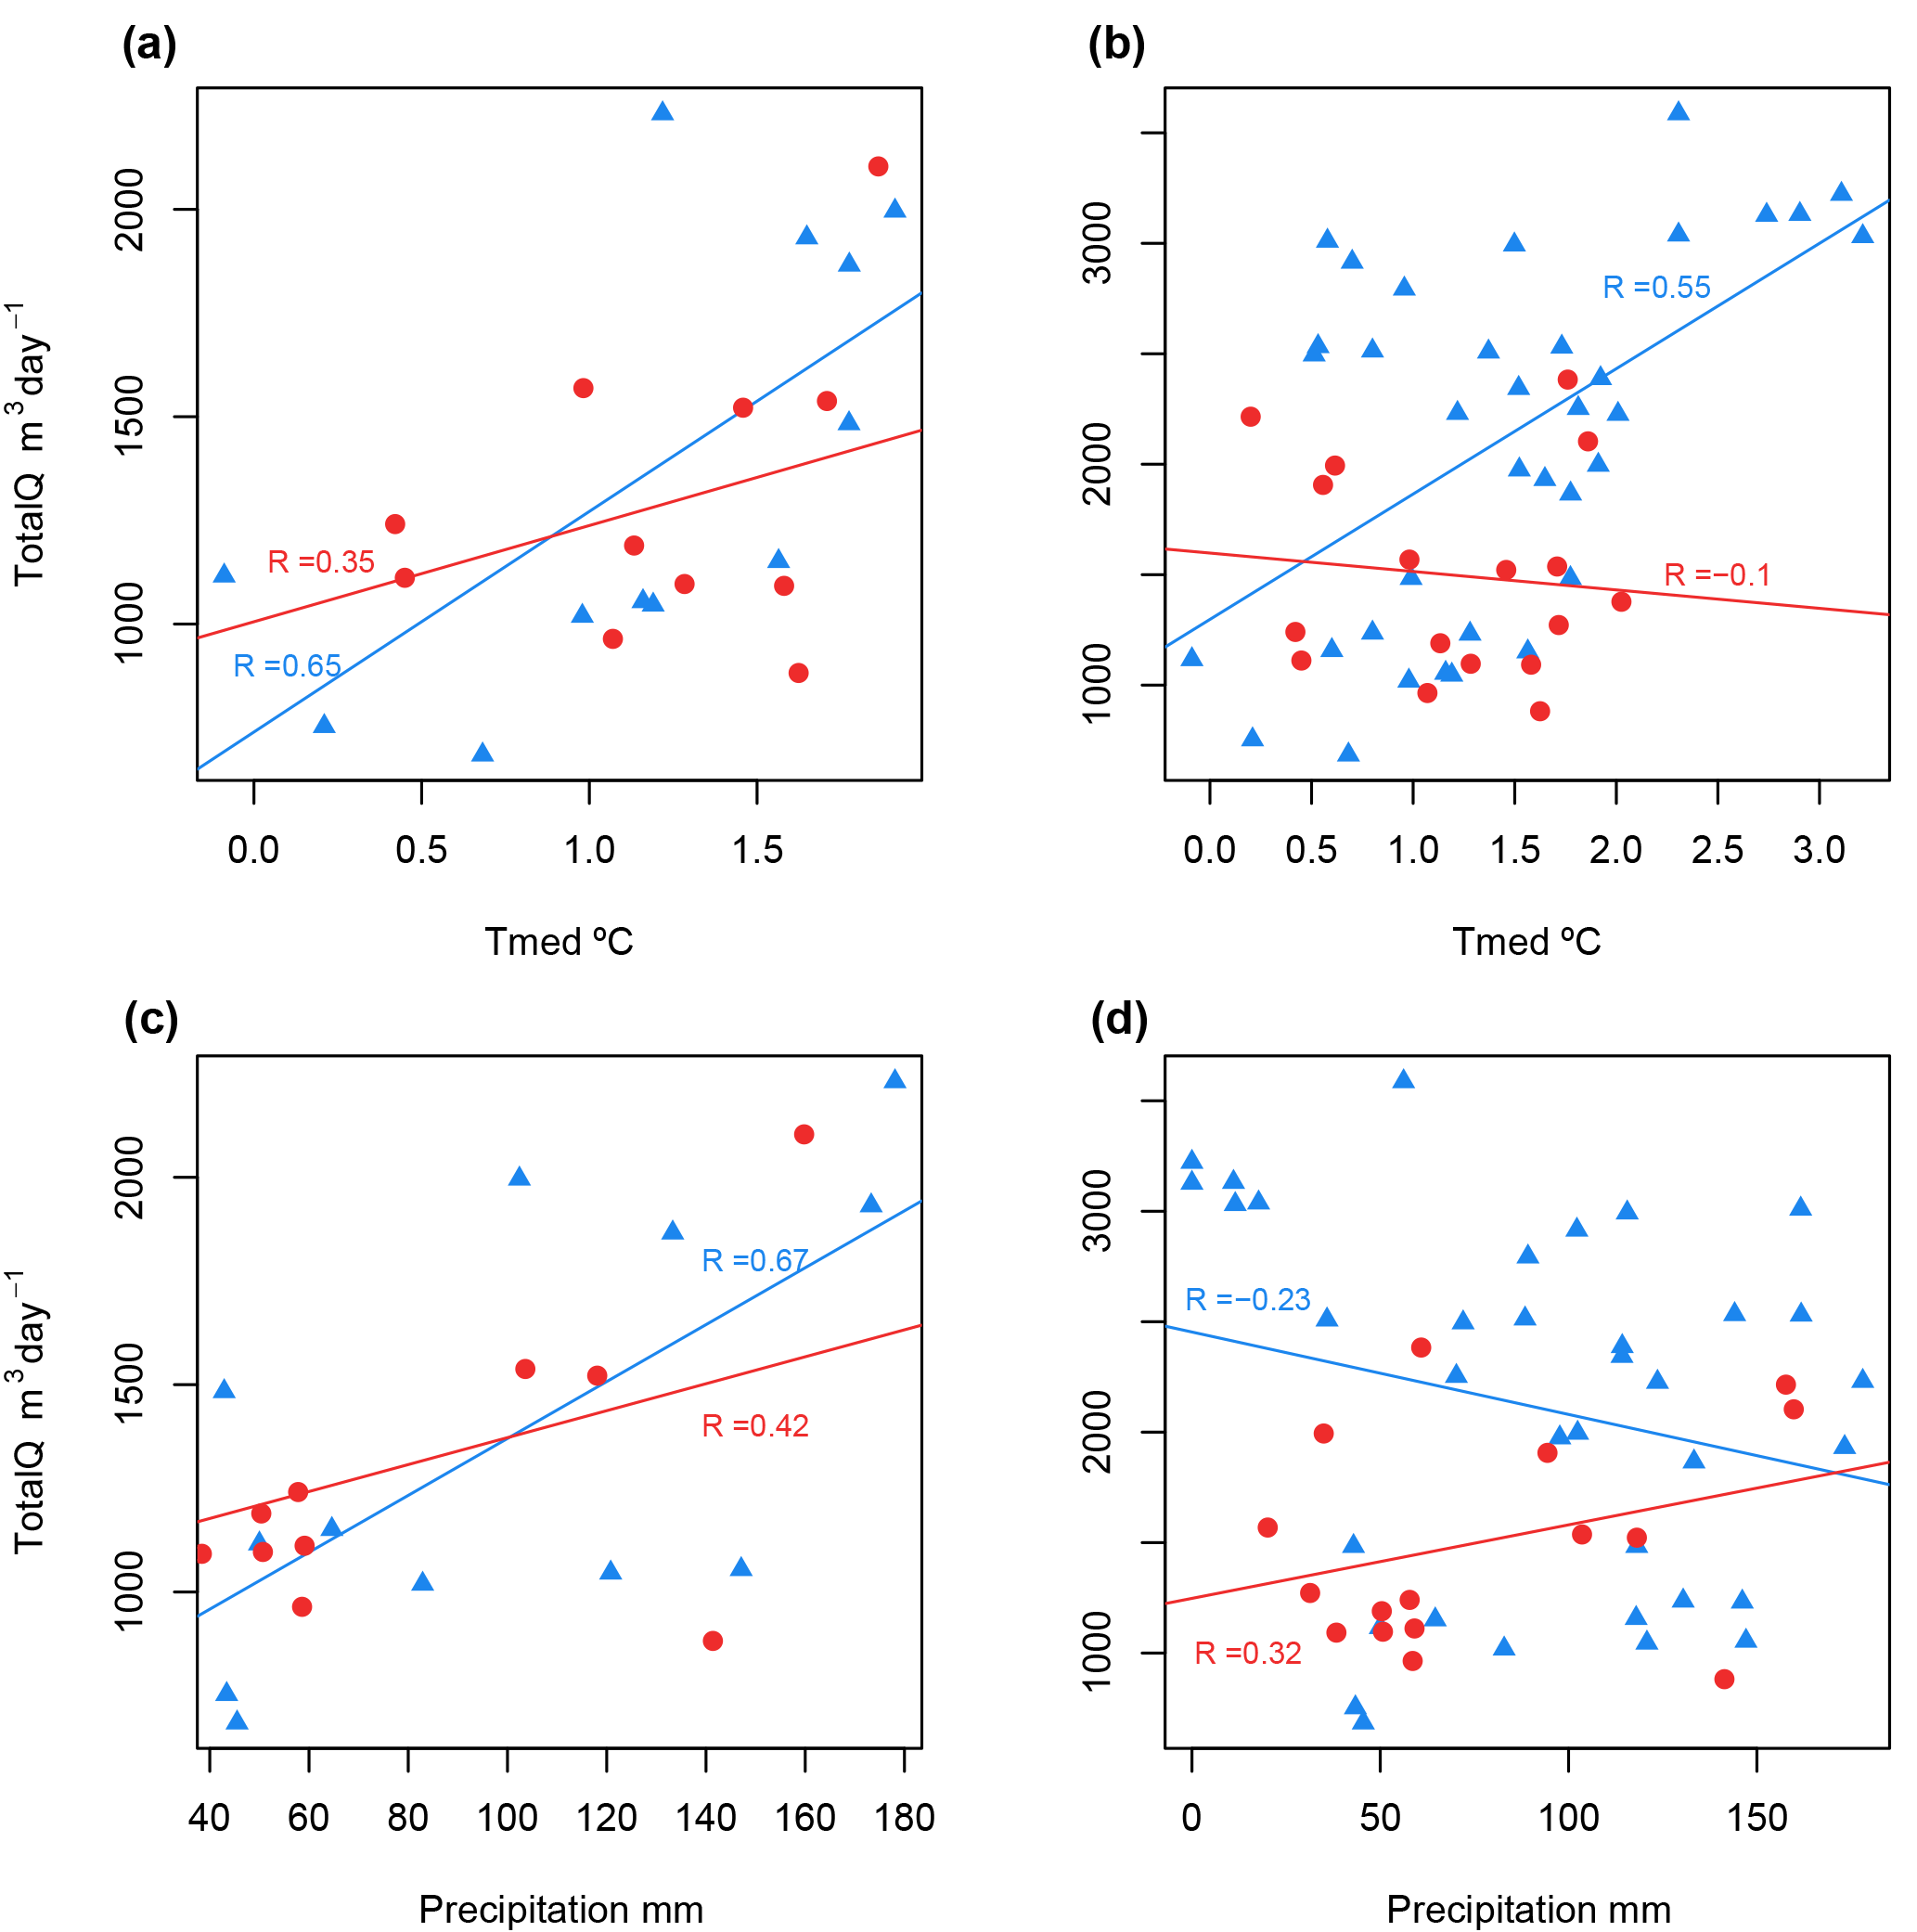
Figure 8Correlations between monthly flow and monthly temperature (a, b) and precipitation (c, d) for (a, c) 2013–2014 (blue triangles) and 2017 (red circles), which are considered as analogues in terms of amounts of flow, and (b, d) months before the May 2016 breakpoint (blue triangles) and months after May 2016 breakpoint (red circles).
Finally, Fig. 8 shows correlations between temperature–precipitation and monthly flows for different time periods. In Fig. 8a, two years are compared that can be considered analogues in terms of total flow (similar amounts of monthly flow; see Fig. 6), but one year (2013–2014) belongs to the period of increasing flows, before the 2016 breakpoint, and the other year (2017) belongs to the period of decreasing flows after the breakpoint. Correlation between temperature and flow is much higher (R=0.65) for 2013–2014 than for 2017 (R=0.35), which would corroborate the previous observation. However, precipitation also shows higher correlation with flow for 2013–2014 (R=0.67) than for 2017 (R=0.42), which would contradict the hypothesis. One year, however, may not be representative of general trends, and so the same analysis is repeated, not for individual years but for the whole periods pre- and post-2016 breakpoint (Fig. 8b). The pattern seems more clear and corroborates the aforementioned hypothesis: correlation between temperature and flow is significant for the pre-2016 period (R=0.55) but is nonexistent for the post-2016 period (). Correlation between precipitation and flow is insignificant () for the pre-2016 period, and it is positive and significant for the post-2016 period (R=0.32). These previous observations lead to reasoning that during the years of hydrological monitoring (2013–2017), the observed hydrological dynamic, with a marked breakpoint in 2016, is a result of the vanishing glacier process and not a response to climate variability.
The present paper shows a comprehensive analysis of the dynamics of an Andean glacier that is close to extinction, with special focus on its hydrological yield. This research has benefited from a hydro-climatic monitoring network located in the surroundings of the glacier terminus that has been fully operative since 2013 and from monthly and annual estimations of mass balance and glacier extent respectively, derived from ice depth measurements and topographical surveys since 2006. Everything has been managed by the Institute of Hydrology Meteorology and Environmental Studies (IDEAM) of Colombia. The Conejeras glacier is currently an isolated small glacier that used to be part of a larger ice body called Nevado de Santa Isabel. Since measurements have been available, the glacier has constantly lost mass and, consequently, a reduction in its area is evident. The extinction of Colombian glaciers has been documented since 1850, with an average loss of 90 % of their area, considering current values (IDEAM, 2012). This reduction, of about 3 % per year, has been much larger during the last 3 decades (57 %) compared to previous decades (23 %), which is directly related to the general increase in temperatures in the region and to re-activation of volcanic activity (IDEAM, 2012; Rabatel et al., 2017). Since direct measurements began in 2006, the glacier studied has constantly lost area; however, until 2014, the area loss was gradual and restricted to the glacier front; from 2014, the sharp retreat also involved higher parts of the glacier. The main reason for this strong shrinkage is the existence of above-zero temperatures during most of the year and less precipitation fallen as snow. This involves a constant migration of the equilibrium line to higher positions, and decreasing albedo of the ice surface that involves greater energy absorption, the latter accelerated by intense activity of Nevado de el Ruiz in the last years. In terms of mass balance, very few months exhibit a gain of ice during the period studied, and these tend to coincide with La Niña events (negative MEI episodes). These episodes cannot compensate for the great losses that occurred during the majority of months, which are especially large during El Niño events (positive MEI episodes), when above-normal temperatures are recorded. The ENSO phenomenon exerts great influence on the evolution of the glacier, similar to that reported for most inner tropical glaciers (Francou et al., 2004; Rabatel et al., 2013; Vuille et al., 2008); however, some episodes of great mass balance loss, such as that of 2014, cannot be explained by the ENSO. Observations of glacier surface during field surveys showed that, during some periods of mass loss, surface ice retreat left ancient layers of volcanic ash exposed. The reduced energy reflectance caused by such ash layers might have triggered positive feedback that led to increasing melting and large ice retreat.
Glacier retreat is a worldwide phenomenon, currently linked to global warming (IPCC, 2013). Amongst the environmental issues related to glacier retreat, the issue concerning water resources has produced a vast amount of research. This is because glaciers constitute water reservoirs in the form of accumulated ice over thousands of years, and they provide water supply to downstream areas for the benefit of life, ecosystems and human societies. The rapid decrease in glacier extent during the last decades involves a change in water availability in glacier-dominated regions, and, thus, changes in water policies and water management are advisable (Huss, 2011; Kundzewicz et al., 2008). In the short term, glacier retreat involves increasing runoff in downstream areas but, after reaching a peak, runoff will eventually decrease until the contribution of the glacier melt is zero, when the glacier completely disappears. From a global perspective, such a tipping point is referred to as peak water and has given rise to concern from the scientific community (Gleick and Palaniappan, 2010; Huss and Hock, 2018; Kundzewicz et al., 2008; Mark et al., 2017; Sorg et al., 2014). Research regarding the occurrence of such a runoff peak related to glacier retreat demonstrates that it will not occur concurrently worldwide. In some mountain areas, it has already occurred, i.e., the Peruvian Andes (Baraer et al., 2012), the western US mountains (Frans et al., 2016) or Central Asia (Sorg et al., 2012). At the majority of studied glacier basins, it is expected to occur in the course of the present century (Immerzeel et al., 2013; Ragettli et al., 2016; Sorg et al., 2014; Soruco et al., 2015). In recent global-scale research, Huss and Hock (2018) state that in nearly half of the 56 large-scale glacierized drainage basins studied, peak water has already occurred. In the other half, it will occur in the next decades, depending on extension of the ice cover fraction.
It was not the aim of this study to allocate such a tipping point in our studied glacier; however, observations on the characteristics of streamflow along the period studied suggest that it may have occurred during our study period. Our observations corroborate glacier melt being the main contributor to runoff in the catchment. However, even when correlations between runoff and temperature are mostly significant, the values are not as high as could be expected for a glacierized catchment. This is due to decreasing dependence of runoff on temperature, and therefore to glacier melt, as at a specific point during the study period. We observed a changing dynamic in most hydrological indicators, with a turning point in mid-2016, whereas climate variables, i.e., temperature and precipitation, do not show such evident variation (besides the exceptional conditions during an El Niño event). Both the PCA and the monthly aggregation of hydrological indices point to a less glacier-induced hydrological yield once the runoff peak of 2016 was reached. According to the literature (see Sect. 1.2.) this change from increasing to decreasing runoff, and from lesser importance of glacier contributions to total water discharge, must be expected in glacierized catchments with glaciers close to extinction. The short length of our hydrological series (five years) does not allow long-term analysis to determine water discharge in years of less glacier loss (i.e., from 2006 to 2012; see Fig. 3), which could verify or refute such a hypothesis. However, when we isolated total runoff from climate variables before and after the 2016 breakpoint (Figs. 8 and 9), we observed that the increase and later decrease of flows was mostly independent of temperature and precipitation, which would involve a glacier-driven hydrological change. Summarizing, streamflow measured at the glacier's snout showed the following characteristics: increasing trend in flow volume until mid-2016 and decreasing trend thereafter; increasing diurnal variability (given by the range between high flows and low flows and by the slope of the rising flow limb) up to mid-2016 and decreasing thereafter; decreasing and increasing monthly variability (given by the coefficient of variation of flows within a given month) before and after mid-2016; and high dependence of flow on temperatures before 2016 and low or null dependence after 2016, with increasing dependence on precipitation. In addition, this is supported by an evident change in the type of hydrograph, from a prevalence of days with melt-driven hydrographs (low baseflows, a sharp melting pulse, and great difference between high flows and low flows) before 2016, to an increase in the occurrence of days with less influence of melt and more influence by precipitation. All these characteristics support the idea of a hydrological change driven by the glacier recession in the catchment, as summarized by Hock et al. (2005; see Sect. 1.2). This observation cannot be taken conclusively, because the time period of hydrological observation is not long enough to deduce long-term trends and to explore hydrological dynamics before the great decline in glacier extent in 2014. However, given the current reduced size of the glacier (14 ha, which represents 35 % of the catchment that drains into the gauge station), it is likely that water discharge will continue to decrease in the upcoming years, until glacier contribution ends and runoff depends only on the precipitation that falls within the catchment. Like this glacier, other small glaciers in Colombia are expected to disappear in the coming decades (Rabatel et al., 2017); thus, a similar hydrological response can be expected.
Unlike glaciers in the western semiarid slopes of the Andes (i.e., Peru, Bolivia), Colombian glaciers do not constitute the main source of freshwater for downstream populations (IDEAM, 2012). The succession of humid periods provides enough water in mountain areas, most of which is stored in the deep soils of Páramos. These wetland ecosystems are mainly fed by rainfall (the contribution of glacier melt is mostly unknown, IDEAM, 2012) and act as water buffers, ensuring water availability during not-so-humid periods. Therefore, the role of glaciers in Colombia regarding water resources, including the ice body studied, is more marginal, and the occurrence of the peak water from glacier melt is not a current concern, as it is in Peru or Bolivia (Francou et al., 2014). Yet this does not diminish the relevance of the results of this work because they may be taken as an example of what can happen to the hydrology of glacierized basins in the tropics whose glaciers are in the process of disappearing. The glacier studied has a very small size compared to other ice bodies in the region. This makes it respond rapidly to variations in climate, as well as involving a rapid hydrological response of the catchment to the loss of ice, as was observed in this work. The increasing–decreasing flow dynamic observed as the glacier retreated occurred in roughly 5 years, and this is most likely related to the reduced size of the glacier studied. Most studies on the hydrological response to glacier retreat consider large river basins with large glacier coverage, usually by modeling approaches (i.e., Huss and Hock, 2018; Immerzeel et al., 2013; Ragettli et al., 2016; Sorg et al., 2012, 2014; Stahl et al., 2008), and the response times reported on either increasing flow at the initial stages or decreasing flow at the final stages are always on the scale of decades.
The added value of studying the hydrology related to this small-sized and near-extinct glacier is that the changes observed in the hydrology of the catchment could be directly attributed to the dynamics of the glacier and the climate that occurs at the same timescale, contrary to catchments containing large glaciers that respond with a larger temporal inertia to environmental changes. Hydrological analyses were restricted to the upper catchment because the streamflows measured at the snout of the glacier are not influenced by the signals of other environmental processes that may occur downstream (e.g., forest clearing or increased grazing). The methodological approach, including the PCA and the hydrological indices computed over subdaily resolution data, demonstrated itself as viable for detecting changes on the diurnal cycle of the glacier and can be applied to other small glaciers of the tropical Andes that respond rapidly (at subannual scales) to environmental forcing. The necessity for in situ observations on a fine scale in order to improve the accuracy of future estimations of water availability related to glacier retreat is emphasized.
Hydro-meteorological data for the Rio Claro Basin as well as Conejeras glacier mass balance data were collected by the Institute for Hydrological, Meteorological and Environmental Studies of Colombia (IDEAM).
Hydrological and meterological data are managed by the departments of hydrology and meteorology respectively and can be accessed upon formal request at http://www.ideam.gov.co/solicitud-de-informacion (last access: 12 May 2018).
Glacier mass balance data are managed by the department of ecosystems and the environmental information system of Colombia, SIAC. To access these data, within SIAC site http://www.siac.gov.co (last access: 1 July 2018), click on “Biodiversidad”, then on “Ecosistemas de importancia ambiental”, and finally on “Glaciares”.
The Multivariate Enso Index can be downloaded from National Oceanic and Atmospheric Administration of the United States NOAA https://www.esrl.noaa.gov/psd/enso/mei/ (Wolter, 2018).
EMT was responsible for the conceptualization, data processing and validation, statistical analyses, writing of the original draft. JLC took part in the conceptualization, experimental design, field surveys and data collection. KP carried out the field surveys, data collection and data processing. JLL carried out the cartography and remote sensing analysis. JILM was responsible for the conceptualization, statistical analyses and editing and review of the paper.
The authors declare that they have no conflict of interest.
This article is part of the special issue “Assessing impacts and adaptation to global change in water resource systems depending on natural storage from groundwater and/or snowpacks”. It is not associated with a conference.
This work has been possible thanks to the monitoring network installed by the
Department of Ecosystems of the Colombian Institute for Hydrology,
Meteorology and Environmental Studies (Instituto de Hidrología, Meteorología y Estudios Ambientales, IDEAM) and to the monthly field
surveys on the Conejeras glacier and Río Claro basin, carried out by
employed staff. We give our sincere gratitude to them, with special thanks to
Yina Paola Nocua. The following projects gave financial support to this
paper: “Estudio hidrológico de la montaña altoandina (Colombia) y su respuesta a procesos de cambio global” financed by Banco
Santander, through the program of exchange scholarships for young researchers
in Ibero-America “Becas Iberoamérica Jóvenes Profesores e
Investigadores” (2015); and CGL2017-82216-R (HIDROIBERNIEVE),
funded by the Spanish Ministry of Economy and Competitiveness. We are
thankful to the anonymous referees for their valuable comments and
suggestions that helped improve the final version of this
paper.
Edited by: David Pulido-Velazquez
Reviewed by: two anonymous referees
Baraer, M., Mark, B. G., McKenzie, J. M., Condom, T., Bury, J., Huh, K.-I., Portocarrero, C., Gómez, J., and Rathay, S.: Glacier recession and water resources in Peru's Cordillera Blanca, J. Glaciol., 58, 134–150, https://doi.org/10.3189/2012JoG11J186, 2012.
Beniston, M.: Impacts of climatic change on water and associated economic activities in the Swiss Alps, J. Hydrol., 412–413, 291–296, https://doi.org/10.1016/J.JHYDROL.2010.06.046, 2012.
Bradley, R. S., Vuille, M., Diaz, H. F., and Vergara, W.: Climate change. Threats to water supplies in the tropical Andes, Science, 312, 1755–1756, https://doi.org/10.1126/science.1128087, 2006.
Cayan, D. R., Dettinger, M. D., Kammerdiener, S. A., Caprio, J. M., Peterson, D. H., Cayan, D. R., Dettinger, M. D., Kammerdiener, S. A., Caprio, J. M., and Peterson, D. H.: Changes in the Onset of Spring in the Western United States, B. Am. Meteorol. Soc., 82, 399–415, https://doi.org/10.1175/1520-0477(2001)082<0399:CITOOS>2.3.CO;2, 2001.
Ceballos, J. L., Euscátegui, C., Ramírez, J., Cañon, M., Huggel, C., Haeberli, W., and Machguth, H.: Fast shrinkage of tropical glaciers in Colombia, Ann. Glaciol., 43, 194–201, https://doi.org/10.3189/172756406781812429, 2006.
Chander, G., Markham, B. L., and Helder, D. L.: Summary of current radiometric calibration coefficients for Landsat MSS, TM, ETM+, and EO-1 ALI sensors, Remote Sens. Environ., 113, 893–903, https://doi.org/10.1016/J.RSE.2009.01.007, 2009.
Chavez, P. S.: An improved dark-object subtraction technique for atmospheric scattering correction of multispectral data, Remote Sens. Environ., 24, 459–479, https://doi.org/10.1016/0034-4257(88)90019-3, 1988.
Chevallier, P., Pouyaud, B., Suarez, W., and Condom, T.: Climate change threats to environment in the tropical Andes: glaciers and water resources, Reg. Environ. Change, 11, 179–187, https://doi.org/10.1007/s10113-010-0177-6, 2011.
Dozier, J.: Spectral signature of alpine snow cover from the landsat thematic mapper, Remote Sens. Environ., 28, 9–22, https://doi.org/10.1016/0034-4257(89)90101-6, 1989.
Favier, V., Wagnon, P., and Ribstein, P.: Glaciers of the outer and inner tropics: A different behaviour but a common response to climatic forcing, Geophys. Res. Lett., 31, L16403, https://doi.org/10.1029/2004GL020654, 2004.
Francou, B. and Pouyaud, B.: Metodos de observacion de glaciares en los Andes tropicales?: mediciones de terreno y procesamiento de datos?: version-1?: 2004, available at: https://www.researchgate.net/profile/Bernard_Pouyaud/publication/282171220_Metodos_ de_observacion_de_glaciares_en_los_Andes_tropicales_mediciones_de_terreno_y_procesamiento_de_datos_version-1_2004/links/561ba9b808ae78721fa0f8ad.pdf (last access: 12 March 2018), 2004.
Francou, B., Vuille, M., Wagnon, P., Mendoza, J., and Sicart, J.: Tropical climate change recorded by a glacier in the central Andes during the last decades of the twentieth century: Chacaltaya, Bolivia, 16∘ S, J. Geophys. Res., 108, 4154, https://doi.org/10.1029/2002JD002959, 2003.
Francou, B., Vuille, M., Favier, V., and Cáceres, B.: New evidence for an ENSO impact on low-latitude glaciers: Antizana 15, Andes of Ecuador, 0∘28′ S, J. Geophys. Res., 109, D18106, https://doi.org/10.1029/2003JD004484, 2004.
Francou, B., Rabatel, A., Soruco, A., Sicart, J. E., Silvestre, E. E., Ginot, P., Cáceres, B., Condom, T., Villacís, M., Ceballos, J. L., Lehmann, B., Anthelme, F., Dangles, O., Gomez, J., Favier, V., Maisincho, L., Jomelli, V., Vuille, M., Wagnon, P., Lejeune, Y., Ramallo, C., and Mendoza, J.: Glaciares de los Andes tropicales: víctimas del cambio climático, Comunidad Andina, PRAA, IRD, available at: http://bibliotecavirtual.minam.gob.pe/biam/handle/minam/1686 (last access: 22 February 2018), 2014.
Frans, C., Istanbulluoglu, E., Lettenmaier, D. P., Clarke, G., Bohn, T. J., and Stumbaugh, M.: Implications of decadal to century scale glacio-hydrological change for water resources of the Hood River basin, OR, USA, Hydrol. Process., 30, 4314–4329, https://doi.org/10.1002/hyp.10872, 2016.
Gleick, P. H. and Palaniappan, M.: Peak water limits to freshwater withdrawal and use, P. Natl. Acad. Sci. USA, 107, 11155–11162, https://doi.org/10.1073/pnas.1004812107, 2010.
Granados, H. D., Miranda, P. J., Núñez, G. C., Alzate, B. P., Mothes, P., Roa, H. M., Cáceres Correa, B. E., and Ramos, J. C.: Hazards at Ice-Clad Volcanoes: Phenomena, Processes, and Examples From Mexico, Colombia, Ecuador, and Chile, in: Snow Ice-Related Hazards, edited by: Shroder, J. F., Haeberli, V., and Whiteman, C., Risks Disasters, 607–646, https://doi.org/10.1016/B978-0-12-394849-6.00017-2, 2015.
Hock, R., Jansson, P., and Braun, L. N.: Modelling the Response of Mountain Glacier Discharge to Climate Warming, in Global Change and Mountain Regions (A State of Knowledge Overview), Springer, Dordrecht, 243–252, 2005.
Huggel, C., Ceballos, J. L., Pulgarĺn, B., Ramírez, J., and Thouret, J.-C.: Review and reassessment of hazards owing to volcano–glacier interactions in Colombia, Ann. Glaciol., 45, 128–136, https://doi.org/10.3189/172756407782282408, 2007.
Huss, M.: Present and future contribution of glacier storage change to runoff from macroscale drainage basins in Europe, Water Resour. Res., 47, W07511, https://doi.org/10.1029/2010WR010299, 2011.
Huss, M. and Hock, R.: Global-scale hydrological response to future glacier mass loss, Nat. Clim. Chang., 8, 135–140, https://doi.org/10.1038/s41558-017-0049-x, 2018.
IDEAM: Glaciares de Colombia, más que montañas con hielo, edited by: Comité de Comuniaciones y Publicaciones del IDEAM, Bogotá, 2012.
Immerzeel, W. W., Pellicciotti, F., and Bierkens, M. F. P.: Rising river flows throughout the twenty-first century in two Himalayan glacierized watersheds, Nat. Geosci., 6, 742–745, https://doi.org/10.1038/ngeo1896, 2013.
IPCC: Climate Change 2013: The Physical Science Basis. Contribution of Working Group I to the Fifth Assessment Report of the Intergovernmental Panel on Climate Change, edited by: Stocker, T. F., Qin, D., Plattner, G.-K., Tignor, M., Allen, S. K., Boschung, J., Nauels, A., Xia, Y., Bex, V., and Midgley, P. M., Cambridge University Press, Cambridge, United Kingdom and New York, NY, USA, 2013.
Kaser, G. and Omaston, H.: Tropical glaciers, Cambridge University Press, available at: https://books.google.es/books?hl=es&lr=&id=ZEB-I3twN_ gC&oi=fnd&pg=PR11&dq=tropical+glaciers&ots=WLwn1fdjig&sig=897EG6q4Pyc113vo9Qb2bnyUo7g#v=onepage&q=tropical glaciers&f=false (last access: 21 November 2017), 2002.
Kaser, G., Grosshauser, M., and Marzeion, B.: Contribution potential of glaciers to water availability in different climate regimes., P. Natl. Acad. Sci. USA, 107, 20223–20227, https://doi.org/10.1073/pnas.1008162107, 2010.
Klein, A. G., Morris, J. N., and Poole, A. J.: Retreat of Tropical Glaciers in Colombia and Venezuela from 1984 to 2004 as Measured from ASTER and Landsat Images, in 63 rd EASTERN SNOW CONFERENCE, Newark, Delaware USA, available at: https://www.researchgate.net/publication/228492383 (last access: 5 July 2018), 2006.
Kundzewicz, Z. W., Mata, L. J., W., A. N., Döll, P., Jimenez, B., Miller, K., Oki, T., Şed, Z., and Shiklomanov, I.: The implications of projected climate change for freshwater resources and their management, Hydrolog. Sci. J., 53, 3–10, https://doi.org/10.1623/hysj.53.1.3, 2008.
López-Moreno, J. I., Fontaneda, S., Bazo, J., Revuelto, J., Azorin-Molina, C., Valero-Garcés, B., Morán-Tejeda, E., Vicente-Serrano, S. M., Zubieta, R., and Alejo-Cochachín, J.: Recent glacier retreat and climate trends in Cordillera Huaytapallana, Peru, Global Planet. Change, 112, 1–11, https://doi.org/10.1016/j.gloplacha.2013.10.010, 2014.
López-Moreno, J. I., Valero-Garcés, B., Mark, B., Condom, T., Revuelto, J., Azorín-Molina, C., Bazo, J., Frugone, M., Vicente-Serrano, S. M., and Alejo-Cochachin, J.: Hydrological and depositional processes associated with recent glacier recession in Yanamarey catchment, Cordillera Blanca (Peru), Sci. Total Environ., 579, 272–282, https://doi.org/10.1016/J.SCITOTENV.2016.11.107, 2017.
Mark, B. G., French, A., Baraer, M., Carey, M., Bury, J., Young, K. R., Polk, M. H., Wigmore, O., Lagos, P., Crumley, R., McKenzie, J. M., and Lautz, L.: Glacier loss and hydro-social risks in the Peruvian Andes, Global Planet. Change, 159, 61–76, https://doi.org/10.1016/J.GLOPLACHA.2017.10.003, 2017.
Mölg, N., Ceballos, J. L., Huggel, C., Micheletti, N., Rabatel, A., and Zemp, M.: Ten years of monthly mass balance of Conejeras glacier, Colombia, and their evaluation using different interpolation methods, Geogr. Ann. A, 99, 155–176, https://doi.org/10.1080/04353676.2017.1297678, 2017.
Padró, J.-C., Pons, X., Aragonés, D., Díaz-Delgado, R., García, D., Bustamante, J., Pesquer, L., Domingo-Marimon, C., González-Guerrero, Ò., Cristóbal, J., Doktor, D., and Lange, M.: Radiometric Correction of Simultaneously Acquired Landsat-7/Landsat-8 and Sentinel-2A Imagery Using Pseudoinvariant Areas (PIA): Contributing to the Landsat Time Series Legacy, Remote Sens., 9, 1319, https://doi.org/10.3390/rs9121319, 2017.
Poveda, G. and Pineda, K.: Reassessment of Colombia's tropical glaciers retreat rates: are they bound to disappear during the 2010–2020 decade?, Adv. Geosci., 22, 107–116, https://doi.org/10.5194/adgeo-22-107-2009, 2009.
Poveda, G., Waylen, P. R., and Pulwarty, R. S.: Annual and inter-annual variability of the present climate in northern South America and southern Mesoamerica, Palaeogeogr. Palaeocl., 234, 3–27, https://doi.org/10.1016/j.palaeo.2005.10.031, 2006.
Rabatel, A., Francou, B., Soruco, A., Gomez, J., Cáceres, B., Ceballos, J. L., Basantes, R., Vuille, M., Sicart, J.-E., Huggel, C., Scheel, M., Lejeune, Y., Arnaud, Y., Collet, M., Condom, T., Consoli, G., Favier, V., Jomelli, V., Galarraga, R., Ginot, P., Maisincho, L., Mendoza, J., Ménégoz, M., Ramirez, E., Ribstein, P., Suarez, W., Villacis, M., and Wagnon, P.: Current state of glaciers in the tropical Andes: a multi-century perspective on glacier evolution and climate change, The Cryosphere, 7, 81–102, https://doi.org/10.5194/tc-7-81-2013, 2013.
Rabatel, A., Ceballos, J. L., Micheletti, N., Jordan, E., Braitmeier, M., González, J., Mölg, N., Ménégoz, M., Huggel, C., and Zemp, M.: Toward an imminent extinction of Colombian glaciers?, Geogr. Ann. A, 100, 75–95, https://doi.org/10.1080/04353676.2017.1383015, 2017.
Ragettli, S., Immerzeel, W. W., and Pellicciotti, F.: Contrasting climate change impact on river flows from high-altitude catchments in the Himalayan and Andes Mountains., P. Natl. Acad. Sci. USA, 113, 9222–9227, https://doi.org/10.1073/pnas.1606526113, 2016.
Rekowsky, I. C.: Variações de área das geleiras da Colômbia e da Venezuela entre 1985 e 2015, com dados de sensoriamento remoto, available at: https://www.lume.ufrgs.br/handle/10183/149546 (last access: 5 July 2018), 2016.
Ribstein, P., Tiriau, E., Francou, B., and Saravia, R.: Tropical climate and glacier hydrology: a case study in Bolivia, J. Hydrol., 165, 221–234, https://doi.org/10.1016/0022-1694(94)02572-S, 1995.
Sicart, J. E., Hock, R., Ribstein, P., Litt, M., and Ramirez, E.: Analysis of seasonal variations in mass balance and meltwater discharge of the tropical Zongo Glacier by application of a distributed energy balance model, J. Geophys. Res., 116, D13105, https://doi.org/10.1029/2010JD015105, 2011.
Sorg, A., Bolch, T., Stoffel, M., Solomina, O., and Beniston, M.: Climate change impacts on glaciers and runoff in Tien Shan (Central Asia), Nat. Clim. Change, 2, 725–731, https://doi.org/10.1038/nclimate1592, 2012.
Sorg, A., Huss, M., Rohrer, M., and Stoffel, M.: The days of plenty might soon be over in glacierized Central Asian catchments, Environ. Res. Lett., 9, 104018, https://doi.org/10.1088/1748-9326/9/10/104018, 2014.
Soruco, A., Vincent, C., Rabatel, A., Francou, B., Thibert, E., Sicart, J. E., and Condom, T.: Contribution of glacier runoff to water resources of La Paz city, Bolivia (16∘ S), Ann. Glaciol., 56, 147–154, https://doi.org/10.3189/2015AoG70A001, 2015.
Stahl, K., Moore, R. D., Shea, J. M., Hutchinson, D., and Cannon, A. J.: Coupled modelling of glacier and streamflow response to future climate scenarios, Water Resour. Res., 44, W02422, https://doi.org/10.1029/2007WR005956, 2008.
Stewart, I. T., Cayan, D. R., and Dettinger, M. D.: Changes in Snowmelt Runoff Timing in Western North America under a “Business as Usual” Climate Change Scenario, Clim. Change, 62, 217–232, https://doi.org/10.1023/B:CLIM.0000013702.22656.e8, 2004.
Vaughan, D. G., Comiso, J. C., Allison, I., Carrasco, J., Kaser, G., Kwok, R., Mote, P., Murray, T., Paul, F., Ren, J., Rignot, E., Solomina, O., Steffen, K., and Zhang, T.: Observations: Cryosphere, in Climate Change 2013: The Physical Science Basis. Contribution of Working Group I to the Fifth Assessment Report of the Intergovernmental Panel on Climate Change, edited by: Stocker, T. F., Qin, D., Plattner, G.-K., Tignor, M., Allen, S. K., Boschung, J., Nauels, A., Xia, Y., Bex, V., and Midgley, P. M., 317–382, Cambridge University Press, Cambridge, United Kingdom and New York, NY, USA, 2013.
Vuille, M., Francou, B., Wagnon, P., Juen, I., Kaser, G., Mark, B. G., and Bradley, R. S.: Climate change and tropical Andean glaciers: Past, present and future, Earth-Sci. Rev., 89, 79–96, https://doi.org/10.1016/J.EARSCIREV.2008.04.002, 2008.
Vuille, M., Carey, M., Huggel, C., Buytaert, W., Rabatel, A., Jacobsen, D., Soruco, A., Villacis, M., Yarleque, C., Timm, O. E., Condom, T., Salzmann, N., and Sicart, J.-E.: Rapid decline of snow and ice in the tropical Andes – Impacts, uncertainties and challenges ahead, Earth-Sci. Rev., 176, 195–213, https://doi.org/10.1016/j.earscirev.2017.09.019, 2017.
Wolter, K.: Multivariate ENSO Index webpage, available at: https://www.esrl.noaa.gov/psd/enso/mei/ (last access: 15 December 2017), 2018.
Wolter, K. and Timlin, M. S.: Monitoring ENSO in COADS with a seasonally adjusted principal component index, Proc. of the 17th Climate Diagnostics Workshop, Norman, OK, NOAA/NMC/CAC, NSSL, Oklahoma Clim. Survey, CIMMS and the School of Meteor., Univ. of Oklahoma, 52–57, 1993.
Wolter, K. and Timlin, M. S.: Measuring the strength of ENSO events – how does 1997/98 rank?, Weather, 53, 315–324, 1998.