the Creative Commons Attribution 4.0 License.
the Creative Commons Attribution 4.0 License.
 | 07 Sep 2018
Global re-analysis datasets to improve hydrological assessment and snow water equivalent estimation in a sub-Arctic watershed
Micha Werner
Albrecht Weerts
Dimitri Solomatine
Hydrological modelling in the Canadian sub-Arctic is hindered by sparse meteorological and snowpack data. The snow water equivalent (SWE) of the winter snowpack is a key predictor and driver of spring flow, but the use of SWE data in hydrological applications is limited due to high uncertainty. Global re-analysis datasets that provide gridded meteorological and SWE data may be well suited to improve hydrological assessment and snowpack simulation. To investigate representation of hydrological processes and SWE for application in hydropower operations, global re-analysis datasets covering 1979–2014 from the European Union FP7 eartH2Observe project are applied to global and local conceptual hydrological models. The recently developed Multi-Source Weighted-Ensemble Precipitation (MSWEP) and the WATCH Forcing Data applied to ERA-Interim data (WFDEI) are used to simulate snowpack accumulation, spring snowmelt volume and annual streamflow. The GlobSnow-2 SWE product funded by the European Space Agency with daily coverage from 1979 to 2014 is evaluated against in situ SWE measurement over the local watershed. Results demonstrate the successful application of global datasets for streamflow prediction, snowpack accumulation and snowmelt timing in a snowmelt-driven sub-Arctic watershed. The study was unable to demonstrate statistically significant correlations (p < 0.05) among the measured snowpack, global hydrological model and GlobSnow-2 SWE compared to snowmelt runoff volume or peak discharge. The GlobSnow-2 product is found to under-predict late-season snowpacks over the study area and shows a premature decline of SWE prior to the true onset of the snowmelt. Of the datasets tested, the MSWEP precipitation results in annual SWE estimates that are better predictors of snowmelt volume and peak discharge than the WFDEI or GlobSnow-2. This study demonstrates the operational and scientific utility of the global re-analysis datasets in the sub-Arctic, although knowledge gaps remain in global satellite-based datasets for snowpack representation, for example the relationship between passive-microwave-measured SWE to snowmelt runoff volume.
- Article
(1358 KB) - Full-text XML
-
Supplement
(257 KB) - BibTeX
- EndNote


Snowpack accumulation and melt are the main drivers of hydrology and peak flow events in high-latitude (> 60∘ N) watersheds. The snow water equivalent (SWE) stored in the winter snowpack is the key contributor and predictor of spring and summer streamflow (Liu et al., 2015). In situ measurement of SWE can provide valuable information for operational water managers, but data collection is challenging in remote high-latitude watersheds, and uncertainty in maximum annual SWE remains a key constraint in hydrological forecasting (Larue et al., 2017). In northern Canada, uncertainty in SWE measurement and a lack of developed hydrological modelling tools result in high uncertainty in the prediction of snowmelt-driven flood events, leading to infrastructure risk and hindering operational water management. Climate change is also shifting the hydrology regime at high latitudes, with global circulation models and observational trends indicating a reduction in spring snowpack duration, although the trend in SWE is less clear (Brown and Mote, 2009; Rees et al., 2014). This will increase risk to hydroelectric facilities, mining operations and local communities as rapid spring snowmelt, rain-on-snow events and variable precipitation patterns that cause flooding become more severe (AMAP, 2012; McCabe et al., 2007; National Research Council, 2007).
SWE measurements from ground and remote-sensing sources have high uncertainty for hydrological application. Although field measurement of SWE can be accurate at point locations, these provide only limited spatial and temporal coverage. Precipitation gauge measurements to quantify snowfall at high latitudes have high uncertainty due to the scarcity of meteorological stations, short duration of meteorological measurement records and systematic measurement error (Devine and Mekis, 2008; Mekis and Vincent, 2011; Sugiura et al., 2006). Remote sensing is used to monitor snow on a global scale and measurement of snow depth with passive microwave has the advantage of frequent re-visit times, long-term data records and a large spatial extent of data collection (Nolin, 2011). GlobSnow-2 provides a long-term (1979–2014) daily record of SWE over the Northern Hemisphere (Luojus et al., 2014). However, passive microwave measurement of SWE is limited for the measurement of deep or wetted snowpacks, relies on estimates of density, and tends to underestimate SWE in tundra environments (Rees et al., 2007).
Global re-analysis data products, which integrate multiple data sources, are well suited to provide meteorological data at high latitudes due to complete spatial and extended temporal coverage. Research into the reliability of re-analysis products at high latitudes is, however, limited due to a lack of reliable precipitation and SWE data (Mudryk et al. 2015; Wong et al., 2017).
In this study a locally distributed conceptual hydrological model using a simplified snow accumulation and melt routine is forced with eartH2Observe meteorological data to simulate SWE and catchment discharge.
Meteorological datasets generated as part of the eartH2Observe project have been used to force global hydrological models (Schellekens et al., 2017). These global hydrological models can be used to improve understanding of water resources in regions like the sub-Arctic, where information is lacking and the models have large uncertainties in part due to simplifications of physical processes (Bierkens and Van Beek, 2009; van Dijk et al., 2014). This study examines the application of global re-analysis data products for hydrological modelling and representation of SWE in the Snare Watershed in the Canadian sub-Arctic. The available datasets hold great potential to allow accurate discharge modelling for sub-Arctic watersheds and development of more advanced modelling systems. This has practical relevance for operational water management at high latitudes and provides a basis for hydrological forecasting and data assimilation to further improve model performance.
The three main goals of this paper are as follows:
-
determine the skill of a locally distributed conceptual hydrological model for a snowmelt-driven, high-latitude watershed forced with long-term meteorological re-analysis data developed in the eartH2Observe project;
-
assess the representation of SWE in both the local- and global-scale models and compare to the GlobSnow-2 daily SWE product as well as available long-term records of snowpack surveys;
-
determine the predictive capacity of SWE measurement from in situ snowpack surveys, GlobSnow-2 SWE as well as local and global hydrological models for snowmelt volume and peak discharge rates.
The Snare Watershed is located in the northern extent of the Mackenzie River basin in Canadian sub-Arctic. The watershed covers an area of roughly 14 000 km2 above a cascade of four hydropower stations as depicted in Fig. 1. The Snare Watershed is typical of many watersheds across northern Canada where temporal and spatial coverage of meteorological data is very sparse, but where historic discharge gauging records are available.
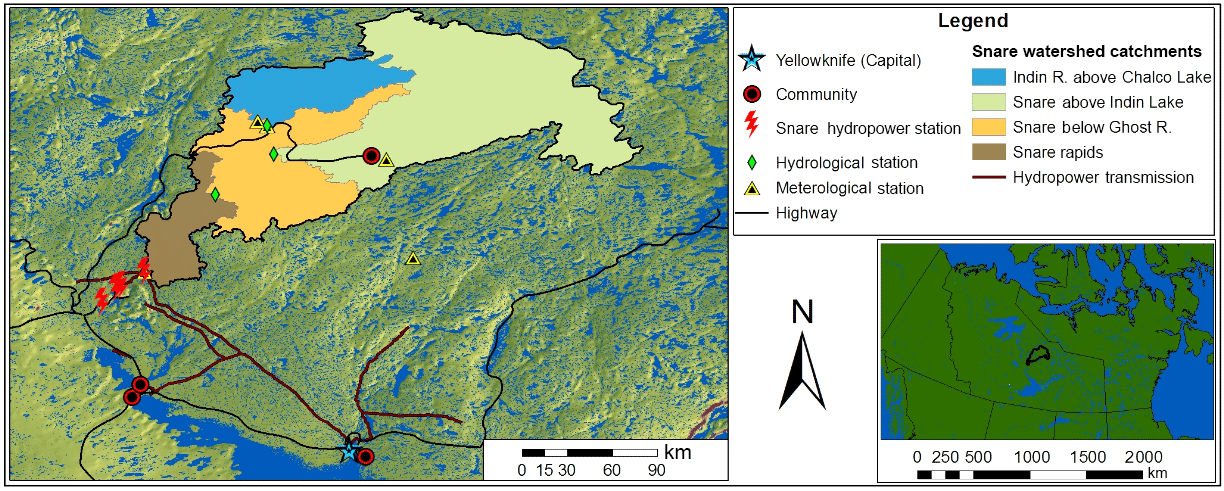
The Snare Watershed has low topographic relief and is characterized by low rolling hills of exposed bedrock with depressions from glacier-scouring forming wetlands, shallow lakes and streams (ECG, 2008). The southern extent of the watershed is boreal forest, while the northern extent is above the treeline and is covered mostly by shrub and sedge tundra (Government of Canada, 2013). Annual precipitation is generally low and in the range of 200 to 500 mm and temperatures are below 0 ∘C for extended periods in the winter months (ECG, 2008).
Several meteorological stations have been installed in the Snare Watershed; however, precipitation records are very short, with a maximum duration of 3 years. Gauge measurement of snowfall is known to have systematic underestimation, and large bias correction factors (80 %–120 %) are required for snowfall at high latitudes, though factors in the boreal and tundra region of the Snare Watershed may be closer to only 20 % (Mekis and Vincent, 2011; Yang et al., 2005). Snowpacks accumulated from winter snowfall are highly spatially variable in depth and SWE, with lower accumulation over lake and plateau areas (Rees et al., 2014). Snowfall measurements at high latitudes are particularly difficult to verify due to the sublimation effects on precipitation totals (Mekis and Hogg, 1998).
Sublimation, the direct conversion of snow particles to vapour, is a major factor in removing snow from tundra areas (Marsh et al., 1995) and along with wind redistribution is a key driver of spatial variability and quantity of SWE. Sublimation estimates in the sub-Arctic boreal forest and tundra regions vary considerably in a general range from 10 % to 50 % of total snowfall (Dery and Yau, 2002; Liston et al., 2002; Marsh et al., 1995; Pomeroy et al., 1997, 1999). Direct measurement of sublimation is very difficult, so values are more often determined through water balance assessment (Liston and Sturm, 2004).
Improved modelling of streamflow and SWE has a direct benefit for the operation of active hydropower facilities in the Snare Watershed. Current approaches for hydropower operations in the Snare Watershed use ground SWE measurements and matching with historical discharge records with similar flow characteristics to anticipate discharge. The system planner uses anticipated streamflow to determine whether to hold or spill water, and whether it is necessary to order diesel should hydroelectric generation fall short and need to be offset using generators. This forecasting approach is limited as it cannot incorporate additional information such as changing temperature regimes, antecedent water storage and meteorological forecasts. In this study the operational context of the Snare Hydro System is used to demonstrate that global datasets are not only useful for broad-scale assessment, but can be applied for accurate discharge modelling and development of a hydrological forecasting system.
3.1 Hydrological models
3.1.1 The wflow-HBV model
The wflow-HBV is based on the conceptual HBV-96 algorithm and is developed as a distributed hydrological modelling platform using the PCRaster python framework (Karssenberg et al., 2010; OpenStreams, 2016). The wflow-HBV includes a simplified snow accumulation and melt routine based on the degree-day method and kinematic wave approximation for routing (Bergström, 1992). The snow routine does consider snowpack melt and refreezing, but not moisture loss from the snowpack (sublimation) and wind redistribution. Several attempts have been made to improve on the snowmelt modelling of the HBV model, but it has been found that inclusion of more advanced routines and additional input data have had only limited improvement of results (Lindstrom et al., 1997). The wflow-HBV model is highly parameterized and requires a structured approach to calibration to achieve suitable streamflow and physical process representation.
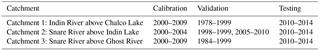
A Python-based framework for optimization, pyOpt, was implemented for calibration of the wflow-HBV model (Perez et al., 2012). Single-objective, constrained parameter optimization of the Nash–Sutcliffe efficiency (NSE) was performed using the Augmented Lagrangian Harmony Search Optimizer (Geem et al., 2001). Constraints on specific model parameters based on land cover type and introduction of lakes and reservoirs were used to improve physical process representation. Historical discharge data were separated into calibration, validation and testing periods. The difference between validation and testing periods is that validation results are seen and evaluated by the modeller in an iterative calibration process, while testing data are not used until the final model parameter values are set. A calibration period as shown in Table 1 was selected to correspond with available discharge data and representative peak flow events in each catchment, and to allow sufficient additional discharge data for validation and testing of the model.
3.1.2 Global hydrological models
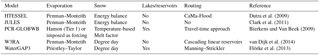
A set of global hydrological and land-surface models were considered in this study and presented in Table 2. Model state variables such as SWE for selected models and forcing datasets can be obtained from the eartH2Observe project Water Cycle Integrator (WCI) (EartH2Observe, 2017).
3.2 Data
3.2.1 Meteorological data
Meteorological stations are sparse in the study area, as they are across northern Canada (Mekis and Vincent, 2011). Local meteorological stations data collected from Government of Canada Historical Climate Data records were reviewed to determine consistency and completeness (ENR, 2016; Simpson, 2016). With the exception of the Yellowknife station, precipitation records for both rainfall and snowfall were, however, found to be incomplete or of short duration. Temperature records for several nearby stations shown in Fig. 1 were found to be complete and suitable for comparison validation.
Global re-analysis datasets generated as part of the eartH2Observe project were used as forcing data for the wflow-HBV model. The primary precipitation forcing dataset used is the Multi-Source Weighted-Ensemble Precipitation (MSWEP), available at a daily timestep from 1979 to 2015 at a resolution of . MSWEP was created through combination of gauge, satellite and re-analysis data and includes a long-term bias correction procedure based on discharge observations (H. E. Beck et al., 2017). Precipitation and temperature data from the WATCH Forcing Data applied to ERA-Interim reanalysis data (WFDEI) were used at a daily timestep 1979–2012 at a resolution of (Weedon et al., 2014). Potential evapotranspiration (PET) for this study was selected as Penman–Monteith calculated at a daily timestep at a resolution based on eartH2Observe Water Resource Re-analysis 2 (WRR2) data (Allen et al., 1998).
Available ground-based weather station data sources and long-term climate normals were used to validate the re-analysis datasets from eartH2Observe. Mean annual precipitation for the eartH2Observe datasets are comparable at the nearest gauge with long-term records at Yellowknife. Undercatch-corrected annual mean precipitation totals for Yellowknife were 377.7 mm, with MSWEP and WFDEI totalling 356.3 and 370.7 mm respectively (ENR, 2016). A comparison of monthly precipitation to undercatch-corrected local datasets shows slightly better correlation and performance for MSWEP (y=0.93x, R2=0.27) than WFDEI (y=0.88x, R2= 0.25). Daily mean temperature data for several local stations were well correlated with WFDEI (Lower Carp Lake, R2=0.98; Indin River, R2=0.97) and showed low biases.
3.2.2 Discharge data
Discharge in the Snare Watershed follows a distinct and highly seasonal pattern which is typical of the sub-Arctic (Kokelj, 2003). Low winter flows are followed by a large peak discharge due to snowmelt. In some years, rainfall in the late fall will cause a notable secondary peak before flow recession in the end of the year. Discharge is available both as a historic time series from as early as 1978 and in near-real time provided by the Water Survey of Canada (ENR, 2016, 2017) for the three hydrological stations presented in Fig. 1. Although the period of record is different for each of the three stations, the annual water yields are well correlated between the three catchments, helping to validate the rating curves and reported discharge rates.
3.2.3 In situ SWE data
Measurement of SWE can be performed in situ with accurate snow depth and density at point locations. However, the resulting datasets have limited spatial and temporal coverage (Derkson et al., 2008). The in situ measurements, or snowpack surveys, are often collected near the end of the snow accumulation season to provide advance information for anticipated snowmelt volume. A long-term record (1978–2016) of end-of-winter snowpack surveys is available at locations distributed across the Snare Watershed (GNWT, 2017). Snowpack survey measurements contain inherent uncertainty related to site selection, sampling protocols and interpolation methods used to create spatial estimates. Despite these limitations, snowpack survey data are considered the most reliable SWE available in the study area.
3.2.4 GlobSnow-2 SWE data
GlobSnow-2 SWE, hereafter referred to as GlobSnow, is a long-term (1979–present) daily record of SWE covering the non-mountainous areas of the Northern Hemisphere (Luojus et al., 2014). GlobSnow uses a Bayesian non-linear iterative assimilation approach with passive microwave measurements and ground-based weather station measurements to create a 25 km by 25 km gridded SWE product (Takala, 2011). GlobSnow has limitations and uncertainty consistent with the measurement of SWE from passive microwave measurements, leading to underestimation in tundra environments due to several contributing factors (Rees et al., 2007). Passive microwave algorithms provide limited measurement of melting snow as the presence of even small amounts of water in the snowpack results in an emissivity similar to land with no snow cover (Nolin, 2011). In GlobSnow, a microwave-derived dry snow mask is first used to determine snow-covered area and SWE retrievals are only retained for those areas determined to have snow cover. When snow is wet, the snow-masking procedure underestimates the snow-covered area.
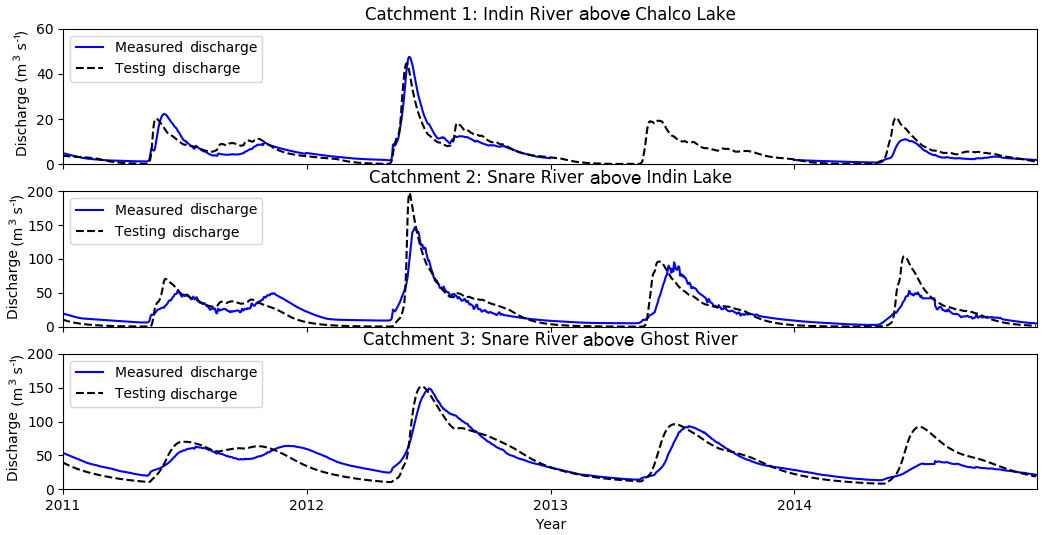
Table 3The wflow-HBV discharge statistical results.
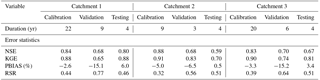
Note: NSE = Nash Sutcliffe efficiency, KGE = Kling–Gupta efficiency, PBIAS = percent bias, RSR = root mean squared error observations standard deviation ratio.
GlobSnow algorithm performance has been tested in Canada by comparing retrievals to in situ measurements for a variety of Canadian land covers (Snauffer et al., 2016). The overall RMSE for comparison with Canadian data is 40 mm, although algorithm retrieval is poor for boreal forest snow where the SWE is greater than 150 mm (Takala et al., 2011). Sparsity of weather station snow depth measurements in boreal regions results in stronger weighting of microwave-based retrievals in the GlobSnow algorithm, contributing to underestimation of SWE due to the volume scatter from dry snowpacks exceeding 150 mm.
3.3 Snowmelt volume
Snowmelt volume and peak discharge were calculated and extracted from the measured discharge data at the Catchment 3 outlet. No local or global model data were used in these calculations. Snowmelt volume was approximated using the local minimum method from the hydrograph stream flow separation program (HYSEP) implemented in MATLAB (Burkley, 2012). This is a mathematical technique that mimics manual methods for stream flow separation as opposed to an explicit representation of the physical processes (Sloto and Crouse, 1996). Secondary hydrograph peaks that occurred after the freshet peak and are driven by late-season rainfall events were removed in the snowmelt volume calculation. The separation of rainfall-driven flow increases was performed using a simple exponential regression to estimate the regression curve from the spring melt hydrograph (Toebes et al., 1969). The method applied in this study results in an annual mean contribution of SWE to total stream flow of 63 %, with a standard deviation of 10 %. These values of snowmelt contribution to streamflow are consistent with literature estimates (30 %–80 %) from more detailed catchment studies (DDC, 2014; McNamara et al., 1998; Schelker et al., 2013; Stieglitz et al., 1999), if a little on the high side.
3.4 Prediction of snowmelt volume and peak discharge from maximum annual SWE
Prediction of spring streamflow is largely dependent on the accuracy of SWE estimates prior to snowmelt (Sospedra-Alfonso et al., 2016). Rank correlation analysis is used to compare maximum annual SWE to the corresponding spring snowmelt volume and peak discharge. Use of maximum annual SWE allows comparison between local and global model datasets, GlobSnow and in situ measurements. Spearman's rho is used as a non-parametric measure of the monotonicity (i.e. whether the trend is entirely increasing or decreasing) between datasets as calculated in Eq. (1) (Yue et al., 2002).
where rs is Spearman's rho and rg(Xi) is the rank of observation Xi in a sample of size n. Spearman's rho test includes a two-sided p value for significance. The period of record for all rank correlation analysis was 1985 to 2012.
4.1 Discharge simulations
Graphical results for the testing period of the wflow-HBV model presented in Fig. 2 show good or acceptable overall model representation of discharge. From the graphical assessment, it appears that model results could be improved with slightly greater attenuation of streamflow. Modelled discharge in 2014 is anomalous with over-prediction of the discharge volume due to snowmelt contribution to streamflow. Analyses of the in situ data show that low snowpack SWE was recorded in snowpack surveys collected in 2014, though this is not reflected in the MSWEP forcing data.
Results only from the testing period are shown graphically in Fig. 2, while the performance statistics over the calibration, validation and testing periods are shown in Table 3. These statistics would generally be classified as good or very good calibration under the model evaluation guidelines defined by Moriasi et al. (2007). NSE values can be in the range of −∞ to 1 where 1 indicates the ideal with no difference between simulated and observed values. (Nash and Sutcliffe, 1970). Percent bias (PBIAS) gives a measure of the tendency of the simulated results to be larger or less than the observed values. RMSE-observations standard deviation ratio (RSR) has the benefit of a normalization and scaling factor, which facilities comparison (Moriasi et al., 2007). Evaluation using KGE is similar to NSE, with an ideal optimized value of 1 (Gupta et al., 2009).

Figure 3Daily mean, maximum and minimum daily SWE compared to ground measurements (1980–2012).
4.2 Snow water equivalent
The accumulated SWE over the Snare Watershed has been measured by in situ snowpack surveys and can be used to evaluate GlobSnow-2 and hydrological models. Figure 3 shows the quantity and timing of SWE accumulation and melt patterns over the period of record. Each snowpack survey point is the spatial mean of a set of snowpack survey stations collected in the same field program. The line graphs represent the spatial mean of daily mean, maximum and minimum SWE estimates from GlobSnow-2, hydrological and land surface models.
The comparison of the GlobSnow data with the in situ SWE measurements in Fig. 4, where the blue crosses are the observations taken in early spring while the red asterisks are the observations from late spring, shows GlobSnow tends to overestimate SWE in the early season and underestimate in the late season. Error is also correlated to the magnitude of the GlobSnow measurement (right-hand figure). The assumption of a constant density of 0.24 g cm−3 in the GlobSnow retrieval algorithm contributes to this trend. The mean density in the Snare Watershed snow surveys is 0.21 g cm−3, with a standard deviation of 0.06 g cm−3 (GNWT, 2016). The assumption of constant density would lead to overestimation of SWE for freshly fallen snow and underestimation for mature snowpacks.
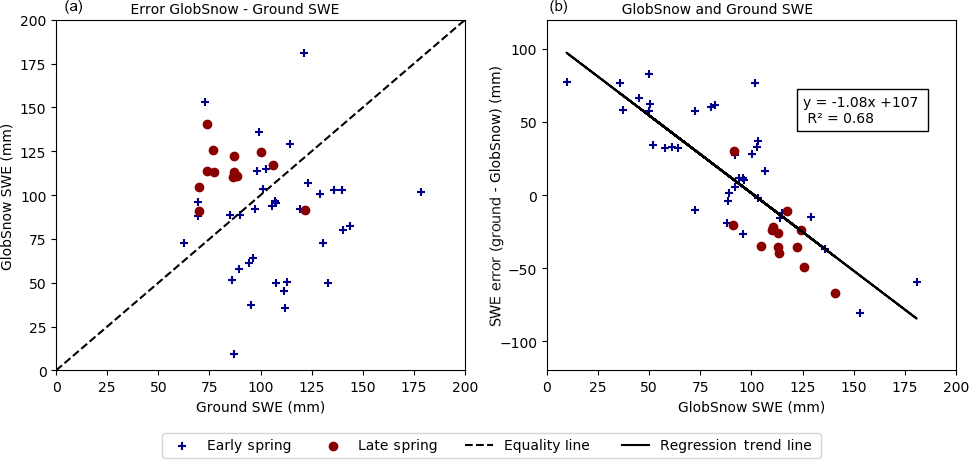
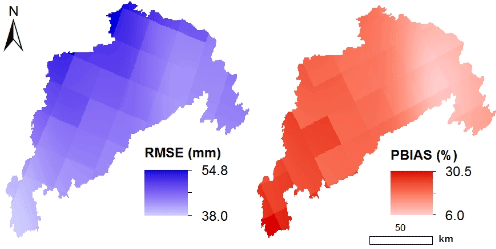
The high overall RMSE (45.1 %) and PBIAS (18.3 %), showing under-prediction by GlobSnow, are consistent with a recent validation study of GlobSnow over Canadian boreal forest and tundra environments (Larue et al., 2017; Takala, 2011). In this study, a key contributing factor to the high RMSE is that comparison is made with late season measurements where GlobSnow SWE retrievals have premature decline. The spatial distribution of RMSE and PBIAS in Fig. 5 indicates better performance over the northern tundra areas compared to southern areas where boreal forest land cover dominates. The checkered pattern of the error statistics is due to the 25 km by 25 km resolution of the GlobSnow product. Observations were interpolated to the 25 km grid using inverse distance weighting.
4.3 Prediction of snowmelt volume and peak discharge
Maximum annual SWE is a key predictor of spring and summer streamflow rates. Rank correlation analysis provides evaluation of the predictive power of measured and modelled SWE for snowmelt volume and peak discharge rates. Table 4 shows results for Spearman's rho (rs) and two-sided p test (p), correlating the maximum SWE found in each of the dataset–model combinations considered, and the observed snowmelt volume and peak discharge. The last column provides the correlation to the SWE obtained from ground-based measurements.
Table 4SWE, snowmelt and peak discharge rank correlation analysis.
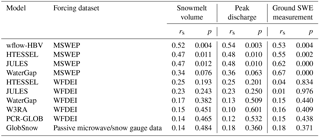
The selection of forcing data has a clear effect on correlation of model maximum annual SWE to snowmelt volume, peak discharge and in situ data. MSWEP forcing precipitation showed superior performance to WFDEI irrespective of the model used. The local wflow-HBV model forced with MSWEP is the best and only statistically significant (p < 0.05) predictor of snowmelt volume and peak discharge. This can be attributed to the calibration of the local model, while global models are generally uncalibrated. GlobSnow has poor correlation to snowmelt volume, peak discharge and in situ data, which is consistent with expected limitations from SWE measurement with passive microwave measuring deep and late-season snowpacks.
The period used for rank correlation analysis was 1985–2012, meaning the wflow-HBV model was calibrated over 18.5 % (5 years) to 37.0 % (10 years) of the rank correlation analysis time period. The higher Spearman coefficient performance of the wflow-HBV model in rank correlation analysis may be partly attributed to improved process representation of snow accumulation and removal processes, including interception and precipitation biases. The quantification of the improvement in inter-annual variability and rank correlation due to correlation has not been investigated in this study. The dominant driver of the rank correlation analysis is the choice of forcing meteorological data.
5.1 Global re-analysis datasets for predicting streamflow, snowpack accumulation and melt
Global re-analysis datasets applied in this study provide considerable advantages in hydrological assessment in a high-latitude watershed compared to what can be achieved with in situ data. Local meteorological datasets are simply too short, inconsistent and spatially disperse to be applied in long-term modelling. The use of hydrological models allows the estimation of hydrological state variables such as snowpack accumulation and streamflow using both local and global conceptual hydrological models.
The local watershed model in this study, forced with global re-analysis datasets and calibrated to available streamflow records is able to reliably and accurately model streamflow based on calibration, validation and testing of statistical results. The wflow-HBV model is conceptual and has limited representation of physical snow processes; however, the modelled maximum annual SWE was found to be a better predictor of snowmelt volume and peak discharge than snowpack survey data as the Spearman coefficient is higher and p value is lower (p < 0.05).
Assimilation of snowpack survey data for model state update has the potential to improve SWE estimates and optimally use available information. Data assimilation requires estimates of both model state and observational uncertainty, quantification of which would improve understanding to the relative reliability and applicability of data sources (Liu et al., 2012).
In global hydrological models, which are not calibrated to streamflow data, MSWEP has better performance over the Snare Watershed in predicting snowmelt volume and peak discharge compared to WFDEI. The selection of forcing data in this study has a greater effect than the choice of conceptual hydrological model, owing to the control over precipitation volumes. Studies of streamflow in calibrated versions of the global hydrological models have also found superior performance using MSWEP (H. E. Beck et al, 2017).
Limitations of hydrological models in high-latitude watersheds include a lack of important physical processes such as permafrost interactions, ice effects on rivers and lake outlets and complex processes in the snowpack. Calibration of highly parameterized models such as wflow-HBV masks underlying physical processes and does not explicitly represent them. This limits applicability for certain types of assessment such as permafrost thaw with climate change, which will alter runoff processes (Duan et al., 2017). Incorporating additional remote sensing data, including land and lake cover, can improve the spatial representation of physical processes and allow assessment based on land use changes.
5.2 SWE measurement for operation and planning purposes
SWE is used by operational water managers to predict the inflow volumes from snowmelt and to anticipate peak discharges. The results of this study demonstrate, however, that SWE measurement for application in hydrological forecasting is still problematic in the Snare Watershed. Consideration of multiple data sources and methodological improvement of data collection can be used to update model states.
In situ measurement of SWE from snowpack surveys provides an end-of-season snapshot measurement and, due to the long data record in the Snare Watershed, allows comparison with previous years. Field data collection could be improved with strategies that consider topographical and vegetative characteristics of the watershed to improve and standardize site selection (Rees et al., 2014). The recognition that while inter-annual variability of snowpack is high, distribution patterns are relatively consistent would improve SWE measurement due to typifying station measurements based on topographic relief.
Snowpack SWE in the conceptual hydrological models forced by MSWEP and WFDEI global have comparable magnitudes to snowpack survey measurements. Given that conceptual models do not include sublimation, which is known to remove a large quantity of snowpack SWE, the MSWEP and WDFEI global re-analysis datasets tend to underestimate actual snowfall. This is difficult to verify as precipitation gauge measurements at high latitudes are known to have large under-catch. Sublimation of snowpack SWE is also very difficult to measure and verify, particularly from remote sensing data (Petropoulos, 2013).
GlobSnow is well suited to providing accessible, timely SWE data as supplementary information for water managers and for assimilation into operational modelling systems. Snow data assimilation for hydrological forecasting is an emerging field and can be applied to operational water management systems (Huang et al., 2017; Montero et al., 2016). However, SWE products based on passive microwave measurements such as GlobSnow under-predict SWE of tundra and boreal environments present across northern Canada (Larue et al., 2017; Takala, 2011). Improvement of retrieval algorithms and the assimilation of in situ estimates can reduce error, though overcoming inherent the limitations of measuring deep (> 150 mm) or wetted snowpack will require novel approaches. Our results suggest that the assumption of a constant density used in GlobSnow is a source of error in the early and late periods of accumulation, and advancing over this assumption could help improve the SWE estimates from products such as GlobSnow.
5.3 Global re-analysis datasets for local application
To be of use in operational managers and planners, the global re-analysis datasets and hydrological models presented in this study must provide reliable data to inform decision making and decrease uncertainty. In the context of the Snare Watershed and snowmelt-driven hydropower operations, the snowpack SWE is the predominant source of uncertainty. Current operation of the Snare Hydro System relies on local expert knowledge, historical records and surrogate hydrographs. These methods will be challenged by changes to local hydrology, snow duration and snowmelt quantity with climate change.
The use of global re-analysis datasets helps with short-term planning by allowing the development of more reliable and accurate hydrological models, which form the basis of forecasting systems. Hydrological models developed with local data alone will have greater calibration parameter uncertainty and less rigorous validation. The calibrated wflow-HBV model was integrated into the Delft-FEWS operational forecasting platform (Werner et al., 2013). The use of this established framework and forecasting tool can improve operator confidence around water release and operation within water license limits.
This study demonstrates that SWE estimation for prediction of snowmelt volume and peak discharge is a persistent challenge. Choice of forcing data has a large effect compared to selection of model, and while global hydrological models can replicate the magnitude of end of season SWE, the difficultly is in accurately predicting inter-annual variability. SWE estimation from passive microwave measurements was found to be a poor predictor, which is consistent with a recent validation study of GlobSnow over eastern Canada that concludes the product accuracy to currently be insufficient for hydrologic simulations (Larue et al., 2017). SWE measurement from passive microwave has poor agreement with spring discharge volume, possibly due to algorithm errors at high SWE values (Rawlins et al., 2006). A locally calibrated hydrological-model-generated snowpack SWE that the more predictive of snowmelt volume and peak discharge than uncalibrated global models.
The manual collection of end of-winter snowpack survey data is justified, as the study shows that ground data are a comparatively reliable predictor of snowmelt contribution to streamflow and peak discharge. Improved field measurement techniques that exploit snow distribution across local topography could help further improve the quality, frequency and predictive ability of ground measurement data. These data could be optimally merged with model data using data assimilation methods (Sun et al., 2016).
The methods described in this study improve representation of the hydrological processes and forecasting application could allow a better operational strategy to be implemented. Global datasets, and in particular meteorological re-analysis data, are useful not only for broad scale assessment, but can be applied for accurate discharge modelling and development of a hydrological forecasting system. This has practical relevance for operational water management in the sub-Arctic.
This study demonstrates that considerable gains in hydrological assessment and model performance for high-latitude watersheds can be achieved with global re-analysis datasets and conceptual hydrological models. The findings of this study are relevant to operational water management in high-latitude catchments with sparse meteorological data and to current scientific research in the estimation of SWE with global remote sensing and re-analysis data. The methods described in this study can be readily applied in the Canadian sub-Arctic where watersheds do not have comprehensive meteorological data or operational hydrological models.
Results of the application of global re-analysis datasets to a locally distributed conceptual model (wflow-HBV) show that the spring snowmelt discharge can be predicted well in terms of timing and magnitude over a 30-year period. Model performance for discharge and select physical processes is improved through constrained parameter optimization, but it is also clear from the results that the calibrated HBV model parameters may compensate for cryosphere processes such as sublimation that are lacking in the model.
This study highlighted the limitations of SWE derived from global re-analysis datasets and conceptual hydrological models to predict the volume of snowmelt and peak discharge rates. Comparison of global re-analysis datasets in the eartH2Observe project shows improved performance in MSWEP precipitation forcing compared to WFDEI for snowpack representation. MSWEP forcing data produced more realistic inter-annual snowpack SWE, which was better able to predict snowmelt volume and peak spring discharge. This finding was consistent for five global hydrological models assessed over the local study area, demonstrating the importance of precipitation forcing data relative to model structure. Data products available in near-real time such as MSWEP-NRT, which is a variant of the historic MSWEP dataset, can be similarly applied to model forcing in remote regions. Using Delft-FEWS, scheduled model runs can be used to keep model states current and generate regularly scheduled hydrological forecasts (H. Beck et al., 2017).
SWE estimation for prediction of snowmelt volume and peak discharge is a persistent challenge. SWE products based on passive microwave measurements such as GlobSnow under-predict SWE in boreal and tundra environments, particularly in the late winter season prior to snowmelt. Improvement of retrieval algorithms and the assimilation of in situ estimates can reduce error, though overcoming inherent limitations measuring deep (> 150 mm) or wetted snowpacks will require novel approaches. Our results suggest the assumption of a constant density used in GlobSnow is a source of error in the early and late periods of accumulation, and not making this assumption could help improve the SWE estimates from products such as GlobSnow.
This study has demonstrated the utility of global re-analysis datasets for hydrological assessment in the data-sparse Canadian sub-Arctic. In the operational context of the Snare Hydro System, the length and breadth of hydrological assessment presented here is much greater than could be achieved with local meteorological data. Further research can focus on the optimal merging of observed and modelled snow data to improve predictability of snowmelt volume and peak discharge. The continued development of these datasets and modelling frameworks is promising, helping to improve the understanding of water resources in data-sparse northern regions in the face of climate change.
All input data and modelling software used in this study are available online free of charge for research purposes.
Meteorological forcing datasets are accessible from the eartH2Observe database (PML RGS THREDDS Data Server, 2015; Schellekens et al., 2017). GlobSnow-2 SWE is available via FTP access (Luojus et al., 2014). The wflow-HBV is an open-source modelling framework and the latest versions are available for download (Openstreams, 2016). Local data for discharge stations, meteorological stations and snowpack surveys are available online (GNWT, 2016; WSC, 2016).
The supplement related to this article is available online at: https://doi.org/10.5194/hess-22-4685-2018-supplement.
DRC, MW, AW and DS contributed to the design, methodology, and implementation of the research. MW, AW and DRS supervised the research. DRC and AW designed and implemented the model. DRC performed the model calibration, data processing and analysis. DRC wrote the paper with contribution from MW.
The authors declare that they have no conflict of interest.
This article is part of the special issue “Integration of Earth observations and models for global water resource assessment”. It is not associated with a conference.
This research received funding from the European Union Seventh Framework
Programme (FP7/2007-2013) under grant agreement no. 603608, “Global Earth
Observation for integrated water resource assessment”: eartH2Observe. This
study would not have been possible without access to open-source datasets
generated from the eartH2Observe project and the development of open-source
software packages including wflow and Delft-FEWS. Chris Derksen and
Emanuel Dutra are acknowledged for their advice throughout the study and
helpful comments on the paper. The first author acknowledges
the Master programme “Water Science and Engineering” (specialisation in
Hydroinformatics) of IHE Delft Institute for Water Education, in the
framework of which this study has been carried out.
Edited by: Gianpaolo Balsamo
Reviewed by:
Emanuel Dutra and one anonymous referee
Allen, R. G., Pereira, L. S., Raes, D., and Smith, M: Crop evapotranspiration-Guidelines for computing crop water requirements, FAO Irrigation and drainage paper, 56, 6541, 1998.
AMAP: Arctic Climate Issues 2011: Changes in Arctic Snow, Water, Ice and Permafrost, SWIPA 2011, Gaustadalléen 21, 0349 Oslo, Norway, 2012.
Beck, H., van Dijk, A., Leviizzani, V., Schellekens, J., Miralles, G., Martrens, B., de Roo, A., Pappenberger, F., Huffman, G., and Wood, E.: MSWEP: 3-hourly 0.1? fully global precipitation (1979–present) by merging gauge, satellite, and weather model data [Abstract], Geophysical Research Abstracts, 19, 2017.
Beck, H. E., van Dijk, A. I. J. M., Levizzani, V., Schellekens, J., Miralles, D. G., Martens, B., and de Roo, A.: MSWEP: 3-hourly 0.25∘ global gridded precipitation (1979–2015) by merging gauge, satellite, and reanalysis data, Hydrol. Earth Syst. Sci., 21, 589–615, https://doi.org/10.5194/hess-21-589-2017, 2017.
Bergström, S.: The HBV Model – its structure and applications, NORRKÖPING, Sweden, 1992.
Bierkens, M. F. P. and Van Beek, L.: The Global Hydrological Model PCR-GLOBWB, P.O. Box 80115, 3508 TC, Utrecht, the Netherlands, 2009.
Brown, R. D. and Mote, P. W.: The Response of Northern Hemisphere Snow Cover to a Changing Climate, J. Climate, 22, 2124–2145, 2009.
Burkley, J.: Hydrograph Separation using HYDSEP, File Exchange, MathWorks, available at: http://nl.mathworks.com/matlabcentral/fileexchange/36387-hydrograph-separation-using-hydsep/content/f_hysep.m (last access: 30 April 2017), 2012.
Clark, D. B., Mercado, L. M., Sitch, S., Jones, C. D., Gedney, N., Best, M. J., Pryor, M., Rooney, G. G., Essery, R. L. H., Blyth, E., Boucher, O., Harding, R. J., Huntingford, C., and Cox, P. M.: The Joint UK Land Environment Simulator (JULES), model description – Part 2: Carbon fluxes and vegetation dynamics, Geosci. Model Dev., 4, 701–722, https://doi.org/10.5194/gmd-4-701-2011, 2011.
DDC: Hydrology Baseline Report, ANNEX X: APPENDIX A: ANNOTATED BIBLIOGRAPHY, Golder Associates Ltd., Yellowknife, NWT, Canada, 2014.
Derkson, C., Sturm, M., Liston, G. E., Holmgren, J., Huntington, H., Silis, A., and Solie, D.: Northwest Territories and Nunavut Snow Characteristics from a Subarctic Traverse: Implications for Passive Microwave Remote Sensing, J. Hydrometeorol., 10, 448–462, 2008.
Dery, S. and Yau, M.: Large-scale mass balance effects of blowing snow and surface sublimation, J. Geophys. Res.-Atmos., 107, 213–227, https://doi.org/10.1029/2001jd001251, 2002.
Devine, K. and Mekis, E.: Field accuracy of Canadian rain measurements, Atmos. Ocean, 46, 213–227, https://doi.org/10.3137/ao.460202, 2008.
Duan, L., Man, X., Kurylyk, B., and Cai, T.: Increasing Winter Baseflow in Response to Permafrost Thaw and Precipitation Regime Shifts in Northeastern China, Water, 9, 25, https://doi.org/10.3390/w9010025, 2017.
Dutra, E., Balsamo, G., Viterbo, P., Mirand, P., Beljaars, A., Schar, C., and Elder, K.: New snow scheme in HTESSEL: description and offline validation, ECMWF607, available at: https://www.ecmwf.int/sites/default/files/elibrary/2009/9167-new-snow-scheme-htessel-description-and-offline-validation.pdf (last access: 30 April 2017), 2009.
eartH2Observe: earth2observe downscaling tools, available at: https://github.com/earth2observe/downscaling-tools/releases, last access: 25 November 2016.
eartH2Observe: eartH2Observe Water Cycle Integrator (WCI): https://wci.earth2observe.eu/, last access: 3 March 2017.
ECG: Ecological regions of the Northwest Territories, Government of Northwest Territories, Yellowknife, NT, Canada, 2008.
ENR: Historical Climate Data – Online Database, available at: http://climate.weather.gc.ca/index_e.html, last access: 28 October 2016.
ENR: Real-Time Hydrometric Data, available at: https://wateroffice.ec.gc.ca/mainmenu/real_time_data_index_e.html#wb-cont, last access: 1 April 2017.
Flörke, M., Kynast, E., Bärlund, I., Eisner, S., Wimmer, F., and Alcamo, J.: Domestic and industrial water uses of the past 60 years as a mirror of socio-economic development: A global simulation study, Global Environ. Chang., 23, 144–156, 2013.
Geem, Z., Kim, J., and Loganathan, G.: A New Heuristic Optimization Algorithm: Harmony Search, Simulation, 76, 60–68, 2001.
GNWT: Snow Survey – Spreadsheet Summary, E. a. N. R. Government of the Northwest Territories, Water Resources Division. Yellowknife, Northwest Territories, Canada, available at: http://www.enr.gov.nt.ca/programs/snow-surveys, last access: 1 April 2017.
Government of Canada: National Ecological Framework, available at: http://sis.agr.gc.ca/cansis/nsdb/ecostrat/index.html, last access: 29 January 2013.
Gupta, H. V., Kling, H., Koray, Y., and Martinez, G.: Decomposition of the mean squared error and NSE performance criteria: Implications for improving hydrological modelling, J. Hydrol., 377, 80–91, 2009.
Huang, C., Newman, A. J., Clark, M. P., Wood, A. W., and Zheng, X.: Evaluation of snow data assimilation using the ensemble Kalman filter for seasonal streamflow prediction in the western United States, Hydrol. Earth Syst. Sci., 21, 635–650, https://doi.org/10.5194/hess-21-635-2017, 2017.
Karssenberg, D., Schmitz, O., Salamon, P., de Jong, K., and Bierkens, M.: A software framework for construction of process-based stochastic spatio-temporal models and data assimilation, Environ. Modell. Softw., 25, 489–502, https://doi.org/10.1016/j.envsoft.2009.10.004, 2010.
Kokelj, S.: Hydrologic Overview of the North and South Slave Regions Water Resources Division Yellowknife, Northwest Territories, Canada, 2003.
Larue, F., Royer, A., De Sève, D., Langlois, A., Roy, A., and Brucker, L.: Validation of GlobSnow-2 snow water equivalent over Eastern Canada, Remote Sens. Environ., 194, 264–277, https://doi.org/10.1016/j.rse.2017.03.027, 2017.
Lindstrom, G., Johansson, B., Persson, M., Gardelin, M., and Bergstrom, S.: Development and test of the distributed HBV-96 hydrological model, J. Hydrol., 201, 272–288, 1997.
Liston, G., McFadden, J., Sturm, M., and Pielke, R.: Modelled changes in arctic tundra snow, energy and moisture fuxes due to increased shrubs, Glob. Change Biol., 8, 17–32, 2002.
Liston, G. and Sturm, M.: The role of winter sublimation in the Arctic moisture budget, Nord. Hydrol., 35, 325–334, 2004.
Liu, Y., Weerts, A. H., Clark, M., Hendricks Franssen, H.-J., Kumar, S., Moradkhani, H., Seo, D.-J., Schwanenberg, D., Smith, P., van Dijk, A. I. J. M., van Velzen, N., He, M., Lee, H., Noh, S. J., Rakovec, O., and Restrepo, P.: Advancing data assimilation in operational hydrologic forecasting: progresses, challenges, and emerging opportunities, Hydrol. Earth Syst. Sci., 16, 3863–3887, https://doi.org/10.5194/hess-16-3863-2012, 2012.
Liu, Y., Peters-Lidard, C. D., Kumar, S. V., Arsenault, K. R., and Mocko, D. M.: Blending satellite-based snow depth products with in situ observations for streamflow predictions in the Upper Colorado River Basin, Water Resour. Res., 51, 1182–1202, https://doi.org/10.1002/2014WR016606, 2015.
Luojus, K., Pullianen, J., Takala, M., J. Lemmetyinen, Kangwa, M., M. Eskelinen (FMI), (SYKE), S. M., R. Solberg, A.-B. S. N., G. Bippus, E. R., T. Nagler (ENVEO), (EC), C. D., (GAMMA), A. W., Wunderle, S., (UniBe), F. H., Fontana, F., and (MeteoSwiss), N. F.: GlobSnow-2 Final Report, available at: http://www.globsnow.info/docs/GlobSnow_2_Final_Report_release.pdf (last access: 30 April 2017), European Space Agency, 2014.
Marsh, P., Quinton, B., and Pomeroy, J.: HYDROLOGICAL PROCESSES AND RUNOFF AT THE ARCTIC TREELINE IN NORTHWESTERN CANADA, National Hydrology Research Institute Saskatoon, Sask., 1995.
McCabe, G. J., Clark, M., and Hay, L. E.: Rain on Snow Events in the Western United States, American Meterological Society, 2007.
McNamara, J., Kane, D., and Hinzman, L.: An analysis of streamflow hydrology in the Kuparuk River Basin, Arctic Alaska: a nested watershed approach J. Hydrol., 206, 39–57, 1998.
Mekis, E. and Hogg, W.: Rehabilitation and analysis of Canadian daily precipitation time series, Atmos. Ocean, 37, 53–85, https://doi.org/10.1080/07055900.1999.9649621, 1998.
Mekis, E. and Vincent, L.: An Overview of the Second Generation Adjusted Daily Precipitation Dataset for Trend Analysis in Canada, Atmos. Ocean, 49, 163–177, 2011.
Montero, R. A., Schwanenberg, D., Krahe, P., Lisniak, D., Sensoy, A., Sorman, A. A., and Akkol, B.: Moving horizon estimation for assimilating H-SAF remote sensing data into the HBV hydrological model, Adv. Water Resour., 92, 248–257, https://doi.org/10.1016/j.advwatres.2016.04.011, 2016.
Moriasi, D. N., Arnold, J. G., Van Liew, M. W., Bingner, R. L., Harmel, R. D., and Veith, T. L.: Model Evaluation Guidelines for Systematic Quantification of Accuracy in Watershed Simulations, T. ASABE, 50, 885–900, 2007.
Mudryk, L. R., Derksen, C., Kushner, P. J., and Brown, R.: Characterization of Northern Hemisphere Snow Water Equivalent Datasets, 1981–2010, J. Climate, 28, 8037–8051, 2015.
Nash, J. E. and Sutcliffe, J. V.: River flow forecasting through conceptual models part I – A discussion of principles, J. Hydrol., 10, 282–290, https://doi.org/10.1016/0022-1694(70)90255-6, 1970.
National Ecological Framework: available at: http://sis.agr.gc.ca/cansis/nsdb/ecostrat/index.html, last access: 29 January 2013.
National Research Council: Colorado River Basin Water Management: Evaluating and Adjusting to Hydroclimatic Variability, 978-0-309-10524-8, 2007.
Nolin, A. W.: Recent advances in remote sensing of seasonal snow, J. Glaciol., 56, 1141–1150, 2011.
OpenStreams: wflow stable release documentation, available at: http://wflow.readthedocs.io/en/stable/, last access: 12 September 2016.
Perez, R., Jansen, P., and Joaquim, R.: pyOpt: A Python-Based Object-Oriented Framework for Nonlinear Constrained Optimization, Struct. Multidiscip. O., 45, 101–118 2012.
Petropoulos, G.: Remote Sensing of Energy Fluxes and Soil Moisture Content: Challenges and Future Outlook, CRC Press, 2013.
PML RGS THREDDS Data Server: available at: https://wci.earth2observe.eu/thredds/catalog-earth2observe.html, last access: 25 November 2015.
Pomeroy, J., Marsh, P., and Gray, D.: Application of a Distributed Blowing Snow Model to the Arctic, Hydrol. Process., 11, 1451–1464, 1997.
Pomeroy, J. W., Hedstrom, N. R., Parviainen, J., and Granger, R. J.: The Snow Mass Balance of Wolf Creek , Yukon : Effects of Snow Sublimation and Redistribution, National Water Research Institute, 15–30, 1999.
Rawlins, M., Fahnestock, M., Frolking, S., and Vorosmarty, C.: On the Evaluation of Snow Water Equivalent Estimates over the Terrestrial Arctic Drainage Basin, 63nd EASTERN SNOW CONFERENCE, Newark, Delaware, USA, 2006.
Rees, A., English, M., Derksen, C., and Silis, A.: The Distribution and Properties and Role of Snow Cover in the Open Tundra 64th EASTERN SNOW CONFERENCE St. John's, Newfoundland, Canada, 2007.
Rees, A., English, M., Derkson, C., Toose, P., and Sillis, A.: Observations of late winter Canadian Tundra snow sover properties, Hydrol. Process., 28, 3962–3977, https://doi.org/10.1002/hyp.9931, 2014.
Schelker, J., Kuglerová, L., Eklöf, K., Bishop, K., and Laudon, H.: Hydrological effects of clear-cutting in a boreal forest – Snowpack dynamics, snowmelt and streamflow responses, J. Hydrol., 484, 105–114, https://doi.org/10.1016/j.jhydrol.2013.01.015, 2013.
Schellekens, J., Dutra, E., Martínez-de la Torre, A., Balsamo, G., van Dijk, A., Sperna Weiland, F., Minvielle, M., Calvet, J.-C., Decharme, B., Eisner, S., Fink, G., Flörke, M., Peßenteiner, S., van Beek, R., Polcher, J., Beck, H., Orth, R., Calton, B., Burke, S., Dorigo, W., and Weedon, G. P.: A global water resources ensemble of hydrological models: the eartH2Observe Tier-1 dataset, Earth Syst. Sci. Data, 9, 389–413, https://doi.org/10.5194/essd-9-389-2017, 2017.
Simpson, G.: genURLs.R, available at: https://gist.github.com/gavinsimpson/8c13e3c5f905fd67cf85, last access: 28 October 2016.
Sloto, R. and Crouse, M.: HYSEP: A Computer Program for Streamflow Hydrograph Separation and Analysis, Lemoyne, Pennsylvania, USA, 1996.
Snauffer, A., Hsieh, W., and Cannon, A.: Comparison of gridded snow water equivalent products with in situ measurements in British Columbia, Canada, J. Hydrol., 541, 714–726, https://doi.org/10.1016/j.jhydrol.2016.07.027, 2016.
Sospedra-Alfonso, R., Merryfield, W. J., and Kharin, V. V.: Representation of Snow in the Canadian Seasonal to Interannual Prediction System. Part II: Potential Predictability and Hindcast Skill, J. Hydrometeorol., 17, 2511–2535, https://doi.org/10.1175/jhm-d-16-0027.1, 2016.
Stieglitz, M., Hobbie, J., Giblin, A., and Kling, G.: Hydrologic modelling of an Arctic Tundra Basin: Toward pan-Arctic predictions, J. Geophys. Res., 104, 507–527, 1999.
Sugiura, K., Ohata, T., and Yang, D.: Catch Characteristics of Precipitation Gauges in High-Latitude Regions with High Winds, J. Hydrometeorol., 7, 984–994, https://doi.org/10.1175/jhm542.1, 2006.
Sun, L., Seidou, O., Nistor, I., and Liu, K.: Review of the Kalman-type hydrological data assimilation, Hydrolog. Sci. J., 61, 2348–2366, https://doi.org/10.1080/02626667.2015.1127376, 2016.
Takala, M., Luojus, K., Pulliainen, J., Derksen, C., Lemmetyinen, J., Kärnä, J.-P., Koskinen, J., and Bojkov, B.: Estimating northern hemisphere snow water equivalent for climate research through assimilation of space-borne radiometer data and ground-based measurements, Remote Sens. Environ., 115, 3517–3529, https://doi.org/10.1016/j.rse.2011.08.014, 2011.
Toebes, C., Morrissey, W. B., Shorter, R., and Hendy, M.: Base Flow Recession Curves, Wellington, New Zealand, 1969.
van Dijk, A. I. J. M., Renzullo, L. J., Wada, Y., and Tregoning, P.: A global water cycle reanalysis (2003–2012) merging satellite gravimetry and altimetry observations with a hydrological multi-model ensemble, Hydrol. Earth Syst. Sci., 18, 2955–2973, https://doi.org/10.5194/hess-18-2955-2014, 2014.
Weedon, G. P., Balsamo, G., Bellouin, N., Gomes, S., Best, M. J., and Viterbo, P.: The WFDEI meteorological forcing data set: WATCH Forcing Data methodology applied to ERA-Interim reanalysis data, Water Resour. Res., 50, 7505–7514, https://doi.org/10.1002/2014WR015638, 2014.
Werner, M., Schellekens, J., Gijsbers, P., van Dijk, M., van den Akker, O., and Heynert, K.: The Delft-FEWS flow forecasting system, Environ. Modell. Softw., 40, 65–77, https://doi.org/10.1016/j.envsoft.2012.07.010, 2013.
wflow stable release documentation: available at: http://wflow.readthedocs.io/en/stable/, last access: 25 January 2016.
Wong, J. S., Razavi, S., Bonsal, B. R., Wheater, H. S., and Asong, Z. E.: Inter-comparison of daily precipitation products for large-scale hydro-climatic applications over Canada, Hydrol. Earth Syst. Sci., 21, 2163–2185, https://doi.org/10.5194/hess-21-2163-2017, 2017.
WSC: Historical Hydrometric Data Search, available at: https://wateroffice.ec.gc.ca/mainmenu/historical_data_index_e.html, last access: 2 November 2016.
Yang, D., Kane, D., Zhang, Z., Legates, D., and Goodison, B.: Bias corrections of long-term (1973–2004) daily precipitation data over the northern regions, Geophys. Res. Lett., 32, L19501, https://doi.org/10.1029/2005GL024057, 2005.
Yue, S., Pilon, P., and Cavadia, G.: Power of the Mann-Kendall and Spearman's rho tests for detecting monotonic trends in hydrological series, J. Hydrol., 259, 254–271, 2002.