the Creative Commons Attribution 4.0 License.
the Creative Commons Attribution 4.0 License.
 | 16 Aug 2018
Evaluation of Doppler radar and GTS data assimilation for NWP rainfall prediction of an extreme summer storm in northern China: from the hydrological perspective
Jiyang Tian
Denghua Yan
Chuanzhe Li
Fuliang Yu
Feifei Shen
Data assimilation is an effective tool in improving high-resolution rainfall of the numerical weather prediction (NWP) systems which always fails in providing satisfactory rainfall products for hydrological use. The aim of this study is to explore the potential effects of assimilating different sources of observations, i.e., the Doppler weather radar and the Global Telecommunication System (GTS) data, in improving the mesoscale NWP rainfall products. A 24 h summer storm occurring over the Beijing–Tianjin–Hebei region of northern China on 21 July 2012 is selected as a case study. The Weather Research and Forecasting (WRF) Model is used to obtain 3 km rainfall forecasts, and the observations are assimilated using the three-dimensional variational (3DVar) data assimilation method. Eleven data assimilation modes are designed for assimilating different combinations of observations in the two nested domains of the WRF model. Both the rainfall accumulative amount and its distribution in space and time are examined for the forecasting results with and without data assimilation. The results show that data assimilation can effectively help improve the WRF rainfall forecasts, which is of great importance for hydrologic applications through the rainfall–runoff transformation process. Both the radar reflectivity and the GTS data are good choices for assimilation in improving the rainfall products, whereas special attention should be paid to assimilating radial velocity where unsatisfactory results are always found. The assimilation of the GTS data in the coarser domain has positive effects on the radar data assimilation in the finer domain, which can make the rainfall forecasts more accurate than assimilating the radar data alone. It is also found that the assimilation of more observations cannot guarantee further improvement of the rainfall products, whereas the effective information contained in the assimilated data is of more importance than the data quantity. Potential improvements of data assimilation in improving the NWP rainfall products are discussed and suggestions are further made.
- Article
(6933 KB) - Full-text XML
- BibTeX
- EndNote


Numerical weather prediction (NWP) systems play an important role in the prediction of meteorological and hydrological processes, with the ability of providing relatively reliable products for analyzing and forecasting weather events (Rodwell et al., 2010; Boussetta et al., 2013). Rainfall is not only a crucial meteorological variable but is also a hydrological element; therefore, it is always important to obtain accurate rainfall information for hydrological use. Unfortunately, because of the uncertainties and complexities of atmospheric processes, rainfall is among the most difficult variables to accurately capture using NWP (Berenguer et al., 2012; Shrestha et al., 2013). The Weather Research and Forecasting (WRF) Model is a latest-generation mesoscale NWP system that has been widely used for rainfall simulation and prediction (Efstathiou et al., 2013; Yang et al., 2015). Although rainfall products can be directly used due to the high accuracy of rain or no-rain predictions, the WRF model still cannot ensure accurate rainfall quantities or spatiotemporal distributions at the catchment scale for hydrological prediction (Liu et al., 2012, 2013a).
Qie et al. (2014) simulated a storm event that featured short-term (12 h) heavy rainfall and frequent lightning activity over northern China using the WRF model. The results showed that the mean absolute error of the 6 h accumulated rainfall was 39.8 mm for an observed rainfall range of 20–50 mm, whereas the mean absolute error reached 53.3 mm for an observed rainfall range of 11–20 mm. Hamill (2014) used an ensemble prediction system to analyze the performance of the WRF model in northern Colorado. Although ensemble prediction could avoid the complications induced by uncertainties, the accumulated rainfall also had a large bias compared with the observations. Kryza et al. (2013) found that the WRF model always underestimated the 24 h accumulated rainfall in Poland, and the rainfall coverage area greatly changed based on different physical parameterizations. Efstathiou et al. (2013) indicated that the WRF model could not capture the maximum rainfall intensity in either time or space at Chalkidiki, Greece. Gascón et al. (2016) used the WRF model to simulate an exceptionally heavy convective rainfall on 3 July 2006 in Calabria, Italy. The simulation results were unsatisfactory, and the total rainfall was significantly underestimated.
Data assimilation has been shown to be an efficient way in improving the quality of the WRF rainfall products (Liu et al., 2013b). The WRF model provides a three-dimensional variational (3DVar) data assimilation system, i.e., WRF-3DVar (Barker et al., 2004), that works in tandem with the WRF model in real time. The system can assimilate various types of conventional and unconventional data, such as observations from surface weather stations, buoys, ships, pilot balloons, radars and satellites (Routray et al., 2010). Many studies have shown that WRF-3DVar works well with observations from different sources. Routray et al. (2012) assimilated upper-air and surface data from the Global Telecommunication System (GTS) using WRF-3DVar, and the results showed that the location and amount of rainfall was captured better over the west coast of India when compared with the simulation without data assimilation. Wind observations were also assimilated using WRF-3DVar as the main observed data for rainfall simulation in India, and the rainfall intensity and spatial distribution were considerably improved (Mohanty et al., 2012). To improve heavy rainfall forecasts over the Korean Peninsula, global positioning system (GPS) radio occultation (RO) data were used with WRF-3DVar (Ha et al., 2014). Results indicated that the quantitative accuracy of the rainfall forecast was in better agreement with observations, especially the maximum rainfall amount.
Compared with other observational data, Doppler radar can obtain detailed rainfall information with spatial resolutions of a few kilometers and temporal resolutions of a few minutes (Sugimoto et al., 2009). With high spatial and temporal resolutions, Doppler radar can reveal detailed structural features of mesoscale storms and capture rapidly developing convective weather systems (Pu et al., 2009; Maiello et al., 2014). Moreover, Doppler radar can provide real-time observations that can be assimilated using WRF-3DVar and used for real-time rainfall forecasts (Liu et al., 2013b). Some studies have also indicated that significant improvements could be obtained in rainfall simulations using data assimilation (Bauer et al., 2015), because radar data can provide more detailed information on the initial fields and improve the lateral boundary conditions of the WRF model (Sokol and Pešice, 2009).
Doppler radar can provide two types of observations for assimilation, i.e., radar reflectivity and radial velocity. Both have been found to have positive impacts on NWP rainfall simulations and forecasts, especially for heavy rainfall events (Li et al., 2012). Based on the operating principle of Doppler radar, reflectivity contains information on the number of falling drops per unit volume, which depends on the hydrometeor number and size, whereas radial velocity is related to vertical atmospheric motions (Maiello et al., 2014). This means that assimilating reflectivity impacts the thermodynamic and dynamic fields, whereas radial velocity assimilation only influences the dynamic fields (Xiao and Sun, 2007; Abhilash et al., 2012). Li et al. (2012) indicated that assimilating radial velocity every 30 min could improve the accuracy of rainfall (caused by hurricane) intensity prediction. Sun et al. (2012) found that the pattern and location of forecasted rainfall were noticeably improved with radar reflectivity assimilation. Pan et al. (2012) found that the WRF model can capture rainfall distributions in time and space better by assimilating both Doppler radar reflectivity and radial velocity. Abhilash et al. (2012) went further and compared the assimilation effects of radar reflectivity and radial velocity. Results showed that the assimilation of both radar reflectivity and radial velocity significantly improved most meteorological elements, including wind, moisture and rainfall.
However, it has been found that data assimilation is mainly used for synoptic analyses of meteorological fields. The potential of data assimilation has not been fully studied for hydrological purposes, which require a more rigorous evaluation of rainfall quantities and variations (Liu et al., 2015). Rainfall prediction is especially important for real-time flood forecasting in small-sized catchments which often have short concentration times and need predicted rainfall to extend the flood forecast lead time (Liu and Han, 2013). Therefore, hydrologists are particularly concerned about the accuracy of the accumulative amount and the spatiotemporal distribution of the predicted rainfall at the catchment scale. The spatiotemporal distribution of the predicted rainfall directly impacts the forecasted discharge and the timing of the flood peak through rainfall–runoff transformation modeling. To what extent can the assimilation of Doppler radar observations help improve rainfall predictions of particular storm events at the catchment scale? Is it always the best choice to simultaneously assimilate radar reflectivity and radial velocity? In general, Doppler radar is easily contaminated by non-weather returns, such as second trips, sidelobe clutter, ground clutter and low signal-to-noise returns, which can affect the quality of radar data and the assimilation effect (Zhang et al., 2012). Therefore, it may be of interest to examine whether rainfall predictions can be improved by assimilating radar data with other observations, such as meteorological elements from fixed and mobile stations.
A 24 h storm event that occurred in July of 2012 in the Beijing–Tianjin–Hebei region of northern China was selected for this study. The storm event has received wide attention due to its high intensity and the significant losses caused by the corresponding flooding. The 24 h rainfall that accumulated in the small mountainous catchment of Zijingguan with the drainage area of 1760 km2 was regenerated using the WRF model with different data assimilation scenarios. Observations from an S-band Doppler weather radar that completely covers the Zijingguan catchment were assimilated with the assistance of WRF-3DVar. Traditional meteorological data from the GTS were obtained from the National Center for Atmospheric Research (NCAR). Eleven different data assimilation modes were designed for assimilating different combinations of the three types of data, i.e., radar reflectivity, radial velocity and GTS observations, in the two nested domains of the WRF model. The improvements in the forecasted rainfall from the 11 data assimilation scenarios were evaluated from the perspectives of the accumulative process, the spatiotemporal distribution and the total amount. The performances of different data assimilation scenarios were compared, and the efficient way to assimilate Doppler radar observations for rainfall prediction was further discussed.
2.1 The WRF model setup
The WRF model (version 3.6) is a next-generation meteorological model that includes a variety of physical options and can be used over a wide range of scales, ranging from tens of meters to thousands of kilometers. Detailed descriptions of the model were available in Skamaraock et al. (2008). Two nested domains were centered over the Zijingguan catchment, and two-way nesting was used for communication between the parent and child domains. To obtain high-resolution rainfall products and make the results applicable for hydrological forecasting systems, the horizontal grid spacing of the WRF inner domain (Domain 2) was set to 3 km, and the downscaling ratio was set to 1:3, which was commonly used and always performed well in the Beijing–Tianjin–Hebei region of northern China (Liu et al., 2012; Chambon et al., 2014; Tian et al., 2017b). The nested domain sizes were 1260×1260 and 450×360 km2 for the Zijingguan catchment. The settings of the nested domains have been shown to be effective in previous studies in terms of representing the large-scale topography and the main climate characteristics in the study area (Wang et al., 2013; Tian et al., 2017b). The two domains were comprised of 40 vertical pressure levels, with the top level set to 50 hPa (Done et al., 2004; Aligo et al., 2009; Fierro et al., 2013; Qie et al., 2014). The model initial and lateral boundary conditions were obtained from Global Forecast System (GFS) forecast data, which were provided by NCEP with grids and were widely used to forecast historical storm events (Routray et al., 2010; Ha and Lee, 2012). The time step of the WRF model output was set to 1 h. Considering the use of downscaling and the high resolution needed for meteorological and hydrological studies, the forecasted rainfall in the inner domain was chosen for analysis.
Cumulus physics, microphysics and planetary boundary layer (PBL) are important physical parameterization options for rainfall simulations (Fernández-González et al., 2015). According to our previous investigations on the performances of the most important WRF physical parameterizations affecting the rainfall processes in northern China (Tian et al., 2017a, c), the most appropriate set of parameterizations for this extreme summer storm, including Kain–Fritsch (KF), WRF single-moment 6 (WSM6) and Mellor–Yamada–Janjic (MYJ), was adopted in this study when configuring the WRF model (Miao et al., 2011; Guo et al., 2014; Di et al., 2015).
2.2 3DVar data assimilation
The 3DVar data assimilation produces an optimal estimate of the atmospheric state through the iterative solution of a prescribed cost function (Ide et al., 1997):
where x is the atmospheric and surface state vector, xb is the first guess or background, and y0 is the assimilated observation. y is the observation space derived from the model. B and R are the background error covariance matrix and the observation error covariance matrix, respectively.
The WRF-3DVar data assimilation system in the WRF model was used for assimilating the GTS and weather radar data in real time (Barker et al., 2004; Gao et al., 2004). The background error covariance CV3 was used in this study. The greatest advantage of CV3 is its wide applicability (Meng and Zhang, 2008). The reason why CV3 is used also includes the trial to simplify the data assimilation procedure which enables a more extensive application among hydrologists.
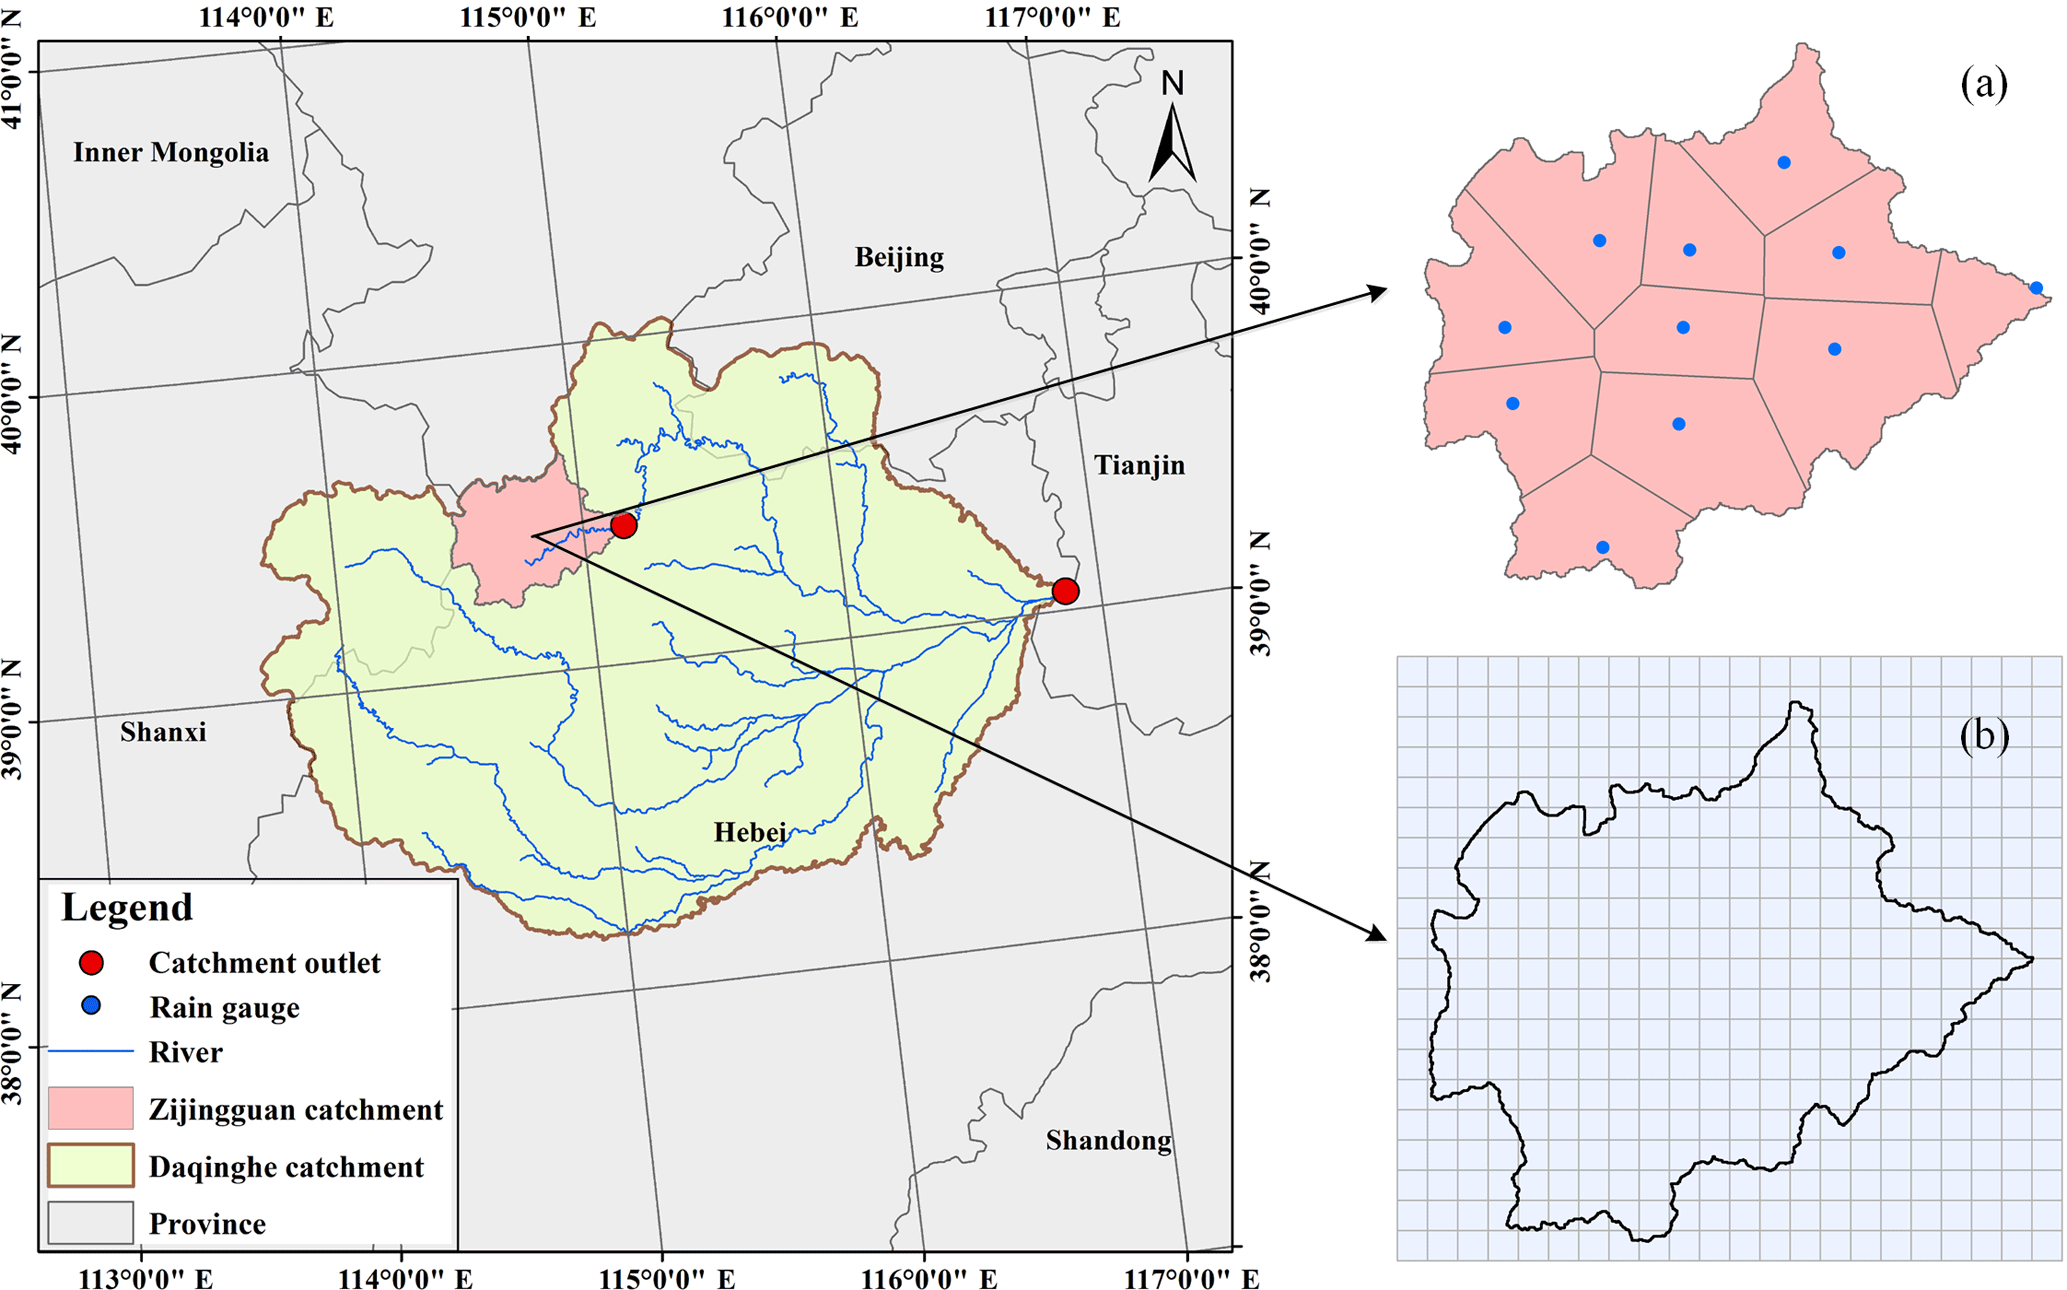
Figure 1The location of the Zijingguan catchment with (a) the 11 rain gauges and (b) the 3 km × 3 km grid cells.
2.3 The observation operators: radar reflectivity and radial velocity
In the WRF-3DVar system, the total water mixing ratio qt was used as the moisture control variable instead of the pseudo-relative humidity when assimilating the radar reflectivity data (Dudhia, 1989). The water mixing ratio has a more direct relation with the radar reflectivity, as described by Eq. (2), which has been proven to be effective in WRF-3DVar as an observation operator to calculate the model-derived radar reflectivity Z from the rainwater mixing ratio qr (Sun and Crook, 1997).
where ρ is the density of air. By assuming a Marshall–Palmer raindrop size distribution and that the ice phases have no effect on reflectivity, Eq. (2) can be derived.
For the assimilation of the radial velocity, the preconditioned wind control variables were also combined with the rainwater mixing ratio qr. Equations (3)–(5) show how the model-derived radial velocity Vr was calculated:
where u, v and w represent the three-dimensional wind field; x, y and z represent the location of the observation point; and xi, yi and zi represent the location of the radar station. ri is the distance between the data point and the radar, and vt is the hydrometer fall speed or terminal velocity.
According to Sun and Crook (1998), vt can be represented as follows:
where a is the correction factor, is the base-state pressure and p0 is the pressure at the ground.
3.1 Study area and the storm event
The Zijingguan catchment, which lies in the northern reach of the Daqing River basin, was chosen as the study area (Fig. 1). It is located at 39∘13′–39∘40′ north latitude and 114∘28′–115∘11′ east longitude and has a drainage area of 1760 km2. It is 54 km long from north to south and 61 km wide from east to west. The Zijingguan catchment has a temperate continental monsoon climate. The average annual rainfall is approximately 600 mm, and the majority of rain falls during the flood season from late May to early September. The size and terrain together with the previous history of extreme storms and floods make the Zijingguan catchment representative of the catchments in the semi-humid and semi-arid area of northern China that require flood warnings. To avoid enormous losses caused by floods, accurate rainfall forecasts are very important.
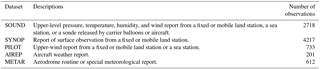
Table 1Descriptions of the GTS datasets assimilated in the study.
A 24 h storm event that occurred over the Beijing–Tianjin–Hebei region on 21 July 2012 was chosen for this study. Because of the high-intensity rainfall, wide coverage and significant losses, the storm event has received widespread attention in China. Many studies have investigated the causes and the properties of the storm (Sang et al., 2013; Zhong et al., 2015). Before the extreme storm event took place, an encounter between a northward-moving subtropical high vortex and an eastward-moving cold vortex in the mid–high troposphere provided a stable atmospheric circulation over the study area, which was conducive to heavy rain formation. Abundant water vapor transported from a low-level jet, strong upward motion caused by the Taihang Mountains and a long duration of dense air humidity were the primary causes of the storm event. The extreme storm event contained two phases: (1) a strong convective rain that occurred in the warm sector ahead of the cold front and (2) a dominant frontal rain after the arrival of the cold front (Guo et al., 2015). Those showed the reasons why the parameterizations of KF, WSM6 and MYJ were chosen for WRF rainfall prediction. KF has strong ability in simulating the low-level jet and the upward transportation of vapor (Kain, 2004). WSM6 contains six water substance variables, which can realistically identify rainfall formation (Kim et al., 2013). MYJ is more suitable for the simulation of the convection system (Janjić, 1994). The 24 h accumulated rainfall with 172 mm led to the high peak flow (2580 m3 s−1) in the Zijingguan catchment. The observed areal rainfall in the Zijingguan catchment can be calculated using the Thiessen polygon method with the rainfall data from the 11 rain gauges, which were chosen as the ground truth to evaluate the WRF outputs. The forecasted areal rainfall was calculated by averaging values of the grid cells that have more than 50 % area located inside the Zijingguan catchment. The 11 rain gauges with the Thiessen polygons and the model grid cells (3 km × 3 km) were shown in Fig. 1.
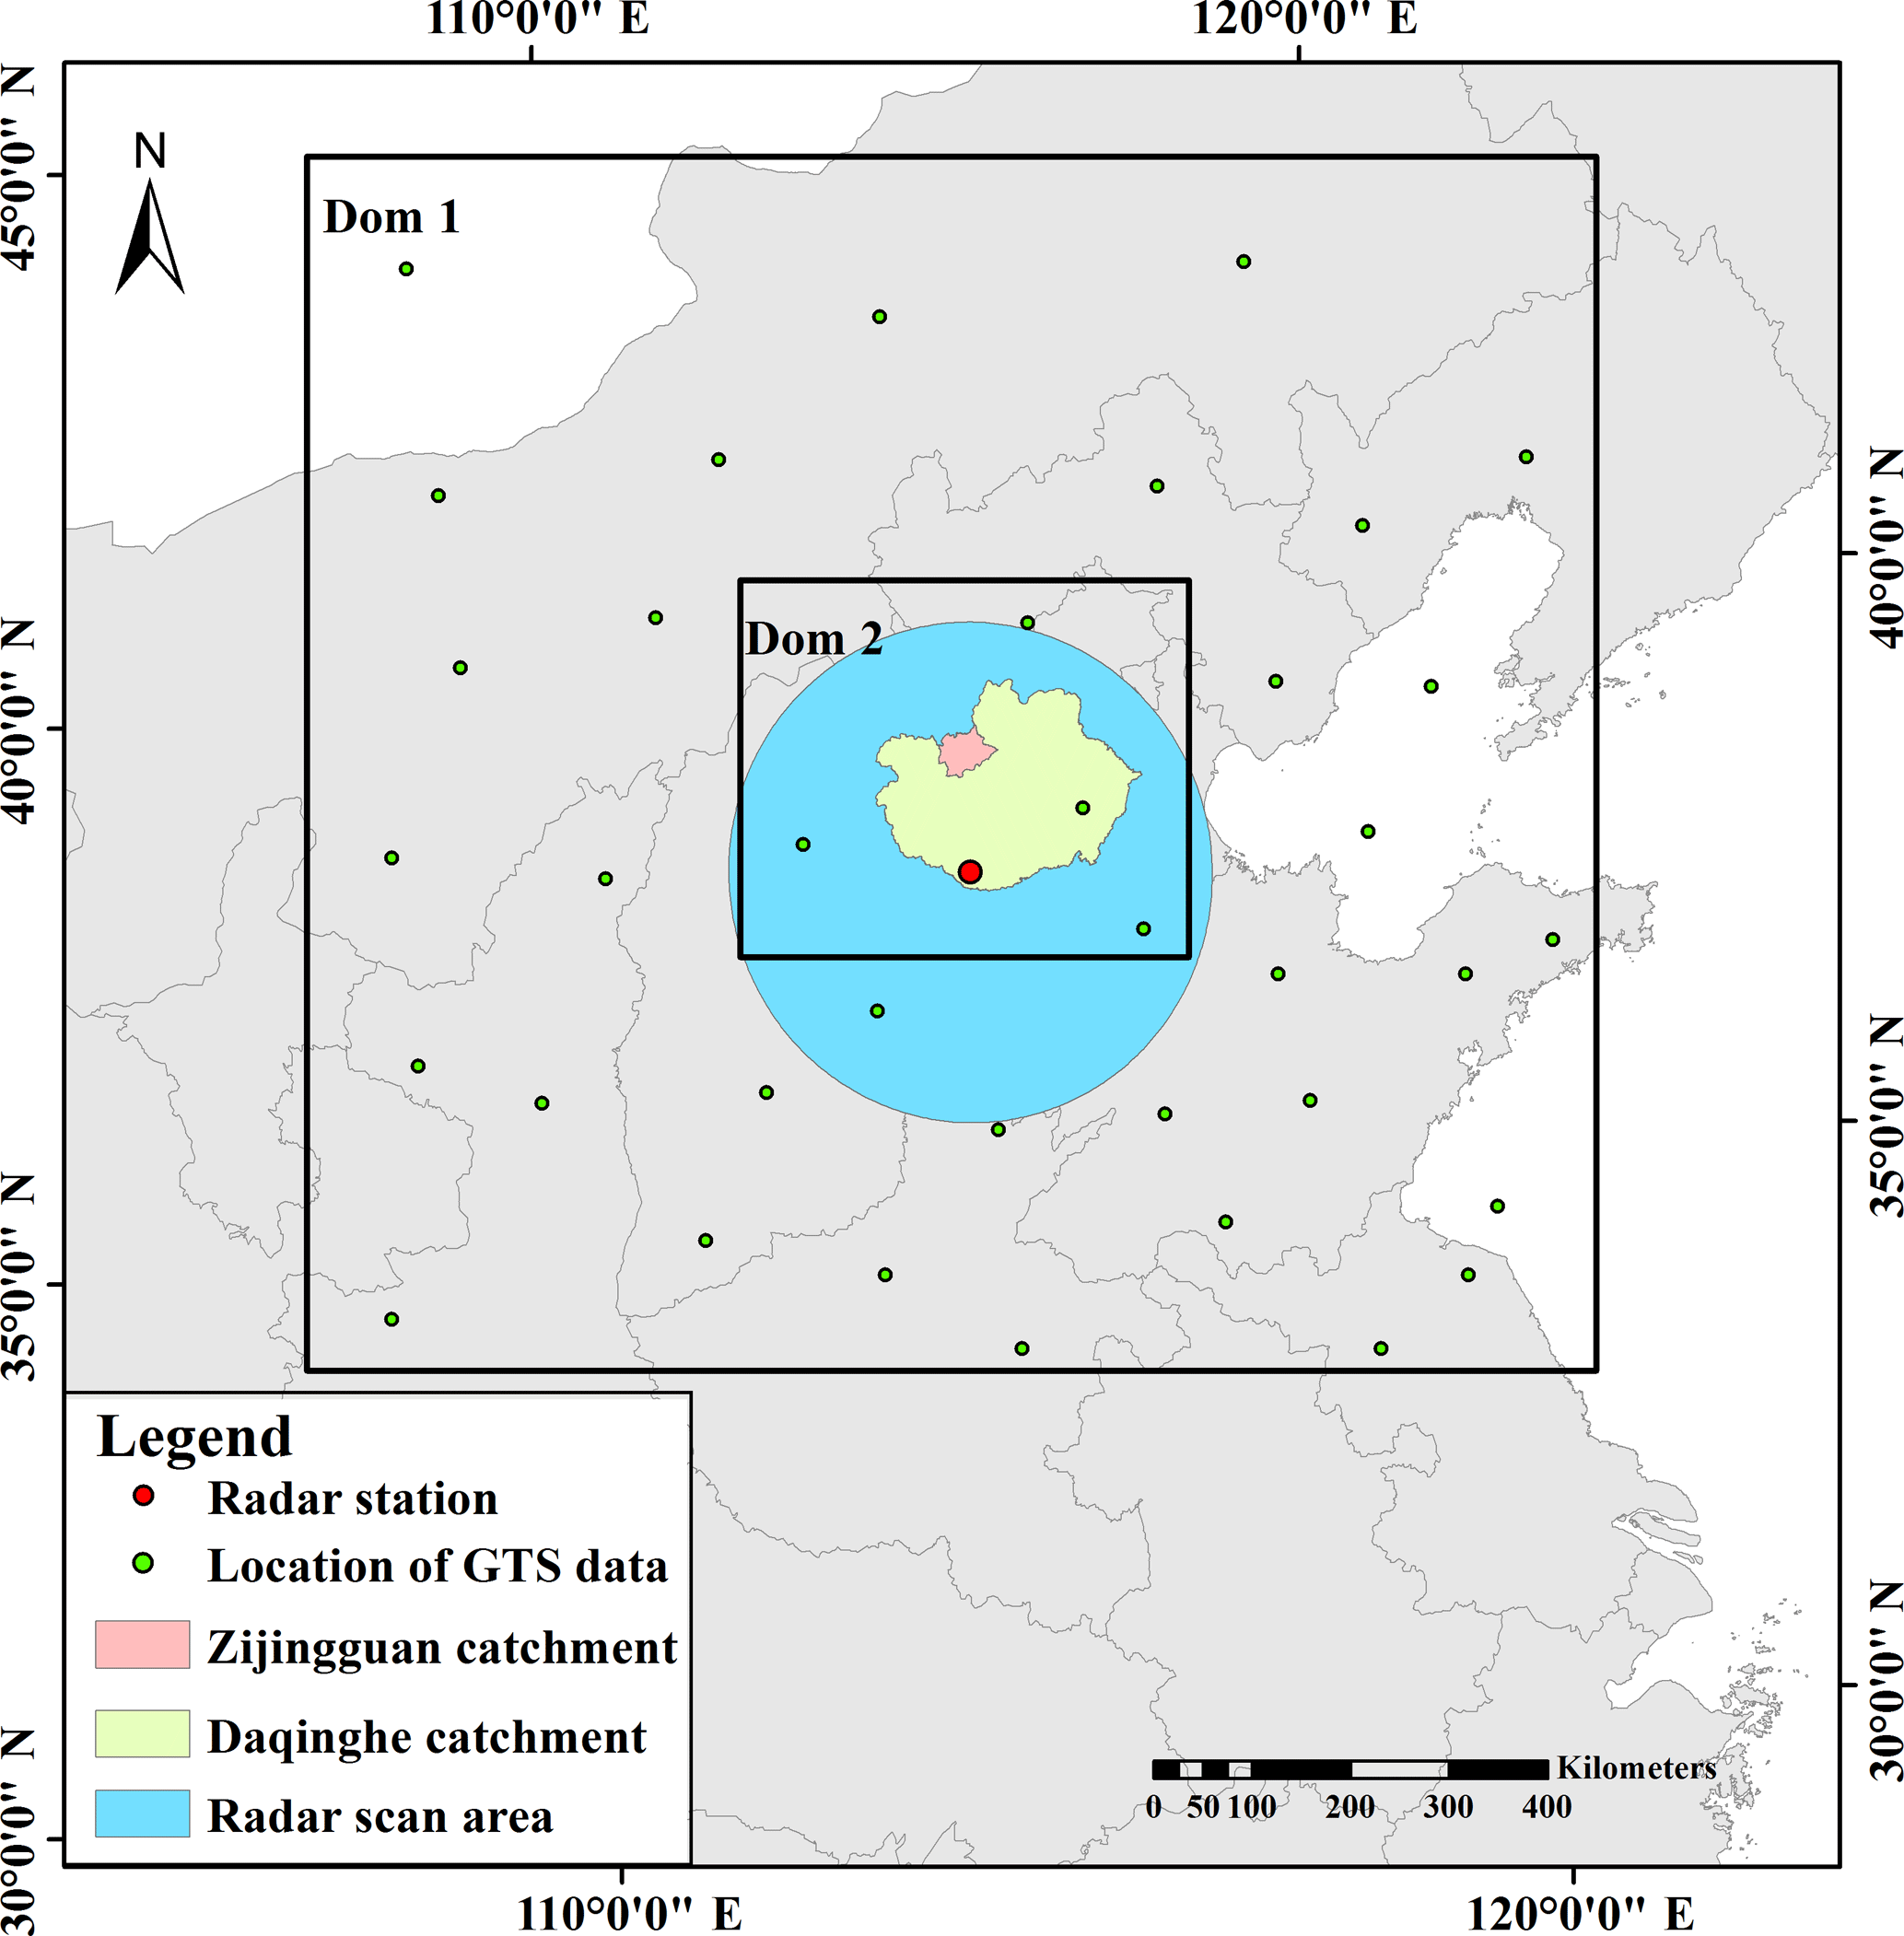
Figure 2Locations of the radar scan area, the GTS data, the study catchments and the two nested domains.
3.2 GTS data
Surface weather station, ship, buoy, pilot balloon, sonde, aircraft and satellite observations from the GTS can be processed using the OBSPROC observation preprocessor before being assimilated using WRF-3DVar. A shell script was compiled to transform the decoded data to the suitable LITTLE_R format, which can be directly used by WRF-3DVar for data assimilation. Wide coverage in horizontal direction and high levels in vertical direction are the main characteristic of the GTS data, although the spatial density of the observations was low, and the time interval of the GTS data was 6 h. Therefore, the GTS data are usually used to improve the prediction of large-scale flows. In this study, five GTS datasets, including SOUND, SYNOP, PILOT, AIREP and METAR, were assimilated in the WRF model. The SOUND and SYNOP data took the majority of the GTS data. Detailed descriptions of the datasets were shown in Table 1. According to Fig. 2, the observations covered by the outer domain were mostly located on land and only a few were on the ocean. The data located on land were distributed evenly.

Figure 3Rainfall observations from the rain gauges and the weather radar: (a) hyetograph of the hourly catchment areal rainfall; (b) spatial distribution of the 24 h rainfall accumulation from the rain gauges; (c) spatial distribution of the 24 h rainfall accumulation from the radar.
The quality control of the GTS data is implemented in WRF-3DVar by defining the observation error covariance. The default US Air Force Weather Agency (AFWA) OBS error file is used in this study, which defines the instrumental and sensor errors for various air, water and surface observation types as well as satellite retrievals.
3.3 Weather radar data
An S-band Doppler weather radar is located in Shijiazhuang, the capital of Hebei province. It is approximately 100 km from the Zijingguan catchment and covers a radius of 250 km. The study area can be completely covered by the radar. The radar cycles include nine different scan elevations every 0.1 h over the course of a day. Figure 2 showed the relative positions of the WRF domains and the radar scan area. To make the atmospheric motions more stable and reduce the nonlinearity in the outer domain, radar data were only assimilated in Domain 2 in this study.
The S-band radar belongs to the newest-generation weather radar network of China (CINRAD), the quality control of which is supported by China Integrated Meteorological Information Service System (CIMISS) of the China Meteorological Administration. The potential error sources, such as ground clutter, radial interference echo, speckles and other artifacts, were removed through the quality control procedure (Tong and Xue, 2005). The rainfall observations from rain gauges and weather radar were also compared to check the quality of the radar data. The following Z–R relationship was used to convert the radar reflectivity into rainfall rates (Hunter, 1996):
where Z is the radar reflectivity in mm6 m−3 and R is the rainfall rate in mm h−1. Figure 3 showed the time series bars and the spatial distributions of the 24 h accumulated rainfall. The accumulated areal rainfall was 160.48 mm observed from the weather radar and 172.17 mm from the rain gauges. Although the accumulated rainfall was slightly underestimated by the weather radar, the spatial distribution of the accumulation was quite consistent with the rain gauges. The temporal variation of the catchment areal rainfall also showed a consistent trend with the rain gauge observations. Therefore, the assimilation of the weather radar data is expected to have positive effect in improving the WRF forecasting results.
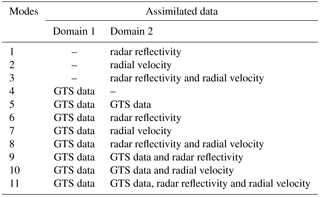
Table 2Designed assimilation modes with different data combinations.
3.4 Mode configurations
To explore the effects of data assimilation using WRF-3DVar for rainfall prediction in the study area, 11 modes were designed based on the different combinations of the available GTS data, radar reflectivities and radial velocities in the two nested domains, as shown in Table 2. The improvements in the rainfall forecasts using data assimilation with the 11 modes were examined in this study and are shown in Table 2. In addition to the different data assimilation combinations, the 11 modes have the same settings of the WRF model and the WRF-3DVar. The purpose of the mode design was to find the most effective way to assimilate the weather radar and traditional meteorological data for improving the WRF rainfall forecasts.
3.5 Cycling the WRF-3DVar runs
WRF-3DVar needs to be run in the cycling mode to continuously assimilate real-time observations during storm events. According to the tests of different spin-up periods (6, 12 and 24 h), which were commonly used in the WRF model (Givati et al., 2012; Pan et al., 2017; Jr and Johnson, 2016), the spin-up periods had little influence on rainfall prediction of the extreme storm event in this study. Considering the calculation efficiency, the 6 h spin-up period was chosen. Figure 4 shows the start and end times of the storm event that occurred on 21 July 2012 and the time bars of the cycling WRF-3DVar runs. The storm event began at 03:00 LT on 21 July 2012 and lasted for 24 h. Data assimilation began at 00:00 LT on 21 July 2012 and ended at 00:00 LT on 22 July 2012, with a time interval of 6 h. Thus, the data assimilation took place on four occasions (21 July 2012 00:00, 06:00, 12:00, 18:00 and 00:00 LT). A 6 h spin-up period was executed by run 1 and the first-guess files generated in run 1 were used for run 2. As time progressed, runs 3–6 were initiated at the corresponding times with the first-guess files generated by the previous runs. In the six runs, only run 1 was the original WRF run without assimilating observations, which can be treated as a benchmark to evaluate the improvements using data assimilation.
4.1 Evaluation on the storm process improvements
Figure 5 showed the forecasted rainfall process of the storm event on 21 July 2012 for the different data assimilation modes. To show the influence of the six runs on the rainfall forecast, all of the WRF-3DVar runs were shown in Fig. 5. The total run time was 36 h, which was longer than the duration (24 h) of the storm event. In Fig. 5, the gray area indicated the duration of the storm event. The black solid line indicated the ground truth of the catchment areal rainfall, which was calculated from the rain gauge observations using the Thiessen polygon method. The six runs were all shown by combining the solid and dashed lines. The solid line segment at the beginning of each run represented a new data assimilation run that generated the most recently updated forecasts. After 6 h, which marked the beginning of the next data assimilation run, the previous run was shown as a dashed line, indicating that the results were no longer the latest. For a given run, the solid and dashed line segments were the same color. The purpose of the data assimilation is to improve the accuracy of the rainfall forecast, and the presumed trends in the cumulative rainfall from the cycling WRF-3DVar runs should therefore increasingly approach the black solid line. In reality, different modes showed different data assimilation effects, and some of them were distinctly different from the presumed trends. Comparing the red and black hyetographs, the original forecast of the areal rainfall accumulation was significantly lower than the ground truth. This finding indicates that the WRF model was unable to forecast the storm event accurately without data assimilation, and the forecast errors may lead to poor runoff forecasts due to error accumulation and magnification during the rainfall–runoff transformation process.

Comparing the first three subfigures of Fig. 5, a significant improvement in the accumulated areal rainfall was found in Mode 1 by assimilating the radar reflectivity in Domain 2. The results of modes 2 and 3 were unstable in the different cycling WRF-3DVar runs, which was a result of the assimilation of the radar velocity data. For modes 2 and 3, the accumulated areal rainfall forecasts for the first 6 h of run 3 were less than for Mode 1, and the assimilation results of run 4 were also unsatisfactory. The forecasted rainfall for modes 2 and 3 was even less than the original run (run 1), which indicated that the assimilation of radial velocity observations at the time 06:00 and 12:00 LT on 21 July 2012 was unable to help trigger the main storm process.
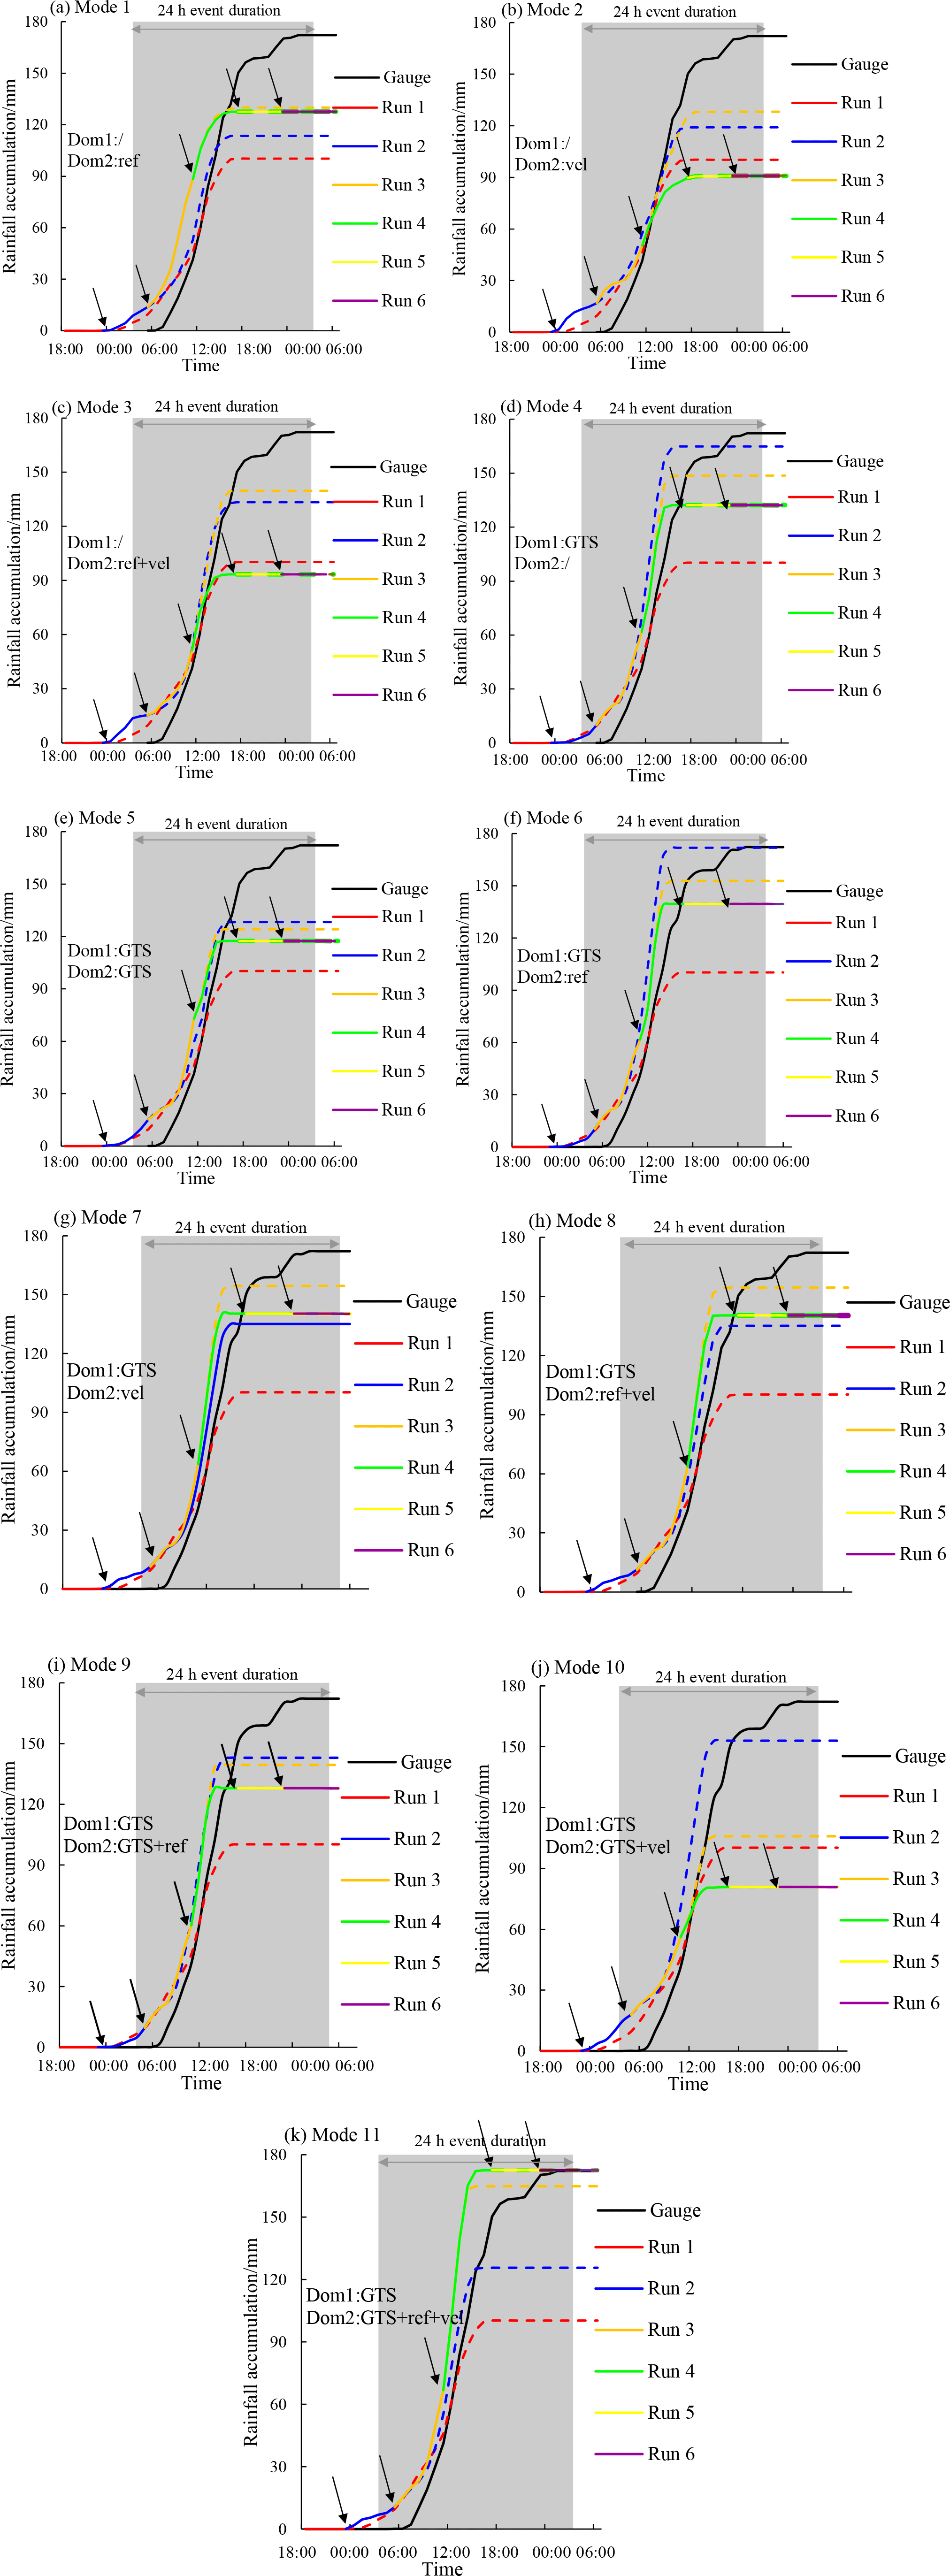
Figure 5Cumulative hyetographs for the 11 data assimilation modes.
For modes 4 and 5 shown in Fig. 5d and e, assimilating the GTS data improved the rainfall forecasts, and only assimilating the GTS data in Domain 1 (Mode 4) was a little better than assimilating the GTS data in both nested domains (Mode 5). The accumulated areal rainfall forecast for Mode 4 was only slightly better than that of Mode 1, while the rainfall processes were very different. For Mode 1, the greatest rainfall amounts were obtained in run 3, whereas the rainfall amounts of run 4 had the largest proportion for Mode 4. Different types of data assimilation can not only affect the rainfall amounts but also the rainfall process.
In order to investigate the impacts of assimilating GTS data on the radar data assimilation effects and the rainfall forecasts, Mode 6–8 (assimilating the GTS data in Domain 1 as well as the radar data in Domain 2) were compared with Mode 1–3 (only assimilating the radar data in Domain 2). For the six modes, the rainfall processes were relatively similar for run 1, run 2, run 5 and run 6, whereas the forecasts of run 3 and run 4 were very different. The accumulated rainfall for run 3 in Mode 1 was slightly higher than in Mode 6, whereas the result was opposite for run 4. In comparison with modes 2 and 3, modes 7 and 8 had larger accumulated rainfall totals in run 3 and run 4, respectively. This finding indicated that the assimilation of the GTS data in Domain 1 could have affected the rainfall forecast when assimilating radar data in Domain 2, which resulted in further improved forecasts that agreed better with the observed rainfall.
Modes 9–11 were designed to explore the influence of the assimilation of the GTS data in Domain 2 on modes 6–8. The accumulated rainfall for run 4 in Mode 9 was less than in Mode 6, which indicated that assimilating the GTS data in Domain 2 at 21 July 2012 12:00 LT may have changed the atmospheric state and water vapor transport when the GTS data were also assimilated in Domain 1 and the radar reflectivity data were assimilated in Domain 2 at the same time. Both run 3 and run 4 of Mode 10 had much less forecasted rainfall than Mode 7, and the rainfall forecast was the worst among the 11 modes. This result showed that assimilating the GTS data in Domain 2 may have reduced the improvement in the rainfall forecast when the GTS data were also assimilated in Domain 1 and the radial velocity data were assimilated in Domain 2. Unlike modes 9 and 10, run 4 of Mode 11 predicted more rainfall than the other modes and provided the largest contribution to the 24 h accumulated areal rainfall.
It can be found in Fig. 5 that the predicted storms always start and end around 6 h earlier than the observations. In addition to the errors in the boundary conditions, it is found that the assimilation of the water vapor information (contained in the radar reflectivity and the GTS data) can make the rain in the initial fields form and fall to the earth more quickly (Georgakakos, 2000; Sun, 2005; Sun et al., 2016). Considering the error is consistent, an error prediction model could be built in further studies, and the assimilation of the latent heat may also be helpful in correcting the starting and ending time of the forecasted rainfall process (Stephan et al., 2010; Schraff et al., 2016).
4.2 Evaluation on the 24 h accumulated areal rainfall
To more quantitatively evaluate the 11 data assimilation modes, the accumulated areal rainfall in the Zijingguan catchment was calculated for the 24 h duration of the storm event on 21 July 2012. The rain gauge observations, WRF model forecasts, and relative errors between them were shown in Table 3. For all 11 modes, the first 6 h of the runs (solid line segments in Fig. 5), which covered the duration of the storm, were used to calculate the 24 h accumulated areal rainfall.
Table 3Observed and forecasted 24 h accumulated areal rainfall from different data assimilation modes.
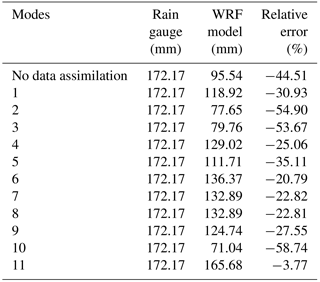
The WRF model forecasts without data assimilation were too poor to be used for hydrological forecasting. The forecasted rainfall accumulation was only 95.54 mm, which was much lower than the rain gauge observations. Data assimilation was used to improve the rainfall forecasts, although the forecast results worsened in modes 2, 3 and 10, and all of the relative errors exceeded 50 %. Interestingly, all three modes assimilated radar velocity data. For the other eight modes, the rainfall forecasts were improved at different levels. Mode 11 performed the best because the forecast (165.68 mm) was closest to the rain gauge observation (172.17 mm), and the relative error was only −3.77 %. Although Mode 5 was improved by assimilating the GTS data in both nested domains, the effect was the least profound.
Comparing modes 1–4, which all assimilated the observations in a single domain, the lower relative errors were found in modes 1 (−30.93 %) and 4 (−25.06 %), whereas the highest error was found in Mode 2 (−54.90 %). This finding indicated that assimilating radar reflectivity and GTS data can provide good results, while assimilating radar velocity made the rainfall forecast unsatisfactory. The observation errors in the radial velocity may have been the main factor that led to the poorest performance (Abhilash et al., 2012). Another reason is that assimilating radial velocity can only change the dynamic field, which changes quickly for small-scale regions, and 6 h may have been too long for the assimilation time interval (Lin et al., 2011).
Modes 6–8 were formed by assimilating the GTS data in Domain 1 based on modes 1–3. The results showed that the relative errors decreased significantly when the GTS data were assimilated in Domain 1. The forecasted rainfall amounts for modes 6–8 were very similar, and the relative errors were all approximately −20 %. This finding indicated that assimilating the GTS data over a large area (Domain 1) had large positive effects on the rainfall forecast using the WRF model.
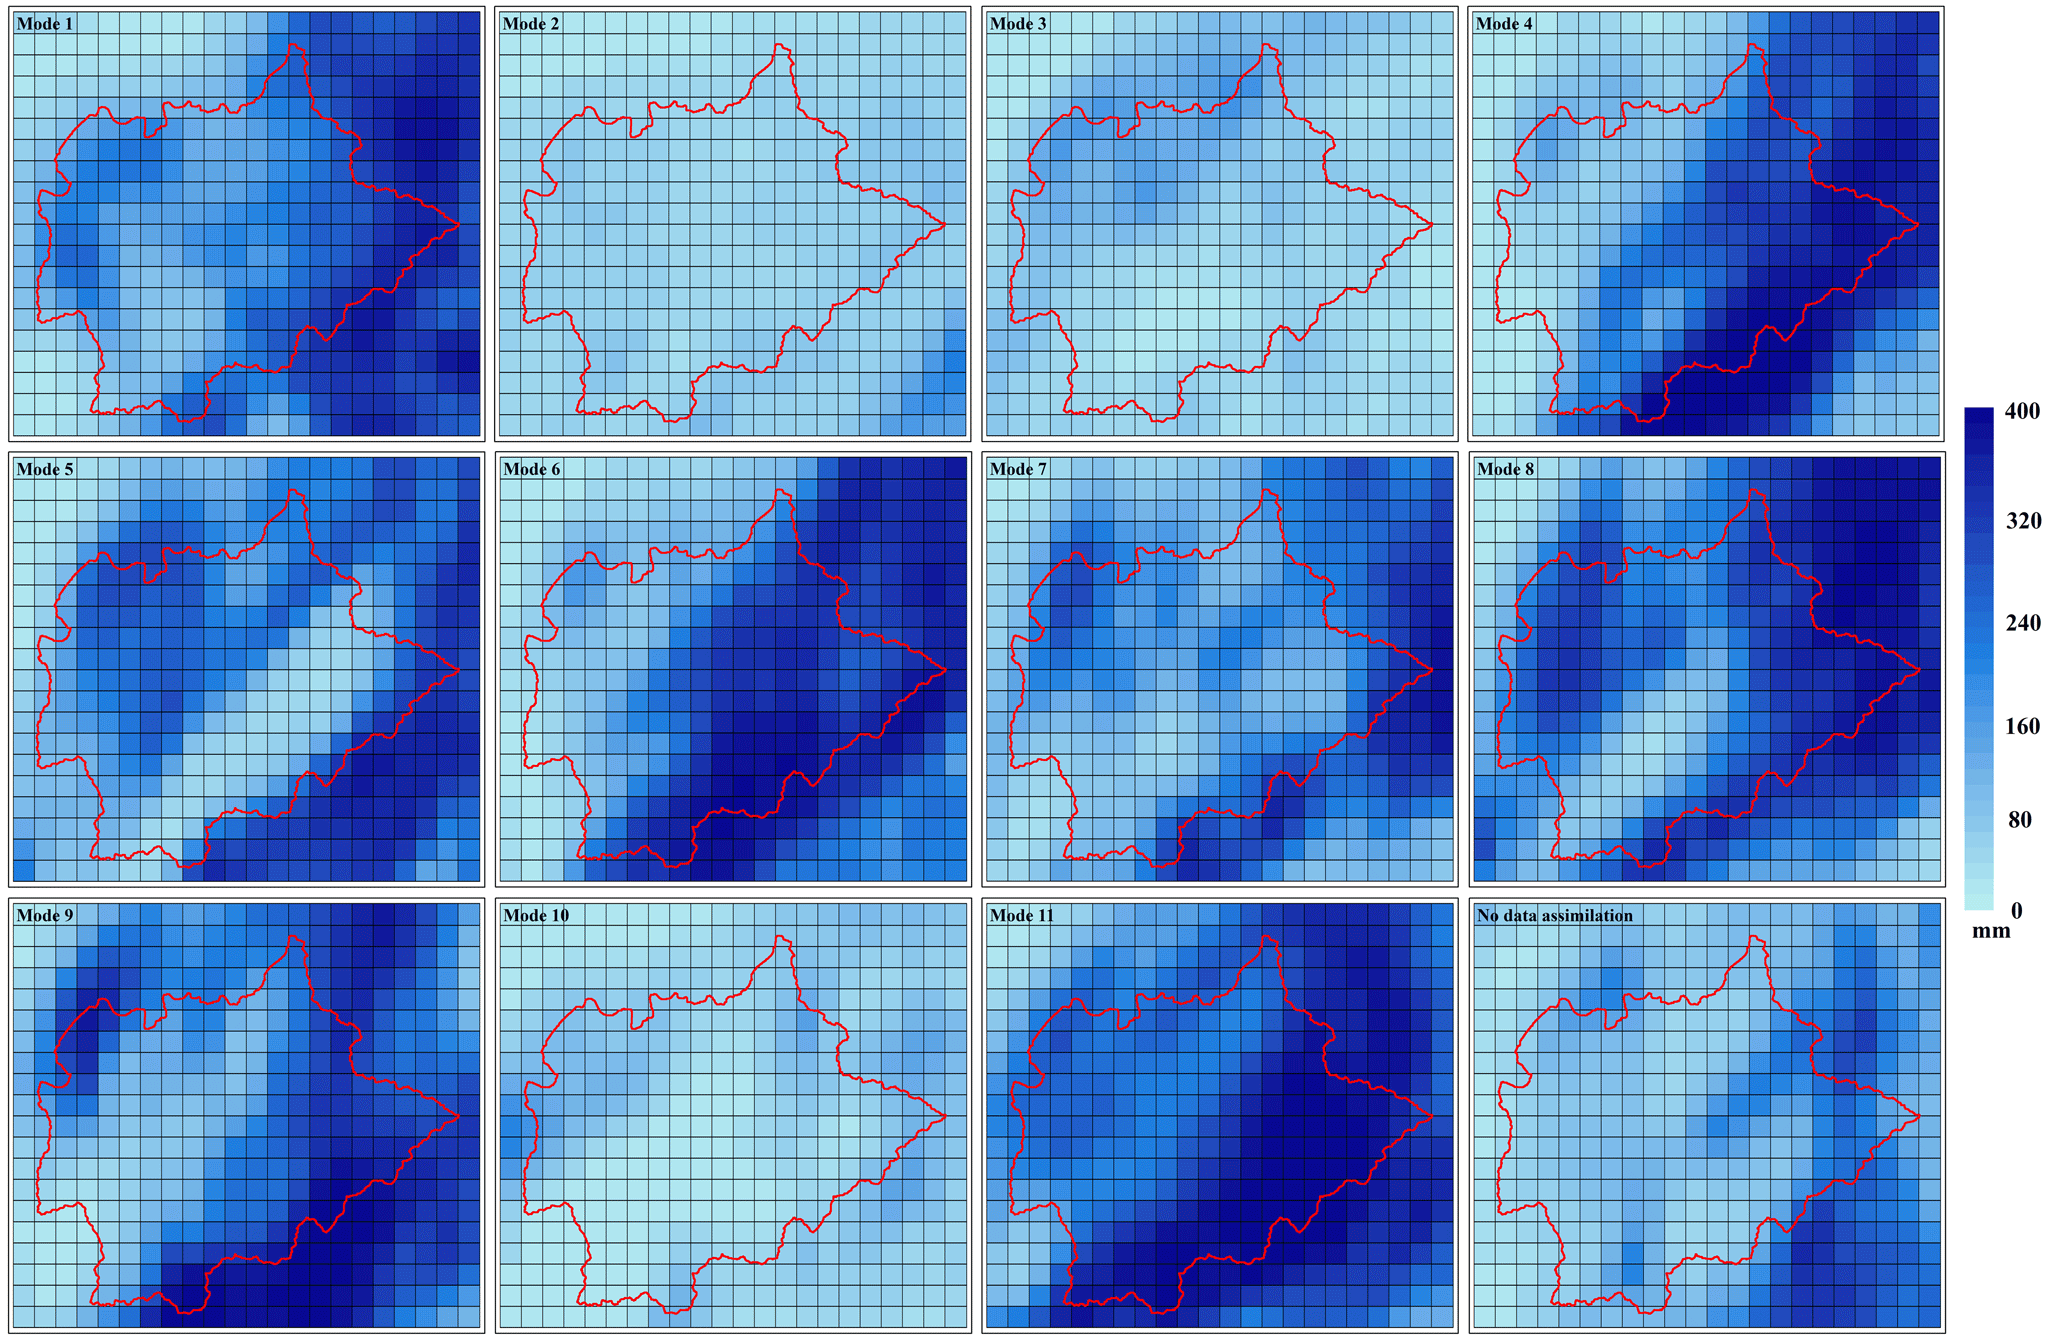
Figure 6Spatial distributions of the forecasted 24 h rainfall accumulations from different data assimilation modes.
Compared with modes 6–8, modes 9–11 also assimilated the GTS data in Domain 2 at the same time. The difference between the forecasted rainfall totals for modes 6 and 9 was not significant, although Mode 9 performed worse than Mode 6. However, the relative error for Mode 10 was −58.74 %, which was much higher than that of Mode 7. This finding indicated that assimilating the GTS data over a small area (Domain 2) may have increased the forecast error, whereas the forecasted rainfall may not have been greatly influenced when the radar reflectivity was assimilated in Domain 2 at the same time.
4.3 Evaluation on the spatial and temporal distributions of rainfall
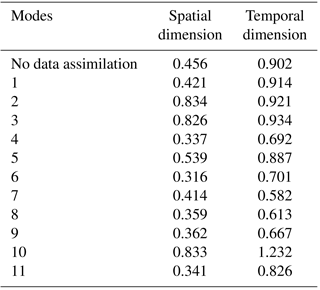
In addition to the accumulative amount, the rainfall variations in both space and time play a crucial role in the formation of the runoff process. Therefore, in the study the spatial and temporal distributions of the forecasted rainfall were evaluated by the root mean square error (RMSE) and the results were shown in Table 4. The rainfall accumulations at different rain gauges and the catchment average rainfall at different time steps are respectively used to calculate the RMSE indices in the spatial and the temporal dimensions. Detailed equations can be found in Tian et al. (2017a). The spatial and temporal distributions of the forecasted 24 h rainfall from the 11 data assimilation modes were shown in Figs. 6 and 7, respectively. It can be observed that for most of the assimilation modes the spatial and temporal distributions were improved in varying degrees after data assimilation. Mode 6 had the lowest RMSE (0.316) in the spatial dimension and Mode 7 showed the lowest RMSE (0.582) in the temporal dimension.
When the radar data are solely assimilated with the radial velocity being involved, modes 2 and 3 showed the worst distribution results among the 11 modes, and no improvement was found in both spatial and temporal dimensions. Mode 1 performed much better than modes 2 and 3 for the spatial distributions of the rainfall forecasts while the RMSEs of the temporal distributions for modes 1–3 did not have much difference. Modes 4 and 5 showed improvements to certain extents in both spatial and temporal distributions after data assimilation.
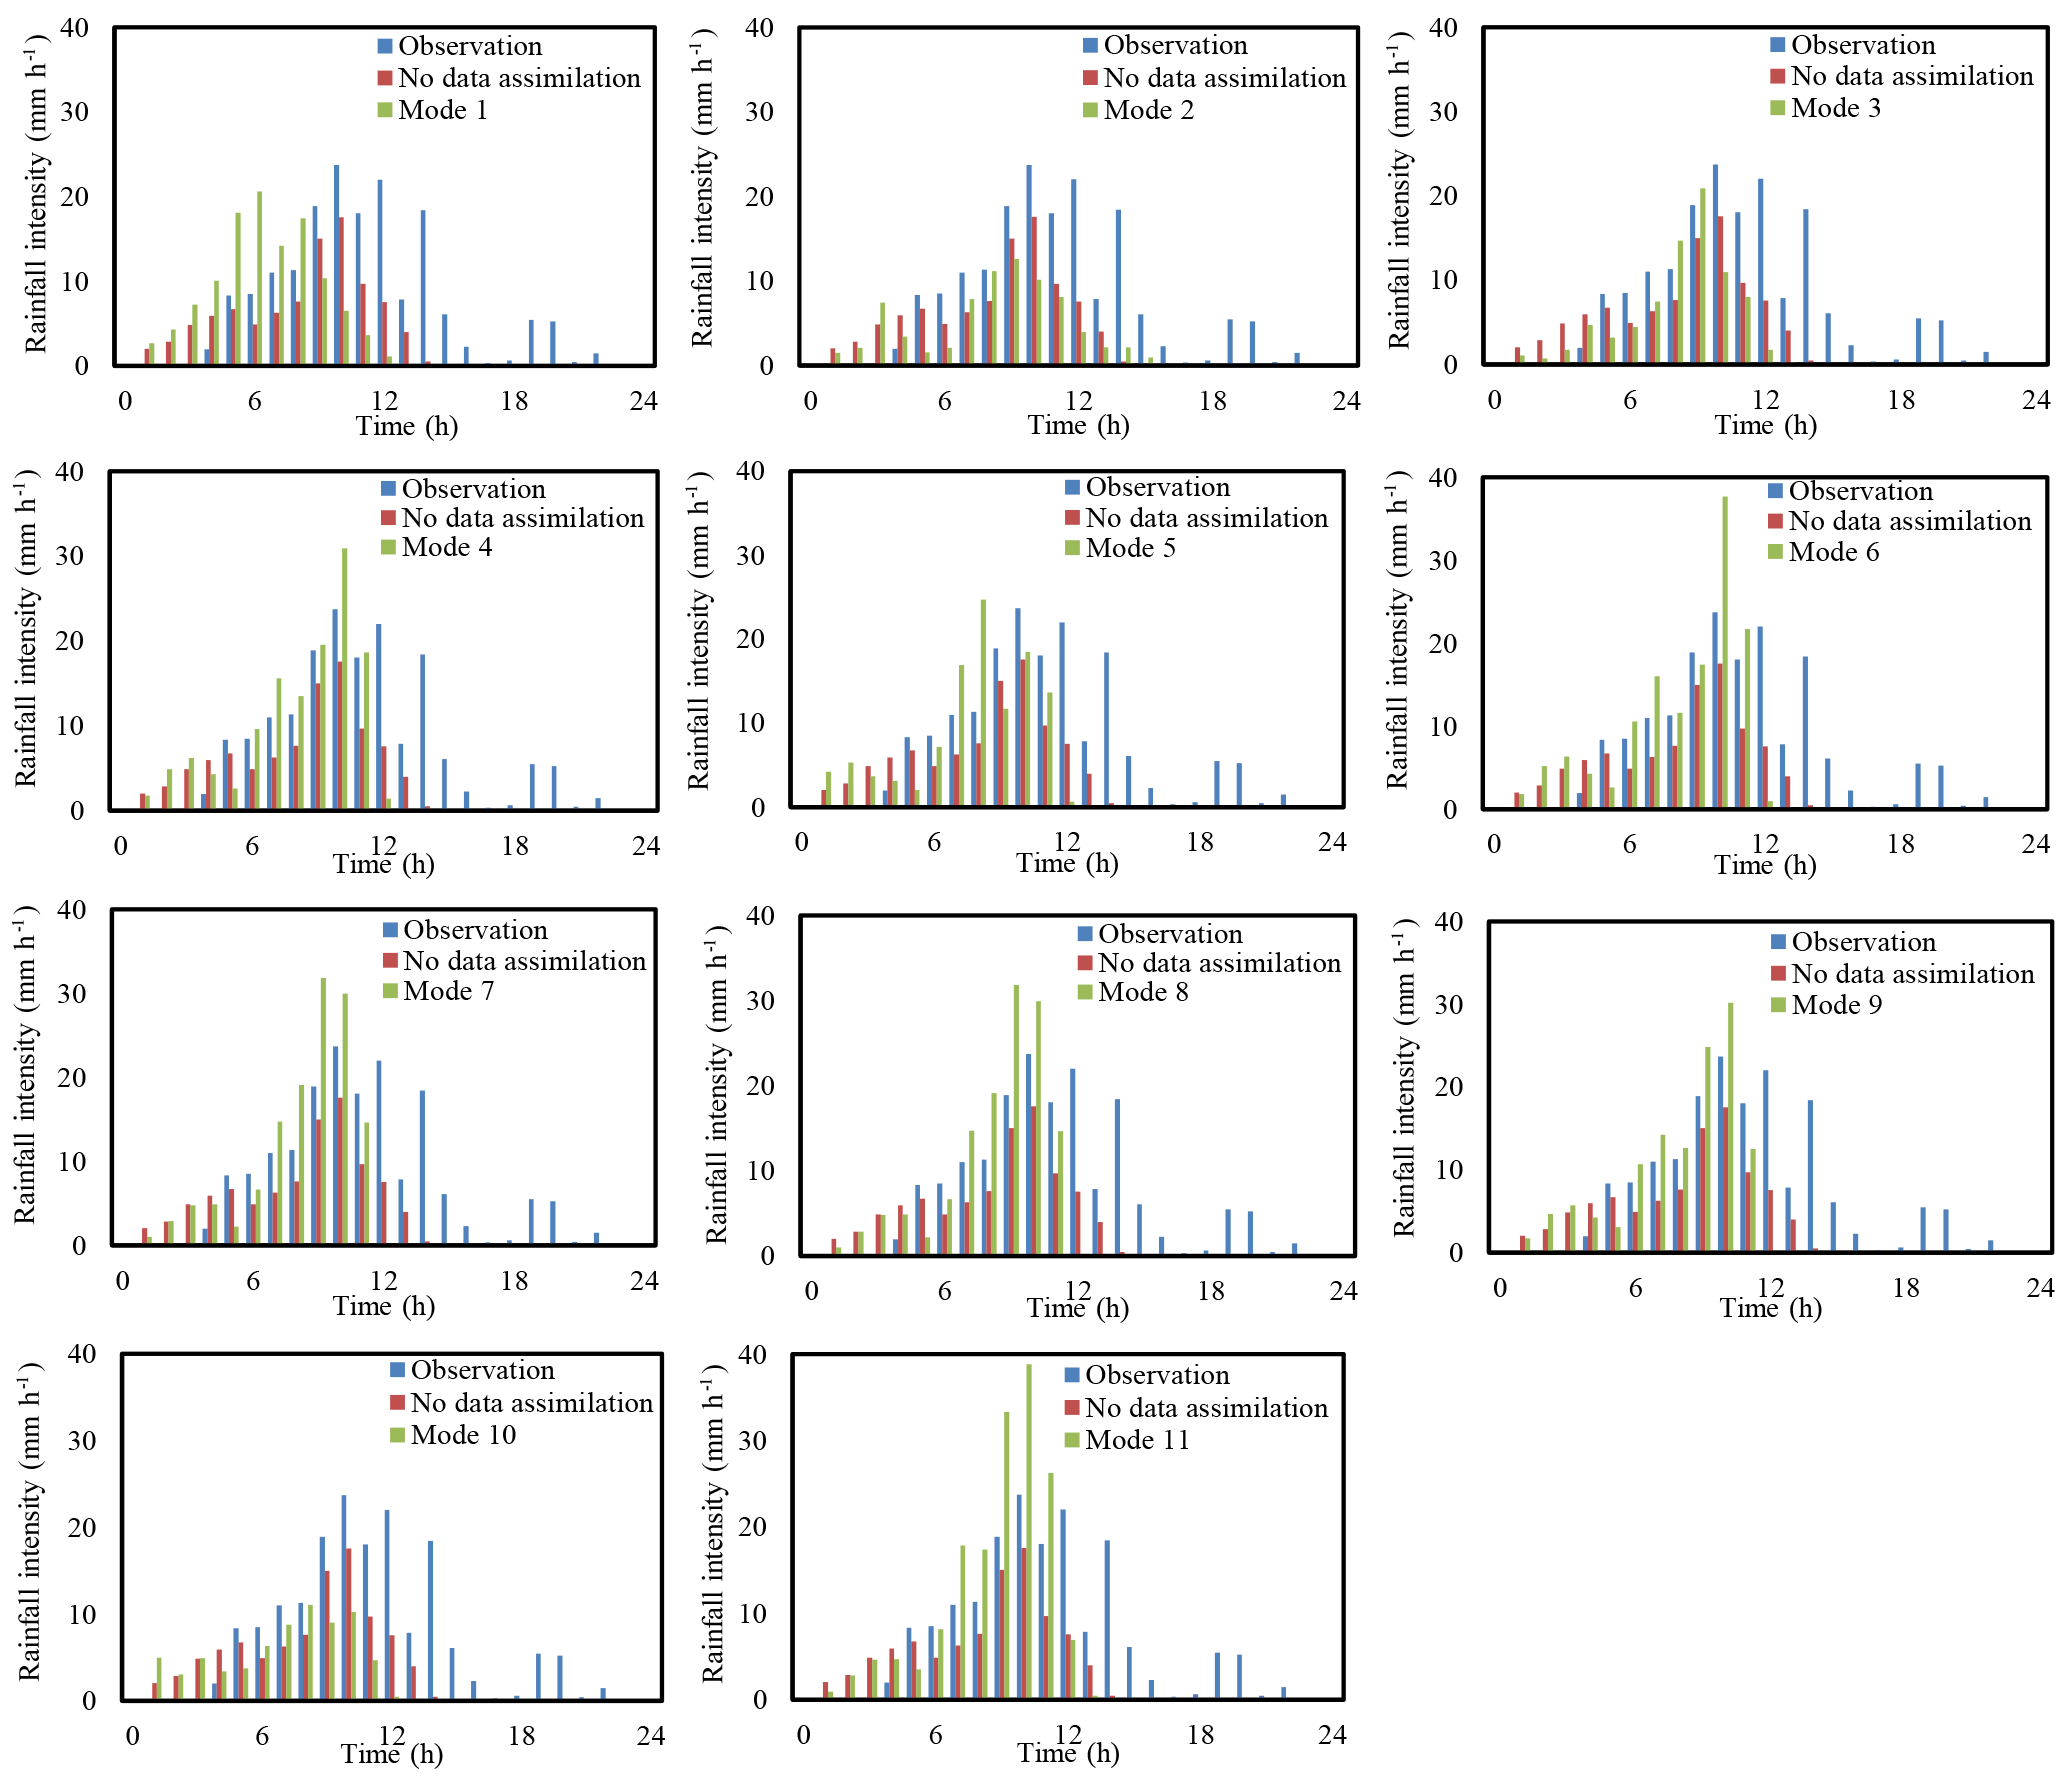
Figure 7Hyetographs of the observed and forecasted rainfall from different data assimilation modes.
For the temporal distributions of the rainfall forecasts, the RMSEs of modes 1–3 were above 0.90, while the RMSEs of modes 6–8 were much lower, between 0.58 and 0.71. For the spatial distributions, the RMSEs were above 0.80 for modes 2 and 3 but less than 0.40 for modes 7 and 8, and the RMSE was also reduced from 0.456 for Mode 1 to 0.316 for Mode 6. Compared with modes 1–3, the rainfall distributions of modes 6–8 had significant improvements by adding the GTS data assimilation in the outer domain, which also indicated that assimilating the GTS data over a large area can help the WRF model assimilate the radar data more effectively.
However, the rainfall distributions of modes 9–11 were worse compared with modes 6–8, though Mode 9 performed a little better than Mode 6 in the temporal dimension and Mode 11 was better than Mode 8 in the spatial dimension. Especially for Mode 10, the RMSEs for the spatial and temporal distributions of the rainfall forecasts were both higher than Mode 7. The results indicated that assimilating the GTS data in the inner domain may have a negative impact on the assimilation of the radar data regarding the distributions of the forecasted rainfall.
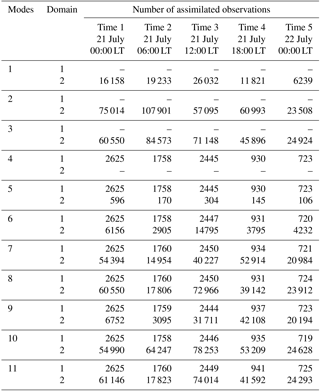
4.4 Influence of the number of assimilated observations
To further explore the assimilation techniques and the causes of the assimilation effects, the number of assimilated observations for each of the 11 modes is shown in Table 5.
Table 4RMSEs for the spatial and temporal distributions of the forecasted rainfall from different data assimilation modes.
Mode 3 can be regarded as a combination of modes 1 and 2. The number of assimilated observations in Mode 3 was less than the sum of the number of assimilated observations in modes 1 and 2 at each time. Therefore, there was a conflict between the radar reflectivity and radial velocity, and some of the radar data were not assimilated in the WRF model when the two types of radar data were assimilated in the same domain at the same time. However, Mode 3 performed worse than Mode 1, which indicated that assimilating the radial velocity data in Domain 2 had a negative effect on the forecasted rainfall.
Through a comparative analysis of modes 1 and 6, modes 2 and 7, and modes 3 and 8, modes 6–8 assimilated fewer observations than modes 1–3, although the assimilation effects were improved. This finding indicated that the data assimilation approach in modes 6–8 was more rational. The assimilation of the GTS data in Domain 1 helped eliminate the unreasonable radar data assimilated in modes 1–3 and improved the radar data assimilation results.
The comparisons were also made between modes 6 and 9, modes 7 and 10, and modes 8 and 11. For modes 9–11, the number of assimilated observations in Domain 2 was greater than for modes 6–8, which meant that the GTS data were assimilated by the WRF model in Domain 2. However, the assimilation results indicated that more assimilated data did not mean better assimilation effects.
Among the 11 data assimilation modes, assimilating radar velocity always led to poorer results than the original rainfall forecasts. It should be noted that the assimilation of the radar radial velocity cannot directly influence the physical process of the rainfall formation, although the assimilation can change the wind field and affect the water vapor transport. If the assimilated radar velocity cannot improve the atmospheric circulation predictions, the water vapor field may not be improved, which thus leads to unimproved rainfall forecasts (Pan et al., 2012; Dong and Xue, 2013). In reality, the accuracy of the radial velocity observations depends on the atmospheric refractive index, which is affected by the air density and the water vapor content (Montmerle and Faccani, 2010; Maiello et al., 2014). Unfortunately, both the air density and the water vapor content are quite variable, especially on rainy days (Abdalla and Cavaleri, 2002). Therefore, the spatial observation errors in the radial velocity retrievals are unavoidable and might be the main factor that leads to poorer performance of the NWP model than that achieved without data assimilation (Abhilash et al., 2012). Due to the ability of frequent adjustment for the atmospheric motions, decreasing the assimilation time interval may reduce the risk of over correction (Xiao et al., 2005). However, the added information may involve more observation errors, which may increase the nonlinearity of the atmosphere and lead to a difficult model convergence. The weather radar in this study had a temporal resolution of 0.1 h, whereas the assimilation time interval was 6 h; therefore, there is still room to increase the data assimilation frequency, although there is a trade-off between model performance and the operating efficiency.
On the contrary, the assimilation of the radar reflectivity always had a positive effect on the forecasted rainfall, and the model performance was relatively stable. The data assimilation modes which involved the radar reflectivity always performed better than the others. The main reason is that the radar reflectivity contain information directly related to the precipitation hydrometeors. According to the Eq. (2), the assimilation of radar reflectivity is a correction to the humidity field in essence, which directly influences the formation process of the precipitation. Additionally, after strict quality control the radar reflectivity assimilated in this study showed consistent trends with the gauge observations in both spatial and temporal distributions (as shown by Fig. 3), which helped result in more effective assimilation results than the radial velocity.
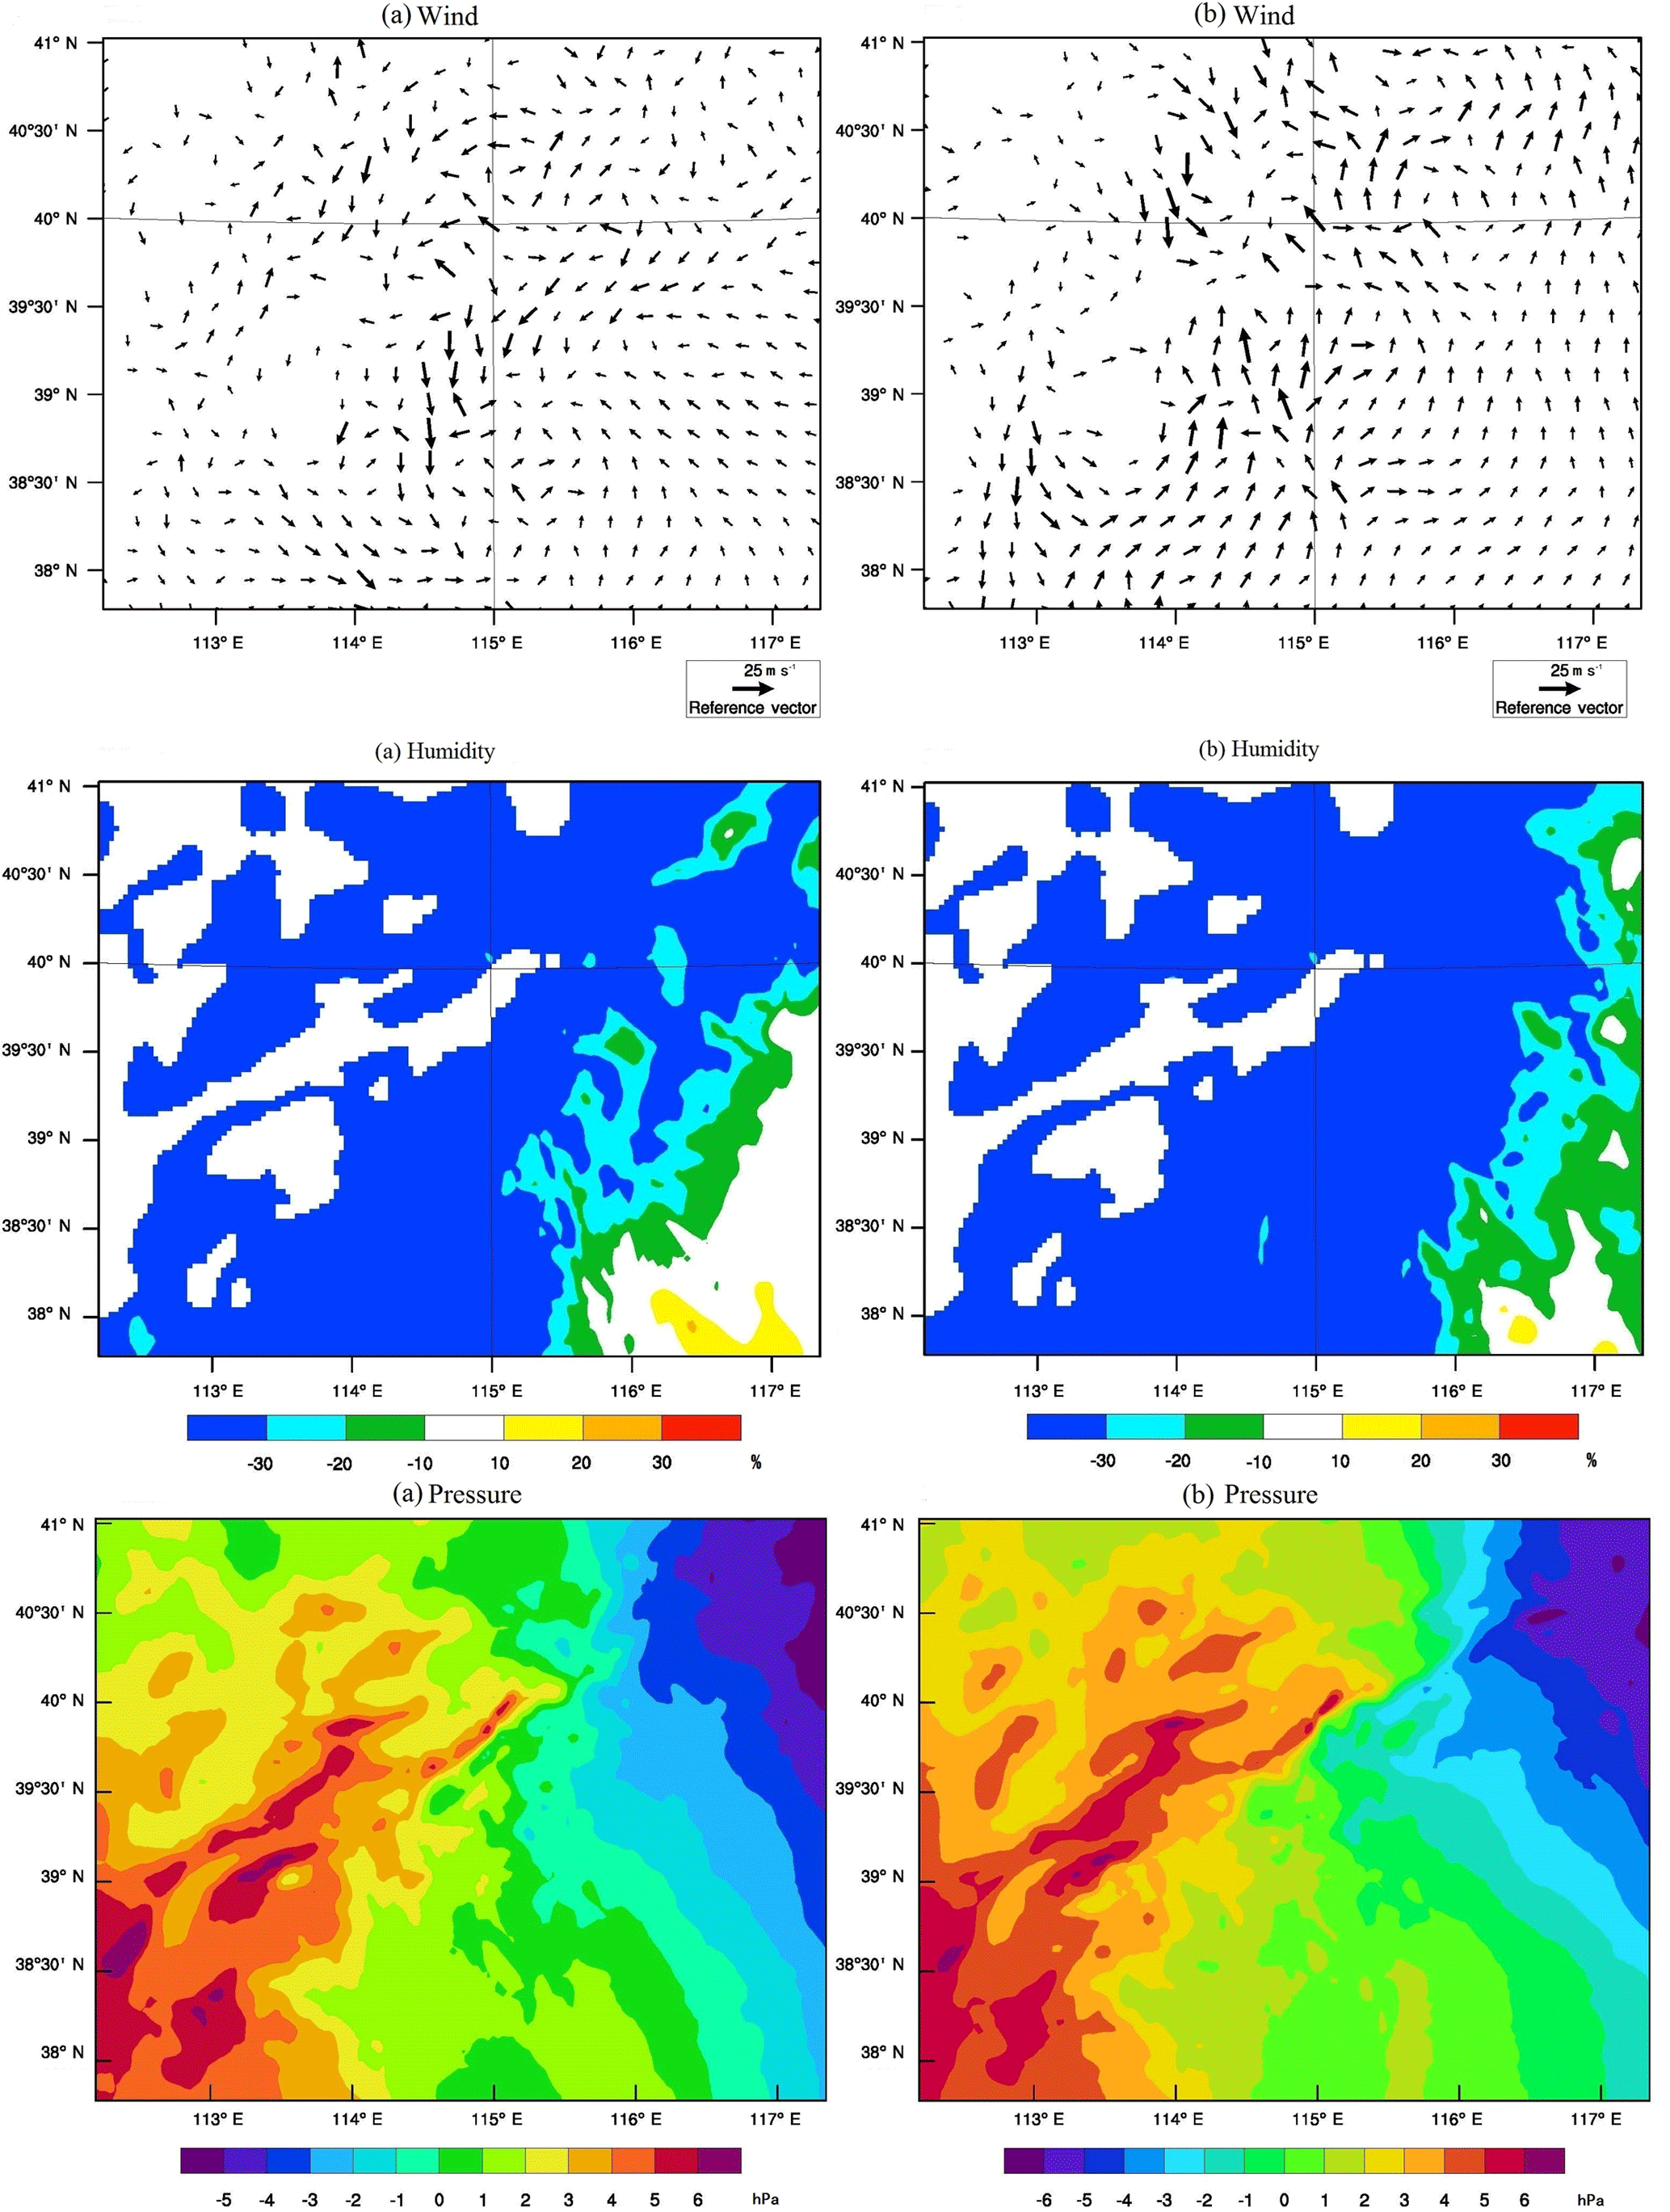
Figure 8The increment distributions of wind, humidity and pressure in Domain 2 at 850 hPa for (a) assimilating only radar reflectivity and (b) assimilating both radar reflectivity and GTS data.
The assimilation of the GTS data played a subsidiary role to the radar reflectivity in improving the rainfall forecasts. A combination of the radar reflectivity together with the GTS data always resulted in better results that assimilating the radar data alone. Although the spatial density of the GTS data is relatively low compared to the radar data, it contains observations of various atmospheric states. As shown by Fig. 2, the GTS data located on land were distributed evenly, which helped improve the stability of the WRF model during data assimilation (Carrassi et al., 2008). SOUND and SYNOP datasets took the majority of the GTS data (Table 1), which means that the observations from the surface-based stations and the upper-air observatories have the most contributions to the improvement of the rainfall prediction. Pressure, temperature, humidity and wind reports from the surface and upper air are contained in SOUND and SYNOP datasets. The assimilation of these meteorological elements can directly correct the initial and lateral boundary conditions through the wide horizontal coverage and vertical levels (Tu et al., 2017). Figure 8 compares the improvement of the initial conditions of Domain 2 after data assimilation in modes 1 and 6. The increment distributions of wind, humidity and pressure when the radar reflectivity was solely assimilated in the inner domain (Mode 1) were shown in Fig. 8a, whereas those when assimilating the radar reflectivity in the inner domain as well as the GTS data in the outer domain (Mode 6) were shown in Fig. 8b.
Table 5Total number of assimilated observations in the two WRF nested domains.
It can be seen that the changes of the wind increments were more significant in Fig. 8b than Fig. 8a in the inner domain of the WRF model. Though the changes of the increment distributions for humidity and pressure were not obvious for the two data assimilation modes, the major differences gather toward the southeast of the domain area, which assisted in the occurrence of the heavy rainfall in the downstream of the study catchment. This may to some extent explain why the rainfall accumulations and the spatial and temporal distributions can be improved from Mode 1 to Mode 6, by adding the GTS data in the outer domain. The involvement of the GTS data in the outer domain helped improve the atmospheric state at a relatively large scale, which induced a positive effect on the rainfall forecasts in the inner domain with the two-way nesting mechanism. Therefore, in this study the assimilation of GTS data together with the radar data performs the best among different assimilation modes.
In order to further verify the findings for assimilating different sources of data, another two storm events with relatively moderate rainfall intensity (around 50 mm for 24 h accumulation) were selected from an analogue catchment to be tested with four simplified assimilation modes (Mode 1, 3, 4 and 6). The analogue catchment locates in the southern reach of the Daqing River basin with a drainage area of 2210 km2. Table 6 showed the details of the storm events and the rainfall forecasting results from different data assimilation modes. The cumulative hyetographs of the forecasted areal rainfall were illustrated in Fig. 9. The results were in accordance with the conclusions from the extreme event in the Zijingguan catchment. Assimilating radar reflectivity together with radial velocity (Mode 3) cannot guarantee improved results compared to only assimilating radar reflectivity (Mode 1). The GTS data alone can also generate as good results (Mode 4) as the radar reflectivity. When the radar reflectivity is assimilated in the inner domain, the involvement of the GTS data in the outer domain (Mode 6) further helped produce better results.
Table 6The two storm events of the analogue catchment and the relative errors of the forecasted rainfall from different data assimilation modes.
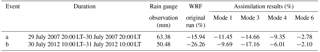
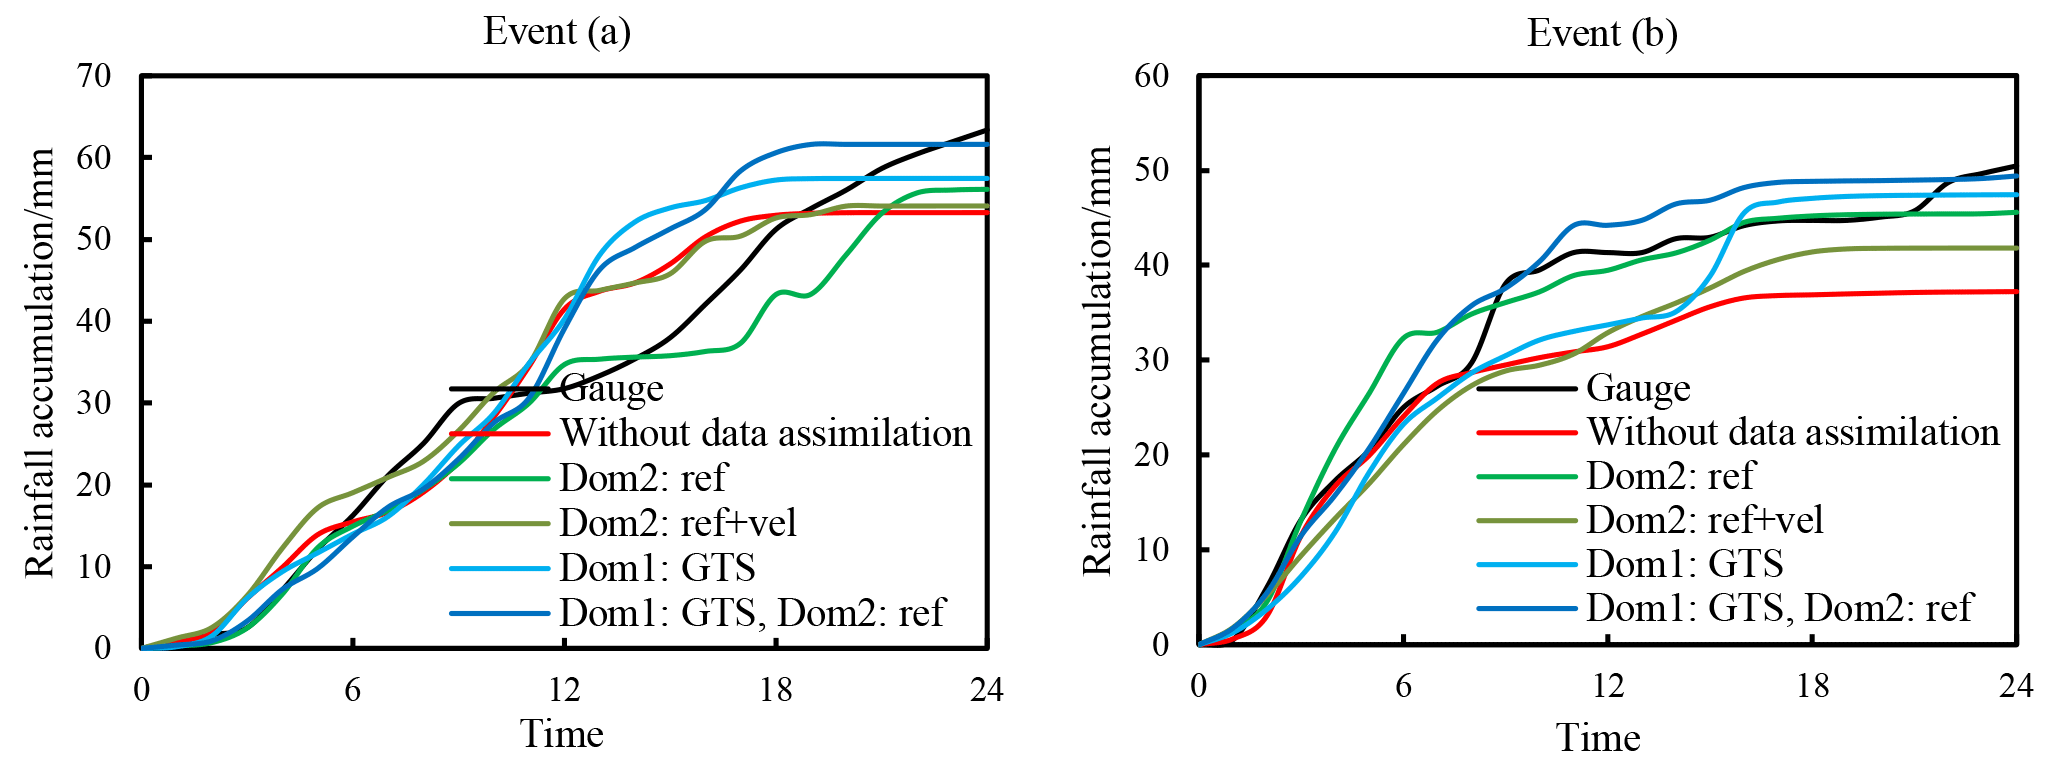
Figure 9Cumulative hyetographs of the two storm events in the analogue catchments with different data assimilation modes.
Before the NCEP-driven data were used in this study, ECMWF was also tested for the data assimilation with the same storm event. Although the rainfall forecasts showed some differences based on the boundary conditions from the two centers, the improvement patterns from different data assimilation modes were quite similar. It should be noted that the initial and lateral boundary conditions do have some potential impact on the rainfall forecast results. More studies should be carried out to verify the effects of data assimilations using different driven data, such as CMA. The ultimate goal for the application of the numerical rainfall prediction is to make flow forecasts at the catchment outlet. Errors in the forecasted rainfall process and the accumulative amount can result in divergent flood peak time and peak stage of the flood (Shih et al., 2014). Therefore, data assimilation is an important tool in improving the forecasted rainfall as well as the flow. Yucel et al. (2015) assimilated conventional meteorological observations to improve the rainfall prediction, meanwhile the mean runoff error was reduced by 14.7 % with data assimilation in the Black Sea Region. The peak discharge error was also reduced from 50 % to 14 % when the radar data were assimilated in a hydrometeorological model built in the Dese river catchment (Rossa et al., 2010). In the further study, the coupled atmospheric–hydrological model with data assimilation will be built and flood forecasts from the coupling system will be examined to evaluate the effect of data assimilation on flood forecasting.
This study explored the effects of data assimilation using WRF-3DVar for the improvement of rainfall forecasting in the Beijing–Tianjin–Hebei region of northern China. Two nested domains were employed, and the GFS data were used to drive the WRF model. A storm event that occurred over the Beijing–Tianjin–Hebei region on 21 July 2012 was selected, considering the widespread attention it received in China due to the high intensity, wide coverage of the rainfall process and the significant losses caused by the following flood. The rainfall accumulation during the storm in a mountainous catchment named Zijingguan with a drainage area of 1760 km2 was set as the forecasting target. Three types of observations, i.e., GTS data, radar reflectivity and radial velocity, were used to investigate the potential improvements on WRF rainfall forecasts through data assimilation. Eleven data assimilation modes were designed based on different combinations of the three types of observations in the two nested domains.
Contrastive analyses of the rainfall forecasts from the 11 data assimilation modes were carried out from three aspects: the rainfall evolution process, the accumulated amount and the number of the observations assimilated. Four main conclusions can be drawn: (1) when the radar data were assimilated alone, the assimilation of radar reflectivity performed better than radial velocity in improving the rainfall forecasts, and the assimilation of both of the two types of the radar data generated poorer results than only assimilating the radar reflectivity; (2) assimilating the GTS data over a large area can help the WRF model assimilate the radar data effectively, and the involvement of the GTS data in the outer domain when radar data are assimilated in the inner domain resulted in better forecasts than only assimilating the radar data; (3) assimilating more observations does not guarantee further improvement – on the other hand, the effective information contained in the assimilated data is of more importance than the data quantity. In this study, according to the results of 24 h accumulated areal rainfall prediction, spatiotemporal distributions of the predicted rainfall and the number of assimilated observations, the combination of radar reflectivity and GTS data resulted in the best improvements of the rainfall forecasts. Considering the poor performance of radial velocity in other assimilation modes and the reasons explained in the discussion, the radial velocity data should be carefully used with a very strict quality control process. Further research considering various geographical and meteorological case studies should be carried out to further verify the conclusions of this study.
Data for observed rainfall are available upon request from the Information Center of the Ministry of Water Resources of China (http://www.hydroinfo.gov.cn/, last access: 4 February 2017). Radar data are available via the China Meteorological Administration (http://www.cma.gov.cn/, last access: 6 May 2017). Other data are available on request from the US National Centers for Environmental Prediction (http://www.ncep.noaa.gov/, last access: 4 March 2017).
All the authors contributed to the conception and the development of this paper. JL and JT contributed to the calculations and the analyses. DY and FY assisted in the experiment design and the assimilation methods. CL and FS helped with the figure production and the writing of the paper.
The authors declare that they have no conflict of interest.
This study was supported by the National Key R & D Program (2016YFA0601503, 2017YFC1502405), the Hebei Province Water Scientific Research Project (2015-16), the Major Science and Technology Program for Water Pollution Control and Treatment (2018ZX07110001), and the IWHR Research and Development Support Program (WR0145B732017).
The authors especially appreciate the helpful comments and constructive
suggestions from the editor, Florian Pappenberger, and the two reviewers,
Yunqing Xuan and an anonymous reviewer.
Edited by: Florian Pappenberger
Reviewed by: Yunqing Xuan and one anonymous referee
Abdalla, S. and Cavaleri, L.: Effect of wind variability and variable air density on wave modelling, J. Geophys. Res., 107, 17-1–17-17, https://doi.org/10.1029/2000JC000639, 2002.
Abhilash, S., Sahai, A. K., Mohankumar, K., George, J. P., and Das, S.: Assimilation of doppler weather radar radial velocity and reflectivity observations in WRF-3DVAR system for short-range forecasting of convective storms, Pure Appl. Geophys., 169, 2047–2070, https://doi.org/10.1007/s00024-012-0462-z, 2012.
Aligo, E. A., Gallus, W. A., and Segal, M.: On the impact of WRF model vertical grid resolution on Midwest summer rainfall forecasts, Weather Forecast., 24, 575–594, https://doi.org/10.1175/2008WAF2007101.1, 2009.
Barker, D. M., Huang, W., Guo, Y. R., Bourgeois, A., and Xiao, Q. N.: A three-dimensional variational data assimilation system for MM5: implementation and initial results, Mon. Weather Rev., 132, 897–914, https://doi.org/10.1175/1520-0493(2004)132<0897:ATVDAS>2.0.CO;2, 2004.
Bauer, H. S., Schwitalla, T., Wulfmeyer, V., Bakhshall, A., Ehret, U., Neuper, M., and Caumont, O.: Quantitative precipitation estimation based on high-resolution numerical weather prediction and data assimilation with WRF – a performance test, Tellus A, 67, 25047, https://doi.org/10.3402/tellusa.v67.25047, 2015.
Berenguer, M., Surcel, M., Zawadzki, I., Xue, M., and Kong, F.: The diurnal cycle of precipitation from continental radar mosaics and numerical weather prediction models. Part II: Intercomparison among numerical models and with nowcasting, Mon. Weather Rev., 140, 2689–2705, https://doi.org/10.1175/MWR-D-11-00181.1, 2012.
Boussetta, S., Balsamo, G., Beljaars, A., and Kral, T.: Impact of a satellite-derived Leaf Area Index monthly climatology in a global Numerical Weather Prediction model, Int. J. Remote Sens., 34, 3520–3542, https://doi.org/10.1080/01431161.2012.716543, 2013.
Carrassi, A., Ghil, M., Trevisan, A., and Uboldi, F.: Data assimilation as a nonlinear dynamical systems problem: stability and convergence of the prediction-assimilation system, Chaos, 18, 023112, https://doi.org/10.1063/1.2909862, 2008.
Chambon, P., Zhang, S. Q., Hou, A. Y., Zupanski, M., and Cheung, S.: Assessing the impact of pre-GPM microwave precipitation observations in the Goddard WRF ensemble data assimilation system, Q. J. Roy. Meteorol. Soc., 140, 1219–1235, https://doi.org/10.1002/qj.2215, 2014.
Di, Z., Duan, Q., Gong, W., Wang, C., Gan, Y., Quan, J., Li, J., Miao, C., Ye, A., and Charles, T.: Assessing WRF model parameter sensitivity: A case study with 5 day summer precipitation forecasting in the Greater Beijing Area, Geophys. Res. Lett., 42, 579–587, https://doi.org/10.1002/2014GL061623, 2015.
Done, J., Davis, C. A., and Weisman, M.: The next generation of NWP: explicit forecasts of convection using the weather research and forecasting (WRF) model, Atmos. Sci. Lett., 5, 110–117, https://doi.org/10.1002/asl.72, 2004.
Dong, J. and Xue, M.: Assimilation of radial velocity and reflectivity data from coastal WSR-88D radars using an ensemble Kalman filter for the analysis and forecast of landfalling hurricane Ike (2008), Q. J. Roy. Meteorol. Soc., 139, 467–487, https://doi.org/10.1002/qj.1970, 2013.
Dudhia, J.: Numerical study of convection observed during the winter monsoon experiment using a mesoscale two-dimensional model, J. Atmos. Sci., 46, 3077–3107, https://doi.org/10.1175/1520-0469(1989)046<3077:NSOCOD>2.0.CO;2, 1989.
Efstathiou, G. A., Zoumakis, N. M., Melas, D., Lolis, C. J., and Kassomenos, P.: Sensitivity of WRF to boundary layer parameterizations in simulating a heavy rainfall event using different microphysical schemes, Effect on large-scale processes, Atmos. Res., 132, 125–143, https://doi.org/10.1016/j.atmosres.2013.05.004, 2013.
Fernández-González, S., Valero, F., Sánchez, J. L., Gascón, E., López, L., García-Ortega, E., and Merino, A.: Numerical simulations of snowfall events: Sensitivity analysis of physical parameterizations, J. Geophys. Res.-Atmos., 120, 10130–10148, https://doi.org/10.1002/2015JD023793, 2015.
Fierro, A. O., Mansell, E. R., Macgorman, D. R., and Ziegler, C. L.: The implementation of an explicit charging and discharge lightning scheme within the WRF-ARW model: benchmark simulations of a continental squall line, a tropical cyclone, and a winter storm, Mon. Weather Rev., 141, 2390–2415, https://doi.org/10.1175/MWR-D-12-00278.1, 2013.
Gao, J. D., Xue, M., Brewster, K. A., and Droegemeier, K.: A three-dimensional variational data analysis method with recursive filter for Doppler radars, J. Atmos. Ocean. Tech., 21, 457–469, https://doi.org/10.1175/1520-0426(2004)021<0457:ATVDAM>2.0.CO;2, 2004.
Gascón, E., Laviola, S., Merino, A., and Miglietta, M. M.: Analysis of a localized flash-flood event over the central Mediterranean, Atmos. Res., 182, 256–268, https://doi.org/10.1016/j.atmosres.2016.08.007, 2016.
Georgakakos, K. P.: Covariance propagation and updating in the context of real-time radar data assimilation by quantitative precipitation forecast models, J. Hydrol., 239, 115–129, https://doi.org/10.1016/S0022-1694(00)00355-3, 2000.
Givati, A., Lynn, B., Liu, Y., and Rimmer, A.: Using the WRF model in an operational streamflow forecast system for the Jordan River, J. Appl. Meteorol. Clim., 51, 285–299, https://doi.org/10.1175/JAMC-D-11-082.1, 2012.
Guo, C., Xiao, H., Yang, H., and Tang, Q.: Observation and modeling analyses of the macro-and microphysical characteristics of a heavy rain storm in Beijing, Atmos. Res., 156, 125–141, https://doi.org/10.1016/j.atmosres.2015.01.007, 2015.
Guo, X., Fu, D., Guo, X., and Zhang, C.: A case study of aerosol impacts on summer convective clouds and precipitation over northern China, Atmos. Res., 142, 142–157, https://doi.org/10.1016/j.atmosres.2013.10.006, 2014.
Ha, J. H. and Lee, D. K.: Effect of length scale tuning of bachground error in WRF-3DVar system on assimilation of high-resolution surface data for heavy rainfall simulation, Adv. Atmos. Sci., 29, 1142–1158, https://doi.org/10.1007/s00376-012-1183-z, 2012.
Ha, J. H., Lim, G. H., and Choi, S. J.: Assimilation of GPS radio occultation refractivity data with WRF 3DVAR and its impact on the prediction of a heavy rainfall event, J. Appl. Meteorol. Clim., 53, 1381–1398, https://doi.org/10.1175/JAMC-D-13-0224.1, 2014.
Hamill, T. M.: Performance of Operational model precipitation forecast guidance during the 2013 Colorado front-range floods, Mon. Weather Rev., 142, 2609–2618, https://doi.org/10.1175/MWR-D-14-00007.1, 2014.
Hunter, S. M.: WSR-88D radar rainfall estimation: Capabilities, limitations and potential improvements, Natl. Weather Dig., 20, 26–38, 1996.
Ide, K., Courtier, P., Ghil, M., and Lorenc, A. C.: Unified Notation for data assimilation: Operational, sequential and variational, J. Meteorol. Soc. Jpn., 75, 181–189, 1997.
Janjić, Z. I.: The step-mountain eta coordinate model: further developments of the convection, viscous sublayer, and turbulence closure schemes, Mon. Weather Rev., 122, 927–945, https://doi.org/10.1175/1520-0493(1994)122<0927:TSMECM>2.0.CO;2, 1994.
Jr, J. H. R. and Johnson, R. H.: On the cumulus diurnal cycle over the tropical warm pool, J. Adv. Model Earth Syst., 8, 669–690, https://doi.org/10.1002/2015MS000610, 2016.
Kain, J. S.: The Kain-Fritsch convective parameterization: an update, J. Appl. Meteorol., 43, 170–181, https://doi.org/10.1175/1520-0450(2004)043<0170:TKCPAU>2.0.CO;2, 2004.
Kim, J. H., Shin, D. B., and Kummerow, C.: Impacts of a priori databases using six WRF microphysics schemes on passive microwave rainfall retrievals, J. Atmos. Ocean. Tech., 30, 2367–2381, https://doi.org/10.1175/JTECH-D-12-00261.1, 2013.
Kryza, M., Werner, M., Wałszek, K., and Dore, A. J.: Application and evaluation of the WRF model for high-resolution forecasting of rainfall – a case study of SW Poland, Meteorol. Z., 22, 595–601, https://doi.org/10.1127/0941-2948/2013/0444, 2013.
Li, Y., Wang, X., and Xue, M.: Assimilation of radar radial velocity data with the WRF hybrid ensemble – 3DVAR system for the prediction of Hurricane Ike (2008), Mon. Weather Rev., 140, 3507–3524, https://doi.org/10.1175/MWR-D-12-00043.1, 2012.
Lin, H. H., Lin, P. L., Xiao, Q., and Kuo, Y. H.: Effect of Doppler radial velocity data assimilation on the simulation of a typhoon approaching Taiwan: A case study of Typhoon Aere (2004), Terr. Atmos. Ocean. Sci., 22, 325–345, https://doi.org/10.3319/TAO.2010.10.08.01(A), 2011.
Liu, J. and Han, D.: On selection of the optimal data time interval for real-time hydrological forecasting, Hydrol. Earth Syst. Sci., 17, 3639–3659, https://doi.org/10.5194/hess-17-3639-2013, 2013.
Liu, J., Bray, M., and Han, D.: Sensitivity of the Weather Research and Forecasting (WRF) model to downscaling ratios and storm types in rainfall simulation, Hydrol. Process., 26, 3012–3031, https://doi.org/10.1002/hyp.8247, 2012.
Liu, J., Bray, M., and Han, D.: A study on WRF radar data assimilation for hydrological rainfall precipitation, Hydrol. Earth Syst. Sci., 17, 3095–3110, https://doi.org/10.5194/hess-17-3095-2013, 2013a.
Liu, J., Bray, M., and Han, D.: Exploring the effect of data assimilation by WRF-3DVar for numerical rainfall prediction with different types of storm events, Hydrol. Process., 27, 3627–3640, https://doi.org/10.1002/hyp.9488, 2013b.
Liu, J., Wang, J., Pan, S., Tang, K., Li, C., and Han, D.: A real-time flood forecasting system with dual updating of the NWP rainfall and the river flow, Nat. Hazards., 77, 1161–1182, https://doi.org/10.1007/s11069-015-1643-8, 2015.
Maiello, I., Ferretti, R., Gentile, S., Montopoli, M., Picciotti, E., Marzano, F. S., and Faccani, C.: Impact of radar data assimilation for the simulation of a heavy rainfall case in central Italy using WRF–3DVAR, Atmos. Meas. Tech., 7, 2919–2935, https://doi.org/10.5194/amt-7-2919-2014, 2014.
Meng, Z. and Zhang, F.: Tests of an ensemble Kalman filter for mesoscale and regional-scale data assimilation, Part IV: Comparison with 3DVAR in a month-long experiment, Mon. Weather Rev., 136, 3671–3682, https://doi.org/10.1175/2007MWR2106.1, 2008.
Miao, S., Chen, F., and Li, Q.: Impacts of urban processes and urbanization on summer precipitation: A case study of heavy rainfall in Beijing on 1 August 2006, J. Appl. Meteorol. Clim., 50, 806–825, https://doi.org/10.1175/2007MWR2106.1, 2011.
Mohanty, U. C., Routray, A., Osuri, K. K., and Prasad, S. K.: A study on simulation of heavy rainfall events over Indian region with ARW-3DVAR modeling system, Pure Appl. Geophys., 169, 381–399, https://doi.org/10.1007/s00024-011-0376-1, 2012.
Montmerle, T. and Faccani, C.: Mesoscale assimilation of radial velocities from Doppler radars in a preoperational framework, Mon. Weather Rev., 137, 1939–1953, https://doi.org/10.1175/2008MWR2725.1, 2010.
Pan, X., Tian, X., Li, X., Xie, Z., Shao, A., and Lu, C.: Assimilating Doppler radar radial velocity and reflectivity observations in the weather research and forecasting model by a proper orthogonal-decomposition-based ensemble, three-dimensional variational assimilation method, J. Geophys. Res.-Atmos., 117, D17113, https://doi.org/10.1029/2012JD017684, 2012.
Pan, X., Li, X., Cheng, G., and Hong, Y.: Effects of 4D-Var data assimilation using remote sensing precipitation products in a WRF model over the complex terrain of an arid region river basin, Remote Sensing, 9, 963, https://doi.org/10.3390/rs9090963, 2017.
Pu, Z., Li, X., and Sun, J.: Impact of airborne Doppler radar data assimilation on the numerical simulation of intensity changes of Hurricane Dennis near a landfall, J. Atmos. Sci., 66, 3351–3365, https://doi.org/10.1175/2009JAS3121.1, 2009.
Qie, X., Zhu, R., Yuan, T., Wu, X., Li, W., and Liu, D.: Application of total-lightning data assimilation in a mesoscale convective system based on the WRF model, Atmos. Res., 145–146, 255–266, https://doi.org/10.1016/j.atmosres.2014.04.012, 2014.
Rodwell, M. J., Richardson, D. S., Hewson, T. D., and Haiden, T.: A new equitable score suitable for verifying precipitation in numerical weather prediction, Q. J. Roy. Meteorol. Soc., 136, 1344–1363, https://doi.org/10.1002/qj.65, 2010.
Rossa, A. M., Guerra, F. L. D., Borga, M., Zanon, F., Settin, T., and Leuenberger, D.: Radar-driven high-resolution hydro-meteorological forecasts of the 26 September 2007 Venice flash flood, J. Hydrol., 394, 230–244, https://doi.org/10.1016/j.jhydrol.2010.08.035, 2010.
Routray, A., Mohanty, U. C., Niyogi, D., Rizvi, S. R. H., and Osuri, K. K.: Simulation of heavy rainfall events over Indian monsoon region using WRF-3DVAR data assimilation system, Meteorol. Atmos. Phys., 106, 107–125, https://doi.org/10.1007/s00703-009-0054-3, 2010.
Routray, A., Osuri, K. K., and Kulkarni, M. A.: A comparative study on performance of analysis nudging and 3DVAR in simulation of a heavy rainfall event using WRF modeling system, Isrn. Meteorol., 2012, 1191–1213, https://doi.org/10.5402/2012/523942, 2012.
Sang, Y. F., Wang, Z., and Liu, C.: What factors are responsible for the Beijing storm, Nat. Hazards, 65, 2399–2400, https://doi.org/10.1007/s11069-012-0426-8, 2013.
Schraff, C., Reich, H., Rhodin, A., Schomburg, A., Stephan, K., Perianez, A., and Potthast, R.: Kilometre-scale ensemble data assimilation for the COSMO model (KENDA), Q. J. Roy. Meteorol. Soc., 142, 1453–1472, https://doi.org/10.1002/qj.2748, 2016.
Shih, D. S., Chen, C. H., and Yeh, G. T.: Improving our understanding of flood forecasting using earlier hydro-meteorological intelligence, J. Hydrol., 512, 470–481, https://doi.org/10.1016/j.jhydrol.2014.02.059, 2014.
Shrestha, D. L., Robertson, D. E., Wang, Q. J., Pagano, T. C., and Hapuarachchi, H. A. P.: Evaluation of numerical weather prediction model precipitation forecasts for short-term streamflow forecasting purpose, Hydrol. Earth. Syst. Sci., 17, 1913–1931, https://doi.org/10.5194/hess-17-1913-2013, 2013.
Skamaraock, W. C., Klemp, J. B., Dudhia, J., Gill, D. O., Barker, D. M., Duda, M. G., Huang, X. Y., Wang, W., and Powers, J. G.: A description of the advanced research WRF Version 3, NCAR technical note, available at: http://www.ncar.ucar.edu, last access: 6 January 2008.
Sokol, Z. and Pešice, P.: Comparing nowcastings of three severe convective events by statistical and NWP models, Atmos. Res., 93, 397–407, https://doi.org/10.1016/j.atmosres.2008.09.016, 2009.
Stephan, K., Klink, S., and Schraff, C.: Assimilation of radar-derived rain rates into the convective-scale model COSMO-DE at DWD, Q. J. Roy. Meteorol. Soc., 134, 1315–1326, https://doi.org/10.1002/qj.269, 2010.
Sugimoto, S., Crook, N. A., Sun, J., Xiao, Q., and Barker, D. M.: An examination of WRF 3DVAR radar data assimilation on its capability in retrieving unobserved variables and forecasting precipitation through observing system simulation experiments, Mon. Weather Rev., 137, 4011–4029, https://doi.org/10.1175/2009MWR2839.1, 2009.
Sun, J.: Convective-scale assimilation of radar data: progress and challenges, Q. J. Roy. Meteorol. Soc., 131, 3439–3463, https://doi.org/10.1256/qj.05.149, 2005.
Sun, J. and Crook, N. A.: Dynamical and microphysical retrieval from Doppler radar observations using a cloud model and its adjoint. Part I: Model development and simulated data experiments, J. Atmos. Sci., 54, 1642–1661, https://doi.org/10.1175/1520-0469(1997)054<1642:DAMRFD>2.0.CO;2, 1997.
Sun, J. and Crook, N. A.: Dynamical and microphysical retrieval from Doppler radar observations using a cloud model and its adjoint. Part II: Retrieval experiments of an observed Florida convective storm, J. Atmos. Sci., 55, 835–852, https://doi.org/10.1175/1520-0469(1998)055<0835:DAMRFD>2.0.CO;2, 1998.
Sun, J., Trier, S. B., Xiao, Q., Weisman, M. L., Wang, H., Ying, Z., Xu, M., and Zhang, Y.: Sensitivity of 0-12-h warm-season precipitation forecasts over the central United States to model initialization, Weather Forecast., 27, 832–855, https://doi.org/10.1175/WAF-D-11-00075.1, 2012.
Sun, J., Wang, H., Tong, W., Zhang, Y., Lin, C. Y., and Xu, D.: Comparison of the impacts of momentum control variables on high-resolution variational data assimilation and precipitation forecasting, Mon. Weather Rev., 144, 149–169, https://doi.org/10.1175/MWR-D-14-00205.1, 2016.
Tian, J., Liu, J., Wang, J., Li, C., Yu, F., and Chu, Z.: A spatio-temporal evaluation of the WRF physical parameterisations for numerical rainfall simulation in semi-humid and semi-arid catchments of Northern China, Atmos. Res., 191, 141–155, https://doi.org/10.1016/j.atmosres.2017.03.012, 2017a.
Tian, J., Liu, J., Yan, D., Li, C., Chu, Z., and Yu, F.: An assimilation test of Doppler radar reflectivity and radial velocity from different height layers in improving the WRF rainfall forecasts, Atmos. Res., 198, 132–144, https://doi.org/10.1016/j.atmosres.2017.08.004, 2017b.
Tian, J., Liu, J., Yan, D., Li, C., and Yu, F.: Numerical rainfall simulation with different spatial and temporal evenness by using a WRF multiphysics ensemble, Nat. Hazards Earth Syst. Sci., 17, 563–579, https://doi.org/10.5194/nhess-17-563-2017, 2017c.
Tong, M. and Xue, M.: Ensemble Kalman filter assimilation of Doppler radar data with a compressible nonhydrostatic model: OSS Experiments, Mon. Weather Rev., 133, 1789–1807, https://doi.org/10.1175/MWR2898.1, 2005.
Tu, C. C., Chen, Y. L., Chen, S. Y., Kuo, Y. H., and Lin, P. L.: Impacts of including rain-evaporative cooling in the initial conditions on the prediction of a coastal heavy rainfall event during TiMREX, Mon. Weather Rev., 145, 253–277, https://doi.org/10.1175/MWR-D-16-0224.1, 2017.
Wang, H., Sun, J., Fan, S., and Huang, X.: Indirect assimilation of radar reflectivity with WRF 3D-Var and its impact on prediction of four summertime convective events, J. Appl. Meteorol. Clim., 52, 889–902, https://doi.org/10.1175/JAMC-D-12-0120.1, 2013.
Xiao, Q. and Sun, J.: Multiple-radar data assimilation and short-range quantitative precipitation forecasting of a squall line observed during, IHOP_2002, Mon. Weather Rev., 135, 3381–3404, https://doi.org/10.1175/MWR3471.1, 2007.
Xiao, Q., Kuo, Y. H., Sun, J., Lee, W. C., Lim, E., Guo, Y. R., and Barker, D. M.: Assimilation of Doppler radar observations with a regional 3DVAR System: Impact of Doppler velocities on forecasts of a heavy rainfall case, J. Appl. Meteorol., 44, 768–788, https://doi.org/10.1175/JAM2248.1, 2005.
Yang, B., Zhang, Y., Qian, Y., Huang, A., and Yan, H.: Calibration of a convective parameterization scheme in the WRF model and its impact on the simulation of East Asian summer monsoon precipitation, Clim. Dynam., 44, 1661–1684, https://doi.org/10.1007/s00382-014-2118-4, 2015.
Yucel, I., Onen, A., Yilmaz, K. K., and Gochis, D. J.: Calibration and evaluation of a flood forecasting system: Utility of numerical weather prediction model, data assimilation and satellite-based rainfall, J. Hydrol., 523, 49–66, https://doi.org/10.1016/j.jhydrol.2015.01.042, 2015.
Zhang, L., Pu, Z., Lee, W. C., and Zhao, Q.: The influence of airborne Doppler radar data quality on numerical simulations of a tropical cyclone, Weather Forecast., 27, 231–239, https://doi.org/10.1175/WAF-D-11-00028.1, 2012.
Zhong, L., Mu, R., Zhang, D., Zhao, P., Zhang, Z., and Wang, N.: An observational analysis of warm-sector rainfall characteristics associated with the 21 July 2012 Beijing extreme rainfall event, J. Geophys. Res., 120, 3274–3291, https://doi.org/10.1002/2014JD022686, 2015.