the Creative Commons Attribution 3.0 License.
the Creative Commons Attribution 3.0 License.
Characterizing drought in terms of changes in the precipitation–runoff relationship: a case study of the Loess Plateau, China
Yuan Zhang
Xiaoming Feng
Xiaofeng Wang
Bojie Fu
The frequency and intensity of drought are increasing dramatically with global warming. However, few studies have characterized drought in terms of its impacts on ecosystem services, the mechanisms through which ecosystems support life. As a result, little is known about the implications of increased drought for resource management. This case study characterizes drought by linking climate anomalies with changes in the precipitation–runoff relationship (PRR) on the Loess Plateau of China, a water-limited region where ongoing revegetation makes drought a major concern. We analyzed drought events with drought durations ≥ 5 years and mean annual precipitation anomaly (PA) values ≤ −5 % during drought periods. The results show that continuous precipitation shifts are able to change the water balance of watersheds in water-limited areas, and multi-year drought events cause the PRR to change with a significantly decreasing trend (p < 0.05) compared to other historical records. For the Loess Plateau as a whole, the average runoff ratio decreased from 10 to 6.8 % during 1991–1999. The joint probability and return period gradually increase with increasing of drought duration and severity. The ecosystem service of water yield is easily affected by drought events with durations equal to or greater than 6 years and drought severity values equal to or greater than 0.55 (precipitation ≤ 212 mm). At the same time, multi-year drought events also lead to significant changes in the leaf area index (LAI). Such studies are essential for ecosystem management in water-limited areas.
- Article
(8186 KB) - Full-text XML
- BibTeX
- EndNote


Drought is a complex and recurrent climate-related phenomenon that has far-reaching adverse impacts on agriculture, water resources, the environment and human life (Ghulam et al., 2007; Goddard et al., 2001). Few types of extreme events have been as economically and ecologically disruptive as droughts over the past half century (Dai, 2011). For example, multi-year droughts across the globe have triggered an increase in tree mortality that is linked to climate change (Allen et al., 2010). On regional scales, during 1998–2001, one-third of the territory of Iran was affected by the most severe drought in the history of the country. More than half of the country's population faced food shortages and a lack of drinking-water supplies (Raziei et al., 2009). The annual economic losses caused by droughts in the United States are estimated as being up to USD 6–8 billion (Wilhite, 2000). As a result of these impacts, increasing numbers of studies now focus on characterizing drought events, including drought identification and frequency analysis, and the resource management actions required by droughts (Michele et al., 2013).
Many drought indices have been developed to monitor the evolution of drought events on regional and global scales (Yan et al., 2016). Meteorological drought can be identified from anomalies in precipitation data, as assessed by the Palmer drought severity index (PDSI; Palmer, 1965), the standardized precipitation index (SPI; McKee et al., 1993), the precipitation anomaly (Moron, 1994) and the Bhalme–Mooley index (Bhalme and Mooley, 1980). Other researchers have recognized the necessity of developing drought indicators that reflect the causes and impacts of drought, and the resulting drought indices incorporate many different physical, biological and socioeconomic variables (Sheffield et al., 2004). For example, the soil moisture indicator (Xia et al., 2014), the crop drought indicator (Duff et al., 1997) and the crop water demand indicators are used to identify agricultural drought events, which are periods that feature dry soil conditions and result from below-average precipitation, intense but less frequent rain events or above-normal evaporation. All of these factors lead to reductions in crop production and plant growth. Hydrological droughts (Herbst et al., 1966; Mohan and Rangacharya, 1991) are usually identified using run-length theory and are characterized as periods when water demand exceeds supply because of long-term precipitation shortages. In addition, socioeconomic drought reflects the undesirable social and economic impacts induced by the other types of droughts mentioned above. All of these drought indicators employ single variables to quantify drought events. However, drought conditions are associated with multiple variables; thus, no single drought indicator provides a satisfactory characterization of the complex conditions associated with droughts or their broad impacts (Hao and Singh, 2015). At the same time, because ecosystem services are closely related to the living conditions experienced by human beings (Burkhard et al., 2014; Zheng et al., 2016), these drought indicators also cannot reflect the impacts of droughts on ecosystems and provide relatively little information to policy makers and resource managers.
The precipitation–runoff relationship (PRR) is an important issue in engineering hydrology, water resource planning and management, and watershed system evolution (Guo et al., 2016; Nourani et al., 2015). Current studies focus on changes in the PRR and the processes by which these changes occur. Charlier et al. (2015) applied the wavelet transform method to detect changes in the PRR. Sun et al. (2016) assessed hydrologic trends in urban catchments using a conceptual urban precipitation–runoff model, which is beneficial for storm water management and planning. There is no doubt that variations in the PRR reflect the actual integrated volume of precipitation and runoff. The ratio between the annual runoff and the annual precipitation, the so-called “runoff ratio” (Savenije, 1996; Feng et al., 2016b) is frequently employed to quantify the ecosystem service of water yield. This ecosystem service is of major concern in water-limited areas because it represents the water resource available to human beings. Studies have shown that protracted drought may affect runoff generation and cause changes in the PRR (Petrone et al., 2010; Saft et al., 2015). Therefore, the shift in the PRR caused by an extended drought will eventually have an adverse effect on the ecosystem service of water yield. Based on this perspective, we want to characterize drought events in terms of the changes in the PRR that they produce and investigate the characteristics and frequency of these dry events, thus contributing to further optimizations of ecosystem management.
Drought stress is the main environmental factor limiting terrestrial ecosystem productivity in arid and semi-arid areas (Boyer, 1982). The vegetation restoration programme in China represents the largest investment that has been made to restore the ecosystem in this developing country. Given the limited water resources on the Loess Plateau, the sustainability of vegetation restoration is a major concern of scientific research and policy makers there (Feng et al., 2016b). As a typical coupled human–natural system on the Loess Plateau of China, the ecosystem service of water yield is of concern for both the sustainability of the revegetation programme and the objective of raising the level of economic development (Wang et al., 2015; Feng et al., 2016a). In recent years, the climate of the Loess Plateau has become warmer and drier (Lü et al., 2014) as global temperatures have increased, a change that will eventually affect the balance between the water supply and demand of the region. Thus, analyzing drought characteristics in terms of the changes in the PRR that occur in response to multi-year dry periods is of great importance in estimating the effects of drought and the ecological reconstruction of the Loess Plateau as a whole.
The objectives of our study are to characterize droughts on the Loess Plateau. We first link climate conditions and the PRR to define drought. We then simulate the drought frequency and return period of drought events of different magnitudes. Finally, we discuss the policy implications of our study for ecosystem management.
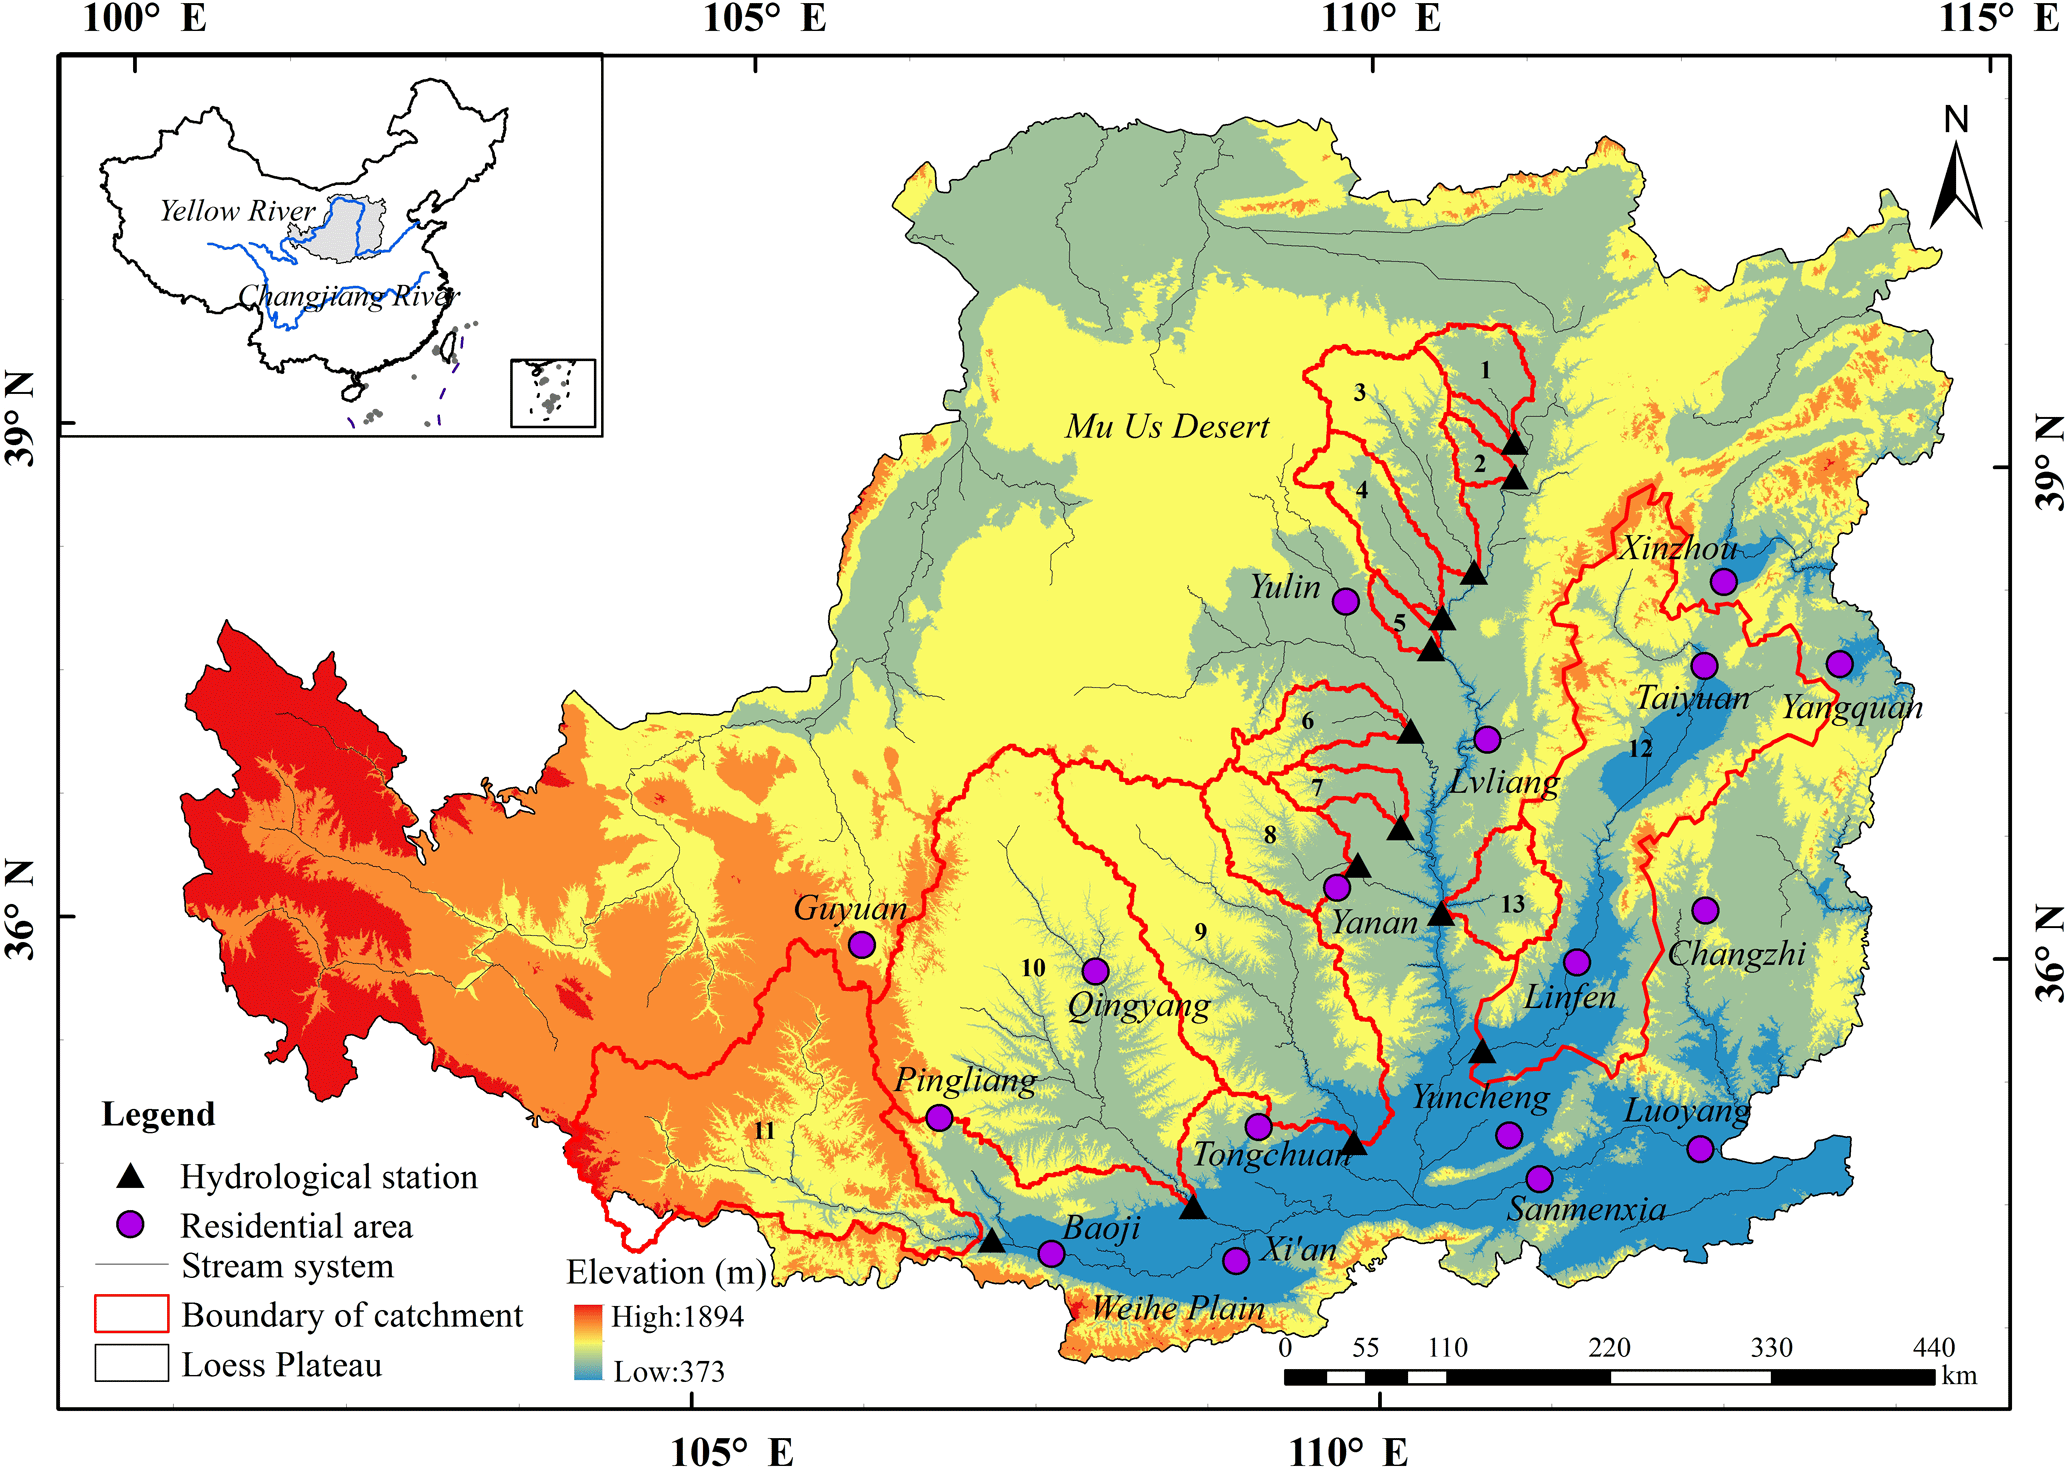
Table 1Watershed characteristics and hydrological data for the study period 1961–1999.
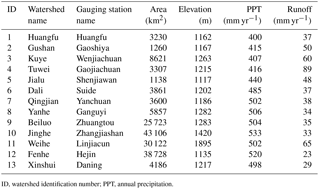
ID, watershed identification number; PPT, annual precipitation.
2.1 Study area
The Loess Plateau (Fig. 1) is located between 100∘54′–114∘33′ E and 33∘43′–41∘16′ N and covers a total area of 624 000 km2. It has a semi-arid and semi-humid climate. From 1960 to 2000, the annual precipitation ranged from 200 mm in the northwest to 700 mm in the southeast. It is a key area in current and past efforts to conserve soil and water in the Yellow River basin. The ecology of the Loess Plateau is sensitive to climate change.
In this study, we examine the 13 primary watersheds of the Loess Plateau (Fig. 1), which make up approximately 35 % of the area of the Loess Plateau. The river runoff from these 13 watersheds contributes 65 % of the discharge into the middle reach of the Yellow River. The attributes of each basin are shown in Table 1. Runoff and meteorological data for these 13 watersheds covering the period from 1961 to 1999 were obtained from the Yellow River Conservancy Commission (http://www.yellowriver.gov.cn/) and the National Meteorological Information Center (NMIC; http://cdc.nmic.cn/home.do) of the Chinese Meteorological Administration (CMA), respectively. The AVHRR GIMMS LAI3g datasets covering the period from 1982 to 1999 were also used in this study. These datasets were generated from AVHRR GIMMS NDVI3g data using a model based on an artificial neural network (http://sites.bu.edu/cliveg/). Some studies have shown that the Grain for Green Program, which began in 1999, resulted in a reduction of runoff from the Loess Plateau (Zhang et al., 2008; Feng et al., 2016b), so the study period is selected from 1961 to 1999.
2.2 Drought identification
In this study, we define drought based on annual precipitation for two aspects. On the one hand, the amount of precipitation is the most important climatic control of drought conditions (Mishra and Singh, 2010). Moreover, because we are interested in determining whether the runoff response differs for multi-year droughts, we do not consider runoff in identifying drought events.
We first calculate the precipitation anomaly (PA) values in the studied watersheds on the Loess Plateau. The time series of anomaly values are divided by the mean annual precipitation and smoothed with a 3-year moving average. Positive PA values indicate that the observed precipitation is higher than the median. On the other hand, negative PA values indicate that the observed precipitation is below the median and imply the possible occurrence of a drought. Each drought event is characterized in terms of its duration and severity. Studies have shown that the drought events with shorter durations but greater intensities or lower intensities but greater durations cause serious water-supply and other drought-related problems (Shiau, 2006; Naresh et al., 2009). Therefore, the basic rules for identifying drought events in this study are (1) a PA value for a single year of ≤ −10 % or (2) mean PA values of less than 0 for more than three consecutive years. Note that the PA value of the starting year of each drought period is negative.
In this study, the cumulative PA values during each drought period are used to measure drought severity (for convenience, drought severity is multiplied by −1 to obtain a positive value). Based on the rules mentioned above, we identified all of the drought events that occurred in each watershed. To reflect the response of the PRR to drought events over the years, we must ensure that the dry periods are sufficiently long and severe. In the subsequent analysis, we consider only drought events with durations ≥ 5 years and mean annual PA values ≤ −5 % during the drought period. Finally, the dry events are classified into major dry periods and single-year dry periods.
We use the Kolmogorov–Smirnov (K–S; Massey, 1951) test to determine whether annual precipitation and runoff data follow a roughly normal distribution. A Box–Cox transformation is applied to those data that are not normally distributed (Box and Cox, 1964). After identifying the major drought events, we examine whether the change in the PRR is statistically significant compared to the historic record using Student's t test (p≤ 0.05). The historical records refer to scatter plots of annual precipitation–runoff during the period of 1961–1999, except for particular major drought periods. For example, when the drought that occurred in 1970–1974 is considered, the corresponding historical record includes a precipitation–runoff scatter plot that includes data from 1961 to 1969 and from 1975 to 1999. For the drought that occurred in 1991–1999, the corresponding historical record refers to a precipitation–runoff scatter plot containing data from 1961 to 1990.
2.3 Drought frequency analysis
Drought can be characterized by multiple variables, such as duration, severity and spatial extent (Steinemann and Cavalcanti, 2006; Hayes et al., 2012), but how to determine the joint distribution between these variables remains an important issue. Here, we use the copula function (Shiau, 2006). We construct a joint distribution function using two main drought characteristics, drought duration and severity. If the marginal distribution functions of drought duration (d) and drought severity (s) are FD(d) and FS(s), respectively, a copula C exits that combines these two marginal distributions to give the joint distribution function, FD,S(ds):
If the marginal distributions FD(d) and FS(s) are continuous, fD(d) and fS(s) are the density functions corresponding to FD(d) and FS(s), respectively, and the joint probability density function becomes
where c is the density function of C, which is defined as
2.4 The criteria used in determining the values of the parameters and goodness-of-fit testing
2.4.1 Parameter estimation
The maximum likelihood (ML), inference functions for margins (IFM) and canonical maximum likelihood (CML) methods are commonly used in parameter estimation (Mirabbasi et al., 2012; Lee et al., 2013). Here, we use ML and IFM to estimate the parameters of the marginal distribution functions and the joint copula functions of drought duration and severity, respectively. We employ seven common distributions to describe the univariate probability distributions as the candidate margins for drought duration and severity. These distributions are the exponential, gamma, log-normal, extreme value, generalized extreme value, Poisson and Weibull distributions. The K–S test is used to establish the optimal marginal distribution function. The ML method is used to estimate the distribution parameters of drought duration (α1, β1) and severity (α2, β2), and the parameters of copula function are then calculated using the following formula:
where ln LC is the log-likelihood function of the copulas.
2.4.2 The determination of the optimal joint distribution function
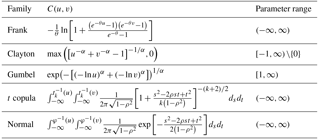
Five commonly used two-dimensional functions are constructed using the marginal distribution function of drought duration and drought severity (Table 2). The goodness-of-fit test is performed by calculating the squared Euclidean distance (SED) between the theoretical copula and the empirical copula (Berg, 2009). The empirical copula and SED are respectively defined as
In addition to the SED method, the root mean square error (RMSE) and the Akaike information criterion (AIC) are adopted to further evaluate the fitted copula.
2.5 Drought return period
N is the drought series length and n is the number of drought events. The return period of a single variable can be obtained from the definition of the copula function as
The joint distribution function of drought duration and severity is
The joint return period of the two characteristic variables is calculated as
3.1 Drought events on the Loess Plateau
Of the 39 years that make up the study period, the precipitation anomaly is negative in 17 years. Based on the drought identification method developed in this study, seven dry periods are identified (Fig. 2), including both major dry periods and single-year dry periods. We find that the periods of 1970–1974, 1979–1983 and 1991–1999 all represent droughts with durations longer than 5 years. The corresponding drought severities are 0.51, 0.32 and 0.61, and the average precipitation values of these events are 231, 320 and 183 mm, respectively.
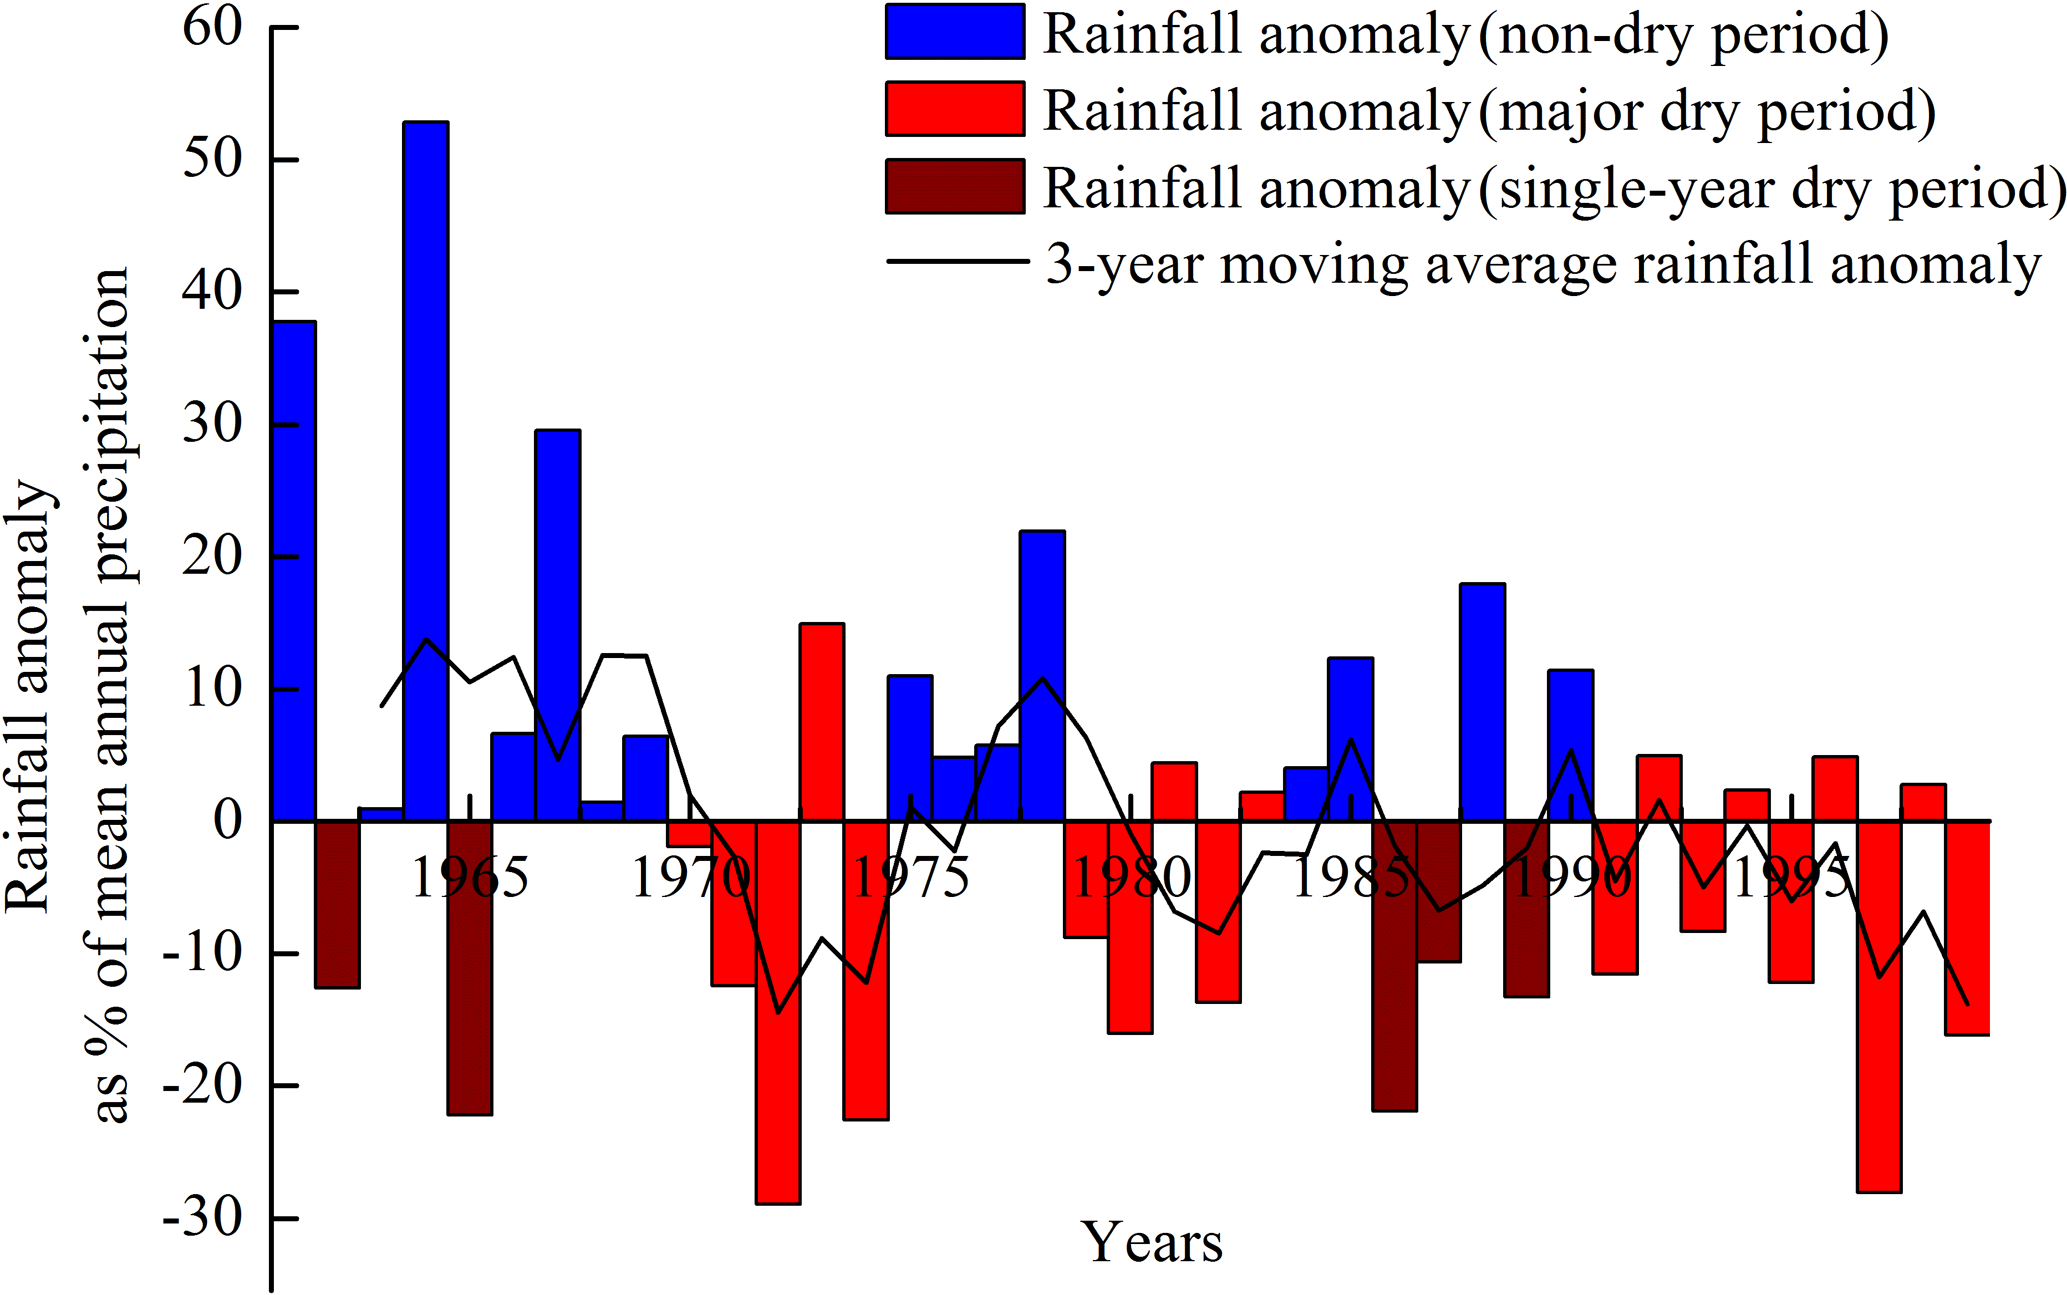
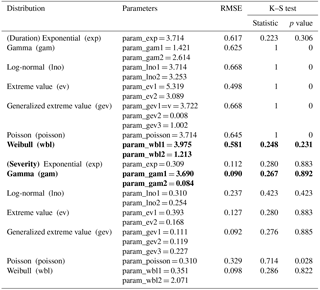
Table 3Parameters and goodness-of-fit values of the marginal distributions. The best fitted marginal distributions of duration and severity are marked with bold font.
Applying the K–S test to the precipitation–runoff data from 1961 to 1999 shows that the precipitation–runoff data in this time series approximate a normal distribution, providing the premise for a linear relationship between precipitation and runoff. The changes in the PRR during the three major drought periods on the Loess Plateau show that the PRR may change significantly during these drought periods (Fig. 3). No significant changes can be identified during the drought periods of 1970–1974 (p= 0.692) or 1979–1983 (p= 0.514), although the regression lines for these dry periods deviate from the overall regression line. However, a significant decrease in the PRR can be identified for 1991–1999 (p= 0.000). In this period, the dry period regression lines are lower than nearly all of the other points, indicating unprecedentedly low runoff generation rates for a given amount of precipitation. The runoff ratio is approximately 10 % from 1961 to 1990. In the dry period of 1991–1999, the average runoff ratio decreased to 6.8 %.
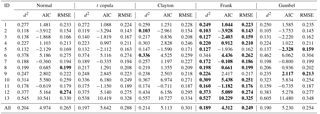
Table 4The goodness-of-fit values of the copula functions. The optimal of copula function in each watershed is marked with bold font.
3.2 Drought frequency on the Loess Plateau
Table 3 lists the estimated parameters and the results of goodness-of-fit tests for the marginal functions. We find that not all of the distributions pass the K–S test at the 95 % (α= 0.05) significance level. Further considering the RMSE, the marginal distributions that provide the best fits to the drought duration and severity values are Weibull and gamma distributions, respectively. The results for these distributions are shown in bold font and underlined in Table 3. The goodness of fit for the joint function was evaluated by calculating the SED, RMSE and AIC. As shown in Table 4, these metrics indicate that the Frank copula function is the best suited to fitting the duration and severity of the drought events in the study area, except for the Jialu, Dali and Beiluo watersheds. Note that, for the three watersheds mentioned above, the values of the SED, RMSE and AIC are also relatively small. Finally, we choose the Frank copula function to represent the joint distribution function of drought duration and severity.
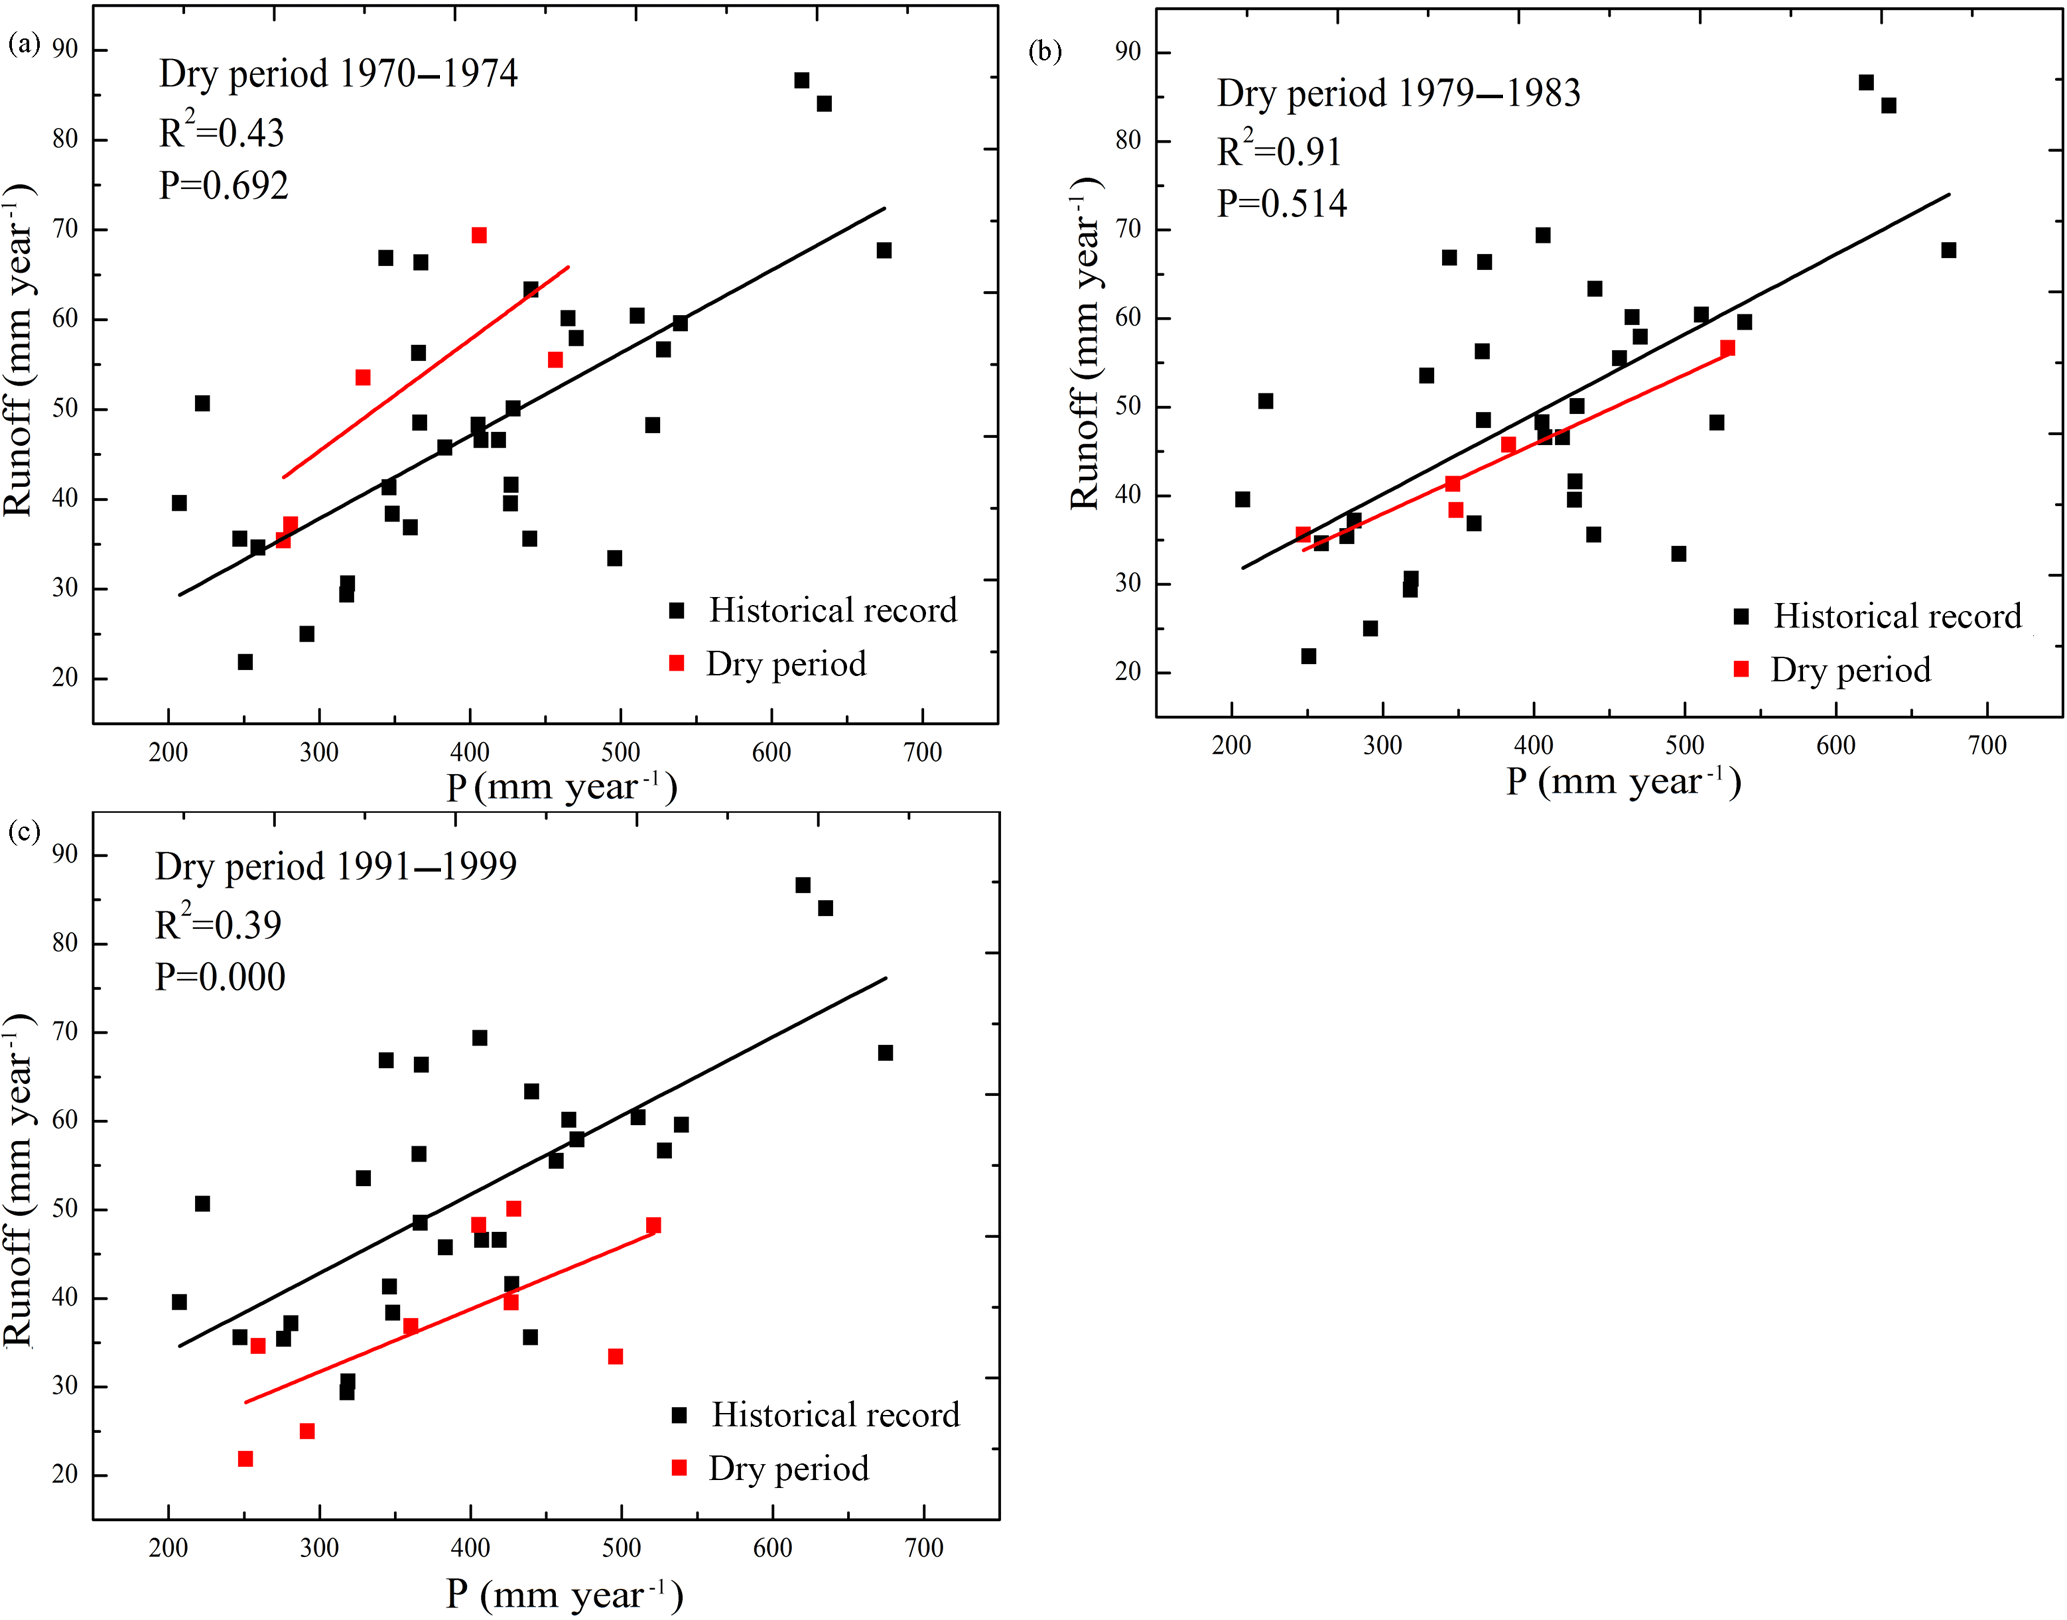
Figure 3Precipitation–runoff relationships during drought periods: (a) and (b) show no significant changes in the precipitation–runoff relationship, whereas (c) shows a significant downward change in the precipitation–runoff relationship.
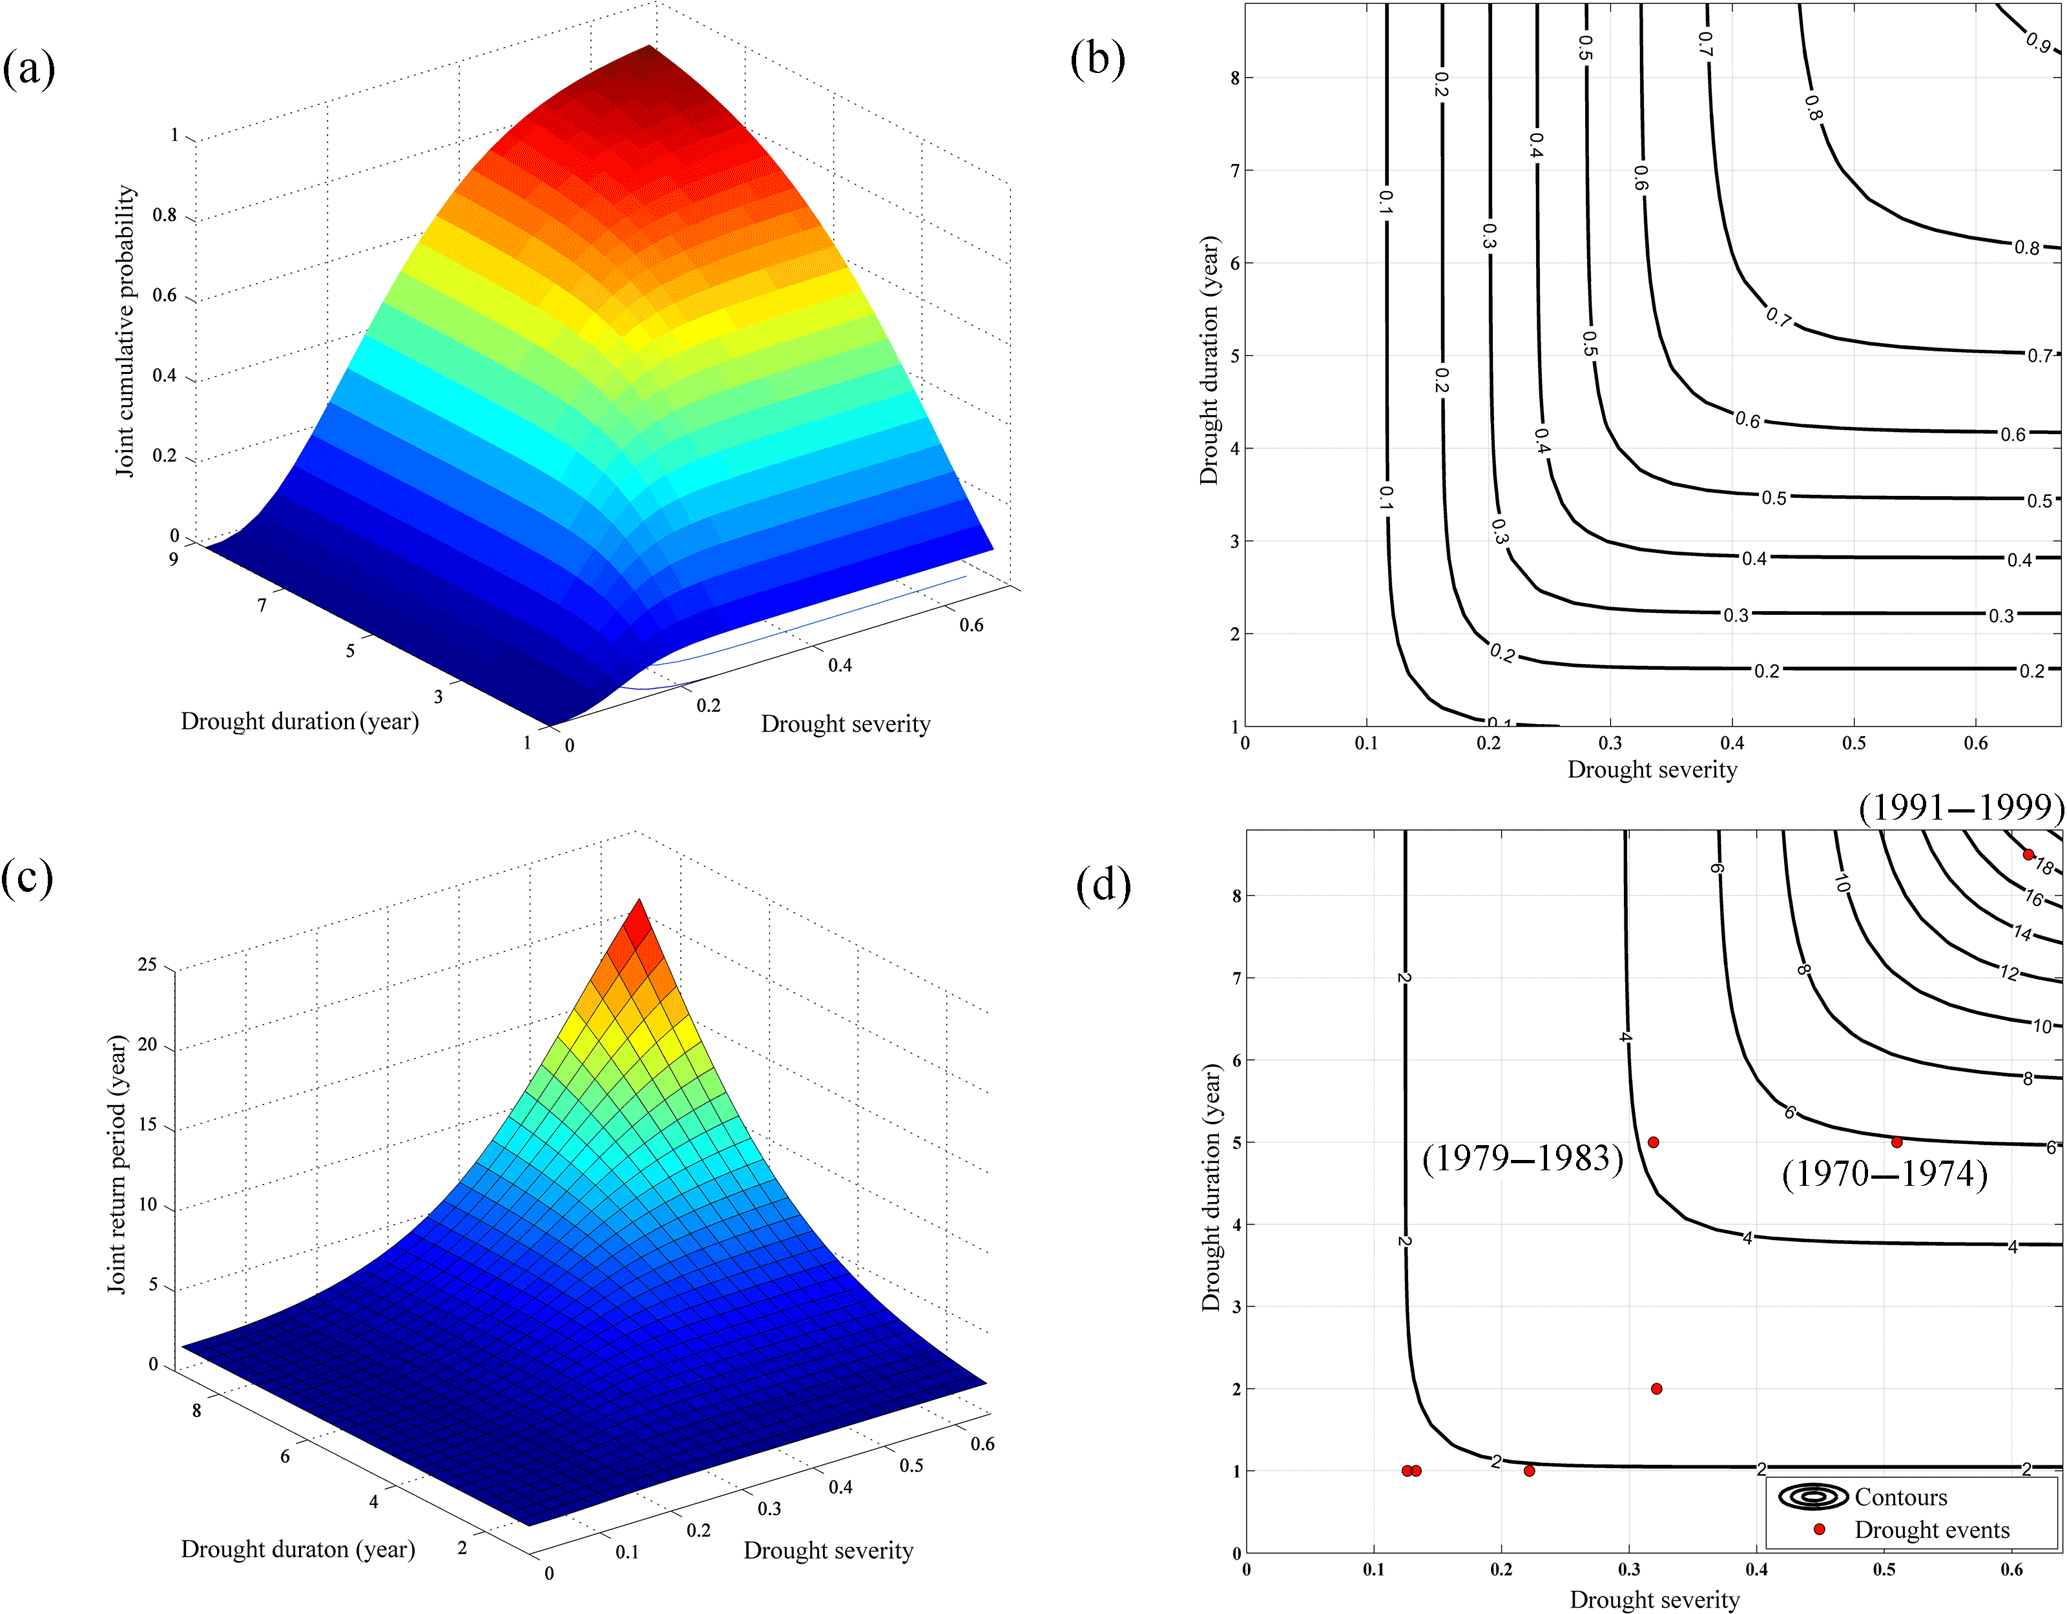
Figure 4The joint probability distribution of drought duration and drought severity and the joint return period: (a) and (b) are the three-dimensional and contour maps of the joint probability density function of the Frank copula, respectively; (c) and (d) are the three-dimensional and contour maps of the joint return period of drought duration and drought severity, respectively.
Figure 4a and b show that the joint probability increases with increasing drought duration and drought severity, regardless of the three-dimensional joint cumulative probability or the contour lines. When the drought severity ranges from 0.1 to 0.35 (which corresponds to precipitation values that range from 306 to 423 mm), the contours are nearly vertical, and the drought duration varies greatly (ranging from 1 to 9 years). When the drought duration is less than 5 years, the cumulative probability of the bivariate increases rapidly as drought severity increases. In contrast, when the drought duration exceeds 5 years, the rate of increase in the joint probability decreases as drought severity increases. When the drought severity is not more than 0.4 (precipitation ≥ 282 mm), the joint probability of drought increases rapidly with increasing drought duration, and the rate of increase in the joint probability decreases as drought duration increases when drought severity is greater than 0.4 (precipitation ≤ 282 mm). The density of the contours shows that, on the Loess Plateau from 1961 to 1999, drought events with drought durations ranging from 2 to 5 years and drought severity ranging from 0.2 to 0.5 (for which the corresponding precipitation values are 235–470 mm) occurred easily. The joint probabilities of drought characteristics are key to drought management. The probability that both drought duration and severity simultaneously exceed certain thresholds is useful information for environmental and government agencies responsible for water system management under drought conditions.
Figure 4c and d show that, as drought duration and drought severity increase, the joint return period also shows an increasing trend. When the duration and severity of drought events reach a maximum during the study period, the joint return period of such drought events on the Loess Plateau is close to 22 years. For the three major drought events that occurred on the Loess Plateau between 1961 and 1999, the return period is about 5.74 years for drought durations of 5 years or drought severity of up to 0.51 (1970–1974). The return period reaches 4.32 years for the drought that occurred in 1979–1983, which displayed a duration of 5 years and a severity of 0.39. The return period of the most severe drought event in the study period, which had a duration of 9 years and a severity of 0.61, is 18.31 years. The return period of the drought period that occurred in 1970–1974 is approximately 5.74 years, given the corresponding drought characteristics. Therefore, the next drought event similar to the drought period that took place from 1970 to 1974 occurred around 1980. During 1979–1983, the drought duration reached 5 years, which is close to the estimated return period.
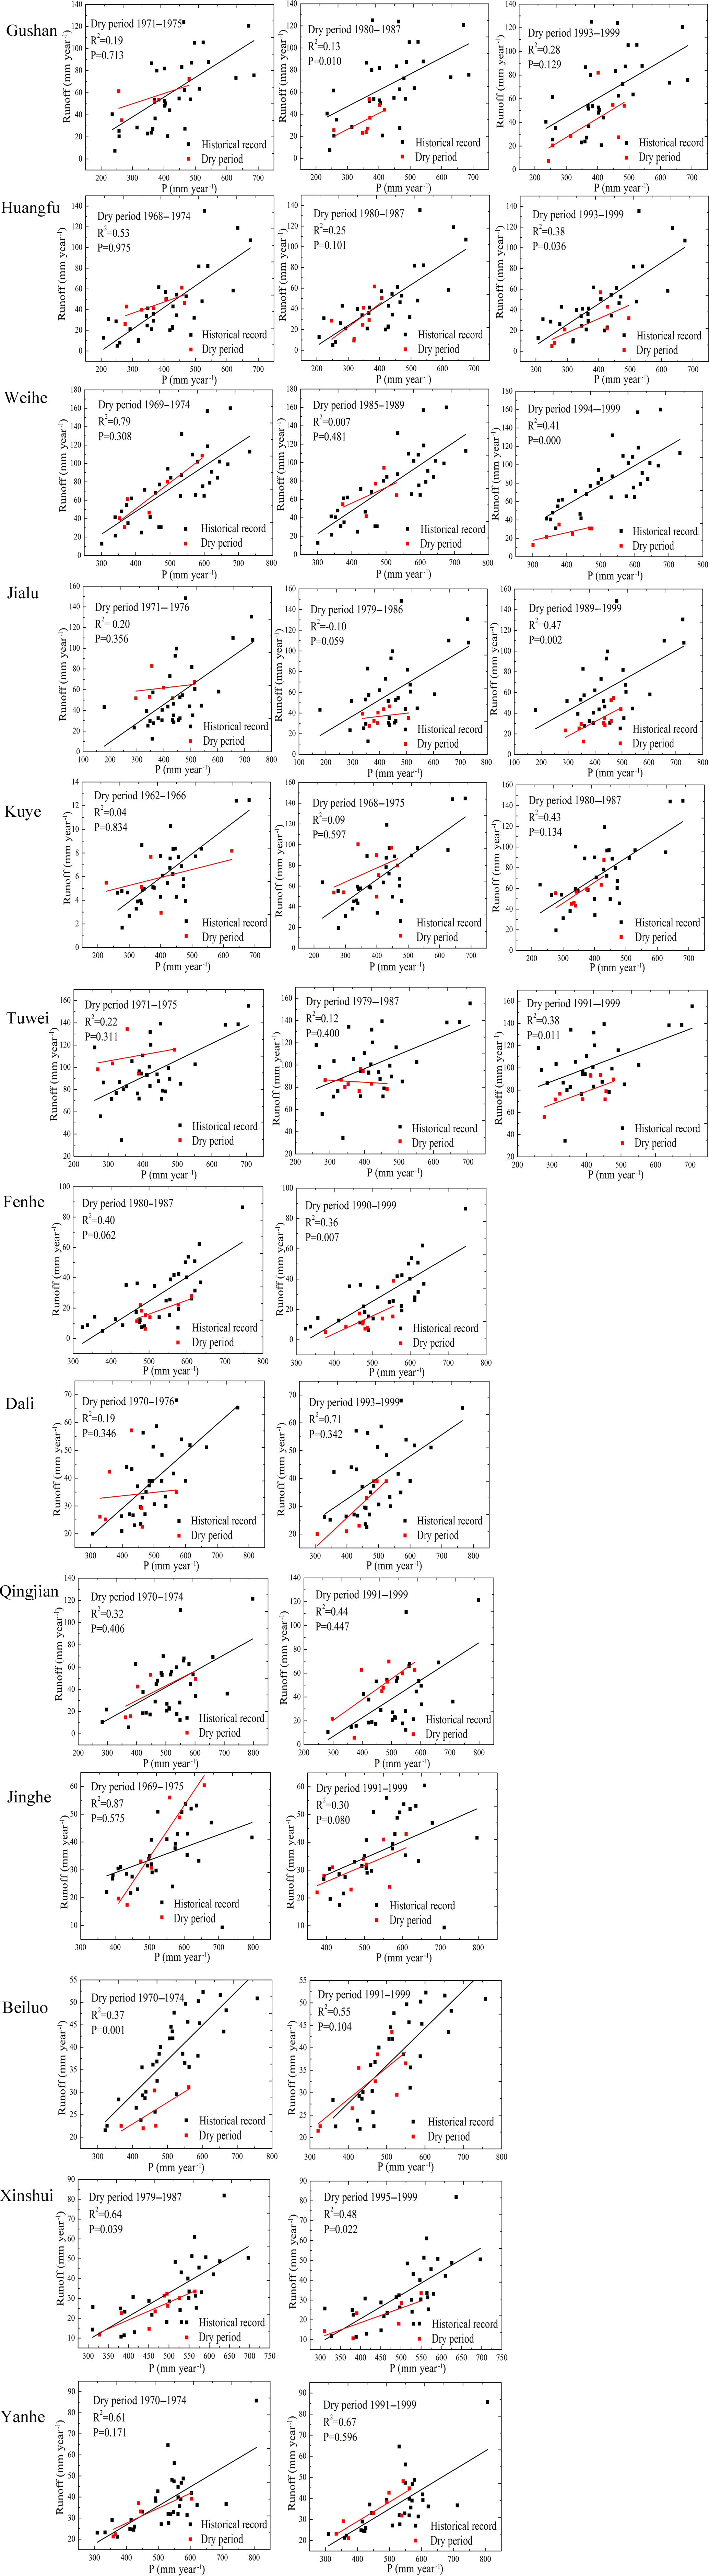
Figure 5The annual precipitation–runoff scatter plot for each watershed.
3.3 Variability of the PRR during the dry periods in each watershed
Prolonged multi-year drought causes significant damages in natural environments. Figure 5 demonstrates the range of changes in the PRR under sustained precipitation decreases. According to the direction of change, the dry period regression line is mainly located above or below the overall regression line, and the PRR in the 13 studied watersheds exhibits no significant change when the regression line of the dry period is above the total regression line. Of the 15 cases in which dry events fell under the overall regression line in the 13 watersheds from 1961 to 1999, significant changes in the PRR (p < 0.05) occurred in 9 cases, accounting for approximately 60 % of the total cases. In these cases, the dry period regression line lies lower than nearly all of the other parts of the historical record, indicating unprecedentedly low runoff generation rates for the given precipitation values. Thus in a sequence of years with decreased precipitation, we can conclude that lower runoff not only relate to the lower precipitation, but also less runoff than expected caused by the multi-year drought period.
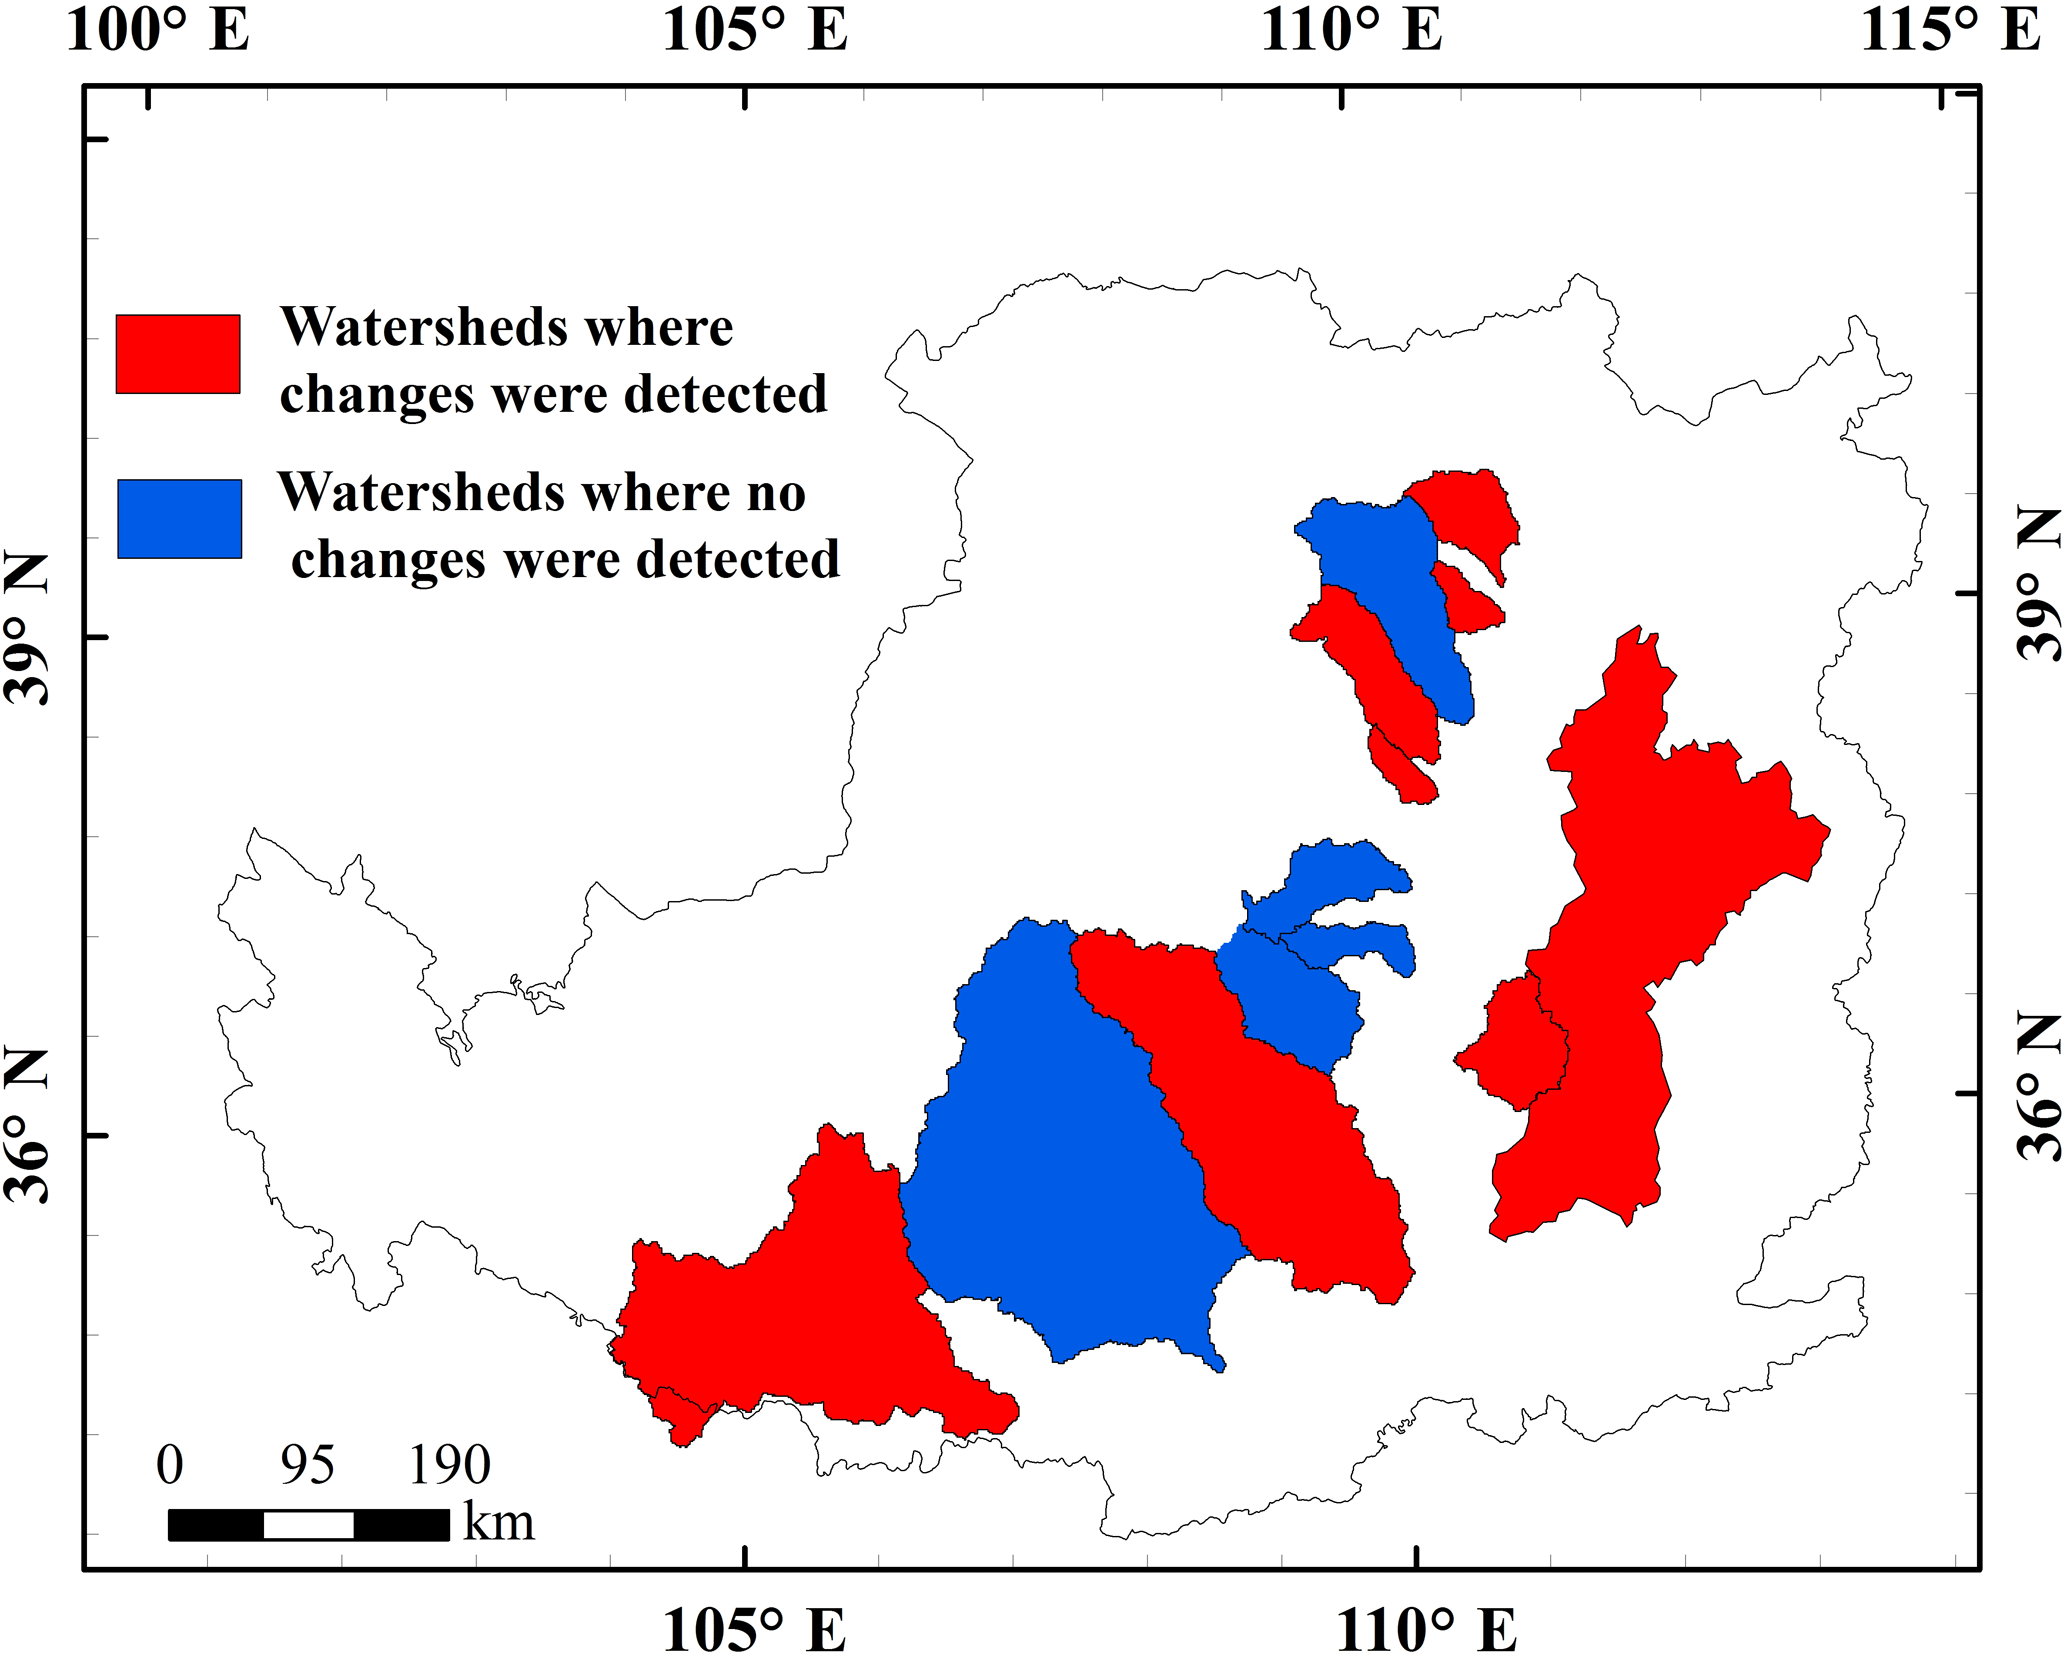
Figure 6Spatial distribution of watersheds with and without significant changes in the PRR during the drought periods.
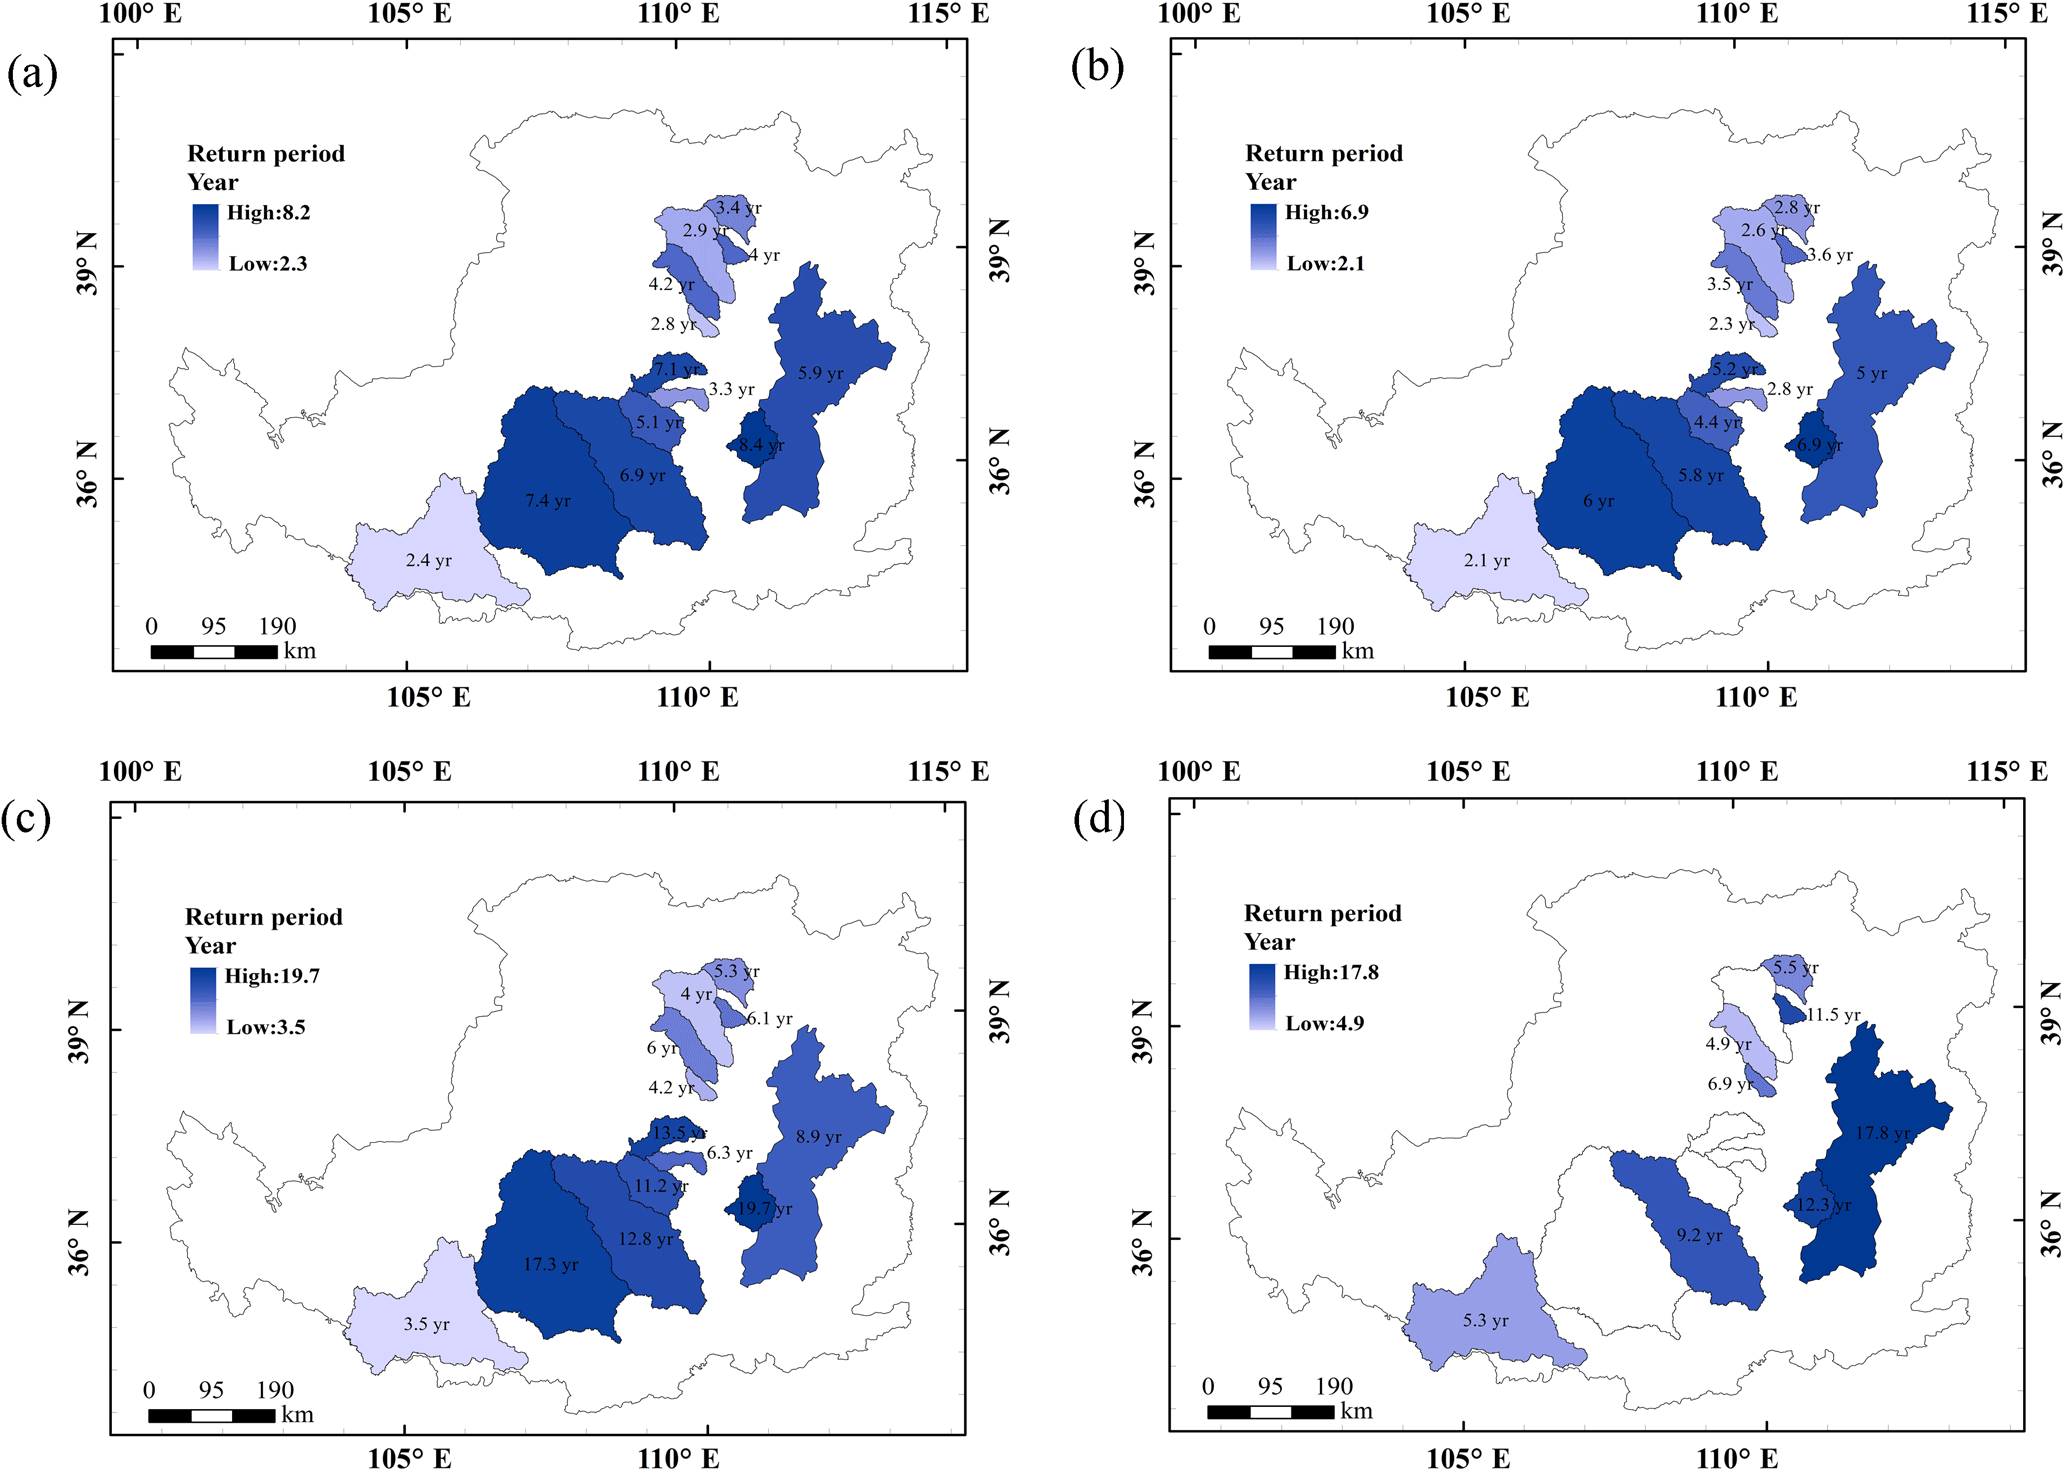
Figure 7Spatial distribution of the return period of drought events in watersheds: (a) spatial distribution of the return period of drought events in 1970–1974; (b) spatial distribution of the return period of drought events in 1979–1983; (c) spatial distribution of the return period of drought events in 1991–1999; (d) return period of drought events corresponding to watersheds with significant changes in the PRR.

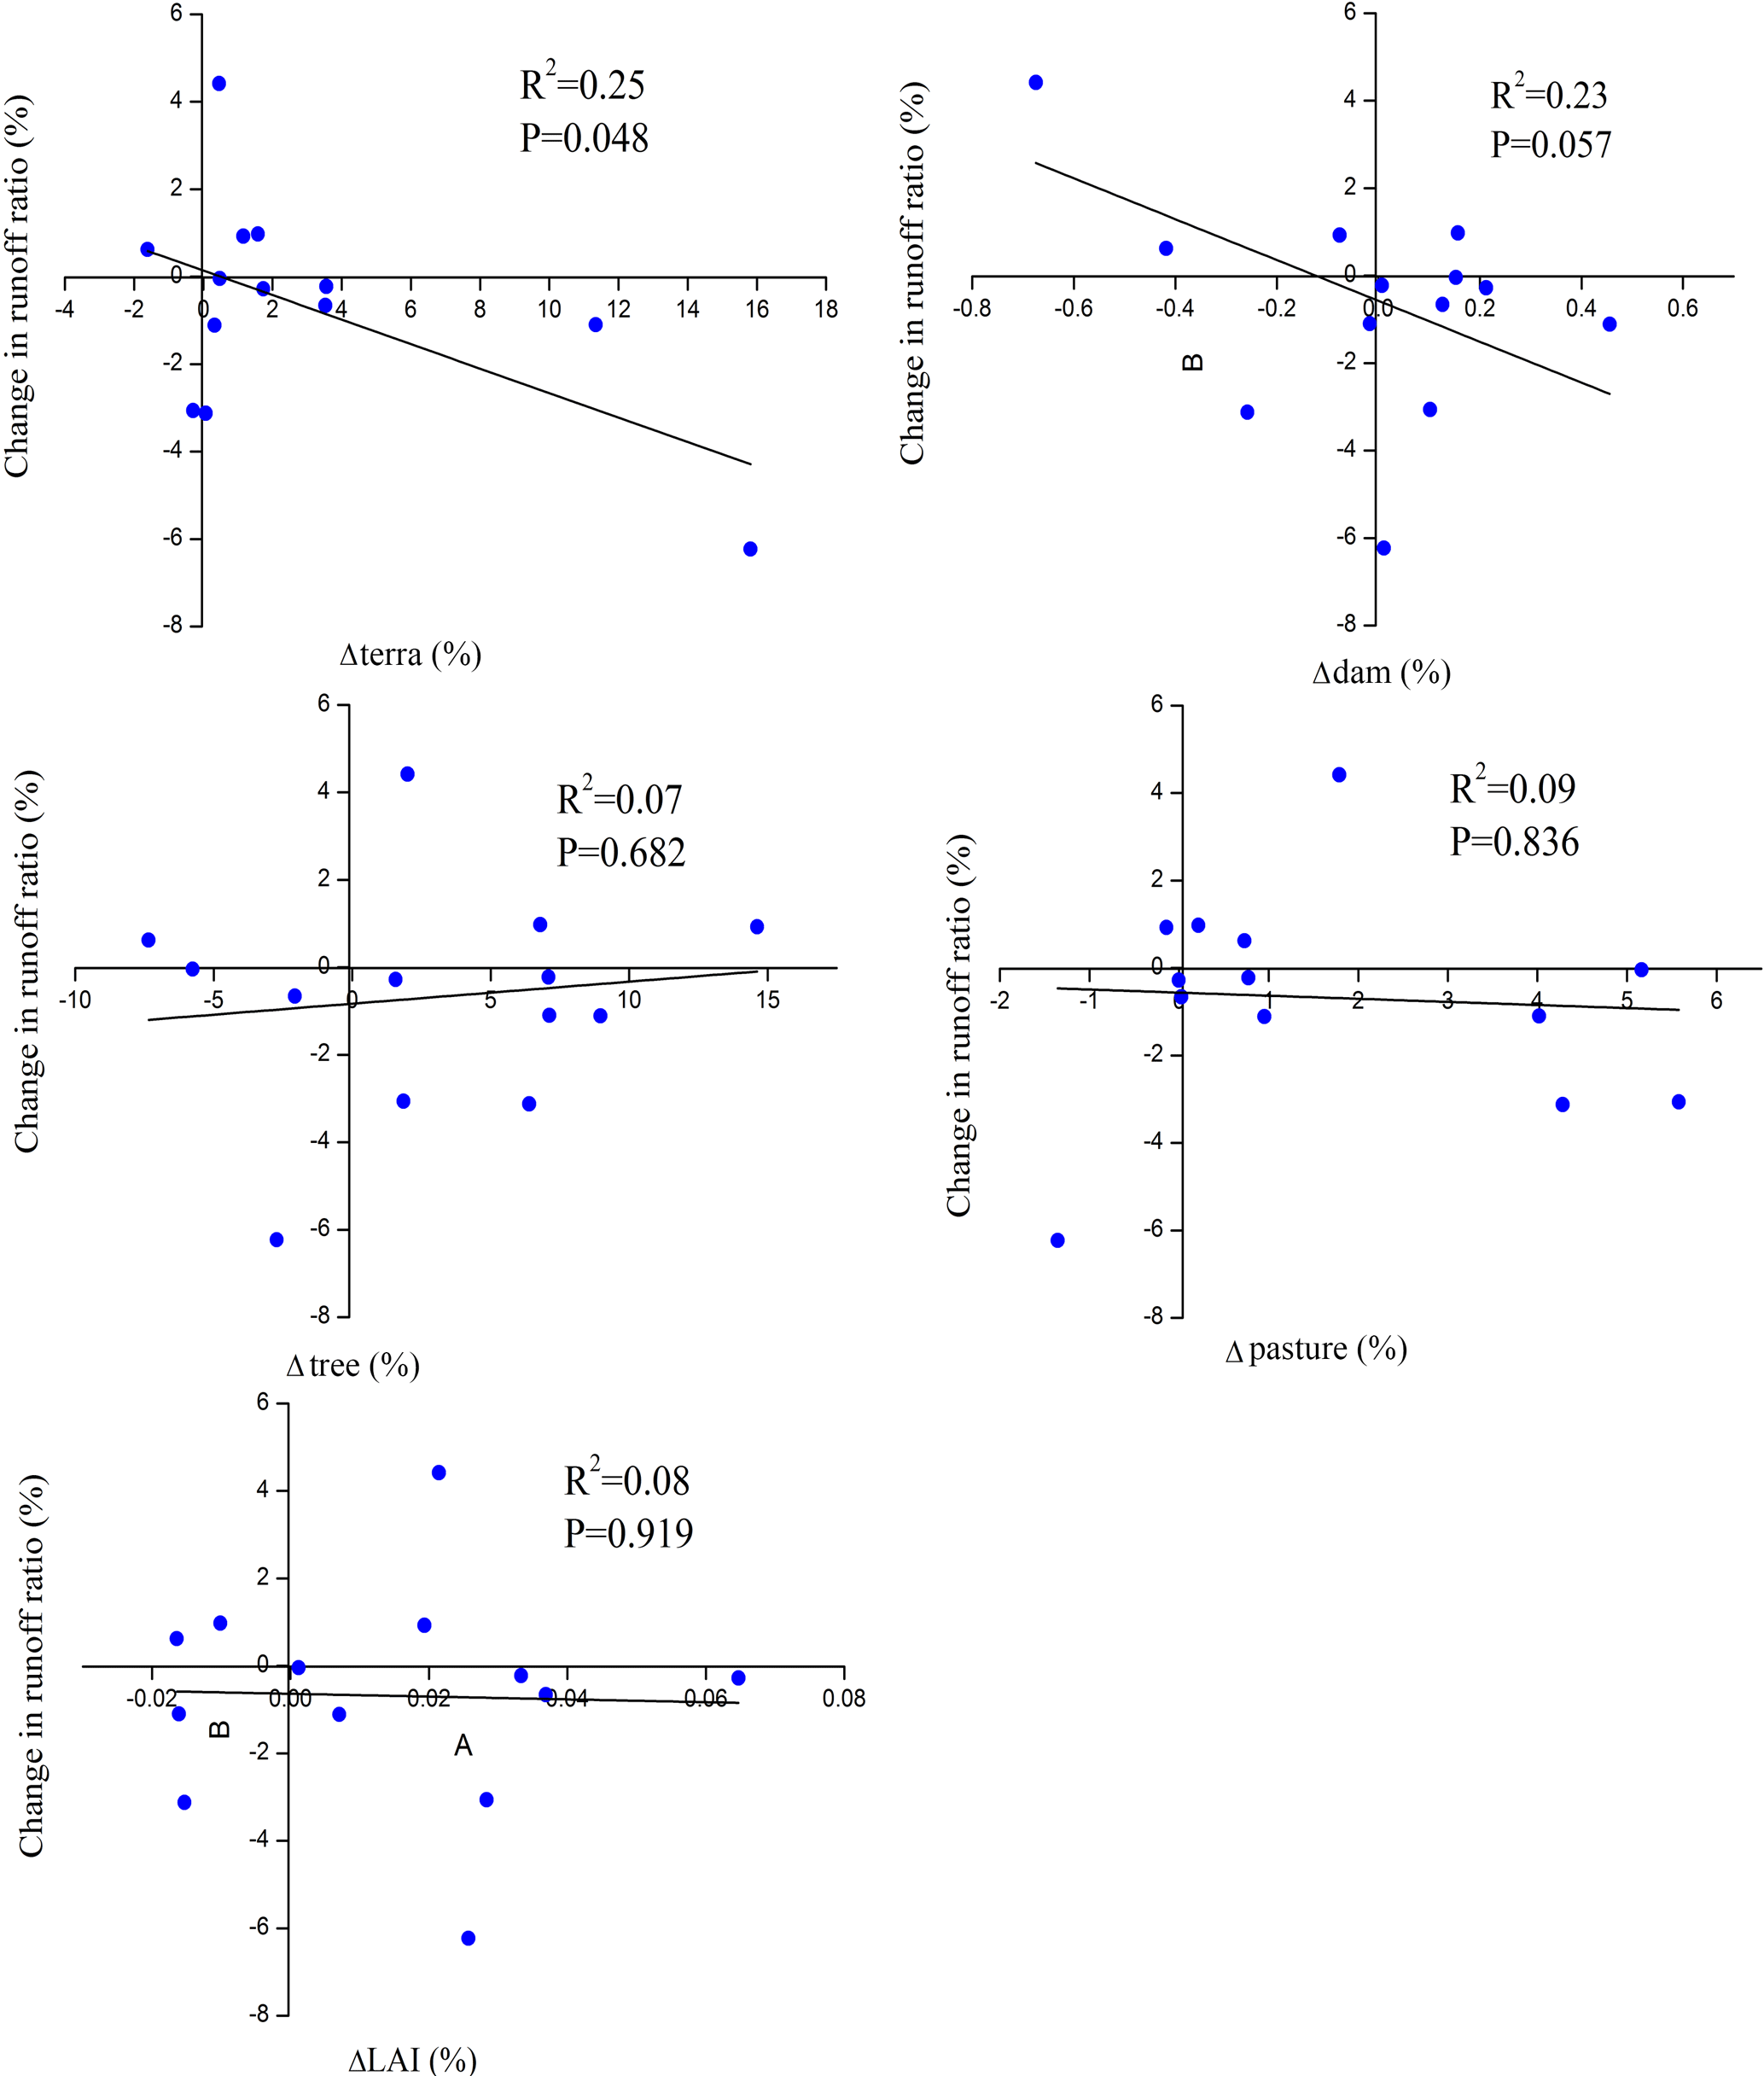
Figure 9Anthropogenic factors of runoff ratio change in the 1980s vs. the 1990s (Terra, Dam, Tree and Pasture are the changes in the percentage area of terraces, check-dams, tree plantation and natural pastures, respectively. LAI is change in the GIMMS LAI for each catchment).
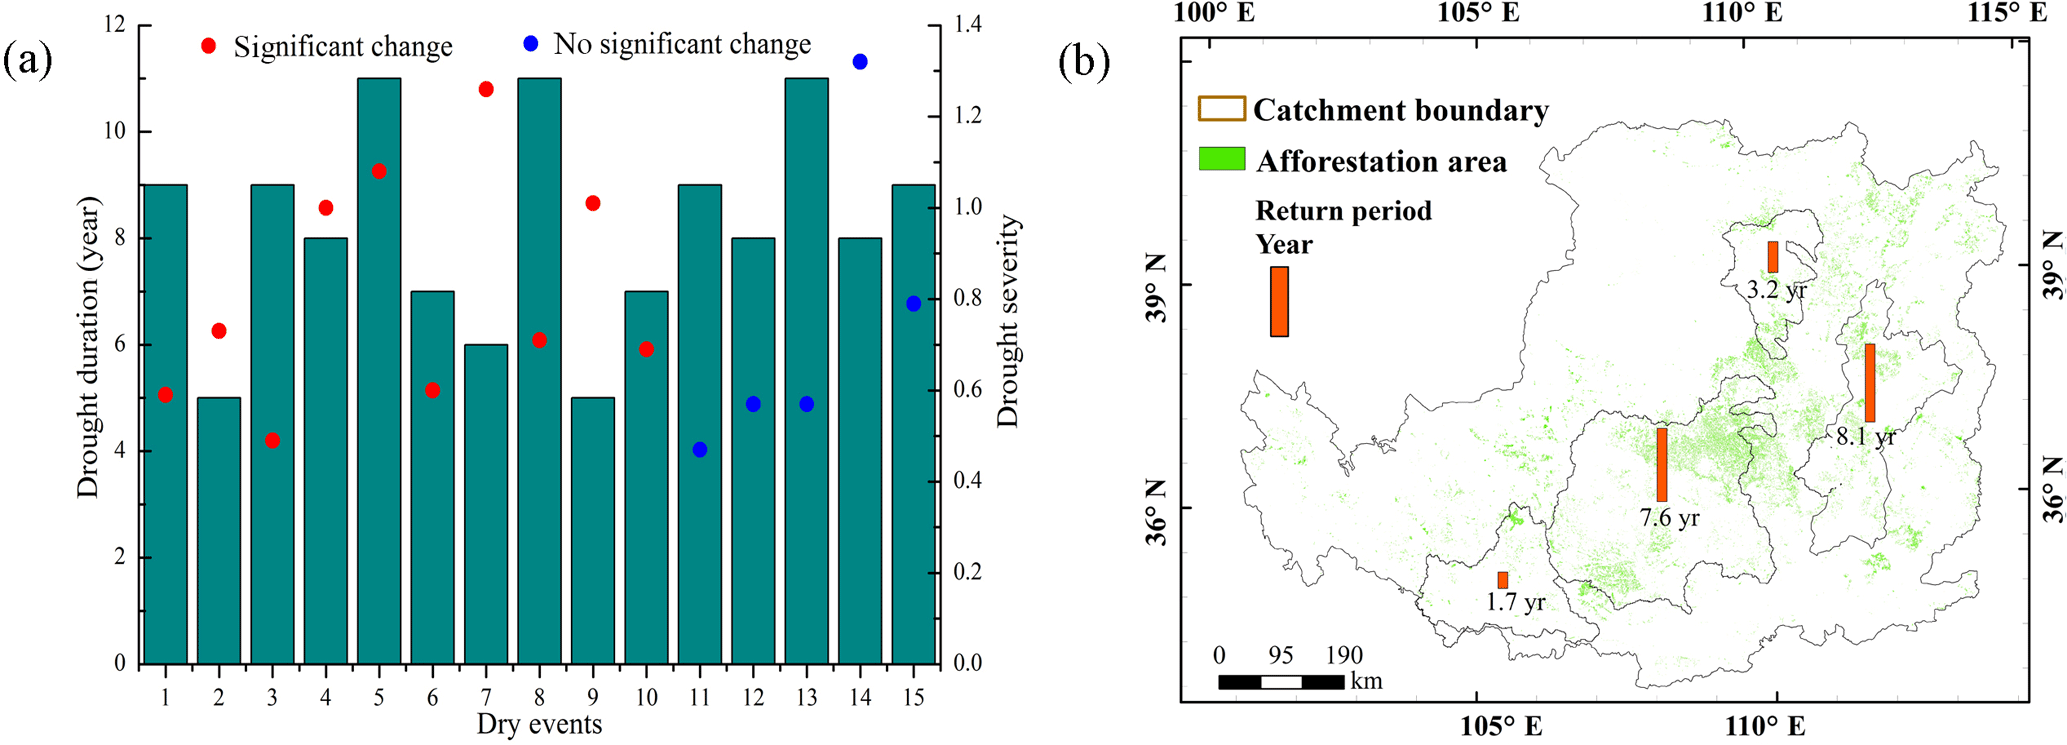
Figure 10 (a) Characteristics of drought events with significant changes and (b) spatial distribution of the joint return period (four regions).
There were no significant changes in the PRR in 5 of the 13 watersheds during the study period. Figure 6 demonstrates that there is no geographical pattern in the spatial distribution of watersheds with and without significant change in the PRR. Compared with the annual average precipitation in separate watersheds during 1961–1999, the watersheds where no significant changes in the PRR occurred (Kuye, Dali, Qingjian, Yanhe and Jinghe) received greater amounts of precipitation. Thus, we conclude that the PRR responds strongly to protracted drought, and the persistence of drought conditions over many years is more likely to cause significant changes in the PRR in basins that receive less precipitation.
3.4 Spatial variability in drought frequency on the Loess Plateau
The return period varies with drought duration and severity. Therefore, the three major dry events that occurred on the Loess Plateau from 1961 to 1999 were selected to enable a study of the characteristics of the spatial distribution of the joint return period. Figure 7a, b and c show that, although the duration and severity of drought differ among these three major drought events, the spatial distribution of the drought return period is consistent. At the same time, the drought return period also differs between watersheds, and the spatially heterogeneous characteristics of the different catchments on the Loess Plateau can also be seen from the drought return period. In terms of spatial distribution, the return periods of drought events are longer in the southern and eastern watersheds of Jinghe, Beiluo, Xinshui and Fenhe, indicating that the frequency of drought events in these watersheds is relatively low. On the other hand, the watersheds to the north and west, such as Huangfu, Kuye, Tuwei and Weihe, display shorter drought return periods. Thus, these regions are more susceptible to drought under the same drought characteristics. We analyze the return periods corresponding to watersheds with significant changes in the relationship between precipitation and runoff. As shown in Fig. 7d, there are obvious differences in the return periods in these watersheds, which experience different drought characteristics. The return period in these watersheds is particularly important in ecosystem management.
4.1 Reliability of the identification of drought events
Since the actual occurrence of drought in a region is complicated, and the practical significance of various drought indicators is different, the choice of drought definition is an important part of studying the process of drought occurrence and development. Prolonged multi-year drought events cause significant damages to both the natural environment and the development of human societies (Belal et al., 2014). To ensure that the dry periods would be sufficiently long and severe, Saft et al. (2015) used only dry periods with drought duration ≥ 7 years and severity 5 %. In this study, the drought duration was limited to not less than 5 years. Linking climate and the change in the PRR to identify drought events on the Loess Plateau from 1961 to 1999 shows that 1962, 1965, 1986–1987 and 1989 are single-year dry periods, whereas 1970–1974, 1979–1983 and 1991–1999 are major dry periods. The years when major dry events occurred in the Yellow River basin from 1961 to 1999 were 1965, 1972, 1980, 1995 and 1997 (Fu et al., 2008; http://www.mwr.gov.cn). For example, a severe drought in northern China in 1997 damaged 1.94 million hectares of crops in the Yellow River basin and resulted in 226 days of zero flow from Henan province to Shandong province. The total length of the river with zero flow was approximately 687 km. Thus, the dry events identified by the method described in this study are consistent with historical data, further illustrating the reasonableness of the method presented here.
4.2 The influence of multi-year drought events on the ecosystem service of water yield
Ecosystem services represent a key concept for policy makers, and the variability of the relationship between precipitation and runoff is vital in the study of the ecosystem service of water yield. The PRR can be influenced by factors other than climate conditions, such as land use, the diversion of surface water, irrigation schemes, groundwater abstraction and the storage of water in catchments (Farley et al., 2005; Brown et al., 2005; Zheng et al., 2009). However, the catchments examined in our study lie in the part of the Loess Plateau with the greatest relief, and the Mu Us Desert is located in the northwest and the Weihe Plain is located in the southeast. The vegetation in the catchments is mostly rain-fed; thus, irrigation schemes can be neglected in the study area (Feng et al., 2016a). The thickness of the loess within the catchments is greater than 100 m (Derbyshire et al., 1998), and the groundwater is minimally impacted by the surface eco-hydrological processes; thus, groundwater recharge and groundwater discharge are not considered in the study area. In addition, Bouwer et al. (2006) concluded that increasing water consumption for irrigation and the degree of runoff variability caused by hydropower is 3 times higher than the variations in runoff under climate change in a densely populated region in the main agricultural irrigation area in India. The water consumed by the local communities on the Loess Plateau is fed to the residential areas, which are mainly located in the flat areas at the outlets of the catchments (the distribution of residential areas is shown in Fig. 1). Moreover, the population shows a tendency to move from the catchment area to the major cities, which are located along the mainstream of the river basin in the Weihe Plain (i.e., Baoji and Xi'an, these cities contain 57.35 % of the population within the study area) because of the accelerated urbanization that has taken place in this area since the 1980s (Hu et al., 2001). Thus, the water consumed by the local communities does not have a major effect on runoff in our study area. Finally, any diversions of surface water and water storage are found in the residential areas at the outlets of these catchments. Therefore, the impacts of these factors are not included in the PRR.
Instead, soil conservation measures, including the construction of terraces and the construction of sediment-trapping dams, have been implemented on the Loess Plateau since the 1950s (Wang et al., 2015), and these anthropogenic factors may change water yields (Wang et al., 2009; Shi et al., 2013; Chang et al., 2015). We used the partial correlation method to isolate the impacts of anthropogenic activities from climatic factors. For the entire period of 1982–1999, the runoff ratio displayed a decreasing trend (Fig. 8). Terrace construction played an important role in the reduction in the runoff ratio from the 1980s to the 1990s (p= 0.048, Fig. 9). The effects of other anthropogenic activities, including dam construction, tree plantations and pasture, did not cause the observed change in the runoff ratio in this period. Terrace construction contributed 25 % of the reduction in the runoff ratio in the 1990s. Thus, drought events are the major factor driving the reduction in runoff in the study area.
The PRR responds to multi-year droughts in two different ways. The PRR either displays no significant change or a significant downward change. Saft et al. (2015) have shown that a significant upward trend in the PRR occurred during a period of drought in watersheds in southeastern Australia, but the probability of such effects is small. It is also not clear whether these observations reflect a real phenomenon or just sampling fluctuations. Analyzing the changes in the PRR during the three major dry periods on the Loess Plateau shows that the annual runoff tends to decrease gradually. Therefore, we believe that the occurrence of dry events will aggravate the reduction of runoff, which could lead to significant changes in the PRR. This study shows that sustained precipitation changes also have the capacity to transform the water balance of watersheds in water-limited areas.
The drought regressions fell under the total regression line 15 times in the 13 watersheds, indicating the occurrence of both significant and non-significant changes during the study period. During drought periods, the runoff decreased as expected when the precipitation decreased, which decreases the runoff ratio and affects the ecosystem service of water yield. Based on the analysis of the duration and severity of the 15 dry events (Fig. 10a), we conclude that the occurrence of a drought event is more likely to result in a significant decreasing trend in the PRR when the drought duration is ≥ 6 years and the drought severity is ≤ 0.55 (i.e., the precipitation ≤ 212 mm). The occurrence of less runoff than expected causes problems for the ecosystem service of water yield. The shift in the PRR induces a contradiction between the expected runoff and the actual amount of water in a watershed if the runoff is not predicted accurately when the PRR changes. This result suggests that we must consider the impacts of prolonged drought events on ecosystems and optimize the modeling techniques used to assess the PRR to cope with the effects of long-term droughts that occur in response to changed climatic conditions.
4.3 Policy implications for ecosystem management
In late 1999, China implemented a massive revegetation program in the name of ecological restoration. This restoration involved returning croplands on steep slopes (> 25∘) to woodlands, shrublands or grasslands. Based on the spatial distribution of drought events on the Loess Plateau, the 13 watersheds are further divided into four regions. The drought return periods in the northern and western regions are lower than those in the central and eastern regions, and we can see the distribution of the effects of the project in the four different regions (Fig. 10b). The different spatial distributions of the return period further reflect regional differences.
Drought events affect ecosystem productivity and reduce the carbon sink capacity of terrestrial ecosystems (Ciais et al., 2005; Tian et al., 1998). As an important ecosystem structural parameter, the leaf area index (LAI) characterizes the physiologically functioning surface area through which energy, mass (e.g., water and CO2) and momentum are exchanged between the vegetated land surface and the planetary boundary layer (Myneni et al., 2002). During 1982–1999, the LAI displays an obvious increasing trend in the 1980s over the Loess Plateau (Fig. 11). To illustrate the impacts of drought on the ecosystems, we choose the major drought period of 1991–1999 and the normal period of 1984–1990. We find that the LAI decreases significantly (p= 0.032, Student's t test) in 1991–1999 compared to that of 1984–1990. Since different vegetation types respond differently to drought events over different timescales, the regional drought return period and vegetation types should be taken into account in future policies, and appropriate policies should be formulated according to the specific regional conditions to control the adverse effects of drought on ecosystem productivity. We must pay more attention to these drought characteristics, which can induce significant changes in the PRR, and the return period (Fig. 7d). This practice will help avoid the waste of capital investment and will effectively improve the implementation of the Grain for Green Program.
The results of this study provide guidance for ecosystem management policy. In addition, the specific measures used in adapting to drought should also be improved. For example, drought-resistant crops, such as millet and maize, should be chosen. Farmers can also increase the soil water storage capacity by reclaiming level terraces and practicing contour strip farming (Panagos et al., 2015) and ridge-furrow cropping (Gan et al., 2013). Vegetation affects the conversion of surface energy, water, momentum and biochemicals through its physical and physiological processes, thus affecting atmospheric conditions (Bonan, 2008) and further changing regional precipitation and hydrological processes (Ellison et al., 2012). During afforestation, managers should select tree species that consume less water, reduce the density of planting, and consider the optimal distribution of woodlands, shrubs and grasslands to cope with the effects of warmer and drier conditions. For example, fish-scale pits (Wang et al., 2014) can be used to enhance the infiltration of atmospheric precipitation and soil moisture. Especially in areas with steep slopes, the use of rainwater harvesting measures, such as fish-scale pits, will boost the survival of trees and avoid drying of the soil.

This article characterizes drought by linking climate anomalies with changes in the PRR. We found that multi-year drought caused the PRR to display a significant decreasing trend (p < 0.05) compared to the historical records. For the Loess Plateau as a whole, the average runoff ratio decreased to 6.8 % of the average annual precipitation in 1991–1999 compared to 10 % of the annual average precipitation in 1961–1990. In 8 of the 13 studied watersheds, significant changes in the PRR occurred during 1961–1999. When we compared the annual average precipitation in separate watersheds and analyzed their drought characteristics, we concluded that this situation is likely to occur when the drought duration is not less than 6 years and the drought severity is equal to or greater than 0.55 (i.e., the annual precipitation is ≤ 212 mm).
Our analysis revealed great spatial variability in drought across the Loess Plateau. We chose the Frank copula function as the optimal joint distribution function of drought duration and severity. The results demonstrated that the joint probability and return period gradually increased with increasing drought duration and severity. At the same time, the spatially heterogeneous characteristics of different watersheds on the Loess Plateau can be seen from the spatial distribution of the drought return period. By analyzing the annual LAI over the Loess Plateau during 1982–1999, we found that the LAI significantly decreases in drought periods compared to normal periods. Long-term drought is also a key factor in considering the influence of LAI trends in the future.
These results should lead to better water regulation and more effective strategies of ecosystem management. We can consider different plant species and the spatial variability in drought events to maximize the function of the ecosystem, based on the stability of the ecosystem structure.
Runoff and meteorological data used in this research paper are available via the Yellow River Conservancy Commission (http://www.yellowriver.gov.cn/, last access: July 2016) (Feng et al., 2016b) and the National Meteorological Administration, respectively. The AVHRR GIMMS LAI3g datasets are available at http://sites.bu.edu/cliveg/ (last access: May 2017) (Zhu et al., 2016).
The authors declare that they have no conflict of interest.
We acknowledge the use of runoff data from the Yellow River Conservancy
Commission (http://www.yellowriver.gov.cn/) and climate data from the
National Meteorological Information Center (NMIC) of the Chinese
Meteorological Administration (CMA; http://cdc.nmic.cn/home.do). The AVHRR
GIMMS LAI3g datasets were generated from AVHRR GIMMS NDVI3g using a model
based on an artificial neural network (http://sites.bu.edu/cliveg/).
This work was funded by the National Natural Science Foundation of China
(nos. 41390464 and 41561134016) and a Key Basic Research Project of the
Ministry of Science and Technology (2016YFC0501603).
Edited by: Stefan Uhlenbrook
Reviewed by: two anonymous referees
Allen, C. D., Macalady, A. K., Chenchouni, H., Bachelet, D., McDowell, N., Vennetier, M., Kitzberger, T., Rigling, A., Breshears, D. D., and Hogg, E. T.: A global overview of drought and heat-induced tree mortality reveals emerging climate change risks for forests, Forest Ecol. Manag., 259, 660–684, 2010.
Belal, A.-A., El-Ramady, H. R., Mohamed, E. S., and Saleh, A. M.: Drought risk assessment using remote sensing and GIS techniques, Arab. J. Geosci., 7, 35–53, 2014.
Berg, D.: Copula goodness-of-fit testing: an overview and power comparison, Eur. J. Financ., 15, 675–701, 2009.
Bhalme, H. N. and Mooley, D. A.: Large-Scale Droughts/Floods and Monsoon Circulation, Mon. Weather Rev., 108, 1197–1211, 1980.
Bonan, G. B.: Forests and Climate Change: Forcings, Feedbacks, and the Climate Benefits of Forests, Science, 320, 1444–1449, 2008.
Bouwer, L. M., Aerts, J. C. J. H., Droogers, P., and Dolman, A. J.: Detecting the long-term impacts from climate variability and increasing water consumption on runoff in the Krishna river basin (India), Hydrol. Earth Syst. Sci., 10, 703–713, https://doi.org/10.5194/hess-10-703-2006, 2006.
Box, G. E. and Cox, D. R.: An analysis of transformations, J. Roy. Stat. Soc. B, 26, 211–252, 1964.
Boyer, J. S.: Plant productivity and environment, Science, 218, 443–448, 1982.
Brown, A. E., Zhang, L., McMahon, T. A., Western, A. W., and Vertessy, R. A.: A review of paired catchment studies for determining changes in water yield resulting from alterations in vegetation, J. Hydrol., 310, 28–61, 2005.
Burkhard, B., Kandziora, M., Hou, Y., and Müller, F.: Ecosystem service potentials, flows and demands-concepts for spatial localisation, indication and quantification, Landscape Online, 34, 1–32, 2014.
Chang, J., Wang, Y., Istanbulluoglu, E., Bai, T., Huang, Q., Yang, D., and Huang, S.: Impact of climate change and human activities on runoff in the Weihe River Basin, China, Quatern. Int., 380, 169–179, 2015.
Charlier, J.-B., Ladouche, B., and Maréchal, J.-C.: Identifying the impact of climate and anthropic pressures on karst aquifers using wavelet analysis, J. Hydrol., 523, 610–623, 2015.
Ciais, P., Reichstein, M., Viovy, N., Granier, A., Ogée, J., Allard, V., Aubinet, M., Buchmann, N., Bernhofer, C., and Carrara, A.: Europe-wide reduction in primary productivity caused by the heat and drought in 2003, Nature, 437, 529–533, 2005.
Dai, A.: Drought under global warming: a review, Wiley Interdisciplinary Reviews, Climate Change, 2, 45–65, 2011.
Derbyshire, E., Meng, X., and Kemp, R. A.: Provenance, transport and characteristics of modern aeolian dust in western Gansu Province, China, and interpretation of the Quaternary loess record, J. Arid Environ., 39, 497–516, 1998.
Duff, G. A., Myers, B. A., Williams, R. J., Eamus, D., O'Grady, A., and Fordyce, I. R.: Seasonal Patterns in Soil Moisture, Vapour Pressure Deficit, Tree Canopy Cover and Pre-dawn Water Potential in a Northern Australian Savanna, Aust. J. Bot., 45, 211–224, 1997.
Ellison, D., Futter, M. N., and Bishop, K.: On the forest cover–water yield debate: from demand- to supply-side thinking, Glob. Change Biol., 18, 806–820, 2012.
Farley, K. A., Jobbágy, E. G., and Jackson, R. B.: Effects of afforestation on water yield: a global synthesis with implications for policy, Glob. Change Biol., 11, 1565–1576, 2005.
Feng, X., Fu, B., Piao, S., Wang, S., Ciais, P., Zeng, Z., Lü, Y., Zeng, Y., Li, Y., and Jiang, X.: Revegetation in China [rsquor] s Loess Plateau is approaching sustainable water resource limits, Nat. Clim. Change, 6, 1019–1022, 2016a.
Feng, X., Wei, C., Fu, B., and Lü, Y.: The role of climatic and anthropogenic stresses on long-term runoff reduction from the Loess Plateau, China, Sci. Total Environ., 571, 688–698, https://doi.org/10.1016/j.scitotenv.2016.07.038, 2016b.
Fu, C., Jiang, Z., Guan, Z., He, J., and Xu, Z.: Climate Extremes and Related Disasters in China, Springer Berlin Heidelberg, 2008.
Gan, Y., Siddique, K. H., Turner, N. C., Li, X.-G., Niu, J.-Y., Yang, C., Liu, L., and Chai, Q.: Ridge-furrow mulching systems—an innovative technique for boosting crop productivity in semiarid rain-fed environments, Adv. Agron., 118, 429–476, 2013.
Ghulam, A., Qin, Q., Teyip, T., and Li, Z. L.: Modified perpendicular drought index (MPDI): a real-time drought monitoring method, ISPRS J. Photogramm., 62, 150–164, 2007.
Goddard, S., Harms, S. K., Reichenbach, S. E., Tadesse, T., and Waltman, W. J.: Geospatial Decision Support for Drought Risk Management, Commun. ACM, 46, 35–37, 2001.
Guo, A., Chang, J., Liu, D., Wang, Y., Huang, Q., and Li, Y.: Variations in the precipitation–runoff relationship of the Weihe River Basin, Hydrol. Res., 48, 295–310, 2016.
Hao, Z. and Singh, V. P.: Drought characterization from a multivariate perspective: A review, J. Hydrol., 527, 668–678, 2015.
Hayes, M., Svoboda, M., Wardlow, B., Anderson, M., and Kogan, F.: Drought monitoring: Historical and current perspectives, Remote sensing of drought, 94, 1–19, 2012.
Herbst, P. H., Bredenkamp, D. B., and Barker, H. M. G.: A technique for the evaluation of drought from rainfall data, J. Hydrol., 4, 264–272, 1966.
Hu, S., Zhi-Mao, G., and Jun-Ping, Y.: The impacts of urbanization on soil erosion in the Loess Plateau region, J. Geogr. Sci., 11, 282–290, 2001.
Lü, Y., Zhang, L., Feng, X., Zeng, Y., Fu, B., Yao, X., Li, J., and Wu, B.: Recent ecological transitions in China: greening, browning, and influential factors, Sci. Rep.-UK, 5, 1–8, 2014.
Lee, T., Modarres, R., and Ouarda, T. B.: Data-based analysis of bivariate copula tail dependence for drought duration and severity, Hydrol. Process., 27, 1454–1463, 2013.
Massey, F. J.: The Kolmogorov-Smirnov Test for Goodness of Fit, J. Am. Stat. Assoc., 46, 68–78, 1951.
McKee, T. B., Doesken, N. J., and Kleist, J.: The Relationship of Drought Frequency and Duration to Time Scales, Proceeding of the 8th Conference on Applied Climatology, 17, 179–183, 1993.
Michele, C., Salvadori, G., Vezzoli, R., and Pecora, S.: Multivariate assessment of droughts: Frequency analysis and dynamic return period, Water Resour. Res., 49, 6985–6994, 2013.
Mirabbasi, R., Fakheri-Fard, A., and Dinpashoh, Y.: Bivariate drought frequency analysis using the copula method, Theor. Appl. Climatol., 108, 191–206, 2012.
Mishra, A. K. and Singh, V. P.: A review of drought concepts, J. Hydrol., 391, 202–216, 2010.
Mohan, S. and Rangacharya, N. C. V.: A modified method for drought identification, Hydrolog. Sci. J., 36, 11–21, 1991.
Moron, V.: Guinean and sahelian rainfall anomaly indices at annual and monthly scales (1933–1990), Int. J. Climatol., 14, 325–341, 1994.
Myneni, R. B., Hoffman, S., Knyazikhin, Y., Privette, J., Glassy, J., Tian, Y., Wang, Y., Song, X., Zhang, Y., and Smith, G.: Global products of vegetation leaf area and fraction absorbed PAR from year one of MODIS data, Remote Sens. Environ., 83, 214-231, 2002.
Naresh Kumar, M., Murthy, C. S., Sesha Sai, M. V. R., and Roy, P. S.: On the use of Standardized Precipitation Index (SPI) for drought intensity assessment, Meteorol. Appl., 16, 381–389, 2009.
Nourani, V., Khanghah, T., and Baghanam, A.: Application of Entropy Concept for Input Selection of Wavelet-ANN Based Rainfall-Runoff Modeling, J. Environ. Inform., 26, 52–70, 2015.
Palmer, W.: Meteorological drought, U.s.department of Commerce Weather Bureau Research Paper, Department of Commerce Weather Bureau Research Paper 45, 58 pp., 1965.
Panagos, P., Borrelli, P., Meusburger, K., van der Zanden, E. H., Poesen, J., and Alewell, C.: Modelling the effect of support practices (P-factor) on the reduction of soil erosion by water at European scale, Environ. Sci. Policy, 51, 23–34, 2015.
Petrone, K. C., Hughes, J. D., Van Niel, T. G., and Silberstein, R. P.: Streamflow decline in southwestern Australia, 1950–2008, Geophys. Res. Lett., 37, L11401, https://doi.org/10.1029/2010GL043102, 2010.
Raziei, T., Saghafian, B., Paulo, A. A., Pereira, L. S., and Bordi, I.: Spatial patterns and temporal variability of drought in Western Iran, Water Resour. Manag., 23, 439–455, 2009.
Saft, M., Western, A. W., Zhang, L., Peel, M. C., and Potter, N. J.: The influence of multiyear drought on the annual rainfall-runoff relationship: An Australian perspective, Water Resour. Res., 51, 2444–2463, 2015.
Savenije, H. H.: The runoff coefficient as the key to moisture recycling, J. Hydrol., 176, 219–225, 1996.
Sheffield, J., Goteti, G., Wen, F., and Wood, E. F.: A simulated soil moisture based drought analysis for the United States, J. Geophys. Res.-Atmos., 109, D24108, https://doi.org/10.1029/2004JD005182, 2004.
Shi, C., Zhou, Y., Fan, X., and Shao, W.: A study on the annual runoff change and its relationship with water and soil conservation practices and climate change in the middle Yellow River basin, Catena, 100, 31–41, 2013.
Shiau, J. T.: Fitting Drought Duration and Severity with Two-Dimensional Copulas, Water Resour. Manag., 20, 795–815, 2006.
Steinemann, A. C. and Cavalcanti, L. F.: Developing multiple indicators and triggers for drought plans, J. Water Res. Plan. Man., 132, 164–174, 2006.
Sun, S., Barraud, S., Branger, F., Braud, I., and Castebrunet, H.: Urban hydrologic trend analysis based on rainfall and runoff data analysis and conceptual model calibration, Hydrol. Process., 31, 1349–1359, 2016.
Tian, H., Melillo, J. M., Kicklighter, D. W., Mcguire, A. D., Helfrich, J. V. K., Moore, B., and Vörösmarty, C. J.: Effect of interannual climate variability on carbon storage in Amazonian ecosystems, Nature, 396, 664–667, 1998.
Wang, S., Fu, B., Piao, S., Lü, Y., Ciais, P., Feng, X., and Wang, Y.: Reduced sediment transport in the Yellow River due to anthropogenic changes, Nat. Geosci., 9, 38–41, 2015.
Wang, X.-J., Cai, H.-J., Zhang, X., Wang, J., and Zhai, J.: Analysis of changing characteristics and tendency of runoff and sediment transport in Huangfuchuan River watershed, Res. Soil Water Conserv., 16, 222–226, 2009.
Wang, Z.-J., Jiao, J.-Y., Su, Y., and Chen, Y.: The efficiency of large-scale afforestation with fish-scale pits for revegetation and soil erosion control in the steppe zone on the hill-gully Loess Plateau, Catena, 115, 159–167, 2014.
Wilhite, D. A.: Drought as a natural hazard: Concepts and definitions, Drought A Global Assessment, 1, 3–18, 2000.
Xia, Y., Ek, M. B., Peters-Lidard, C. D., Mocko, D., Svoboda, M., Sheffield, J., and Wood, E. F.: Application of USDM statistics in NLDAS-2: Optimal blended NLDAS drought index over the continental United States, J. Geophys. Res.-Atmos., 119, 2947–2965, 2014.
Yan, H., Wang, S. Q., Wang, J. B., Lu, H. Q., Guo, A. H., Zhu, Z. C., Myneni, R. B., and Shugart, H. H.: Assessing spatiotemporal variation of drought in China and its impact on agriculture during 1982–2011 by using PDSI indices and agriculture drought survey data, J. Geophys. Res.-Atmos., 121, 2283–2298, 2016.
Zhang, X., Zhang, L., Zhao, J., Rustomji, P., and Hairsine, P.: Responses of streamflow to changes in climate and land use/cover in the Loess Plateau, China, Water Resour. Res., 44, W00A07, https://doi.org/10.1029/2007WR006711, 2008.
Zheng, H., Li, Y., Robinson, B. E., Liu, G., Ma, D., Wang, F., Lu, F., Ouyang, Z., and Daily, G. C.: Using ecosystem service trade-offs to inform water conservation policies and management practices, Front. Ecol. Environ., 14, 527–532, 2016.
Zheng, H. X., Zhang, L., Zhu, R. R., Liu, C. M., Sato, Y., and Fukushima, Y.: Responses of streamflow to climate and land surface change in the headwaters of the Yellow River Basin, Water Resour. Res., 45, 641–648, 2009.
Zhu, Z., Piao, S., Myneni, R. B., Huang, M., Zeng, Z., Canadell, J. G., Ciais, P., Sitch, S., Friedlingstein, P., Arneth, A., Cao, C., Cheng, L., Kato, E., Koven, C., Li, Y., Lian, X., Liu, Y., Liu, R., Mao, J., Pan, Y., Peng, S., Peñuelas, J., Poulter, B., Pugh, T. A. M., Stocker, B. D., Viovy, N., Wang, X., Wang, Y., Xiao, Z., Yang, H., Zaehle, S., and Zeng, N.: Greening of the Earth and its drivers, Nature Climate Change, 6, 791–795, https://doi.org/10.1038/nclimate3004, 2016.