
the Creative Commons Attribution 4.0 License.
the Creative Commons Attribution 4.0 License.
 | 11 Nov 2026
Extreme glacier melt on the Central Tibetan Plateau during the summer of 2022: detection and mechanisms

Extreme glacier melt events accelerate mass loss, increase glacier instability, and temporarily increase downstream runoff, potentially alleviating drought conditions. Yet the glacier energy–mass balance in the Geladandong region – a headwater region of the Yangtze River (China's longest river) and one of the source regions feeding Siling Co (Tibet's largest lake) – and its connection to the unprecedented 2022 summer melt remain insufficiently quantified. To address this gap, we integrated in-situ mass balance observations and glacio-meteorological data from a 5700 m monitoring site with an energy-mass balance model and applied a novel dual-threshold framework (based on mean and standard deviation) to identify extreme mass loss/melt events in short-term glacier mass balance records. Our novel methodology identified 2021/22 as a period of extreme mass loss and melt intensity, with melt during the 2022 summer heatwave reaching unprecedented extremes. These heatwaves caused an increase in melt amount of 317.8 mm w.e., amounting to 1.66 and 1.69 times the values recorded for the same period in 2019/20 and 2020/21, respectively. This extreme melt was driven by energy balance anomalies over the glacier surface. In terms of net contributions to the +28.2 W m−2 melt energy anomaly during the three identified heatwave windows, enhanced sensible heat flux was the largest term (+17.0 W m−2; 60.3 %), followed by increased net longwave radiation (+14.0 W m−2; 49.7 %) and increased net shortwave radiation (+5.1 W m−2; 18.1 %) associated with reduced albedo, with negative contributions from latent heat flux and subsurface heat flux. Such anomalies were driven by large-scale atmospheric circulation patterns, specifically the eastward extension and northward displacement of the South Asian High (SAH), together with near-neutral mid-latitude westerlies. This study advances the understanding of glacier mass balance responses to extreme weather and climate events on the central Tibetan Plateau.
- Article
(7860 KB) - Full-text XML
-
Supplement
(1211 KB) - BibTeX
- EndNote


Extreme glacier melt events directly reflect glacier mass balance responses to extreme weather and climate events, such as heatwaves and droughts (Zhu et al., 2024; Xu et al., 2024; Zhu et al., 2026b; van Tiel et al., 2026). Across the Tibetan Plateau (TP) and surrounding regions, evidence from Xiao Dongkemadi Glacier, which holds the longest mass balance record in the central TP with observations since 1989, indicates that extreme mass loss events have been concentrated in 2000–2022, compared to 1989–2000 (Yao et al., 2012; Zhu et al., 2026a). In recent decades, scientific focus has increased on understanding spatiotemporal patterns and driving mechanisms of glacier retreat and thinning across TP (Bolch et al., 2012; Yao et al., 2012; Brun et al., 2017; Bhattacharya et al., 2021; Hugonnet et al., 2021). Studies have systematically revealed how atmospheric circulation patterns and dominant climate variables govern spatiotemporal variations in glacier mass balance across TP. Large-scale atmospheric anomalies generate distinct regional disparities in air temperature-precipitation regimes, potentially explaining the observed spatial heterogeneities in glacier mass balance (Yao et al., 2012, 2022). Meteorological controls exhibit strong regional differences: annual precipitation dominates mass balance variability in northwestern TP glaciers, whereas ablation-season air temperatures primarily regulate mass balance in southeastern regions (Zhu et al., 2018). Monsoon-driven cloud cover significantly influences summer surface energy budgets, as evidenced by detailed observations at East Rongbuk Glacier on the northern slopes of Mount Everest (Liu et al., 2021). These findings collectively demonstrate pronounced spatial heterogeneity in the sensitivity of TP glaciers to climate forcing. However, understanding the mechanisms underlying extreme mass loss events across TP and adjacent regions remains inadequate.
Emerging evidence identifies compound heat-drought events as primary drivers of extreme glacier mass loss. Regional case studies across cryosphere hotspots – including the eastern Tien Shan (Xu et al., 2024), Qilian Mountains (Chen et al., 2024), and Tanggula and Nyainqêntanglha ranges (Zhu et al., 2024) – reveal unprecedented mass loss rates associated with atmospheric teleconnections and glacier surface energy budget anomalies. These events typically result from synergistic interactions between external forcing (heat extremes/precipitation deficits) and intrinsic glacier responses (albedo feedback/turbulent heat flux anomalies). When superimposed, these drivers can push glacier systems beyond equilibrium thresholds within weeks, producing nonlinear mass losses that challenge conventional model predictions. However, comprehensive event attribution remains challenging across most of TP.
This knowledge gap stems from two critical limitations: (1) methodological constraints in detecting extremes from short mass balance records (under ten years), and (2) sparse in situ monitoring networks – fewer than ten TP glaciers have decadal-scale measurements. Traditional extreme detection methods (e.g., 10th percentile thresholds, generalized extreme value distributions) require multi-decadal data unavailable for over 90 % of TP glaciers. Consequently, developing and testing frameworks, such as the dual-threshold approach proposed in this study, for identifying extremes from short-term observations (under ten years) are essential for advancing glacier research in this region.
The exceptional 2022 heatwave, characterized by unprecedented air temperature anomalies and precipitation deficits, served as an ideal natural experiment to address these challenges. Researchers have systematically analyzed the temporal characteristics (frequency/duration), intensity metrics, and hydrological impacts of the 2022 heatwave-drought events in both the Yangtze River Basin (Hua et al., 2023; Jeong et al., 2023) and TP (Yan et al., 2024; Zhou et al., 2024). Hua et al. (2023) demonstrated that a 6.45 °C temperature anomaly, observed in central China over the 21 d period from 6 to 26 August 2022, broke historical records and established a new threshold for defining future record-breaking daily maximum temperatures in the region. During summer 2022, central-eastern TP recorded mean maximum air temperatures 3.5 °C above the 1961–2013 baseline (Zhou et al., 2024). Concurrently, central-eastern TP precipitation was 2.4σ below the 1961–2013 mean (Zhou et al., 2024), while southern China experienced rainfall deficits of 2–3 mm d−1 (Jeong et al., 2023). Multiple drivers have been identified, including synoptic-scale circulation anomalies (Hua et al., 2023; Duan et al., 2024), Indian Ocean Dipole–La Niña interactions (Jeong et al., 2023), land-atmosphere feedback (Gui et al., 2024), and localized energy budget perturbations (Tian et al., 2023; Zhang et al., 2023). These studies collectively reveal that both TP and eastern China faced unprecedented extreme heat and precipitation deficits during summer 2022. More broadly, this event occurred against a background of significant heatwave intensification across High Mountain Asia since the early 2000s (Zhao et al., 2026).
The key glaciated complexes most exposed to this extreme event are located in the Central Tanggula Mountains, a critical cryospheric zone in the central TP that encompasses the Geladandong and Dongkemadi regions and the Puruogangri Ice Cap. These glaciers provide a unique opportunity to develop novel methodologies for identifying extreme mass loss events and elucidating their driving mechanisms. Continuous mass balance monitoring began in 1989 at Xiao Dongkemadi Glacier in the Dongkemadi region (Pu et al., 2008). Since entering a negative mass balance regime around 1995, Xiao Dongkemadi Glacier has experienced accelerated mass loss at since 2000 (Kang et al., 2015; Zhu et al., 2026a). Research demonstrates that summer mass balance controls annual mass balance variations in summer-accumulation-type glaciers in the Dongkemadi region (Liang et al., 2018). The Geladandong region recorded glacier mass loss rates of from the 1960s to 2015/18 (King et al., 2023).
Sangqu Glacier, located south of Geladandong, was selected for in situ glacio-meteorological observations. Meltwater from Sangqu Glacier drains into Siling Co, the largest lake in Tibet. Therefore, investigating extreme melt events in this region will improve the understanding of glacier change patterns. Hence, this study aims to (i) investigate the energy-mass balance characteristics of Sangqu Glacier; (ii) develop a novel framework for detecting extreme mass loss events in short-term glacier mass balance records; and (iii) elucidate melting mechanisms driven by the unprecedented 2022 summer heatwaves. By integrating multi-source observational data with an energy-mass balance model, this work advances understanding of glacier responses to extreme heatwaves and proposes an innovative statistical dual-threshold framework as a methodological advancement for addressing critical gaps in TP cryosphere research.
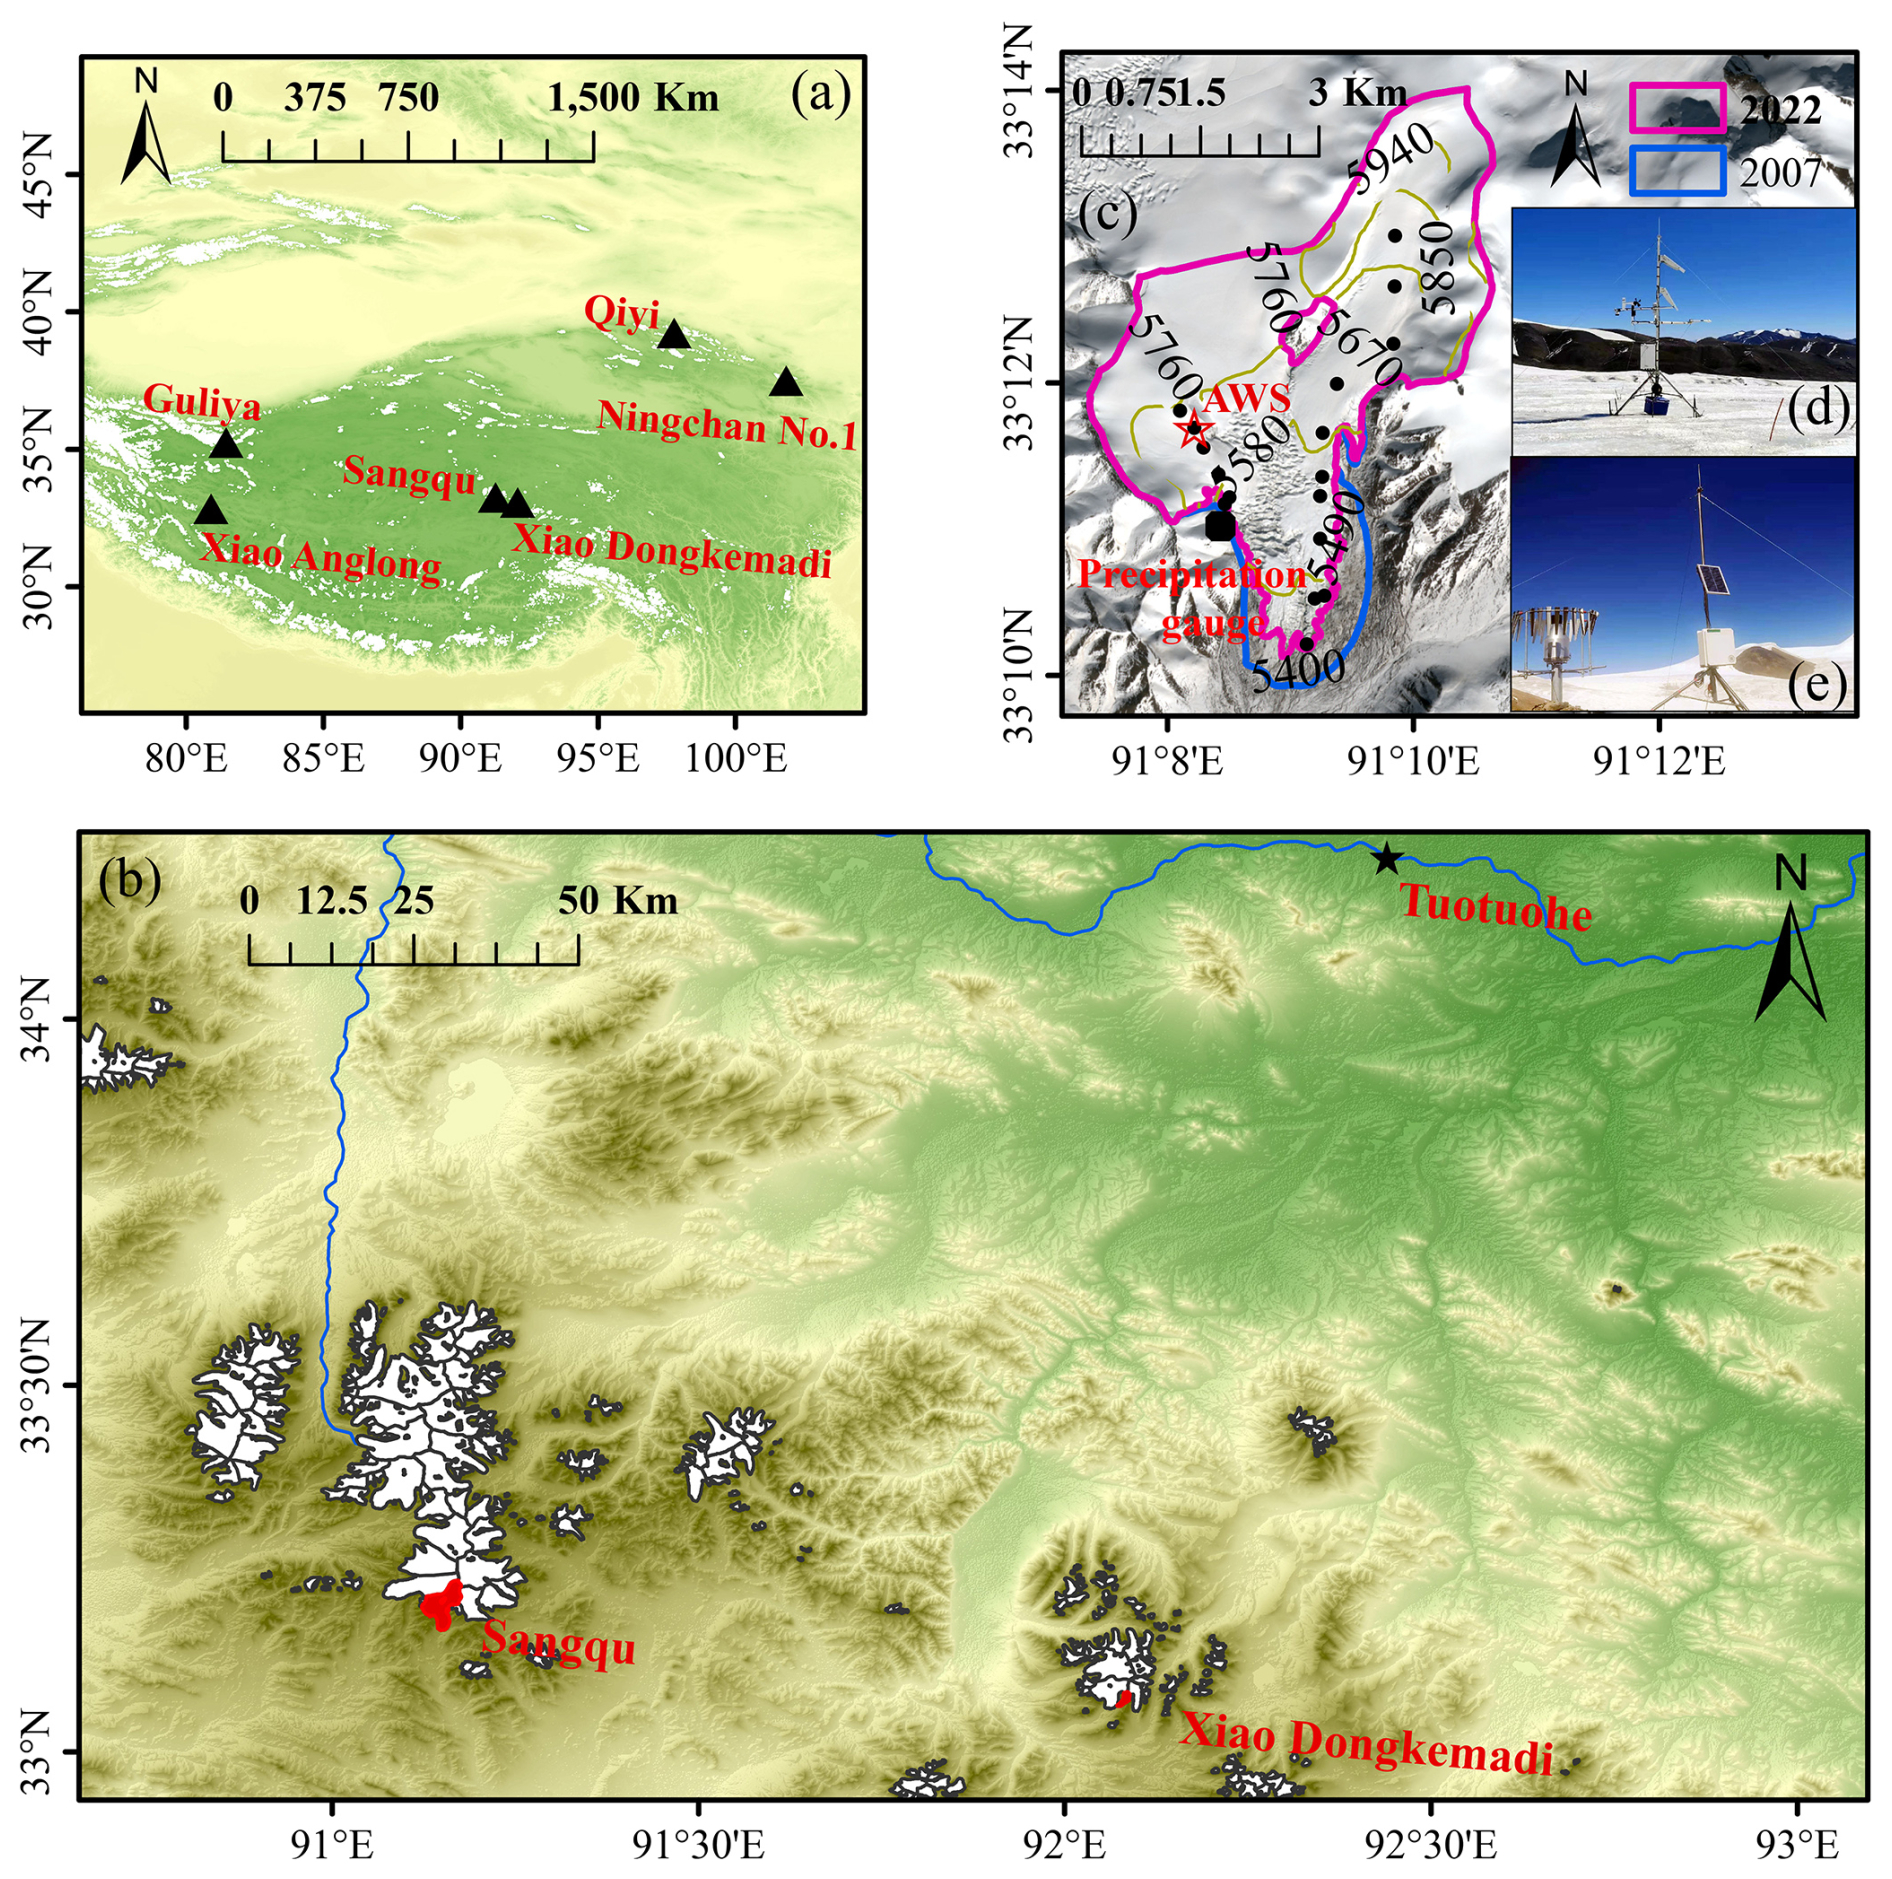
Figure 1Overview of the study area. (a, b) Geographical location of the glacier on the TP: (a) regional context; (b) enlarged local map. (c) Sentinel-2 image (5 December 2022) with contour lines showing the topography of Sangqu Glacier. (d, e) Photographs of the AWS and the precipitation gauge on Sangqu Glacier (Photo credit: Fei Zhu). The positions of the AWS, precipitation gauge, and stakes are indicated in panel (c).
The valley-type continental Sangqu Glacier in Geladandong was selected as the study site (Fig. 1). This south-facing glacier spans an elevation range of 5400–6104 m a.s.l. The Second Chinese Glacier Inventory, primarily based on imagery acquired between 2006 and 2010, recorded an area of 18.04 km2 for Sangqu Glacier; the corresponding outline was derived from an image acquired on 5 May 2007 (Guo et al., 2015). By 2020, the glacier area had decreased to 16.4 km2 (Ke et al., 2026). Based on our delineation from a Sentinel-2 image acquired on 3 June 2022, the area further decreased to 16.34 km2. Situated in central TP, the region experiences low air temperatures and a semi-arid continental climate. Over 70 % of annual precipitation occurs during June–September, coinciding with the warmest season (Zhu et al., 2024). Glacier ablation and accumulation in Geladandong primarily occur from June to September, characterized by a short melt season (Pu et al., 2008). Multi-temporal digital elevation model differencing and in situ stake measurements reveal continuous mass loss in this region since the 1990s (Yao et al., 2012; King et al., 2023). Based on the combined in situ and ERA5-corrected precipitation data, the mean annual precipitation at the Sangqu Glacier site was 510.5 mm for the period October 2019–September 2022. A fused product combining glaciological in-situ measurements with geodetic mass balance observations (Dussaillant et al., 2025) suggests a long-term mass loss rate of approximately 515 for Sangqu Glacier over the period 1957–2024, though such large-scale fusion products come with considerable uncertainties at the individual glacier scale. Based on the observed ice temperatures and the presence of meltwater percolation and refreezing in the ablation zone, Sangqu Glacier is polythermal, with cold ice in the upper accumulation zone and temperate ice in the ablation zone. This thermal regime is consistent with observations on neighboring glaciers on the central TP, such as Xiao Dongkemadi Glacier (Fig. 1b), where superimposed ice formation plays a significant role in the mass balance (Fujita et al., 1996). Moreover, Sangqu Glacier lies at the northern limit of Indian monsoon influence (Tian et al., 2001; Yao et al., 2013).
3.1 Meteorological Data on Glacier Surface
An automatic weather station (AWS) was installed on Sangqu Glacier at 5700 m a.s.l. in October 2020 (Fig. 1c and 1d). Hourly measurements included air temperature, relative humidity, wind speed, incoming/outgoing shortwave radiation, and incoming/outgoing longwave radiation. Air temperature and relative humidity probes, along with wind speed, were mounted 2 m above the glacier surface. Radiation sensors were installed more than 1.6 m above the surface. Data from July 2021 were incomplete due to power failure; operations resumed on 13 July 2021. A Geonor T-200B precipitation gauge, equipped with a double-alter shield to minimize wind-induced undercatch, was installed on adjacent bedrock (5665 m a.s.l.) to record precipitation at 30 min intervals (Fig. 1e). Meteorological data cover the period October 2020 to July 2022. As the observational data only cover the period up to July 2022, the meteorological forcing for August–September 2022 was reconstructed using ERA5 reanalysis data (see Sect. 4.1).
3.2 Glacier Mass Balance Data
Glacier mass balance measurements began in October 2019 using stake and snow-pit methods. Stakes were distributed between 5400 and 5750 m a.s.l. (Fig. 1c). Stake heights and snow-pit characteristics were measured in October 2019, October 2020, October 2021, and July 2022. Using these measurements and assumed densities (snow: 300 kg m−3; ice: 900 kg m−3), mass balance data were derived for three periods: October 2019–October 2020, October 2020–October 2021, and October 2021–July 2022. Taking the 2019/20 mass balance year as an example, sensitivity tests indicate that when snow density is changed from the baseline value of 300 kg m−3 to 100, 200, and 400 kg m−3 respectively, the point mass balance variations at different elevations range from −35 to 70 mm w.e. (Fig. S8 in the Supplement). Point and mass balances were calculated following Yao et al. (2012), and glacier-wide mass balances were obtained by integrating these point measurements over the glacier area using an elevation-based interpolation method.
3.3 Other Data
Hourly ERA5 reanalysis data (Hoffmann et al., 2019), including air temperature, precipitation, relative humidity, wind speed, and incoming shortwave radiation, were used. Additionally, variables at the 500, 200, and 300 hPa pressure levels, including geopotential height, horizontal wind, temperature, and specific humidity, were also employed in this study. These data were used to reconstruct meteorological conditions at the AWS locations and to analyze the characteristics and underlying causes of the extreme melt. The glacier outline of Sangqu Glacier used in this study was derived from the Second Chinese Glacier Inventory (Guo et al., 2015), which is primarily based on Landsat imagery acquired between 2006 and 2010. For Sangqu Glacier specifically, the outline originates from an image acquired on 5 May 2007. To provide a more recent reference, we also used the 2020 TP Glacier Inventory (Ke et al., 2026), and manually delineated the glacier boundary from Sentinel-2 imagery acquired on 3 June 2022. These data were used to obtain the glacier area of Sangqu Glacier at different time periods. The 90 m resolution Shuttle Radar Topography Mission (SRTM) digital elevation model (DEM) was used to extract elevation, slope, and aspect. These data also drove model calculations of top-of-atmosphere radiation (Hock and Holmgren, 2005).
4.1 Energy and Mass Balance Model
We established the distributed coupled energy balance–snow/firn model (EBFM) and subsurface model for Sangqu Glacier. This model describes the evolution of vertical temperature, density, and water content profiles within the snow/ice pack, incorporating percolation and refreezing processes (van Pelt et al., 2012). The EBFM has been successfully applied to mountain glaciers, including Abramov Glacier in the Pamir Alay (Kronenberg et al., 2022) and Kuoqionggangri Glacier in the Nyainqêntanglha Mountains (Zhu et al., 2024). Detailed model descriptions are provided by van Pelt et al. (2012, 2019). The sum of each surface energy component is equal to the melt energy (QM) and the surface energy balance formula is as follows (van Pelt et al., 2012):
Snet is the net shortwave radiation, which consists of the incoming (Sin) and outgoing (Sout) shortwave radiation. The Sout depends on the albedo of the glacier surface. Lnet is the difference between the incoming (Lin) and the outgoing longwave radiation (Lout). QH and QL are the sensible and latent heat fluxes, respectively. QG represents the snow and ice heat flux. The subsurface heat flux QG in EBFM is computed by solving the one-dimensional heat conduction equation. Following established approaches for polythermal glaciers (van Pelt et al., 2012), the effective thermal conductivity is parameterized as a function of snow/firn/ice density based on Östin and Andersson (1991) and Sturm et al. (1997). The heat capacity is treated as a function of temperature following Yen (1981). One simplification of the EBFM is that it does not include penetrating shortwave radiation, meaning that solar radiation is absorbed entirely at the surface rather than within the subsurface layers. Following micrometeorological convention, energy fluxes directed towards the surface are positive. The dichotomous iterative method was used to calculate the glacier's surface temperature, and the surface temperature was constrained at less than 0 °C.
The glacier mass balance on TP comprises four primary processes: snowfall, melting, sublimation/evaporation, and refreezing. The glacier mass balance at each grid point can be expressed as:
B denotes the point mass balance of each grid. P is for precipitation. M is the amount of melt on glacier surface. refers to the sublimation and evaporation. Cr is for refreezing. Surface ablation involves melting, sublimation and evaporation. In this study, sublimation and evaporation were quantified based on latent heat flux and surface temperature. Specifically, the phase transition criteria were defined as follows: sublimation was identified under conditions where surface temperatures remained below the melting point while latent heat flux exhibited negative values. Conversely, evaporation was classified when surface temperatures exceeded the melting point with concurrent negative latent heat flux values. Additionally, the model explicitly includes deposition and condensation processes, which are strictly governed by positive latent heat flux conditions. Here, deposition occurs when surface temperatures remain below the melting point with positive latent heat flux, while condensation occurs when surface temperatures exceed the melting point with positive latent heat flux. However, both processes were excluded from the final analysis due to their negligible impact on the overall mass balance. Mass accumulation comprises snowfall and refreezing processes. Specifically, surface accumulation was derived from solid precipitation events, determined by a temperature-dependent rain-snow transition threshold applied to atmospheric forcing data. Subsurface liquid water sources, including meltwater, rainfall, and condensation, were tracked as potential contributors to refreezing.
In this study, the EBFM was applied as a distributed model at a spatial resolution of 100 m and hourly temporal resolution, driven by air temperature, relative humidity, wind speed, total precipitation, and cloud fraction from October 2019 to September 2022. As the AWS was installed in October 2020, one year later than the start of mass balance observations (October 2019), and observations were only available through July 2022, meteorological forcing for October 2019–October 2020 and for August–September 2022 was reconstructed. To obtain the air temperature, relative humidity, wind speed, total precipitation, and cloud fraction at hourly intervals from October 2019 to September 2022, meteorological data were reconstructed at hourly intervals using the Random Forest method by combining the air temperature, relative humidity, wind speed, and Sin measured at AWS and ERA5. This study applied the Random Forest method for statistical downscaling of ERA5 reanalysis data to reconstruct near-surface meteorological variables, specifically air temperature, relative humidity, wind speed, and Sin at a glacier surface AWS site.
Observational data from an AWS were first spatially and temporally matched with ERA5 grid points to construct training and testing datasets. Predictor variables included surface variables (2 m air temperature, dewpoint temperature, 10 m wind components, and surface pressure) and at 300 and 500 hPa (temperature, humidity, wind components, and geopotential height), from which derived variables such as wind speed and relative humidity were also computed. To minimize overfitting and obtain robust estimates of model performance, we applied three repetitions of five-fold cross-validation, where the training data were repeatedly split into five subsets, each serving in turn as the validation set. Evaluation results indicate that the Random Forest model achieves high predictive accuracy. Comparisons between the downscaled estimates and in-situ observations yielded R2 (coefficient of determination) values of 0.99, 0.96, 0.94, and 0.96 for air temperature, relative humidity, wind speed, and Sin, respectively, at the hourly scale (Fig. S1), with similarly robust performance during the ablation season (June–September) (Fig. S5).
The cloud cover fraction was estimated as 1 minus the ratio of incoming shortwave radiation to top-of-atmosphere radiation. The hourly calculation of STOA (total radiation from the top of the atmosphere) was based on elevation, slope, and aspect parameters (Hock and Holmgren, 2005). We also estimated the total precipitation on Sangqu Glacier from October 2019 to September 2022. This was achieved by combining total precipitation data from ERA5 with data from direct measurements. First, we calculated the ratio (1.03) of total measured precipitation to that estimated by ERA5 for the overlap period (October 2020 to July 2022). Based on the overlap period, we also calculated seasonal correction factors (spring: 0.92, summer: 0.96, autumn: 1.29, and winter: 5.34). Although the winter correction factor is large, winter precipitation accounts for only 4.24 % of the annual total and the glacier is in a quiescent state during this period (Fig. S9). Consequently, to avoid amplifying the substantial uncertainties inherent in solid precipitation measurement under high-wind conditions, we ultimately adopted the precipitation-weighted annual mean factor of 1.03 for reconstructing the full time series.
The spatial interpolation of meteorological data considered the topographic conditions (elevation, slope, and aspect) of Sangqu Glacier. Both the air temperature lapse rate and the precipitation gradient were treated as model parameters, with the latter constrained by glacier mass balance and albedo. Following the approach of Hock and Holmgren (2005) in their distributed surface energy-balance modeling for Storglaciären, Sweden, the wind speed and relative humidity measured at the single AWS are assumed to be representative of the entire glacier, due to the limited availability of spatially distributed observations and the relatively small spatial variability in relative humidity across the glacier.
The methodology for calculating the energy balance components at the glacier surface was based on the findings of previous studies. The Sin was calculated following Klok and Oerlemans (2002) and van Pelt et al. (2012) and accounts for the grid aspect and shading by the surrounding terrain. Sout depends on surface albedo. Snow albedo was related to temperature and humidity (Oerlemans and Knap, 1998; Bougamont et al., 2005; van Pelt et al., 2019), and ice albedo was calculated from dew-point temperature following Mölg et al. (2008). The Lin was calculated based on the relative humidity and air temperature (Brunt, 1932). Lout was calculated using the Stefan–Boltzmann law. The surface emissivity (ϵ) was set to 1.0 following van Pelt et al. (2012). QH and QL were calculated using the method proposed by Klok and Oerlemans (2002). QG was obtained as the sum of the conductive heat fluxes (Reijmer and Hock, 2008; van Pelt et al., 2012).
4.2 Modelling Validation and Uncertainty
To reduce uncertainties arising from manual parameter calibration, this study proposes a stepwise parameter calibration scheme. First, the Shuffled Complex Evolution (SCE-UA) algorithm (Duan et al., 1992) was employed to calibrate parameters related to incoming longwave radiation parameterization using RMSE as the objective function. Subsequently, for the EBFM model, the Nondominated Sorting Genetic Algorithm II (NSGA-II) multi-objective optimization algorithm (Deb et al., 2002) was applied. Utilizing daily-scale surface albedo data from on-glacier meteorological stations and glacier-wide mass balance observations, the EBFM parameters were calibrated with both the R2 and RMSE as dual objective functions.
Following parameter calibration, the model's performance was rigorously validated using in-situ observational data to the greatest extent possible. Specifically, validation utilized in-situ measurements of albedo, Lin, and Lout from an AWS installed on the glacier. Additionally, point-scale mass balance data across different elevations, along with glacier-wide mass balance records for the periods October 2019–October 2020, October 2020–October 2021, and October 2021–July 2022, were used to assess the simulation accuracy. To further evaluate the model's performance in simulating glacier mass balance, seasonal-scale glacier-wide mass balance data observed during 2020–2021 were also employed. Because AWS observations ended in July 2022, no concurrent in-situ meteorological observations were available to directly validate the reconstructed forcing or model performance during August–September 2022.
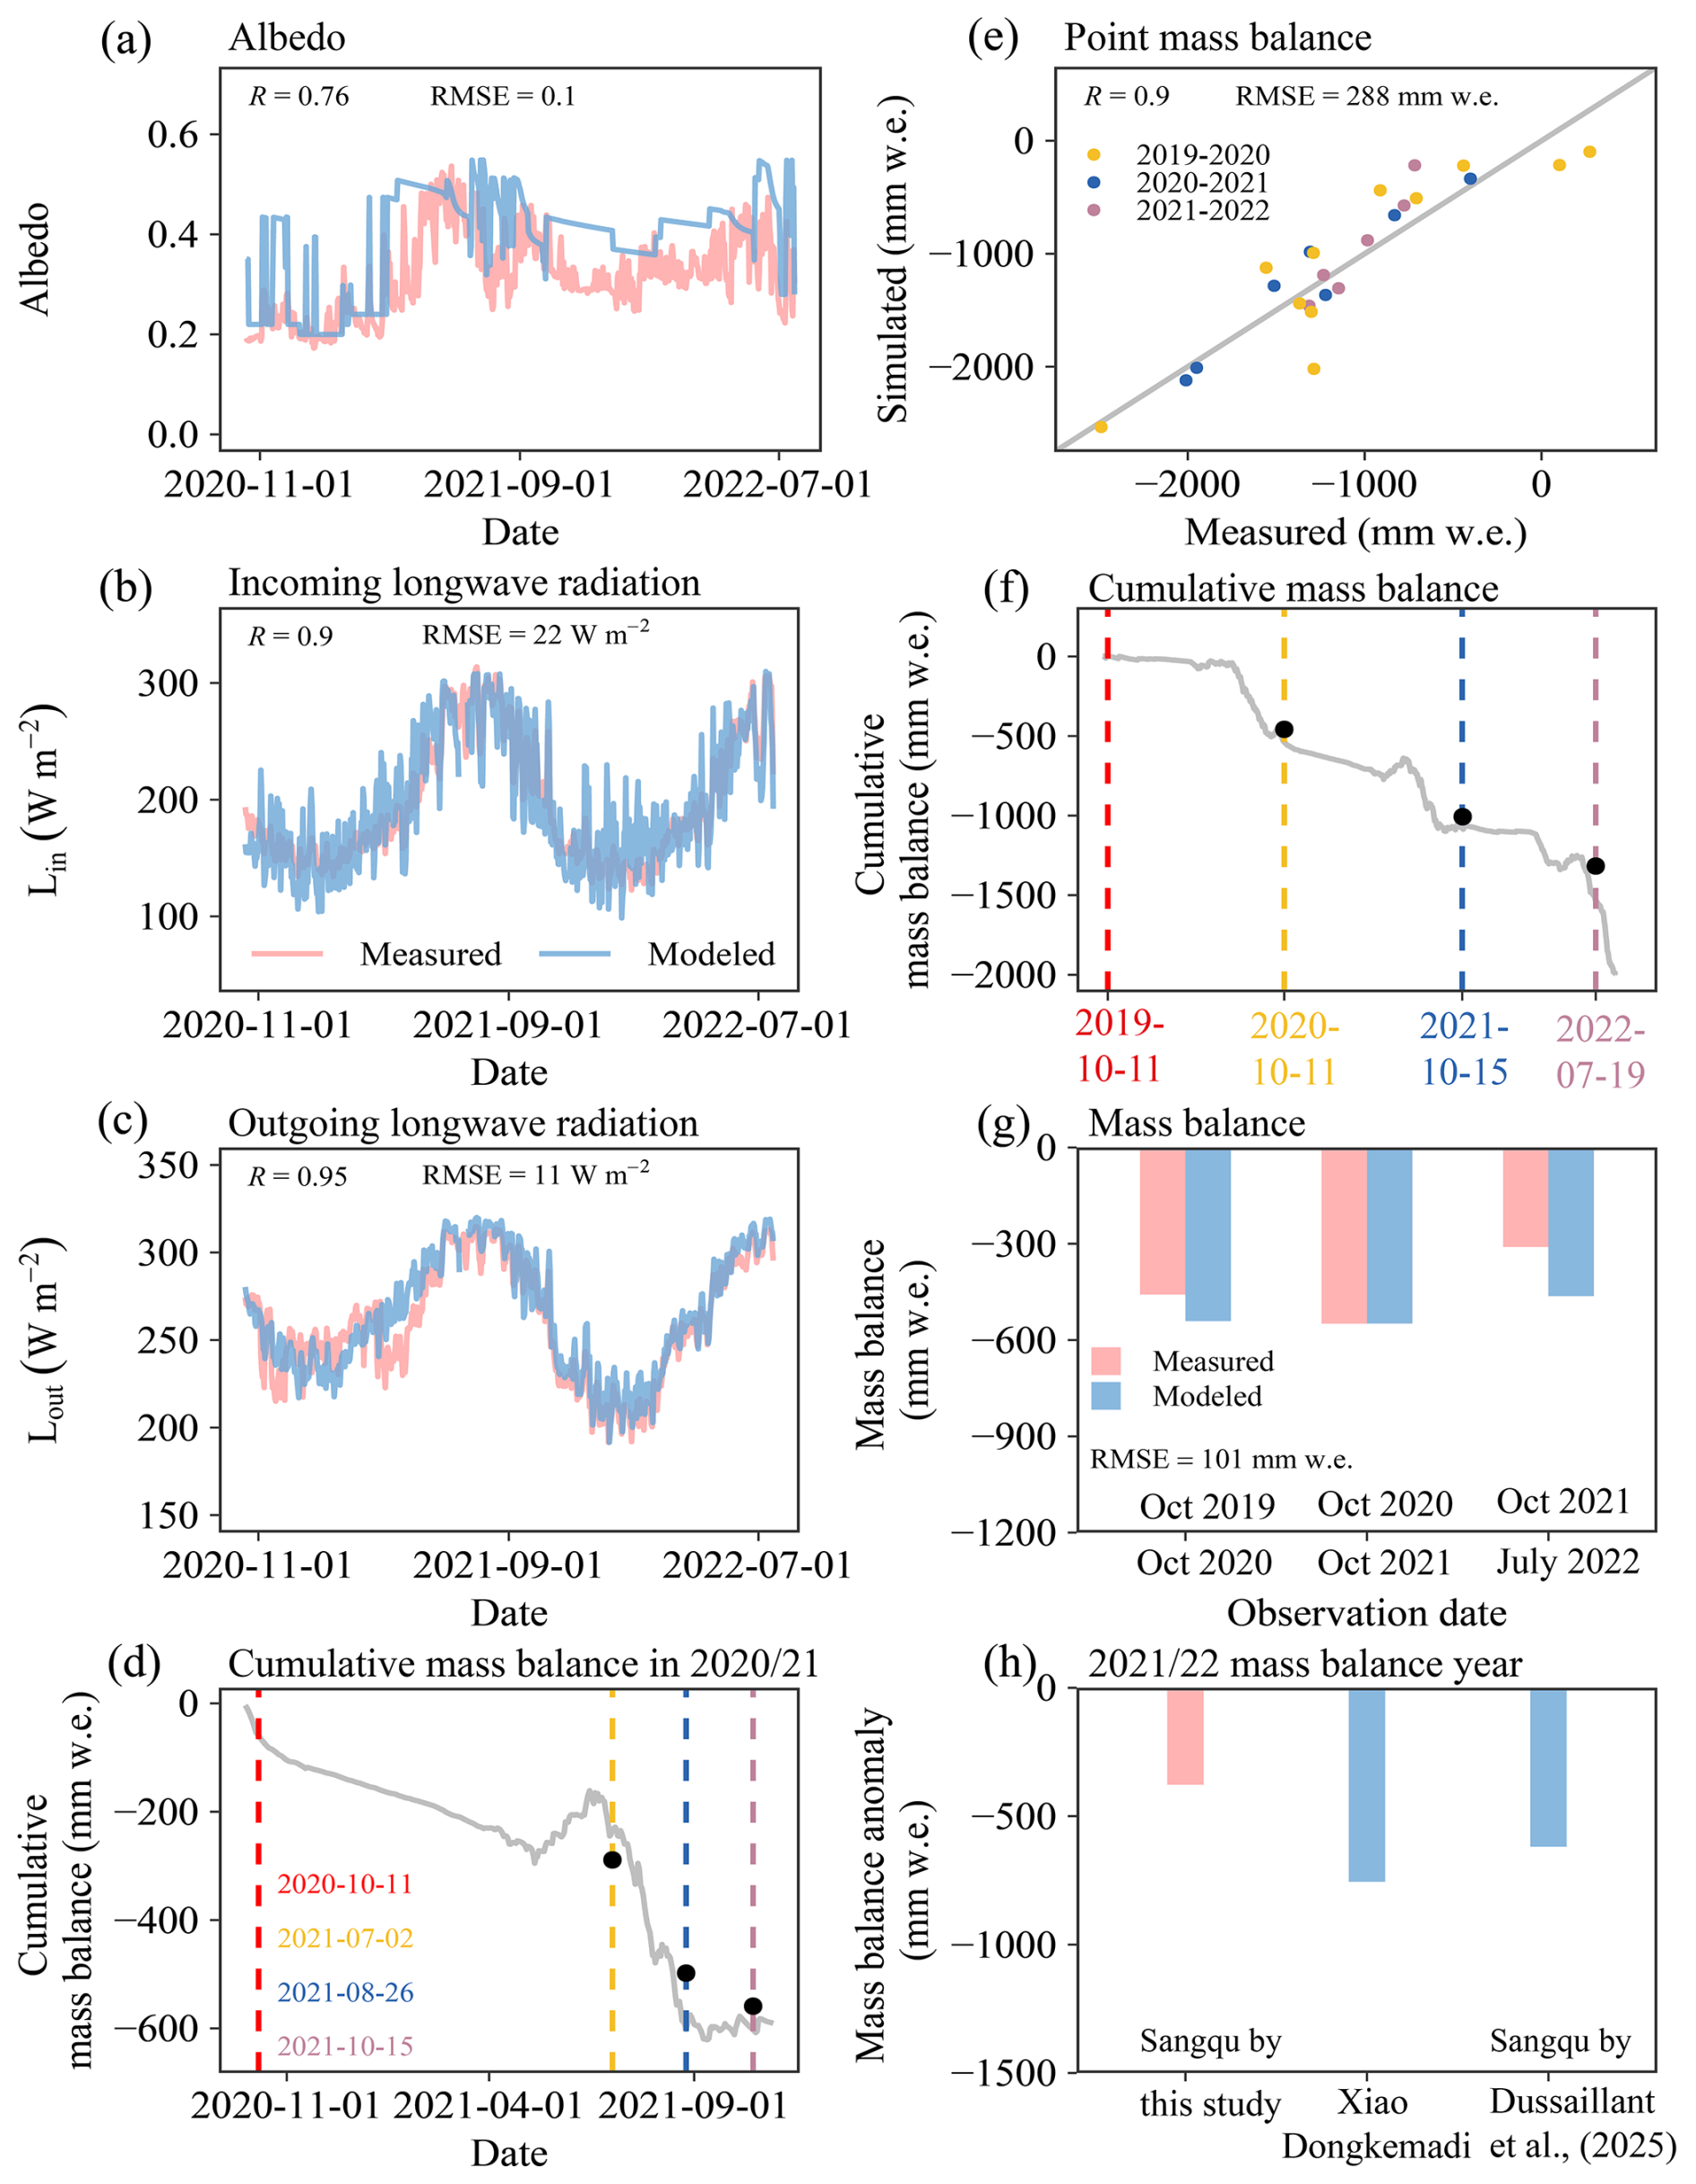
Figure 2Comparison between observations and simulations of (a) albedo, (b) Lin, (c) Lout, (d) glacier mass balance from June to September 2021, (e) point mass balance at different elevations, (f) accumulation mass balance, and (g) glacier-wide mass balance for the periods 2019/20, 2020/21, and from October 2021 to July 2022. (h) Comparison of simulated 2021/22 mass balance anomaly for Sangqu Glacier (anomaly relative to 2019/20–2020/21 average) with observed anomaly for Xiao Dongkemadi Glacier and the anomaly for Sangqu Glacier from Dussaillant et al. (2025), with the latter two anomalies referenced to the 1989–2021 average. All anomalies are shown as deviations from their respective reference periods, highlighting the consistency in direction rather than the magnitude of absolute values.
Figure 2 presents a comparison between measured and modelled albedo, Lin, and Lout at the AWS site. Albedo was directly derived as the ratio at the AWS site. This observed albedo time series was used for model calibration and validation. Daily albedo simulations showed good agreement with observations, with an R of 0.76 and an RMSE of 0.1 (Fig. 2a). For 7 d average values, the agreement was comparable to that of the daily simulations (R=0.74, RMSE = 0.09; Fig. S2). Simulations of Lin and Lout were also robust. Modelled Lin correlated well with measurements (R=0.9, RMSE = 22 W m−2; Fig. 2b), as did Lout (R=0.95, RMSE = 11 W m−2; Fig. 2c). The high accuracy in simulating radiation components supports reliable estimates of Lnet and glacier surface temperature.
The performance of the EBFM model in simulating glacier mass balance was evaluated using multi-scale comparisons. At the point scale, the RMSE between simulated and observed mass balances was 288 mm w.e. (Fig. 2e). The R at the point scale is 0.9 (Fig. 2e). At the glacier-wide scale, the RMSE was 101 mm w.e. for the periods with available observations (Fig. 2f and g). The model reproduced the observed cumulative mass balance evolution during the observationally constrained periods, supporting its application to reconstruct the full 2021/22 balance year. However, the August–September 2022 results should be interpreted as model-based estimates rather than directly validated observations. We also compared the differences between observed and simulated temperatures at 3 and 5 m within the glacier, with correlation coefficients of 0.94 and 0.96, respectively (Fig. S3). The simulated englacial temperatures show a systematic cold bias compared to observations (Fig. S3). This cold bias may arise from the following factors: (i) the model does not account for penetrating shortwave radiation at the bare-ice surface (Bintanja and Van den Broeke, 1995; Mölg et al., 2008); (ii) the density-based thermal conductivity parameterization (Ostin and Andersson 1991; Sturm et al., 1997) may not fully capture the thermal properties of snow/firn layers under the high-radiation environment of the central TP; and (iii) the simplified initial conditions may not have reached full equilibrium. Mölg et al. (2008) found on Kilimanjaro that neglecting penetrating shortwave radiation leads to a significant cold bias in ice temperatures, which was eliminated after incorporating the process. Wheler and Flowers (2011) and Yang et al. (2021) also emphasized the importance of including subsurface processes such as radiative penetration. Nevertheless, our sensitivity analysis shows that this bias has limited impact on mass balance: the glacier-wide annual mass balance has sensitivities of −9.9 to effective thermal conductivity and +10.5 to heat capacity, far smaller than the extreme mass loss observed in 2021/22 and its anomaly relative to the previous two years. Moreover, because this bias is systematic, its effect on interannual anomalies is smaller than on absolute values, and thus it does not affect our identification or quantification of the extreme melt event.
To assess model accuracy at seasonal resolution, we compared simulated and in-situ mass balances for the 2020–2021 balance year, yielding an RMSE of 329 mm w.e. (Fig. 2d). The extreme mass loss in 2021/22 is supported by two independent lines of evidence. First, the in-situ mass balance at the neighbouring Xiao Dongkemadi Glacier ranks as the third most negative in its nearly 30-year record, falling 619.5 mm w.e. below the 1989–2021 mean (Zhu et al., 2026a). Second, the coarse satellite-informed product of Dussaillant et al. (2025) shows a negative anomaly of 755.2 mm w.e. relative to the same reference period. Together, these independent datasets confirm that the 2021/22 balance year was exceptionally negative and represents an extreme mass loss event for Sangqu Glacier.
Collectively, these multi-scale and cross-site comparisons demonstrate that the EBFM model provides reliable energy and mass balance simulations for Sangqu Glacier, thereby supporting its use for detailed analyses of energy and mass balance processes.
This study conducts sensitivity and uncertainty tests based on the parameter selection framework proposed by van Pelt et al. (2012). Model output uncertainty primarily originates from key parameters governing albedo (snow, firn, and ice), precipitation gradients, critical temperature thresholds (e.g., the rain-snow partitioning threshold), temperature lapse rate, parameters for downward shortwave radiation, and turbulent flux calculations, all of which are crucial determinants of mass balance simulation accuracy. Following the recommendation of van Pelt et al. (2012), an uncertainty of ± 0.03 was applied to the albedo of snow, ice, and firn, along with the relevant parameters. The aerosol transmissivity coefficient, a parameter influencing Sin, was perturbed by ±0.01. The temperature lapse rate was adjusted by ± 0.1 °C per 100 m. All other parameters were perturbed by ±10 % to assess sensitivity and associated uncertainty. The sensitivity was quantified using the formula provided below (Oerlemans et al., 1998):
M is the glacier-wide mass balance, and S represents the parameter for which sensitivity tests are to be performed.
The results of the sensitivity tests are presented in the Supplement (Tables S1–S4). Unless otherwise specified, the sensitivities reported here represent arithmetic means for the three mass balance years 2019/20–2021/22; the corresponding annual values are tabulated in Tables S2–S4, while the heatwave-period melt sensitivity is tabulated in Table S1. The glacier-wide mass balance of the Sangqu Glacier exhibits particularly high sensitivity to ice and snow albedo. Specifically, the sensitivities of the snow-albedo parameter, firn-albedo parameter, and the two ice-albedo parameters were 123.2, 114.7, −0.3, and 126.3 , respectively. The temperature lapse rate shows a sensitivity of −141.4 . The background turbulent exchange coefficient and turbulent flux coefficient yield sensitivities of 8.3 and −55 , respectively. In comparison, the sensitivity of the glacier-wide mass balance to the rain-snow temperature threshold and precipitation gradient are relatively minor, at 0.5 and −2.2 , respectively. The sensitivity to the aerosol transmissivity coefficient is −20.2 . The glacier-wide annual mass balance has a sensitivity of −9.9 to effective thermal conductivity and +10.5 to heat capacity.
The total uncertainty in the modelled mass balance for each mass balance year was estimated following the error propagation law described by Zhu et al. (2024, 2021). The average uncertainty over three mass balance years is 264.3 mm w.e. (Tables S2–S4). A comprehensive sensitivity analysis of key model parameters during the heatwave period was conducted, and the associated uncertainty in melt amount was estimated to be 99.3 mm w.e. (Table S1).
4.3 Standardized heatwave index
The standardized heatwave index (SHI) was employed to detect heatwave events (Raei et al., 2018; Shan et al., 2024). This index quantifies temperature deviations, ranking heatwaves by their probability of occurrence relative to a climatological reference period. As highlighted by Shan et al. (2024), the choice of this reference period is critical due to the non-stationarity of temperature records caused by global warming. Using the entire period of record can introduce bias, as the climate normal for a given day would be influenced by long-term trends rather than representing the recent expected conditions to which ecosystems and society may have adapted.
To address this, Shan et al. (2024) explicitly recommend using a dynamic, 30-year moving window to better account for climate non-stationarity. Following their methodology, we used the past 30 years as the historical reference period (1992–2021). For each target day, the 30-year mean of the accumulated temperature is calculated and used as the expected normal, allowing the index to reflect anomalies relative to a recent, locally adapting baseline. The SHI for each day was then calculated as follows (Raei et al., 2018; Shan et al., 2024):
The variables i and j denote calendar days, with ; represents the year, M is the total number of years in the historical record. The daily mean temperature Tm,i for day i of year m is used directly. For leap years, the mean temperatures of 28 February and 29 February are averaged and assigned to 28 February, after which the leap day is excluded. The accumulation period for a heatwave is denoted by Nh, and represents the mean temperature over the accumulation period ending on day i. The cumulative distribution function (CDF) is fitted to the set when m≥30; otherwise, it is fitted to . The inverse of the standard normal CDF is denoted as ϕ−1, and SHIm,i is the resulting standardized heatwave index for day i of year m.
We follow Raei et al. (2018) in using daily mean air temperature for the SHI calculation, as the original method employs this metric. From a glaciological perspective, daily mean temperature is preferred over daily maximum for two reasons. First, glacier melt responds to the cumulative thermal forcing over the entire diurnal cycle, and daily mean temperature better represents the total energy available for melt over multi-day heatwave events. Second, the widely used positive degree-day method for glacier mass balance modeling is traditionally based on daily mean temperatures (Hock, 2003), making this choice consistent with standard glaciological practice for capturing sustained melt anomalies rather than isolated peak temperature extremes.
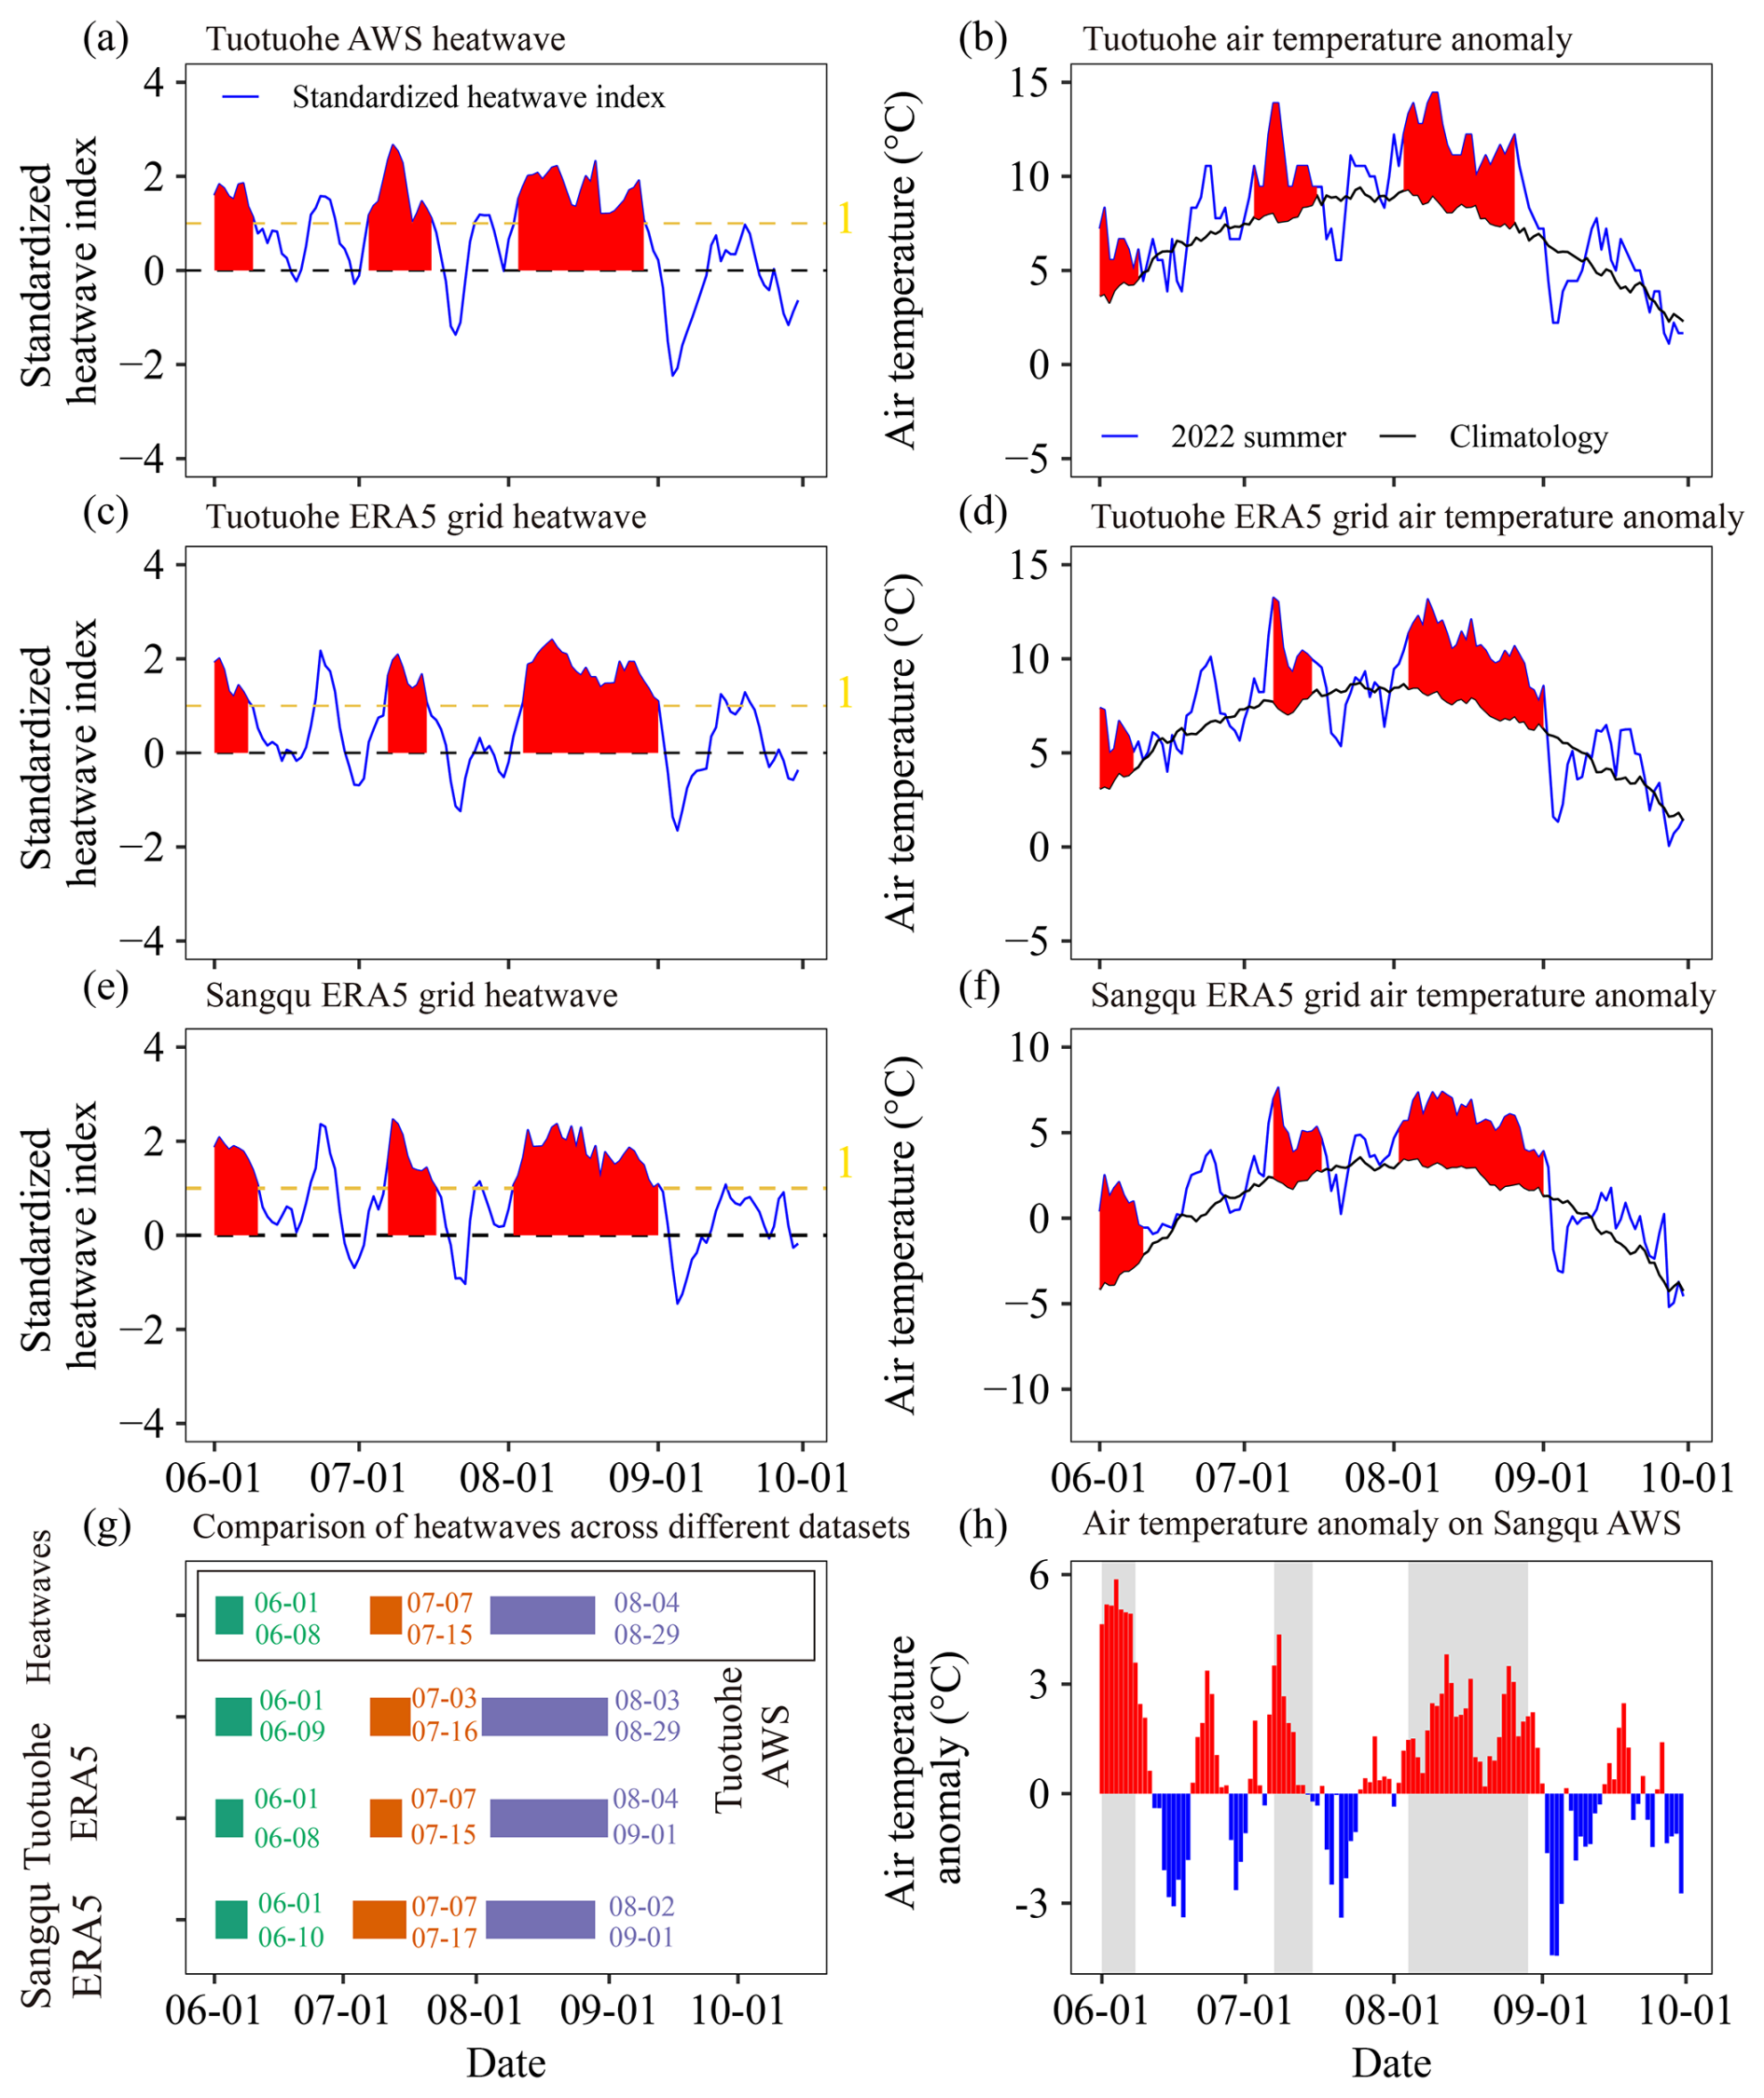
Figure 3Identification of heatwave events from June to September 2022. Air temperature anomalies are calculated relative to the 1992–2021 climatology. (a, b) Heatwave events and corresponding temperature anomalies at the Tuotuohe meteorological station. (c, d) As in (a) and (b), but for the ERA5 grid cell containing the Tuotuohe meteorological station. (e, f) As in (a) and (b), but for the ERA5 grid cell containing Sangqu Glacier. In panels (a), (c), and (e), the yellow line marks the standardized heatwave index threshold of 1; a heatwave is identified when the index exceeds this threshold for at least three consecutive days. (g) Comparison of heatwave events identified from the three datasets shown in (a), (c), and (e). (h) Summer (June–September) temperature anomalies at Sangqu Glacier in 2022 based on the identified heatwave events.
Figure 3 presents the identified heatwave events (Fig. 3a, c and e) and the associated air temperature anomaly magnitudes (Fig. 3b, d and f). The anomalies are calculated relative to the 1992–2021 climatology. The first dataset consists of in-situ observations from the Tuotuohe meteorological station, located approximately 150 km from Sangqu Glacier. This station has been widely employed in previous studies on glacier mass balance and hydrological processes in the region (Gao et al., 2012). Using daily mean air temperatures from this station, three heatwave events were identified: 1–9 June, 3–16 July, and 3–29 August (Fig. 3a and b). The second dataset is derived from the ERA5 reanalysis, specifically from the grid cell corresponding to the Tuotuohe meteorological station. Based on daily mean air temperatures extracted from this dataset, three heatwaves were identified: 1–8 June, 7–15 July, and 4 August–1 September (Fig. 3c and d). The third dataset is also from ERA5 reanalysis but represents the grid cell covering the study site, Sangqu Glacier. Analysis of daily mean air temperatures from this dataset revealed three heatwave periods: 1–10 June, 7–17 July, and 2 August–1 September (Fig. 3e and f).
To minimize uncertainties arising from the use of multiple data sources, only the overlapping periods consistently identified by all three datasets were defined as the final heatwave events (Fig. 3g). Accordingly, the three heatwave events in the summer of 2022 were delineated as 1–8 June, 7–15 July, and 4–29 August. Figure 3h shows that the air-temperature anomaly magnitudes at the Sangqu Glacier site during the three identified heatwave periods were 4.9, 1.6, and 2.0 °C, respectively; the August value is based on the meteorological series reconstructed from downscaled ERA5 data.
This approach integrates multi-source data consistency with an objective statistical criterion for identifying heatwave events. By retaining only the overlapping periods identified across all three datasets, it reduces dataset-specific discrepancies and improves the consistency of heatwave identification.
4.4 A Dual-Threshold Framework for Identifying Extreme Mass Loss Events in Short-Term Glacier Mass Balance Records
Conventional approaches for detecting extreme mass loss events, such as percentile thresholds (Vargo et al., 2020) and generalized extreme value (GEV) distributions (Thibert et al., 2018), typically require observational records exceeding 30 years. On the TP, however, most glacier mass balance series span less than a decade, with the sole exception of Xiao Dongkemadi Glacier (since 1989; Yao et al., 2012). To address this limitation, we developed a dual-threshold framework capable of reliably identifying extreme mass loss events from short-term records (<10 years).
The core idea is to establish a mathematical link between two approaches for defining extreme events within a training period: a percentile-based method and a method based on deviations from the mean. Let By denote the annual mass balance (mm w.e.). The available record is split into a training set (years Ttrain) and a test set (years Ttest). The training set is used to calibrate the relationship between the two methods, and the calibrated rule is then applied to the test set.
First, we identify extreme years in the training set using a percentile-based threshold. With a default probability level p=0.10 (the 10th percentile), the threshold QP is computed, and all years in the training set with annual mass balance below QP are defined as extreme mass loss events, denoted by the set Ytarget.
Second, we calculate the mean μ and standard deviation σ of the annual mass balance in the training set:
n is the number of years in the training set, and Bi is the mass balance of the ith training year.
Third, we determine a multiplier k such that the rule identifies the same extreme years as the percentile method. By searching over a predefined range (e.g., ), we retain all k values for which the set of years satisfying exactly matches Ytarget. The smallest and largest k in this valid range are denoted kmin and kmax, respectively. These yield two thresholds:
The relaxed threshold serves as a lower bound for identifying potential extreme events, while the strict threshold denotes a more conservative bound for high-confidence extreme events. The interval between the two thresholds quantifies the uncertainty arising from the short training series.
Finally, for any year in the test set, we classify it as an extreme event if its mass balance falls below the relaxed threshold, and as a high-confidence extreme event if it falls below the strict threshold. To test the reliability and transferability of this dual-threshold framework, we validated it using five glaciers with long-term observational records across the TP, as presented in Sect. 5.2.
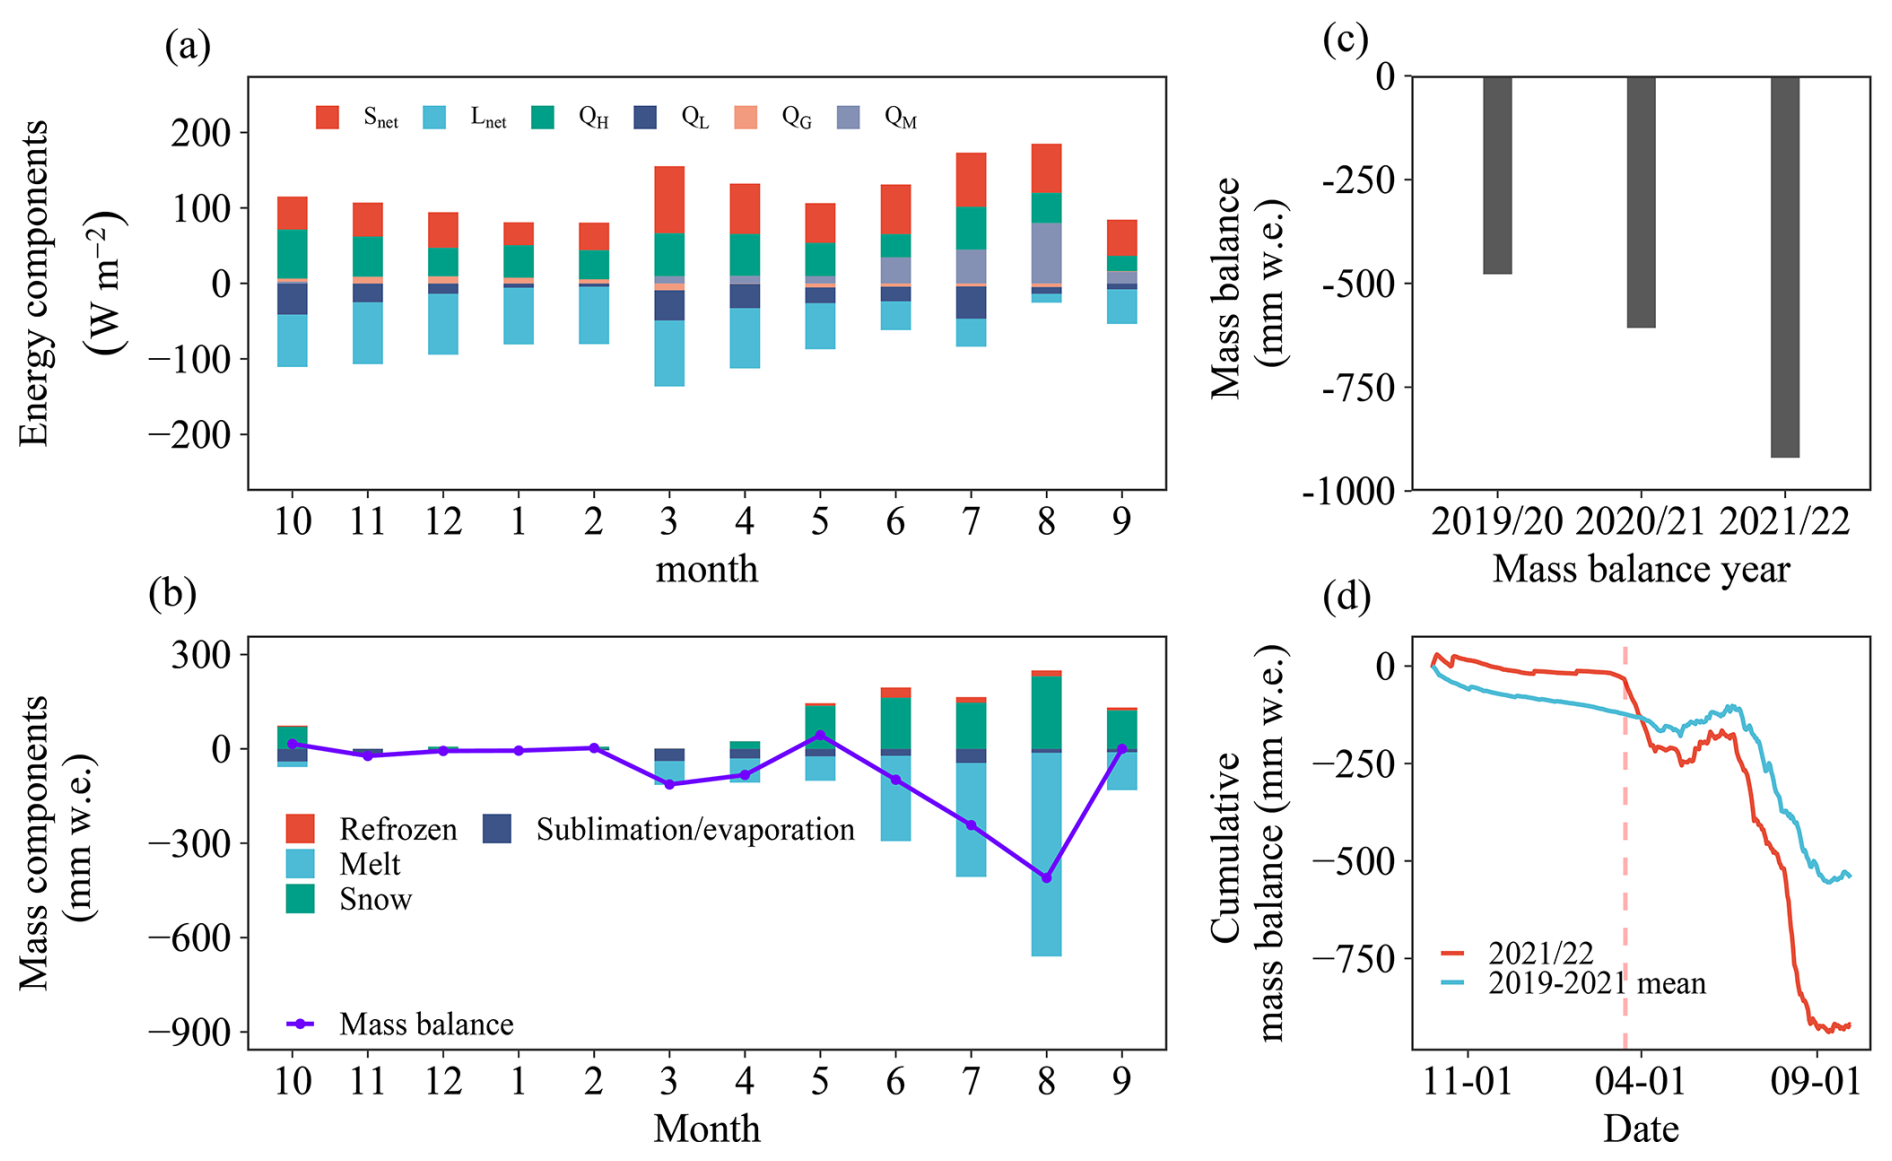
Figure 4Monthly variations of (a) energy and (b) mass balance components during the 2021/22 mass balance year. (c) Interannual variations of annual mass balance. (d) Differences in accumulation mass balance between 2021/22 and the 2019–2021 mean.
5.1 Seasonal cycle of energy and mass balance during the 2021/22 mass balance year
The seasonal variations in the glacier-wide energy balance and its components during the 2021/22 mass balance year are presented in Fig. 4a. The Snet shows significant seasonal variability in the range of 30.2 to 88.8 W m−2, and this variability is mainly driven by the seasonal shift in the solar elevation angle in conjunction with the glacier surface albedo. Lnet is the major energy-loss term for the glacier surface energy balance (Fig. 4a). The maximum and minimum values of net longwave radiation are −11.7 and −87.5 W m−2, which occur in August and March, respectively. The mean Lnet in the warm and cool seasons was −33.2 and −76.5 W m−2, respectively. The difference in Lnet between the warm and cool seasons mainly depends on the difference between Lin and Lout. In this study, Lin is influenced by both air temperature and relative humidity, both of which reach high values in the warm season, corresponding to higher Lin. The Lout calculated from the glacier surface temperature was also high during the warm season. Combining Lin and Lout, the absolute value of Lnet was found to be lower during the warm season than during the cold season. The QH on Sangqu Glacier was continuously above 0 W m−2 and was an important heat source in the energy balance (Fig. 4a). This indicates that the atmosphere continuously supplies heat to the glacier surface, which helps maintain the glacier surface temperature. The QH in the cold and warm seasons was 37 and 49.4 W m−2, respectively, and this difference may be closely related to the temperature gradient between the glacier surface and the atmosphere, as well as seasonal changes in wind speed. In contrast, the QL on Sangqu Glacier is usually less than 0 W m−2, and the mean QL is −21.8 W m−2, indicating that sublimation or evaporation processes are continuously occurring at the glacier surface (Fig. 4a). QG depends on the heat transfer coefficients of ice and snow, as well as the temperature gradient (the temperature difference between the surface and the interior of the glacier). The mean QG is 0.7 W m−2, indicating that the QG accelerates the melting process at the glacier surface (Fig. 4a). Further analysis showed that QG in the cold season played an important role in maintaining the energy balance of the glacier surface, whereas in the warm season, it accelerated the melting of the glacier surface. Analysis of the combined energy components reveals that melt energy became positive as early as March, marking the start of ablation on the Sangqu Glacier, with maximum values occurring in July and August (Fig. 4a). This advanced melt onset corroborates the observations of Zhu et al. (2024). Additionally, melt energy decreases with increasing elevation, reflecting the lower available energy at higher altitudes (Fig. S6).
The glacier-wide mass balance and its components at the glacial scale are shown in Fig. 4b. Melt, snowfall, refreezing, and sublimation/evaporation are the major mass components of glaciers on central TP.
Mass replenishment comes from snowfall and the refreezing of the snowpack. 73 % of snowfall is concentrated in the warm season, and most precipitation falls as snow on glacier surfaces during the warm season. Cold–season snowfall accounts for only 27 % of the total snowfall, with less mass replenishment. The total snowfall in April and May, which affects warm–season albedo and glacier melt rates, accounted for 18 % of the total snowfall. Meltwater on the glacier surface and water content in the snow are the main sources of mass for refreezing. The volume of refreezing peaks in June, which is related to snow cover and meltwater on the glacier surface. During the observation period, the refreezing amount on Sangqu Glacier accounted for 6 % of the melting amount.
The major mass losses from glaciers include melt, sublimation and evaporation. The melt is the dominant component of the mass balance. Melting begins at the glacier surface in March and peaks in July or August, which is related to the seasonal distribution of melt energy. 85 % of melt occurs during the warm season. June, July, August, and September account for 16 %, 22 %, 39 %, and 7 % of the total melt, respectively. Sublimation/evaporation is a component of the mass balance that cannot be ignored; in this study, sublimation/evaporation on the Sangqu Glacier accounted for 29 % of the mass loss.
As illustrated in Fig. 4c, the interannual variability in the mass balance of the Sangqu Glacier indicates that mass loss during the 2021/22 mass balance year was substantially more severe than in 2019/20 and 2020/21, surpassing those years by 442 and 312 mm w.e., respectively. Figure 4d shows the anomaly in cumulative mass balance for 2021/22 relative to the 2019–2021 average. This further indicates that the cumulative mass balance in 2021/22 began to diverge negatively from the multi-year average earlier in the year, suggesting an earlier onset of rapid ablation compared to the two preceding mass balance years.
5.2 Identification and Validation of Extreme Glacier Mass Loss Events on TP
To evaluate the robustness of our proposed dual-threshold framework across different climatic regimes and record lengths, we applied it to five glaciers with long-term mass balance observations on the TP (Figs. 1a, 5). These five glaciers were selected to represent the major climatic regimes of the Tibetan Plateau: Xiao Dongkemadi Glacier in the central plateau (relatively humid, summer-accumulation type), Qiyi Glacier and Ningchan No. 1 Glacier in the northern Qilian Mountains (arid continental), and Guliya Glacier and Xiao Anglong Glacier in the western Kunlun Mountains (hyper-arid, cold). For each glacier, we calibrated the multiplier k based on a portion of its own record and tested the framework's performance on the remainder, ensuring an independent assessment of its detection capability. The results demonstrate that the framework consistently identifies documented extreme mass loss years across all five glaciers (Fig. 5), confirming its robustness and transferability across diverse climatic settings. Given the climatic similarity between Xiao Dongkemadi and Sangqu glaciers, we then applied the k values derived from the former to the short-term record of Sangqu Glacier. This stepwise approach, first validating the framework on multiple long-term records and then transferring it to a data-scarce glacier, strengthens the credibility of our extreme event identification for Sangqu Glacier.
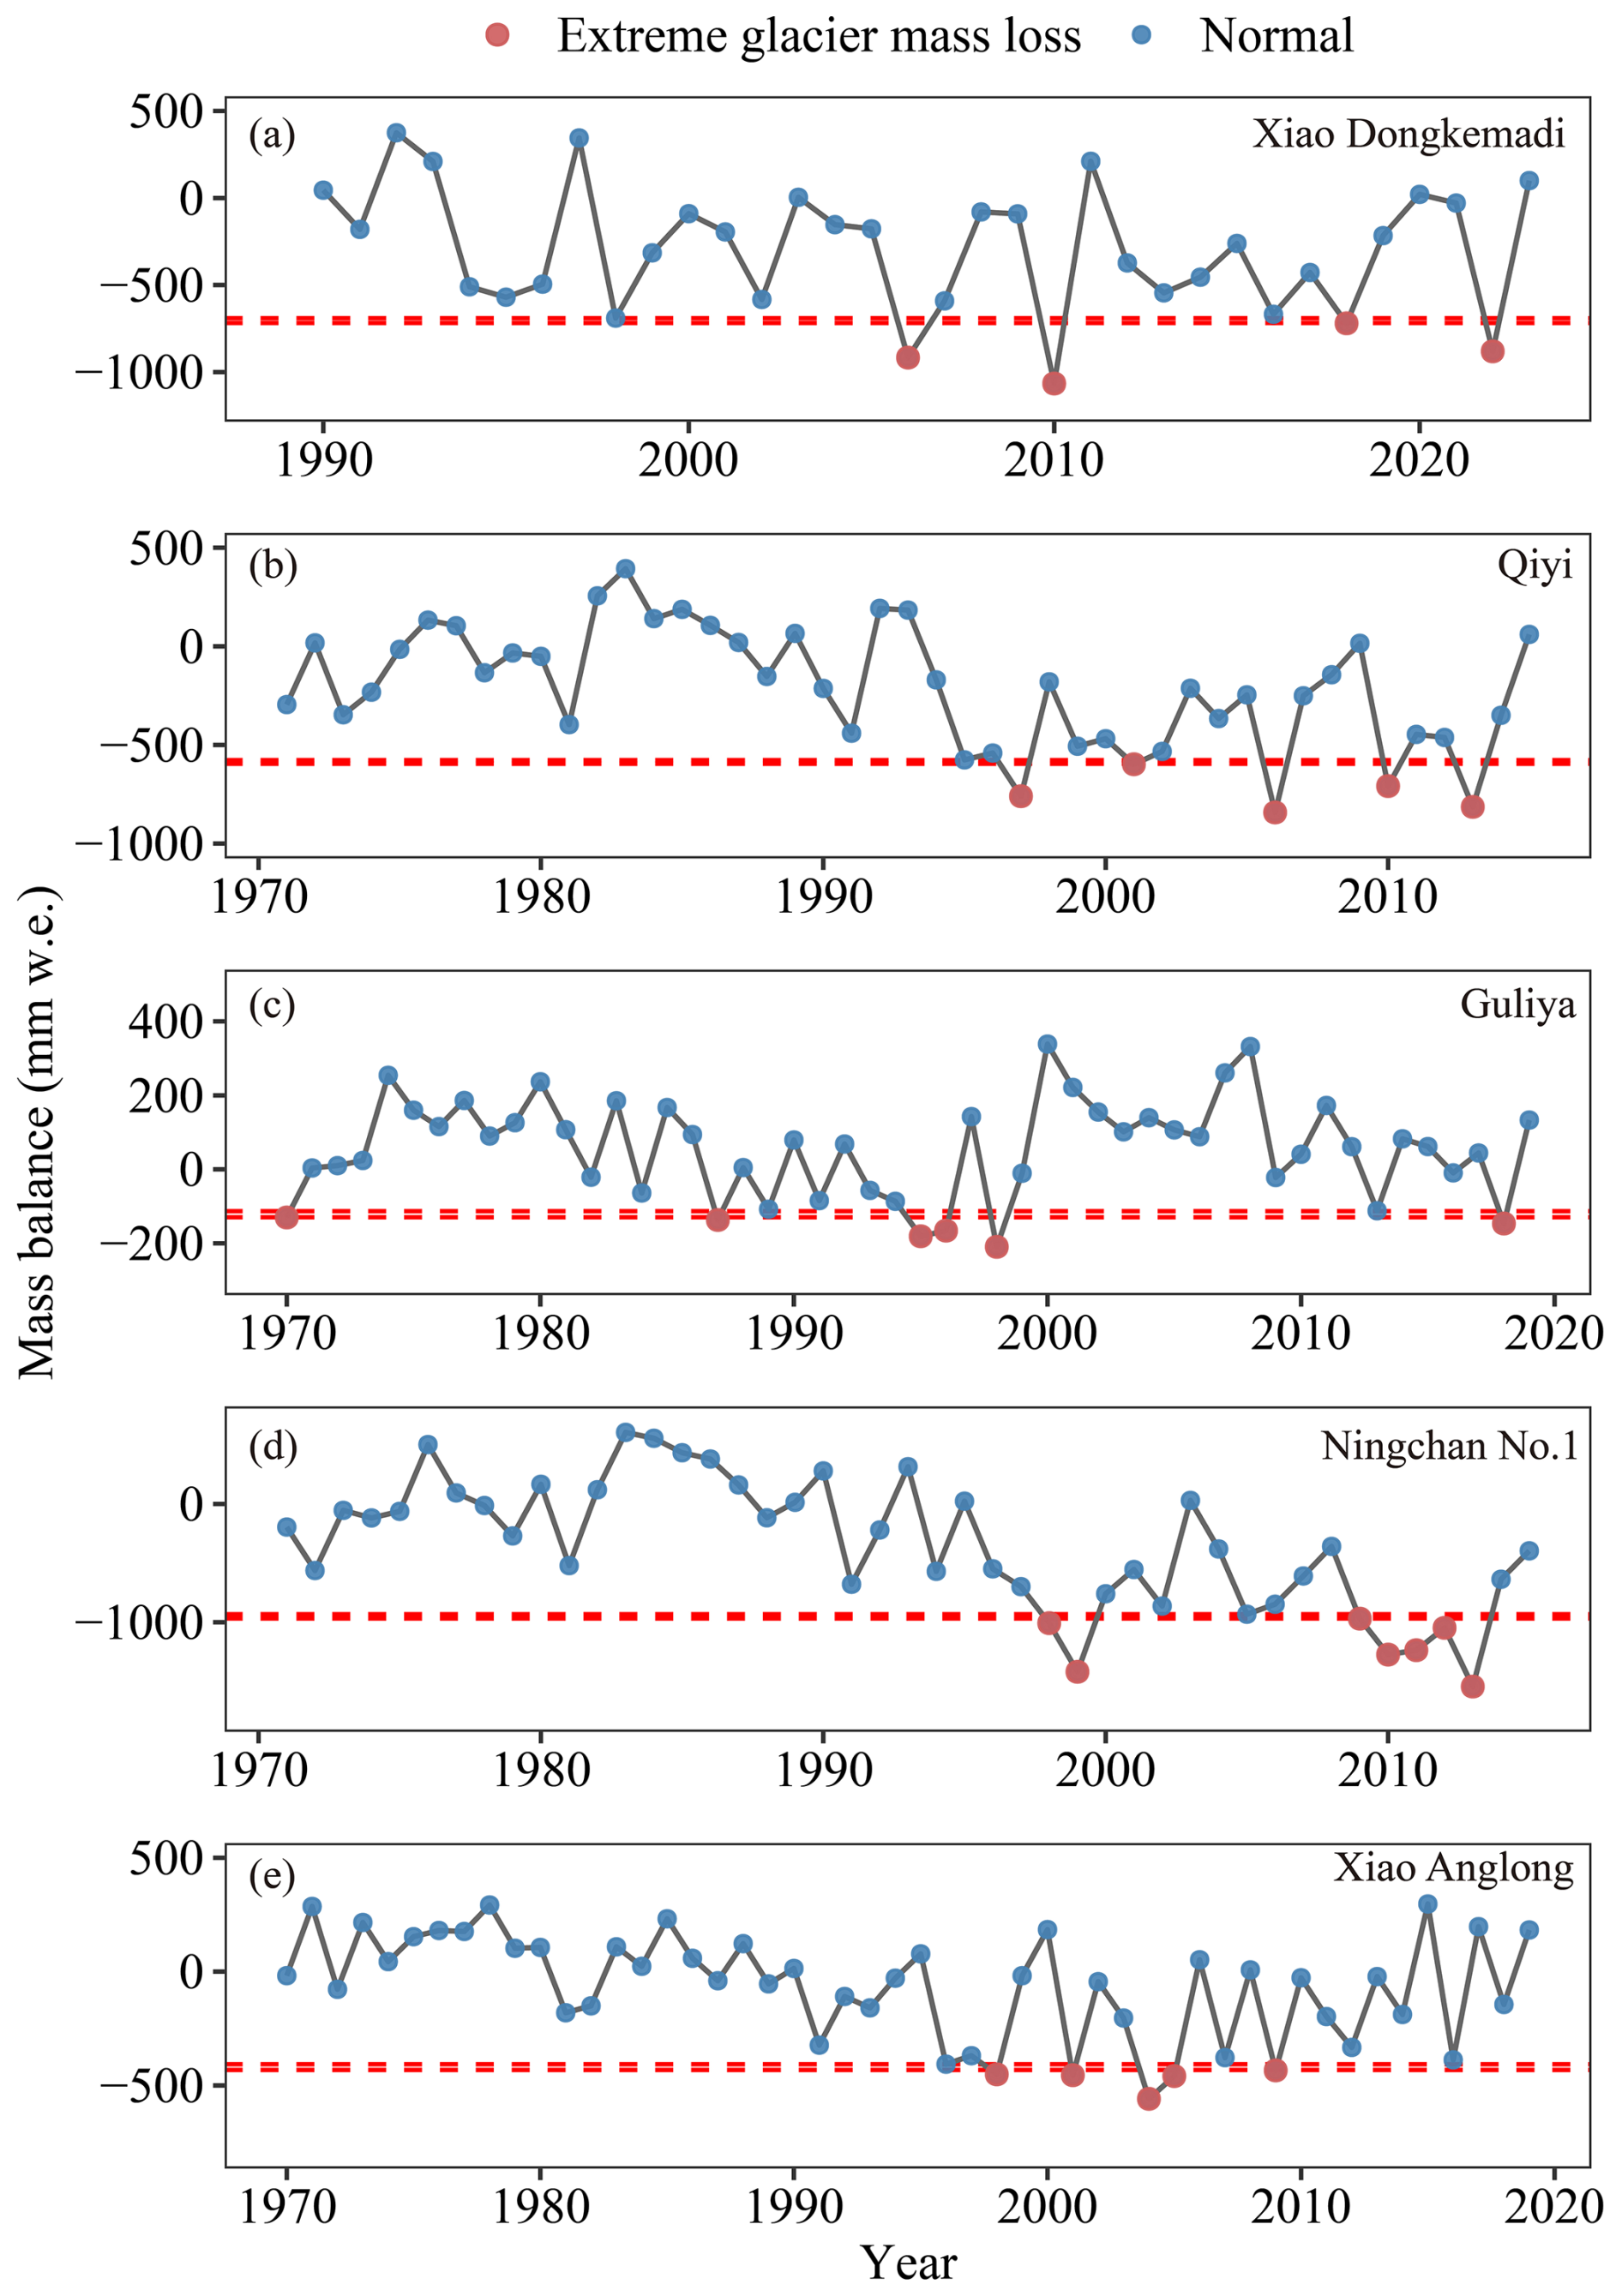
Figure 5Annual mass balance time series and extreme mass loss events for (a) Xiao Dongkemadi Glacier, (b) Qiyi Glacier, (c) Guliya Glacier, (d) Ningchan No. 1 Glacier, and (e) Xiao Anglong Glacier. The data were sourced from Yao et al. (2012), Zhu et al. (2026a) and Zhu et al. (2021, 2022a, b). The two red dashed lines indicate the relaxed and strict thresholds, respectively, derived from the dual-threshold framework for identifying extreme mass loss events. Red dots mark years as extreme mass loss events.
Following the methodology described in Sect. 4.4, we first calibrated the multiplier k for each glacier based on the training period. The resulting kmin and kmax values vary by glacier: for Xiao Dongkemadi Glacier, kmin of 1.06 and kmax of 1.13 (corresponding to thresholds of −691 and −718 mm w.e., respectively) (Fig. 5a); for Qiyi Glacier, kmin of 1.28 and kmax of 1.34 (corresponding to thresholds of −577 and −595 mm w.e., respectively) (Fig. 5b); and for Guliya Glacier, kmin of 1.29 and kmax of 1.41 (corresponding to thresholds of −113 and −129 mm w.e., respectively) (Fig. 5c). For Ningchan No. 1 Glacier, kmin=1.28 and kmax=1.35 (corresponding to thresholds of −932 and −968 mm w.e., respectively) (Fig. 5d); for Xiao Anglong Glacier, kmin=1.49 and kmax=1.6 (corresponding to thresholds of −407.18 and −432 mm w.e., respectively) (Fig. 5e). Using these k values, the relaxed and strict thresholds (as defined in Sect. 4.4) were calculated, enabling the identification of 4–6 extreme mass loss events across the five glaciers. This demonstrates that the framework reliably identifies extreme events even when applied to short-term records.
Given the climate similarity between Xiao Dongkemadi Glacier and Sangqu Glacier, we applied the k values derived from the former to assess the severity of the 2021/22 mass balance year at Sangqu Glacier. Using the mean and standard deviation of the 2019–2021 mass balance record at Sangqu Glacier, the relaxed and strict thresholds were calculated as −909 and −925 mm w.e., respectively. The simulated annual mass balance for 2021/22 (−920 mm w.e.) falls below the relaxed threshold but remains above the strict threshold, indicating an extreme mass-loss event under the relaxed criterion, though not a high-confidence extreme event under the strict criterion.
We acknowledge that the three-year Sangqu Glacier record is insufficient to define independent extreme thresholds. The k values transferred from Xiao Dongkemadi are therefore used not to claim statistical independence, but to provide a consistent reference that places the 2021/22 anomaly, already supported by independent evidence (Sect. 4.2), on a comparable scale with other datasets. This framework serves as a diagnostic aid, not as the primary evidence of extremity.
5.3 Surface Energy Balance Responsible for Extreme Melt during the summer 2022 heatwave
To understand the extreme melt induced by the 2022 summer heatwave, we analyzed the glacier-wide surface energy balance of Sangqu Glacier. The results reveal pronounced energy-balance anomalies during this event (Figs. 6 and S4).
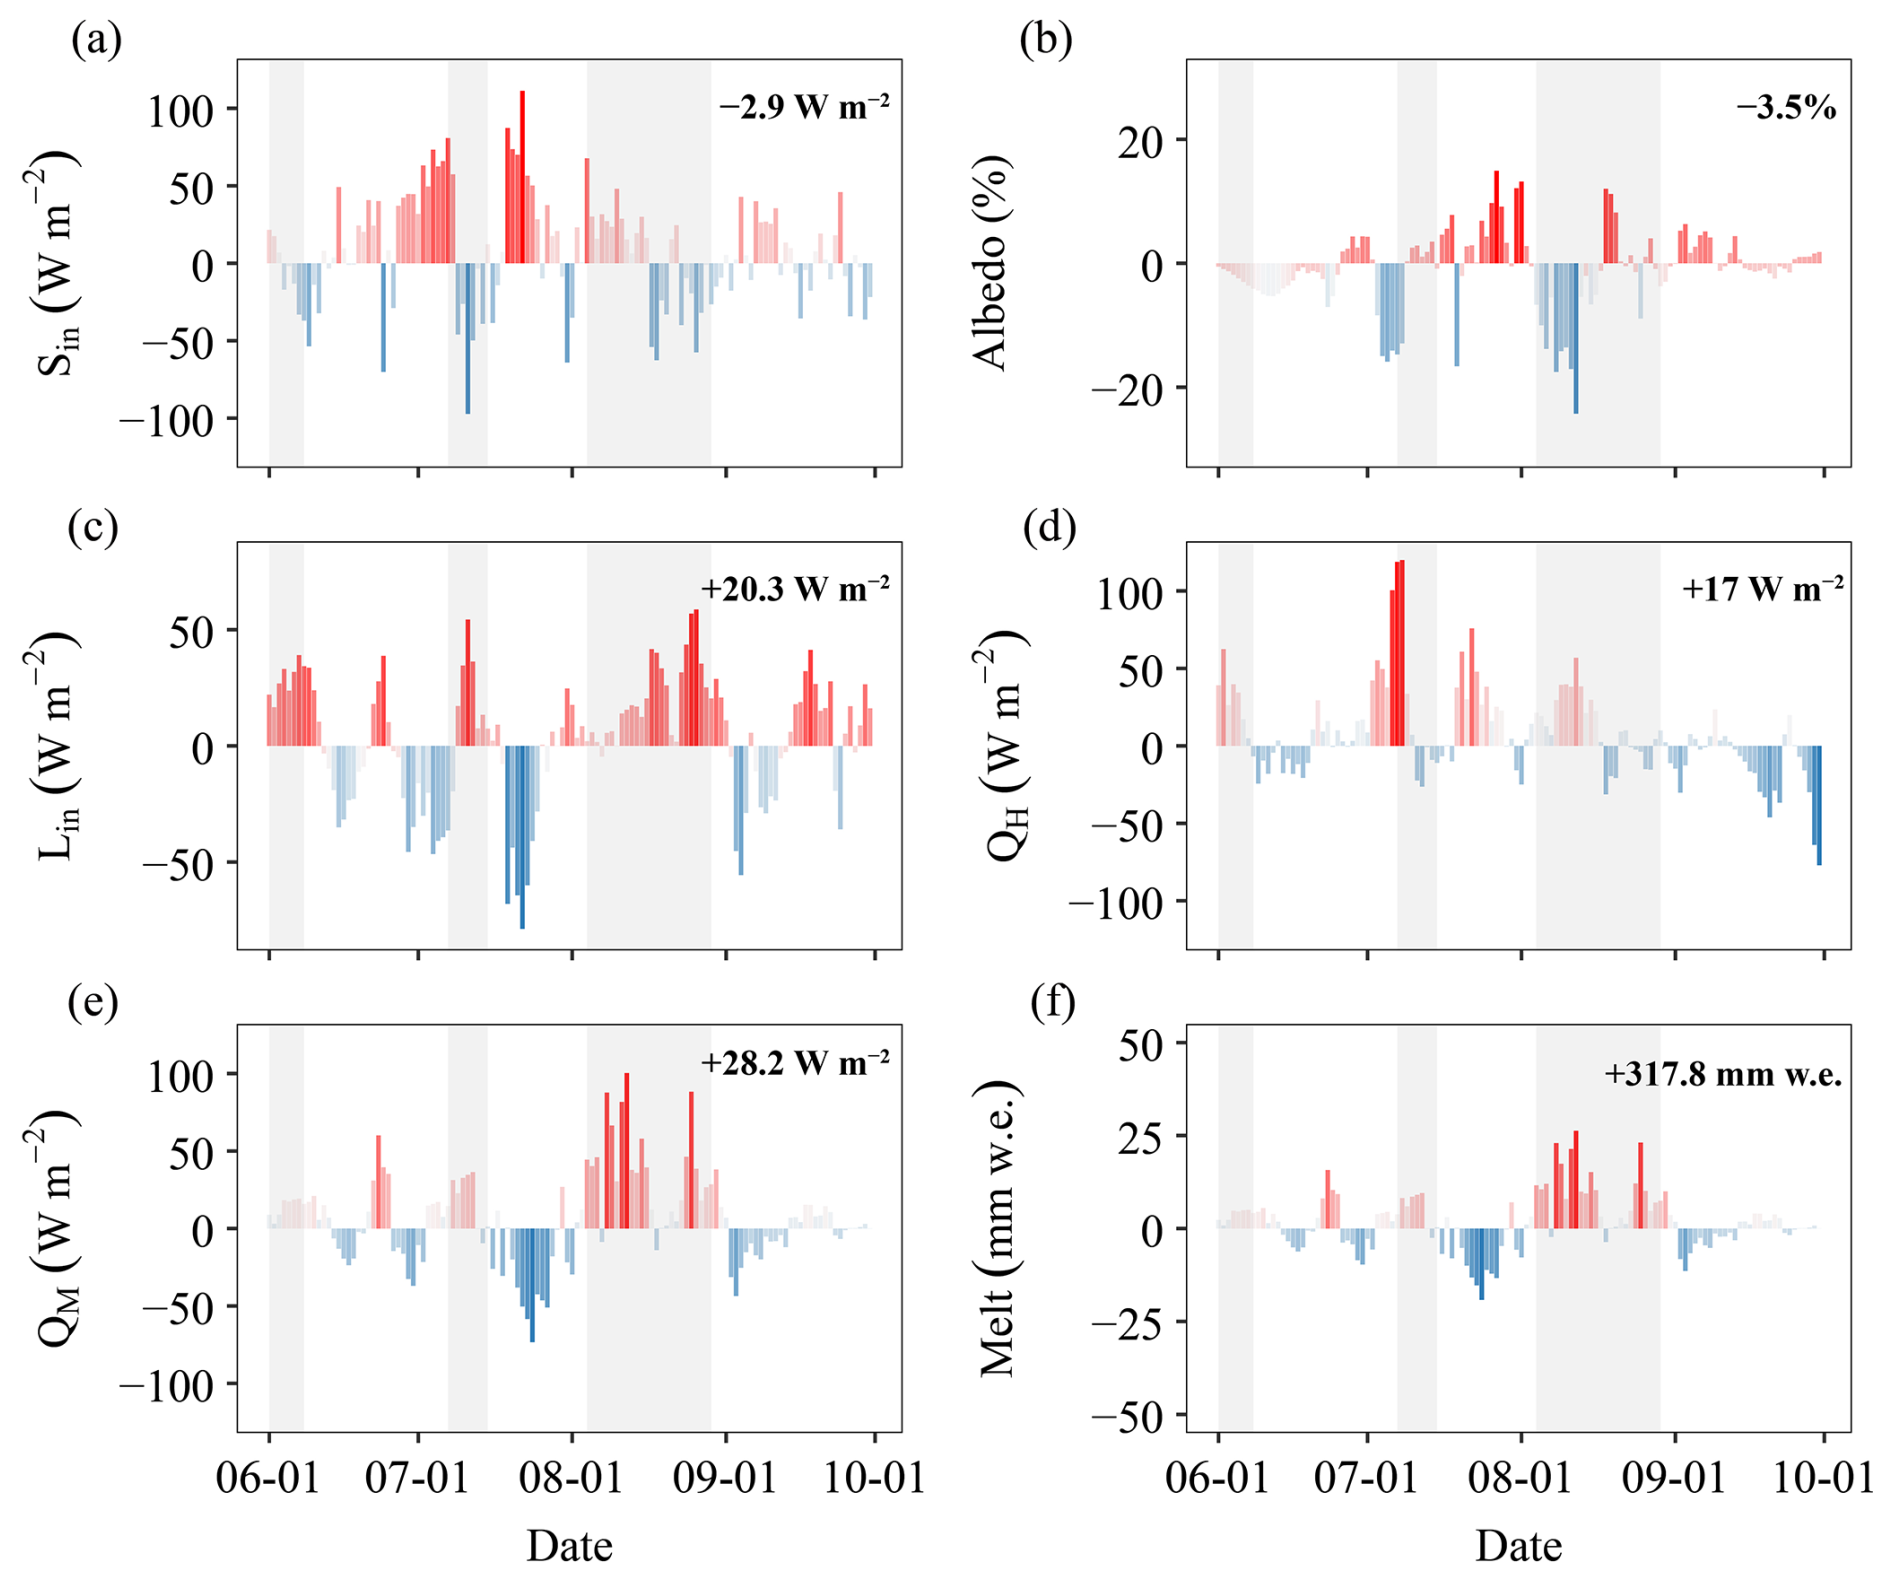
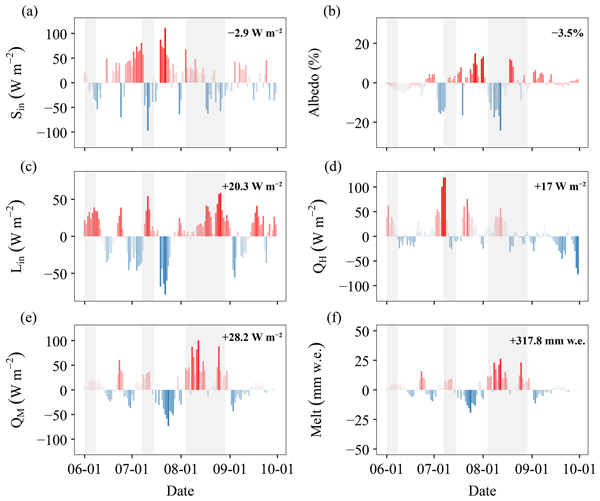
Figure 6Glacier-wide energy balance anomalies associated with extreme melt events. Anomalies in (a) incoming shortwave radiation, (b) albedo, (c) incoming longwave radiation, (d) sensible heat flux, (e) melt energy, and (f) melt amount are shown relative to the average of the June–September periods in 2019, 2020, and 2021. Gray shading indicates the three identified 2022 heatwave windows. The anomalies refer to these heatwave windows, not the entire June–September period.
Relative to the reference period (October 2019–September 2021), the extreme melt period was characterized by a 2.9 W m−2 decrease in Sin (Fig. 6a) and an 8.0 W m−2 reduction in Sout (Fig. S4a). The decline in Sout was primarily driven by a 3.5 % decrease in albedo (Fig. 6b), resulting in a Snet gain of 5.1 W m−2 (Fig. S4e). Longwave radiation components also exhibited substantial changes: Lin increased by 20.3 W m−2 (Fig. 6c), while Lout rose by 6.3 W m−2 (Fig. S4b). This led to a Lnet increase of 14.0 W m−2 (Fig. S4f). Although the increase in Lin was the largest single energy input (+20.3 W m−2), it was partly offset by the increase in Lout (+6.3 W m−2), so the net longwave contribution was +14.0 W m−2. Combined, the increases in Snet and Lnet contributed an additional 19.1 W m−2 to the total net radiation.
Regarding turbulent heat fluxes, QH showed a marked increase of 17.0 W m−2 (Fig. 6d), whereas QL decreased by 4.8 W m−2 (Fig. S4c). QG also declined by 3.1 W m−2 (Fig. S4d). These energy balance anomalies substantially enhanced the energy available for melt (Fig. S6e). A component-wise decomposition of this anomaly is provided in Tables S6 and S7. Table S6 lists the individual flux components, and Table S7 ranks their net contributions. In terms of net contribution to the +28.2 W m−2 melt energy anomaly, QH was the largest single term (+17.0 W m−2; 60.3 %), followed by Lnet (+14.0 W m−2; 49.7 %) and Snet (+5.1 W m−2; 18.1 %), with negative contributions from QL (−4.8 W m−2; −17.0 %) and QG (−3.1 W m−2; −11.0 %). The amplified Snet resulting from reduced albedo, combined with enhanced QH and Lnet due to warm air advection, ultimately led to the extreme melt during the heatwave. During the three identified heatwave windows (1–8 June, 7–15 July, and 4–29 August 2022), the average melt energy increased by 28.2 W m−2 relative to the reference period, resulting in an accumulated melt amount anomaly of 317.8 mm w.e.
Current research increasingly identifies energy balance anomalies as the principal driver of extreme glacier melt. Zhu et al. (2024) demonstrated that early 2022 springtime climatic extremes interacting with anomalous Sin and QH triggered exceptional melting on Sangqu Glacier. Thibert et al. (2018) reported record melt on Sarennes Glacier (French Alps) controlled by three factors: Sin anomalies, QL variations, and preseason snowpack conditions. Tian et al. (2023) further established that large-scale circulation patterns modulating cloud cover diurnal cycles induced extreme temperature anomalies in the eastern TP.
Our findings corroborate that energy balance anomalies, characterized primarily by QH amplification, Lnet enhancement, and albedo-driven Snet increase, were the primary drivers of glacier melt during the 2022 summer heatwave. The observed energy partitioning pattern, featuring synergistic radiative-turbulent flux interactions during these summer extreme events, aligns with documented mechanisms in both Alpine and TP glaciers (Thibert et al., 2018; Zhu et al., 2024).
5.4 Effects of Atmospheric Circulation on Extreme Glacier Melt and heat waves
Large-scale circulation anomalies can substantially influence changes in glacier mass balance over the TP and its surrounding regions by modulating regional air temperature and precipitation (Yao et al., 2012; Mölg et al., 2014). The Indian monsoon and the mid-latitude westerlies are the two dominant circulation systems affecting the plateau's climate. Our results indicate that the eastward extension and northward displacement of the SAH, together with near-neutral mid-latitude westerlies, formed the critical circulation background for the 2022 summer heatwave and the associated extreme glacier melt event.
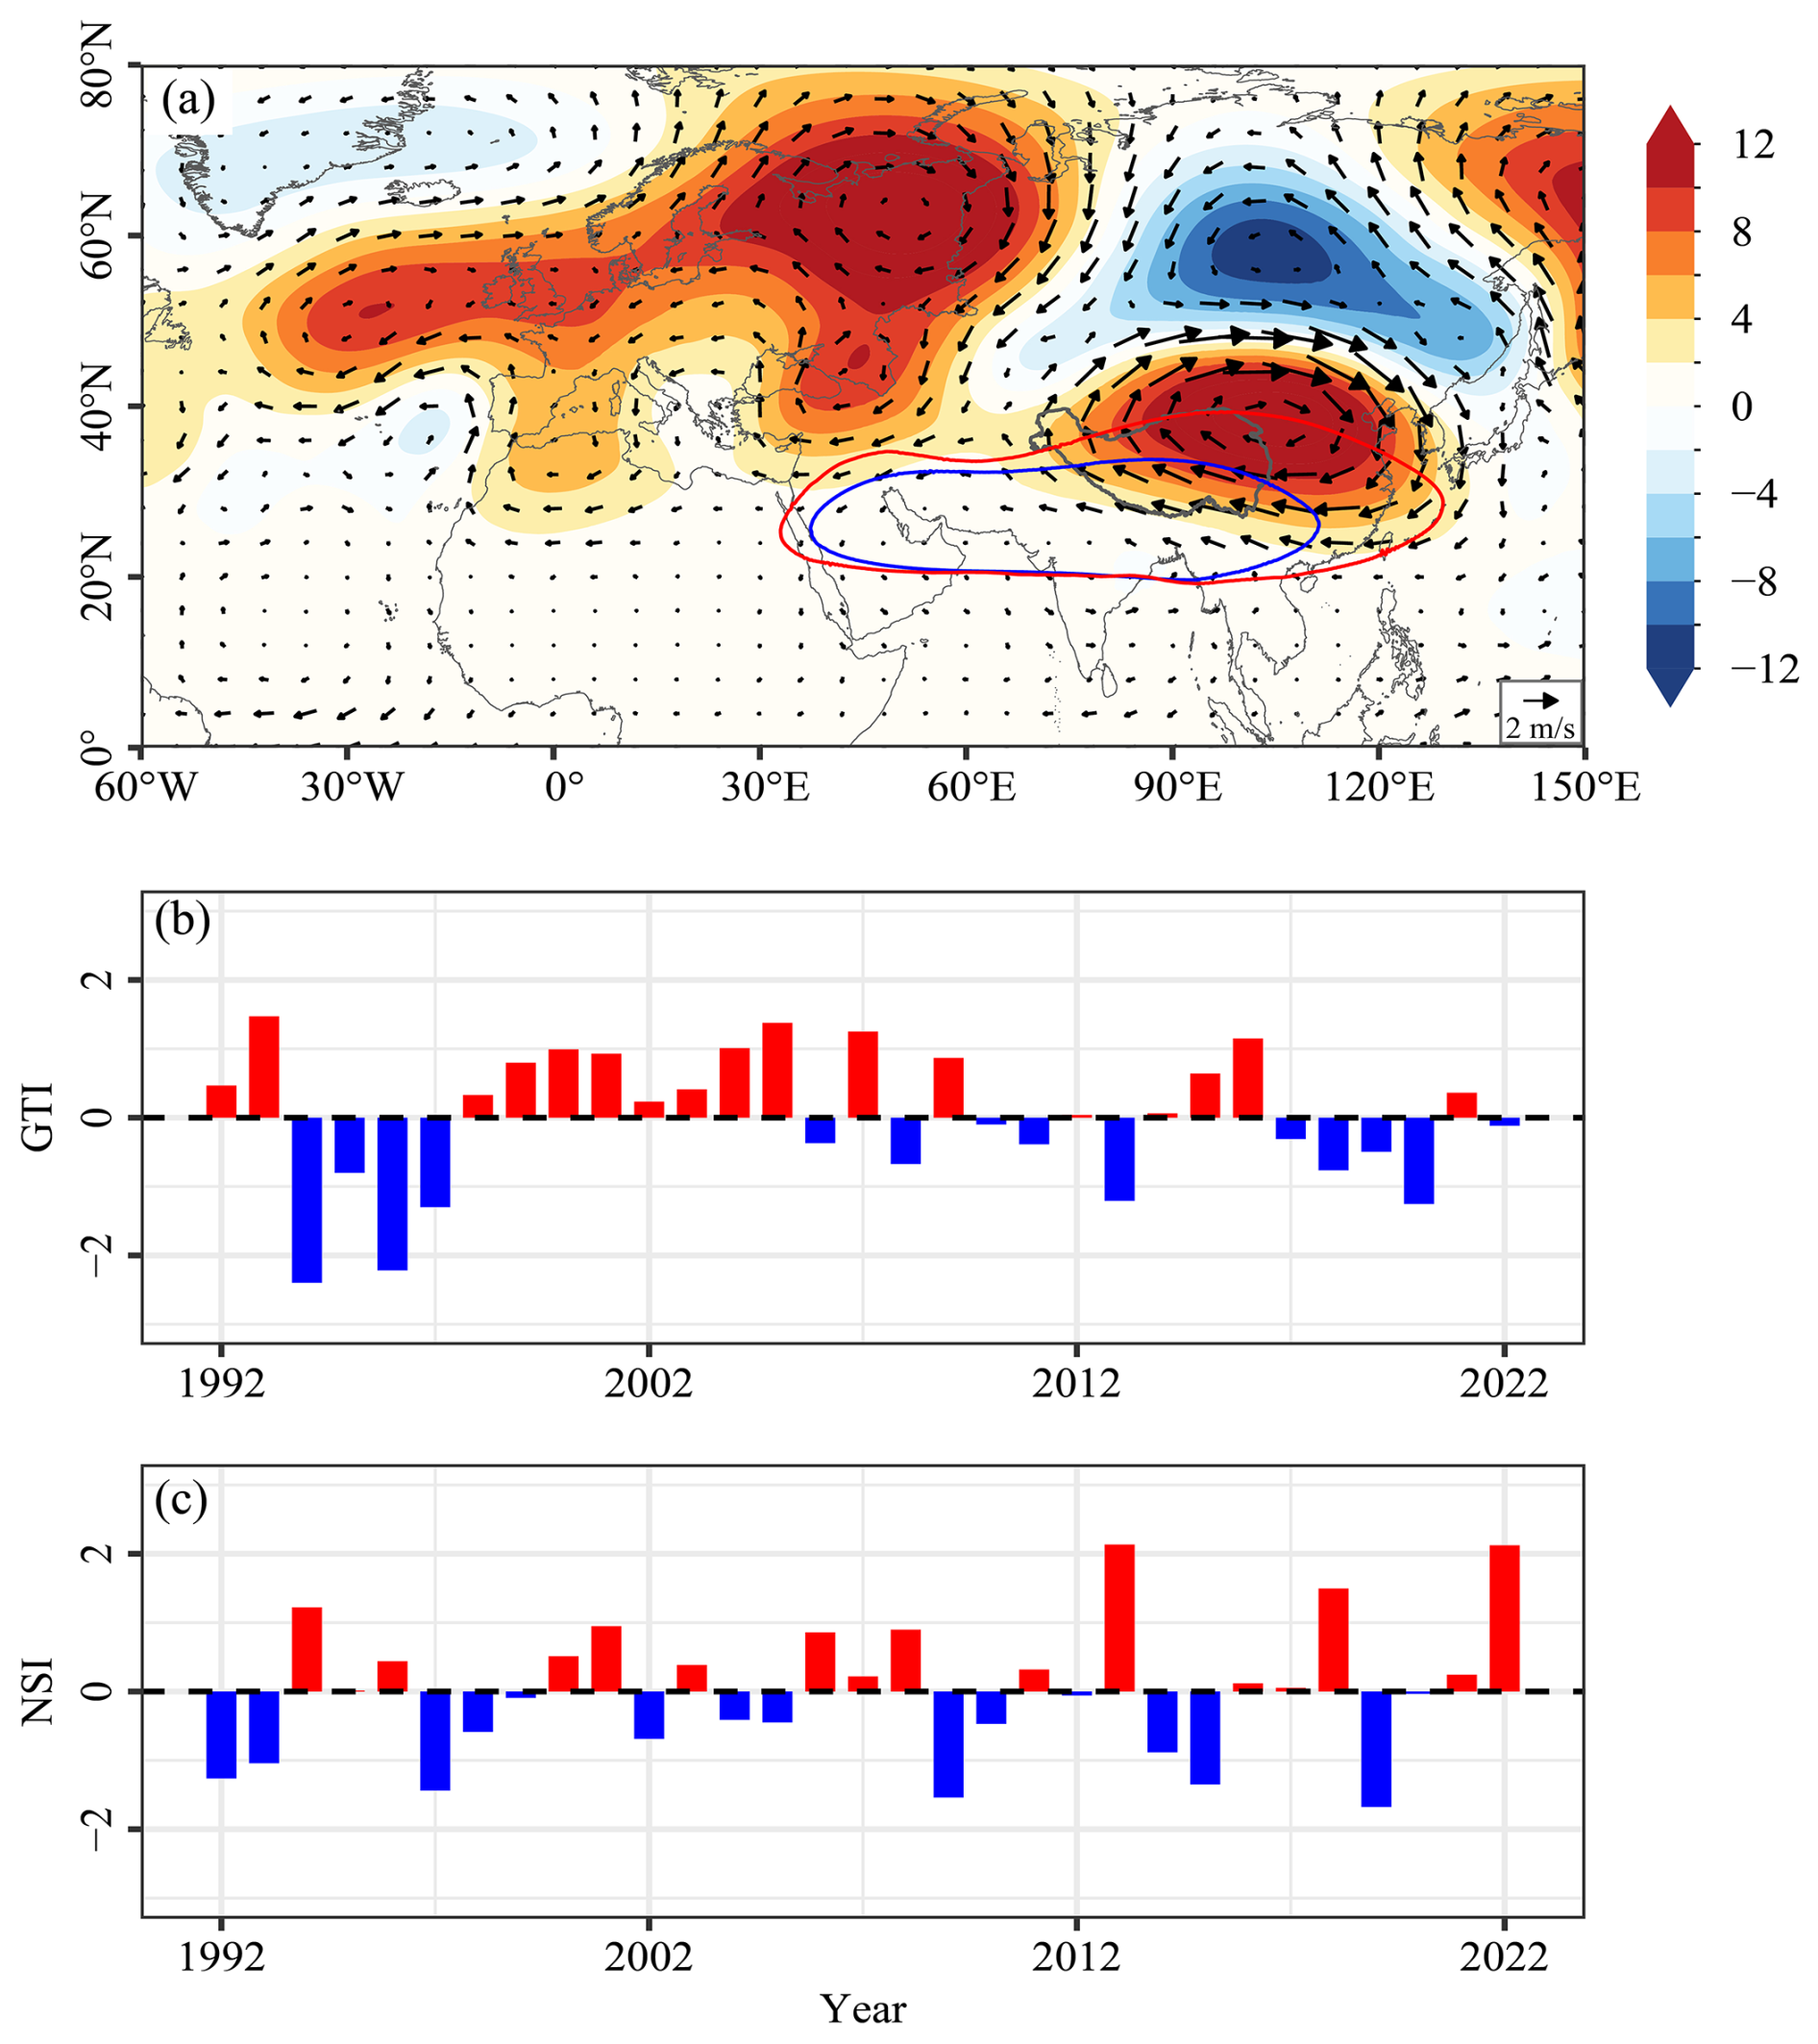
Figure 7(a) 200 hPa geopotential height anomalies (shading) and wind anomalies (vectors) during the 2022 summer heatwave, relative to the 1992–2021 climatology; blue and red contours denote the 12 520 gpm isolines for the 1992–2021 climatology and the summer of 2022, respectively, indicating the position and extent of the SAH. (b) Time series of the summer (June–August) GTI from 1992 to 2022; positive values represent enhanced mid-latitude westerly circulation, while negative values represent weakened westerly circulation. (c) Time series of the summer (June–August) NSI from 1992 to 2022; positive values indicate a northward shift of the SAH, and negative values indicate a southward shift.
Figure 7a presents the 200 hPa geopotential height and wind anomalies during the 2022 summer heatwave. Relative to the 1992–2021 climatology, an anomalous anticyclone dominated the TP and the regions to its east. The associated subsidence favored atmospheric warming, creating large-scale conditions conducive to the onset, persistence, and development of the heatwave. Meanwhile, the 12 520 gpm contour of the SAH extended markedly eastward in 2022, indicating a pronounced eastward shift and intensification of the SAH. As one of the most important upper-tropospheric circulation systems over the plateau and its surrounding regions, changes in the SAH's intensity and position can substantially regulate regional vertical motion and thermal structure.
During the same period, an anomalous anticyclone prevailed over Europe, while cyclonic anomalies occurred over the Mongolian Plateau, forming a clear cross-Eurasian circulation pattern (Fig. 7a). Jiang et al. (2024) demonstrated that low soil moisture over the TP can excite an equivalent barotropic anticyclone north of the plateau, which coincides with the subtropical westerly jet waveguide and initiates circumglobal Rossby waves propagating both westward and eastward, ultimately inducing synchronous extreme heatwaves over Europe and East Asia through enhanced downward solar radiation and adiabatic subsidence. Thus, the anomalous anticyclone over the TP in 2022 may not have been merely a local response but rather part of a planetary-scale teleconnection across Eurasia.
To quantify the effects of these circulation anomalies on the heatwave and extreme melt over the central TP, we analyzed the Global Wave Train Index (GTI) and the SAH north–south displacement index (NSI). Following Ding and Wang (2005), we defined the GTI as the standardized anomaly of the 200 hPa geopotential height averaged over 35–40° N, 60–70° E. To facilitate interpretation in the context of this study, we multiplied this index by −1 (see also Mölg et al., 2017) so that positive values correspond to enhanced mid-latitude westerlies and enhanced wave-train activity over Eurasia. This index has also been applied in previous studies examining the relationship between glacier mass balance and large-scale circulation over the TP and its surrounding regions (Zhu et al., 2024; Fan et al., 2026). Following Wei et al. (2012), NSI is calculated as the difference in mean 200 hPa geopotential height between a northern region (27.5–32.5° N, 50–100° E) and a southern region (22.5–27.5° N, 50–100° E), and then standardized. Positive values indicate a northward displacement of the SAH center and negative values a southward displacement. Figure 7b shows that the GTI in 2022 was −0.12, a value close to neutral, indicating near-normal rather than substantially weakened mid-latitude westerlies. This near-neutral GTI, combined with the strongly positive NSI, favored the persistence of high-pressure systems and reduced the southward transport of cold air from higher latitudes. Figure 7c shows that the NSI reached 2.12 in 2022, reflecting a pronounced northward shift of the SAH and enhanced anticyclonic control over the TP. This pronounced northward shift is consistent with the findings of Wang et al. (2024), who demonstrated that an intensified SAH, particularly when coupled with a weakened East Asian jet, significantly increases the frequency of summer high-temperature extremes over the TP. Thus, the anomalous NSI value in 2022 points to a circulation configuration that is statistically conducive to extreme heat. The combined effect of a near-neutral GTI and an anomalously northward-displaced SAH shaped the upper-level circulation during the 2022 summer heatwave. Through anomalous subsidence and tropospheric warming, this configuration created favorable conditions for the heatwave and the extreme glacier melt.
The statistical relationship between large-scale circulation and heatwave intensity over the central TP was further evaluated through Pearson correlation coefficients between summer (June–August) GTI, NSI, and SHI for 1992–2022 (Fig. 8). Based on ERA5 gridded data, GTI was generally negatively correlated with SHI across the central and eastern TP, whereas NSI was generally positively correlated with SHI (Fig. 8a, c). These patterns agree with observations at the Tuotuohe meteorological station, indicating that both circulation factors exert significant control on local heatwave intensity. Station observations confirmed these relationships: GTI was significantly negatively correlated with SHI (, p<0.05), while NSI was significantly positively correlated with SHI (R=0.42, p<0.05) (Fig. 8b, d). In 2022, a near-neutral GTI, a strongly positive NSI, and high SHI values occurred simultaneously, suggesting that the heatwave was associated with a strongly northward-displaced SAH rather than with weakened mid-latitude westerlies. The consistency between gridded and station data further highlights the significance and statistical robustness of the 2022 circulation anomalies.
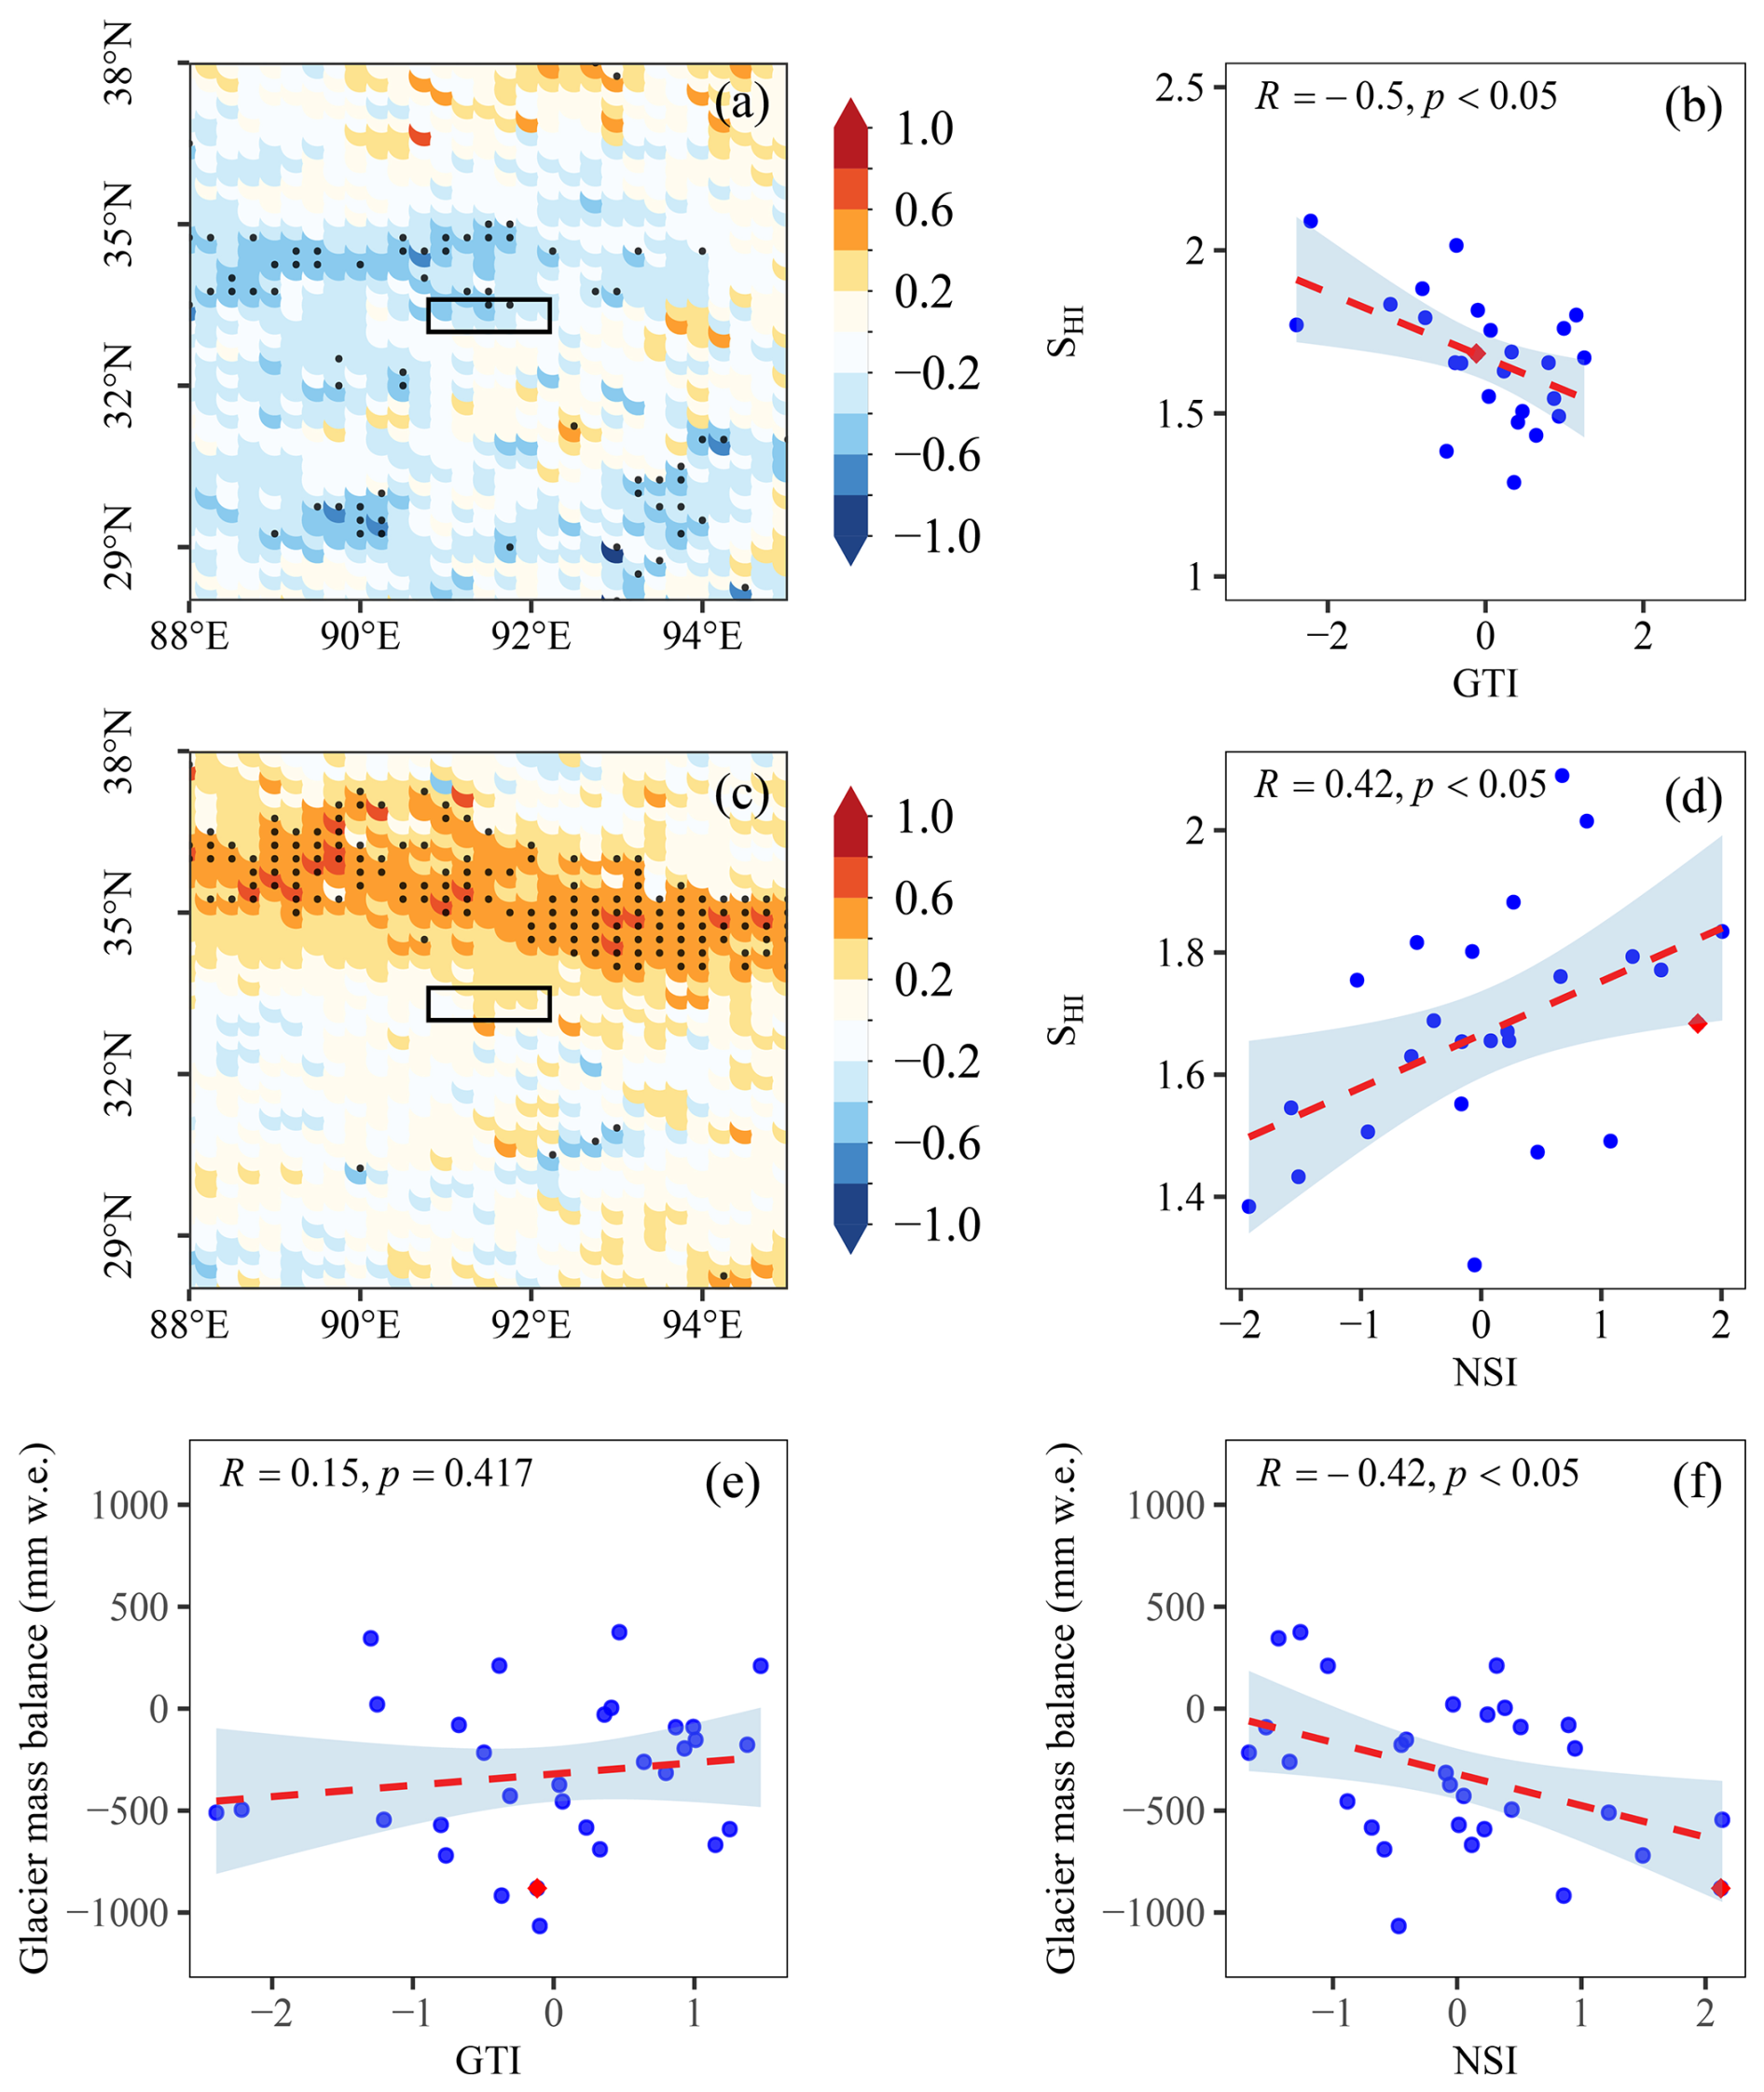
Figure 8Correlations between GTI, NSI and SHI during June–August. (a, c) Spatial distribution of correlation coefficients of GTI and NSI with SHI based on ERA5 gridded data for 1992–2022; stippling indicates statistical significance (p<0.05). (b, d) Scatter plots and correlation coefficients between GTI/NSI and the SHI calculated from the Tuotuohe meteorological station for 1992–2022. (e, f) Scatter plots and correlation coefficients between the raw (non-detrended) summer GTI/NSI and the Xiao Dongkemadi mass balance record, the longest continuous mass balance series in the central TP, over the overlapping period 1992–2023. In (b), (d), (e), (f), the red diamond marks 2022.
We further examined the uniqueness of this circulation configuration by comparing 2022 with the non-extreme years of 2020 and 2021 using the indices shown in Fig. 7 and Table S5. The NSI in 2022 reached 2.12, comparable to the 2013 value of 2.13 and much higher than in 2020 (−0.03) and 2021 (0.24). This indicates a strongly northward-displaced SAH in 2022, although a similar NSI magnitude also occurred in 2013. However, the GTI in 2013 was strongly negative (−1.21), whereas in 2022 it was only slightly negative (−0.12), indicating different mid-latitude westerly conditions between the two years.
In terms of the GTI, 2022 was negative (−0.12), whereas 2021 showed a positive value (0.36). Notably, 2020 exhibited the most negative GTI (−1.25) among the three years, yet its SHI (1.67) remained lower than that of 2022 (1.78), because its NSI was also negative (−0.03), indicating no northward shift of the SAH. Similarly, although the ERA5-based SHI for 2021 (1.86) slightly exceeded that of 2022 (1.78), the Tuotuohe meteorological station SHI for 2021 (1.29) was substantially lower than in 2022 (1.68). More importantly, the NSI in 2021 (0.24), like that in 2020 (−0.03), remained much lower than in 2022 (2.12), indicating that in neither non-extreme year did the SAH exhibit such a strong northward displacement. Nevertheless, because the 2013 NSI was comparable, the 2022 extremity cannot be attributed to the NSI alone. Notably, although the NSI in 2013 was comparable to that in 2022, the GTI differed substantially (−1.21 in 2013 vs. −0.12 in 2022). This further indicates that the 2022 extreme melt cannot be attributed to the NSI alone, but likely resulted from the combined effect of multiple circulation factors. Collectively, these comparisons demonstrate that the extremity of 2022 cannot be attributed to weakened westerlies alone; instead, it arose from the synergistic combination of a near-neutral GTI and a strongly positive NSI.
To further test the linkage between large-scale circulation and glacier mass balance, we correlated the raw (non-detrended) summer NSI and GTI with the Xiao Dongkemadi mass balance record, the longest continuous mass balance series in the central TP, over the overlapping period 1992–2023. The NSI was significantly negatively correlated with mass balance (, p<0.05), whereas the GTI showed no significant correlation (R=0.15, p=0.417). These results support the role of the SAH in modulating glacier mass balance on the central TP, while also indicating that the 2022 extreme melt involved additional circulation and surface energy balance anomalies.
These large-scale circulation anomalies also influenced the heatwave through land-surface processes. During the summer heatwave, increased cloud cover and enhanced downward longwave radiation promoted near-surface warming (Fig. S7a–c). This warming was accompanied by higher soil temperatures and enhanced evapotranspiration, which reduced soil moisture (Fig. S7e, f). However, soil drying may not simply be a passive response to atmospheric forcing; through land–atmosphere interactions, it may in turn modulate the atmospheric circulation. In addition, a drier land surface enhances outgoing sensible heat flux (Fig. S7d), warming the troposphere and favoring the maintenance of anomalous high-pressure systems (Jiang et al., 2023). This process provides local thermodynamic conditions for the persistence of heatwaves. Therefore, large-scale circulation anomalies may not only directly trigger heatwaves but also prolong and intensify them through a positive feedback involving soil drying, enhanced sensible heating, and high-pressure maintenance (Gui et al., 2024).
An increasing number of studies have shown that large-scale circulation anomalies are important external drivers of extreme glacier mass loss, affecting both surface energy balance and mass balance. Regarding the energy balance, Zhu et al. (2024) found that clear-sky conditions under anomalous anticyclonic control can enhance incoming shortwave radiation. Simultaneously, higher air temperatures and drier soils can increase sensible heat flux, jointly providing additional energy for glacier melt. In terms of mass balance, warming can shift precipitation from snow to rain, weakening the role of fresh snow in maintaining high glacier albedo. Reduced albedo subsequently increases shortwave radiation absorption and accelerates mass loss (Zhu et al., 2018). In addition, circulation-induced reductions in moisture transport and precipitation can further limit snow accumulation during the melt season, exacerbating albedo decline and glacier mass loss (Luo et al., 2026). Together, these studies reveal the mechanisms through which large-scale circulation anomalies drive extreme glacier mass loss.
These findings are consistent with our results on the anomalous circulation configuration and the associated extreme melt in 2022, and they support the proposed mechanism whereby a near-neutral GTI, SAH anomalies, and local energy balance anomalies collectively cause extreme glacier melt. In summary, the extreme glacier ablation during the 2022 summer heatwave was not driven by a single circulation factor. Instead, it resulted from the combined effects of a near-neutral GTI and the anomalous northward and eastward extension of SAH.
This circulation configuration may have been maintained through planetary-scale teleconnections across Eurasia and further amplified through coupling with soil moisture, sensible heat flux, and radiative processes. These interactions ultimately produced pronounced anomalies in glacier surface energy and mass balance. Our findings advance the understanding of how large-scale circulation affects glacier mass balance over the TP (Yao et al., 2012; Mölg et al., 2014; Zhou et al., 2025; Zhu et al., 2026b) and demonstrate that studies of extreme glacier melt should consider the coordinated effects of tropical and extratropical circulation systems, as well as their coupling with local land-surface processes.
6.1 Comparison with extreme glacier mass loss events in other regions
Extreme mass loss events have been observed across diverse mountain glaciers, including the Swiss and Austrian Alps (Cremona et al., 2023; Voordendag et al., 2023; van Tiel et al., 2026), Svalbard (Bernard and Friedt, 2025), the Pyrenees (Izagirre et al., 2024), the Tien Shan (Xu et al., 2024), western North America (Menounos et al., 2025), the central TP (Zhu et al., 2024), and New Zealand (Vargo et al., 2020). In the Swiss Alps, 2022 mass loss exceeded the 1991–2020 average by more than threefold, with meltwater compensating for precipitation deficits in basins with ∼15 % glacier cover (van Tiel et al., 2026). The Pyrenees lost nearly 40 % of their glacier area between 2020 and 2023, with thinning rates triple those of the previous decade (Izagirre et al., 2024). Western North American glaciers lost 12 % of their mass during 2021–2024, double the rate of 2010–2020 (Menounos et al., 2025). Central TP glaciers experienced anomalous early spring melting, typically part of the accumulation season (Zhu et al., 2024).
These events share common drivers. Anomalous large-scale circulation, such as a weakened and northward-shifted westerly jet, creates conditions for persistent warmth (Zhu et al., 2024). Record summer heatwaves, often combined with winter snow deficits, provide ample melt energy (Menounos et al., 2025; Xu et al., 2024). This is reflected in increased incoming shortwave radiation and enhanced sensible heat flux (Thibert et al., 2018). The resulting earlier snowmelt exposes darker ice, reducing albedo and amplifying melt – a feedback loop further intensified by impurities like black carbon or dust (Menounos et al., 2025; van Tiel et al., 2026). Liquid precipitation can destabilize snowpack, lengthening the melt season (Bernard and Friedt, 2025), while winter snow deficits advance ice exposure (Voordendag et al., 2023). Attribution studies confirm that anthropogenic warming has made such extreme years significantly more likely (Vargo et al., 2020). These findings highlight the urgent need for systematic research into the increasing frequency of extreme glacier melt events and their downstream hydrological and hazard implications.
6.2 Research Limitations
While this study integrates multi-source data with an energy-mass balance model to reveal the extreme melting processes and mechanisms of the Sangqu Glacier on the central TP driven by the 2022 summer heatwave, several limitations warrant further investigation.
The AWS was deployed at only a single elevation point (5700 m a.s.l.) on the glacier surface, which is closer to the lower–middle part of the glacier (elevation range 5400–6104 m) and may not fully represent conditions in the upper glacier. This results in spatiotemporal gaps that make spatial extrapolation of meteorological variables a primary source of model uncertainty. We used parameterization schemes such as temperature lapse rates and precipitation gradients to extrapolate point-scale observations to the entire glacier and conducted sensitivity analyses. However, this simplified approach cannot fully capture the spatiotemporal heterogeneity of meteorological variables under complex terrain conditions, which may introduce uncertainty especially during extreme weather and climate events. Other studies have also indicated that even with physically robust energy balance models, spatial extrapolation of meteorological variables remains a major source of model uncertainty requiring multi-source data constraints (Kinnard et al., 2022). In addition, the use of a single AWS to drive the distributed model assumes spatially uniform wind speed and relative humidity across the glacier. While this simplification follows common practice in data-scarce mountain environments, it may not fully capture local topographic effects on wind fields. However, our sensitivity analysis indicates that the resulting uncertainty in annual mass balance is minor relative to the observed mass loss (Sect. 4.2). Moreover, logistical challenges on the TP, such as power failures and harsh environmental conditions, persistently hamper field data continuity. We used observational data as much as possible to constrain the model and used the 2021/22 mass balance observations from the adjacent Xiao Dongkemadi Glacier as independent regional corroboration. We did not apply explicit seasonal bias correction to the downscaled ERA5 data. However, validation for the ablation season (Fig. S5) shows good agreement with observations, suggesting minimal seasonal bias during summer. Nevertheless, this simplification may introduce uncertainties under extreme conditions and should be addressed in future work. Additionally, while we used a random forest method to statistically downscale ERA5 reanalysis data, the inherent errors of the downscaling model were not incorporated into the final uncertainty assessment, a factor that could be significant under extreme climatic anomalies.
A further limitation concerns the meteorological forcing for August–September 2022. AWS measurements ended in July 2022, whereas the longest heatwave of the summer (4–29 August) occurred entirely during the period reconstructed from Random Forest-downscaled ERA5 data. Consequently, the meteorological forcing and simulated melt during this period could not be directly validated against concurrent on-glacier observations. The model was calibrated and evaluated using all available AWS and mass balance observations before July 2022, which supports its performance under observed conditions; nevertheless, this does not constitute direct validation under the anomalous conditions of August–September 2022. The reconstructed melt for this period should therefore be interpreted as the best model-based estimate under the available data constraints. In addition, uncertainty from the Random Forest downscaling was not explicitly propagated into the final mass balance uncertainty. This omission may be particularly important during extreme climatic anomalies and should be addressed through ensemble downscaling or other uncertainty-propagation approaches in future work. Importantly, the conclusion of extreme mass loss in 2021/22 is independently supported by in-situ observations from the neighbouring Xiao Dongkemadi Glacier (Zhu et al., 2026a) and by satellite remote sensing products (Dussaillant et al., 2025), which consistently show a strongly anomalous signal over the Sangqu Glacier region.
Another limitation concerns the short length of the Sangqu mass balance record (only three years), which precludes the independent derivation of extreme thresholds from the glacier's own data. As explicitly stated in Sect. 5.2, our dual-threshold framework is used as a diagnostic aid rather than the primary evidence of extremity, and the k values transferred from Xiao Dongkemadi serve to provide a consistent reference rather than statistical independence. Nevertheless, the associated uncertainty should be borne in mind when interpreting the absolute classification.
While the EBFM performs well at the glacier-wide scale, discrepancies are evident at finer scales (point and seasonal), reflecting inherent challenges of distributed glacier modeling under data-scarce conditions. These deviations arise from spatial extrapolation of meteorological variables using simplified lapse rates and gradients, parameterization uncertainty (with albedo and temperature lapse rate being the most sensitive parameters), scale mismatch between point stakes and grid-cell averages, and observational uncertainties in density assumptions and stake height readings. In addition, the model assumes fixed glacier geometry and does not account for the effects of area retreat or surface lowering on mass balance. However, for a short-term (three-year) study, this simplification has a negligible impact, as glacier area and surface elevation changes over such a brief period are minimal.
The EBFM employed in this study has been validated at multiple scales, but its calibration of key parameters, including snow/ice albedo, turbulent exchange coefficients, and precipitation gradients, relies on limited observational data. This introduces uncertainties in the key parameterization schemes and may affect the model's extrapolation capability under extreme conditions. Studies in other regions have shown that different combinations of parameterization schemes can lead to considerable differences in the simulated individual energy flux components while having a relatively smaller impact on total melting energy, suggesting that total melt is less sensitive to different parameterization schemes than the individual flux components themselves (Draeger et al., 2024). This finding is consistent with the results of our sensitivity analysis. Nevertheless, our uncertainty assessment through parameter perturbation may still not fully capture the nonlinearities inherent in heatwave-driven processes. Additionally, the model does not account for snow redistribution processes such as wind-driven transport and avalanches, which may influence the spatial distribution of mass balance, particularly in complex terrain. Furthermore, the model does not account for penetrating shortwave radiation within the glacier, which may introduce uncertainty in simulating englacial temperatures (Mölg et al., 2008; Wheler and Flowers, 2011). However, because this study focuses on surface energy balance and total melt, and because bare-ice surface temperatures remain near the melting point during the ablation season, this simplification has limited impact on our total melt estimates. It should, however, be considered when analyzing englacial thermal conditions and processes such as meltwater refreezing in future work.
This study focused on Sangqu Glacier on the central TP, which is situated at the confluence of the mid-latitude westerlies and the Indian monsoon. Consequently, the regional generalizability of our findings requires broader validation. Glacier sensitivity to climatic anomalies varies markedly across the TP, from the humid southeast to the arid northwest (Yao et al., 2012; Zhu et al., 2018). Whether the extreme melt mechanism identified here, driven primarily by enhanced sensible heat flux, increased net longwave radiation, and increased net shortwave radiation associated with reduced albedo, can be directly extended to other glacier types remains to be examined through similar studies in more representative sub-regions. Future research should strengthen multi-glacier collaborative observation networks and integrate high-resolution regional climate modeling to deepen our understanding of extreme melt mechanisms across diverse climatic regimes.
This study integrated in-situ glacio-meteorological observations from Sangqu Glacier with a surface energy–mass balance model to elucidate the mechanisms driving extreme glacier melt during the 2022 summer heatwave. To overcome the challenge of identifying extreme mass loss from short-term records, we developed a dual-threshold framework based on the mean and standard deviation. This approach effectively identifies extreme events in data-scarce regions, providing a robust diagnostic tool that circumvents the traditional requirement for decadal observational series.
Our findings reveal that the 2021/22 mass balance year experienced exceptionally negative mass loss within the study period. During the 2022 summer heatwave, glacier melt was 1.66 and 1.69 times higher than in the corresponding periods of 2019/20 and 2020/21, respectively, corresponding to an increase of 317.8 mm w.e. This extreme melt was driven by synergistic anomalies in the surface energy balance, primarily enhanced sensible heat flux (+17.0 W m−2; 60.3 %), increased net longwave radiation (+14.0 W m−2; 49.7 %), and increased net shortwave radiation (+5.1 W m−2; 18.1 %) associated with reduced albedo that further amplified the melt through positive feedback. These local-scale drivers were modulated by large-scale atmospheric circulation patterns, characterized by the eastward extension and northward displacement of the South Asian High, together with near-neutral mid-latitude westerlies.
In summary, this study improves our understanding of glacier mass balance responses to extreme weather and climate events on the central TP. The findings highlight the critical role of glacier surface energy balance anomalies in driving extreme melt during heatwaves and emphasize the importance of large-scale atmospheric circulation anomalies. This study has certain limitations, mainly including the limited spatial representativeness due to single-point meteorological observations and the omission of feedback effects from dynamic glacier geometry changes on mass balance. Future research should conduct detailed in-situ observations of glacier surface micrometeorology, mass balance, and runoff across different climatic zones on the TP to further elucidate the mechanisms of extreme melt during summer heatwaves and their impacts on hydrological processes, thereby providing a scientific basis for water resource management and hazard risk assessment.
Meteorological data from the Tuotuohe meteorological station were obtained from the National Oceanic and Atmospheric Administration (https://www.noaa.gov, last access: 8 November 2026). ERA5 data are available from the Copernicus Climate Change Service (C3S) Climate Data Store (CDS) at https://doi.org/10.24381/cds.adbb2d47 (single-level data; Copernicus Climate Change Service, 2023a) and https://doi.org/10.24381/cds.bd0915c6 (pressure-level data; Copernicus Climate Change Service, 2023b). The EBFM model is available via https://github.com/wardvp/EBFM-glacier.git (last access: 8 November 2026). Data supporting the findings of this study are available from the corresponding author upon reasonable request.
The supplement related to this article is available online at https://doi.org/10.5194/hess-30-6983-2026-supplement.
All authors contributed to the study conception and design. Data collection was performed by FZ. Analysis was performed by FZ, MZ and LA. The first draft of the manuscript was written by FZ and all authors commented on previous versions of the manuscript. All authors read and approved of the final manuscript.
The contact author has declared that none of the authors has any competing interests.
Publisher's note: Copernicus Publications remains neutral with regard to jurisdictional claims made in the text, published maps, institutional affiliations, or any other geographical representation in this paper. The authors bear the ultimate responsibility for providing appropriate place names. Views expressed in the text are those of the authors and do not necessarily reflect the views of the publisher.
We thank the editor and anonymous reviewers for their constructive feedback on the manuscript, which led to substantial improvements during the review process.
This study is jointly funded by the Second Tibetan Plateau Scientific Expedition and Research Program (grant no. 2024QZKK0400) and the Science and Technology Project of the Xizang Autonomous Region (grant nos. XZ202501ZY0081 and XZ202501JD0025).
This paper was edited by Jan Seibert and reviewed by three anonymous referees.
Bernard, É. and Friedt, J.-M.: Did a global heatwave have a lasting impact on the snowpack and the annual glacier mass balance? The example of a small glacial basin observatory in the High Arctic (Brøgger Peninsula, Spitsbergen), Arct. Antarct. Alp. Res., 57, 2479899, https://doi.org/10.1080/15230430.2025.2479899, 2025.
Bhattacharya, A., Bolch, T., Mukherjee, K., King, O., Menounos, B., Kapitsa, V., Neckel, N., Yang, W., and Yao, T.: High Mountain Asian glacier response to climate revealed by multi-temporal satellite observations since the 1960s, Nat. Commun., 12, 4133, https://doi.org/10.1038/s41467-021-24180-y, 2021.
Bintanja, R. and Van Den Broeke, M. R.: The surface energy balance of antarctic snow and blue ice, J. Appl. Meteorol. Climatol., 34, 902–926, https://doi.org/10.1175/1520-0450(1995)034<0902:TSEBOA>2.0.CO;2, 1995.
Bolch, T., Kulkarni, A., Kääb, A., Huggel, C., Paul, F., Cogley, J. G., Frey, H., Kargel, J. S., Fujita, K., Scheel, M., Bajracharya, S., and Stoffel, M.: The State and Fate of Himalayan Glaciers, Science, 336, 310–314, https://doi.org/10.1126/science.1215828, 2012.
Bougamont, M., Bamber, J. L., and Greuell, W.: A surface mass balance model for the Greenland Ice Sheet, J. Geophys. Res.-Earth Surf., 110, https://doi.org/10.1029/2005JF000348, 2005.
Brun, F., Berthier, E., Wagnon, P., Kääb, A., and Treichler, D.: A spatially resolved estimate of High Mountain Asia glacier mass balances from 2000 to 2016, Nat. Geosci., 10, 668–673, https://doi.org/10.1038/ngeo2999, 2017.
Brunt, D.: Notes on radiation in the atmosphere. I, Q. J. Roy. Meteor. Soc., 58, 389–420, https://doi.org/10.1002/qj.49705824704, 1932.
Chen, J., Xue, X., and Du, W.: Short communication: Extreme glacier mass loss triggered by high temperature and drought during hydrological year 2022 / 2023 in Qilian Mountains, Res. Cold Arid Reg., 16, 1–4, https://doi.org/10.1016/j.rcar.2024.01.002, 2024.
Copernicus Climate Change Service: ERA5 hourly data on single levels from 1940 to present, Copernicus Climate Change Service (C3S) Climate Data Store (CDS) [data set], https://doi.org/10.24381/cds.adbb2d47 (last access: 8 November 2026), 2023a.
Copernicus Climate Change Service: ERA5 hourly data on pressure levels from 1940 to present, Copernicus Climate Change Service (C3S) Climate Data Store (CDS) [data set], https://doi.org/10.24381/cds.bd0915c6 (last access: 8 November 2026), 2023b.
Cremona, A., Huss, M., Landmann, J. M., Borner, J., and Farinotti, D.: European heat waves 2022: contribution to extreme glacier melt in Switzerland inferred from automated ablation readings, The Cryosphere, 17, 1895–1912, https://doi.org/10.5194/tc-17-1895-2023, 2023.
Deb, K., Pratap, A., Agarwal, S., and Meyarivan, T.: A fast and elitist multiobjective genetic algorithm: NSGA-II, IEEE T. Evol. Comput., 6, 182–197, https://doi.org/10.1109/4235.996017, 2002.
Ding, Q. and Wang, B.: Circumglobal teleconnection in the northern hemisphere summer, J. Climate, 18, 3483–3505, https://doi.org/10.1175/JCLI3473.1, 2005.
Draeger, C., Radić, V., White, R. H., and Tessema, M. A.: Evaluation of reanalysis data and dynamical downscaling for surface energy balance modeling at mountain glaciers in western Canada, The Cryosphere, 18, 17–42, https://doi.org/10.5194/tc-18-17-2024, 2024.
Duan, J., Zhang, H., Jian, D., Xiao, C., Hao, F., Zhu, H., Lott, F. C., and Stott, P. A.: Influences of Anthropogenic Forcing on the Exceptionally Warm August 2022 over the Eastern Tibetan Plateau, B. Am. Meteorol. Soc., 105, E1068–E1073, https://doi.org/10.1175/BAMS-D-23-0179.1, 2024.
Duan, Q., Sorooshian, S., and Gupta, V.: Effective and efficient global optimization for conceptual rainfall-runoff models, Water Resour. Res., 28, 1015–1031, https://doi.org/10.1029/91WR02985, 1992.
Dussaillant, I., Hugonnet, R., Huss, M., Berthier, E., Bannwart, J., Paul, F., and Zemp, M.: Annual mass change of the world's glaciers from 1976 to 2024 by temporal downscaling of satellite data with in situ observations, Earth Syst. Sci. Data, 17, 1977–2006, https://doi.org/10.5194/essd-17-1977-2025, 2025.
Fan, Y., Xie, Y., He, Y.-F., He, Z., Wang, P.-L., and Yang, W.: Unprecedented 2025 glacier mass loss in pamir, Adv. Clim. Change Res., S1674927826001152, https://doi.org/10.1016/j.accre.2026.04.018, 2026.
Fujita, K., Seko, K., Ageta, Y., Jianchen, P., and Tandong, Y.: Superimposed ice in glacier mass balance on the Tibetan Plateau, J. Glaciol., 42, 454–460, https://doi.org/10.3189/S0022143000003440, 1996.
Gao, H., He, X., Ye, B., and Pu, J.: Modeling the runoff and glacier mass balance in a small watershed on the Central Tibetan Plateau, China, from 1955 to 2008, Hydrol. Process., 26, 1593–1603, https://doi.org/10.1002/hyp.8256, 2012.
Gui, K., Zhou, T., Zhang, W., and Zhang, X.: Land-atmosphere coupling amplified the record-breaking heatwave at altitudes above 5000 meters on the Tibetan Plateau in July 2022, Weather Clim. Extremes, 45, 100717, https://doi.org/10.1016/j.wace.2024.100717, 2024.
Guo, W., Liu, S., Xu, J., Wu, L., Shangguan, D., Yao, X., Wei, J., Bao, W., Yu, P., Liu, Q., and Jiang, Z.: The second Chinese glacier inventory: data, methods and results, J. Glaciol., 61, 357–372, https://doi.org/10.3189/2015JoG14J209, 2015.
Hock, R.: Temperature index melt modelling in mountain areas, J. Hydrol., 282, 104–115, https://doi.org/10.1016/S0022-1694(03)00257-9, 2003.
Hock, R. and Holmgren, B.: A distributed surface energy-balance model for complex topography and its application to Storglaciären, Sweden, J. Glaciol., 51, 25–36, https://doi.org/10.3189/172756505781829566, 2005.
Hoffmann, L., Günther, G., Li, D., Stein, O., Wu, X., Griessbach, S., Heng, Y., Konopka, P., Müller, R., Vogel, B., and Wright, J. S.: From ERA-Interim to ERA5: the considerable impact of ECMWF's next-generation reanalysis on Lagrangian transport simulations, Atmos. Chem. Phys., 19, 3097–3124, https://doi.org/10.5194/acp-19-3097-2019, 2019.
Hua, W., Dai, A., Qin, M., Hu, Y., and Cui, Y.: How Unexpected Was the 2022 Summertime Heat Extremes in the Middle Reaches of the Yangtze River?, Geophys. Res. Lett., 50, e2023GL104269, https://doi.org/10.1029/2023GL104269, 2023.
Hugonnet, R., McNabb, R., Berthier, E., Menounos, B., Nuth, C., Girod, L., Farinotti, D., Huss, M., Dussaillant, I., Brun, F., and Kääb, A.: Accelerated global glacier mass loss in the early twenty-first century, Nature, 592, 726–731, https://doi.org/10.1038/s41586-021-03436-z, 2021.
Izagirre, E., Revuelto, J., Vidaller, I., Deschamps-Berger, C., Rojas-Heredia, F., Rico, I., Alonso-González, E., Gascoin, S., Serrano, E., and López-Moreno, J. I.: Pyrenean glaciers are disappearing fast: state of the glaciers after the extreme mass losses in 2022 and 2023, Reg. Environ. Change, 24, 172, https://doi.org/10.1007/s10113-024-02333-1, 2024.
Jeong, H., Park, H.-S., Chowdary, J. S., and Xie, S.-P.: Triple-Dip La Niña Contributes to Pakistan Flooding and Southern China Drought in Summer 2022, B. Am. Meteorol. Soc., 104, E1570–E1586, https://doi.org/10.1175/BAMS-D-23-0002.1, 2023.
Jiang, J., Liu, Y., Mao, J., and Wu, G.: Extreme heatwave over eastern China in summer 2022: the role of three oceans and local soil moisture feedback, Environ. Res. Lett., 18, 044025, https://doi.org/10.1088/1748-9326/acc5fb, 2023.
Jiang, J., Liu, Y., Meng, J., Wu, G., He, B., Ma, T., Bao, W., and Fan, J.: Dry soil moisture on the Tibetan Plateau drives synchronous extreme heatwaves in Europe and east Asia, npj Clim. Atmos. Sci., 7, 281–290, https://doi.org/10.1038/s41612-024-00831-x, 2024.
Kang, S., Wang, F., Morgenstern, U., Zhang, Y., Grigholm, B., Kaspari, S., Schwikowski, M., Ren, J., Yao, T., Qin, D., and Mayewski, P. A.: Dramatic loss of glacier accumulation area on the Tibetan Plateau revealed by ice core tritium and mercury records, The Cryosphere, 9, 1213–1222, https://doi.org/10.5194/tc-9-1213-2015, 2015.
Ke, C., Xiao, Y., Fan, Y., Luo, L., Cai, Y., Shen, X., Wang, G., Wu, J., Zhuang, L., Wang, J., Liu, Y., Shao, D., He, Z., Hu, X., and Yuan, T.: A new time-stamped glacier inventory of high mountain asia based on deep learning and remote sensing big data in 2020, Sci. China Earth Sci., 69, 236–252, https://doi.org/10.1007/s11430-025-1725-9, 2026.
King, O., Ghuffar, S., Bhattacharya, A., Yao, R., Yao, T., and Bolch, T.: Glaciological and climatological drivers of heterogeneous glacier mass loss in the Tanggula Shan (Central-Eastern Tibetan Plateau), since the 1960s, J. Glaciol., 69, 1149–1166, https://doi.org/10.1017/jog.2023.5, 2023.
Kinnard, C., Larouche, O., Demuth, M. N., and Menounos, B.: Modelling glacier mass balance and climate sensitivity in the context of sparse observations: application to Saskatchewan Glacier, western Canada, The Cryosphere, 16, 3071–3099, https://doi.org/10.5194/tc-16-3071-2022, 2022.
Klok, E. J. and Oerlemans, J.: Model study of the spatial distribution of the energy and mass balance of Morteratschgletscher, Switzerland, J. Glaciol., 48, 505–518, https://doi.org/10.3189/172756502781831133, 2002.
Kronenberg, M., van Pelt, W., Machguth, H., Fiddes, J., Hoelzle, M., and Pertziger, F.: Long-term firn and mass balance modelling for Abramov Glacier in the data-scarce Pamir Alay, The Cryosphere, 16, 5001–5022, https://doi.org/10.5194/tc-16-5001-2022, 2022.
Liang, L., Cuo, L., and Liu, Q.: The energy and mass balance of a continental glacier: Dongkemadi Glacier in central Tibetan Plateau, Sci. Rep., 8, 12788, https://doi.org/10.1038/s41598-018-31228-5, 2018.
Liu, W., Zhang, D., Qin, X., Van Den Broeke, M. R., Jiang, Y., Yang, D., and Ding, M.: Monsoon Clouds Control the Summer Surface Energy Balance on East Rongbuk Glacier (6,523 m Above Sea Level), the Northern of Mt. Qomolangma (Everest), J. Geophys. Res.-Atmos., 126, e2020JD033998, https://doi.org/10.1029/2020JD033998, 2021.
Luo, D., Lin, D., Xu, Y., Zhu, M., Zhu, F., Zhao, H., and Xiang, Y.: The processes and impacts of drought-induced extreme glacier mass loss on the south-central tibetan plateau, J. Hydrol., 675, 135645, https://doi.org/10.1016/j.jhydrol.2026.135645, 2026.
Menounos, B., Huss, M., Marshall, S., Ednie, M., Florentine, C., and Hartl, L.: Glaciers in Western Canada-Conterminous US and Switzerland Experience Unprecedented Mass Loss Over the Last Four Years (2021–2024), Geophys. Res. Lett., 52, e2025GL115235, https://doi.org/10.1029/2025GL115235, 2025.
Mölg, T., Cullen, N. J., Hardy, D. R., Kaser, G., and Klok, L.: Mass balance of a slope glacier on Kilimanjaro and its sensitivity to climate, Int. J. Climatol., 28, 881–892, https://doi.org/10.1002/joc.1589, 2008.
Mölg, T., Maussion, F., and Scherer, D.: Mid-latitude westerlies as a driver of glacier variability in monsoonal High Asia, Nat. Clim. Change, 4, 68–73, https://doi.org/10.1038/nclimate2055, 2014.
Mölg, T., Maussion, F., Collier, E., Chiang, J. C. H., and Scherer, D.: Prominent midlatitude circulation signature in high asia's surface climate during monsoon, J. Geophys. Res.-Atmos., 122, 1–11, https://doi.org/10.1002/2017JD027414, 2017.
Oerlemans, J. and Knap, W. H.: A 1 year record of global radiation and albedo in the ablation zone of Morteratschgletscher, Switzerland, J. Glaciol., 44, 231–238, https://doi.org/10.3189/S0022143000002574, 1998.
Oerlemans, J., Anderson, B., Hubbard, A., Huybrechts, Ph., Jóhannesson, T., Knap, W. H., Schmeits, M., Stroeven, A. P., Van De Wal, R. S. W., Wallinga, J., and Zuo, Z.: Modelling the response of glaciers to climate warming, Clim. Dynam., 14, 267–274, https://doi.org/10.1007/s003820050222, 1998.
Östin, R. and Andersson, S.: Frost growth parameters in a forced air stream, Int. J. Heat Mass Transfer, 34, 1009–1017, https://doi.org/10.1016/0017-9310(91)90012-4, 1991.
Pu, J., Yao, T., Yang, M., Tian, L., Wang, N., Ageta, Y., and Fujita, K.: Rapid decrease of mass balance observed in the Xiao (Lesser) Dongkemadi Glacier, in the central Tibetan Plateau, Hydrol. Process., 22, 2953–2958, https://doi.org/10.1002/hyp.6865, 2008.
Raei, E., Nikoo, M. R., AghaKouchak, A., Mazdiyasni, O., and Sadegh, M.: GHWR, a multi-method global heatwave and warm-spell record and toolbox, Sci. Data, 5, 180206, https://doi.org/10.1038/sdata.2018.206, 2018.
Reijmer, C. H. and Hock, R.: Internal accumulation on Storglaciären, Sweden, in a multi-layer snow model coupled to a distributed energy- and mass-balance model, J. Glaciol., 54, 61–72, https://doi.org/10.3189/002214308784409161, 2008.
Shan, B., Verhoest, N. E. C., and De Baets, B.: Identification of compound drought and heatwave events on a daily scale and across four seasons, Hydrol. Earth Syst. Sci., 28, 2065–2080, https://doi.org/10.5194/hess-28-2065-2024, 2024.
Sturm, M., Holmgren, J., König, M., and Morris, K.: The thermal conductivity of seasonal snow, J. Glaciol., 43, 26–41, https://doi.org/10.3189/S0022143000002781, 1997.
Thibert, E., Dkengne Sielenou, P., Vionnet, V., Eckert, N., and Vincent, C.: Causes of Glacier Melt Extremes in the Alps Since 1949, Geophys. Res. Lett., 45, 817–825, https://doi.org/10.1002/2017GL076333, 2018.
Tian, L., Masson-Delmotte, V., Stievenard, M., Yao, T., and Jouzel, J.: Tibetan Plateau summer monsoon northward extent revealed by measurements of water stable isotopes, J. Geophys. Res.-Atmos., 106, 28081–28088, https://doi.org/10.1029/2001JD900186, 2001.
Tian, Y., Ghausi, S. A., Zhang, Y., Zhang, M., Xie, D., Cao, Y., Mei, Y., Wang, G., Zhong, D., and Kleidon, A.: Radiation as the dominant cause of high-temperature extremes on the eastern Tibetan Plateau, Environ. Res. Lett., 18, 074007, https://doi.org/10.1088/1748-9326/acd805, 2023.
van Tiel, M., Huss, M., Zappa, M., Jonas, T., and Farinotti, D.: Swiss glacier mass loss during the 2022 drought: persistent streamflow contributions amid declining melt water volumes, Hydrol. Earth Syst. Sci., 30, 23–43, https://doi.org/10.5194/hess-30-23-2026, 2026.
van Pelt, W., Pohjola, V., Pettersson, R., Marchenko, S., Kohler, J., Luks, B., Hagen, J. O., Schuler, T. V., Dunse, T., Noël, B., and Reijmer, C.: A long-term dataset of climatic mass balance, snow conditions, and runoff in Svalbard (1957–2018), The Cryosphere, 13, 2259–2280, https://doi.org/10.5194/tc-13-2259-2019, 2019.
van Pelt, W. J. J., Oerlemans, J., Reijmer, C. H., Pohjola, V. A., Pettersson, R., and van Angelen, J. H.: Simulating melt, runoff and refreezing on Nordenskiöldbreen, Svalbard, using a coupled snow and energy balance model, The Cryosphere, 6, 641–659, https://doi.org/10.5194/tc-6-641-2012, 2012.
Vargo, L. J., Anderson, B. M., Dadić, R., Horgan, H. J., Mackintosh, A. N., King, A. D., and Lorrey, A. M.: Anthropogenic warming forces extreme annual glacier mass loss, Nat. Clim. Change, 10, 856–861, https://doi.org/10.1038/s41558-020-0849-2, 2020.
Voordendag, A., Prinz, R., Schuster, L., and Kaser, G.: Brief communication: The Glacier Loss Day as an indicator of a record-breaking negative glacier mass balance in 2022, The Cryosphere, 17, 3661–3665, https://doi.org/10.5194/tc-17-3661-2023, 2023.
Wang, Z., Jiang, X., Ke, Z., and Song, Y.: Atmospheric and oceanic factors related to the increasing summer high temperature extremes on the Tibetan Plateau under the background of global warming, J. Climate, 37, 2309–2323, https://doi.org/10.1175/JCLI-D-23-0441.1, 2024.
Wei, W., Zhang, R., and Wen, M.: Meridional variation of South Asian high and its relationship with summer precipitation over China, J. Appl. Meteor. Sci., 23, 650–659, 2012.
Wheler, B. A. and Flowers, G. E.: Glacier subsurface heat-flux characterizations for energy-balance modelling in the donjek range, southwest yukon, canada, J. Glaciol., 57, 121–133, https://doi.org/10.3189/002214311795306709, 2011.
Xu, C., Li, H., Wang, F., Li, Z., Zhou, P., and Liu, S.: Heatwaves in summer 2022 forces substantial mass loss for Urumqi Glacier No. 1, China, J. Glaciol., 70, e77, https://doi.org/10.1017/jog.2024.4, 2024.
Yan, R., Wang, X., Wang, J., Tan, J., and Ju, W.: Warm Early Summer Compensated Reduction in Photosynthesis Caused by 2022 Late Summer Extreme Drought Over the Tibetan Plateau, J. Geophys. Res.-Biogeo., 129, e2023JG007859, https://doi.org/10.1029/2023JG007859, 2024.
Yang, M., Li, Z., Anjum, M. N., Zhang, X., Gao, Y., and Xu, C.: On the importance of subsurface heat flux for estimating the mass balance of alpine glaciers, Global Planet. Change, 207, 103651, https://doi.org/10.1016/j.gloplacha.2021.103651, 2021.
Yao, T., Thompson, L., Yang, W., Yu, W., Gao, Y., Guo, X., Yang, X., Duan, K., Zhao, H., Xu, B., Pu, J., Lu, A., Xiang, Y., Kattel, D. B., and Joswiak, D.: Different glacier status with atmospheric circulations in Tibetan Plateau and surroundings, Nat. Clim. Change, 2, 663–667, https://doi.org/10.1038/nclimate1580, 2012.
Yao, T., Masson-Delmotte, V., Gao, J., Yu, W., Yang, X., Risi, C., Sturm, C., Werner, M., Zhao, H., He, Y., Ren, W., Tian, L., Shi, C., and Hou, S.: A review of climatic controls on δ18 O in precipitation over the Tibetan Plateau: Observations and simulations, Rev. Geophys., 51, 525–548, https://doi.org/10.1002/rog.20023, 2013.
Yao, T., Bolch, T., Chen, D., Gao, J., Immerzeel, W., Piao, S., Su, F., Thompson, L., Wada, Y., Wang, L., Wang, T., Wu, G., Xu, B., Yang, W., Zhang, G., and Zhao, P.: The imbalance of the Asian water tower, Nat. Rev. Earth Environ., 3, 618–632, https://doi.org/10.1038/s43017-022-00299-4, 2022.
Yen, Y.: Review of thermal properties of snow, ice and sea ice, Tech. rep., DTIC Document, 1981.
Zhang, T., Deng, Y., Chen, J., Yang, S., and Dai, Y.: An energetics tale of the 2022 mega-heatwave over central-eastern China, npj Clim. Atmos. Sci., 6, 162, https://doi.org/10.1038/s41612-023-00490-4, 2023.
Zhao, H.-Y., Wang, C., Hou, X., Su, B., Lei, H.-J., Hao, H.-R., Zhang, T., and Xiao, C.-D.: Heatwave intensification and associated driving mechanisms across high mountain asia, Adv. Clim. Change Res., https://doi.org/10.1016/j.accre.2026.10.004, 2026.
Zhou, B., Zhai, P., and Liao, Z.: Bivariate attribution of the compound hot and dry summer of 2022 on the Tibetan Plateau, Sci. China Earth Sci., 67, 2122–2136, https://doi.org/10.1007/s11430-023-1320-y, 2024.
Zhou, M., Wang, Y., Hou, S., Zhai, Z., Li, Z., Sun, W., and Wang, Y.: North Atlantic Ocean natural variability drives glacier mass loss over the northeastern Tibetan Plateau, Commun. Earth Environ., 6, 843–850, https://doi.org/10.1038/s43247-025-02851-8, 2025.
Zhu, F., Zhu, M., Yang, W., Wang, Z., Guo, Y., and Yao, T.: Drivers of the Extreme Early Spring Glacier Melt of 2022 on the Central Tibetan Plateau, Earth Space Sci., 11, https://doi.org/10.1029/2023ea003297, 2024.
Zhu, F., Yao, T.-D., Zhu, M.-L., An, L., Wang, P., Huang, G.-F., and Hu, Z.-F.: The role of mid-latitude zonal wind anomalies in extreme glacier mass loss on central Tibetan Plateau, Adv. Clim. Change Res., https://doi.org/10.1016/j.accre.2026.03.010, 2026a.
Zhu, M., Yao, T., Yang, W., Xu, B., Wu, G., and Wang, X.: Differences in mass balance behavior for three glaciers from different climatic regions on the Tibetan Plateau, Clim. Dynam., 50, 3457–3484, https://doi.org/10.1007/s00382-017-3817-4, 2018.
Zhu, M., Thompson, L. G., Zhao, H., Yao, T., Yang, W., and Jin, S.: Influence of atmospheric circulation on glacier mass balance in western Tibet: an analysis based on observations and modeling, J. Climate, 1–55, https://doi.org/10.1175/JCLI-D-20-0988.1, 2021.
Zhu, M., Yao, T., Thompson, L. G., Wang, S., Yang, W., and Zhao, H.: What induces the spatiotemporal variability of glacier mass balance across the Qilian Mountains, Clim. Dynam., 59, 3555–3577, https://doi.org/10.1007/s00382-022-06283-4, 2022a.
Zhu, M., Yao, T., Yang, W., Wu, G., Li, S., Zhao, H., and Thompson, L. G.: Possible Causes of Anomalous Glacier Mass Balance in the Western Kunlun Mountains, J. Geophys. Res.-Atmos., 127, e2021JD035705, https://doi.org/10.1029/2021JD035705, 2022b.
Zhu, M., Yao, T., Thompson, L. G., Yang, W., Zhu, F., Lin, D., Zhong, Z.-P., Zhao, H., Zhang, X., and Li, S.: Linking northeastern indian subcontinental high temperature to extreme glacier mass loss on the south-central Tibetan Plateau, J. Geophys. Res.-Atmos., 131, e2025JD045031, https://doi.org/10.1029/2025JD045031, 2026b.