
the Creative Commons Attribution 4.0 License.
the Creative Commons Attribution 4.0 License.
 | 10 Nov 2026
Is earlier always better? A comparative assessment of an early-stage response window for rainfall timing in multiyear drought alleviation in China
Yichen Zhang
Fubao Sun
Wenbin Liu
Jie Zhang

Wenli Lai
Jiquan Lin
Wenchao Sun
Wenjie Liu
Zhongyi Sun
Peng Wang
Multiyear droughts (MYDs) are severe drought events with profound impacts on human activities and ecosystems. However, the timing that maximizes drought attenuation efficiency under additional precipitation (toptimal) remains insufficiently quantified. With that in mind, we conducted a retrospective grid-based analysis of historical MYDs in China using the Palmer Drought Severity Index (PDSI) over 1961–2020, with a calibration period of 1961–1990, and performed numerical experiments with hypothetical precipitation gradient increases during 1991–2020. We defined k to quantify the sensitivity of drought alleviation to precipitation input. Actual k values derived from the numerical experiments showed strong consistency with theoretical k derived from a drought attenuation quantitative model (DAQM). Theoretical k was further used to quantify MYD attenuation efficiency, with toptimal identified as the timing of maximum theoretical k (kmax). Overall, drought severity (DS) exhibits a nonlinear response to hypothetical precipitation increases. Both numerical experiment-based and DAQM-derived results identify an early-stage response window within the first three months (t1∼t3), and multiple robustness analyses confirm its stability. kmax occurs most frequently at t1, in 58.79 % of all grids, while t2 and t3 were also non-negligible (22.11 % and 11.06 %). This suggests that missing t1 within this window does not necessarily imply a substantial reduction in k. Compared with humid river basins in southern China, arid and semi-arid northern basins show a higher probability that k at t2 or t3 exceed k at t1. Drought duration (DD) is a key factor, as longer DD is associated with a greater likelihood of t2 or t3 being the toptimal (R2=0.526 and 0.578). We noticed that k is jointly influenced by the cumulative temporal advantage of earlier precipitation input and the higher sensitivity of standardized drought indices under severe drought conditions. This study identifies an early-stage response window during MYD evolution and provides conceptual guidance for understanding how precipitation input timing influences drought alleviation across regions.
- Article
(7332 KB) - Full-text XML
-
Supplement
(3642 KB) - BibTeX
- EndNote


Droughts are recognized as a major natural hazard with profound negative effects on both human activities and the environment (Berdugo et al., 2020; Shi et al., 2021; Palagi et al., 2022). Compared to other natural hazards, droughts often rank higher in key characteristics of losses, such as total loss of life and total economic loss (Mishra and Singh, 2010). For instance, in the United States, drought caused USD 250 billion in damages and nearly 3000 deaths between 1980 and 2020, making it the costliest and second deadliest natural disaster during this period (Ault, 2020; Smith, 2020). In Europe, drought-related financial losses over the three decades prior to 2007 were estimated to exceed EUR 100 billion (Blauhut et al., 2016). In China, prolonged droughts in Southwest China during 2018–2020 resulted in economic losses of USD 240 million, underscoring the intensifying impacts of prolonged droughts (Feng et al., 2025). Such devastating drought events, which typically last more than 12 months (Brunner and Tallaksen, 2019; van Mourik et al., 2025), are referred to as multiyear droughts (MYDs). Under climate change, these persistent, expansive, and difficult-to-recover MYD events have shown an escalating trend in severity, duration, and frequency (Dai, 2013; Zhang et al., 2016; Stevenson et al., 2022; Chen et al., 2025; Wang et al., 2025).
Droughts are primarily related to prolonged reductions in the precipitation for a region (McCabe and Wolock, 2015; Hao et al., 2018; Zhang et al., 2021). For instance, the Millennium Drought in southeast Australia (2001–2009) was the longest drought on record for the region (Van Dijk et al., 2013). Similarly, the California droughts from 2012 to 2015 included the driest three-year period on record in the state (2012–2014) (Mao et al., 2015; Luo et al., 2017). The MYD in Europe from 2014 to 2018 was also record-breaking for the region (Moravec et al., 2021; Büntgen et al., 2021). To better quantify the severity of drought, various drought indices have been developed based on deviations in water availability against long-term normal conditions. Currently, the most widely used drought indices include the Palmer Drought Severity Index (PDSI), Standardized Precipitation Evapotranspiration Index (SPEI), and Standardized Precipitation Index (SPI) (Zhang et al., 2016; Liu et al., 2017; Mukherjee and Mishra, 2021). These indices typically quantify drought severity on a monthly timescale based on precipitation and/or potential evapotranspiration (PET) (Easterling et al., 2007; Vicente-Serrano et al., 2010). They generally standardize monthly effective precipitation time series under the assumption of a normal distribution, enabling the identification of thresholds that delineate different drought intensities (Dai, 2011; Vicente-Serrano et al., 2025). Moreover, by thoughtfully incorporating auto-correlation processes (such as auto-correlation coefficients or the accumulation of antecedent water deficit/surplus), these indices can effectively capture the dynamic evolution of typical drought events, including their onset, development, recovery, and termination (Gupta and Karthikeyan, 2024). To further characterize the dynamic evolution of typical drought events, Yevjevich (1967) proposed the run theory, which extracts drought features based on three key characteristics. These include: (a) Drought duration (DD, the period during which a drought parameter is continuously below the critical threshold), (b) Drought intensity (DI, the maximum deviation of the drought index below the critical threshold during a drought event), (c) Drought severity (DS, the cumulative deficiency of a drought parameter below the critical threshold throughout the event). Such drought event features have been widely applied at station, regional, and global scales to assess drought processes and related impacts (Gu et al., 2020; Wu et al., 2022a; Ullah et al., 2022; Zhou et al., 2023), with DS particularly offering a more integrated measure of drought impact (Cavus and Aksoy, 2020).
Previous studies have examined the dynamic evolution of drought events across the four stages, namely onset, development, recovery, and termination (Ma et al., 2023; Lin et al., 2023). It has been widely observed that the recovery and termination phases are often accompanied by increased precipitation (Haile et al., 2020). However, such hydrometeorological changes typically occur several months after the onset of severe drought, by which time substantial ecological, agricultural, and socioeconomic damages may have already occurred (DeChant and Moradkhani, 2015; Livneh and Hoerling, 2016; Wu et al., 2018). For example, in southeast Australia, the Millennium Drought (2001–2009) was terminated by unusually high rainfall in early 2010, yet this MYD still exhibited prolonged DD and high DS (Yang et al., 2017). Consequently, precipitation occurring earlier in the drought event is more effective in alleviating drought impacts (Fig. 1a and b). From another perspective, drought indices typically represent anomalies from normal conditions in a standardized way, allowing comparisons across space and time. This implies that during extreme drought, when the standardized index deviates far from zero, even small increases in precipitation can induce relatively large numerical shifts in the index, owing to the probabilistic structure of standardized indices. In contrast, when the index is closer to zero, the same precipitation perturbation results in much smaller numerical changes. For instance, using the widely applied PDSI as an example, achieving the same one-unit change in the index requires only about 48 % of the cumulative probability shift under extreme drought conditions (PDSI ) compared with that required under milder drought conditions (PDSI ) (Fig. 1c and d). This reflects the non-linear probabilistic spacing of the standardized drought indices, whereby values far below the drought threshold are numerically more sensitive to identical perturbations. Consequently, index responses to the same precipitation perturbation can differ substantially depending on the magnitude of PDSI deviations. However, such nonlinear responses are often overlooked. Small increases in precipitation during extreme drought are frequently dismissed as inconsequential, despite their potential to drive meaningful recovery (Pan et al., 2013).
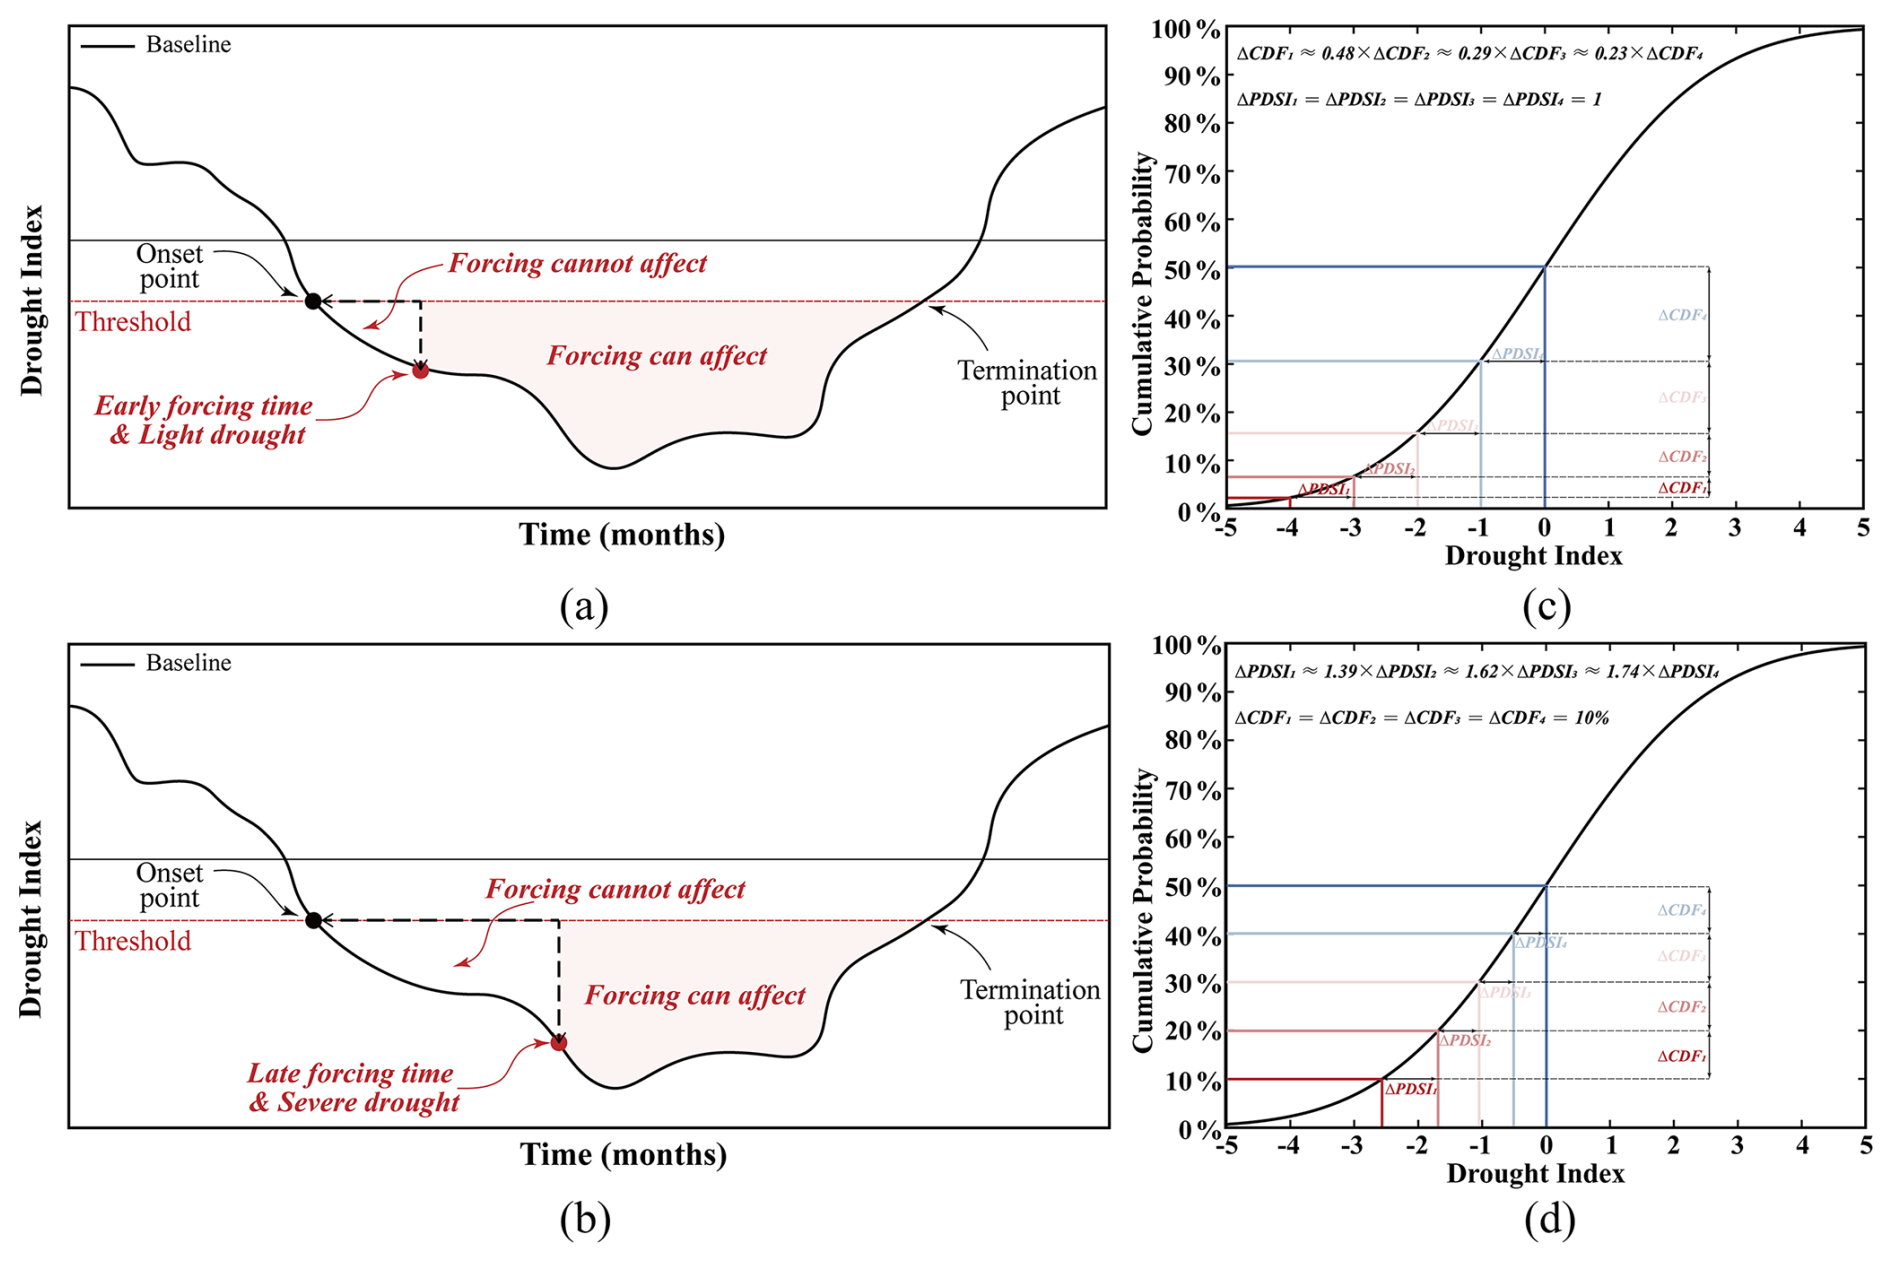
Figure 1Conceptual and statistical illustrations related to drought alleviation and the normal distribution characteristics of commonly used drought indices (with PDSI as an example). Here, “forcing” refers to a hypothetical incremental water input applied at a given month within a drought event for conceptual illustration. Panels (a) and (b) illustrate the event-level progression of a drought and the associated accumulation of deficit. (a) During the early stage of a drought event, PDSI deviation is relatively small and the accumulated deficit is low. (b) As the drought progresses toward the drought intensity (DI) point, which is defined as the maximum deviation of the index below the critical threshold during the event, the PDSI deviation increases and the accumulated deficit becomes larger. Panels (c) and (d) illustrate the statistical behavior of the standardized index, independent of event-level cumulative deficit. (c) Change in cumulative probability induced by a one-unit shift in PDSI at different levels of PDSI deviation below the drought threshold. (d) PDSI shift required to achieve an equivalent change in cumulative probability at different levels of PDSI deviation.
Currently, the timing that maximizes drought attenuation efficiency under additional precipitation (toptimal) remains insufficiently quantified. Several existing studies focus on early drought monitoring or alleviation measures during severe drought (Haile et al., 2020). However, we suggest that effective drought alleviation may not necessarily occur at either of these two stages. In particular, cases where early precipitation input and drought conditions are considered together remain under-investigated. Therefore, it is necessary to clarify the relationship between the timing of precipitation input and drought alleviation. Because MYDs involve cumulative water deficits across seasons and years, exhibiting more persistent impacts, the timing of additional precipitation becomes more critical for alleviation, making MYDs particularly suitable for examining precipitation effects on DS. To this end, we propose a new framework involving a series of numerical experiments to retrospectively investigate typical historical MYD events. In this study, MYD events are defined at the grid level as the basic analytical units, with each representing a temporally continuous drought period identified independently within a single grid. Section 2 introduces the study area and datasets. In Sect. 3, representative MYD events are identified based on existing literature, with a particular focus on assessing the extent of drought alleviation during these events. A model based on hypothetical precipitation forcing applied at different months of MYD is developed to parameterize MYD attenuation efficiency. The accuracy of this parameter is evaluated by comparing model-derived estimates with empirical estimates derived directly from the numerical experiments. The results and related discussion are presented in Sects. 4 and 5. We close with a brief conclusion in Sect. 6.
To assess the role of nonlinear patterns in MYD alleviation, we utilize a daily meteorological dataset suitable for calculating PDSI during the period of 1961 to 2020 over China. This dataset includes precipitation (pr), air temperature (mean, maximum, and minimum), relative humidity, wind speed, and sunshine duration. This dataset consisting of 756 stations is provided by the National Climate Centre of the China Meteorological Administration and has been quality-controlled before being released to the scientific community (https://www.nmic.cn/, last access: 26 August 2025). Given the importance of reliable statistics, we applied additional temporal and spatial consistency control on the data based on the information of the length of available data, the missing data, and the density of stations, etc. First, we conducted temporal consistency control on the dataset. Daily records from 1960–2020 were examined for each station, and stations with more than 5 % missing values were excluded. Short gaps (≤5 d) in the remaining stations were filled using linear interpolation, while longer gaps were replaced with the multi-year mean for the corresponding day. Following this procedure, 620 out of 756 meteorological stations with continuous measurements were selected. These stations are distributed in 10 large river basins covering China, as shown in Fig. 2. Second, we conduct further control on the spatial inhomogeneity of station distribution. We select 199 grid boxes of 2°×2° longitude by latitude (Fig. 2), and each grid box should contain at least one station with continuing meteorological measurements. For the given grid box with multiple stations, the station results were averaged to represent the grid box. In doing that, we reduce the possible influence from temporal and spatial inhomogeneities in the data and ensure that the overall statistics are robust. The resulting grid-level daily meteorological series were then used as the basis for subsequent monthly aggregation and PDSI calculation.
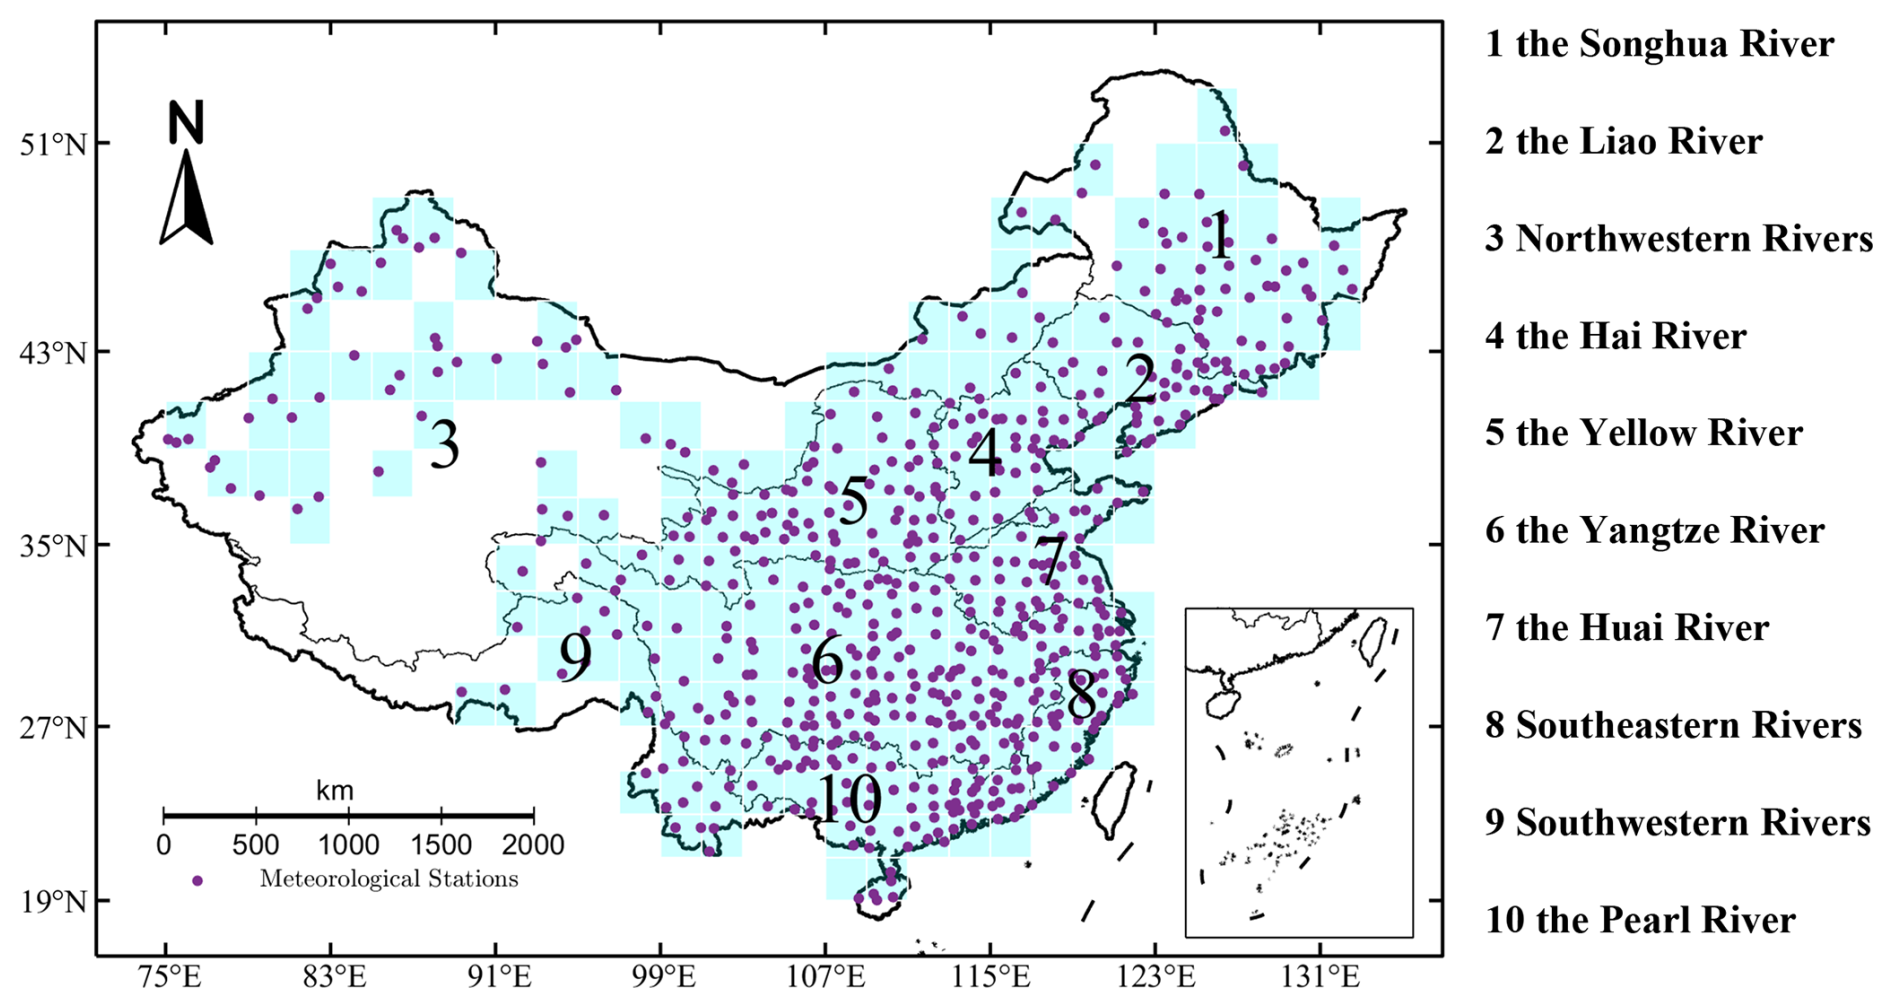
Figure 2The study area covers 10 large river basins (regions). No. 1, the Songhua River; No. 2, the Liao River; No. 3, Northwestern Rivers; No. 4, the Hai River; No. 5, the Yellow River; No. 6, the Yangtze River; No. 7, the Huai River; No. 8, Southeastern Rivers; No. 9, Southwestern Rivers and No. 10, Pearl River. A total of 199 (2°×2°) grid boxes (color: cyan) were identified as containing at least one station with continuous instrumental meteorological records. In total, 620 meteorological stations (purple dots) were used.
3.1 Overview
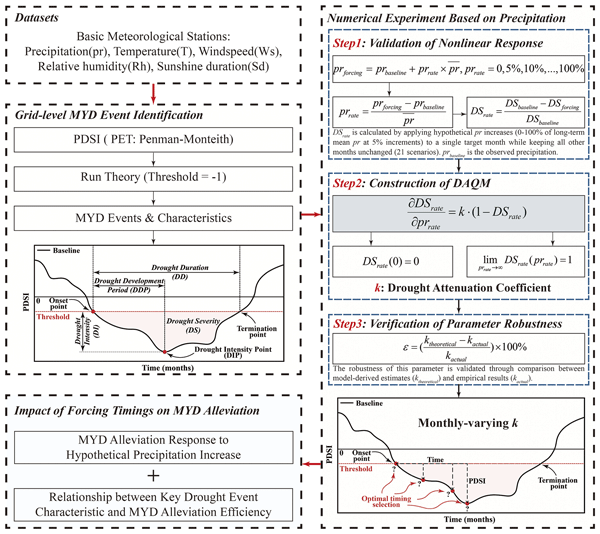
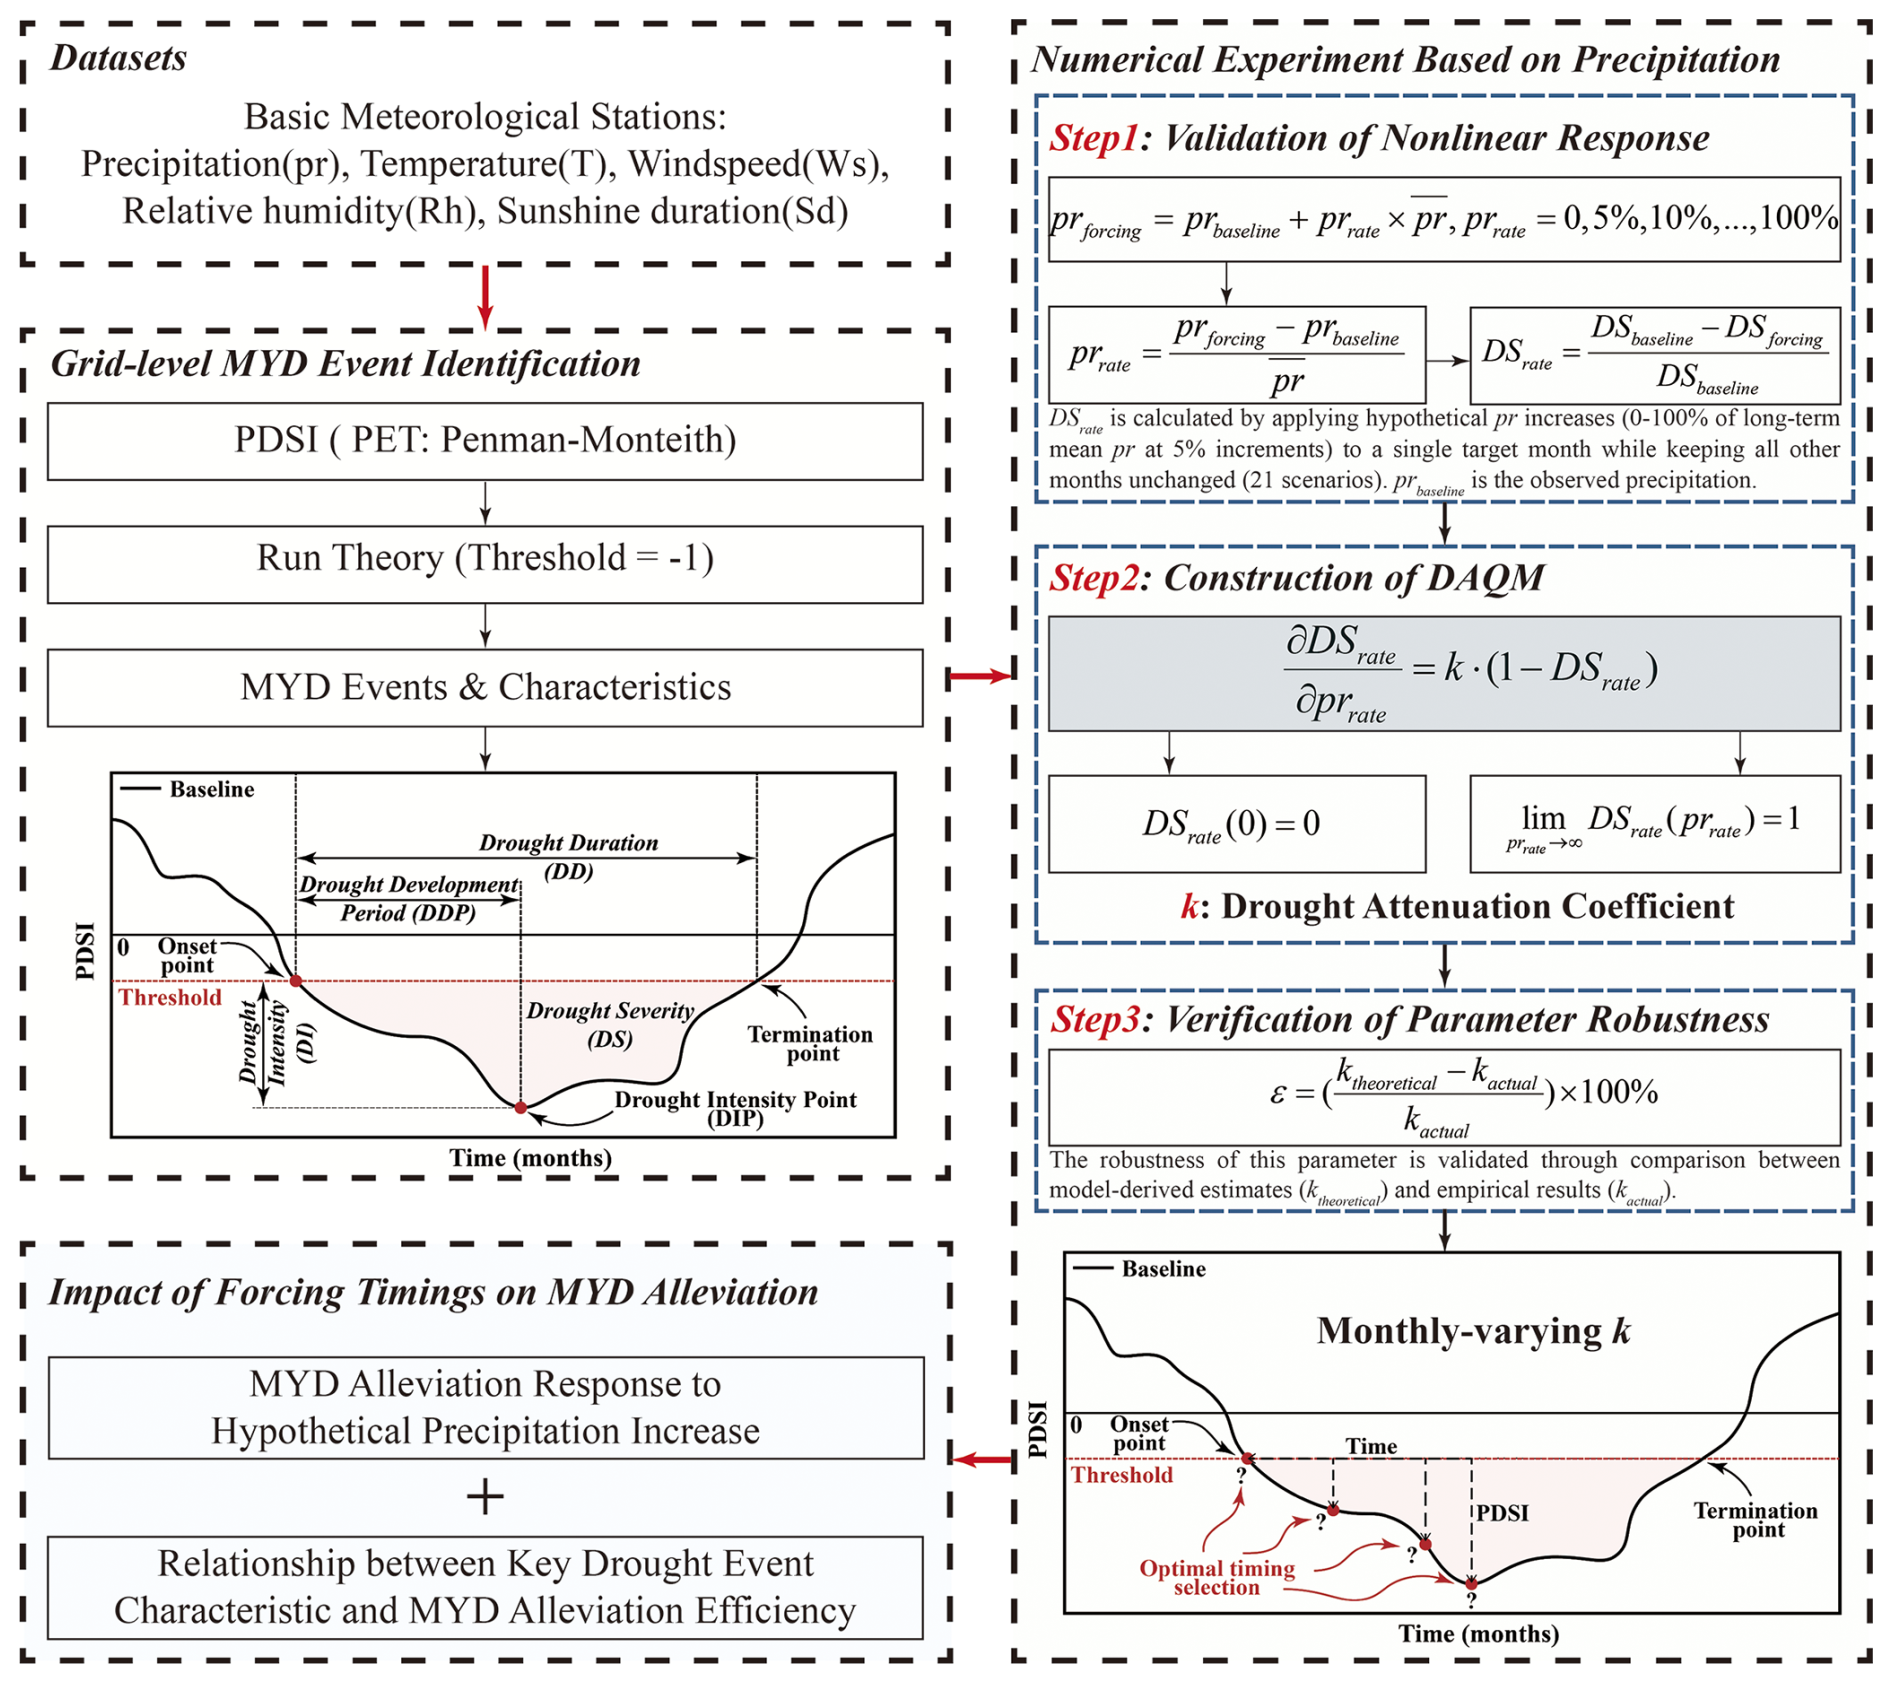
To determine toptimal of drought alleviation, we propose the following methodological framework that evaluates how early-stage hypothetical precipitation forcing and PDSI deviation magnitude jointly modulate the efficiency of alleviating grid-level MYD events. We calculate the PDSI using data from meteorological stations, identify representative grid-level MYD events which capture the key characteristics of persistent and severe droughts, and characterize them in terms of DS, DD, DI, Drought Development Period (DDP), and Drought Intensity Point (DIP, the PDSI value at the drought intensity point) (see Sect. 3.3 for identification criteria). Based on these identified grid-level MYDs, a series of numerical experiments is conducted by applying hypothetical precipitation increases along a prescribed gradient. The numerical experiment consists of the following three steps: (1) Validation of the nonlinear response of DS to incremental precipitation forcing applied along a gradient; (2) construction of a novel drought attenuation quantitative model (DAQM) to describe this response; (3) verification of the applicability of the key parameter derived from the DAQM, namely k, the MYD attenuation efficiency coefficient. k characterizes how rapidly additional precipitation is converted into reductions in DS. For each grid-level MYD, k is evaluated across different forcing timings, and its maximum value (kmax) is identified. The toptimal is then identified as the timing corresponding to kmax. In addition, we examine the relationship between DD, as a key event characteristic, and MYD attenuation efficiency under hypothetical precipitation forcing. A detailed description of each methodological component is provided in Sect. 3.2–3.4. For clarity, a consolidated table listing principal symbols, acronyms and their description is provided for reference (Table S1 in the Supplement). Figure 3 provides an overview of the workflow and methodological structure of the proposed framework.
3.2 Estimation of PDSI using the Penman-Monteith method
In this study, PDSI was used to quantify the deviation between observed monthly precipitation and the required precipitation, which was estimated each month under Climatically Appropriate For Existing Conditions (CAFEC). The PDSI was calculated following the CAFEC formulation and calibrated at the grid level over the calibration period 1961–1990 to calculate CAFEC values and establish a fixed climatological reference (Karl, 1986). This ensured that PDSI thresholds remained unchanged throughout the analysis (Fig. S1). The calibration period was intentionally kept independent from the subsequent numerical experiments, which were conducted exclusively for 1991–2020, in order to avoid altering the reference climatology and to allow consistent evaluation of hypothetical precipitation forcing effects (Fig. S1a). During the calibration period, monthly climatological values of the water balance components, including precipitation, PET, recharge, runoff, and losses, were derived to compute CAFEC precipitation, calibration coefficients, and the corresponding Z-index and PDSI time series.
The PDSI formulation was based on a simple two-layer water balance model (Palmer, 1965), which considered both water supply and atmospheric evaporative demand. To ensure the credibility of PDSI results, we used the Penman-FAO56 method with a physically based formulation (Xu et al., 2022) to estimate PET (denoted as PETpm), as shown in Eq. (1). Specifically, daily PET was first calculated from daily meteorological observations and then aggregated to monthly values for use in the PDSI calculation.
Where Δ is the slope of the vapor pressure curve, Rn is the net radiation (calculated using surface downwelling/upwelling shortwave/longwave radiation), G is the soil heat flux, which was assumed to be negligible (G≈0) at the daily timescale beneath the grass reference surface (Allen et al., 1998), γ is the psychometric constant, T is the monthly averaged air temperature, U2 is the wind speed at 2 m height, es is the saturation vapor pressure at a given air temperature, Rh is the relative humidity.
In this study, long-term PDSI series for the period 1961–2020 were calculated using the tool provided by the Palmer Drought Severity Index (Jacobi et al., 2013).
3.3 Identification and characterization of grid-level MYD events based on run theory
Run theory is a threshold-based method that defines drought events as temporally continuous periods during which PDSI remains below −1 (Yang et al., 2024), such that any month exceeding this threshold marks the termination of an event. According to this method, each identified drought event was further characterized using a set of event-based indicators, including DS, DD, DI, DDP, and DIP.
In this study, the identified grid-level drought events were further selected to capture the key characteristics of MYDs that are both persistent and sufficiently severe (hereafter referred to as typical MYDs), by retaining only those with DD>12 and (Brunner and Tallaksen, 2019; van Mourik et al., 2025; Chen et al., 2025). MYDs were required to be temporally continuous, with PDSI remaining below −1 throughout the entire event. Since the calibration period was set to 1961–1990 and the CAFEC values needed to remain fixed during numerical experiments, the final selection was restricted to grid-level MYD samples occurring during 1991–2020 (Fig. S1a). A total of 351 grid-level MYD samples meeting these criteria were identified. Each basin contained at least 11 grid-level MYD samples, thereby helping to ensure the statistical robustness of the analysis.
3.4 Numerical experiment design for quantifying drought attenuation efficiency under hypothetical precipitation increase
According to run theory, for a given drought event characterized by its baseline monthly PDSI series (Fig. S2a), a hypothetical precipitation increase applied at a specific month leads to a reduction in DS, assuming all other conditions remain unchanged. This provides a foundation for quantifying drought attenuation efficiency in terms of DS reduction. The numerical experiments therefore apply hypothetical precipitation increases to individual months of a drought event independently, keeping all other months unchanged, and compare the resulting DS responses across months. The timing of hypothetical precipitation increases (tforcing) is a key experimental parameter, representing the month at which the additional precipitation is applied within a grid-level MYD event.
Since this study focuses on drought alleviation, only hypothetical precipitation increase scenarios with incremental gradients are considered. The procedures of this numerical experiment were given as follows:
Step 1: Validation of nonlinear response
To validate the nonlinear response of MYD alleviation to hypothetical precipitation increases applied at different tforcing and under varying PDSI values, a single-timing precipitation forcing strategy was adopted. Under this strategy, precipitation is increased at only one tforcing within an MYD event, while precipitation in all other months remains unchanged. Since the calibration period in this study corresponds to the period 1961–1990, all numerical experiments were conducted for MYDs occurring after 1990, with no temporal overlap between the two periods (Fig. S1a). This design ensures that the reference climate is not influenced by hypothetical precipitation perturbations. Consequently, the baseline remains fixed throughout all gradient-based numerical experiments (Fig. S1a). The forcing strategy for a given MYD event during 1991–2020 is expressed as follows:
Where prforcing is the precipitation in the targeted month after applying the hypothetical forcing, prbaseline is the observed precipitation in the same month under the baseline (unforced) scenario, is the long-term mean monthly precipitation, is the relative change in precipitation, and is the imposed hypothetical precipitation increment. The long-term mean monthly precipitation was used as the reference quantity for defining the perturbation magnitude because it provides a physically interpretable measure of local climatological conditions and is highly consistent with the standard deviation of monthly precipitation across the study area (Fig. S3). Considering that MYD responses may vary under different precipitation perturbation magnitudes, prrate ranging from 0 % to 100 % at 5 % increments were used to systematically evaluate MYD responses across different perturbation conditions, thereby integrating both small and relatively large hypothetical precipitation perturbations. The upper bound of 100 % was selected to ensure that, even under severe antecedent drought conditions, the additional precipitation could bring monthly precipitation to or above its long-term mean and potentially shift conditions toward a relatively wet state.
As described above, applying precipitation forcing alters the DS of the corresponding MYD event. Therefore, the relationship between prforcing and the resulting change in DS provides a basis for examining the nonlinear response of drought alleviation to hypothetical precipitation increases.
Step 2: Construction of DAQM
To further parameterize drought attenuation efficiency in a consistent and comparable way across grids, forcing timings and MYDs, we developed DAQM. DAQM describes the relationship between hypothetical precipitation perturbations and the resulting reductions in event-level DS. It provides a unified framework for estimating the attenuation efficiency coefficient (k) while accounting for the nonlinear responses implied by Conceptual Models 1 and 2.
DS is defined as the cumulative sum of PDSI values over DD of a grid-level MYD period. In the model formulation, attenuation of DS under hypothetical precipitation increases is represented as a nonlinear diminishing-return process. This functional form is motivated by numerical experiments, which consistently show that incremental precipitation inputs produce progressively smaller marginal reductions in DS across grids and forcing timings, indicating a bounded drought alleviation response.
To represent this behavior, we adopt a first-order kinetic-like formulation, in which the instantaneous rate of DS reduction is proportional to the remaining DS. This structure captures rapid initial alleviation when residual DS is high and progressively slower alleviation as DS approaches zero.
Accordingly, Eq. (3) expresses the drought attenuation process in differential form, linking the instantaneous rate of DS reduction to the residual DS:
Where , DSbaseline is the observed DS under the baseline scenario, and DSforcing is the DS after the hypothetical precipitation is applied) is the relative change in DS.
k is the attenuation efficiency coefficient, representing the proportionality with which additional precipitation is converted into reductions in residual DS. Because k is dimensionless, it allows direct comparison of attenuation efficiency across different tforcing and regions.
It is clear that when no hypothetical precipitation forcing is applied (prrate=0), there is no change in DS (DSrate=0). Likewise, when sufficient forcing is applied, the MYD is fully alleviated (DSrate=1). Thus, the model is subject to the following boundary and limiting conditions:
Thus, based on the differential Eq. (3) above and the boundary and limiting conditions in Eq. (4), the analytical solution describing the relationship between DSrate and prrate can be obtained as follows:
To ensure that this exponential structure reflects observed system behavior rather than an assumed mathematical form, we compared formulations inspired by zero-order, first-order, and second-order kinetic processes using historical MYDs during 1991–2020. Across most grids and events, the first-order structure more accurately reproduced the curvature observed in the numerical experiments (Table S2 in the Supplement). Extension to an n-order formulation showed that the estimated n converged toward unity (n≈0.98), further supporting the first-order representation. We also compared the exponential form against alternative empirical relationships. Logistic curves did not match the observed pattern. Power-law functions were unable to satisfy the required boundary conditions.
Step 3: Verification of parameter robustness
To evaluate the robustness of the drought attenuation efficiency parameter k, we compared model-derived estimates obtained from DAQM (ktheoretical) with empirical estimates calculated directly from the numerical experiments (kactual). Specifically, ktheoretical is obtained by fitting the DAQM analytical solution to the full set of experimental outcomes, thereby capturing the nonlinear and bounded response of DS to hypothetical precipitation increases. In contrast, kactual represents the empirical sensitivity of DS to small precipitation perturbations and is approximated from the initial slope of the relationship between DSrate and prrate under the smallest forcing step (, where 0.05 is the smallest perturbation step used in the experiments).
The relative error between ktheoretical and kactual was used as a diagnostic measure to assess the numerical reliability of the model-based parameterization:
Where ϵ is the relative error, ktheoretical is the model-derived attenuation efficiency coefficient, and kactual is the empirical estimate obtained from numerical experiments.
In subsequent analyses, ktheoretical is used as the primary indicator because it captures the overall nonlinear response structure of DS to hypothetical precipitation increases and provides a more comprehensive and comparable measure of drought attenuation efficiency across grids and forcing timings. kactual is employed solely to verify internal consistency and is not used in other analyses.
4.1 Response relationship between DS and hypothetical precipitation increase in China
Focusing on drought alleviation, the numerical experiments were constrained to the tforcing range of DDP, with the minimum DDP among the selected MYD events being 8 months. Accordingly, t1, t2, …, and t8 represent the first to the eighth month of MYD. For each tforcing from t1 to t8, DSrate values were calculated across hypothetical precipitation perturbations with prrate ranging from 0 to 1 at 0.05 increments. Figure 4a presents the empirical DSrate responses derived directly from the numerical experiments, summarized as the mean ± standard error (SE) across MYD events under different precipitation perturbation scenarios, mainly to illustrate the overall attenuation behavior across the study area. The resulting responses were then fitted for each tforcing within each MYD event using the DAQM analytical form described in Sect. 3.4 (Eq. 5). The fitted relationships closely reproduced the numerical experiment outputs at the event scale with R2 values generally exceeding 0.90, confirming the suitability of the DAQM analytical form. This fitting yielded one theoretical attenuation efficiency parameter (k) for each tforcing, representing the drought attenuation efficiency of a given event at a specific timing. The corresponding k values are denoted as k1, k2, …, and k8, respectively.
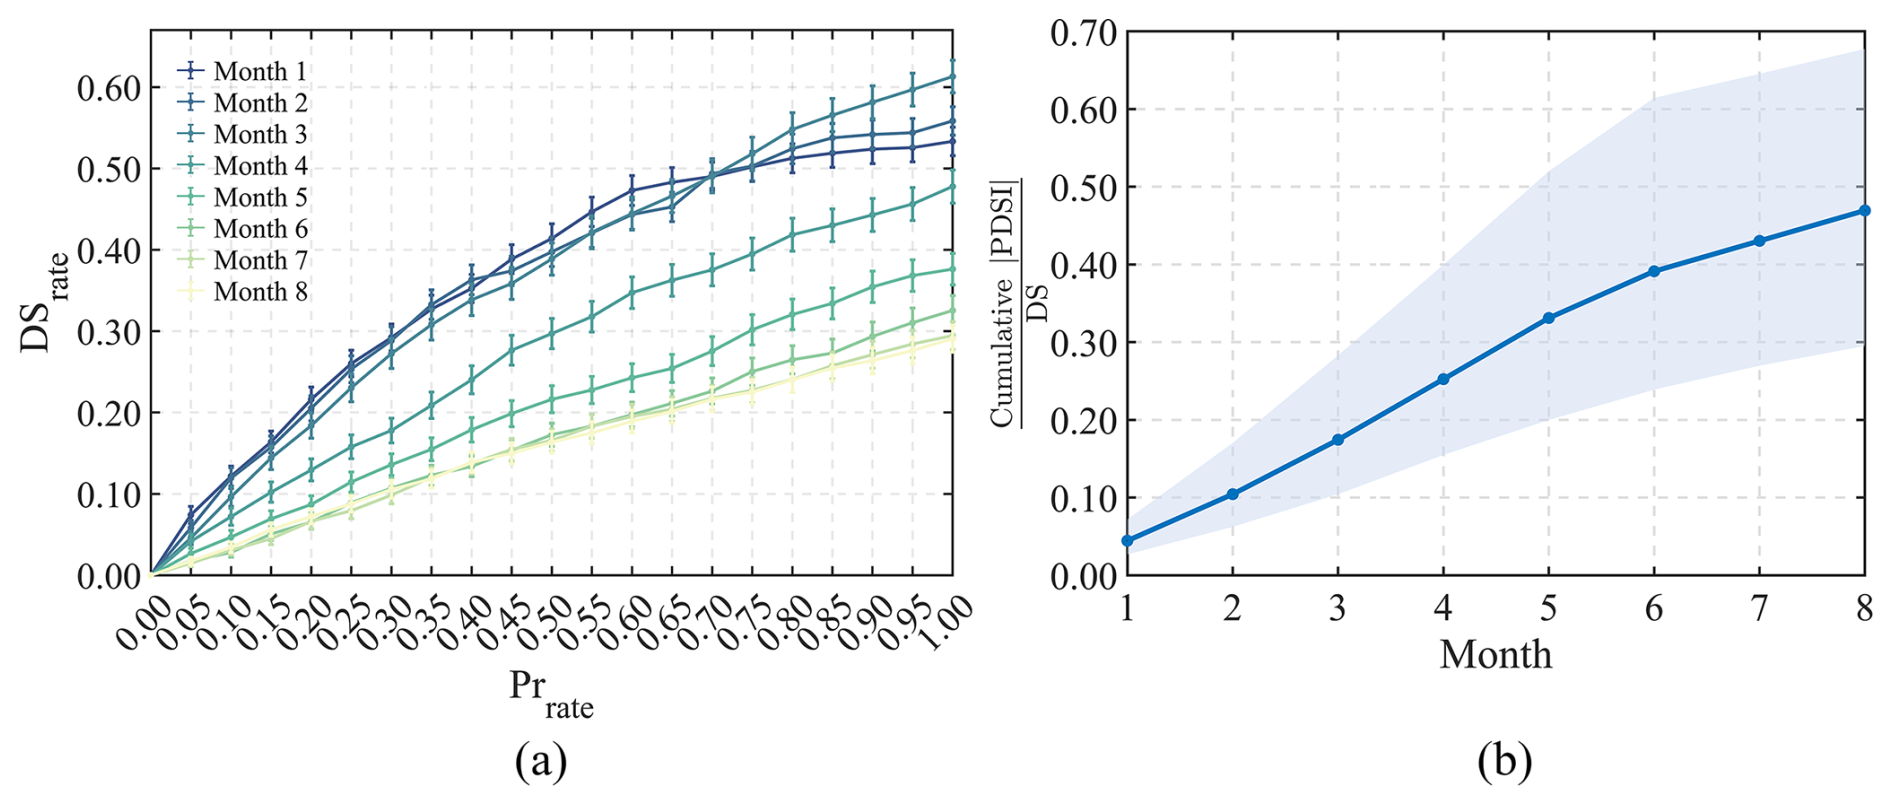
Figure 4DS responses to hypothetical precipitation perturbations and cumulative absolute PDSI from event onset to a given month within a single event relative to the DS of that event during DDP in China. (a) Mean responses under different hypothetical precipitation perturbations for t1∼t8 across all MYD events, with error bars representing standard error. (b) Temporal evolution of during DDP across all MYD events.
To preserve regional differences, MYD events were identified and analyzed separately at each grid across the study area, rather than being calculated from regionally averaged conditions. By retaining individual grid-level responses, the analysis preserves spatial heterogeneity while comprehensively reflecting the overall MYD response characteristics across the study area. Based on these grid-level events, the changes in DS were not proportional along the increasing precipitation gradient. Within the same prrate range from 0 to 1, all timings from t1 to t8 exhibited a similar nonlinear diminishing-return response pattern (Fig. 4a). The overall responses for t1, t2, and t3 remained relatively close, whereas a clearer reduction emerged from t4 onward. Effect sizes between two groups were evaluated using Cohen's d, and the magnitude of differences was quantified using its absolute value (hereafter referred to as Cohen's d). Pairwise statistical comparisons further showed that although the differences among t1∼t3 were statistically significant (p<0.001), the corresponding effect sizes were extremely small (Cohen's ) (Table S3). In contrast, comparisons involving t4 exhibited substantially larger effect sizes (Cohen's ) (Table S3). These results indicate that, when aggregated across all MYD events over the study area, the overall drought attenuation efficiencies associated with t1∼t3 remained relatively close before a clearer decline emerges from t4 onward.
Since hypothetical precipitation inputs applied at a given tforcing can only influence the subsequent stage of MYD evolution, cumulative deficits were further calculated to quantify the drought impacts accumulated before each timing. Because PDSI values during MYD events remain below the drought threshold (), cumulative absolute PDSI was used in the analysis. Based on this, the ratio of cumulative absolute PDSI from event onset to a given month within a single event relative to the DS of that event was defined to quantify the proportion of drought impacts accumulated before each tforcing. The ratio increased progressively with MYD development across all MYD events (Fig. 4b). The values corresponding to t1, t2, t3, and t4 were approximately 0.04, 0.10, 0.17, 0.25, respectively. These results indicate that a progressively larger fraction of DS had already accumulated by later tforcing during MYD development, thereby reducing the remaining alleviation potential.
Within the relatively early MYD stages (t1∼t3), further basin-scale analyses of pairwise comparisons among t1∼t3 showed that the distinctions among early tforcing became substantially more pronounced (Fig. S4). The median Cohen's d values for pairwise comparisons among t1∼t3 generally exceeded 0.80 in all ten river basins, corresponding to large effect sizes, while the minimum values were mostly greater than 0.50, indicating at least medium effect sizes. These results indicate that the differences among t1∼t3 remain distinguishable at the river basin scale, supporting further investigation of attenuation efficiency differences among early tforcing.
4.2 Validation of the MYD attenuation efficiency coefficient in China
For each grid, the toptimal was first identified based on the DAQM-derived k. Figure 5a shows the spatial distribution of the corresponding toptimal across the study area. Overall, t1 dominates, accounting for 58.79 % of the grids, whereas t2 and t3 account for 22.11 % and 11.06 %, respectively. To further evaluate the robustness of the DAQM-derived toptimal, an independent estimate was obtained from DSrate responses (Fig. S5). During the numerical experiments, it was found that the identified toptimal for a given MYD event was not always identical across different hypothetical precipitation perturbation scenarios, indicating that precipitation perturbation magnitude itself can influence the identified toptimal. To reduce the influence of perturbation magnitude on toptimal identification, 21 hypothetical precipitation perturbation scenarios (prrate=0, 0.05, 0.10, …, 1.00) were separately evaluated for each MYD event, thereby integrating both small and relatively large perturbations into a comprehensive evaluation method. For each scenario, the corresponding optimal timing was first determined according to the maximum DSrate among different tforcing. The mode of the resulting 20 optimal timings was then used to represent toptimal across different precipitation perturbation magnitudes (within the mode-based identification process, scenario without additional precipitation input, i.e., prrate=0, was not included because identical DSrate across all tforcing prevented a unique optimal timing from being identified), hereafter referred to as the mode-based approach. Because toptimal is expressed as a discrete positive integer, the mode was adopted instead of the mean or median to ensure that the identified toptimal remained physically interpretable as an integer month. Notably, the DAQM-based estimates are also derived from all hypothetical precipitation perturbation scenarios through least-squares fitting, making the mode-based and DAQM-derived results directly comparable. The mode-based approach yields proportions of t1 (67.84 %), t2 (12.06 %), and t3 (14.57 %) (Fig. S5). Comparison between the two approaches shows that 75.88 % of the grids exhibit identical toptimal (Fig. 6b). Further analyses focusing only on grids where the two approaches yield identical toptimal show proportions of t1 (72.84 %), t2 (11.92 %), and t3 (10.60 %) (Fig. S6).
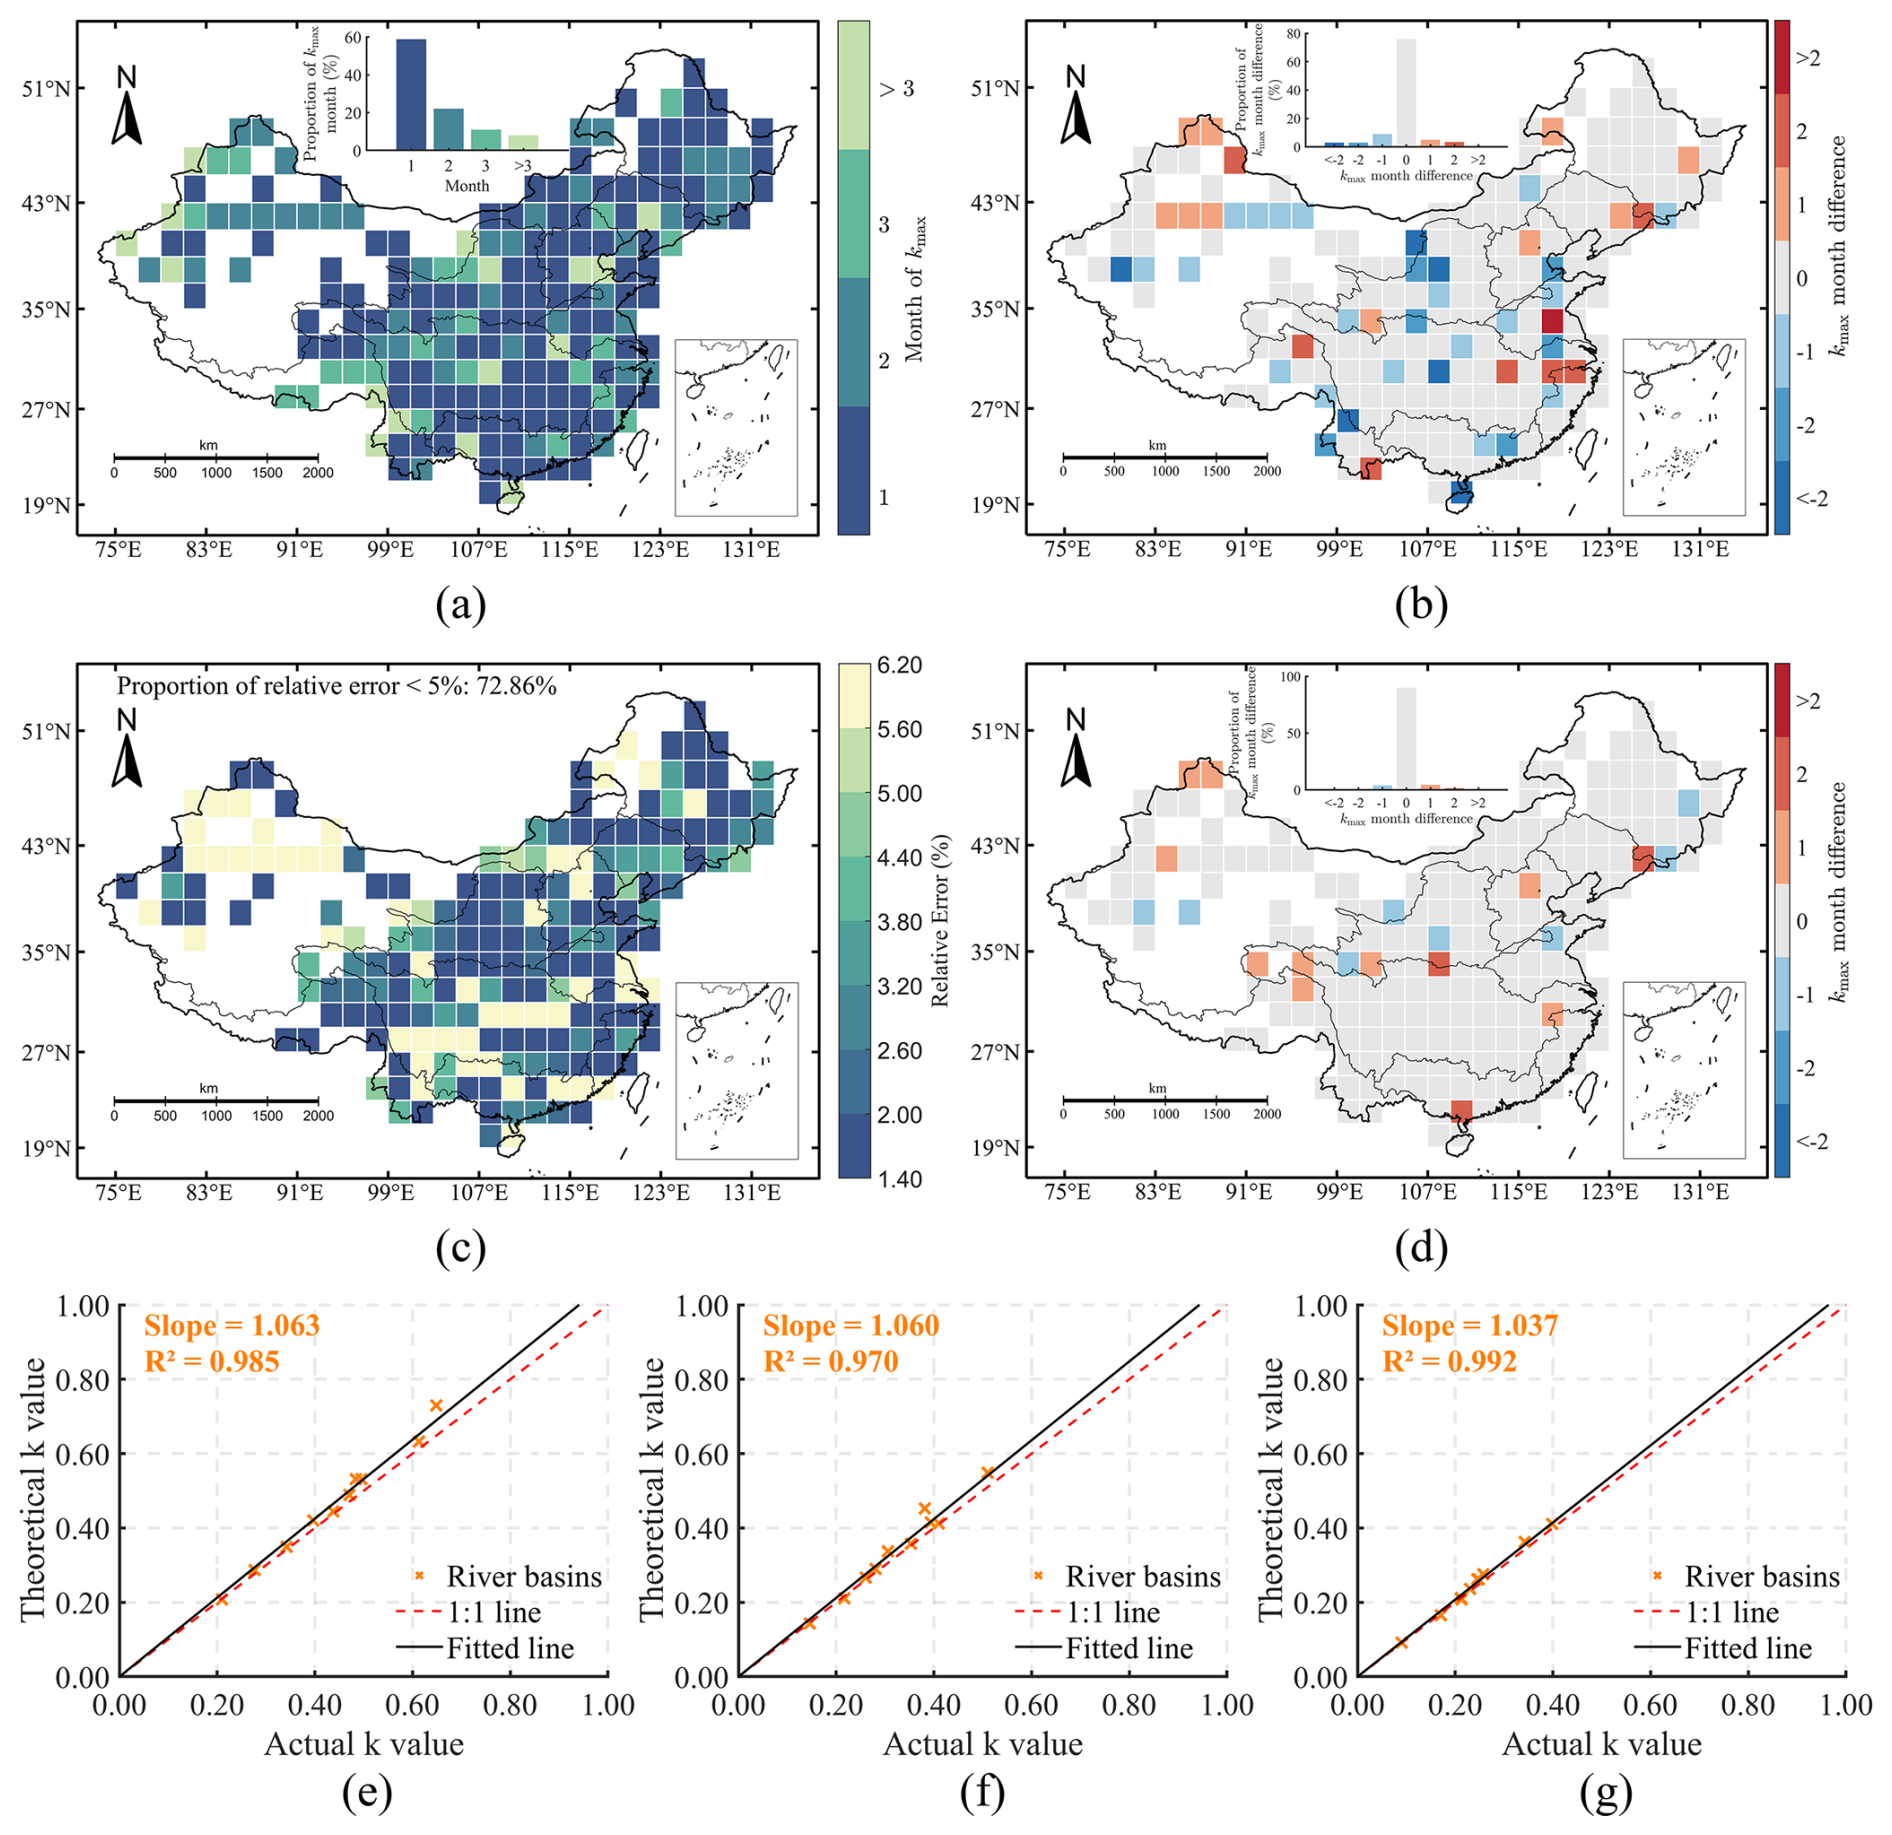
Figure 5Validation and robustness assessment of the MYD attenuation efficiency coefficient (k). (a) Spatial distribution of the DAQM-derived toptimal for each grid. The inset shows the frequency histogram of the DAQM-derived toptimal across all grids. (b) Spatial distribution of toptimal differences (mode-based toptimal minus DAQM-derived toptimal). The inset shows the frequency histogram of timing differences between mode-based and DAQM-derived toptimal across all grids. (c) Spatial distribution of ϵ for each grid. (d) Spatial distribution of toptimal differences (small perturbation-based toptimal minus DAQM-derived toptimal). The inset shows the frequency histogram of timing differences between small perturbation-based and DAQM-derived toptimal across all grids. (e–g) Median actual versus median theoretical k values for the ten major river basins in (e) t1, (f) t2, and (g) t3. The red dashed line is the 1:1 line. The black solid line is the fitted line based on values from 10 river basins. Orange crosses are the values for individual river basins.
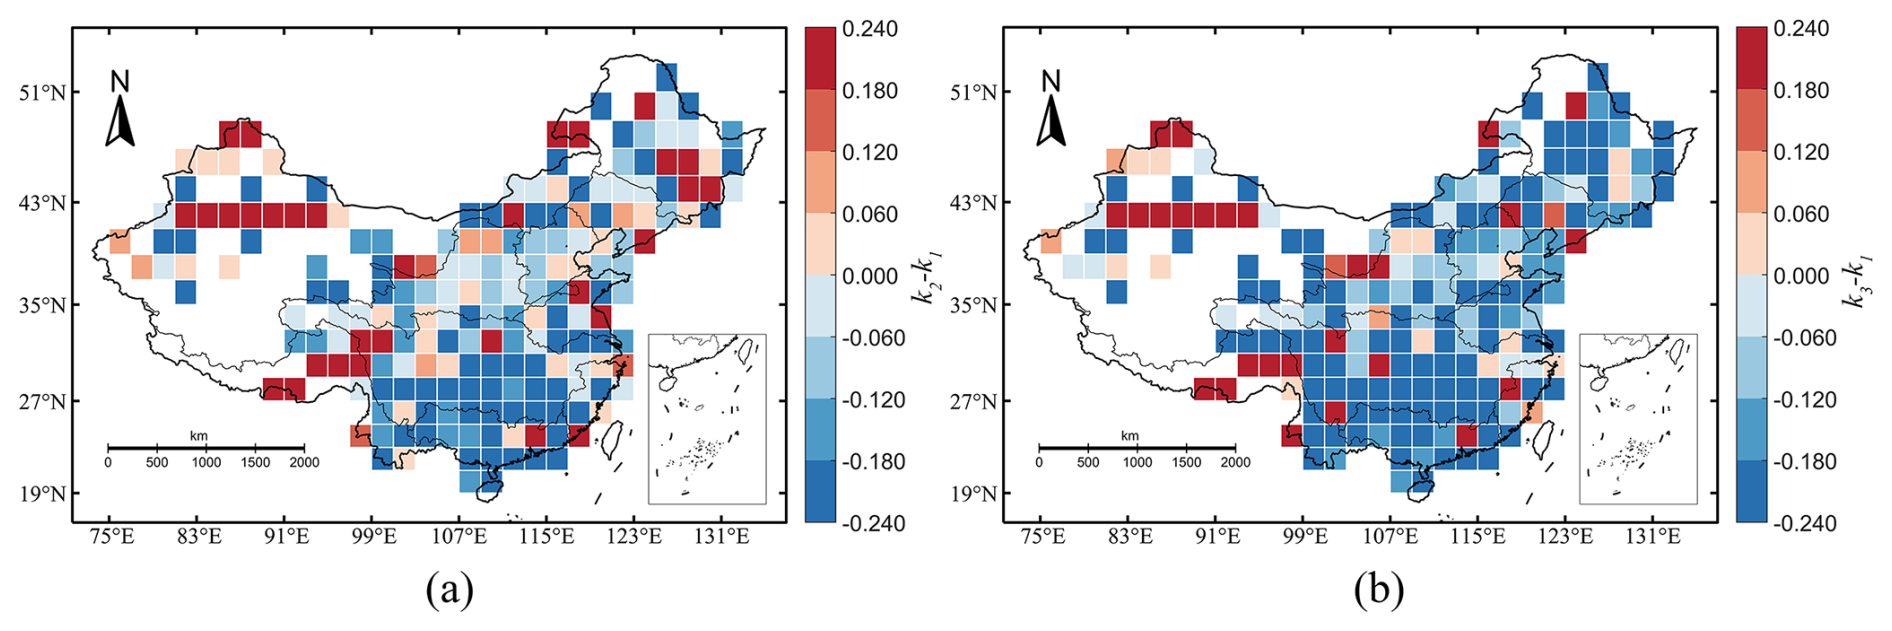
Figure 6Spatial distribution of the changes in k (Δk) derived from the DAQM model. (a) Change in k between t2 and t1 (Δk21). (b) Change in k between t3 and t1 (Δk31).
According to the DAQM constructed in Sect. 3.4, as the increment in prrate approaches zero, the corresponding DSrate also approaches zero. Under this condition, the estimated value of k approaches the actual k. Therefore, the actual values of k can be approximated using the numerical experiment controlling a small perturbation of a individual input variable (prrate=0.05) and its corresponding DSrate. Based on this principle, actual values of k were calculated from the numerical experiments and compared with the theoretical k values derived from the DAQM developed in Sect. 3.4, at the grid scale. Figure 5c shows the spatial distribution of ϵ across all given grids, with 72.86 % of the grids exhibiting ϵ values below 5 %. Slightly larger deviations mainly occur in parts of northern and southern China, whereas semi-arid regions generally exhibit relatively stronger agreement between theoretical and actual estimates. Despite these regional differences, the overall ϵ remains modest, with most grids exhibiting values around 6 %, confirming the robustness of the DAQM across the study area (Figs. 5c and S4). To further evaluate whether ϵ influences toptimal, the small perturbation experiments (prrate=0.05) were also used to independently identify toptimal (Fig. S7). Comparison with the DAQM-derived toptimal shows agreement in 89.95 % of the grids (Fig. 5d), indicating that the ϵ does not substantially alter the spatial pattern of toptimal. To further evaluate the robustness of the DAQM framework at the basin scale, comparisons between theoretical (DAQM-derived) and actual k values (small perturbation-based) were conducted across the ten major river basins in China. A strong positive correlation was observed between the theoretical and actual values, with R2 values exceeding 0.90 for t1, t2, and t3 across the ten river basins in China (Fig. 5e–g). The comparison results for each month revealed no significant deviation from the 1:1 reference line, with slopes of 1.063, 1.060, and 1.037 for t1, t2, and t3, respectively (Fig. 5e–g).
Overall, these results demonstrate the robustness and applicability of the theoretical values at both the grid and river basin scales. For this reason, the DAQM was further employed to investigate drought attenuation efficiency at different tforcing. This quantitative model was also used to identify toptimal for precipitation input across t1, t2, and t3.
4.3 Quantification of the relationship between MYD attenuation efficiency and precipitation input timing in China
To identify toptimal in various river basins during t1, t2, and t3, a series of numerical experiments were conducted using the DAQM. Figure 6 presents the spatial distributions of the changes in k between t2 and t1 (), and between t3 and t1 (). As demonstrated by the validation results shown in Sect. 4.2, the DAQM framework performs robustly across most regions, supporting the interpretation of the following spatial patterns. Additional analyses based on small perturbation experiments (prrate=0.05) further confirm that the DAQM-derived results generally capture the spatial patterns (Fig. S8). Strong consistency was observed between the responses derived from the small perturbation experiments and those obtained from the full hypothetical precipitation-gradient framework, with correlation coefficients of R=0.957 for Δk21 (Figs. 6a and S8a) and R=0.955 for Δk31 (Figs. 6b and S8b) (p<0.001 in both cases). Therefore, the spatial patterns shown in Fig. 6 can be considered reliable for interpreting drought attenuation efficiency.
To enable a clearer comparison of magnitude among cases where Δk<0, absolute values were used. Notably, the larger absolute values of negative Δk (Δk<0) were mainly observed in the humid river basins of southern China, particularly in the Pearl River and Yangtze River basins (Fig. 6 and Table 1). By comparison, smaller absolute values of negative Δk were detected in the arid and semi-arid northern regions of China, particularly in the Liao River basin (Fig. 6 and Table 1). Moreover, in 118 out of 199 grids (59.30 %), the absolute values of negative Δk31 were larger than those of Δk21 (Fig. 6 and Table 1). This disparity indicates that, in more than half of MYD occurrences, the greatest attenuation efficiency tends to occur at earliest tforcing (t1). Interestingly, we found that 40 out of 199 grids (20.10 %) exhibited positive values in both Δk21 and Δk31 (Fig. 6). These results indicate that, in a non-negligible portion of grids, the greatest attenuation efficiency does not occur at t1.
Table 1Summary of the number of grids, median values of DD, and changes in theoretical k (derived from the DAQM model; , , and ) and actual k (derived from the small perturbation experiments with prrate=0.05), across the ten river basins and all of China.
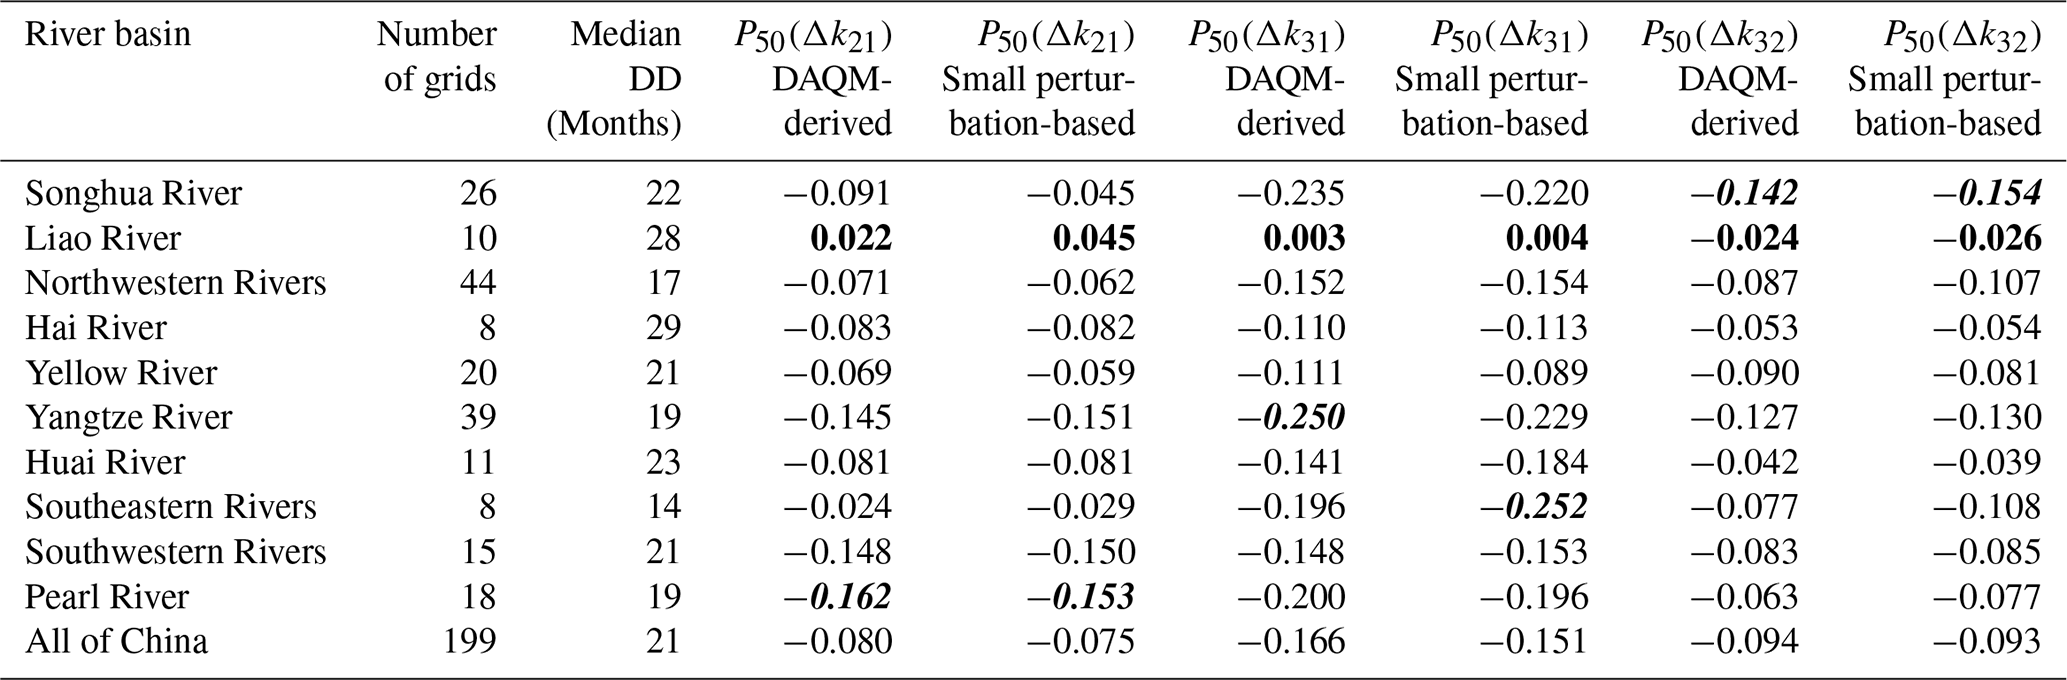
Note: The bold value marks the maximum P50 among the ten river basins in China, and the bold-italic value marks the minimum P50. P50 values are derived from both the DAQM-derived and small perturbation-based (prrate=0.05) results.
These experiments also aimed to identify the key drought event characteristics responsible for the variation in tforcing. Since DS represents the cumulative water deficit over the entire DD, and k is derived from DS, DD constitutes an important factor influencing k in addition to the standardized characteristics of PDSI itself. Therefore, the spatial distribution and statistical characteristics of DD are examined to help interpret basin-scale differences in k (Fig. 7 and Table 1). We summarize the probability density function (PDF) of Δk21, and Δk31 for all of grid-level MYD events across 10 river basins in China (Fig. 7 and Table 1). The Δk values exhibit a roughly normal distribution across river basins (Fig. 7). The median values of both Δk21 and Δk31 are negative in 9 out of 10 basins, with the median of Δk31 being lower than that of Δk21 (Table 1). In most basins, the standard deviation of Δk31 is also larger than that of Δk21, indicating greater variability in the efficiency difference between t3 and t1 (Fig. 7). These results suggest an efficiency advantage of early precipitation input (t1>t2 and t1>t3). This advantage becomes more pronounced when comparing t1 and t3. However, positive Δk21 and Δk31 values were found in 33.67 % and 23.12 % of all grids, respectively (Fig. 6a and b). Similar results were also evident in the PDFs for all of China and each individual basin (Fig. 7). Consistent patterns are observed in both the DAQM-derived results (Fig. 7) and the small perturbation-based results (Fig. S9). These results suggest a non-negligible role of the higher sensitivity of normally distributed standardized drought indices to identical precipitation perturbations under more severe drought conditions. Longer DD tends to be associated with Δk values closer to or even above zero (Fig. 7 and Table 1). In particular, the Liao River, with a relatively long DD of 28 months (DDall China=21 months), shows median Δk values of 0.022 for Δk21 and 0.003 for Δk31 (Fig. 7 and Table 1). In contrast, the Pearl River, characterized by a shorter DD of 19 months, exhibits more negative median Δk values of −0.162 and −0.200 for Δk21 and Δk31 (Fig. 7 and Table 1), respectively.
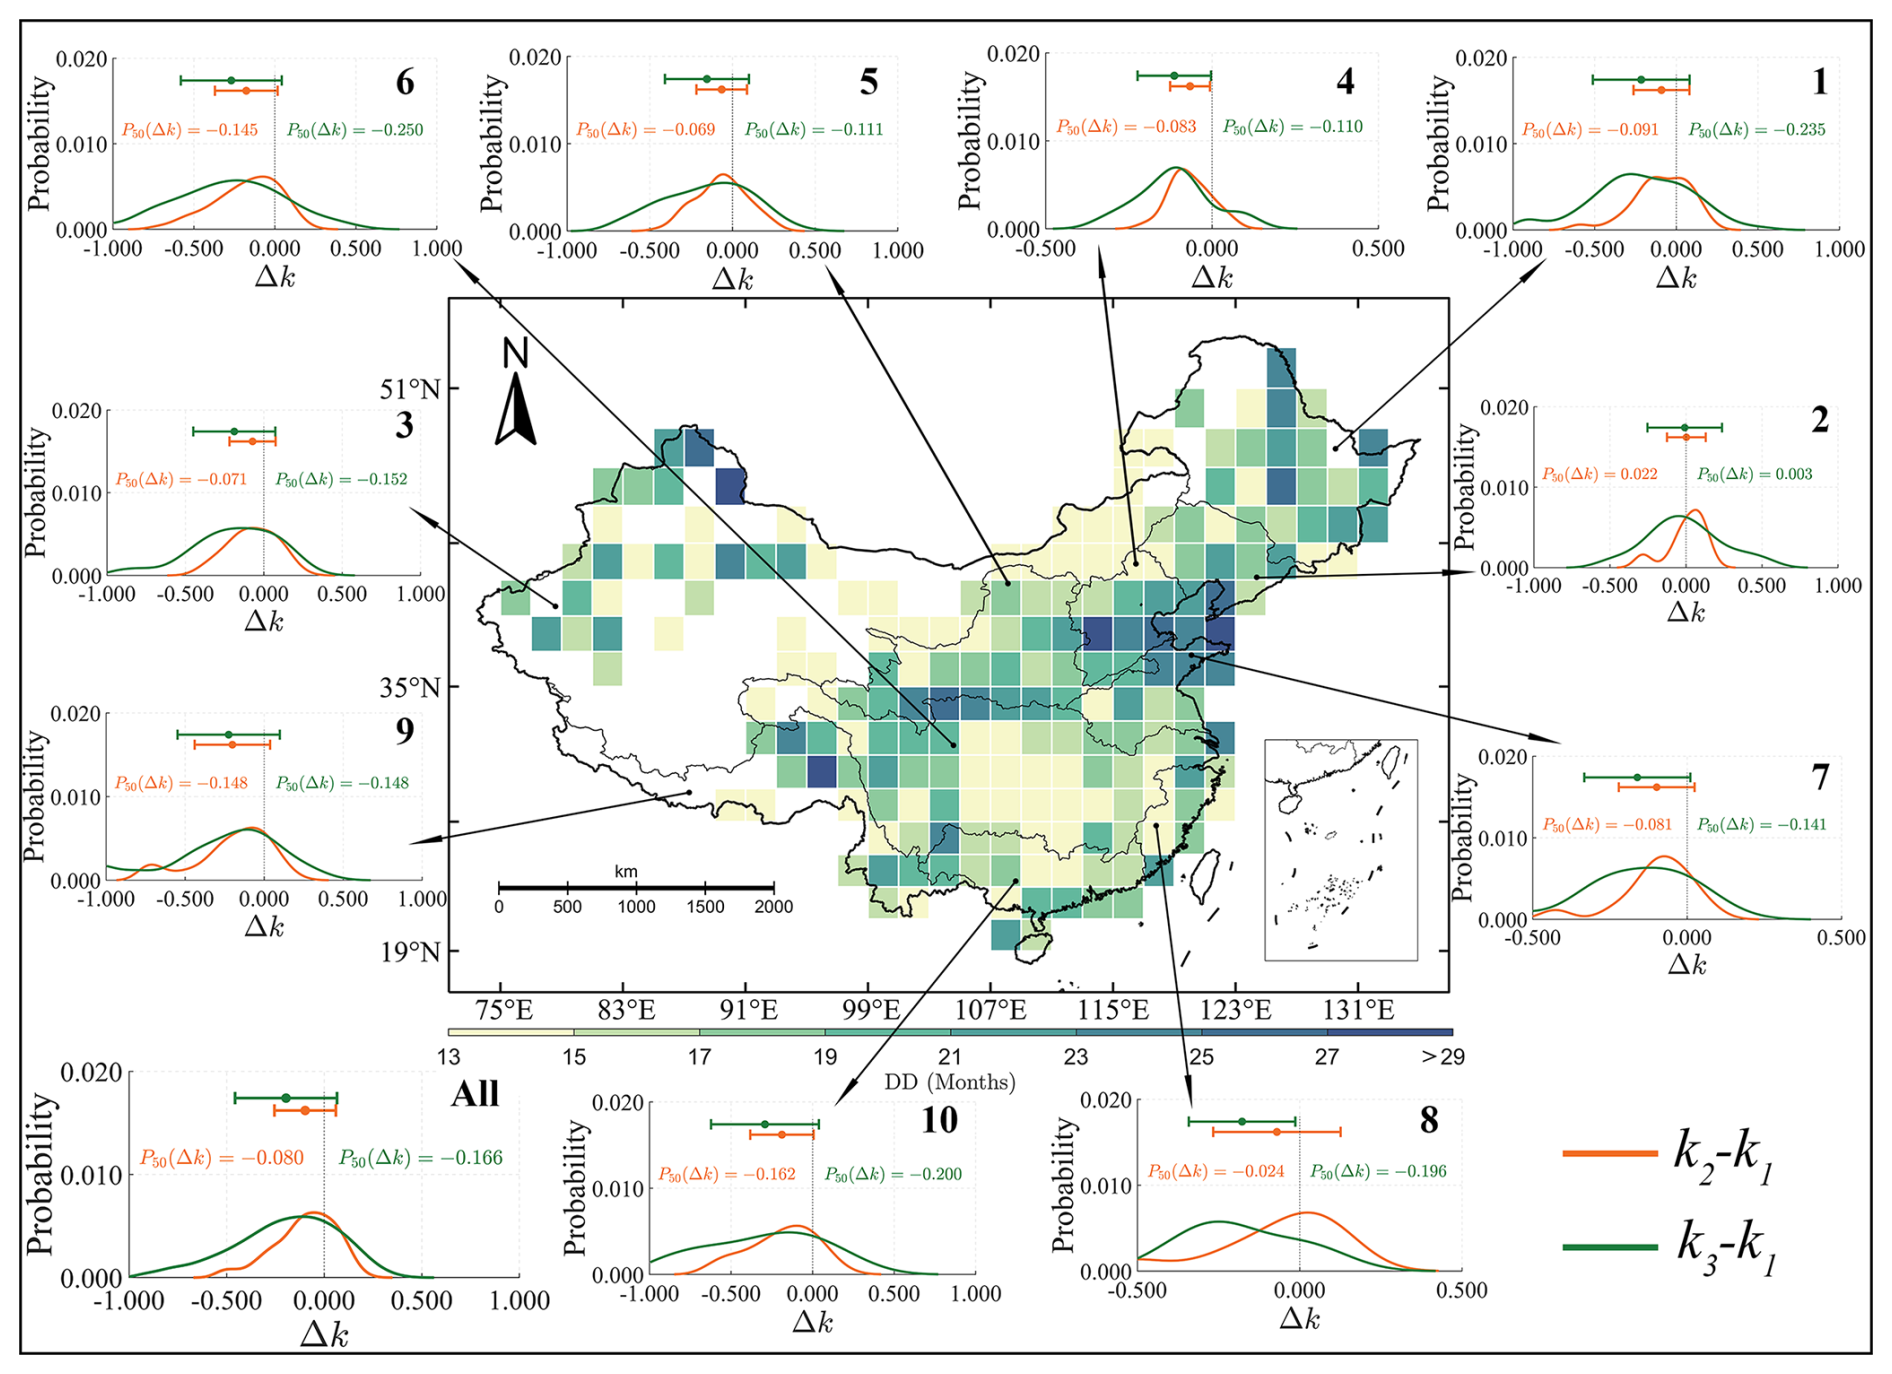
Figure 7Spatial distribution of the median drought duration from 1991 to 2020 across the 10 river basins in China. Surrounding panels show the probability distribution of Δk derived from the DAQM model for all of China and each basin, based on grid-level MYD samples. Specifically, the orange lines represent Δk21, and the green lines represent Δk31. The x-axis in each panel denotes Δk, while the y-axis denotes probability. The number in the upper-right corner of each panel indicates the basin code.
To further investigate the influence of DD as an important event characteristic, an equal-width binning method was applied to examine the variation of Δk under different DD values. Specifically, the original DD values of the selected MYD events ranged from 13 to 51 months. These events were grouped into bins according to their DD values. To ensure the robustness of the results (each bin contained no fewer than 10 grid-level events), the DD range was limited to 13 to 40 months, and the bin width was set to 4 months. This setting yielded a total of seven bins (Fig. 8). We calculated the median values of both Δk and DD within each bin. As shown in Fig. 8, we found a positive correlation between DD and Δk, with R2 values of 0.526 and 0.578 for Δk21 and Δk31, respectively. Notably, when DD exceeds 29 months (as shown in Fig. 8), the Δk values approaching zero, indicating that the drought attenuation efficiencies of t2 and t3 become comparable to that of t1. In contrast, when DD is shorter (around 17 months, as shown in Fig. 8), t1 demonstrates notably higher drought attenuation efficiency than t2 and t3. These results suggest that DD is a key factor influencing toptimal.
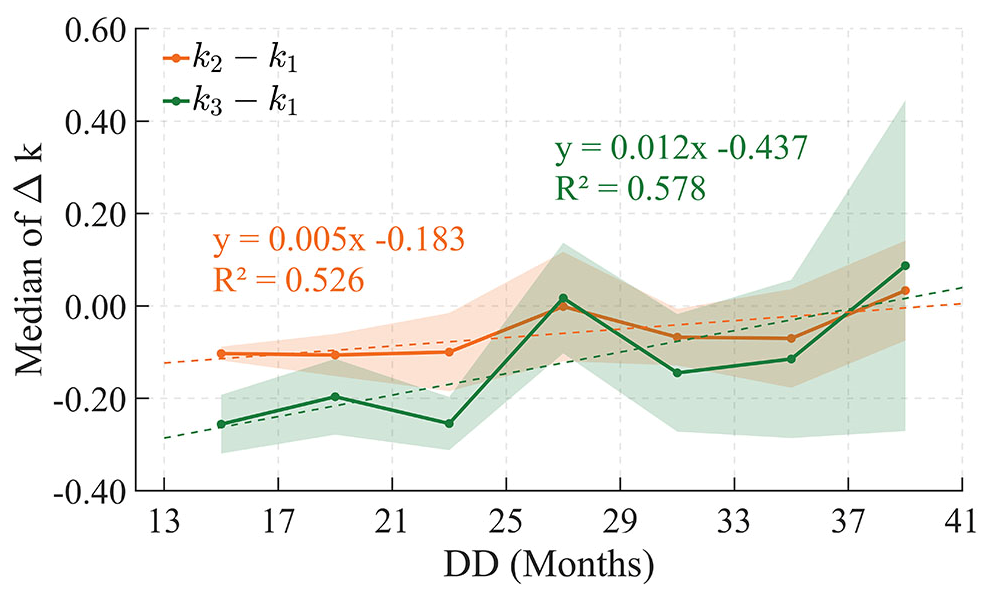
Figure 8Median Δk of MYD under different DD. The orange line represents Δk21, and the green line represents Δk31. Shaded areas indicate half the standard error as the confidence interval.
To clarify the alleviation advantages of the toptimal, we consider both the cumulative temporal advantage of earlier precipitation input and the statistical properties of standardized drought indices. Figure 9 and Table 2 present a comparison between the drought attenuation efficiency of toptimal and those of t1 and tDIP (the month corresponding to DIP within a MYD event). The corresponding k at t1 (k1), tDIP (kDIP), and toptimal (kmax) exhibit differences. For simplicity, two ratios, and , are used to quantify the differences in k between toptimal and t1, and between toptimal and tDIP, respectively. In terms of magnitude, is typically close to 1, while consistently exceeds 2 (Table 2). From the perspective of the cumulative temporal advantage of earlier precipitation input, t1 tends to dominate (Fig. 9a and Table 2). Nevertheless, the presence of grids with suggests toptimal>1 should not be overlooked (Fig. 9a). At the basin scale, t1dominates in most regions, except in the Liao River basin, where the median reaches 1.135 (Table 2). In contrast, toptimal offers a more substantial advantage in drought attenuation efficiency compared to tDIP (Fig. 9b and Table 2). This advantage is particularly pronounced in the Liao River and Songhua River basins, where the median values reach 15.430 and 12.555, respectively. By contrast, the advantage of toptimal is less evident in the Southeastern River and Hai River basins, with median values of 3.428 and 2.413, respectively.
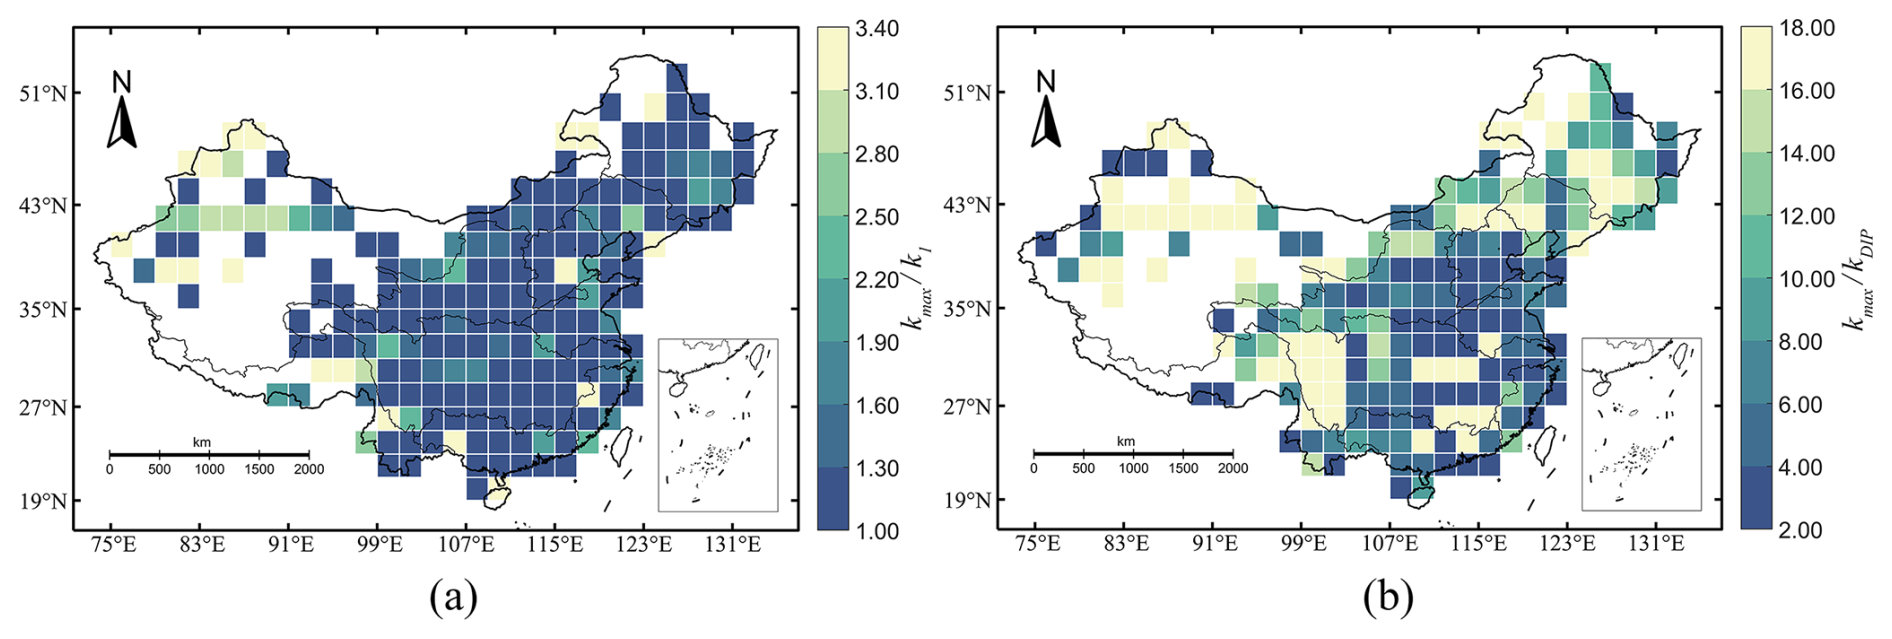
Figure 9Spatial distribution of the ratios of k derived from the Optimal Solution Model relative to those derived separately from Conceptual Model 1 and Conceptual Model 2. (a) The ratio of k between the toptimal and t1 (), (b) the ratio of k between the toptimal and tDIP ().
Table 2Summary of the median values of and across the ten river basins and all of China.
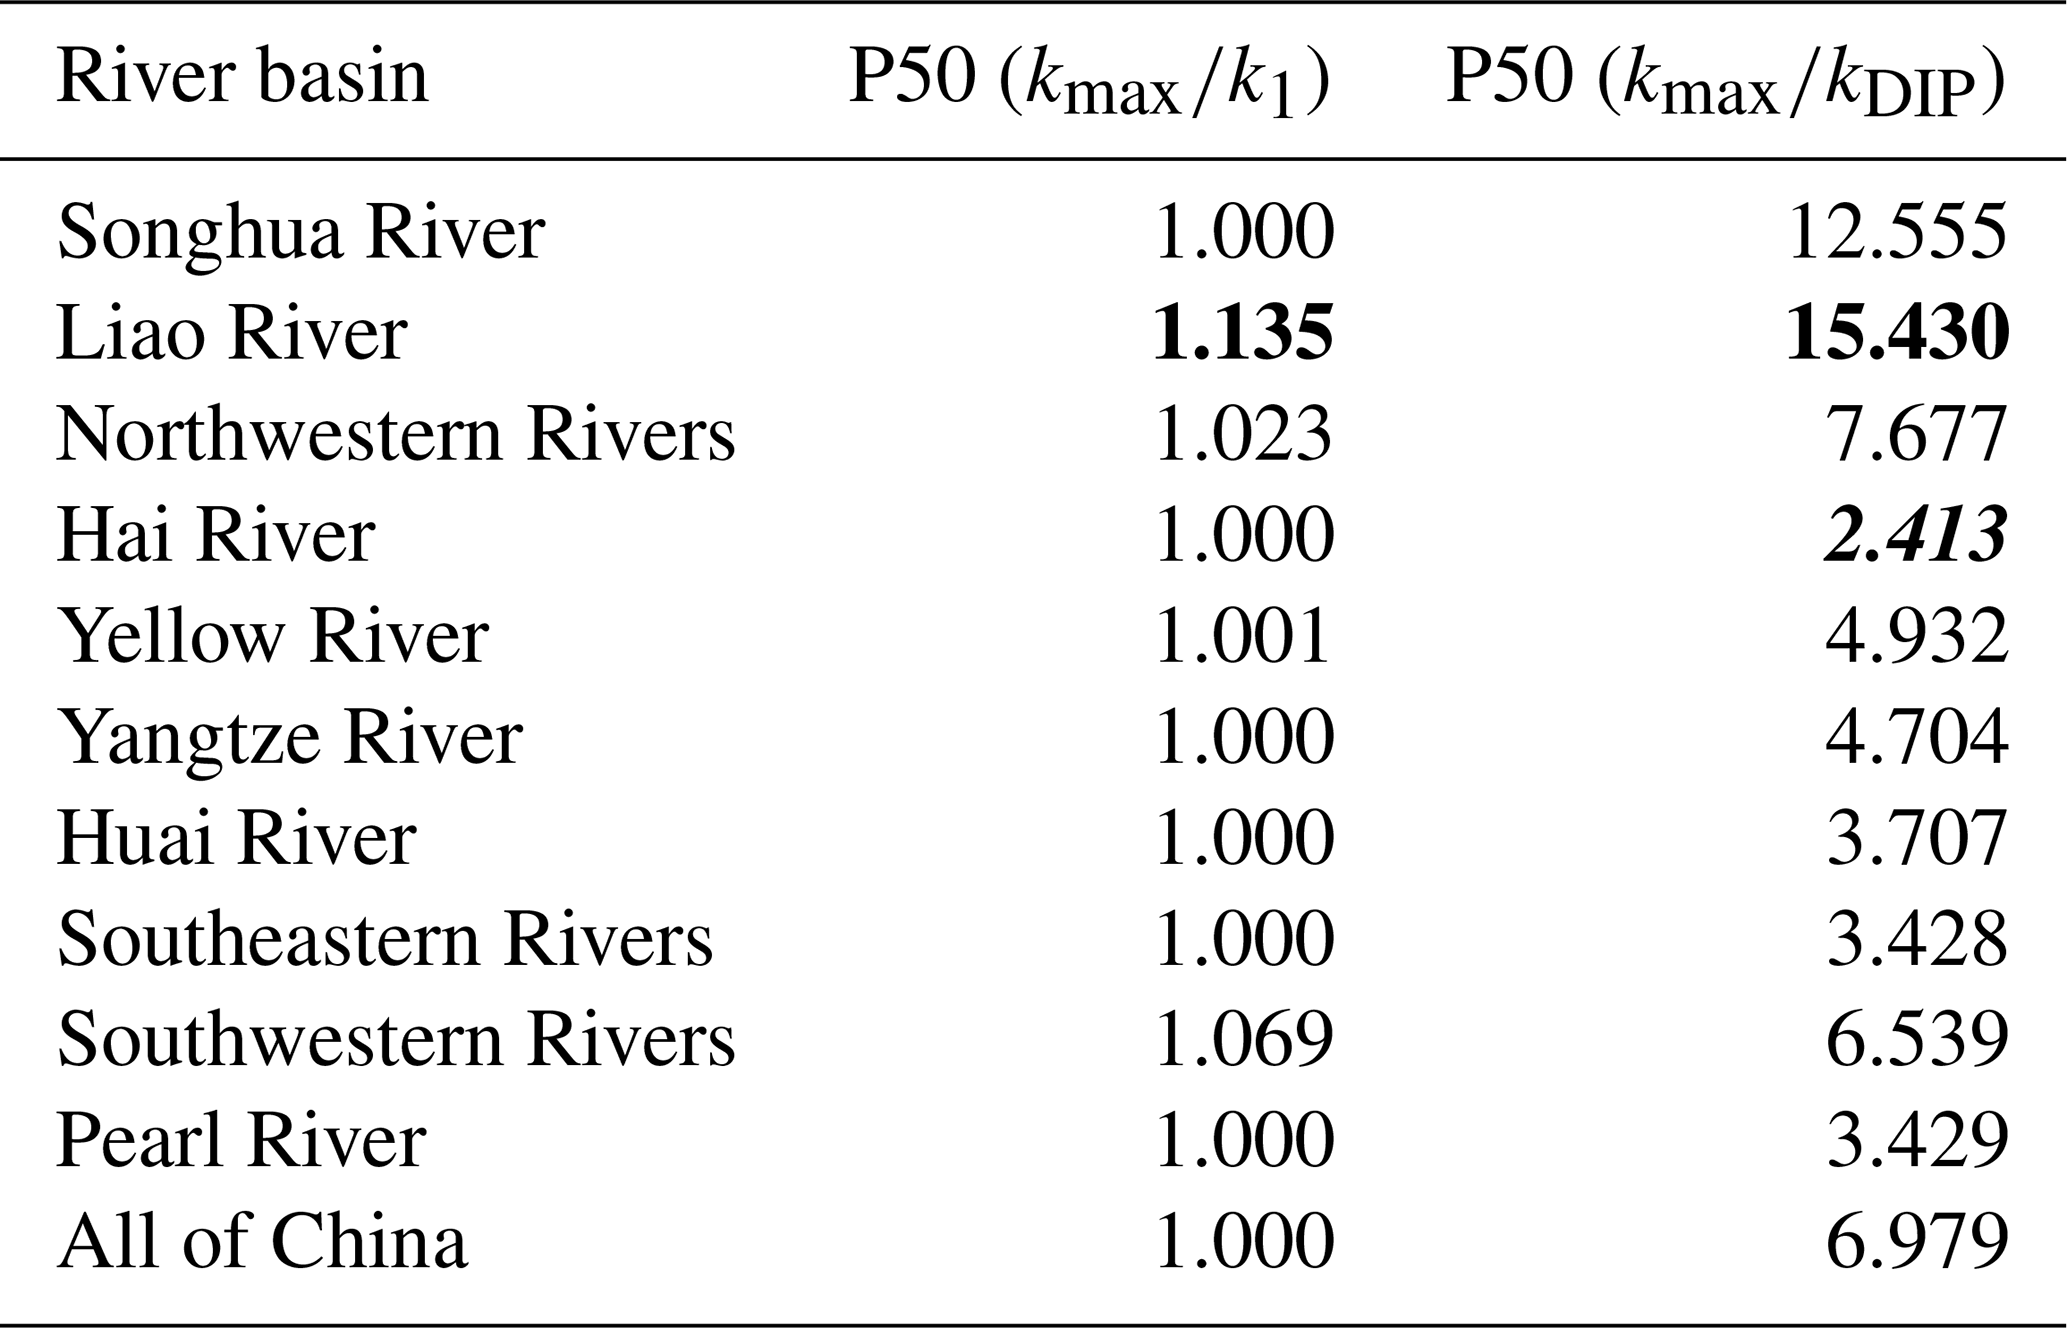
Note: The bold value marks the maximum P50 among the ten river basins in China, and the bold-italic value marks the minimum P50.
5.1 MYD alleviation response to hypothetical increased precipitation
Current studies on precipitation-based drought alleviation, referring to the dominant role of precipitation in driving drought alleviation, have primarily focused on the early stage of drought development (DeChant and Moradkhani, 2015; Livneh and Hoerling, 2016; Wu et al., 2018). Yang et al. (2017) integrated early precipitation input with drought-induced losses and concluded that earlier precipitation is more effective in alleviating drought impacts. This interpretation is consistent with the cumulative temporal advantage associated with earlier precipitation input considered in this study. However, due to the statistical properties of standardized drought indices, more severe drought conditions are often associated with higher attenuation efficiency under identical precipitation perturbations (Fig. 1). To further interpret the mechanisms controlling drought attenuation efficiency, two conceptual models were considered (Fig. S2). Conceptual Model 1 considers the same hypothetical precipitation increase applied at different tforcing within an MYD event (Fig. S2b). Because the precipitation perturbation can influence DS only from tforcing onward, earlier tforcing allows a longer period during which the drought process can be affected. Consequently, toptimal under Conceptual Model 1 tends to occur at the beginning of the event (t1), i.e., toptimal→t1. Conceptual Model 2 features the same precipitation forcing applied at the same tforcing, but under different PDSI values (Fig. S2c). As a standardized index, PDSI (similar to widely used normally distributed standardized indices such as SPEI and SPI) exhibits tail sensitivity, whereby values further below the drought threshold tend to experience larger numerical responses under identical precipitation perturbations. Because DS is calculated as the cumulative sum of monthly PDSI values over DD, this property of PDSI also affects event-level DS. This mechanism forms the basis of Conceptual Model 2 and favors toptimal toward the month of DIP occurrence (tDIP), i.e., toptimal→tDIP. The interaction between these two mechanisms suggests that toptimal should theoretically fall within the interval from t1 to tDIP, because tDIP of MYD events typically occurs much later than the onset (tDIP≫t1) (Fig. S2d). The nonlinear pattern in DS response to increased precipitation (Figs. 1 and 4) can be more comprehensively understood by jointly considering these two conceptual models. To further clarify this relationship, attenuation efficiencies at different tforcing were quantified using the DAQM developed in Sect. 3.4. Under the same hypothetical precipitation forcing, a higher value of k at a given tforcing indicates greater drought attenuation efficiency. The results further show that attenuation efficiencies among t1∼t3 remain relatively close, whereas clearer separation emerges after t4 (Fig. 4a and Table. S3). This pattern suggests that t1∼t3 constitute an important early-stage response window during which the effects described in Conceptual Models 1 and 2 partially offset each other. However, progressively increasing during drought development (e.g., approximately 0.04, 0.10, 0.17, and 0.25 at t1, t2, t3, and t4, respectively) indicate the continuous accumulation of drought impacts during MYD evolution. Once reaches a sufficiently high level (approximately 0.25 at t4), the cumulative temporal advantage associated with earlier precipitation input becomes dominant. These findings further reflect the complexity of drought alleviation processes and can be interpreted through the interaction between the two conceptual models.
Consistent with several existing studies (Pan et al., 2013; Haile et al., 2020), t1 remains the dominant toptimal across China. However, we noted that t2 and t3, while occurring later than t1, are still non-negligible in the early stage of MYD. Spatially, the grids where t2 and t3 are dominant account for 22.11 % and 11.06 % of all grids, respectively (Fig. 5a). According to the classification of climate zones based on average annual precipitation (Yang et al., 2022), compared with the humid river basins in southern China, the arid and semi-arid northern regions exhibited a higher probability that drought attenuation efficiency at t2 and t3 exceeds that at t1 (Figs. 6 and 9a). This interpretation is supported by the strong agreement between theoretical and actual k values shown in Fig. 5. We further noticed that the Liao River basin (semi-arid basin) and Pearl River basin (humid basin) exhibited relatively high and low MYD attenuation efficiency, respectively. This difference may be associated with the generally more severe drought conditions in the Liao River basin compared to those in the Pearl River basin (Huang et al., 2019; Lai et al., 2024; Zhang et al., 2025). Due to the statistical properties of standardized drought indices, increased precipitation tends to induce stronger attenuation responses under more severe drought conditions. Consequently, the influence of the second mechanism becomes relatively more evident in arid and semi-arid regions, increasing the probability that t2 or t3 may exceed t1 in attenuation efficiency within the early-stage response window. By contrast, in humid basins characterized by relatively milder drought conditions, the cumulative temporal advantage associated with earlier precipitation input remains dominant, resulting in a stronger preference for t1. This conclusion was consistent with previous findings (Wang et al., 2025), showing the importance of earlier precipitation input for alleviating MYD in the humid basins of China.
Overall, our results do not suggest that “later is better” for MYD alleviation. Instead, they reveal the existence of an early-stage response window during which t2 and t3 may still exhibit attenuation efficiencies comparable to or even exceeding that of t1. This finding is particularly important for MYDs because these events involve cumulative water deficits across seasons and years, making the timing of precipitation input especially critical for drought alleviation. Missing t1 does not necessarily imply that the opportunity for maximum attenuation efficiency has already been lost, provided that precipitation input still occurs within the early-stage window.
5.2 Robustness of optimal timing identification within the early-stage response window
The basin-scale Cohen's d results indicate that the attenuation efficiency differences among t1∼t3 are distinguishable and cannot be attributed to random variability or noise (Fig. S4). Accordingly, the robustness of the DAQM-derived toptimal was evaluated through comparisons among the DAQM-derived results, the mode-based results, and the small perturbation-based results. Despite methodological differences among these three approaches, all consistently indicate that t1 dominates overall, while the possibility that t2 and t3 may exceed t1 within the early-stage response window remains non-negligible (Figs. 5a, S5, S6, and S7).
Comparison between the mode-based and DAQM-derived approaches shows that 75.88 % of grids exhibit identical toptimal (Fig. 5b). The distribution of timing differences is approximately symmetric and centered around zero, suggesting that the discrepancies are spatially random rather than systematically biased. In addition, Fig. S6 shows that, even when only grids with identical results are considered, t2 and t3 still account for a substantial proportion of toptimal (11.92 % and 10.60 %, respectively), confirming their non-negligible role within the early-stage response period. Generally, small perturbation experiments (prrate=0.05) represent more frequently occurring weak perturbation conditions in real-world situations. The comparison between small perturbation-based and DAQM-derived estimates further supports the robustness of the identified toptimal. Although relative errors in k exist across grids, the overall relative error magnitude remains small across China, with 72.86 % of grids showing relative errors in k below 5 % and most of the remaining grids around 6 %, indicating relatively limited deviations overall. Even though 27.14 % of grids exhibit relative errors exceeding 5 %, this has limited influence on the identification of toptimal, as 89.95 % of grids show identical results between the two approaches (Fig. 5d). The distribution of toptimal differences in Fig. 5d further indicates that the remaining discrepancies are not systematically biased. In addition, compared with the small perturbation-based results, the DAQM-derived probability distributions of Δk appear smoother (Figs. 7 and S9), reflecting that the DAQM integrates attenuation responses across the full precipitation-gradient experiment.
Overall, the DAQM-derived results demonstrate strong robustness across multiple validation approaches. The DAQM provides a theoretical basis that helps interpret and justify the patterns observed in the numerical experiments, thereby offering a more physically interpretable basis for attenuation efficiency and toptimal identification.
5.3 Key drought event characteristics influencing MYD attenuation efficiency
Recent studies have shown that droughts are increasing in both frequency and severity (Dai et al., 2020; Fischer et al., 2025), although substantial regional differences exist. Similarly, Chen et al. (2025) highlighted that MYDs are also becoming more frequent and severe at global scales. To further characterize the dynamic evolution of MYD, three commonly used features include DD, DS, and DI. Among these, DD is a key factor for identifying MYDs, as MYDs are typically defined by a duration exceeding 12 months (Massari et al., 2022). DS represents the overall impact of MYD, while DI is related to the onset timing of the recovery stage. In current studies, standardized drought indices are commonly used to quantify drought severity (Mishra and Singh, 2010). According to the statistical characteristics of the normal distribution (Dai, 2011), drought indices responses to identical precipitation inputs can vary considerably depending on the magnitude of index values below the drought threshold. This aligns with Conceptual Model 2 presented in Sect. 5.1, where small increases in precipitation have the potential to induce substantial shifts toward alleviation when the index deviates far below the drought threshold. Our findings further indicate that t1 and tDIP of MYD do not coincide, especially in longer-duration MYD, where tDIP tends to occur much later than t1. With that in mind, we examined the relationship between DD and k. Our results demonstrate a positive correlation between DD and k in MYD (Figs. 7 and 8). Specifically, basins in northern China, characterized by longer DD, tend to have a higher probability of t2 or t3 being the toptimal within the early-stage response window, in contrast to southern basins with shorter DD (Fig. 7 and Table 1).
5.4 Limitations and uncertainties
Droughts are not only influenced by pr, but also by other non-precipitation factors such as wind speed, air temperature, radiation, and relative humidity, among others. These non-precipitation factors are widely used to estimate potential evapotranspiration. However, this study focuses solely on pr. This is primarily because drought alleviation mainly depends on the effective management and allocation of available water resources. In future studies, the framework could be further improved by considering these non-precipitation factors. Another limitation concerns the range of pr increase scenarios considered in our experiments. As shown in Fig. S3, the long-term mean and standard deviation of monthly pr are approximately comparable, indicating that the maximum increase corresponds approximately to one standard deviation. Increases beyond 100 % would therefore represent stronger anomalies that are less frequently encountered and were not considered. Future studies could assess the drought alleviation response under such conditions. It is also essential to recognize that our study is a retrospective analysis based on historical MYDs. This study provides a framework for exploring attenuation efficiency within the early-stage response window of MYD development. However, determining whether a drought event would develop into an MYD at an early stage remains a major challenge (Xu et al., 2021; Gumus, 2023). This is due to the complexity of the factors influencing the development of droughts into MYDs. Furthermore, this study currently focuses solely on meteorological drought. Research on other types of drought, such as agricultural, hydrological, and socio-economic droughts, will also be a key focus in future studies. Future research should evaluate the applicability of our framework to other types of drought. To this end, it is also necessary to further optimize the framework by fully considering additional influencing factors (Tian et al., 2022; Wu et al., 2022b; Meresa et al., 2023).
This study applied a series of numerical experiments involving hypothetical precipitation gradient increases to investigate the attenuation efficiency for 351 historical MYDs during 1991–2020 across ten river basins in China, based on monthly PDSI calculated from daily meteorological data. Following these experiments, we developed the DAQM, a single-parameter model designed to quantify drought attenuation efficiency through the key coefficient, k, with toptimal identified as the timing corresponding to kmax. The main conclusions can be summarized as follows:
(1) A nonlinear response relationship was identified between DS and hypothetical precipitation forcing applied incrementally along a gradient. Based on this relationship, the DAQM quantified attenuation efficiency and identified toptimal, and showed strong agreement with both the mode-based and the small perturbation-based estimates, confirming its robustness and applicability for characterizing attenuation efficiency during MYD evolution.
(2) Our results revealed the existence of an early-stage response window during MYD evolution, corresponding primarily to t1∼t3. Within this window, attenuation efficiency is jointly influenced by the cumulative temporal advantage associated with earlier precipitation input and the higher numerical sensitivity of standardized drought indices under more severe drought conditions. Although t1 remains the dominant toptimal in most regions, accounting for 58.79 % of all grids, t2 and t3 are also non-negligible, accounting for 22.11 % and 11.06 %, respectively. These findings do not suggest that later precipitation input is generally more effective than earlier precipitation input. Instead, they indicate that within the early-stage response window, precipitation input during t2 or t3 may still exhibit attenuation efficiencies comparable to, or exceeding, that of t1 under certain conditions. This implies that, during the early stage of MYD evolution, missing t1 does not necessarily mean that the opportunity for relatively high attenuation efficiency has already been lost.
(3) DD is a key factor influencing attenuation efficiency within the early-stage response window. Longer DD was associated with a greater likelihood of t2 or t3 emerging as the toptimal, evidenced by R2 values of 0.526 and 0.578, respectively. When DD exceeds 29 months, the MYD attenuation efficiencies of t2 and t3 become comparable to that of t1. Compared with the humid river basins in Southern China, the arid and semi-arid northern regions exhibited a higher probability that k at t2 or t3 would exceed that at t1.
Overall, this study identifies and characterizes an early-stage response window during MYD evolution and further clarifies the competing mechanisms controlling attenuation efficiency within this window. With the increasing frequency and severity of MYDs in the future, our findings provide theoretical support and methodological guidance for improving the understanding of how precipitation input timing influences drought alleviation, thereby contributing to the development of more targeted and effective drought alleviation strategies across different regions.
The PDSI series in this study were calculated using the MATLAB PDSI tool of Jacobi et al. (2013), as modified by Ficklin et al. (2015) to incorporate the Penman–Monteith potential evapotranspiration method. The modified MATLAB code was obtained from the publicly available GitHub repository at https://github.com/dficklin/CAGEO-paper.git (Ficklin, 2015).
The daily meteorological dataset from 756 stations suitable for calculating PDSI during the period of 1961 to 2020 over China is available from the National Meteorological Information Center of the China Meteorological Administration via http://www.nmic.cn/ (last access: 26 August 2025).
The supplement related to this article is available online at https://doi.org/10.5194/hess-30-6963-2026-supplement.
YZ: Conceptualization, Data curation, Formal analysis, Funding acquisition, Investigation, Methodology, Supervision, Validation, Visualization, Writing – original draft, Writing – review and editing. FS: Conceptualization, Investigation, Methodology, Supervision, Writing – review and editing. WBL: Conceptualization, Investigation, Formal analysis, Methodology, Validation, Writing – review and editing. JZ: Conceptualization, Formal analysis, Funding acquisition, Investigation, Methodology, Project administration, Resources, Supervision, Validation, Writing – review and editing. WLL: Data curation, Investigation, Methodology, Project administration, Supervision. JL: Data curation, Investigation, Validation, Visualization. WS: Conceptualization, Formal analysis, Methodology. WJL: Conceptualization, Methodology, Project administration. ZS: Data curation, Visualization. PW: Formal analysis, Validation.
The contact author has declared that none of the authors has any competing interests.
Publisher's note: Copernicus Publications remains neutral with regard to jurisdictional claims made in the text, published maps, institutional affiliations, or any other geographical representation in this paper. The authors bear the ultimate responsibility for providing appropriate place names. Views expressed in the text are those of the authors and do not necessarily reflect the views of the publisher.
The authors express their gratitude to the National Natural Science Foundation of China, Hainan Province Science and Technology Special Fund, the Innovative Research Projects for Postgraduates of Hainan Province, and Hainan Provincial Higher Education Research Project for the financial support of this research project.
This research has been supported by the National Natural Science Foundation of China (grant nos. 41901043 and 42261005); Hainan Province Science and Technology Special Fund (grant no. ZDYF2024SHFZ078); the Innovative Research Projects for Postgraduates of Hainan Province (grant no. Qhyb2024-100); and Hainan Provincial Higher Education Research Project (grant no. Hnjg2024-46).
This paper was edited by Carlo De Michele and reviewed by three anonymous referees.
Allen, R. G., Pereira, L. S., Raes, D., and Smith, M.: FAO Irrigation and Drainage Paper No. 56 – Crop Evapotranspiration, FAO, Rome, Italy, ISBN 92-5-104219-5, https://www.fao.org/4/x0490E/x0490e00.htm (last access: 26 August 2025), 1998.
Ault, T. R.: On the essentials of drought in a changing climate, Science, 368, 256–260, https://doi.org/10.1126/science.aaz5492, 2020.
Berdugo, M., Delgado-Baquerizo, M., Soliveres, S., Hernández-Clemente, R., Zhao, Y., Gaitán, J. J., Gross, N., Saiz, H., Maire, V., Lehmann, A., and Rillig, M. C.: Global ecosystem thresholds driven by aridity, Science, 367, 787–790, https://doi.org/10.1126/science.aay5958, 2020.
Blauhut, V., Stahl, K., Stagge, J. H., Tallaksen, L. M., De Stefano, L., and Vogt, J.: Estimating drought risk across Europe from reported drought impacts, drought indices, and vulnerability factors, Hydrol. Earth Syst. Sci., 20, 2779–2800, https://doi.org/10.5194/hess-20-2779-2016, 2016.
Brunner, M. I. and Tallaksen, L. M.: Proneness of European catchments to multiyear streamflow droughts, Water Resour. Res., 55, 8881–8894, https://doi.org/10.1029/2019WR025903, 2019.
Büntgen, U., Urban, O., Krusic, P. J., Rybníček, M., Kolář, T., Kyncl, T., Ač, A., Koňasová, E., Čáslavský, J., Esper, J., and Wagner, S.: Recent European drought extremes beyond Common Era background variability, Nat. Geosci., 14, 190–196, https://doi.org/10.1038/s41561-021-00698-0, 2021.
Cavus, Y. and Aksoy, H.: Critical drought severity/intensity-duration-frequency curves based on precipitation deficit, J. Hydrol., 584, 124312, https://doi.org/10.1016/j.jhydrol.2019.124312, 2020.
Chen, L., Brun, P., Buri, P., Fatichi, S., Gessler, A., McCarthy, M. J., Pellicciotti, F., Stocker, B., and Karger, D. N.: Global increase in the occurrence and impact of multiyear droughts, Science, 387, 278–284, https://doi.org/10.1126/science.ado4245, 2025.
Dai, A.: Drought under global warming: a review, Wires Clim. Change, 2, 45–65, https://doi.org/10.1002/wcc.81, 2011.
Dai, A.: Increasing drought under global warming in observations and models, Nat. Clim. Change, 3, 52–58, https://doi.org/10.1038/nclimate1633, 2013.
Dai, M., Huang, S., Huang, Q., Leng, G., Guo, Y., Wang, L., Fang, W., Li, P., and Zheng, X.: Assessing agricultural drought risk and its dynamic evolution characteristics, Agric. Water Manage., 231, 106003, https://doi.org/10.1016/j.agwat.2020.106003, 2020.
DeChant, C. M. and Moradkhani, H.: Analyzing the sensitivity of drought recovery forecasts to land surface initial conditions, J. Hydrol., 526, 89–100, https://doi.org/10.1016/j.jhydrol.2014.10.021, 2015.
Easterling, D. R., Wallis, T. W., Lawrimore, J. H., and Heim Jr., R. R.: Effects of temperature and precipitation trends on US drought, Geophys. Res. Lett., 34, L20709, https://doi.org/10.1029/2007GL031541, 2007.
Feng, X., Wang, Z., Wu, X., Huang, S., Li, J., Lai, C., Zeng, Z., and Lin, G.: Tracking 3D drought events across global river basins: Climatology, spatial footprint, and temporal changes, Geophys. Res. Lett., 52, e2024GL111442, https://doi.org/10.1029/2024GL111442, 2025.
Ficklin, D. L.: CAGEO-paper, GitHub [code], https://github.com/dficklin/CAGEO-paper (last access: 26 August 2025), 2015.
Ficklin, D. L., Letsinger, S. L., Gholizadeh, H., and Maxwell, J. T.: Incorporation of the Penman–Monteith potential evapotranspiration method into a Palmer Drought Severity Index tool, Comput. Geosci., 85, 136–141, https://doi.org/10.1016/j.cageo.2015.09.013, 2015.
Fischer, E. M., Bador, M., Huser, R., Kendon, E. J., Robinson, A., and Sippel, S.: Record-breaking extremes in a warming climate, Nat. Rev. Earth Environ., 6, 456–470, https://doi.org/10.1038/s43017-025-00681-y, 2025.
Gu, L., Chen, J., Yin, J., Sullivan, S. C., Wang, H.-M., Guo, S., Zhang, L., and Kim, J.-S.: Projected increases in magnitude and socioeconomic exposure of global droughts in 1.5 and 2 °C warmer climates, Hydrol. Earth Syst. Sci., 24, 451–472, https://doi.org/10.5194/hess-24-451-2020, 2020.
Gumus, V.: Evaluating the effect of the SPI and SPEI methods on drought monitoring over Turkey, J. Hydrol., 626, 130386, https://doi.org/10.1016/j.jhydrol.2023.130386, 2023.
Gupta, A. and Karthikeyan, L.: Role of initial conditions and meteorological drought in soil moisture drought propagation: An event-based causal analysis over South Asia, Earth's Future, 12, e2024EF004674, https://doi.org/10.1029/2024EF004674, 2024.
Haile, G. G., Tang, Q., Li, W., Liu, X., and Zhang, X.: Drought: Progress in broadening its understanding, Wiley Interdiscip. Rev.-Water, 7, e1407, https://doi.org/10.1002/wat2.1407, 2020.
Hao, Z., Singh, V. P., and Xia, Y.: Seasonal drought prediction: Advances, challenges, and future prospects, Rev. Geophys., 56, 108–141, https://doi.org/10.1002/2016RG000549, 2018.
Huang, S., Wang, L., Wang, H., Huang, Q., Leng, G., Fang, W., and Zhang, Y.: Spatio-temporal characteristics of drought structure across China using an integrated drought index, Agric. Water Manage., 218, 182–192, https://doi.org/10.1016/j.agwat.2019.03.053, 2019.
Jacobi, J., Perrone, D., Duncan, L. L., and Hornberger, G.: A tool for calculating the Palmer drought indices, Water Resour. Res., 49, 6086–6089, https://doi.org/10.1002/wrcr.20342, 2013.
Karl, T. R.: The Sensitivity of the Palmer Drought Severity Index and Palmer's Z-Index to their Calibration Coefficients Including Potential Evapotranspiration, J. Appl. Meteorol., 25, 77–86, https://doi.org/10.1175/1520-0450(1986)025<0077:TSOTPD>2.0.CO;2, 1986.
Lai, C., Sun, H., Wu, X., Li, J., Wang, Z., Tong, H., and Feng, J.: Water availability may not constrain vegetation growth in Northern Hemisphere, Agric. Water Manage., 291, 108649, https://doi.org/10.1016/j.agwat.2023.108649, 2024.
Lin, H., Yu, Z., Chen, X., Gu, H., Ju, Q., and Shen, T.: Spatial-temporal dynamics of meteorological and soil moisture drought on the Tibetan Plateau: Trend, response, and propagation process, J. Hydrol., 626, 130211, https://doi.org/10.1016/j.jhydrol.2023.130211, 2023.
Liu, Y., Zhu, Y., Ren, L., Singh, V. P., Yang, X., and Yuan, F.: A multiscalar Palmer drought severity index, Geophys. Res. Lett., 44, 6850–6858, https://doi.org/10.1002/2017GL073871, 2017.
Livneh, B. and Hoerling, M. P.: The physics of drought in the US central Great Plains, J. Climate, 29, 6783–6804, https://doi.org/10.1175/JCLI-D-15-0697.1, 2016.
Luo, L., Apps, D., Arcand, S., Xu, H., Pan, M., and Hoerling, M.: Contribution of temperature and precipitation anomalies to the California drought during 2012–2015, Geophys. Res. Lett., 44, 3184–3192, https://doi.org/10.1002/2016GL072027, 2017.
Ma, Q., Li, Y., Liu, F., Feng, H., Biswas, A., and Zhang, Q.: SPEI and multi-threshold run theory based drought analysis using multi-source products in China, J. Hydrol., 616, 128737, https://doi.org/10.1016/j.jhydrol.2022.128737, 2023.
Mao, Y., Nijssen, B., and Lettenmaier, D. P.: Is climate change implicated in the 2013–2014 California drought? A hydrologic perspective, Geophys. Res. Lett., 42, 2805–2813, https://doi.org/10.1002/2015GL063456, 2015.
Massari, C., Avanzi, F., Bruno, G., Gabellani, S., Penna, D., and Camici, S.: Evaporation enhancement drives the European water-budget deficit during multi-year droughts, Hydrol. Earth Syst. Sci., 26, 1527–1543, https://doi.org/10.5194/hess-26-1527-2022, 2022.
McCabe, G. J. and Wolock, D. M.: Variability and trends in global drought, Earth Space Sci., 2, 223–228, https://doi.org/10.1002/2015EA000100, 2015.
Meresa, H., Zhang, Y., Tian, J., and Faiz, M. A.: Understanding the role of catchment and climate characteristics in the propagation of meteorological to hydrological drought, J. Hydrol., 617, 128967, https://doi.org/10.1016/j.jhydrol.2022.128967, 2023.
Mishra, A. K. and Singh, V. P.: A review of drought concepts, J. Hydrol., 391, 202–216, https://doi.org/10.1016/j.jhydrol.2010.07.012, 2010.
Moravec, V., Markonis, Y., Rakovec, O., Svoboda, M., Trnka, M., Kumar, R., and Hanel, M.: Europe under multi-year droughts: how severe was the 2014–2018 drought period?, Environ. Res. Lett., 16, 034062, https://doi.org/10.1088/1748-9326/abe828, 2021.
Mukherjee, S. and Mishra, A. K.: Increase in compound drought and heatwaves in a warming world, Geophys. Res. Lett., 48, e2020GL090617, https://doi.org/10.1029/2020GL090617, 2021.
Palagi, E., Coronese, M., Lamperti, F., and Roventini, A.: Climate change and the nonlinear impact of precipitation anomalies on income inequality, P. Natl. Acad. Sci. USA, 119, e2203595119, https://doi.org/10.1073/pnas.2203595119, 2022.
Palmer, W. C.: Meteorological drought, Research paper no. 45, US Weather Bureau, Washington, DC, 58 pp., https://www.ncei.noaa.gov/monitoring-content/temp-and-precip/drought/docs/palmer.pdf (last access: 26 August 2025), 1965.
Pan, M., Yuan, X., and Wood, E. F.: A probabilistic framework for assessing drought recovery, Geophys. Res. Lett., 40, 3637–3642, https://doi.org/10.1002/grl.50728, 2013.
Shi, H., Tian, H., Lange, S., Yang, J., Pan, S., Fu, B., and Reyer, C. P.: Terrestrial biodiversity threatened by increasing global aridity velocity under high-level warming, P. Natl. Acad. Sci. USA, 118, e2015552118, https://doi.org/10.1073/pnas.2015552118, 2021.
Smith, A. B.: 2010–2019: A landmark decade of U.S. billion-dollar weather and climate disasters, National Oceanic and Atmospheric Administration, https://www.climate.gov/news-features/blogs/beyond-data/2010-2019-landmark-decade-us-billion-dollar-weather-and-climate (last access: 26 August 2025), 2020.
Stevenson, S., Coats, S., Touma, D., Cole, J., Lehner, F., Fasullo, J., and Otto-Bliesner, B.: Twenty-first century hydroclimate: A continually changing baseline, with more frequent extremes, P. Natl. Acad. Sci. USA, 119, e2108124119, https://doi.org/10.1073/pnas.2108124119, 2022.
Tian, Q., Lu, J., and Chen, X.: A novel comprehensive agricultural drought index reflecting time lag of soil moisture to meteorology: A case study in the Yangtze River basin, China, Catena, 209, 105804, https://doi.org/10.1016/j.catena.2021.105804, 2022.
Ullah, I., Ma, X., Asfaw, T. G., Yin, J., Iyakaremye, V., Saleem, F., Xing, Y., Azam, K., and Syed, S.: Projected changes in increased drought risks over South Asia under a warmer climate, Earth's Future, 10, e2022EF002830, https://doi.org/10.1029/2022EF002830, 2022.
Van Dijk, A. I., Beck, H. E., Crosbie, R. S., De Jeu, R. A., Liu, Y. Y., Podger, G. M., Timbal, B., and Viney, N. R.: The Millennium Drought in southeast Australia (2001–2009): Natural and human causes and implications for water resources, ecosystems, economy, and society, Water Resour. Res., 49, 1040–1057, https://doi.org/10.1002/wrcr.20123, 2013.
van Mourik, J., Ruijsch, D., van der Wiel, K., Hazeleger, W., and Wanders, N.: Regional drivers and characteristics of multi-year droughts, Weather Clim. Extremes, 48, 100748, https://doi.org/10.1016/j.wace.2025.100748, 2025.
Vicente-Serrano, S. M., Beguería, S., and López-Moreno, J. I.: A multiscalar drought index sensitive to global warming: the standardized precipitation evapotranspiration index, J. Climate, 23, 1696–1718, https://doi.org/10.1175/2009JCLI2909.1, 2010.
Vicente-Serrano, S. M., Domínguez-Castro, F., Beguería, S., El Kenawy, A., Gimeno-Sotelo, L., Franquesa, M., Azorin-Molina, C., Andres-Martin, M., and Halifa-Marín, A.: Atmospheric drought indices in future projections, Nat. Water., 3, 374–387, https://doi.org/10.1038/s44221-025-00416-9, 2025.
Wang, C., Chen, J., Lee, S. C., Xiong, L., Su, T., Lin, Q., and Xu, C. Y.: Response and recovery times of vegetation productivity under drought stress: Dominant factors and relationships, J. Hydrol., 655, 132945, https://doi.org/10.1016/j.jhydrol.2025.132945, 2025.
Wu, J., Chen, X., Yao, H., Liu, Z., and Zhang, D.: Hydrological drought instantaneous propagation speed based on the variable motion relationship of speed-time process, Water Resour. Res., 54, 9549–9565, https://doi.org/10.1029/2018WR023120, 2018.
Wu, J., Yao, H., Chen, X., Wang, G., Bai, X., and Zhang, D.: A framework for assessing compound drought events from a drought propagation perspective, J. Hydrol., 604, 127228, https://doi.org/10.1016/j.jhydrol.2021.127228, 2022a.
Wu, W., Zhang, J., Sun, Z., Yu, J., Liu, W., Yu, R., and Wang, P.: Attribution analysis of land degradation in Hainan Island based on geographical detector, Ecol. Ind., 141, 109119, https://doi.org/10.1016/j.ecolind.2022.109119, 2022b.
Xu, L., Chen, N., Yang, C., Zhang, C., and Yu, H.: A parametric multivariate drought index for drought monitoring and assessment under climate change, Agric. For. Meteorol., 310, 108657, https://doi.org/10.1016/j.agrformet.2021.108657, 2021.
Xu, Y., Zhu, X., Cheng, X., Gun, Z., Lin, J., Zhao, J., Yao, L., and Zhou, C.: Drought assessment of China in 2002–2017 based on a comprehensive drought index, Agric. For. Meteorol., 319, 108922, https://doi.org/10.1016/j.agrformet.2022.108922, 2022.
Yang, L., Zhao, G., Tian, P., Mu, X., Tian, X., Feng, J., and Bai, Y.: Runoff changes in the major river basins of China and their responses to potential driving forces, J. Hydrol., 607, 127536, https://doi.org/10.1016/j.jhydrol.2022.127536, 2022.
Yang, X., Wu, F., Yuan, S., Ren, L., Sheffield, J., Fang, X., Jiang, S., and Liu, Y.: Quantifying the impact of human activities on hydrological drought and drought propagation in China using the PCR-GLOBWB v2. 0 model, Water Resour. Res., 60, e2023WR035443, https://doi.org/10.1029/2023WR035443, 2024.
Yang, Y., McVicar, T. R., Donohue, R. J., Zhang, Y., Roderick, M. L., Chiew, F. H., Zhang, L., and Zhang, J.: Lags in hydrologic recovery following an extreme drought: Assessing the roles of climate and catchment characteristics, Water Resour. Res., 53, 4821–4837, https://doi.org/10.1002/2017WR020683, 2017.
Yevjevich, V. M.: An objective approach to definitions and investigations of continental hydrologic droughts, Hydro. Pap., Colorado State University, no. 23, 25 pp., http://hdl.handle.net/10217/61303 (last access: 26 August 2025), 1967.
Zhang, J., Sun, F., Xu, J., Chen, Y., Sang, Y. F., and Liu, C.: Dependence of trends in and sensitivity of drought over China (1961–2013) on potential evaporation model, Geophys. Res. Lett., 43, 206–213, https://doi.org/10.1002/2015GL067473, 2016.
Zhang, Q., Miao, C., Su, J., Gou, J., Hu, J., Zhao, X., and Xu, Y.: A new high-resolution multi-drought-index dataset for mainland China, Earth Syst. Sci. Data, 17, 837–853, https://doi.org/10.5194/essd-17-837-2025, 2025.
Zhang, W., Furtado, K., Wu, P., Zhou, T., Chadwick, R., Marzin, C., Rostron, J., and Sexton, D.: Increasing precipitation variability on daily-to-multiyear time scales in a warmer world, Sci. Adv., 7, eabf8021, https://doi.org/10.1126/sciadv.abf8021, 2021.
Zhou, Z., Zhang, L., Chen, J., She, D., Wang, G., Zhang, Q., Xia, J., and Zhang, Y.: Projecting global drought risk under various SSP-RCP scenarios, Earth's Future, 11, e2022EF003420, https://doi.org/10.1029/2022EF003420, 2023.