the Creative Commons Attribution 4.0 License.
the Creative Commons Attribution 4.0 License.
 | 05 Feb 2026
Technical note: Literature based approach to estimate future snow
Christoph Marty
The seasonal snow cover in the European Alps is increasingly threatened by rising temperatures due to climate change. Still, downscaled climate projections are lacking for many regions. To address this gap, we developed a literature-based approach for projecting future snow depths, that is applicable to all locations where historical snow depth data is available.
We harmonized heterogeneous literature on future snow depth and snow water equivalent by translating emission scenarios to corresponding temperature scenarios and standardizing seasonal periods. Then, we parameterized localized reduction curves based on elevation, temperature scenarios and local climatologies, such as mean snow cover length and mean maximum snow depth. This method was applied to four measurement stations in Switzerland under a +2 °C temperature scenario, revealing significant declines in snow depth and season length, especially at lower elevations. Validation against published data shows that the approach captures key trends in snow loss, despite the simplification of climate dynamics.
This resource-efficient method provides a practical tool for estimating climate change related snow depth declines in snow dominated regions, which are lacking highly resolved climate projections, and can support decision-makers in developing adaptation strategies for climate-related challenges.
- Article
(2196 KB) - Full-text XML
- BibTeX
- EndNote


Seasonal snow cover plays a crucial role in Alpine hydrology, ecology, and winter tourism. In the context of ongoing climate change, it is increasingly threatened by rising temperatures. Both snow depth and snow water equivalent (SWE) have shown substantial decreases across the European Alps in recent decades (Marty et al., 2025; Ranzi et al., 2024; Broust et al., 2024), with future projections indicating further declines across all ranges of elevations and regions (Kotlarski et al., 2022; Bülow et al., 2025). While detailed climate projections exist for selected study areas and provide detailed insights into future snow cover (Marty et al., 2017; Schmucki et al., 2015; Willibald et al., 2020; Verfaillie et al., 2018), many Alpine regions still lack high resolution projections. This presents a challenge for practitioners and decision-makers requiring localized snow cover information to support climate adaptation strategies.
To bridge this gap within a short-term project with limited resources, we developed a transferable, literature-based approach, which is applicable to climatological datasets (both point-based and gridded) by synthesizing existing studies to estimate future snow cover changes.
2.1 Synthesizing literature values
The heterogeneity of available studies posed several methodological challenges, e.g. the heterogeneity in projected regions and elevations, emission scenarios and examined variables.
Reported variables ranged from decreases in seasonal means for different periods (Willibald et al., 2020; Kotlarski et al., 2022; Morin et al., 2018; Marty et al., 2017; Verfaillie et al., 2018), season lengths for different thresholds in snow depths (Willibald et al., 2021; Verfaillie et al., 2018; Morin et al., 2018), monthly values (Bülow et al., 2025; Marty et al., 2017) or seasonal evolutions (Schmucki et al., 2017; Schmucki, 2015; Fiddes et al., 2022) of either SWE or snow depth. Since the relative reductions in SWE and snow depth were comparable across these studies (Schmucki et al., 2015; Verfaillie et al., 2018), we treated the reduction values as interchangeable.
Tables A1 and A2 in the Appendix summarize the examined variables. These studies were generally divided into two groups: Literature-Fit and Literature-Validation (see comments in Tables A1 and A2). The data in Literature-Fit provided daily or monthly snow depths, both for the reference period and the future projection, which could be used to train the reduction curves in Sect. 2.2. The data in Literature-Validation reported seasonal reduction values or decreases in season length and was used for validation only (Sects. 2.4 and 3.3).
2.1.1 Translating emission scenarios to temperature scenarios
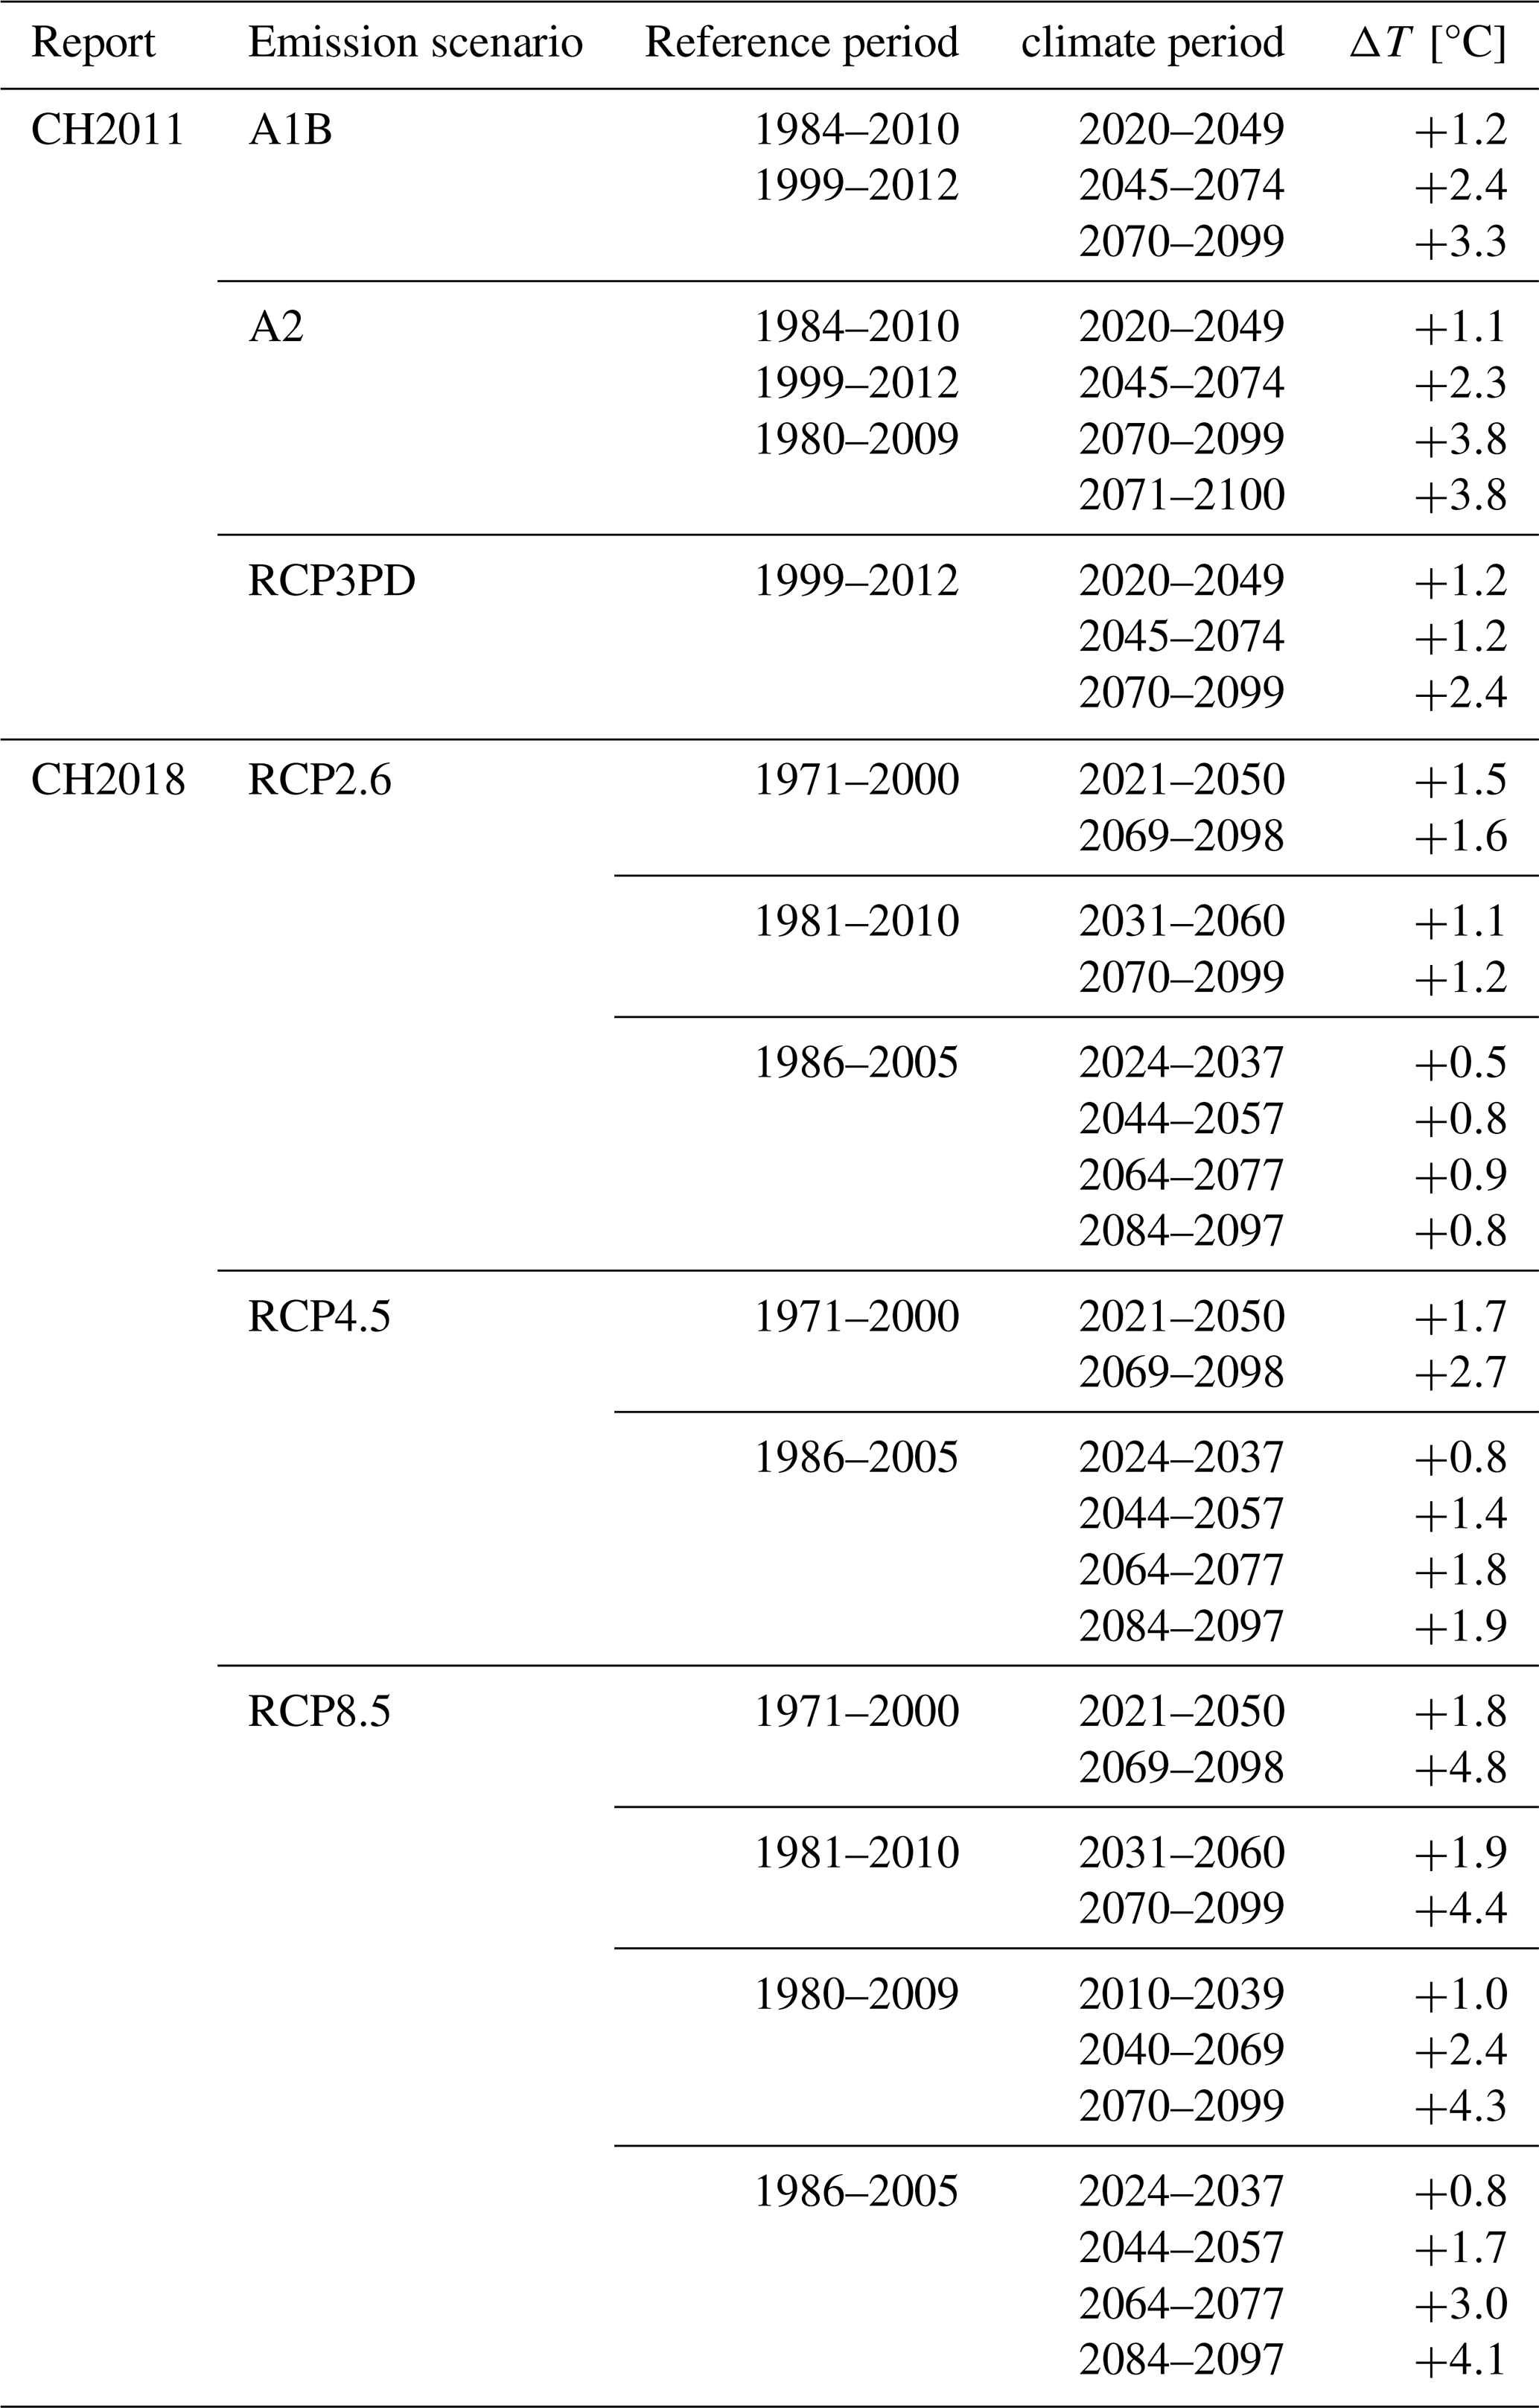
Most studies referred to different emission scenarios (e.g. various RCPs). To address this complexity, we standardized reported climate change scenarios by translating all RCPs, reference periods, and projected periods into corresponding temperature scenarios, if temperature scenario was not directly reported. To this end, we used the reports CH2011 and CH2018 (CH2018, 2018; CH2011, 2011) and summarized emission and corresponding temperature scenarios in Table B1 (see Appendix).
2.1.2 Synthesizing different seasonal means
Reduction values for seasonal means in the Literature-Validation dataset were reported for various time periods, ranging from the shortest – December–February (DJF, 3 months) – to the longest – September–August (SONDJFMAMJJA, 12 months). As reduction values may highly vary depending on the period, as illustrated in an example below, literature values are difficult to compare. For consistency, we synthesized all results to a common six-month period from November to April (NDJFMA).
To this end, we used the Literature-Fit dataset, which was linearly interpolated to daily values, to calculate mean snow depths for both the reference period (HSref) and the future projection (HSfut) across different seasonal windows (e.g. NDJFMA). The relative decrease in mean snow depth for NDJFMA was then calculated as:
Reduction values for other periods were computed analogously and compared to the NDJFMA-decrease (Fig. 1). For illustration, we use the example of the lowermost point at 1350 in Fig. 1, which comes from Schmucki (2015) (see Fig. 2): The mean reference snow depth during the NDJFMA period is HSref(NDJFMA)= 68 cm, whereas the future mean snow depth is HSfut(NDJFMA)= 25 cm, corresponding to a NDJFMA-decrease of −63 %. In comparison, the DJF-decrease is only −56 % (HSref(DJF)= 78 cm, HSfut(DJF)= 34 cm). Thus, if the DJF-decrease were used in place of the NDJFMA-decrease, the relative reduction would be underestimated by about −7 %. These differences in relative reduction between the NDJFMA and DJF periods (in this example −7 %) and other periods are shown for the full Literature-Fit dataset in Fig. 1.
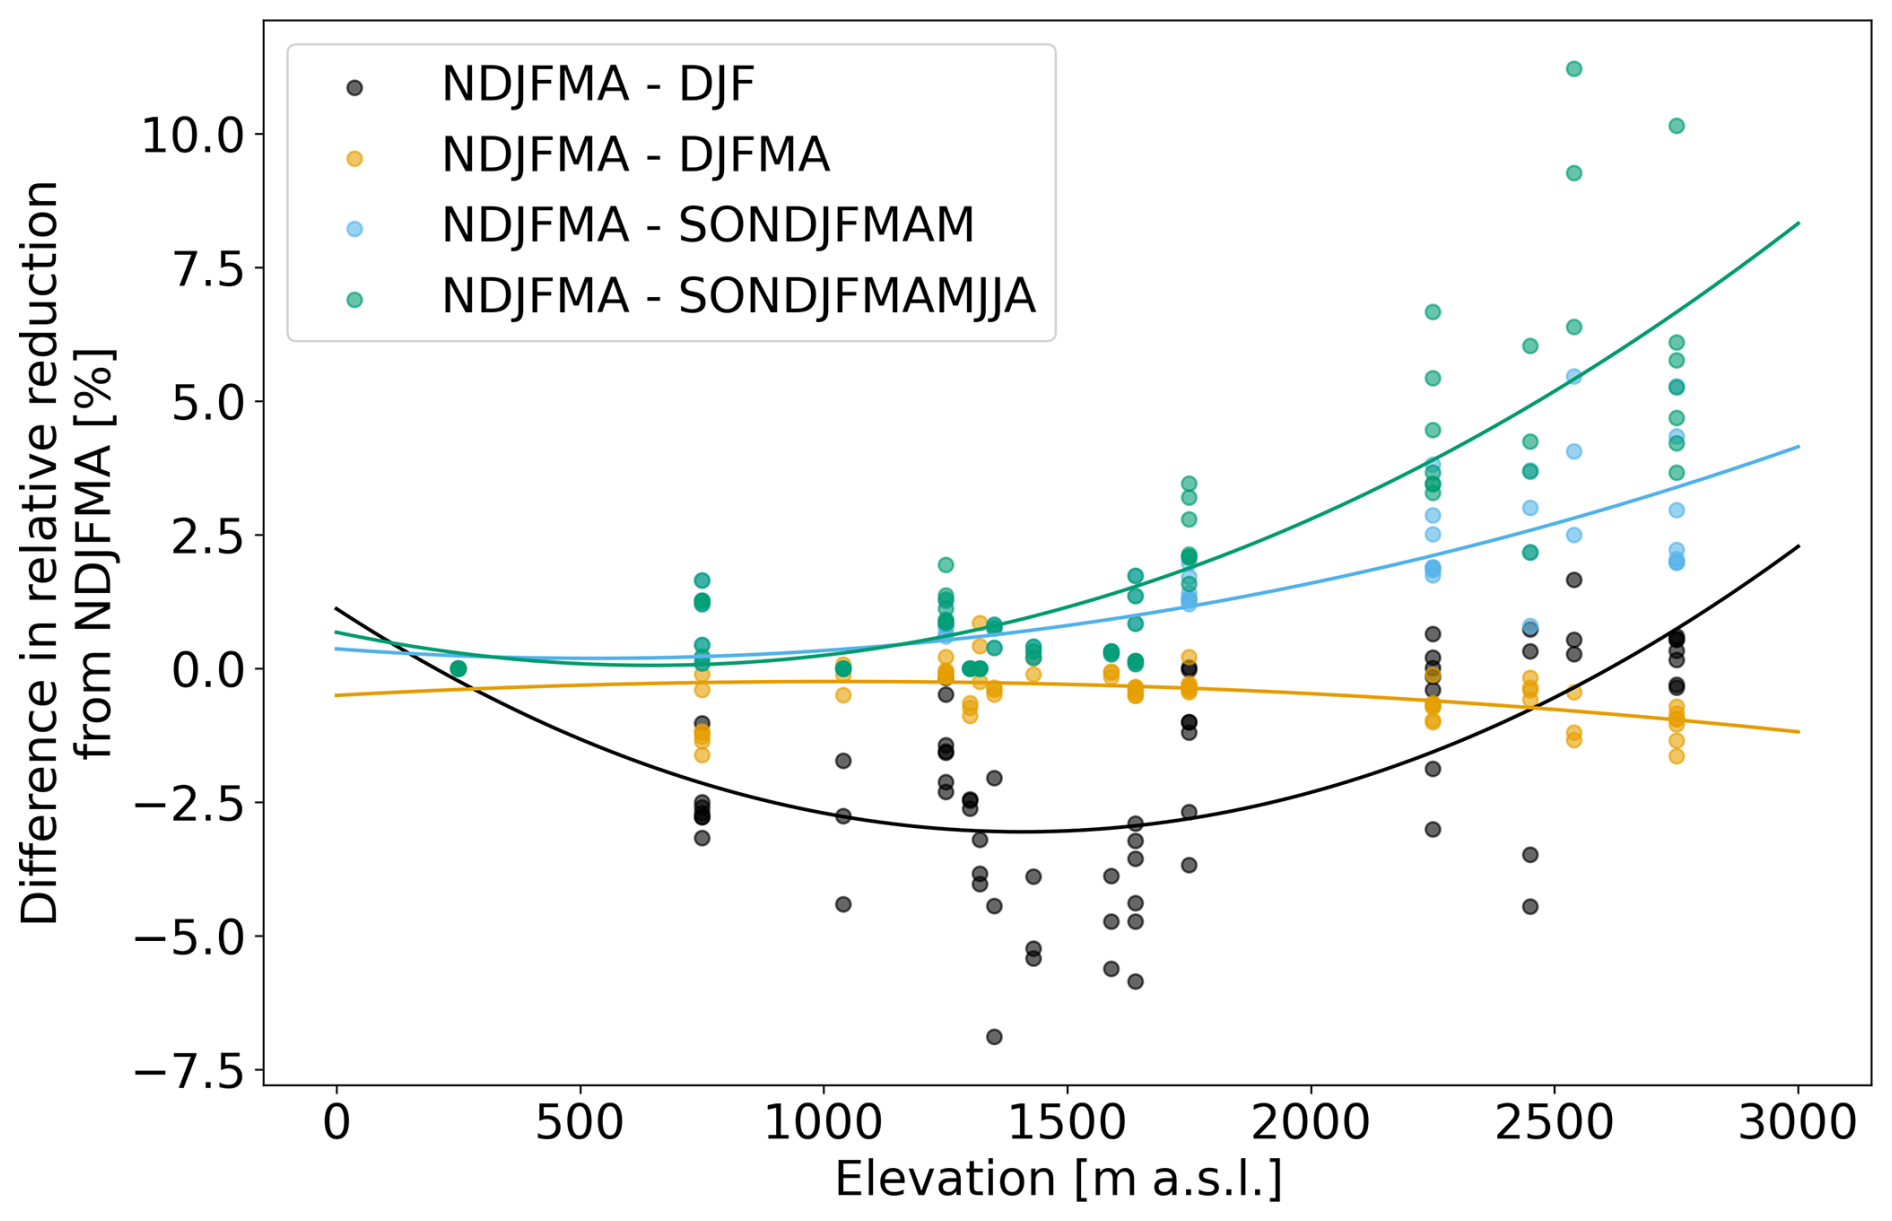
Figure 1Relationship of relative decreases in mean snow depths for different periods (colors) compared to NDJFMA period. Values were derived from studies which provided monthly or daily snow depths and decreases. For each period we computed a second order polynomial fit with elevation.
Depending on the specific period and elevation, deviations of up to 10 % from the NDJFMA-decrease were observed. To account for these variations, we applied a second-order polynomial fit to adjust reduction values based on both period length and elevation (lines in Fig. 1).
2.2 Fitting of Seasonal Reduction Curves
We analyzed the seasonal snow depth reduction curves for the Literature-Fit data, by first linearly interpolating reported values to daily data. If reduction values were not provided, we computed those from reference and future snow depth or SWE data.
Figure 2 (top) shows reference and future snow depth at 1350 under a +2.4 °C scenario from Schmucki (2015). Peak snow depth decreased from 116 to 52 cm, with a reported reduction in season length of approximately 20 d. In most of the Literature-Fit data this shortening is asymmetric: for example, Fig. 2 (top) indicates a slight delay of a few days in future accumulation, whereas ablation occurs approximately two weeks earlier. In contrast, the corresponding future relative snow depths (Fig. 2, bottom), which are equivalent to relative reduction curves, appear symmetric around the value b. The reduction curve peaked shortly before the seasonal maximum (b=144 DOWY), and approached 0 % toward both ends of the season. This shape implies both a delayed onset and an earlier end of the season, reflecting this general shortening of the snow duration. All relative reduction curves consistently showed this behavior without any systematic asymmetry, therefore, reduction curves fred(x) could be well approximated by a quadratic function:
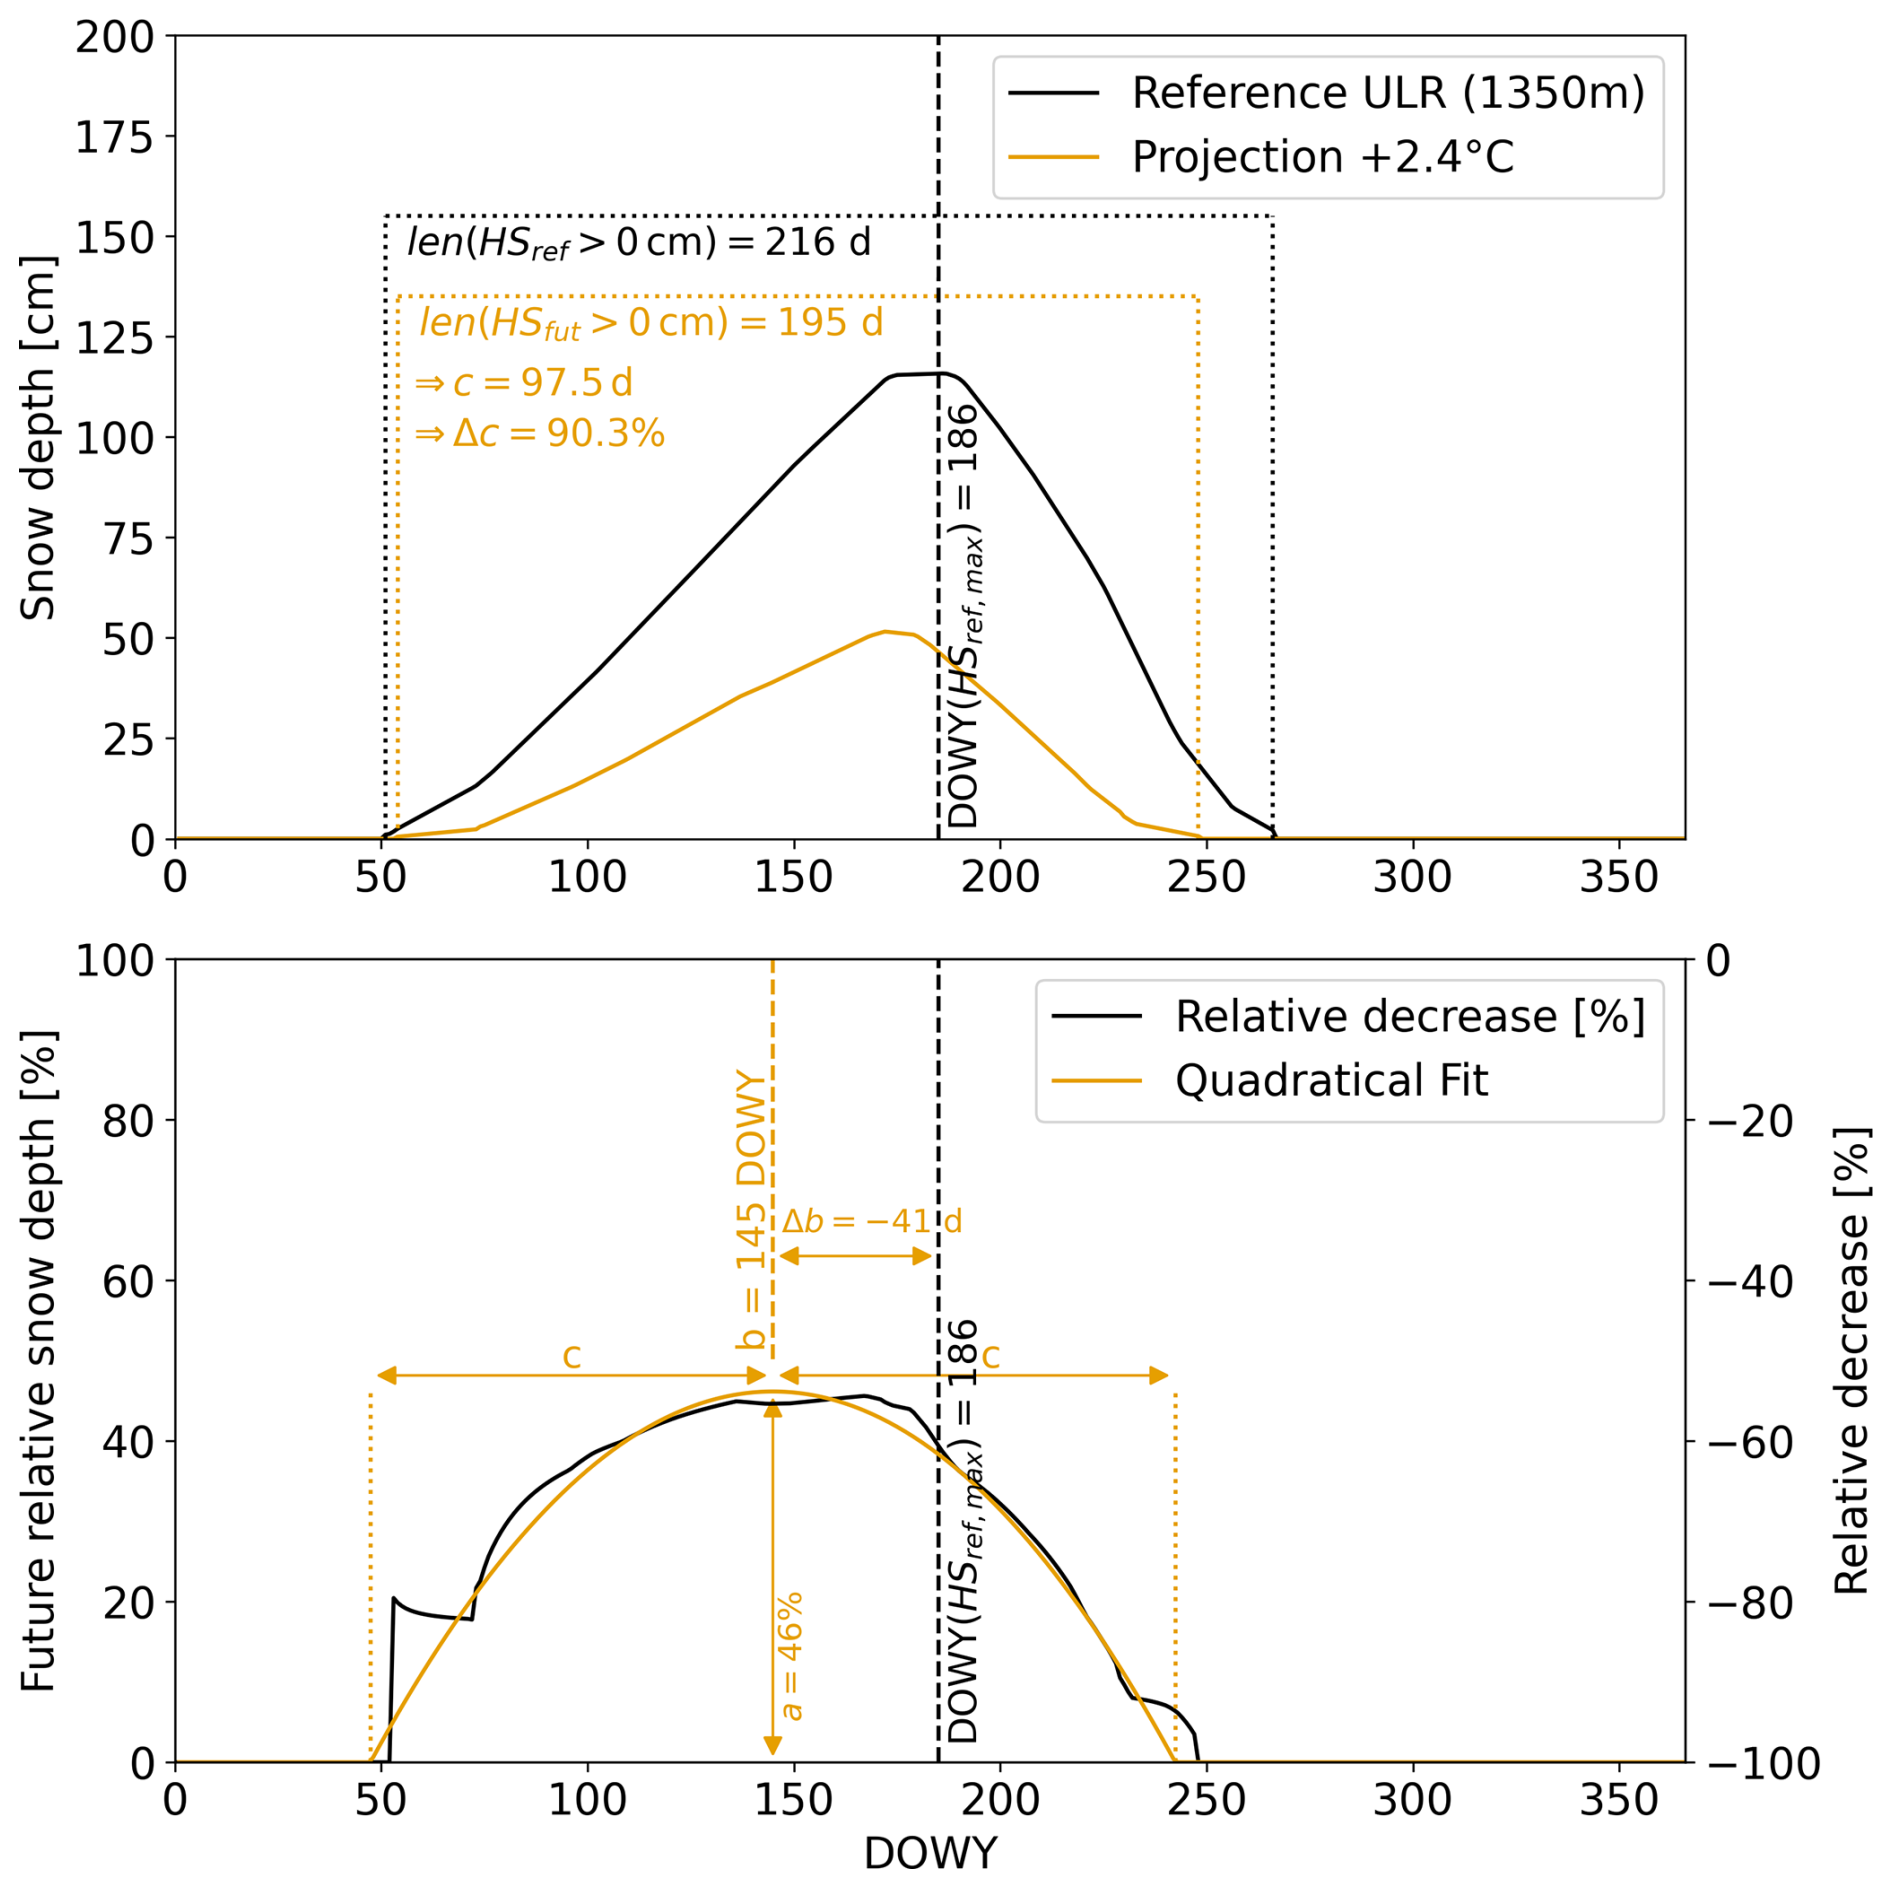
Figure 2Upper: Reference and future snow depth from Schmucki (2015) (temperature scenario: +2.4 °C, elevation: 1350 , monthly averages) and lower: corresponding future relative snow depths. The fitting parameter a and Δb are marked in orange, where a corresponds to the maximum future relative snow depth, Δb is the position of the peak of the reduction curve relative to the peak in reference snow depth, and Δc is the fraction of future season length to reference season length, which are also marked (upper). Orange line shows the quadratic fit for the reduction curve. x axis is the day of water year (DOWY) starting on 1 September.
To express the relative future snow depth directly, this can be rewritten as:
where:
-
x is the day of water year (DOWY, ranging from 1 to 366, with DOWY 1 = 1 September),
-
a denotes the maximum of f(x), corresponding to the highest relative snow depth in future,
-
b is the day of the year (DOWY) on which this maximum occurs,
-
c defines half the width of the curve, and thus approximates half the snow season length (i.e. days with snow on the ground before and after b).
Finding trends for b and c directly would imply to fix the position of the peak of the reduction curve to a specific day in the season (b) and fix the length of snow duration to a certain number of days (c). However, snow duration can greatly differ between regions and locations. To preserve the local climatology, instead of finding trends for b and c, we explored trends for the relative snow duration length (Δc) and the position of the peak of the reduction curve relative to the peak snow depth (Δb):
In Fig. 2, the maximum future snow depth a=47 % and the reduction curve peaks on b=144 DOWY (corresponding to 23 January), hence the peak of the reduction curve is 41 d prior to the peak in reference snow depth (). The total snow duration decreases from 216 to 195 d, resulting in a relative decrease of Δc=90 %.
Finally, we compared all reduction parameter (a, Δb, and Δc) from the Literature-Fit data with temperature scenario and elevation (see Sect. 3.1) and trained a linear regression model. To avoid overfitting, we used linear terms of temperature scenario and elevation and their interaction terms (elevation ×ΔT), which were scaled before training. While the reduction parameters a, Δb, and Δc can be computed for any given elevation and temperature scenario, these parameters were trained on data with elevations ranging from 750 and 2750 m and temperature scenarios from +1.1 to +4.8 °C and should be treated with caution outside these ranges.
2.3 Apply reduction curve to project future snow evolution
We applied the reduction curves to retrieve future snow depths for four measurement stations in Switzerland: Weissfluhjoch (WJ, 2540 ), in the eastern Swiss Alps, Maloja (MA, 1810 ), in the southern Swiss Alps, Saanenmöser (SM, 1390 ), in the western Swiss Alps, and Engelberg (EN, 1023 ), in the central Swiss Alps. These stations provide daily manually measured snow depth data from winter season 1991–2020 (30 years). We computed daily median, as well as the 5th and the 95th percentile for those stations, as our reduction curves were trained on data, which does not account for extreme events.
We chose a temperature scenario of for the projections and then computed the reduction parameters a, Δb, and Δc for the given elevations. As our reference period 1991–2020 experienced a mean annual temperature increase of +0.5 °C compared to the period 1981–2010 (MeteoSwiss and ETH Zurich, 2025), this temperature scenario of refers to the climate period 2043–2072 for the RCP8.5 scenario of CH2018 (2018).
Climate projections show uncertainties in temperature scenarios of around ±1 °C for each RCP-scenario between years 2000 and 2100 (CH2018, 2018). Therefore, we applied the same uncertainty range for the snow projections as follows:
-
Temperature scenario ΔT for median snow depths (here: )
-
“ΔT+1 °C” scenario used for 5th percentile (higher increase, more pessimistic scenario, here: +3 °C)
-
“ΔT−1 °C” scenario used for 95th percentile (less increase, more optimistic scenario, here: +1 °C)
To apply the reduction curve (Eq. 3) to climatological evolutions we have to compute b and c from Δb and Δc, respectively. To this end, we first determined DOWY(HSref,max) and the reference season length len(HSref>0 cm). We suggest smoothing reference snow evolutions prior to determining DOWY(HSref,max) using a running mean of 30 d, to smoothen temporal variability in the data. Then b and c can be computed as follows:
Finally, using the reduction curve (Eq. 3) and reference snow depths HS(x)ref, future snow depths HS(x)fut can be computed as follows:
2.4 Variables used for validation
After synthesizing all seasonal decreases from the Literature-Fit and Literature-Validation dataset into NDJFMA-decreases (Sect. 2.1.2), we compared these Literature values to the NDJFMA-decreases from our projections of the four stations using Eq. (1).
Furthermore, we also looked at the relative reduction in season lengths by counting the days for which a certain snow depth was reached, both in the reference len(HSref>x) and for the projections len(HSfut>x). The relative reduction in season length (HS>x)-decrease was then computed as follows:
The Literature-Validation dataset contains decreases in season lengths for the following thresholds: >5, >30, >50, and >100 cm. As most values were reported for the former two thresholds, we chose the following variables for validation:
-
Relative decrease in mean November–April snow depth (NDJFMA-decrease).
-
Relative decrease in season length with more than 30 cm snow on the ground (HS>30 cm)-decrease.
-
Relative decrease in season length with more than 5 cm snow on the ground (HS>5 cm)-decrease.
Projected relative decreases were calculated for the median snow depths and 5th–95th percentiles.
3.1 Reduction curve parameters with respect to temperature and elevation
Figure 3 (left) presents the reduction parameter a, which corresponds to the maximum future relative snow depth. As expected, a decreases with increasing temperature scenarios, indicating less snow under warmer conditions. Furthermore, a increases with elevation, indicating that the decrease of future snow depth is more pronounced at lower elevations.
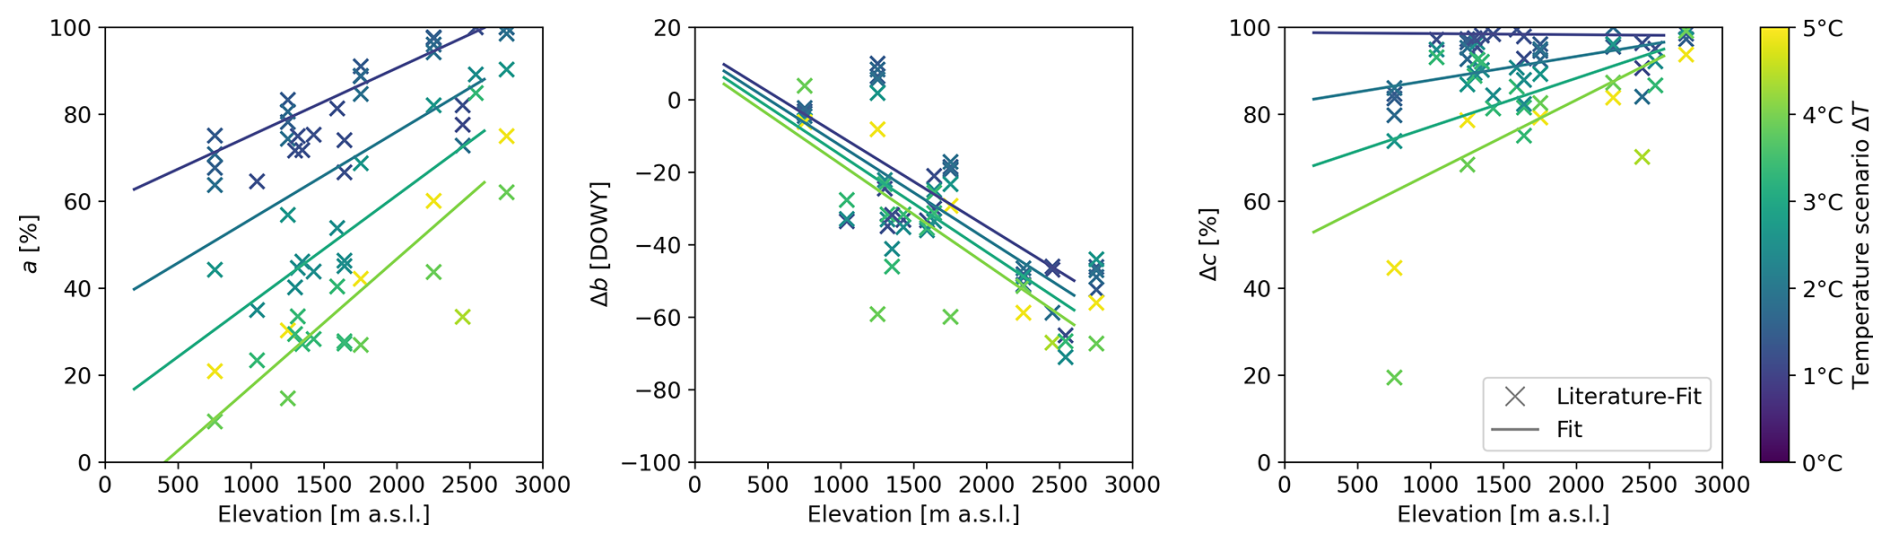
Figure 3Reduction parameters from the Literature-Fit dataset and corresponding fits with elevation and temperature scenario, which were used for computing reduction curves for future snow projections: (left) maximum of the future relative snow depth a, (middle) days between peak reduction and peak snow depth Δb, and (right) the future relative season length Δc.
Although no consistent trend was observed for the parameter b itself, Δb was predominantly negative (Fig. 3, middle), suggesting a shift in the timing of peak snow depth towards earlier in the season. Notably, this shift becomes more pronounced with elevation, as Δb decreases with higher elevation. Δb positions the peak of the reduction curves relative to the peak in snow depth, which peaks later in the season for higher elevations as the accumulation period is longer.
The relative change in season length Δc is shown in Fig. 3 (right). All studies indicated shorter snow seasons in future scenarios, with the reduction in season length being more substantial at lower elevations and under higher temperature scenarios.
The following regression formulas were derived to describe the relationships of the reduction parameters with temperature and elevation (lines in Fig. 3):
3.2 Projected snow evolutions
Snow projections under a temperature scenario indicate a decline in snow depth across all sites (Fig. 4). At Weissfluhjoch, the peak median snow depth decreases from 215 to 171 cm, while in Saanenmöser it drops from 64 to 36 cm. In Engelberg, the median snow depth during the reference period never exceeded 30 cm, and in 5 % of winters, snow depth remained at 0 cm throughout the entire year.
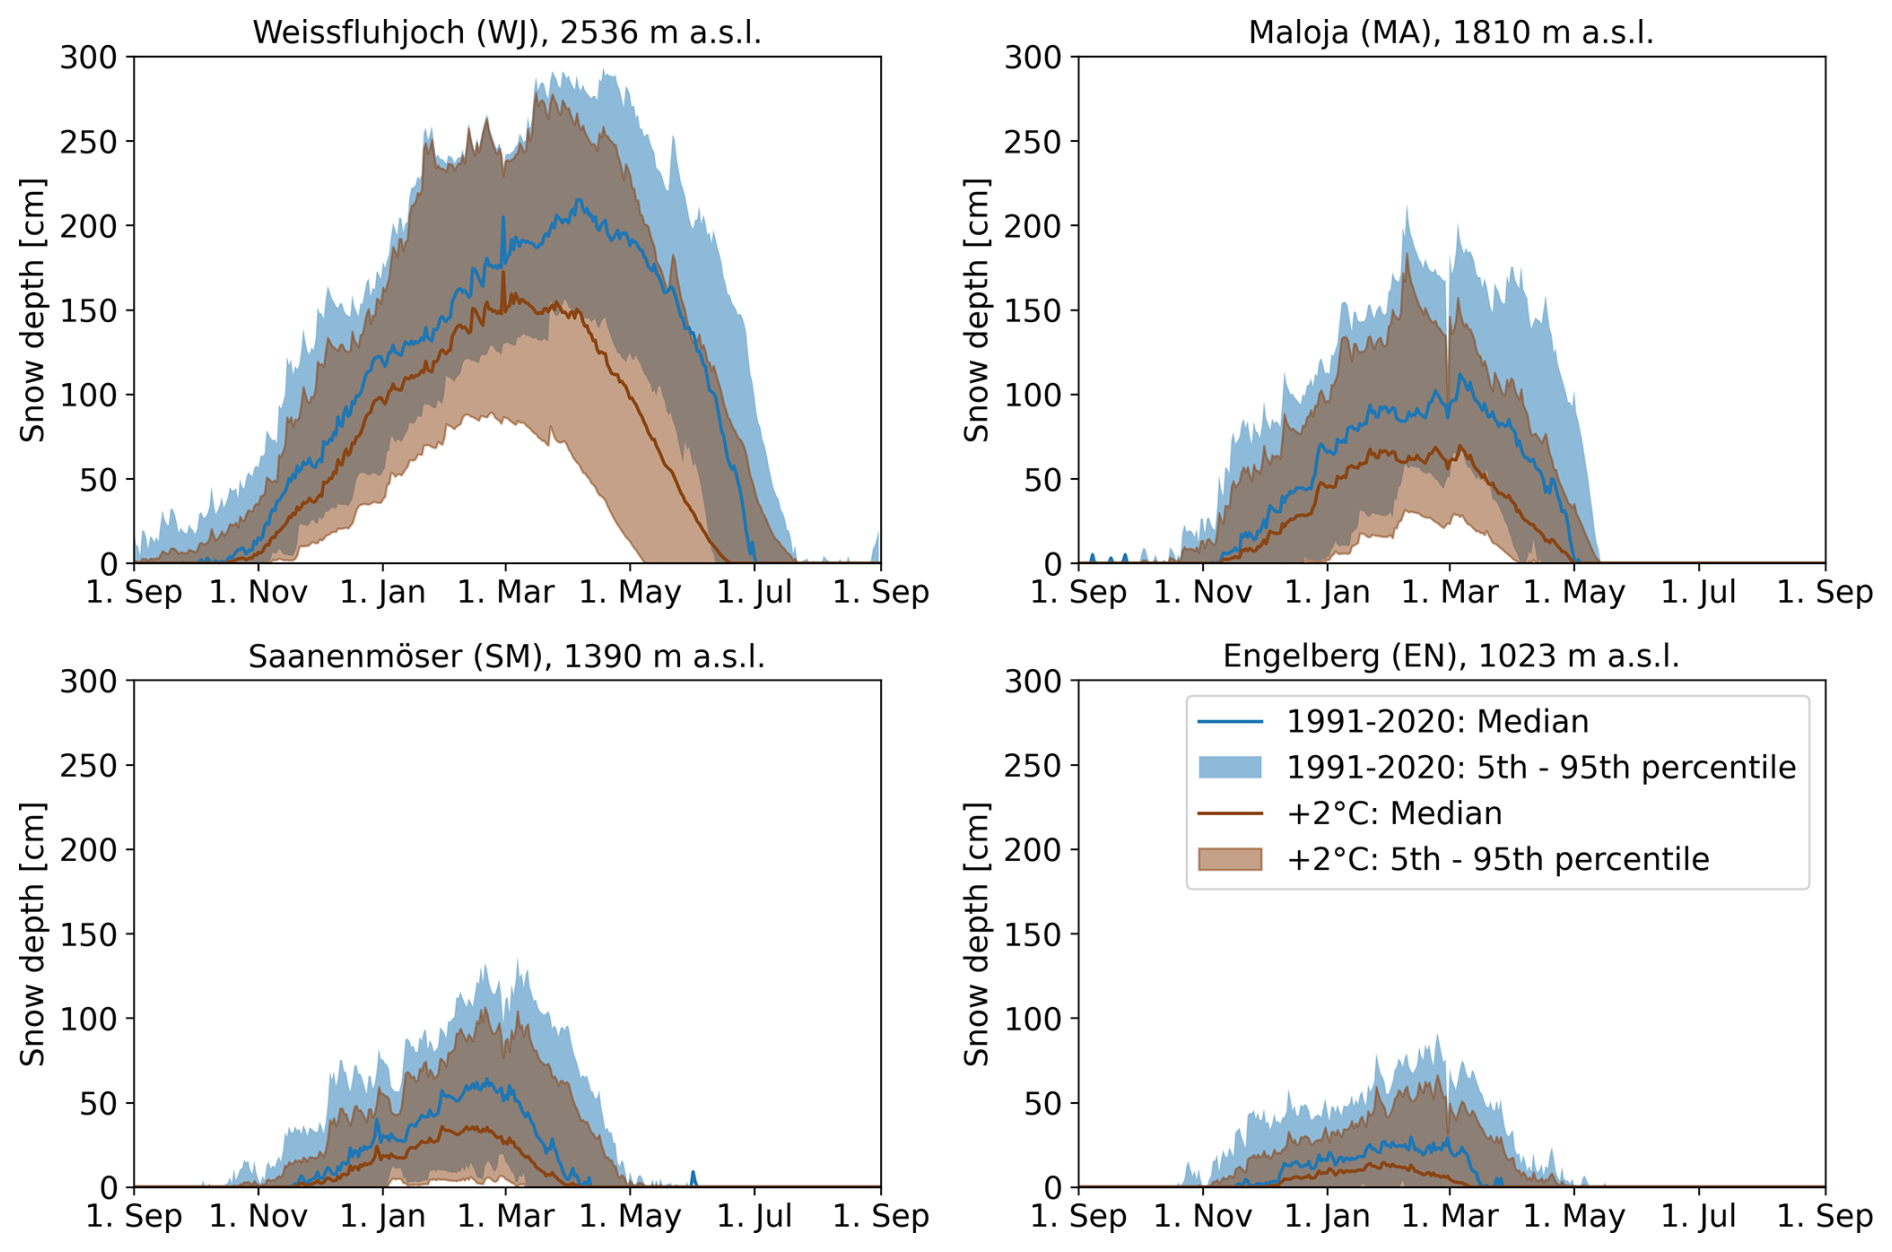
Figure 4Snow depth evolution for Weissfluhjoch (upper left), Saanenmöser (upper right), Maloja (lower left) and Engelberg (lower right) for the reference period 1991–2020 and a future projection for the temperature scenario +2 °C.
All projections also indicate shorter snow seasons in the future. For example, at Weissfluhjoch, the snow season (with HS>0 cm) is projected to begin approximately two weeks later and to end nearly two weeks earlier on average.
3.3 Validation of snow projections
We validated the projections by comparing the projected decreases at all four study sites with values reported in the literature (Fig. 5). Projected decreases shown as bars represent the 5th and 95th percentiles, while black lines indicate the decrease in median snow depth. Since literature values were not always based on the exact same temperature scenarios or elevations, comparisons were quantitatively made based on the range of values rather than exact matches.
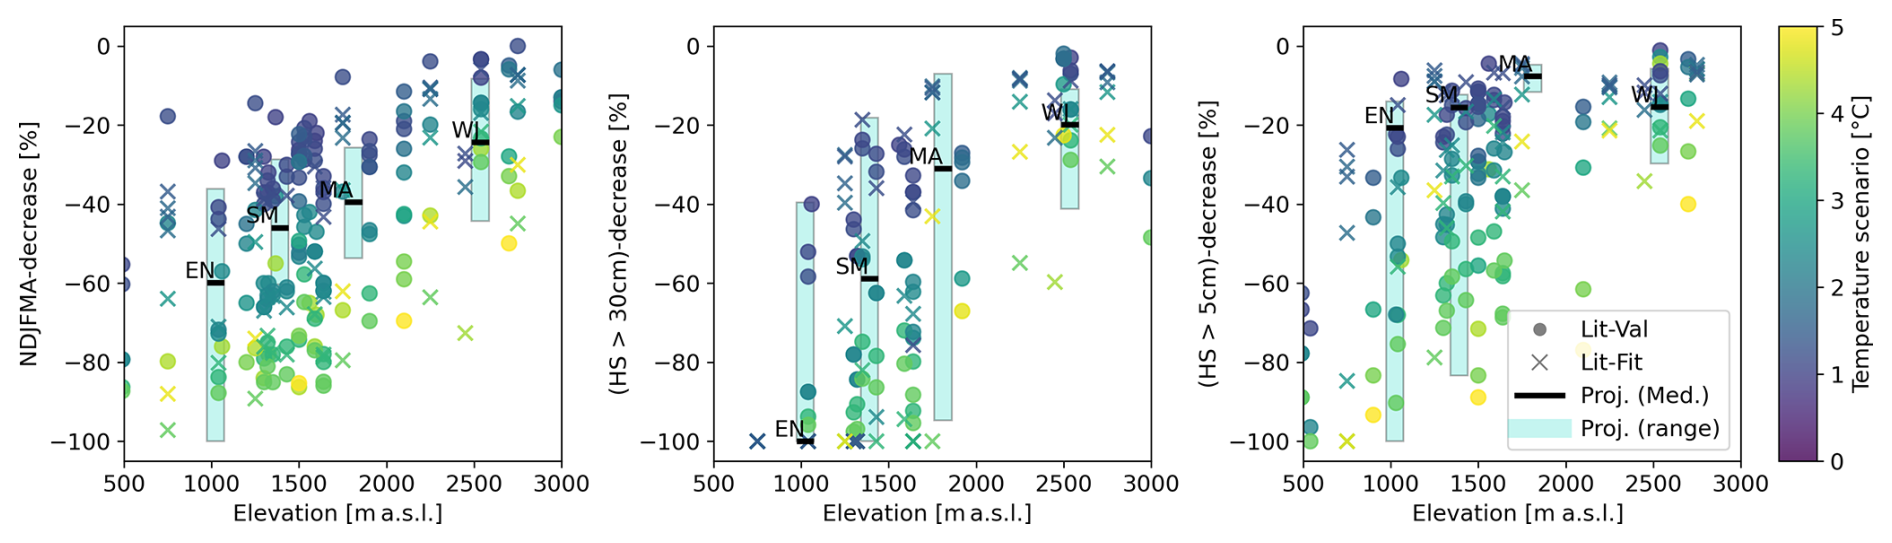
Figure 5Projected (bars) and literature based (markers) values for (left) the relative decrease in mean November to April snow depths NDJFMA-decrease, (middle) relative decrease in season length with more than 30 cm snow (HS>30 cm)-decrease and (right) decrease in season length with more than 5 cm snow (HS>5 cm)-decrease with elevation. Colors indicate temperature scenarios. Projections show median decrease (black line) and 5th and 95th percentile (bars) for the four stations Weissfluhjoch (WJ), Maloja (MA), Saanenmöser (SM), and Engelberg (EN).
Both the Literature-Fit and Literature-Validation datasets show similar trends (percentage changes) for the NDJFMA-decrease, the (HS>30 cm)-decrease and the (HS>5 cm)-decrease: the relative decreases are stronger with higher temperature scenarios and at lower elevations (Fig. 5). The projections align well with the reported ranges and replicate the expected elevation-dependent trends. Both, literature data and projections show weaker (HS>5 cm)-decreases compared to the (HS>30 cm)-decrease.
Uncertainty ranges in the projections, showing the relative decrease in the 5th and the 95th percentile, seemed to be occasionally larger than uncertainty ranges from literature values. This is due to the methodology (see Sect. 2.3), as we are projecting median and 5th–95th percentiles rather than individual years: For instance, the 5th percentile snow depth at Engelberg (EN) is zero at each calendar day in the reference period (see Fig. 4). This indicates that there is currently not one period (day) throughout a year, where snow on the ground can be guaranteed in Engelberg. As such the projected decrease in Fig. 5 was set to −100 %. On the other hand, we want to highlight that this does not imply that 5 % of the future winters will be entirely snow-free.
This study presents a practical and efficient alternative to high-resolution climate model downscaling for estimating future changes in snow depth and season length. Synthesizing existing literature and applying a simplified yet structured method to observational snow data allows to assess climate impacts in regions where localized projections are scarce or unavailable.
A major strength of this method lies in its low resource demand. No computationally complex physically-based snow models or dynamically downscaled regional climate simulations are required. Instead, observed snow data in combination with parameterized reduction curves are sufficient to obtain snow projections for different climate scenarios. As such, the approach inherently captures local climatology and site-specific features (e.g. exposure, shading, cold pool valleys) that are often missed in coarse-grid climate models (Frei, 2014). This is especially valuable for metrics like snow season length above a specific threshold (e.g. HS>30 cm), which are highly sensitive to local topography and micro-climatic conditions.
To synthesize existing literature on future snow depth reductions, we translated climate scenarios, reference periods, and projection periods into temperature scenarios. This approach offers several advantages. First, it enables to directly compare literature results and helps to quantify uncertainties across different studies. Second, it substantially improves communication with policy makers, as many national and international climate targets are framed around temperature thresholds. This communication will make the results more accessible to non-scientific audiences. Finally, this methodology can be extended and updated as new studies based on the latest climate scenarios become available.
Despite the above described strengths, our simple approach has several important limitations, in the first place the simplification of climate dynamics. While temperature change is the dominant driver of future snow loss in the Alps (Marty et al., 2017; Verfaillie et al., 2018; Kotlarski et al., 2022), other climatological uncertainties such as changing precipitation, or changes in large scale weather patterns are not explicitly incorporated. These factors are only indirectly captured, as the reduction parameters were trained on projections that do consider such dynamics. Still, this indirect inclusion does not allow assessing their future contributions. Other studies performed sensitivity analyses (e.g. adding 2 °C and ±10 % changes in precipitation as in López-Moreno et al., 2020; Richter et al., 2020) to compare the impact on the future snow cover.
Furthermore, the quadratic approximation of snow reduction curves and the linear interpolation of reduction parameters with temperature and elevation may not capture the full complexity of snow accumulation and melt processes. These simplifications may limit accuracy in regions with strong seasonal asymmetries or where snow dynamics are highly variable.
The reduction parameters were trained for elevations ranging between 750–2750 m and temperature scenarios between +1.1 and +4.8 °C. Extrapolations outside these ranges should be treated with caution.
The literature-derived values often lack clear definitions of ensemble spreads, e.g. spread of mean of individual ensemble members (Schmucki et al., 2015) or spread of all modeled snow depth evolutions. As a robust statistical assessment was not possible, we adopted a simple ±1 °C variation around the central temperature scenario to approximate uncertainty bounds (5th and 95th percentiles). Although this is a coarse approximation, the resulting projection spread remains within the variability reported across different studies and models (Marty et al., 2017; Bülow et al., 2025).
However, while the approach offers high transferability and ease of use, it simplifies complex climatic and geographic interactions. Thus, it is best used as a first-order estimate in regions where detailed projections are not available, or to complement more detailed modeling efforts.
This study introduces a resource-efficient approach to project future snow cover evolution across Alpine regions. Literature values were used to obtain localized reduction curves depending on temperature scenario and elevation. The relative reduction curves could be described with three metrics: (1) maximum relative future snow depth, (2) shift in the timing of peak snow depth, and (3) relative shortening of the snow season. Projections show consistent and plausible snow depth trends for different elevations and temperature scenarios.
This method is rather simplified and rudimentary, still it offers a robust and adaptable framework for estimating future local or regional snow depth changes in the absence of high-resolution climate projections. As such, it provides a valuable tool for the assessment of climate impacts and development of adaptive strategies in snow-dependent regions of the European Alps.
Table A1Overview over Literature values, which were used for training (Literature-Fit, first four studies in Table A1) and validation (Literature-Validation). Studies which reported values for SWE were marked with *. (Part 1, part 2 see Table A2).
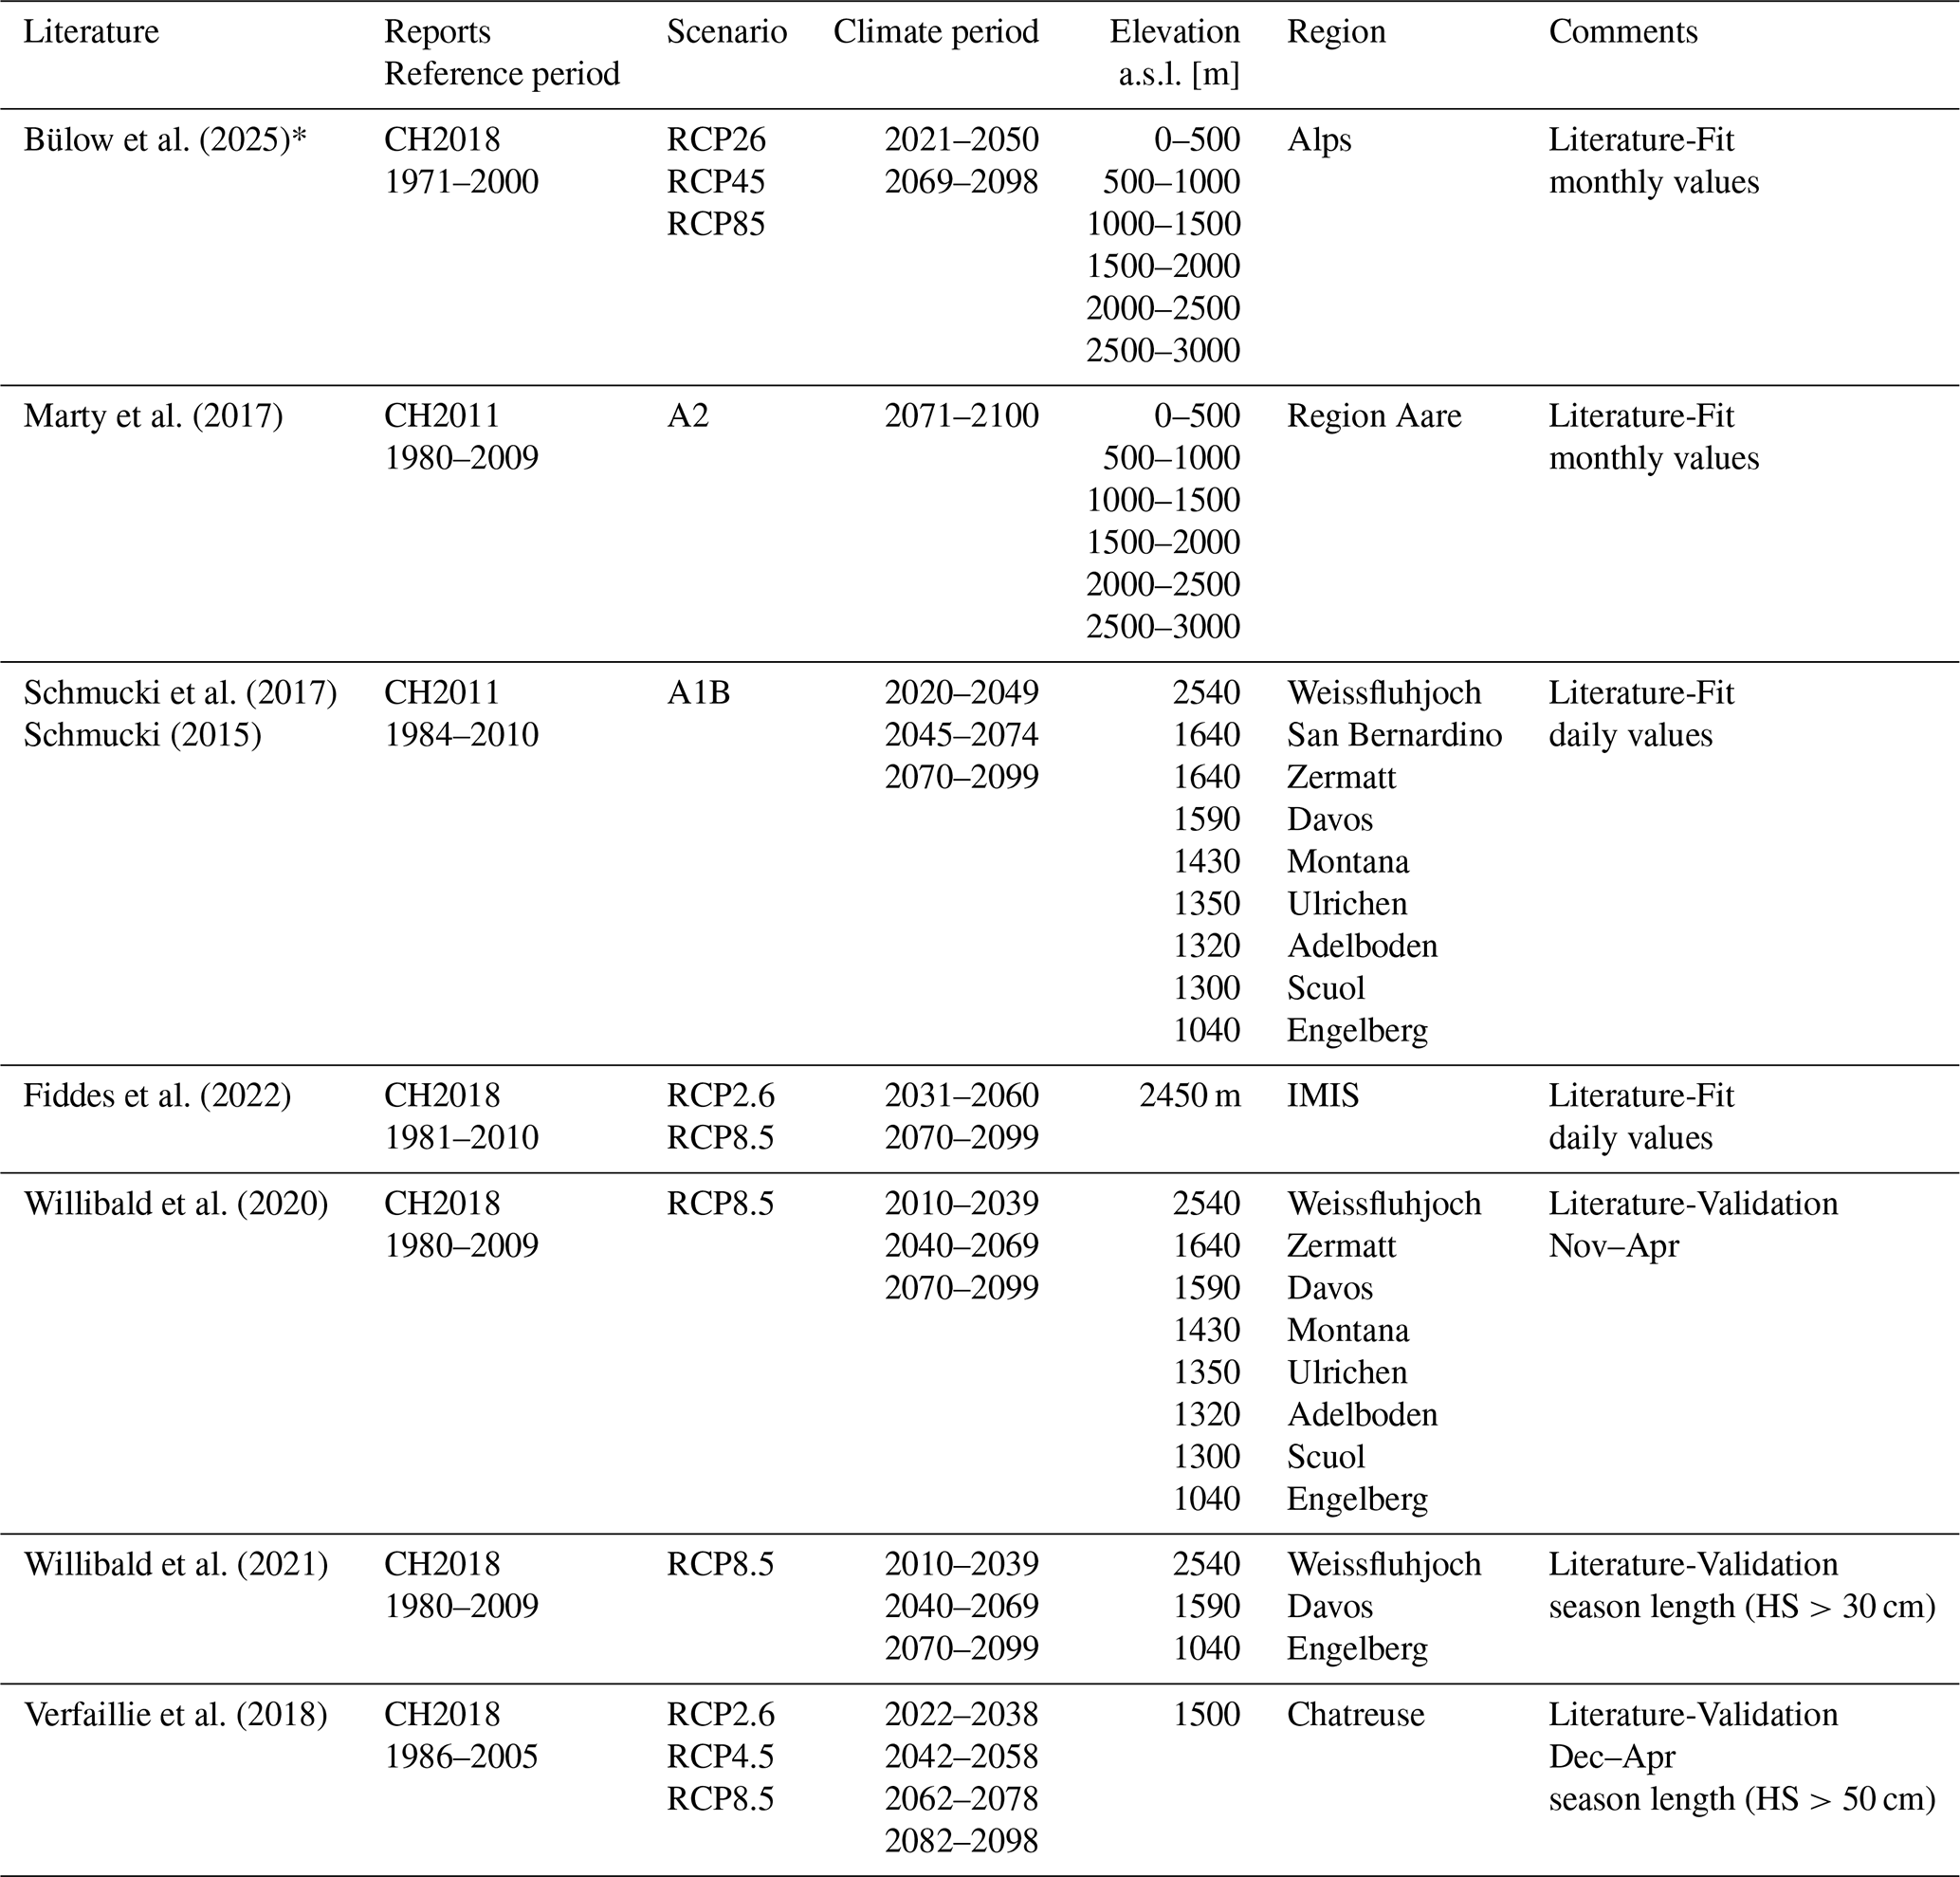
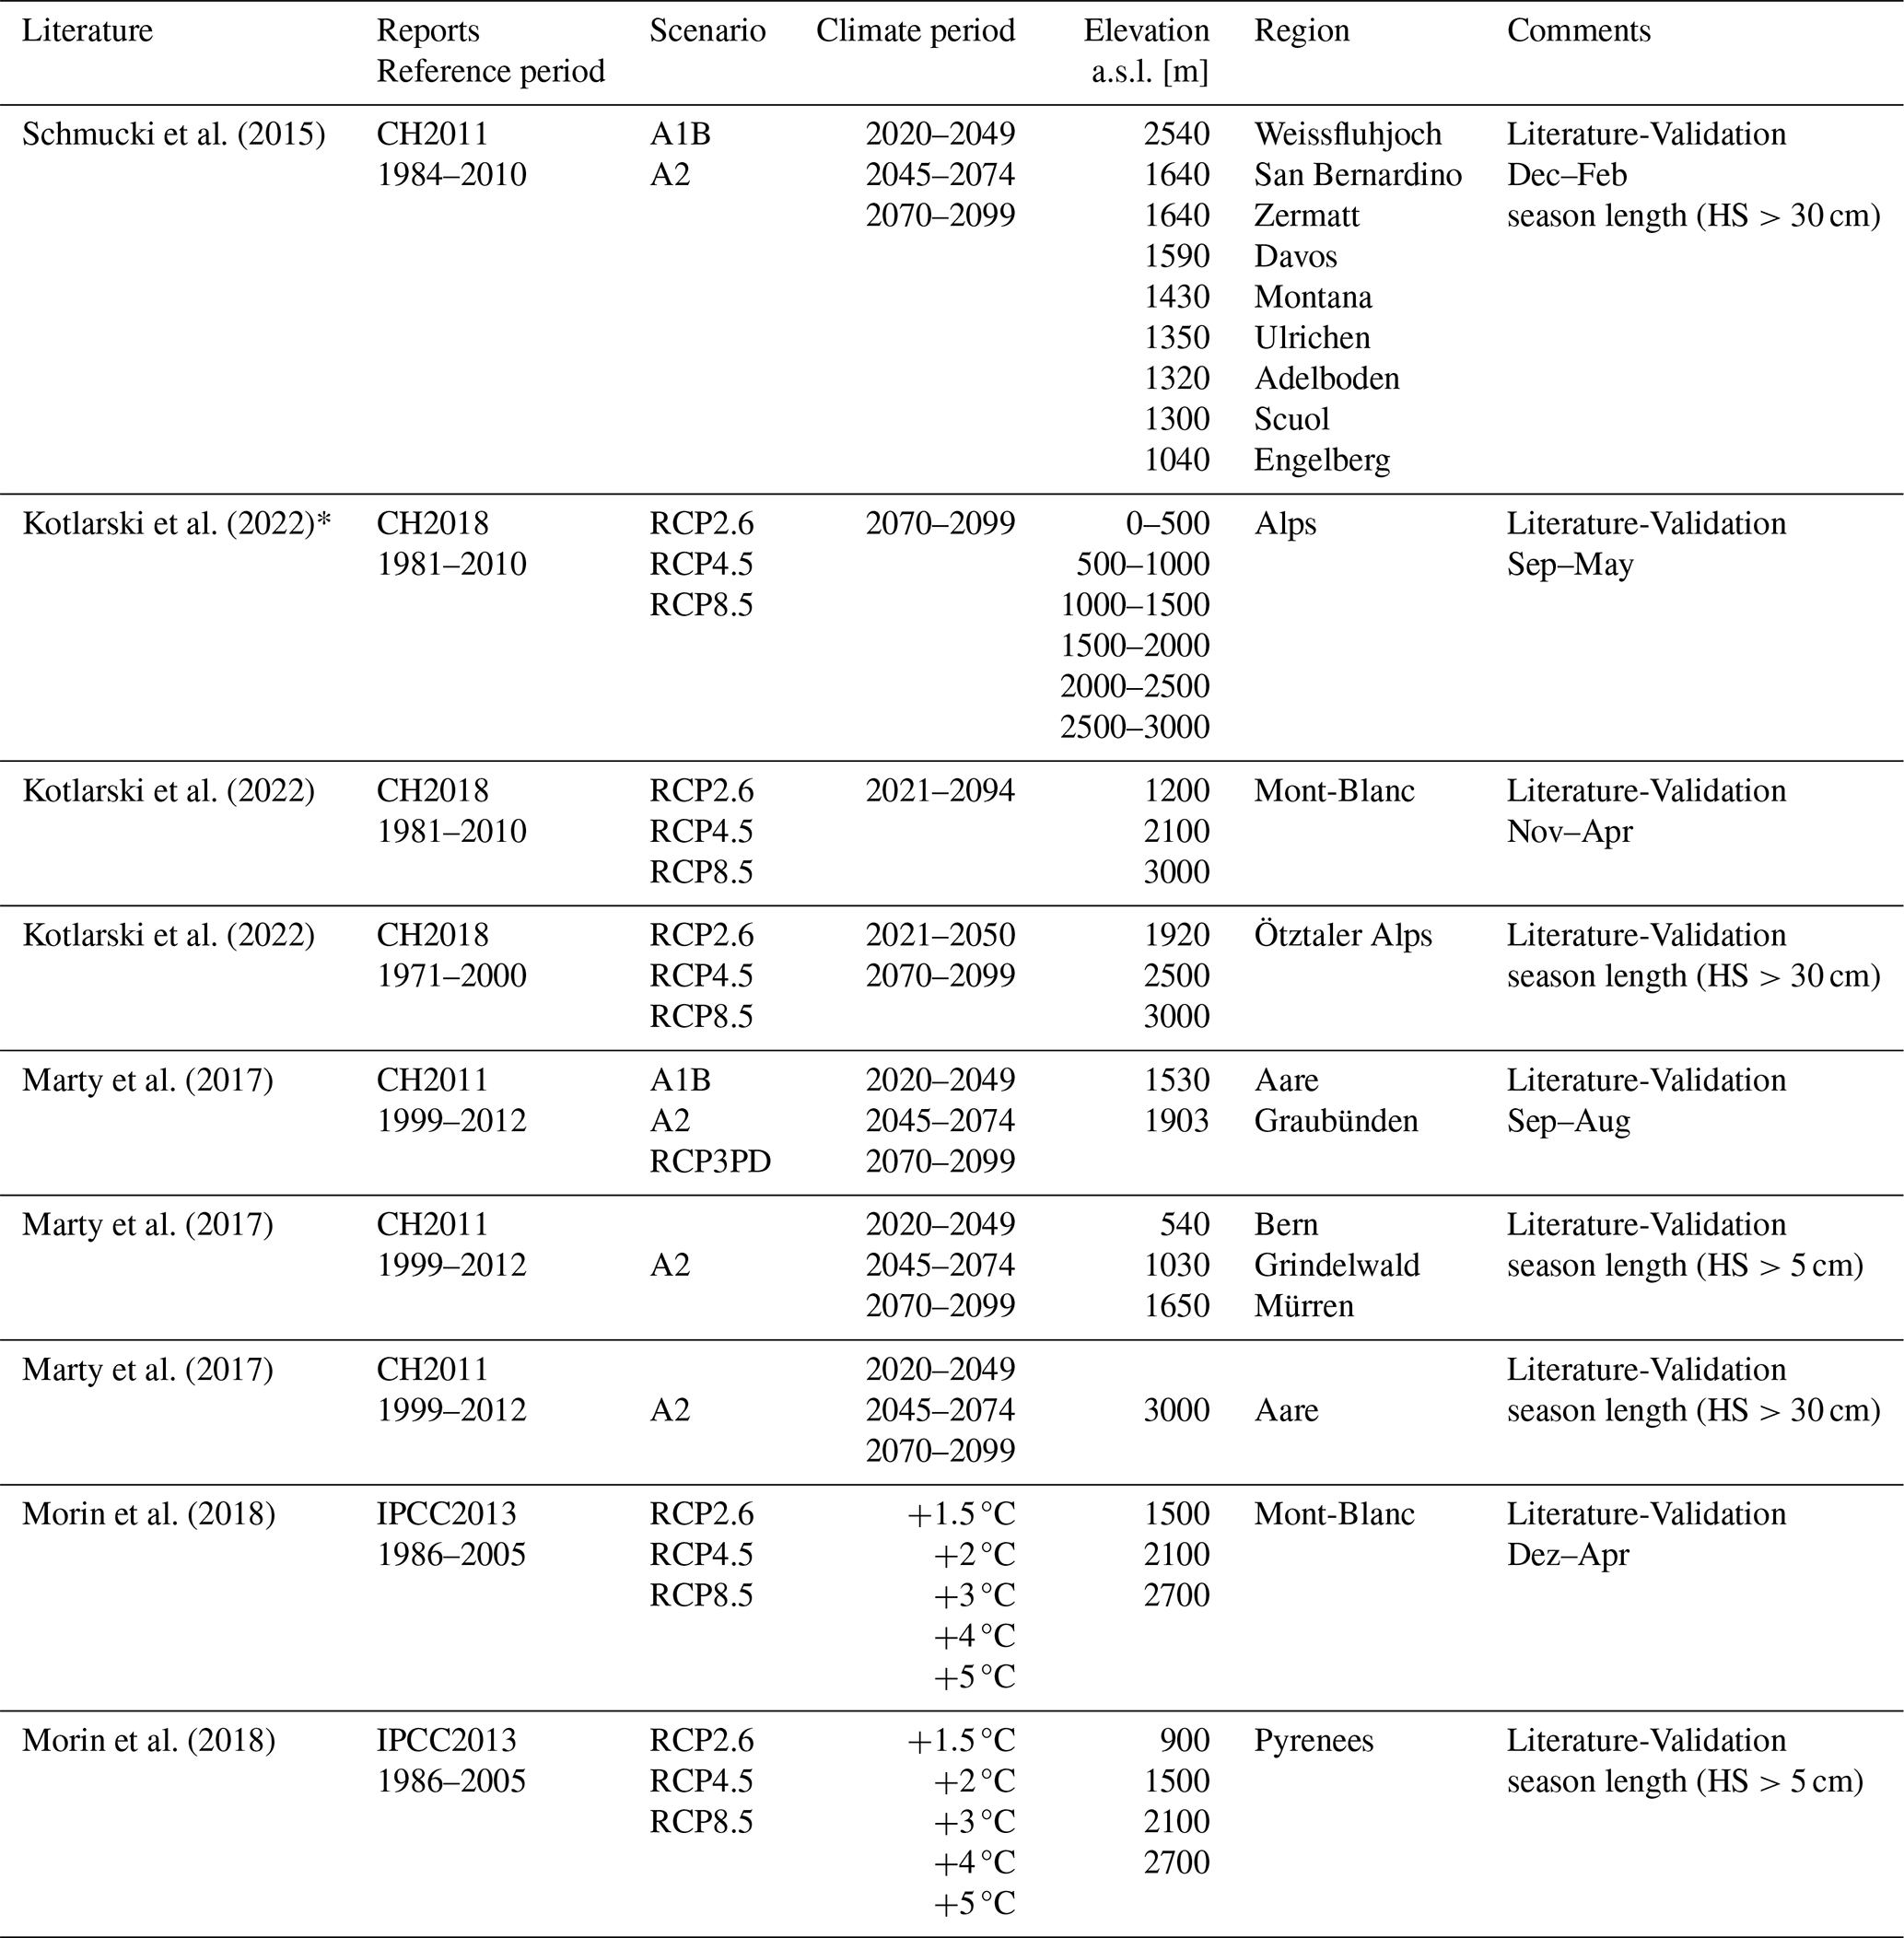
Table B1Mapping of emission scenario, reference and climate period to temperature scenario (ΔT).
Literature data and projected snow depths can be downloaded here: https://doi.org/10.16904/envidat.719 (Richter and Mary, 2025). In-situ snow depth data from SLF stations can be freely downloaded from: https://www.slf.ch/en/services-and-products/slf-data-service (last access: 22 January 2026).
BR: Data analysis, Conceptualization, Methodology, Software, Writing – original draft. CM: Conceptualization, Methodology, Writing – review and editing.
The contact author has declared that neither of the authors has any competing interests.
Publisher's note: Copernicus Publications remains neutral with regard to jurisdictional claims made in the text, published maps, institutional affiliations, or any other geographical representation in this paper. The authors bear the ultimate responsibility for providing appropriate place names. Views expressed in the text are those of the authors and do not necessarily reflect the views of the publisher.
We thank Sven Kotlarski and Katharina Bülow for their valuable contributions in providing data and insightful discussions. Finally, we want to thank the editor Daniel Viviroli, the reviewer J. Ignacio López-Moreno, and one anonymous reviewer for their valuable feedback on the manuscript.
This research has been supported by the State Secretariat for Economic Affairs SECO and “Seilbahnen Schweiz”. Additional support was provided by Speed2Zero, a Joint Initiative co-financed by the ETH Board.
This paper was edited by Daniel Viviroli and reviewed by J. Ignacio López-Moreno and one anonymous referee.
Broust, G., Buisson, S., Couble, M., Eymard, E., Grosso, J., Konarski, F., Lacroix, P., Lecomte, I., Prache, O., Roigt, P., Vicier, L., Vicier, J., and Dufour, A.: Small mid-mountain ski resorts facing climate change: the testimony of Saint-su-Touvet, Chartreuse, France, Proceedings of the International Snow Science Workshop, Tromsø, Norway, https://arc.lib.montana.edu/snow-science/objects/ISSW2024_O5.5.pdf (last access: 22 January 2026), 629–634, 2024. a
Bülow, K., Kotlarski, S., Steger, C. R., and Teichmann, C.: European snow cover in the EURO-CORDEX regional climate model ensemble – Part 2: Scenarios, in preparation, 2025. a, b, c, d
CH2011: Swiss Climate Change Scenarios CH2011, C2SM, MeteoSwiss, ETH, NCCR Climate, and OcCC, Zurich, Switzerland, ISBN: 978-3-033-03065-7, 2011. a
CH2018: CH2018 – Climate Scenarios for Switzerland, Technical Report, National Centre for Climate Services, Zurich, ISBN: 978-3-9525031-4-0, 2018. a, b, c
Fiddes, J., Aalstad, K., and Lehning, M.: TopoCLIM: rapid topography-based downscaling of regional climate model output in complex terrain v1.1, Geosci. Model Dev., 15, 1753–1768, https://doi.org/10.5194/gmd-15-1753-2022, 2022. a, b
Frei, C.: Interpolation of temperature in a mountainous region using nonlinear profiles and non-Euclidean distances, Int. J. Climatol., 34, 1585–1605, https://doi.org/10.1002/joc.3786, 2014. a
Kotlarski, S., Gobiet, A., Morin, S., Olefs, M., Rajczak, J., and Samacoíts, R.: 21st Century alpine climate change, Clim. Dynam., 60, 65–86, https://doi.org/10.1007/s00382-022-06303-3, 2022. a, b, c, d, e, f
López-Moreno, J. I., Pomeroy, J. W., Alonso-González, E., Morán-Tejeda, E., and Revuelto, J.: Decoupling of warming mountain snowpacks from hydrological regimes, Environ. Res. Lett., 15, 114006, https://doi.org/10.1088/1748-9326/abb55f, 2020. a
Marty, C., Schlögl, S., Bavay, M., and Lehning, M.: How much can we save? Impact of different emission scenarios on future snow cover in the Alps, The Cryosphere, 11, 517–529, https://doi.org/10.5194/tc-11-517-2017, 2017. a, b, c, d, e, f, g, h, i
Marty, C., Michel, A., Jonas, T., Steijn, C., Muelchi, R., and Kotlarski, S.: SPASS – new gridded climatological snow datasets for Switzerland: potential and limitations, The Cryosphere, 19, 4391–4407, https://doi.org/10.5194/tc-19-4391-2025, 2025. a
MeteoSwiss and ETH Zurich: Climate CH2025 – Scientific Report, Federal Office of Meteorology and Climatology MeteoSwiss, Zurich, https://doi.org/10.18751/climate/scenarios/ch2025/sr/1.0/, 2025. a
Morin, S., Verfaillie, D., Lafaysse, M., Déqué, M., Eckert, N., Lejeune, Y., and Soubeyroux, J.-M.: Linking variations of meteorological and snow conditions in the frenchmountain regions to global temperature levels, in: Proceedings of International Snow Science Workshop, Innsbruck, Austria, 481–487, https://arc.lib.montana.edu/snow-science/objects/ISSW2018_P06.3.pdf (last access: 22 January 2026), 2018. a, b, c, d
Ranzi, R., Colosio, P., and Galeati, G.: Climatology of snow depth and water equivalent measurements in the Italian Alps (1967–2020), Hydrol. Earth Syst. Sci., 28, 2555–2578, https://doi.org/10.5194/hess-28-2555-2024, 2024. a
Richter, B. and Marty, C.: Literature based approach to estimate future snow, EnviDat [data set], https://doi.org/10.16904/envidat.719, 2025. a
Richter, B., van Herwijnen, A., Rotach, M. W., and Schweizer, J.: Sensitivity of modeled snow stability data to meteorological input uncertainty, Nat. Hazards Earth Syst. Sci., 20, 2873–2888, https://doi.org/10.5194/nhess-20-2873-2020, 2020. a
Schmucki, E.: 21st century snow response to climate change in Switzerland, https://slsp-ube.primo.exlibrisgroup.com/permalink/41SLSP_UBE/17e6d97/alma99116775931305511 (last access: 22 January 2026), 2015. a, b, c, d, e
Schmucki, E., Marty, C., Fierz, C., and Lehning, M.: Simulations of 21st century snow response to climate change in Switzerland from a set of RCMs, Int. J. Climatol., 35, 3262–3273, https://doi.org/10.1002/joc.4205, 2015. a, b, c, d
Schmucki, E., Marty, C., Fierz, C., Weingartner, R., and Lehning, M.: Impact of climate change in Switzerland on socioeconomic snow indices, Theor. Appl. Climatol., 127, 875–889, https://doi.org/10.1007/s00704-015-1676-7, 2017. a, b
Verfaillie, D., Lafaysse, M., Déqué, M., Eckert, N., Lejeune, Y., and Morin, S.: Multi-component ensembles of future meteorological and natural snow conditions for 1500 m altitude in the Chartreuse mountain range, Northern French Alps, The Cryosphere, 12, 1249–1271, https://doi.org/10.5194/tc-12-1249-2018, 2018. a, b, c, d, e, f
Willibald, F., Kotlarski, S., Grêt-Regamey, A., and Ludwig, R.: Anthropogenic climate change versus internal climate variability: impacts on snow cover in the Swiss Alps, The Cryosphere, 14, 2909–2924, https://doi.org/10.5194/tc-14-2909-2020, 2020. a, b, c
Willibald, F., Kotlarski, S., Ebner, P. P., Bavay, M., Marty, C., Trentini, F. V., Ludwig, R., and Grêt-Regamey, A.: Vulnerability of ski tourism towards internal climate variability and climate change in the Swiss Alps, Sci. Total Environ., 784, 147054, https://doi.org/10.1016/j.scitotenv.2021.147054, 2021. a, b
- Abstract
- Introduction
- Methods
- Results
- Discussion
- Conclusions
- Appendix A: Table of Literature values used for training and validation
- Appendix B: Table: Linking RCP-Scenarios and Climate periods to temperature scenarios
- Code and data availability
- Author contributions
- Competing interests
- Disclaimer
- Acknowledgements
- Financial support
- Review statement
- References