
the Creative Commons Attribution 4.0 License.
the Creative Commons Attribution 4.0 License.
 | 20 Oct 2026
Climate change impacts on groundwater simulated using the AquiFR modelling platform

Jean-Pierre Vergnes
Simon Munier
Florence Habets
In the context of increasing water stress and climate change, the assessment of changes in groundwater resources has become a major challenge for water decision-makers. As part of the EXPLORE2 project, this study aims to estimate changes in groundwater levels on French aquifers during the 21st century. We use the hydrogeological modelling platform AquiFR, forced by 36 regional climate projections from Eurocordex (CMIP5), bias-corrected according to a state-of-the-art method, based on three Representative Concentration Pathways (RCPs): RCP2.6, RCP4.5 and RCP8.5. To better reflect uncertainties, four storylines based on the RCP8.5 scenario have been selected to represent possible futures that illustrate the impacts of worst-case scenarios, to help decision-makers to adopt sustainable groundwater management policies. The future evolution of groundwater is assessed using the standardized piezometric level index, a normalized indicator of groundwater level that provides return periods based on the distribution value over a reference period – in this case 1975–2004. The analyses revealed significant variability between regional climate models. The predominant signal is an increase in groundwater levels, affecting most of the study area, particularly in northern France. This result is in contrast to previous studies in this area. Under the RCP8.5 (highest greenhouse gas emissions scenario), the evolution of the occurrence of current 10-year return period events shows a significant increase in the risk of high groundwater levels, primarily on the northern part of France, which is consistent with 3 out of the 4 storylines. This is accompanied by an increase in the 10-year low groundwater levels mostly observed in the southern part of the French aquifer systems represented by AquiFR. This pattern is shared by all four storylines. This finding underscores a discernible North-South distinction. The increase in the severity of events is a well-known consequence of climate change on surface hydrology, but is less prevalent in groundwater hydrology, which is characterised by a longer residence time.
- Article
(31958 KB) - Full-text XML
- BibTeX
- EndNote


In France, groundwater supports 70 % of drinking water, supplying both domestic (Maréchal and Rouillard, 2020) and agricultural sectors, the latter accounting for one-third of agricultural withdrawals (Pasquier, 2017). Therefore, understanding and anticipating future groundwater temporal evolution is crucial for stakeholders and decision-makers involved in the sustainable management of water resources, especially because this evolution depends on both human activities and climate (Baulon et al., 2020; Guillaumot et al., 2024). In addition, the Intergovernmental Panel on Climate Change (IPCC) asserts that a large proportion of hydrological systems (e.g., surface rivers, groundwater tables, …) are already being affected on a global scale and will be further impacted in the coming decades due to climate change (IPCC, 2014, 2022). Among the projected changes figures the intensification of extreme events in terms of floods and droughts, in both frequency and intensity (Kundzewicz et al., 2014; Prudhomme et al., 2014; Garner et al., 2015), potentially affecting groundwater management.
Several projects have provided a first global assessment of the consequences of climate change on French hydrology, e.g., the EXPLORE 2070 project (Chauveau et al., 2013) using climate projections provided by the Coupled-Model Intercomparison Project 3 (CMIP3) global exercise. More recent projects used climate projections from the CMIP5 global exercise (Taylor et al., 2012), which were regionalized over France by Dayon et al. (2018), to assess the future of groundwater on specific watersheds (Boé et al., 2018; Habets et al., 2021). These studies projected a widespread drop in groundwater levels induced by a decrease in recharge of between 10 % and 25 %, with spatial variations (Stollsteiner, 2012; Habets et al., 2013). Two areas were particularly severely affected: the Loire basin, where recharge decreases by 25 % to 30 % over half of its surface; and South-West France, where the decreases ranges between 30 % and 50 %. The EXPLORE 2070 project, which was completed with a surface hydrology assessment, enabled the magnitude of the challenge of defining national adaptation or attenuation strategies for numerous sectors of activity (e.g. energy and agriculture) to be better measured (Carroget et al., 2017).
However, more recent studies suggest that the impact of climate change on French hydrological systems, including groundwater, is more contrasted, particularly in northern France (Costantini et al., 2023; Vergnes et al., 2023), highlighting the need for a new general assessment of the impact of climate change on French hydrology. In line with IPCC recommendations (IPCC, 2022), the EXPLORE2 project (Marson et al., 2026; Sauquet et al., 2026) aims to update the conclusions of these previous studies, in particular with regard to groundwater. This project provides an opportunity to study larger areas and more aquifers of interest.
In such a context, studying the impact of climate change on hydrological systems requires the use of a hydroclimatic modelling chain, ranging from updated greenhouse gas emission scenarios to hydrological indicators, and established as best as possible on a multi-model ensemble approach (Sansom et al., 2013). The principle is to use several radiative forcing scenarios, climate models and hydro(geo)logical models to quantify the uncertainty associated with the projections (Knutti et al., 2013; Rajib et al., 2014). Indeed, each climate model differs in elements such as precipitation distribution (Lafaysse et al., 2014) which necessarily leads to different projections at the end of the modelling chain. Consequently, using multiple models at each step is strongly recommended (Hingray and Saïd, 2014; Vidal et al., 2016; Hingray et al., 2019). Ultimately, the challenge for modellers is to assess the uncertainties inherent to the amount of obtained results, for example by identifying converging patterns or, conversely, the absence of a robust trend from all projections (Kennel et al., 2016). Given the potential divergence in results derived from global climate projection datasets, a second approach has recently emerged: the use of storylines. These are contrasted climate projections, each based on distinct design assumptions (Shepherd et al., 2018). The objective is to emphasis the variability of climate change impacts while maintaining the physical consistency of each projection, avoiding the aggregation of results as in probabilistic approaches.
In order to provide consistent information on groundwater, the use of models providing realistic representations of aquifer systems is required (Vergnes et al., 2020). Therefore, the hydrogeological part of the modelling chain is often composed of spatially distributed hydrogeological regional models built over specific studies areas at the regional scale (Stollsteiner, 2012; Højberg et al., 2013; Maxwell et al., 2015). In this respect, the hydrogeological platform AquiFR (Vergnes et al., 2020) is a relevant candidate as the platform integrates two distributed hydrogeological modelling software packages with several regional models, in order to account for the heterogeneity of French aquifers. However, although the AquiFR platform integrates several hydrogeological software packages, it is not based on a multi-model approach, as each package is applied to a specific catchment and almost no simulated areas overlap spatially. Despite this limitation, the AquiFR system is already operational for historical reanalysis of groundwater, real-time monitoring and seasonal forecast, when coupled with the SURFEX land surface model to provide recharge over its entire domain (Masson et al., 2013; Le Moigne et al., 2020), especially for the assessment of dry events to help decision-makers (Habets et al., 2021).
As part of a study on the impact of climate change on French groundwater, CMIP5 global climate projections have already been used by Habets et al. (2021) to force AquiFR. However, since then, the projections have been updated and a new assessment is required. Furthermore, Vergnes et al. (2023) have also already assessed the impact of climate change on French groundwater resources, but using a single-layer aquifer model at a coarser spatial configuration than AquiFR, with a set of five climate projections. These elements highlight the importance of the present study. As part of the EXPLORE2 project, we aim to assess the impact of climate change projected by regional climate models on several French aquifers of interest. To this end, the hydrogeological modelling platform AquiFR is used to simulate hydrogeological projections based on 36 climate projections that use three future socio-economic scenarios. These projections are a subset of the Euro-CORDEX project (Jacob et al., 2020) resulting from the CMIP5 exercise (IPCC, 2014), which have been downscaled with a method combining weather typing and quantile mapping approaches. The primary contribution of this paper lies in its utilisation of a large ensemble of climate projections used to better account for climate internal variability – a dimension that has been poorly carried out in the literature, particularly with respect to the evolution of groundwater under climate change. Additionally, this work places specific emphasis on four contrasting projections from the EXPLORE2 dataset. These projections are utilised as storylines to explore the range of climate change impacts on groundwater, an approach that, to our knowledge, has been rarely adopted in existing literature. Finally, the use of the AquiFR platform enables the integration of heterogeneous aquifer systems, representing another key strength of this study.
It is important to clarify that this study does not explicitly address the impacts of anthropogenic factors on water resources, as the EXPLORE2 project was designed to disentangle climate change impacts from those of human activities. This separation aims to provide stakeholders with clear, actionable insights for developing targeted adaptation measures. Consequently, all anthropogenic factors, including land use and groundwater abstraction, are held constant throughout the 21st century simulations. Nevertheless, previous work using the AquiFR platform has demonstrated that groundwater abstraction, by inducing declines in groundwater levels, can substantially reduce aquifer-river exchange fluxes, with significant implications for headwater basin dynamics (Guillaumot et al., 2024).
2.1 Regionalized climate projections from EXPLORE2
The climate projections (CPs) used to force the AquiFR platform primarily originates from the DRIAS-2020 database (DRIAS 2021; http://www.drias-climat.fr/, last access: 25 October, 2024) which provides downscaled and unbiased climate projections on the French region. This database is based on a subset of projections from the Euro-CORDEX project (CooRdinated Downscaling EXperiment – European Domain; Jacob et al., 2020), which is included in CMIP5 (IPCC, 2014). As part of the EXPLORE2 database implementation, the original DRIAS-2020 database has been extended to include the latest EURO-CORDEX simulations with evolving aerosol forcing (Robin et al., 2023) resulting in the EXPLORE2-Climat 2022 database.
To obtain future climate variables, General Circulations Models (GCMs; Phillips, 1956; Randall, 2000) are forced by Radiative Concentration Pathways (RCPs), greenhouse gas emission scenarios that follow specific socio-economic trajectories through the 21st century. However, GCM outputs have a coarse spatial resolution of around 2.5°, i.e., between 100 and 200 km, which is insufficient to adequately represent local meteorological phenomena and extreme events. This prevents them from being directly used as climate forcing in hydrological models for regional or local scale studies. Thus prior to use a statistical downscaling method, a dynamic downscaling is made by using RCMs (Regional Climate Models) to provide detailed estimates of meteorological parameters (e.g., temperature, precipitation, humidity, wind, solar radiation, …) at an hourly time step for regional applications using a dynamic downscaling approach (Liang et al., 2008; Tapiador et al., 2020), with a spatial resolution from 10 to 20 km.
Then, the ADjustment to MOuNTain regions (ADAMONT; Verfaillie et al., 2017) method is applied to the RCM outputs to both improve spatial resolution and correct bias according to an historical meteorological reference by a two-steps method:
-
Weather regime computation (Michelangeli et al., 2009; Driouech et al., 2010): each day from both the RCMs and the meteorological reference is clustered into one of four weather regimes, based on the clustering of the geopotential height at 500 hPa from the ERA-40 analysis, per each one of the four seasons: (1) December, January, February (DJF); (2) March, April, May (MAM); (3) June, July, August (JJA); (4) September, October, November (SON). Then, quantile distributions of each climate variables from both the RCMs and the meteorological reference are computed for the 16 weather regime/season combinations (Verfaillie et al., 2017);
-
Quantile mapping (Maurer et al., 2010; Navarro-Racines et al., 2020; Potter et al., 2020): for each couple, quantile mapping is applied to the quantile distributions of RCMs climate variables, which are adjusted according to the meteorological reference.
The historical meteorological reference used is the SAFRAN reanalysis (“Système d'Analyse Fournissant des Renseignements Adaptés à la Nivologie” in French; Le Moigne et al., 2020), which provides “pseudo-observed” data useful for bias correction across France.
At the end of the procedure, the CPs simulated by the GCM/RCM couples provide downscaled climate variables at hourly time step and on a regular grid of 8 km × 8 km. The total set comprises 6 GCMs coupled with 9 RCMs, and forced by 3 RCPs : (1) RCP2.6, a stringent mitigation scenario which assumes an efficient international environmental policy (van Vuuren et al., 2007); (2) RCP4.5, an intermediate stabilisation scenario (Thomson et al., 2011); (3) RCP8.5, a very high green house gas emission scenario without efficient environmental international policy (Riahi et al., 2011). The EXPLORE2 project uses 17 GCM/RCM pairs forced by one to three RCPs, for a total of 36 simulations (Table A1 in Appendix A), all downscaled and bias-corrected by ADAMONT.
The large number of GCM/RCM couples in the EXPLORE2 ensemble is one of the project's main strengths, which allows to better account for uncertainty when extracting future trends using a probabilistic approach. Evin et al. (2025) identified climate components as being the primary source of uncertainty in particular for precipitation, which is the main factor influencing recharge and, consequently, groundwater. Indeed, the climate models can produce different results for the same future scenario, depending on the formulation and parametrisation of physical and thermodynamic processes, which can vary considerably from one model to another, as well as on the spatial resolution. Further details on the biases induced by each specific GCM and RCM can be found in Marson et al. (2026). In light of this divergence, which limits the extraction of future trends using a probabilistic approach, a second approach is adopted. This approach involves selecting four contrasting storylines (i.e., CPs based on contrasted trends) from the available GCM/RCM couples using the RCP8.5. This allows us to focus on four contrasting possible futures (Shepherd et al., 2018; Shepherd, 2019). Unlike the probabilistic approach, the aim here is to consider each narrative individually to maintain its physical consistency without mixing it with the other narratives in the set. The selected storylines are (Marson et al., 2026):
-
Orange storyline (EC-EARTH/HadREM3-GA7-05 couple): climate affected by a strong warming and very dry in the summer;
-
Green storyline (HadGEM2-ES/ALADIN63 couple): serious warming and increased rainfall;
-
Purple storyline (HadGEM2-ES/CCLM4-8-17 couple): serious warming in temperature and strong seasonal contrast in precipitation with the winter season having large amount of precipitation, while summer season has low amount of precipitation;
-
Yellow storyline (CNRM-CM5/ALADIN63 couple): future changes remaining relatively low;
It should be noticed that the latter CMIP6 projections are not used here, since they have not yet been downscaled or bias-corrected at the regional level, which prevents their use for regional studies. However, the EXPLORE2 dataset was compared with projections from CMIP6, and the projections used here are included within the CMIP6 confidence interval (Marson et al., 2026). This lends credibility to the use of these climate projections, particularly given that they have been used in recently published papers (Tramblay et al., 2025; Sauquet et al., 2026).
Following the recommendations of the EXPLORE2 project, the analyses of CPs were conducted over four time periods comprising 1 historical period and 3 future horizons for a total time frame ranging from 1975 to 2099. This considers that an hydrological year is set from 1 August to 31 July (Table 1).
Table 1Temporal splitting of the climate projections from the EXPLORE2 project.

2.2 The AquiFR modelling platform
AquiFR is a hydro-meteorological modelling platform regrouping existing models, one model being defined as a pair of catchments and the hydrogeological modelling software used, to simulate French rivers and groundwater systems (Habets et al., 2021). Each model is developed and configured for a specific region to meet the needs of stakeholders. The platform was assessed over a sixty-year period (Vergnes et al., 2020), and has demonstrated good performance in simulating groundwater levels, compared to observed piezometric heads from the ADES (“Accès aux Données sur les Eaux Souterraines”) database (http://www.ades.eaufrance.fr/, last access: 29 November 2024, Chery and Cattan, 2003). Nowadays, the AquiFR platform is used in an operational context for real-time monitoring and seasonal forecasting on the main sedimentary basins and aquifers for groundwater decision-makers (Habets et al., 2021).
2.2.1 The SURFEX modelling platform
A specific feature of AquiFR is that the SURFEX modelling platform (“SURFace EXternalisée” in French; Masson et al., 2013) is used to solve the water and energy balances at the surface-atmosphere interface from the atmospheric forcings. This is achieved using several land surface schemes dedicated to each land use category. More specifically, only the ISBA (“Interactions Sol – Biosphère – Atmosphère” in French; Noilhan and Planton, 1989) land surface scheme, which is included in the SURFEX modelling platform, is used to simulate the continental area. ISBA allows a direct coupling with an atmospheric model, with a spatial resolution adaptable to a wide range of grid sizes, from hundreds of kilometers (e.g., when coupled to a global climate model) to a few kilometers for more local studies (Le Moigne et al., 2020) or for hydrological studies (Decharme et al., 2019; Munier and Decharme, 2022).
The atmospheric forcing used to force SURFEX varies depending on the purpose, either the SAFRAN historical reanalysis (Vidal et al., 2010) for historical reanalysis and real-time monitoring or seasonal forecasting (Roehrig et al., 2020).
Eventually, SURFEX simulates surface runoff and drainage homogeneously across all the aquifers simulated by AquiFR. These are both diagnostic variables that constitute the groundwater recharge terms used to force the hydrogeological models implemented in AquiFR. Note that no feedback mechanisms from AquiFR to SURFEX are used here. Such mechanisms could provide a more accurate representation of actual evapotranspiration, particularly when groundwater level reaches the root zone. However, the contribution of groundwater to actual evapotranspiration in France does not exceed 2 % (Decharme et al., 2019), which suggests that feedback mechanisms can be reasonably neglected.
2.2.2 Hydrogeological modelling software
Two physically-based hydrogeological modelling software packages have been integrated into the AquiFR platform: EauDyssée (Saleh et al., 2013) and MARTHE (“Modélisation des Aquifères avec un maillage Rectangulaire, Transport et HydrodynamiquE” in French; Thiéry, 2015). These software packages represent sedimentary aquifers, with an explicit representation of river-aquifer exchanges and a simplified transfer process within the unsaturated zone (Philippe et al., 2011).
EauDyssée comprises several modules, including, among the most important ones, one dedicated to simulate multilayer aquifers using a finite difference numerical scheme to solve the groundwater diffusivity equation (Ledoux et al., 1989). This approach is based on 2D horizontal groundwater flows and vertical exchange through aquitards, in order to represent both unconfined and confined aquifers (Vergnes et al., 2020). Then, a second module uses matrix-based version of the Muskingum routing scheme for river routing (David et al., 2011), to calculate discharge simultaneously through a river network, and exchanges with groundwater in both directions by coupling with groundwater modules.
MARTHE is the hydrogeological modelling software program developed by the French Geological Survey (BRGM), which simulates coupled groundwater flows and mass transfers and rivers flows using single-layer to multilayer aquifers and hydrographic networks. MARTHE simulates groundwater flows using a 3-dimensional finite volume approach to solve the hydrodynamic equation based on Darcy’s law and mass conservation on a regular rectangular grids, and coupled to a kinetic wave approach used to simulate river flows (Vergnes et al., 2020).
Note that while EauDyssée and MARTHE simulate rivers discharges and groundwater-river exchanges, this study focuses exclusively on groundwater level projections. The choice is motivated to focus the reader attention of groundwater levels and because studies included in the EXPLORE2 project already carry out the future evolution of river discharge under climate change over hexagonal France (Tramblay et al., 2025; Sauquet et al., 2026). Furthermore, groundwater abstraction is simulated at a monthly time step for each model, using a climatology-based approach that relies on historical data. As stated in the introduction section, groundwater abstraction rates are assumed to remain unchanged in future projections, thereby allowing the isolation of climate change impacts on groundwater dynamics. More detailed information about hydrogeological modelling software are provided in Habets et al. (2021). In practice, the hydrogeological modelling software packages are simultaneously and synchronously forced by the runoff and drainage simulated by SURFEX and connected via a Python software. The AquiFR results are provided in a homogeneous format defined according to an irregular spatial grid with a resolution ranging from 100 to 2000 m on a monthly time step (Habets et al., 2021).
2.2.3 Spatial coverage of the AquiFR domain
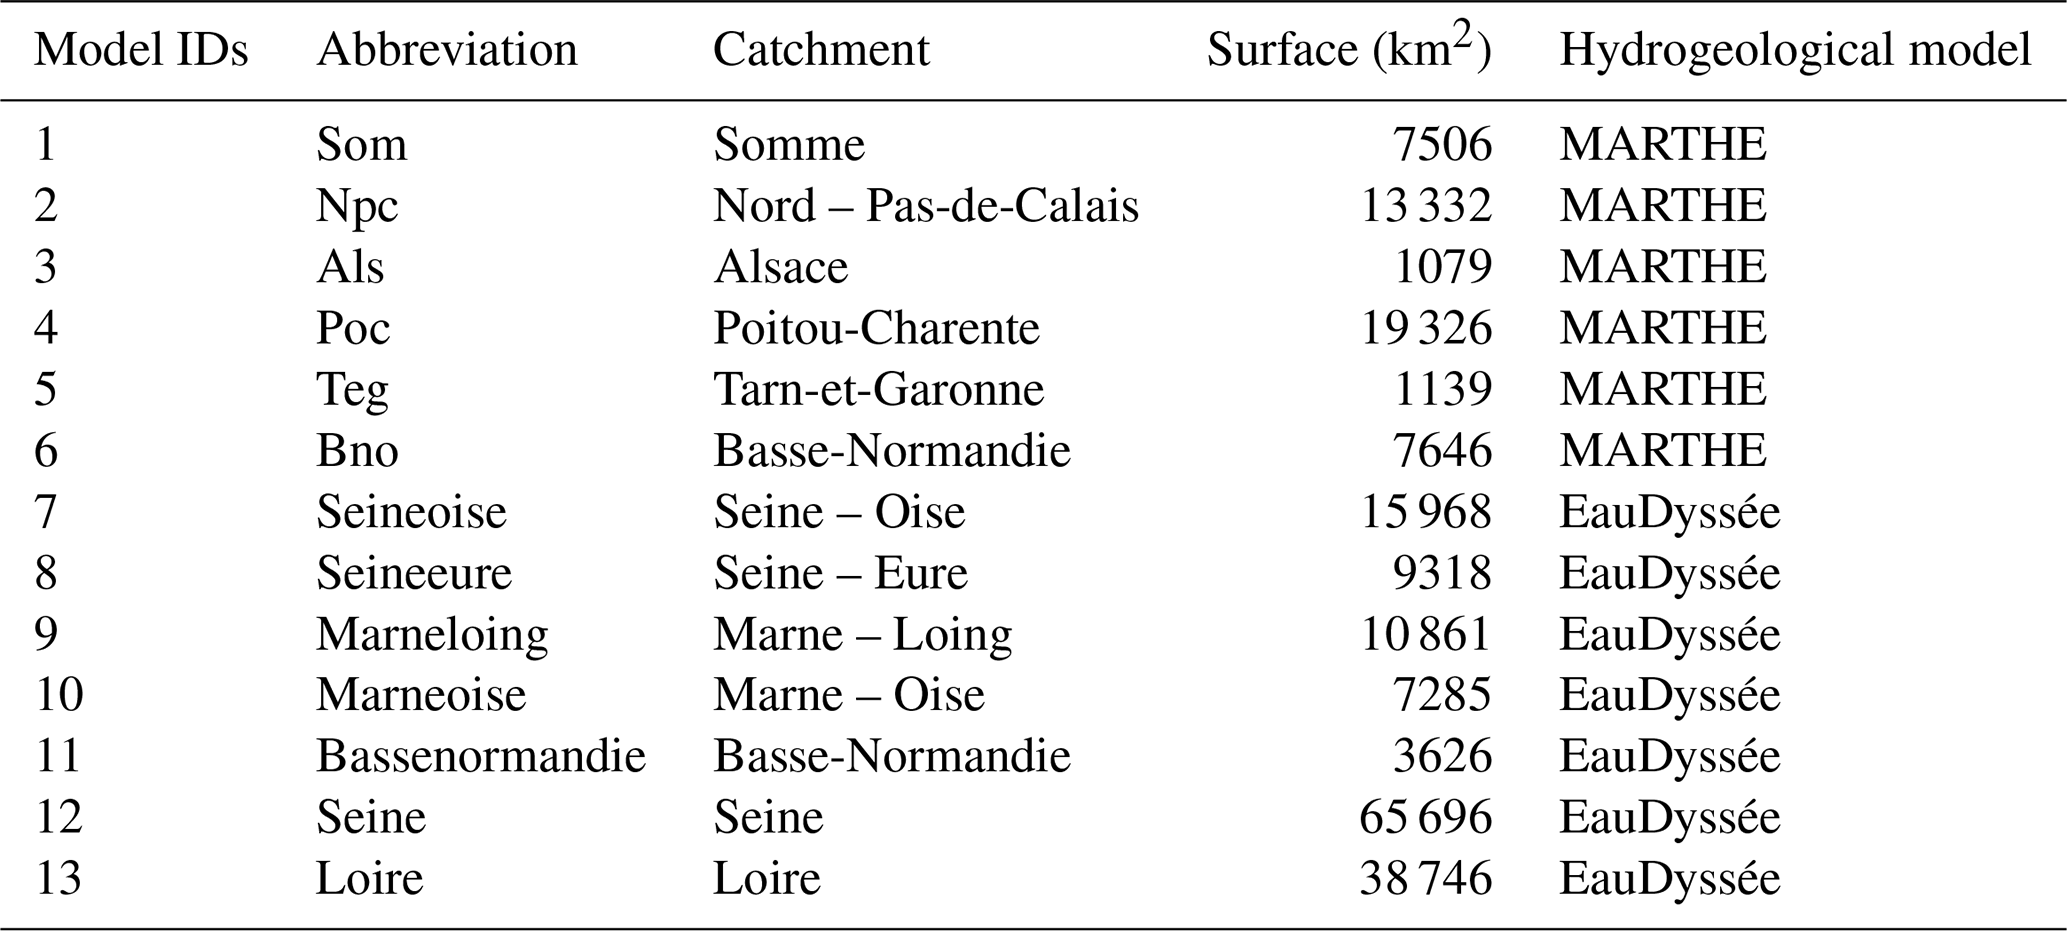
In this paper, the AquiFR domain is defined as the spatial extent of the 13 models simulated within the AquiFR platform (see Fig. 1 and Table A2 in Appendix A). These models are mostly located in the large sedimentary basin in the North part of France, spanning the Poitou-Charentes region, the Loire and the Parisian basin, up to the Nord Pas-de-Calais region. Two other models are located further out: MARTHE Alsace covering an area of around 1100 km2 in East of France, and MARTHE Tarn-et-Garonne, of a similar size, which is the only model located in the southern part of mainland France. For the remaining models, the surface areas of the aquifer systems within the models vary between around 7000 and 66 000 km2.
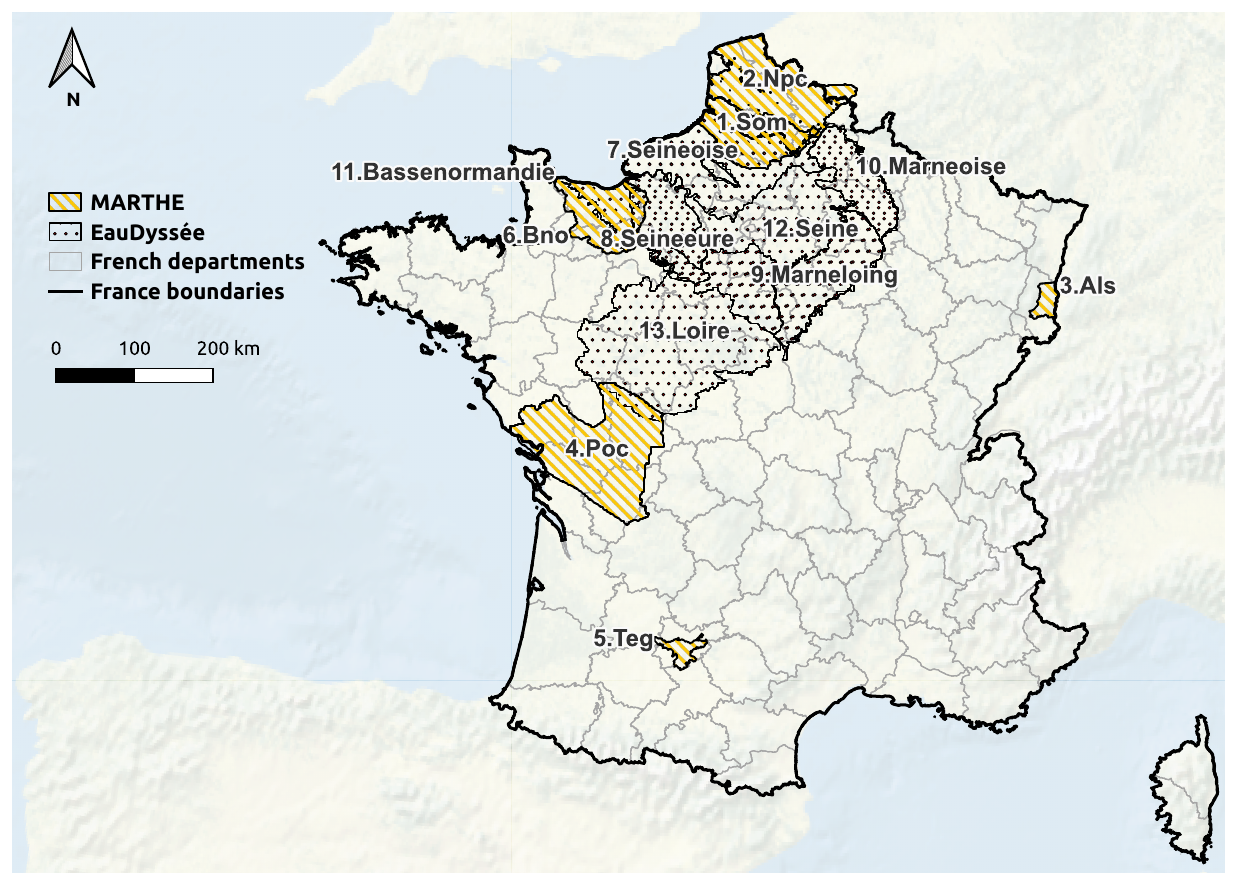
Figure 1Spatial distribution of the AquiFR models. The numbers refer to the IDs of each model regrouped in Appendix A (see Table A2).
On the Somme and the Basse-Normandie basins, both EauDyssée and MARTHE are used. In these cases, the simulations are carried out separately using the two different hydrogeological software packages, and the resulting models may overlap spatially (to account for the potential evolution of the groundwater edge). Therefore, priority is given to the most accurate models on top of the maps when plotting, and when performing the corresponding analyses. This order corresponds to the ID numbering presented in Table A2, from the uppermost surface layer to the deepest layer, and is applied to all spatial projection results in this article.
2.3 Method used to analyse the climate change projections
2.3.1 Standardized Piezometric Level Index
The following analyses use the Standardized Piezometric Level Index (SPLI; Seguin, 2015) to examine the evolution of the groundwater level over the AquiFR domain. The SPLI is a normalised indicator of monthly water table level very useful to evidence the evolution compared to the distribution on a reference period, regardless of the study area's intrinsic hydrogeological heterogeneity. The advantage of the SPLI is that it provides an easy-to-interpret indication of whether the groundwater level is above or below the median state for the given month. The greatest advantage lies in mapping, as maps of the groundwater level are linked to the topography, whereas SPLI maps allows to interpret the state of the aquifers compared to the past reference evolution (Seguin, 2015; Vergnes et al., 2023). Therefore, the SPLI is widely used by the French Geological Survey (BRGM) over France, as well as for seasonal forecasts with AquiFR for the French aquifer systems represented by the platform.
The SPLI is based on the same approach as the well-known Standard Precipitation Index (SPI; McKee et al., 1993). First, 12 series of monthly groundwater levels are extracted from the reference historical time series, one for each month from January to December, from a historical time series of N years (N=30). Second, monthly cumulative distribution functions (CDFs) are extracted from the monthly groundwater levels, which are then used to fit empirical distribution functions based on standard normal distributions using a non-parametric Kernel Density Estimation (KDE, Fig. 2b) using the scikit-learn Python package (Pedregosa et al., 2011). The KDE is estimated using the Epanechnikov kernel (i.e., with a parabolic form) and the bandwidth-selection procedure controlling the smoothing follows the Silverman's rule of Thumb, to get an optimized estimator of bandwidth. Third, the adjusted CDF from the KDE is projected over a standardized normal distribution using a quantile-quantile projection (Fig. 2c), deducing the SPLI value. Eventually, each groundwater level value from an evaluated period (example with the piezometer 01266X1013_S1 located in the Seine-Oise basin on Fig. 2a) is converted into a SPLI value (Fig. 2d), which corresponds to the return period of the equivalent event in the historical reference period.
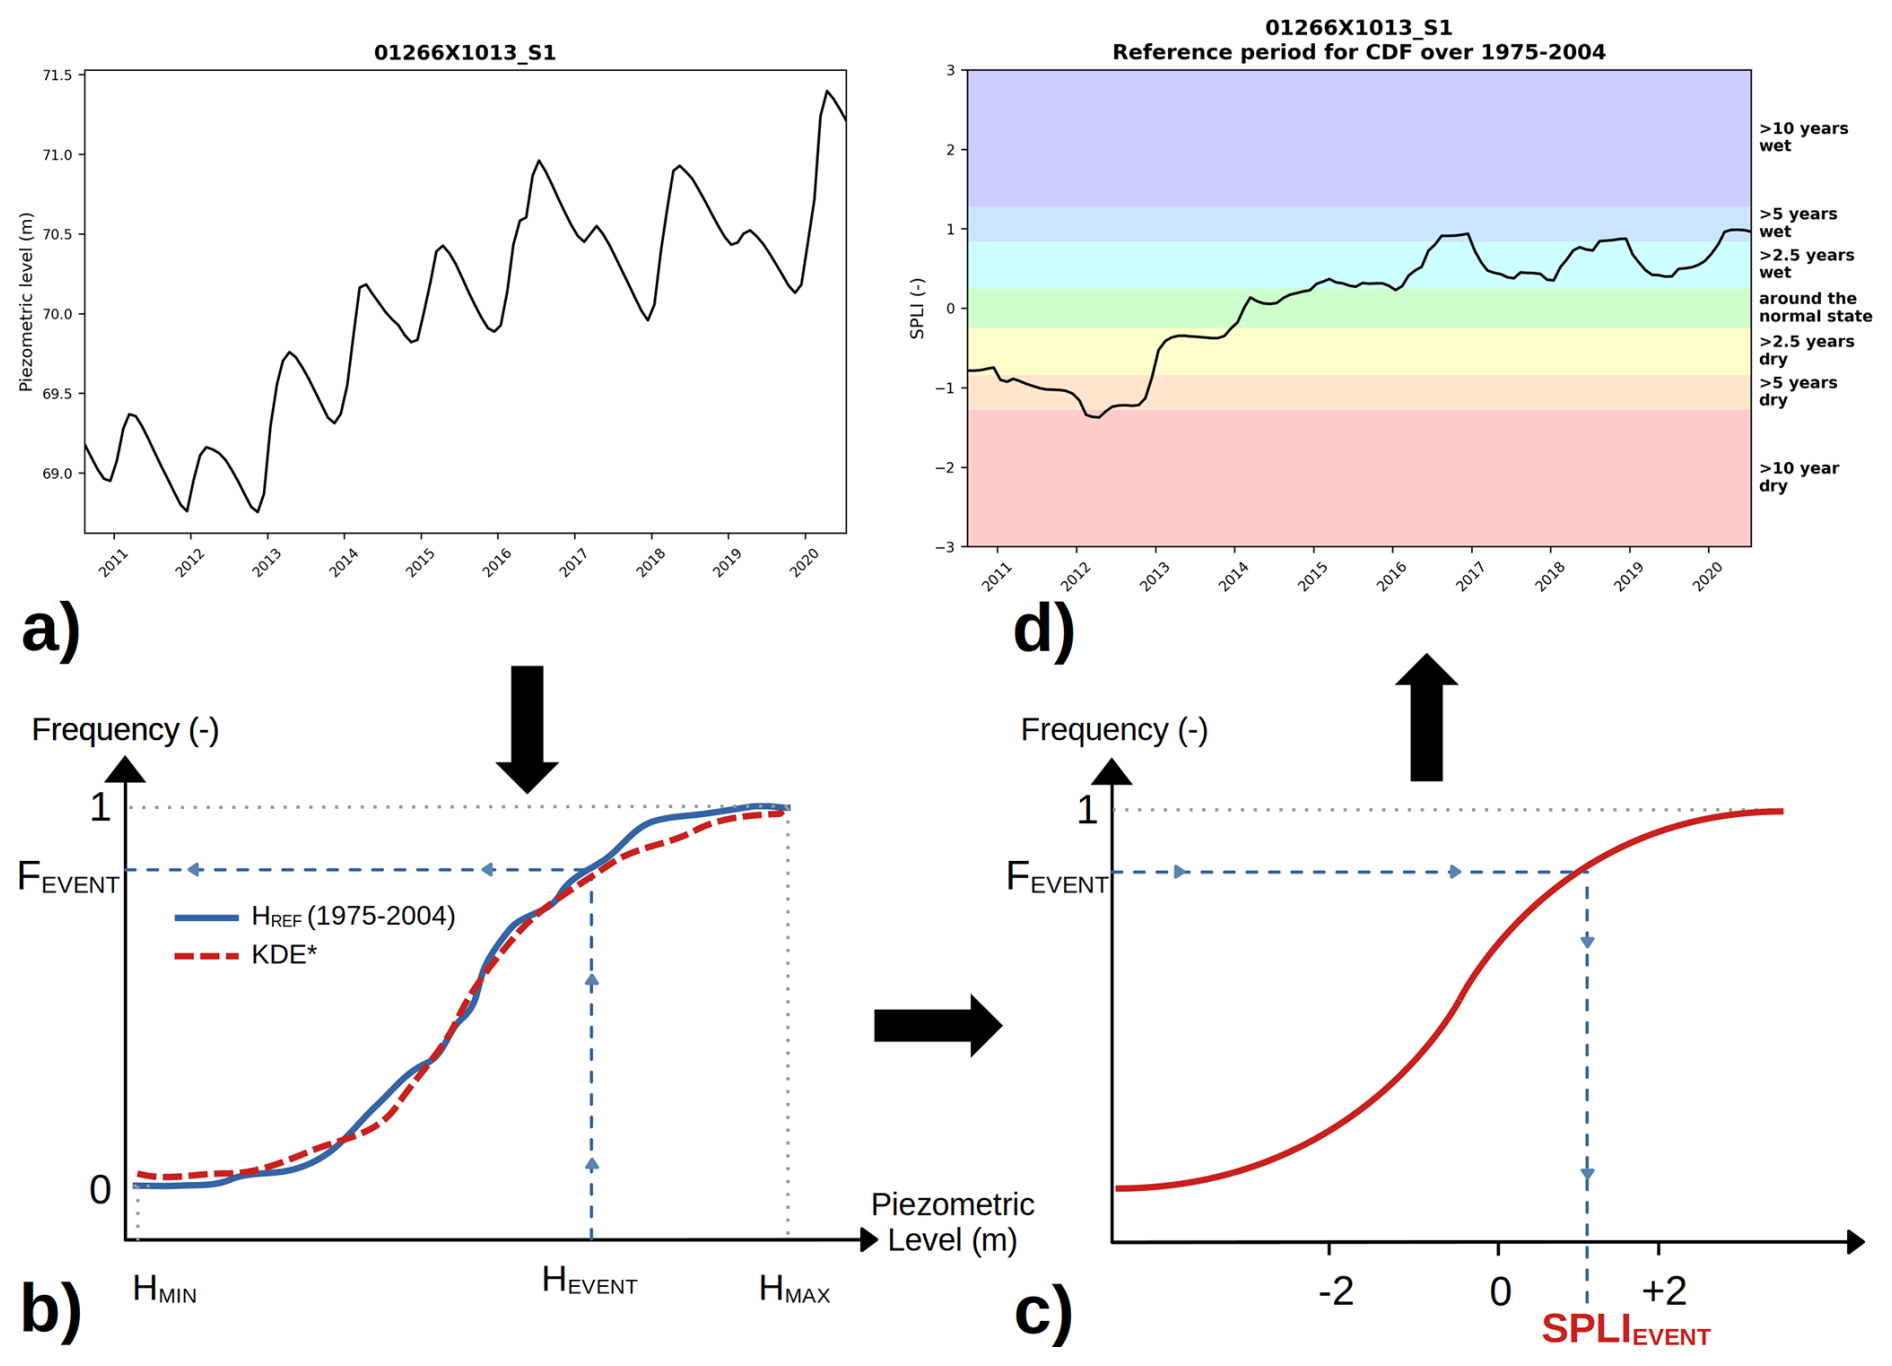
Figure 2General approach for constructing the SPLI. “KDE” refers to the Kernel Density Estimation used to estimate the best probability density function fitting the reference CDF from reference water table level mean (HREF). The piezometer 01266X1013_S1, located in the Seine-Oise basin, is used as an example to illustrate the conversion of a time series groundwater water level into a SPLI time series, according to the CDF extracted from the reference period.
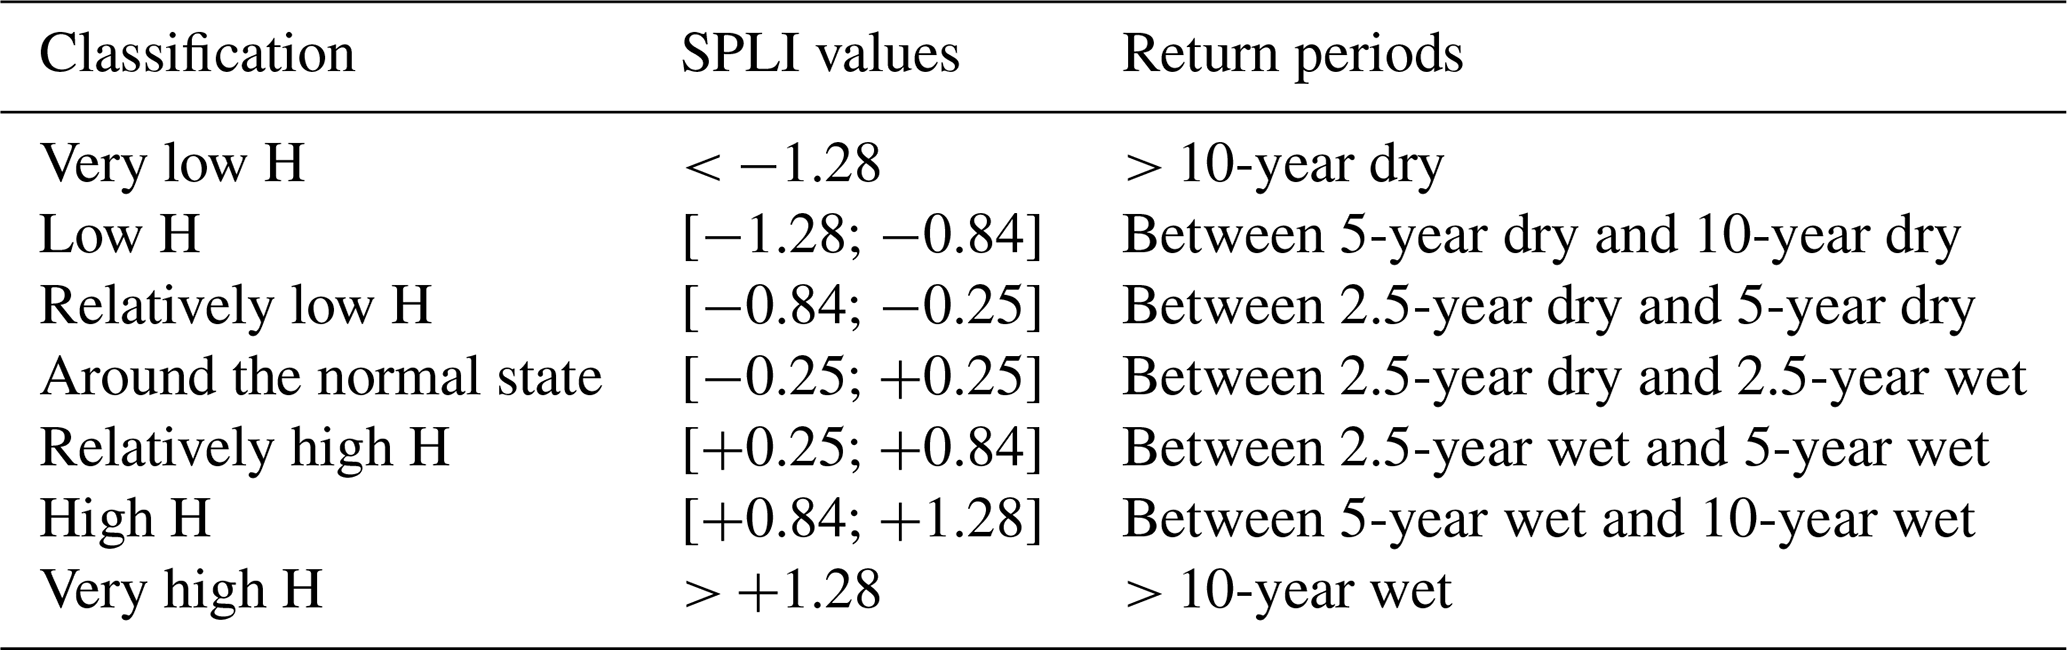
The SPLI values are centred on 0, which corresponds to a simulated groundwater level close to the median of the groundwater levels in the reference series. Negative values indicate a lower level, i.e., for events lower (and thus drier) than the median, up to −3 (corresponding to a very low water level), while positive values indicate a higher level, i.e., for a wetter event, up to +3. The range of SPLI values associated with return periods (T) is divided into seven mutually exclusive categories (Table 2).
Table 2Classification of groundwater heads (H) assessed following the SPLI values and the associated return period corresponding to the historical reference. Adapted from Vergnes et al. (2023).
2.3.2 Groundwater evolution under climate change
In this paper, the evolution of groundwater is first analysed in term of the spatial distribution of the median of the SPLI values across the 3 horizons of Table 1 and under the 3 RCPs. The medians of the SPLI values from each pixel of a model are extracted for each future horizon and each RCP, illustrating the temporal evolution of the medians of the SPLI in each RCP/horizon couple. This evaluation is performed for each GCM/RCM couple in order to illustrate the uncertainty related to CPs.
A second analysis is carried out on the occurrence of each category of events, by examining the temporal evolution of the proportion of the AquiFR domain that is affected by the corresponding dry or wet events (see Table 2). In practice, the SPLI values from all models are regrouped and the proportion of surface affected by a specific return period is defined as the sum of each pixel's surface dedicated to this return period, and divided by the total surface area of the AquiFR domain. This procedure is performed on the results from all the projections. For graphical analyses, a 5-year temporal rolling median SPLI is calculated for each RCP with an envelope representing the difference between the minimum and maximum values, to enable comparison of future trends between each RCP. As the year 2005 marks the transition between the historical and the future periods in the simulations provided by the CPs, the period from 2003 to 2007 is excluded from this analysis.
The significance of the trends observed between the reference period and the horizons of the 3 RCPs is assessed using two statistical tests:
-
The Kolmogorov–Smirnov test (Birnbaum and Tingey, 1951) is used to evaluate the significance of the difference between historical and future trends of SPLI values from 2021 to 2099. The test is performed using the Scipy Python package, and the null hypothesis is that distributions are identical;
-
The Mann-Kendall test (Mann, 1945; Kendall, 1948) on the future SPLI values is used to assess whether the associated trend of future SPLI values significantly evolves over time. The test is performed using the pyMannKendall Python package, the null hypothesis is that there is no monotonic trend in the future SPLI values.
For each storyline, the tests are performed on the 5-year temporal rolling median from the corresponding GCM/RCM couple. When considering all the CPs, in order to provide more integrated analysis for each RCP, the tests are performed on the median from the 5-year temporal rolling medians over the available GCM/RCM couples. For each statistical test, the significance threshold is set at a p-value ≤ 0.05.
A third set of analysis focuses on hydrogeological extreme events, which are defined here as decadal events, i.e., with a probability to occur each year of 0.1 in present day ( at least 10-year events in Table 2), for both wet and dry events. The spatial distribution of the median proportion of time corresponding to these extreme wet events is analysed, per future horizon and per RCP.
The following analyses mostly focus on the results extracted from the RCP8.5. The results corresponding to the RCP2.6 and RCP4.5 will be provided in Appendix C. Furthermore, all the analyses performed on the total set of available CPs (Table A1) are also performed individually on the four storylines selected in the EXPLORE2 project (see Sect. 2.1) in order to compare the statistical trends extracted from all the combined CPs, and the trends obtained when using few plausible futures that conserve all their physical consistency (Marson et al., 2026). This second approach is therefore more deterministic regarding the scenario represented by the storyline.
3.1 Spatial evolution of the french groundwater level over the 21st century
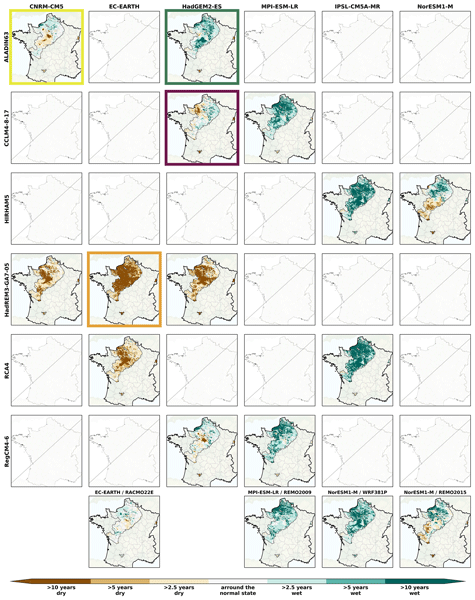
The SPLI maps for each RCP8.5 projection of the median value over the long-term horizon (Fig. 3) show heterogeneity between the different projections, from dry to wet values. Some GCM/RCM couples, such as the orange storyline (EC-EARTH/HadREM3-GA7-05 couple), lead to a increase in the area corresponding to dry events, specifically 10-year events which span almost the entire AquiFR domain on the long-term horizon. On the contrary, other couples like the green storyline (HadGEM2-ES/ALADIN63) and the IPSL-CM5A-MR/RCA4 couple lead to predominantly stable or increasing groundwater levels for the three horizons, with a large area characterised by median groundwater level above the 10-year wet level throughout the entire period.
Overall, most of GCM/RCM couples lead to an increase in groundwater level across the domain (11 out of 17, ≈ 65 %), while 4 induce a decrease (≈ 23 %) and 2 induce relatively stable values (≈ 12 %).
Focusing on the purple storyline, the results indicate stable groundwater levels in the northern part of the domain for the short-term horizon while in the Beauce and in the Loire basin, groundwater levels increase (median above 2.5-year wet). This pattern changes over time, with conditions close to normal for the intermediate and long-term horizon over the major part of the domain, except in the Basse-Normandie region with decreasing trend. The yellow storyline shows the least changes. Groundwater levels in southern Beauce, the Loiret department and the northern part of the Loire basin decrease slightly (median SPLI below the 2.5-year dry, and around normal elsewhere). Similar results are observed for the long-term horizon, except in the northern France (Nord-Pas-de-Calais and Basse-Normandie), where groundwater levels slightly increase (median SPLI between 2.5- and 5-year wet). Let us note that the MARTHE Tarn-et-Garonne and MARTHE Alsace models show an opposite trend with decreasing groundwater levels for all the storylines, corresponding to extreme dry events, from the short-term horizon for Alsace and from the long-term horizon for Tarn-et-Garonne.
The same analyses for the short-term (Fig. B7) and the intermediate horizons (Fig. B8) under the RCP8.5 are available in Appendix B. Despite the divergent results, two main patterns are distinguishable:
-
From the northern part of the AquiFR domain to the southern part of the Loire basin, the median of the groundwater levels increases up to what is today considered as 5-year wet events on the short-term and intermediate horizons, and to extreme wet events on the long-term horizon;
-
On the contrary, the median of the groundwater levels remains stable in the southern AquiFR domain (e.g., Tarn-et-Garonne) for the short-term horizon and decrease then to reach a 5-year dry events in the long term horizon.
These findings suggest a North-South divide in the future evolution of groundwater level over the AquiFR domain under the RCP8.5, as highlighted by 3 out of the 4 storylines (green, purple and yellow).
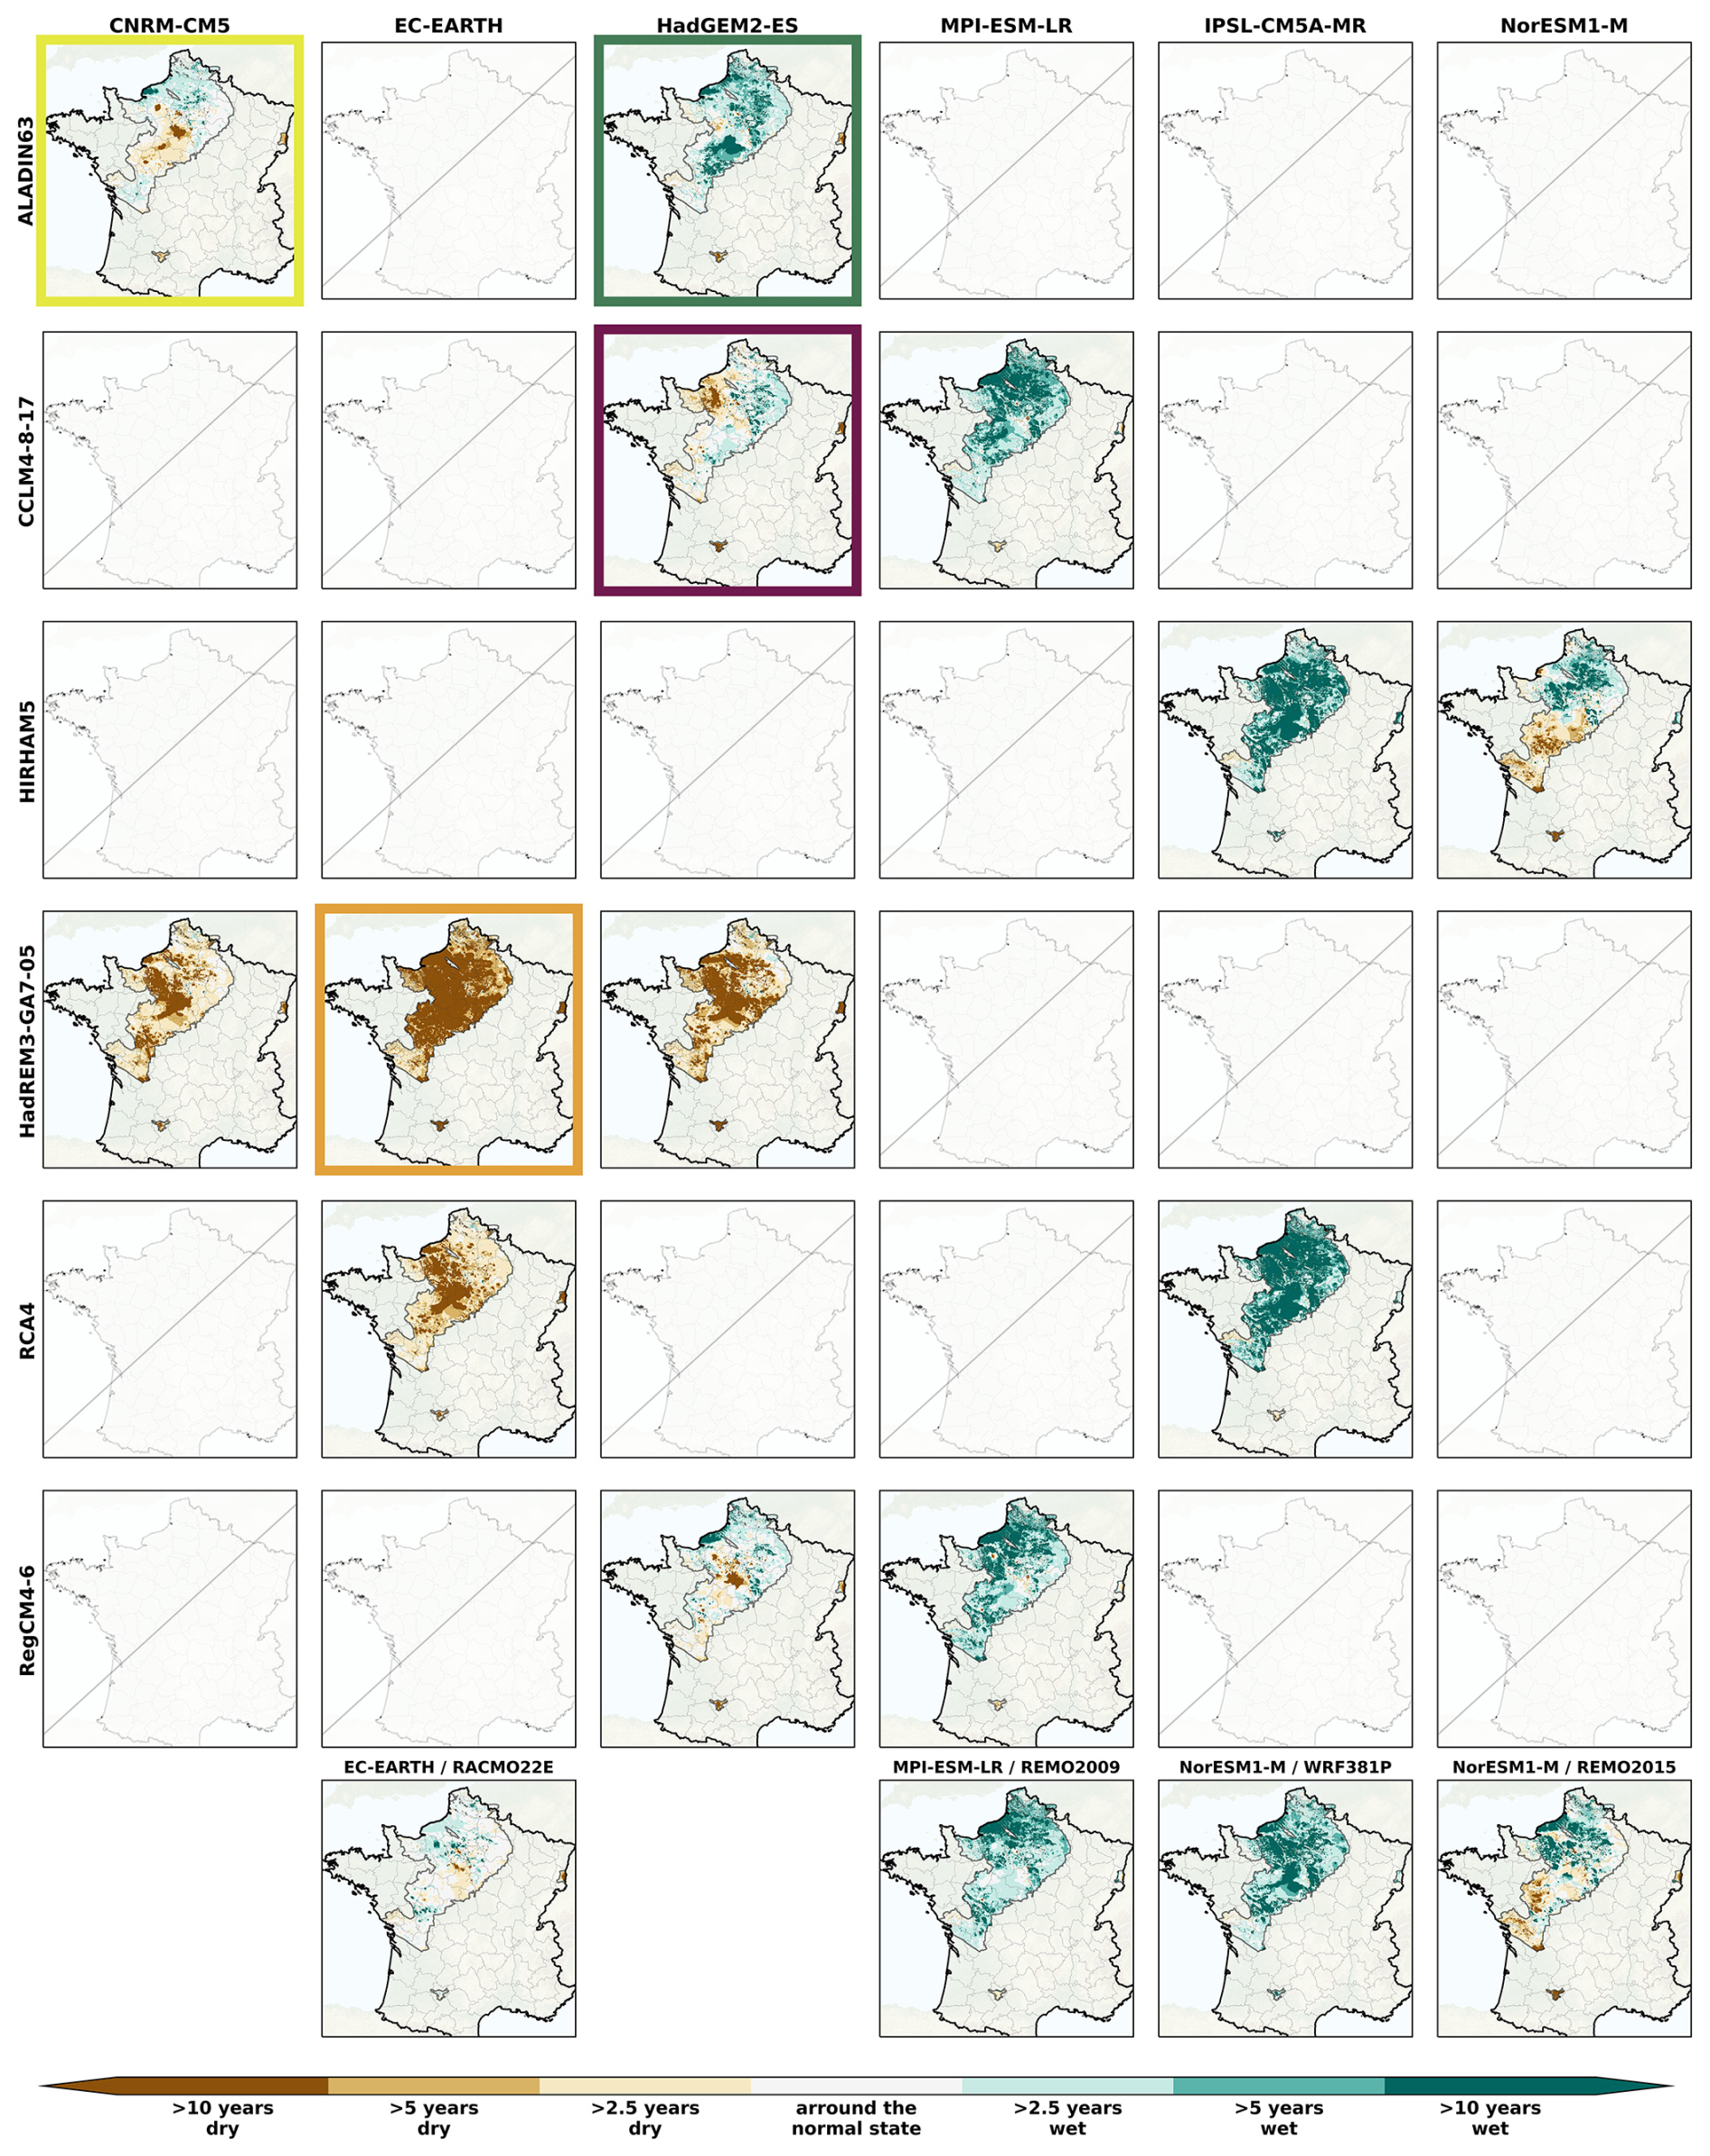
Figure 3Spatial distribution of the SPLI median over the AquiFR domain under the RCP8.5 on the long-term horizon (2071–2099), following the different GCM (in column)/RCM (in line) combination. The last line corresponds to couples where RCMs are used only once. The coloured rectangles indicates the GCM/RCM couples corresponding to the storylines (see Sect. 2.1). The missing panels indicate the GCM/RCM couples not included in the EXPLORE2 climate projection dataset.
Under the RCP2.6 (Figs.B1, B2 and B3 in Appendix B respectively for the three horizons), projections show the largest heterogeneities. On the long-term horizon, 4 out of 10 GCM/RCM couples (40 %) project an increase of the groundwater level to a relatively high value, 3 couples (30 %) project almost no change and 3 couples (30 %) project a decrease of the groundwater level, especially the ones related to the EC-EARTH GCM. These results are consistent across the three horizons. Similarly, projections with RCP4.5 for the short-term and intermediate horizons (see Figs.B4 and B5) are divergent, preventing any statement as to the future trend in groundwater levels for this scenario. On the long-term horizon (see Fig. B5), the results are more homogeneous with 6 out of 9 GCM/RCM couples inducing increasing groundwater level corresponding to high values over more than half of the AquiFR domain, while 3 couples induce either no change or slight decrease of the groundwater level.
Due to these large heterogeneities in the results from all the CPs, we focus the further analyses on the storylines, while the results corresponding to all the CPs are available in Appendices B and C.
3.2 Evolution of the occurrence of wet and dry events
Figure 4 illustrates the temporal evolution of the percentage of the surface within the AquiFR surface area that falls into one of the six SPLI categories (in line), as defined in Table 2, for the four storylines under the RCP8.5. The left column corresponds to wet events and the right column to dry events. Overall, the results depend largely on the hypotheses on which the storylines are based. The results show strong temporal variabilities, mostly on the 10-year events, probably related to climate natural variability. The orange storyline tends to significantly decrease the surface affected by wet events and increase the ones affected by 10-year and 5-year dry events. The surface corresponding to 10-year dry events almost reaches 60 % of the AquiFR domain by the end of the 21st century. The green storyline induces an increase the surface related to wet events, i.e., 10-year wet events covering almost 20 % of the AquiFR domain (from 3.7 % on the historical period), and a decrease of the surface dedicated to dry events, except for the 10-year dry event where the surface increases to 10.2 %. The changes induced by the purple and the yellow storylines are smaller, except for both wet and dry extreme events where the contrasts are particularly pronounced. These two storylines tends to increase the extreme events (mainly the purple storyline) and reduce the surface allocated to 2.5-year events. These results are confirmed by the statistical tests with p-values below 0.05 for almost all the 6 categories of events (see Table C1 and Table C2), meaning that the future is significantly different from the reference period (Kolmogorov-Smirnov test) and changes significantly over the 21st century (Mann-Kendall test), for the four storylines.
The results for all the CPs are available in Appendix C (see Fig. C1 and Table C3). The results show that the envelopes between the minimum and maximum values are wide, mainly for the extreme events, which highlights the heterogeneity between the projections. The surfaces related to 10-year events increase for both wet and dry events, spreading with time and increasing greenhouse gas emission, particularly for wet events. The surface related to extreme dry events is also projected to increase, albeit with a much less pronounced trend, reaching at most 10.0 % under the RCP8.5. The changes of surface proportions corresponding to the 5-year dry or wet events are low, slightly increasing for the wet events, and decreasing for the dry events. Eventually, both dry and wet 2.5-year events are expected to decrease over the 21st century, indicating an intensification of extreme events, which aligns with the findings from the storylines.
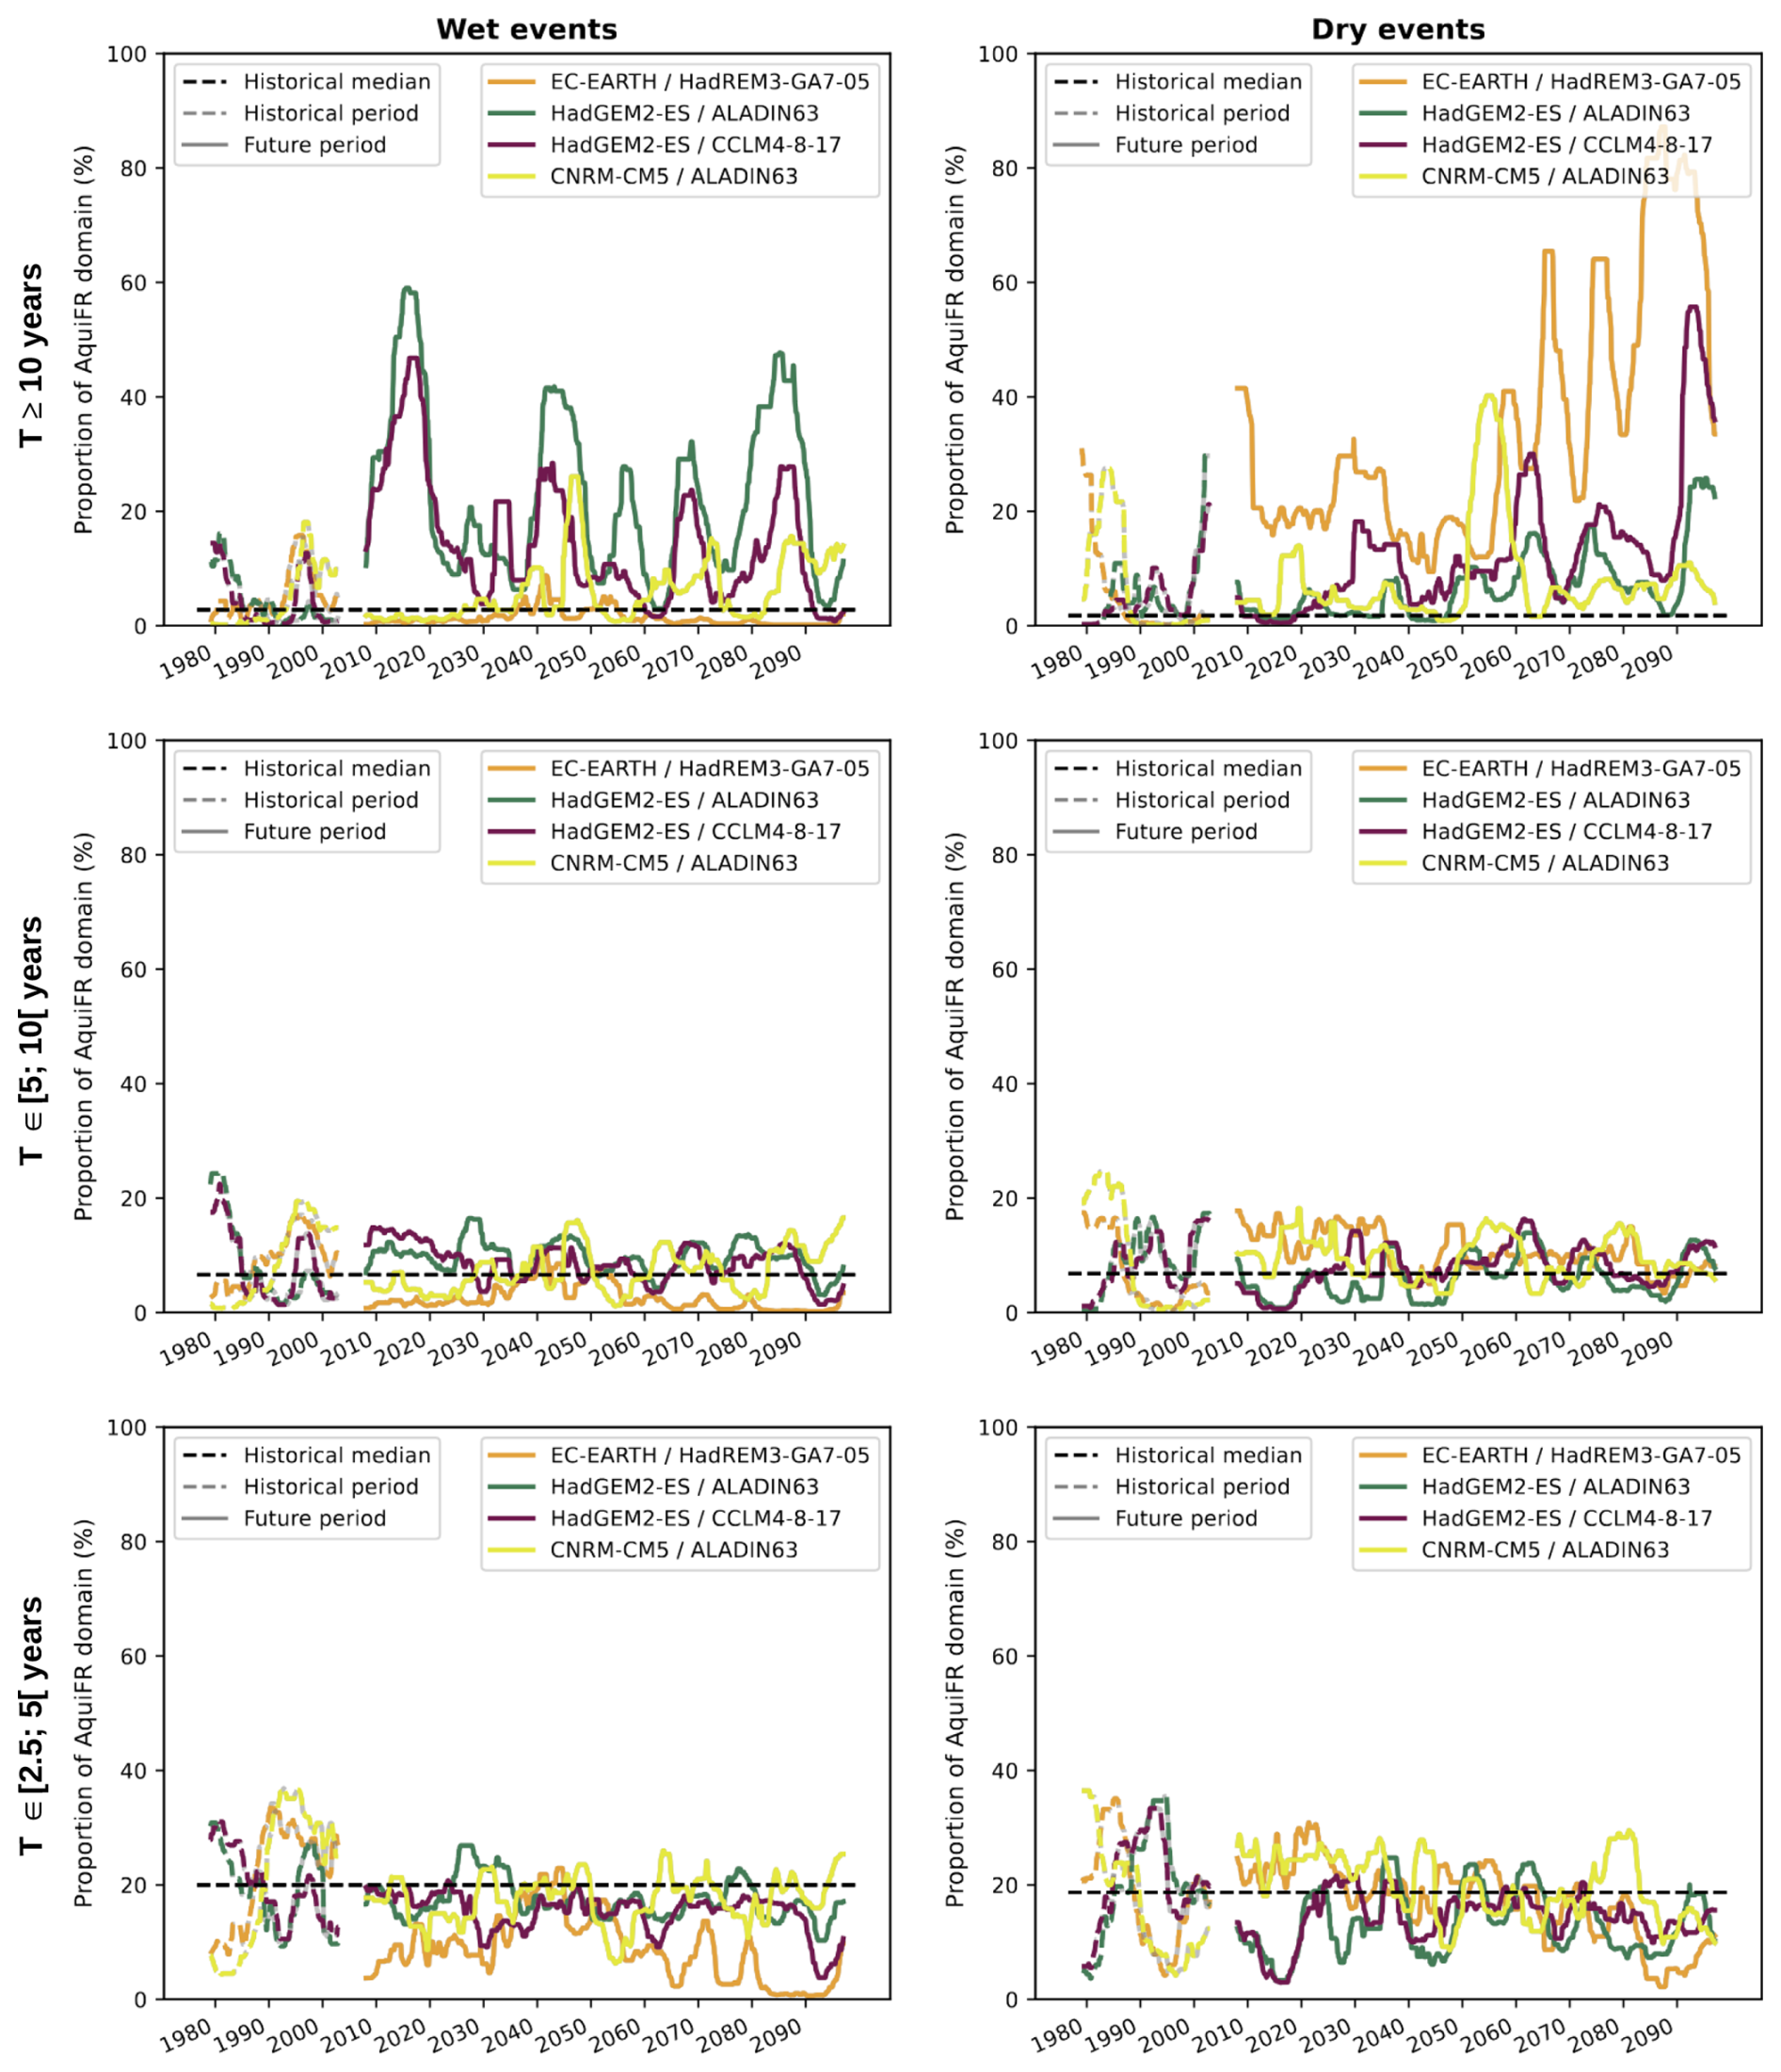
Figure 4Temporal evolution of the running median of proportion from the AquiFR domain affected by the categories of events from Table 2 for the four storylines. The lines represent the return periods of the events, for the wet events (left) and dry events (right). The gap centered on 2005 corresponds to the exclusion of the 2003–2007 period in the calculation of running medians (see Sect. 2.3). The black line represents the historical median of each category from all the available CPs.
3.3 Evolution of the time spent in extreme events
Figure 5 illustrates the maps of the median of the time proportion corresponding to extreme events (i.e., at least 10-year events), for wet (1st line) and dry (2nd line) events for the four storylines on the long-term horizon. The results for the short-term and intermediate horizons are available in Appendix C (see Fig. C2). In consistency with the previous analyses, the results vary depending on the storyline. The orange storyline tends to reduce the time proportion corresponding to extreme wet events to less than 5 % over almost the entire AquiFR domain, while increasing the time proportion of extreme dry events to more than 75 % over the whole domain. The green storyline strongly increases the time proportion of extreme wet events while reducing the one corresponding to extreme dry events. The purple storyline induces an increase in both wet and extreme dry events, higher as time goes to 2100, and representing more than 50 % of the time over half of the AquiFR domain by the end of the 21st century. The results for the yellow storyline are more spatially and temporally contrasted and do not highlight a noticeable future tendency over the 21st century.
The results for all the CPs (see Fig. C3) show that, in the short-term horizon, the time proportion of extreme wet events corresponds to almost half of the time over half of the AquiFR domain for the three RCPs. This proportion remains close to the historical conditions over the remaining part of the domain. Then, this time proportion increases as time goes to 2100, primarly in the northern part of the AquiFR domain. Results for the time proportion corresponding to extreme dry events are more contrasted. On the long-term horizon, the results suggest a decrease of the median of the time proportion in extreme dry event with values on more than half of the AquiFR domain under the RCP2.6 and RCP4.5. Under the RCP8.5, the results show a decrease of the time proportion in the northern part of the AquiFR domain, and higher values on the southern part of the domain, suggesting a North-South contrast in the evolution of the time proportion corresponding to extreme dry events.
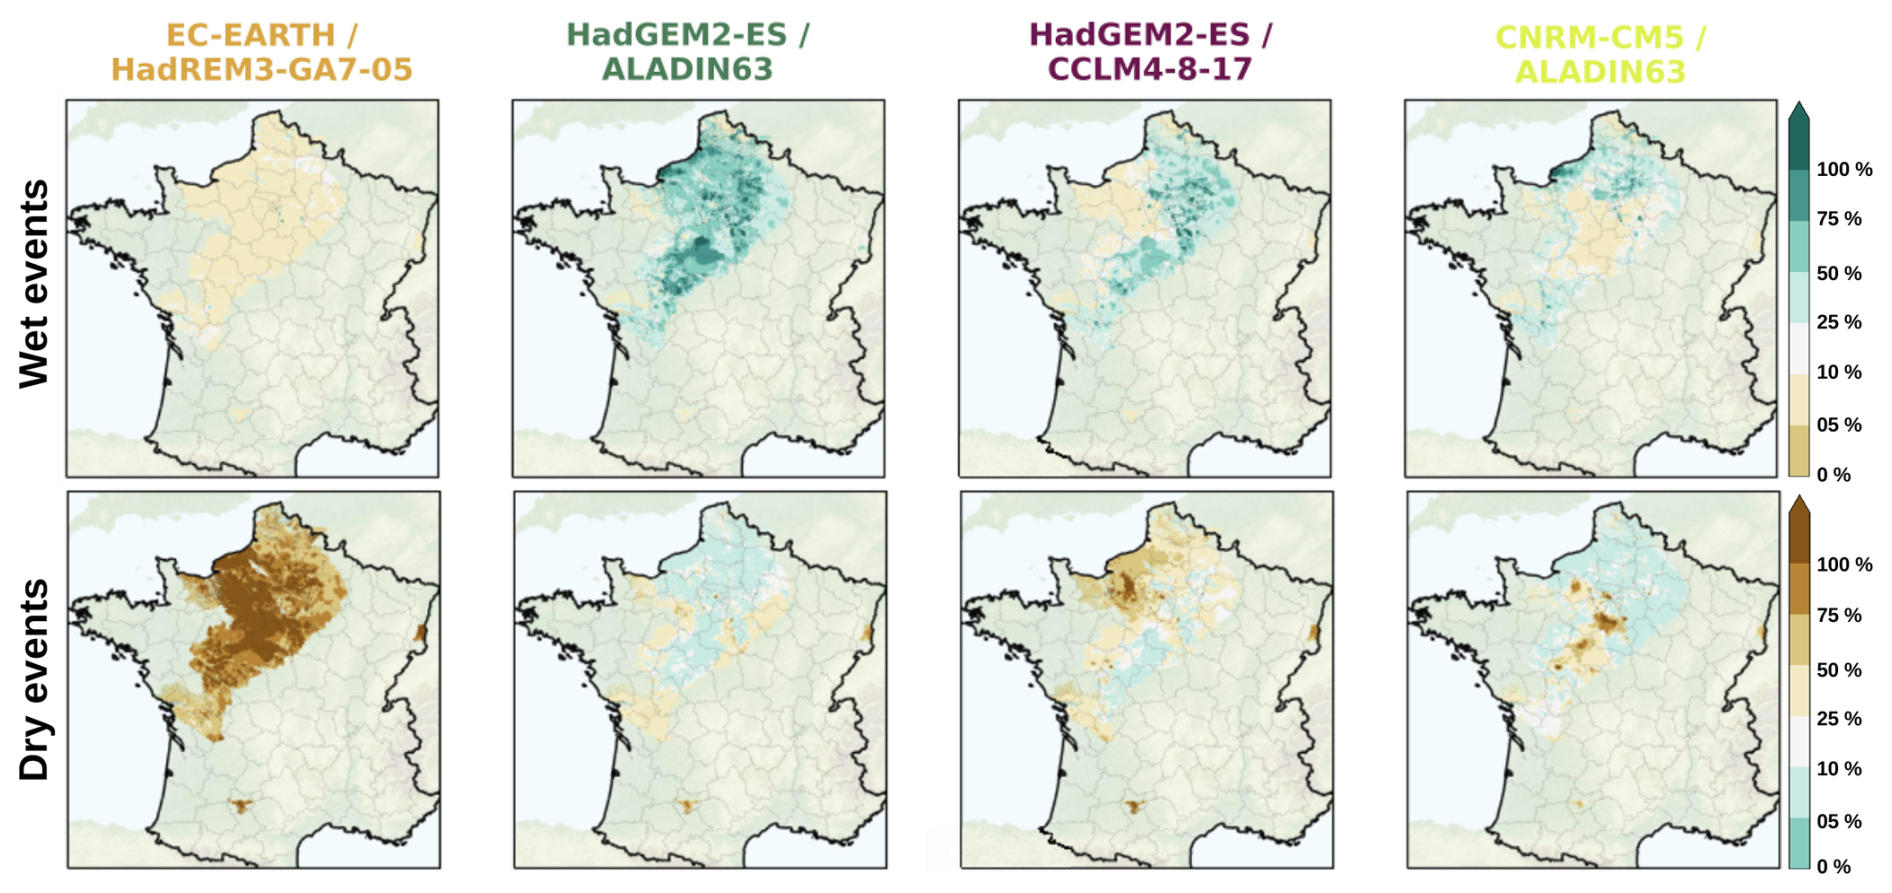
Figure 5Spatial distribution of median of time proportion corresponding to extreme events (i.e., at least 10-year return period), respectively for wet (SPLI > +1.28, 1st line) and dry events (SPLI < −1.28, 2nd line), for the long-term horizon for the four storylines (in column) under the RCP8.5.
4.1 Divergent projections limiting the extraction of clear future tendency
In this study, the evolution of the groundwater is simulated by the AquiFR modelling platform using 36 climatic projections spread over 3 socio-economic scenarios RCPs. As highlighted in the introduction section, the use of such an extensive range of CPs enables a robust assessment of uncertainties associated with internal climate variability. When combined with the exploration of four distinct storylines to illustrate contrasting future scenarios, this methodological approach remains rare in the existing literature, particularly in studies examining groundwater dynamics under climate change. Furthermore, the AquiFR platform provides a noticeable advantage by accounting for the heterogeneity of aquifers across the French aquifers covering by the platform. This capability is further enhanced by the integration of the SPLI, which facilitates spatially explicit analyses of future groundwater level trends. Collectively, these elements – the CP ensemble, the storyline-based approach, and the high-resolution aquifer modelling – represent the primary scientific advancements of this paper, with direct implications for groundwater management and climate adaptation strategies.
The results demonstrate that the spatial distribution of the SPLI median varies between the projections, resulting in an uncertainty that restrains the identification of a clear trend regarding the future evolution of groundwater. This uncertainty is to be expected as the study area falls within the transition zone of the Atlantic region marked by a large internal variability (Evin et al., 2025), where expected trends shift from a wetter climate in the North to a drier climate in the South (Goubanova and Li, 2007; Meaurio et al., 2017). Therefore, there is a lack of consensus among the CPs regarding the location of the transition zone, thereby inducing divergence in the future evolution of groundwater levels.
4.1.1 Uncertainty arising from the AquiFR forcings
This inherent uncertainty that is frequently observed in hydroclimatic modelling chains based on a multi-model approach is a recurring point in the literature (Knutti et al., 2013) and requires a proper evaluation (Northrop and Chandler, 2014; Evin et al., 2019). To be accurate, a rigorous uncertainty analysis must consider the contribution of each element in the modelling chain to the total uncertainty: (1) climate scenarios such as RCPs or, more recently, SSPs (Shared Socioeconomic Pathways) in the CMIP6 global exercise (IPCC, 2022); (2) global (GCMs) and regional (RCMs) climate models; (3) debiasing and downscaling methods such as ADAMONT (Verfaillie et al., 2017; Evin et al., 2019) or CDF-t (Michelangeli et al., 2009); (4) hydrological component (models and associated parameters); (5) irreducible fraction of uncertainty due to internal climate variability (Hawkins and Sutton, 2009).
In the context of the EXPLORE2 project, an uncertainty propagation analysis has been carried out by Evin et al. (2024) on surface hydrology over hexagonal France, by estimating the variance inherent in each link in the modelling chain. Their results indicated that the main contributor to the total uncertainty is internal climate variability (> 40 %). Subsequently, the following sources contributing the most are the GCMs and the RCMs (> 40 % of combined contribution), in similar proportion, especially in North and East of France corresponding to the large majority of the AquiFR domain. These elements are in accordance with the literature, which states that the cumulative GCM/RCM contribution often reaches 40 % to 80 % of the total uncertainty (Vetter et al., 2015; Tramblay and Somot, 2018; Lemaitre-Basset et al., 2021; Jeantet et al., 2023). Moreover, they are consistent with the analyses showed in this paper suggesting that the results strongly depends on the GCM/RCM couples. In South of France, including the MARTHE Tarn-et-Garonne model, Evin et al. (2024) demonstrated that the RCPs constitute the third source contributing the most to the total uncertainty, which can be attributed to a weaker influence of precipitation in these regions than on the rest of the country, and as a consequence a heightened influence of temperature evolution, over the 21st century.
At mid-latitudes including France, the uncertainty related to internal variability and the GCMs/RCMs may originate from the chaotic nature of precipitation (Bouttier and Marchal, 2024), rainfall being caused by multiple factors, that affects the accuracy of hydrometeorological forecasts and long-term projections (Nuissier et al., 2011), and induces divergence among the CPs. The future evolution of rainfall over France is consistent with this statement (see Appendix D on the long-term horizon for the three RCPs). The divergence is most pronounced for the RCP8.5 (see Fig. D3) for which the quantiles Q10 and Q90 between the CPs exhibit opposite trends, while the Q50 quantile delineates a North-South divide, characterised by an increase in rainfall in northern France, and a decrease in the southern regions. Conversely, the results from the RCP2.6 (see Fig. D1) and the RCP4.5 (see Fig. D2) demonstrate slightly lower divergence. This finding suggests that the larger the number of CPs per scenario, the more the contribution from internal variability and the GCMs/RCMs to the total uncertainty is highlighted. The real evapotranspiration, drainage and runoff, simulated by the SURFEX land surface model (Le Moigne et al., 2020; see Sect. 2.2.1), are also submitted to this large divergence among the CPs, especially under the RCP8.5. This divergence is even larger for the variables drainage and runoff, which are the primary drivers of aquifer recharge. This result is in accordance with the existing literature on the subject, which indicates that the two variables in question are characteristic of the near-surface soil horizon, which is strongly affected by rainfall (Van Loon, 2015). As these two variables are used to force AquiFR, it is reasonable to assume that the observed divergence in the SPLI primarily originates from the earlier stages in the modelling chain. Note that the uncertainties highlighted in the CP ensemble – and their propagation through the modelling chain – may be transferable to other mid-latitude regions where, as mentioned above, precipitation projections exhibit high variability due to the precipitation inherent chaotic nature (Nuissier et al., 2011; Fereday et al., 2018).
4.1.2 Uncertainty arising from the hydrogeological modelling
The hydrogeological part may also contribute to uncertainty, and a proper evaluation evaluation of this contribution would require a multi-model approach for the hydrogeological component of the modelling chain, which is not the case for the AquiFR platform (see Sect. 1). However, Habets et al. (2013) demonstrated that the simulated outcomes derived from two hydrogeological software packages closed to the ones used in AquiFR, i.e., based on analogous physical approaches and forced by the same surface fluxes, were similar. Thus, we can assume that models with spatial overlap in the AquiFR region may yield comparable results, and consequently that the contribution of hydrogeological components in the modelling chain to overall uncertainty is relatively minor compared to that of climate components. However, as stated above, a thorough assessment of the hydrogeological contributions to total uncertainty is necessary to substantiate this claim.
While this kind of assessment remains unfeasible, we can nevertheless evaluate the influence of climate projections on historical reference distributions of groundwater levels. Indeed, part of the uncertainty is linked to the fact the climate projection cannot be fully unbiased over the historical period, which might affect simulated groundwater levels. This is rather explicit when computing SPLI over the historical period, since the projections are not compared to present day observations or reference simulation, but to present day climate simulation, which are all different. The CDFs extracted from projected groundwater series are used to fit an empirical distribution function (based on a Kernel Density Estimation KDE), on which a standard normal distribution is projected in order to get the SPLI (see Sect. 2.3). Therefore, if climate projections introduce too much bias into groundwater levels, the CDFs and consequently the SPLI values are biased, which thereby bias the interpretation of future groundwater levels. To evaluate this effect, we compare the CDFs obtained from CPs with a reference CDF obtained using the reference atmospheric forcings over the historical period. To maintain consistency with the bias correction method of applied on the used CPs (see Sect. 2.1 and Marson et al., 2026), the SAFRAN historical reanalysis product (Vidal et al., 2010; Le Moigne et al., 2020) is used as the meteorological reference. For each model, the evaluation is carried out by first calculating a CDF of the model extracted per CP over the historical period. Second, the spatial mean of CDFs from each CP is calculated with a 95 % confidence interval. Third, from the simulations obtained by forcing AquiFR with SAFRAN on the historical period, a reference CDF is calculated. Fourth, the average CDF obtained from the CPs is compared to the reference CDF. This evaluation is performed for each of the 12 months and Fig. 6 illustrates results for January.
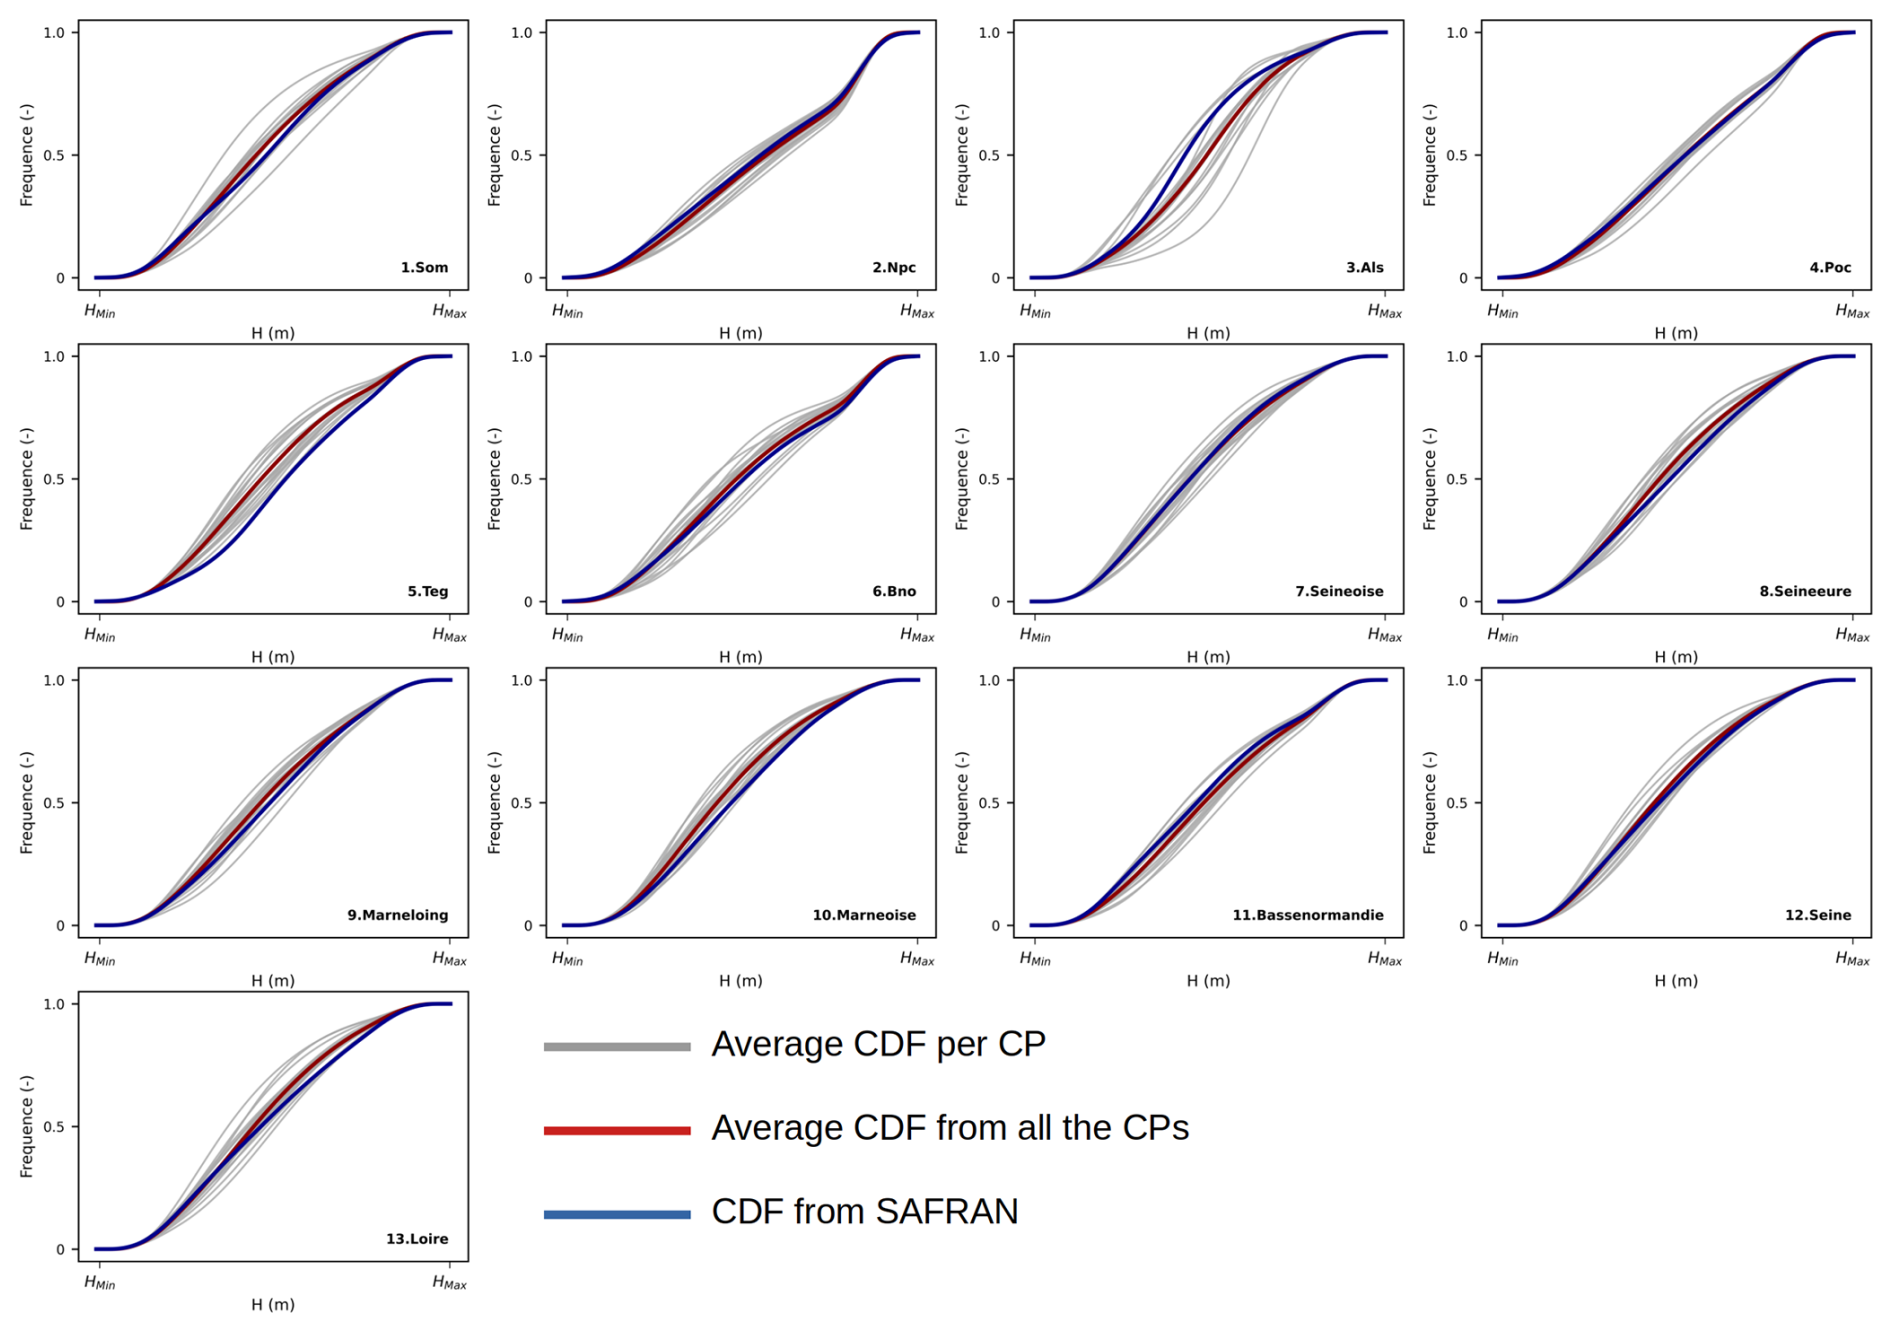
For almost all models, the CDFs from CPs are relatively close and distributed on either side of the reference CDFs, with average projected CDFs following the trends of the reference CDFs quite well. This suggests that the mean distribution of groundwater level obtained from CPs is analogous to the distribution obtained from the SAFRAN historical reanalysis over the historical period. Similar analyses were carried out on the 12 months of the hydrological year and led to analogous results. The largest differences are evident in March and April, indicating that the CPs diverge on this period, i.e., the end of the wet period and the beginning of the dry period and so the end of the recharge period of water tables. This period is also characterised by significant inter-annual variability, which is difficult to represent in climate models. Overall, these results suggest that the construction of SPLI by the AquiFR simulations is not noticeably affected by the use of CPs. Therefore, the discrepancies between the SPLI values observed on the future horizons are unlikely to be induced by the construction of the CDFs from the CPs on the historical period. Instead, it is more likely that these discrepancies are due to the divergences from the CPs on the future period, and thus from the climate components of the modelling chain (GCMs and RCMs). This statement is in agreement with the results highlighted by Evin et al. (2024) on surface hydrology, as mentioned-above.
However, for a specific model, the CDFs from CPs are never fully merged, suggesting discrepancies directly induced by the adjustment of the CDFs by CPs. Consequently, if these CDFs are too divergent, this may result in SPLI values pertaining to different categories of events from one CP to another (Table 4), particularly due to the presence of threshold effects on the studied aquifers. This may contribute to the uncertainty associated with the SPLI, and then on both sign (dry/wet) and severity of the corresponding event.
Let us note that the discrepancies of the CDFs of the CPs in present day attest that the bias correction method is not fully efficient, which is expected. Indeed, even a perfect bias correction method would lead to different results due to the inherent internal variability included in each CP. More robust studies are required, accounting for both the need for an accurate method and the complexity of hydrogeological modelling.
4.2 Groundwater evolution over the 21st century
Faced to the divergences observed between all the available CPs in the multi-model ensemble approach, the extraction of reliable future trends is quite challenging and strongly depends on the RCP considered. As regards the RCP8.5, two tendencies have been identified, primarly through to the utilisation of storylines which demonstrate analogous future evolutions despite being based on contrasted future evolutions consistent with their design assumptions (Shepherd et al., 2018; Shepherd, 2019; Baulenas et al., 2023). First, groundwater level from the northern part of the AquiFR domain (i.e., Seine, north of Loire catchment, Basse Normandie and Nord Pas de Calais) is expected to increase toward wetter events, mostly corresponding to 10-year wet groundwater level of the reference period. The green storyline induces this increase from the short-term horizon over most of the AquiFR domain, while this increase starts from the long-term horizon for the yellow (Nord Pas de Calais and Basse-Normandie) and the purple (on the Beauce and the Loire catchment) storylines. Second, a decrease in groundwater level from the southern part of the AquiFR domain (i.e., south of Loire catchment and Tarn-et-Garonne) and from the Alsace catchment is expected, at least to levels corresponding to 5-year dry events on the reference period on the South of the AquiFR domain on the long-term horizon. The orange storyline enhances this decrease to the entire AquiFR domain, reaching levels corresponding to 10-year dry events on the reference period. The yellow storyline also induces a slight decrease of groundwater level from south of Loire to the southern part of the AquiFR domain.
This North-South contrast in the evolution of groundwater levels under the RCP8.5 is highlighted by both the majority of the CPs and by 3 out of the 4 storylines, and appears to be the consequence of the North-South contrast observed in future precipitation projections derived from climate models used in the EXPLORE2 project (Marson et al., 2026). In this paper, the spatial representation of South of France into the AquiFR platform is limited, which prevents the existence of this North-South divide from being highlighted with certainty. However, these findings are consistent with Vergnes et al. (2023), who predict an increase in groundwater level in the northern part of the French metropolitan area as time goes to 2100, and a decrease in the southernmost sectors of France, using a subset of the RCP8.5 DRIAS projections. Moreover, in Sect. 4.1.1, we demonstrated that this contrast is already visible in earlier stages of the modelling chain, in particular on the drainage and runoff variables simulated by SURFEX and which constitute the main drivers of the aquifers recharges (see Appendix D). For RCP8.5 (see Fig. D3), the North-South divide is already visible for precipitation and real evapotranspiration but the contrast remains moderate. Conversely, the contrast is much clearer for the groundwater recharge term across the three quantiles, particularly for drainage, with northern France becoming wetter and southern regions drier. Note that the Q90 quantile still highlights a decrease in drainage in regions close to the Pyrenean mountains. All these elements are consistent with joint research from the EXPLORE2 project on groundwater recharge (Lanini et al., 2024) and surface hydrology (Jaouen et al., 2025; Tramblay et al., 2025; Sauquet et al., 2026).
Nevertherless, some differences with our findings and the conclusions extracted from the literature are to be noticed. Indeed, the conclusions drawn for the northern part of the AquiFR domain are not consistent with previous studies which, as mentioned in Sect. 1, suggested a global decrease of both recharge and groundwater level over France (Habets et al., 2013; Carroget et al., 2017). The divergence may come from that CPs from the CMIP5 global project are wetter than the ones from the CMIP3 global project (Meehl et al., 2007) from which these previous studies were based on, particularly over northern France (Dayon et al., 2018). Hydrological systems are therefore directly affected by this additional amount of water into the water balance between the two versions of the projections. In this way, the consistency between the present results and the ones from Vergnes et al. (2023) was to be expected as they used the hydrogeological MARTHE model, included in the AquiFR platform, and CPs provided by the DRIAS-2020 database, which are included into the CP database established by EXPLORE2. However, the main difference is that the MARTHE hydrological software package was configured on a coarser spatial grid of 2 km × 2 km, and their study is based on 5 selected regionalized CPs, while in this paper 17 different GCM/RCM combinations have been used.
Moreover, most of studies addressing surface hydrology under climate change state that the seasons will be more contrasted in the future, e.g., winter flows will be higher while summer will be lower (Sauquet et al., 2024), shift that can be attributed to a seasonal regime change of rainfall and evapotranspiration balances (Soubeyroux et al., 2021; Marson et al., 2026). However, by assessing the spatial distribution of SPLI for each one of the 12 months of the year (not shown here), we found similar results for each month, suggesting no modification in the seasonal regime of groundwater level. This phenomenon may be attributed to the slow temporal dynamics characterising the aquifers in the study area, particularly those close to the Parisian Basin which constitute a large part of the AquiFR domain. Indeed, these aquifers are subject to variations that often extent beyond the hydrological year and even span multi-decadal (Baulon et al., 2022). This renders the observation of sub-annual variations a highly arduous undertaking.
Let us note that the storylines inducing contrasted yet possible future evolutions highlight their usefulness to groundwater decision-makers, especially when they do not converge. The northern part of the AquiFR domain, i.e., from Nord Pas-de-Calais to the South of the Loire basin, is the sector where the contrast between the storylines is the most pronounced, particularly in the long-term horizon. In this context, the storylines can encourage the decisions-makers to establish their policy based on the less favourable projection, i.e., the “worst case scenario” (or precautionary principle), or using no-regrets measures based on the consequences of climate change on other surface variables such as the different seasonal flows (Sauquet et al., 2024) or the 20-year return period quantile of the annual maximum daily flow to characterise floods (Tramblay et al., 2024).
The extraction of tendencies for the RCP2.6 and the RCP4.5 was an ardous task, because the projections are too divergent to give confidences on the evolution of the groundwater, especially on the short-term and the intermediate horizons. On the long-term horizon under the RCP2.6, the results are still quite divergent, yet they do underscore an increase of groundwater with values that reach the 5-year to 10-year wet return period of the reference. Under the RCP4.5, this result is in line with the statement established by Marson et al. (2026) on the climate aspect of the EXPLORE2 project, which projects a 3.5 % increase in precipitation on the long-term horizon under this RCP in North of France, encompassing the majority of the AquiFR domain (see Appendix D2). This additional amount of precipitation increase water supply, groundwater recharge and ultimately raise groundwater levels in these areas.
As stated in the introduction section, this study does not address the impacts of anthropogenic factors on water resources, which constitutes a major limitation of this work. As mentioned in Sect. 2.2.2, groundwater abstractions currently applied to the studied aquifers, thus defined according to current water availability and water demand, are supposedly maintained in the future and do not change regardless of groundwater level evolution and groundwater availability to meet future water demand. This assumption may be rendered moot by the fact that, according to several projections, groundwater level is expected to decrease over the 21st century, specifically in the southern AquiFR domain. In such cases, it is imperative that current groundwater abstractions need to be adapted (Stollsteiner, 2012) to future conditions. In further assessments, including adapting groundwater abstraction could prove to be a crucial element in enhancing the persistency of our analysis.
4.3 Hydrogeological extreme events under climate change
In this study, hydrogeological extreme events are defined as decadal events, i.e., at least 10-year events (see Table 2), for both wet and dry events. The results show that the surface affected by extreme wet events increases by the end of the 21st century as both time goes to 2100 and greenhouse gases are released by the RCP. For RCP8.5, extreme wet events increase by a factor of 4.5 on the long-term horizon considering all the CPs, a trend supported by 3 out of 4 of the storylines (green, purple and yellow). The increase of wet events could affect surface water, resulting in an increased risk of flooding, as shown by Tramblay et al. (2025) in northern France, due to the strong influence of groundwater dynamics on the amount of water in rivers and wetlands (Guillaumot et al., 2024). Let us note that the orange storyline predicts a different future trend characterised by a total disappearance of extreme wet events.
Conversely, the results also show an increase in extreme dry events, as confirmed by the four storylines, which correspond to a decrease of more regular events, i.e., 2.5-years events. It should be noted that even the green storyline induces this increase of extreme dry events, despite its design assumption leading to a larger amount of precipitation. Furthermore, the orange storyline leads to a much larger increase, by a factor of 25 of the extreme dry events, covering almost the entire AquiFR domain. In this case, groundwater recharge may decrease, a phenomenon already observed in some locations nowadays, e.g., the Champagne region (Sobaga et al., 2024). The areas where these increases are larger are Alsace, Poitou-Charentes and Tarn-et-Garonne on the RCP8.5. However, for most of the CPs and the 3 remaining storylines (green, purple and yellow), this increase is lower than the one for wet events. Therefore, the meteorological droughts announced in the EXPLORE2 project (Marson et al., 2026) do not appear to noticeably involve hydrogeological droughts in the large majority of the AquiFR domain. This is differs notably from recent hydrological drought assessments, which clearly indicate an intensity of drought events, whether in terms of low flows observed or periods of no flow, particularly in South of France (Dayon et al., 2018; Lemaitre-Basset et al., 2021; Tramblay et al., 2024). This result contradicts the results from the EXPLORE 2070 project which suggested a strong increase of hydrogeological droughts (Stollsteiner, 2012; Habets et al., 2013; Carroget et al., 2017). As mentioned in Sect. 4.2, the CPs used in the EXPLORE2 project are wetter than the ones used in the EXPLORE 2070 project (Dayon et al., 2018). As such, the ones from EXPLORE2 are likely to induce fewer dry events than those used in the EXPLORE 2070 project. Furthermore, the aquifers corresponding to the study area are defined by annual or multi-annual temporal dynamics (Baulon et al., 2022) and often involve groundwater-river interactions, whereby the groundwater feeds the river (Guillaumot et al., 2022). Therefore, droughts may be observed at the surface without having a direct effect on groundwater.
The purpose of this study is to identify the main impacts of climate change on groundwater levels in the French regions covered by the AquiFR platform: Nord Pas-de-Calais, Basse-Normandie, Parisian Basin, Loire, Poitou-Charentes, Alsace and Tarn-et-Garonne. To achieve this, the hydrogeological modelling platform AquiFR, which gathers 13 different models (a model being the combination of a study aquifer with the associated hydrogeological software package), is connected to a hydroclimatic modelling chain. The latter is based on a multi-model ensemble approach, with 36 climate projections under the RCP2.6, RCP4.5 and RCP8.5. The future evolution of groundwater level is assessed using the SPLI, a normalised indicator of groundwater level, which allows various types of aquifer to be compared simultaneously. The results show that future trends diverge depending on the GCM/RCM couples, either on the spatial distribution of median SPLI or on areas associated with extreme events, defined as 10-year events, i.e., characterised by return periods of more than 10 years.
Under the RCP8.5, the divergences from the 17 CPs are substantial, but two main trends have been identified, mostly thanks to the use of four storylines defined in the EXPLORE2 project. First, an increase in groundwater levels (with return periods greater than 5 years) is expected in the northern part of the AquiFR domain (Nord Pas-de-Calais, Parisian Basin, Normandie), a statement supported by 3 out of the 4 storylines. Second, a decrease in groundwater levels is expected in the southern part (Poitou-Charentes and Tarn-et-Garonne), but with a lower intensity than the increase in the northern AquiFR domain. All four storylines confirm this evolution, and the orange storyline (the driest one) extends this increase of dry event to the entire AquiFR domain, with groundwater levels reaching 10-year dry events on the reference historical period (1975–2004).
The RCP8.5 produces the largest amplification of both dry and wet extreme groundwater levels, and induces the most pronounced North-South differentiation, with a transition zone along the northern border which depends on the GCM/RCM couple. While this study alone is insufficient to prove the existence of a North-South divide over France due to the limited spatial extent in South of France, the results are consistent with those from several other studies dealing with climate change impacts on French hydrology, especially the joined researches carried out in the EXPLORE2 project on groundwater recharge (Lanini et al., 2024) and surface hydrology (Sauquet et al., 2026), which justifies the authors' confidence in this conclusion. Furthermore, the use of the storylines may encourage the decision-makers to adopt the precautionary principle and select the worst case situation when establishing a sustainable groundwater management policy.
For the RCP2.6 and RCP4.5, the results are too divergent on the short-term horizon (2021–2050) and the intermediate-term horizon (2041–2070) to extract reliable future trends. While still being quite divergent, the results on the long-term horizon are more convergent and show an increase of groundwater level mostly in the northern AquiFR domain, i.e., Normandie, Nord Pas-de-Calais, Parisian Basin. For the RCP4.5, this increase in groundwater levels corresponds to extreme wet events on the historical period. For the most remote areas (Tarn-et-Garonne and Alsace), the results diverge too much from one GCM/RCM couple to another to extract reliable future trends.
There are several potential ways in which this work could be improved, such as integrating more models into the AquiFR platform to enhance its representativeness for the different French hydrogeological contexts, especially in South of France. Similarly, using other hydrogeological modelling software per model could substantial improve the reliability of the study, particularly in terms of accurately assessing the propagation of uncertainties along the modelling chain. Eventually, considering the very close relationship between water policy (including water use) and water availability, future work should integrate socio-economic considerations into physically-based models to make water demand dependent on water availability.
The elements from Appendix A are related to the Material and Method section. Table A1 regroups all the GCM/RCM combinations available in this study, with the RCPs used to force them, and Table A2 regroups the characteristics of the 13 models included in the AquiFR platform.
Table A1Availability of climate projections. The numbers (2.6, 4.5, and 8.5) refer to the RCPs used by the GCM (rows)/RCM (columns) couples. “–” indicates missing data.
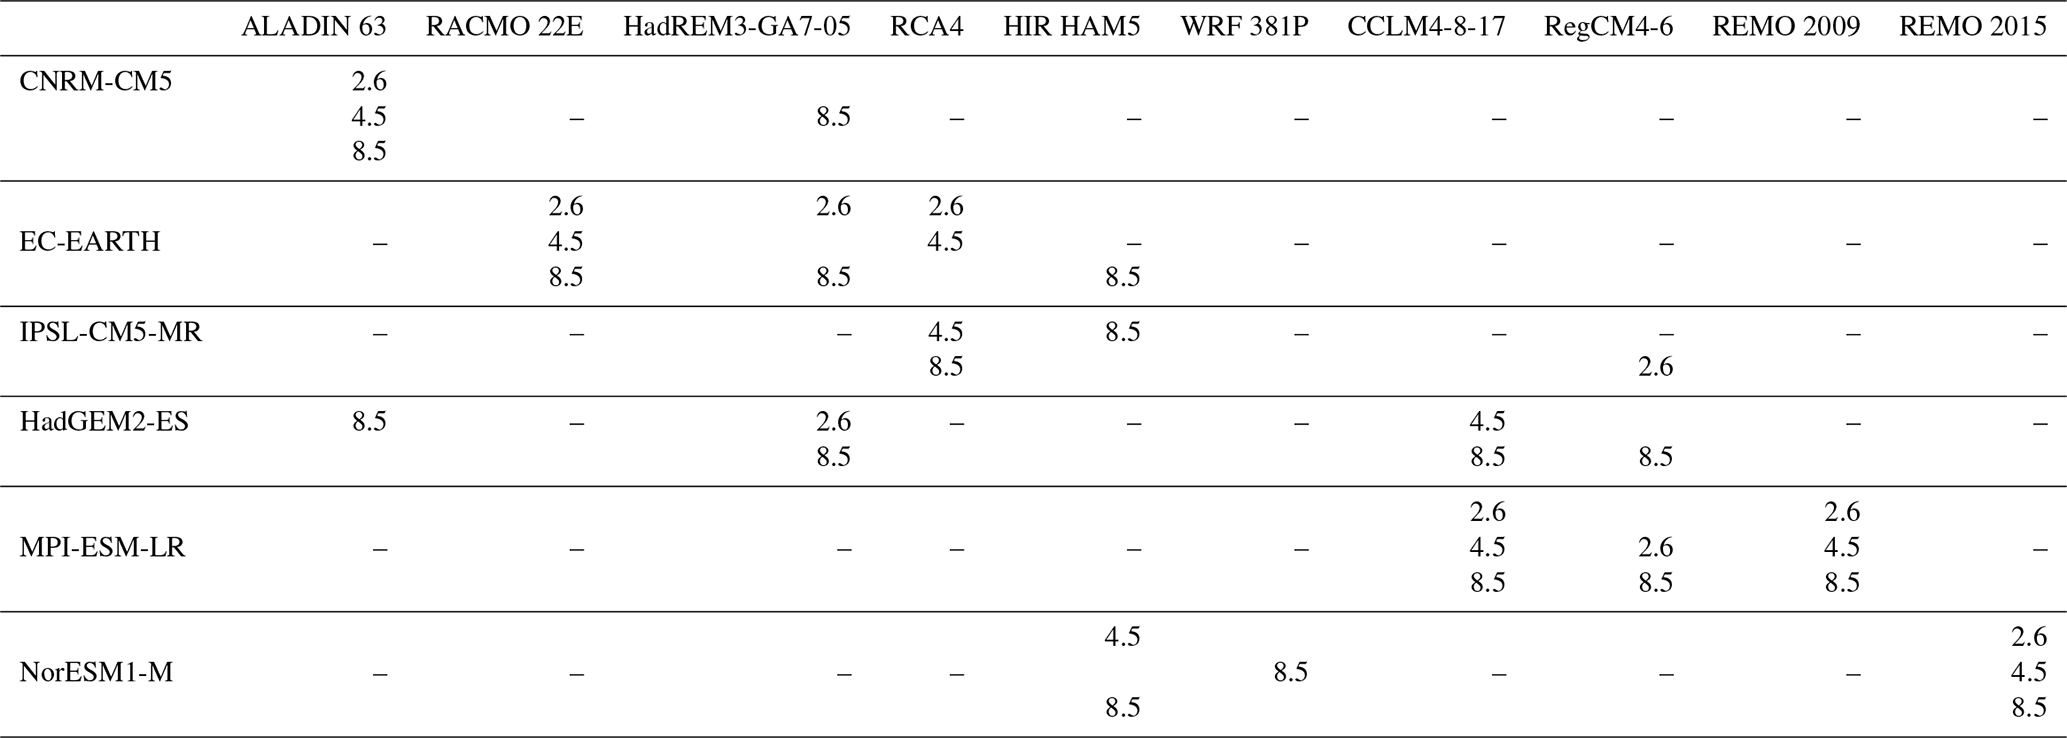
Table A2Characteristics of the 13 studied models included in the AquiFR platform. The IDs refer to each model illustrated on Fig. 1.
The figures from Appendix B are related to the spatial repartion of the SPLI median over the AquiFR domain under the RCP2.6 (Figs. B1, B2 and B3) and under the RCP4.5 (Figs. B4, B5 and B6) respectively on the short-term, intermediate-term and long-term horizons. The similar ones are available under the RCP8.5 (Figs. B7 and B8) on the short-term and intermediate-term horizons.
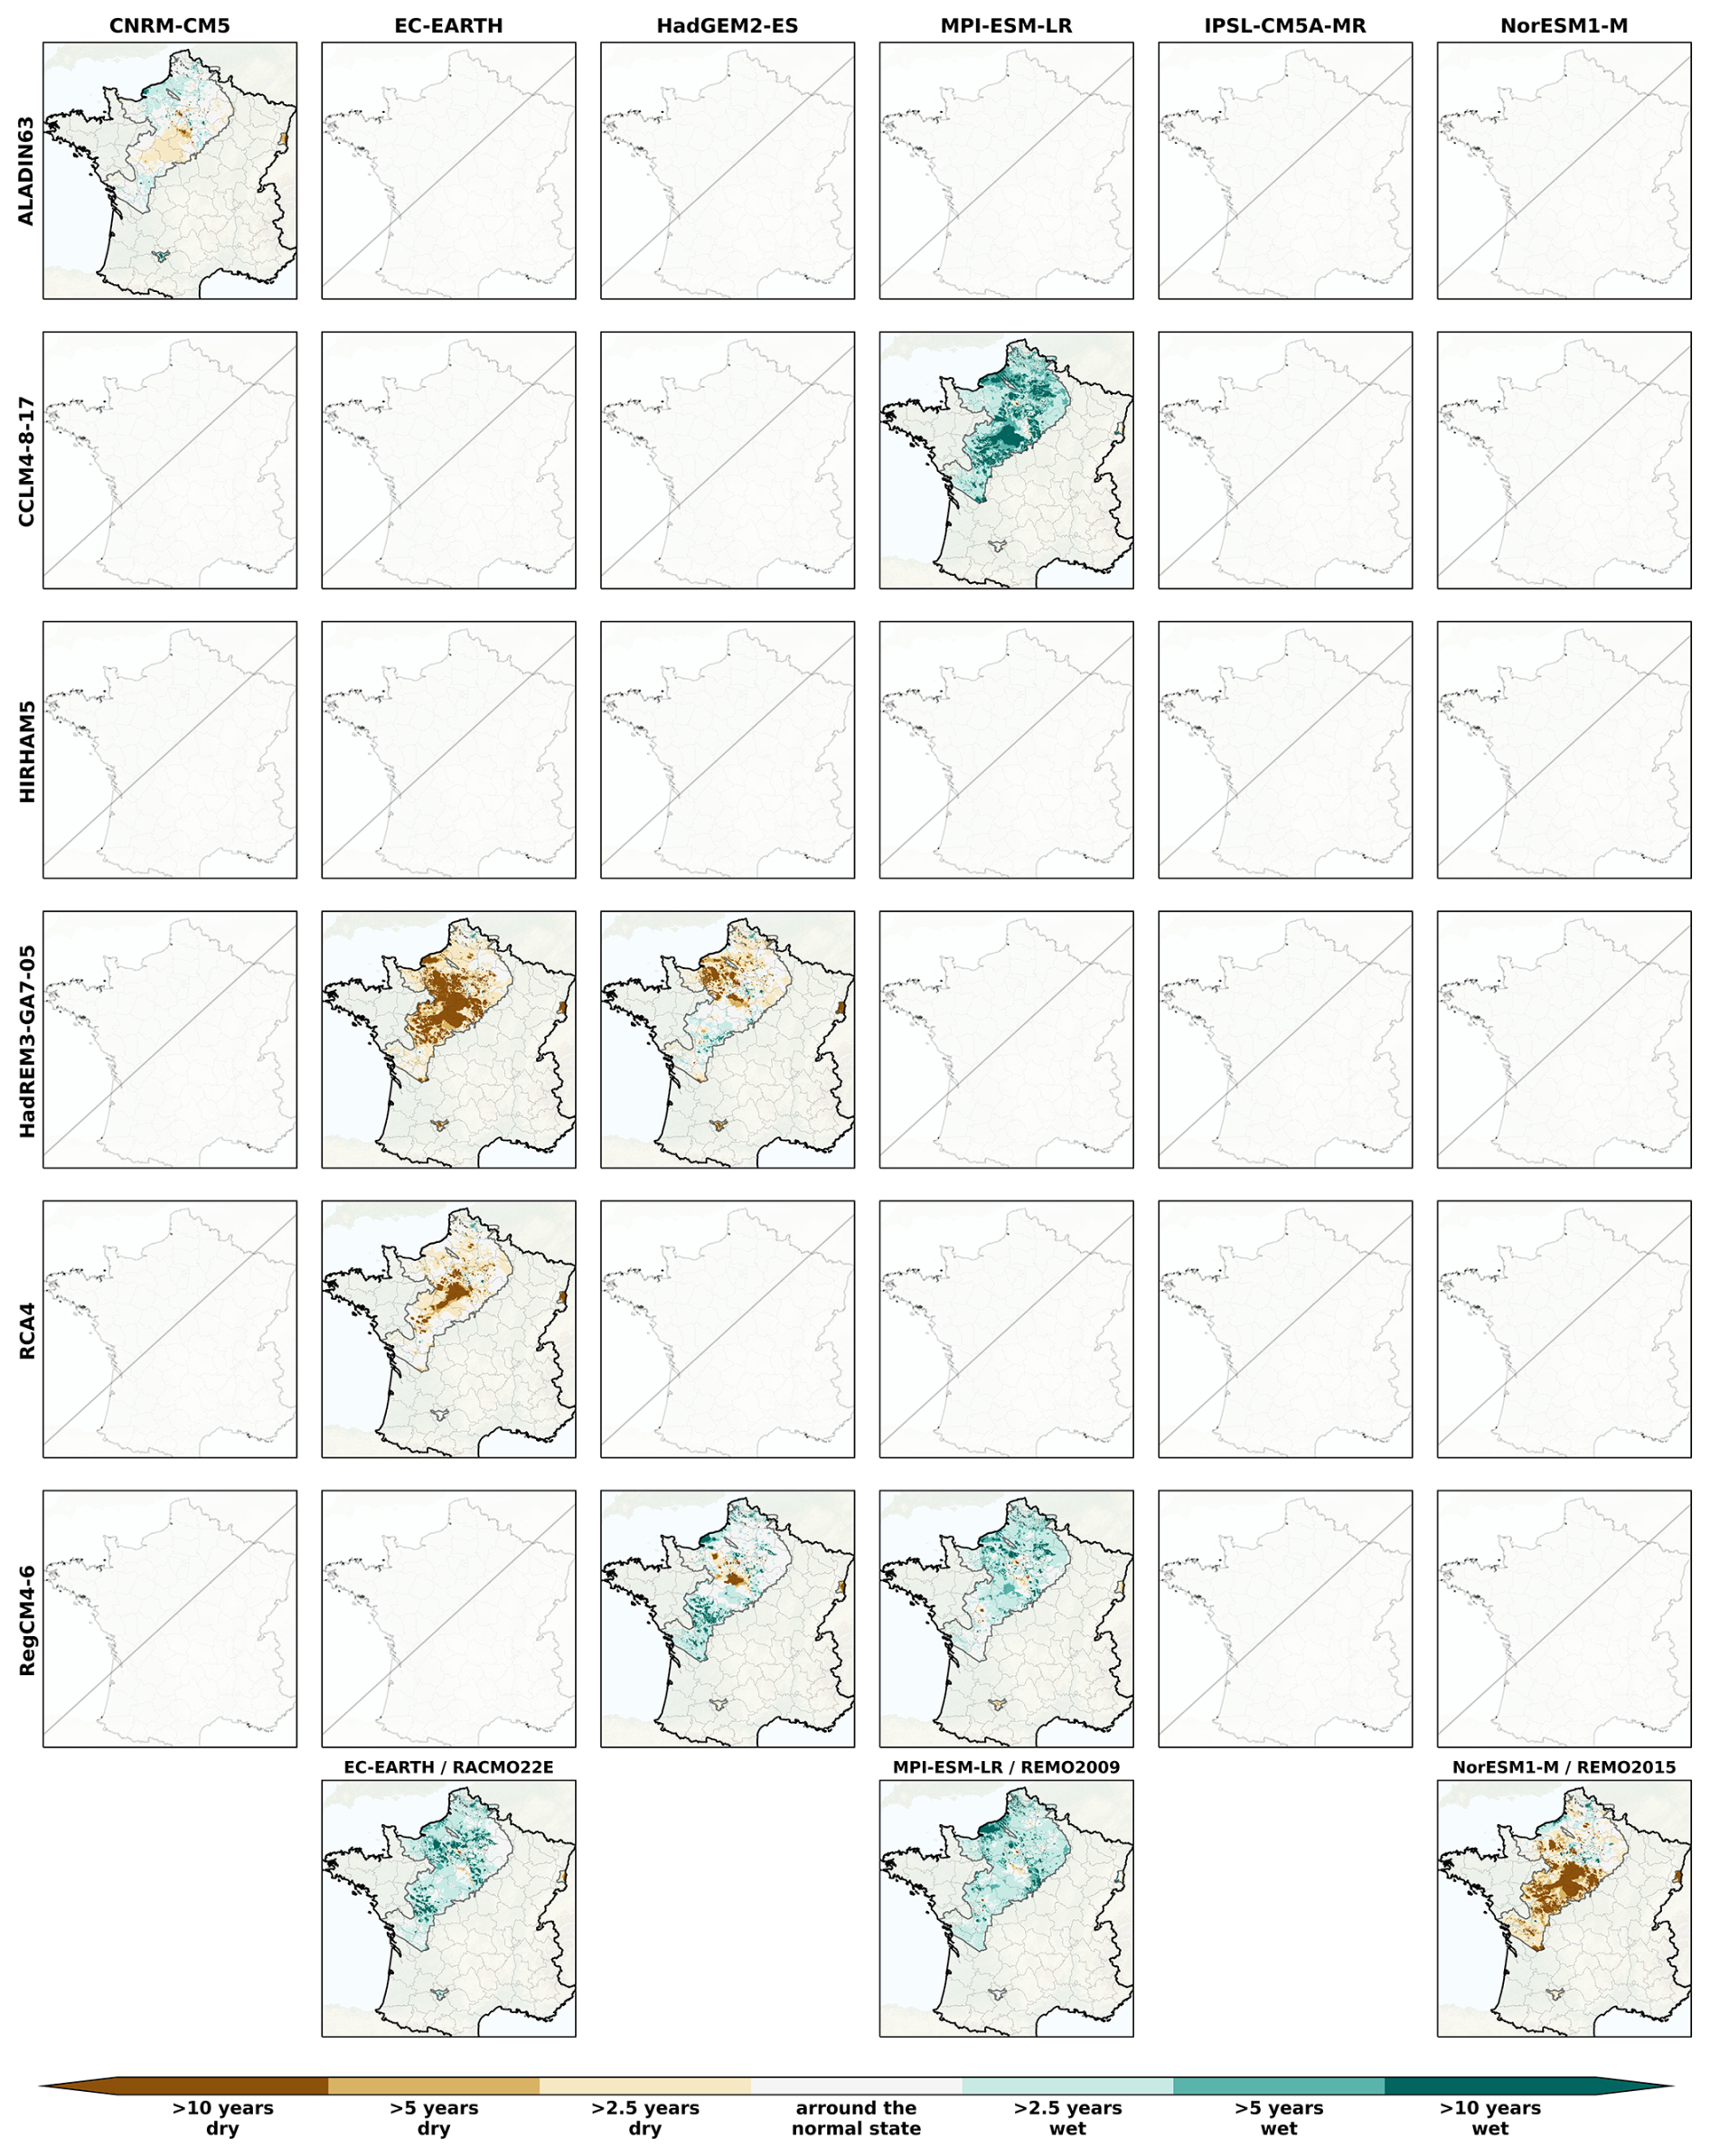
Figure B1Spatial distribution of the SPLI median over the AquiFR domain under the RCP2.6 on the short-term horizon (2021–2050), following the different GCM (in column)/RCM (in line) combination. The last line corresponds to couples where RCMs are used only once. The missing panels indicate the GCM/RCM couples not included in the EXPLORE2 climate projection dataset.
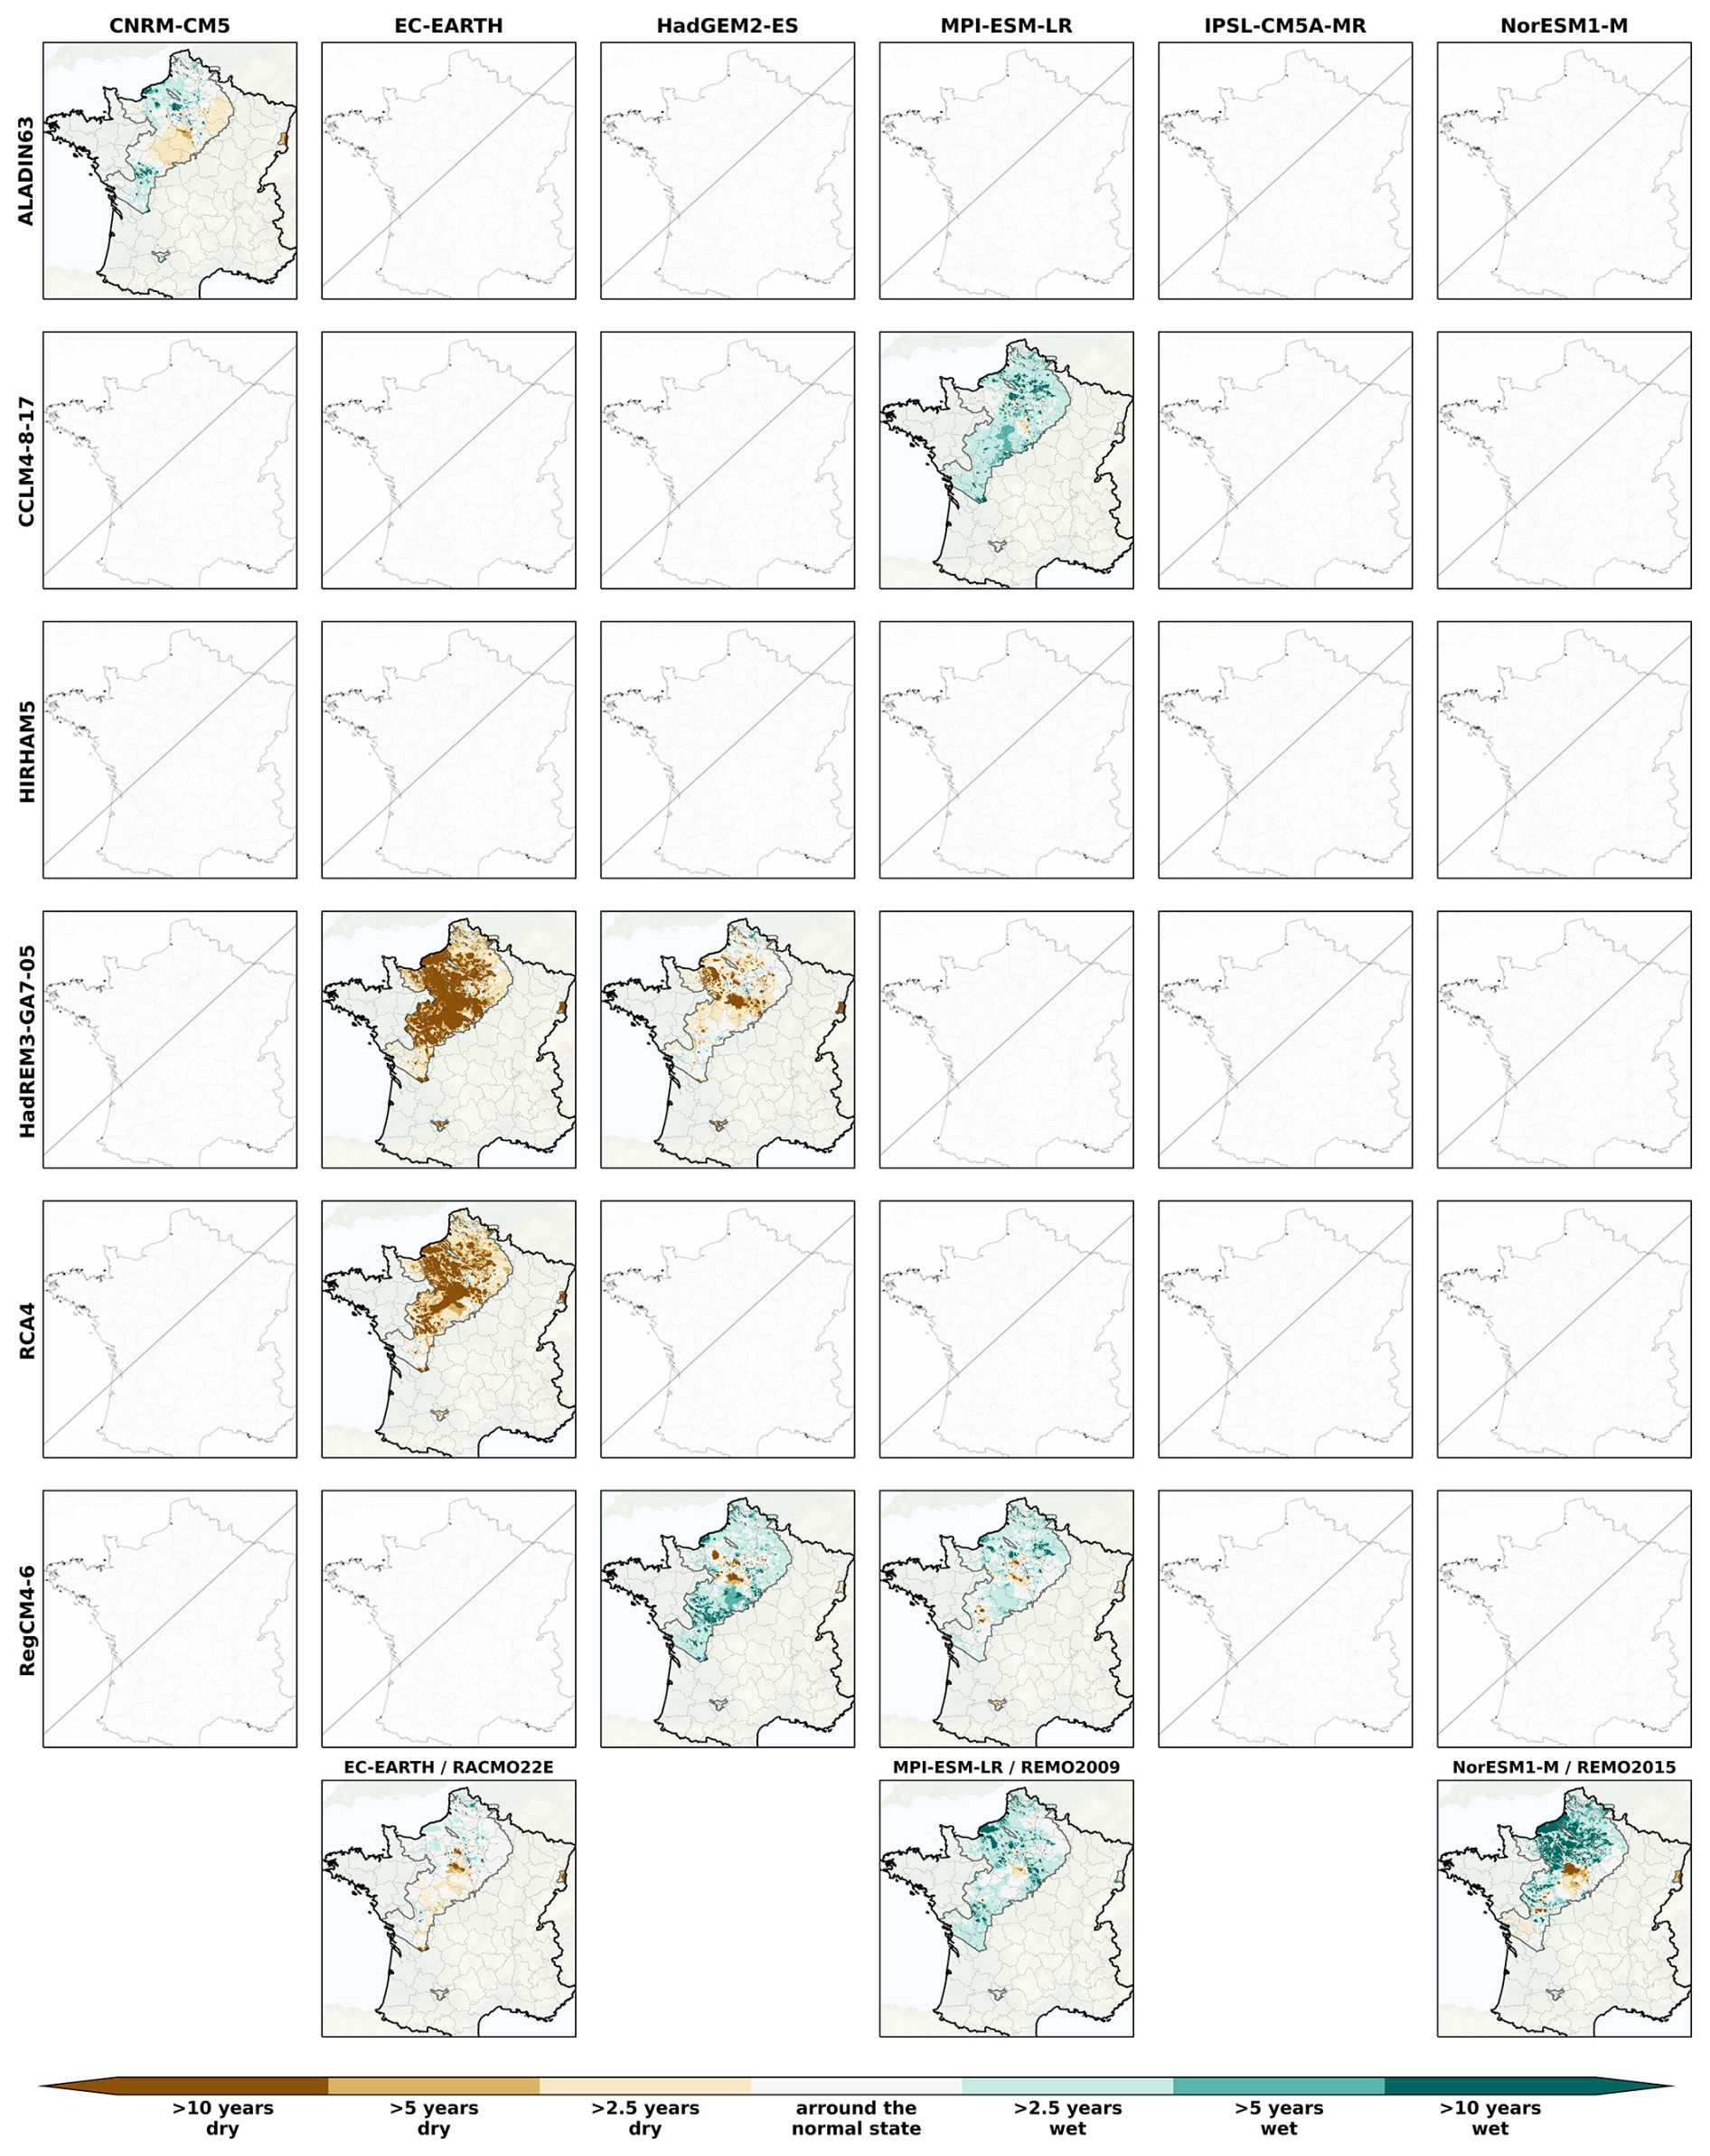
Figure B2Spatial distribution of the SPLI median over the AquiFR domain under the RCP2.6 on the intermediate-term horizon (2041–2070), following the different GCM (in column)/RCM (in line) combination. The last line corresponds to couples where RCMs are used only once. The missing panels indicate the GCM/RCM couples not included in the EXPLORE2 climate projection dataset.
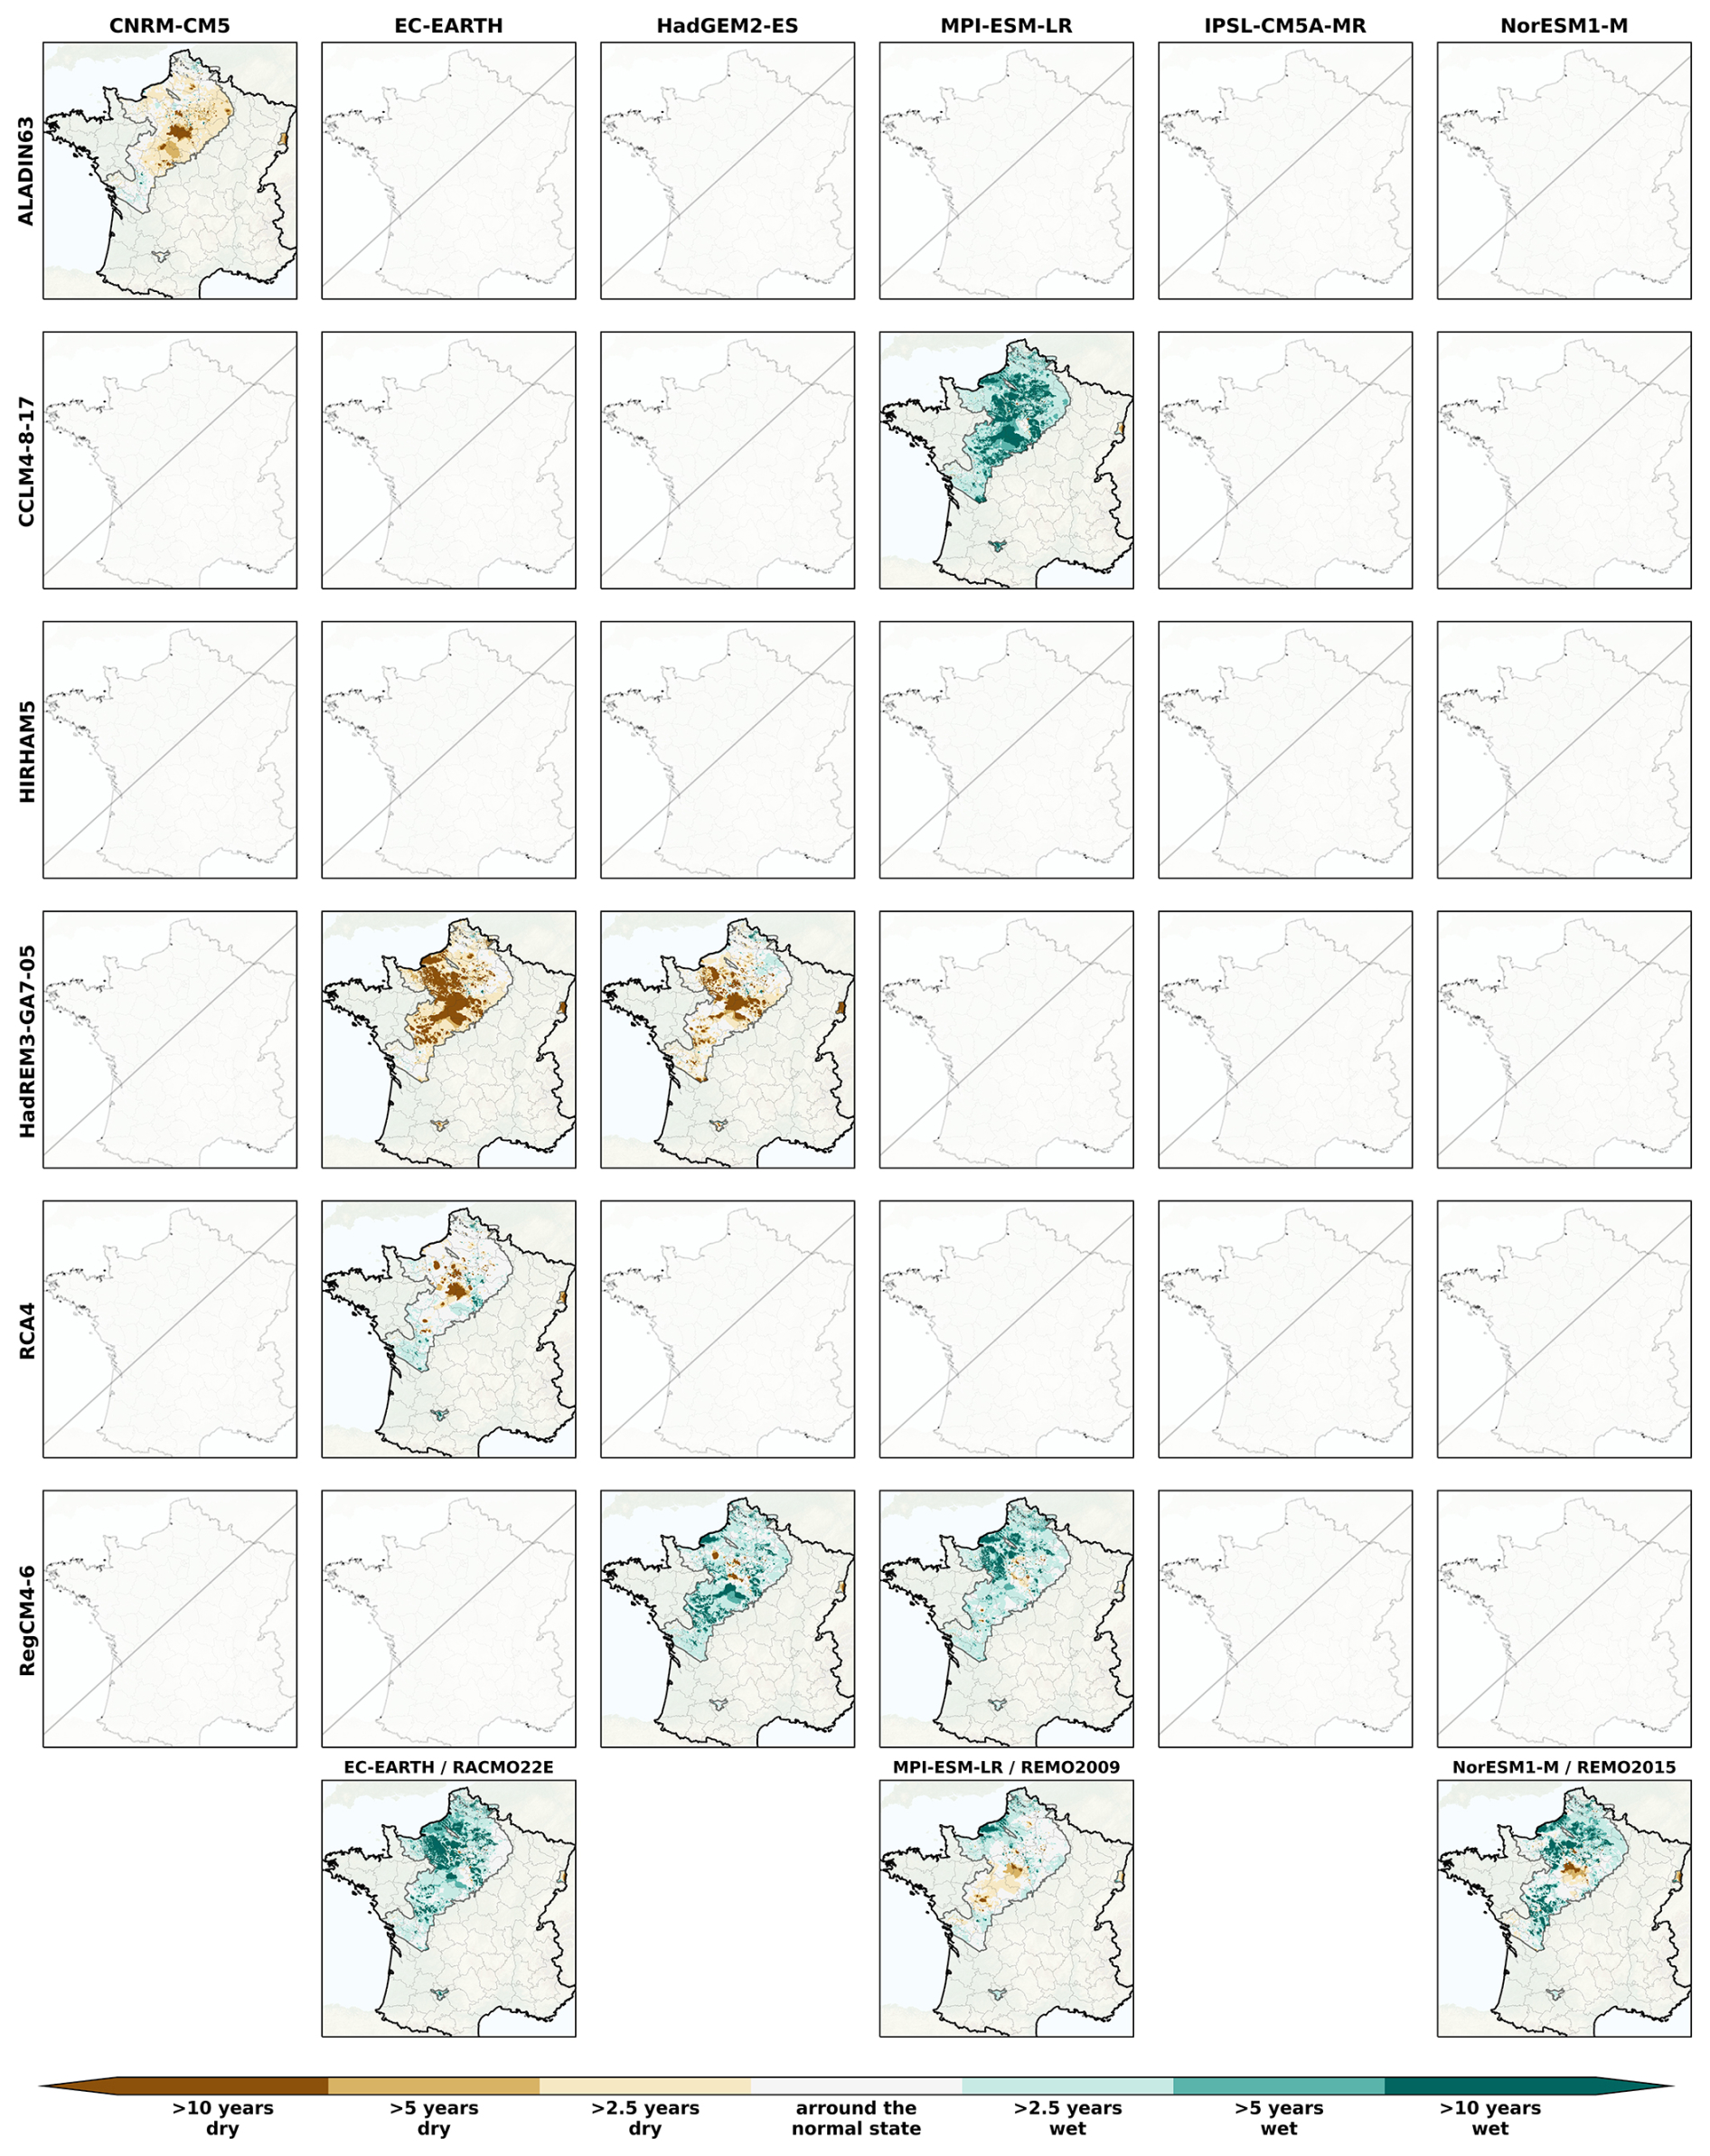
Figure B3Spatial distribution of the SPLI median over the AquiFR domain under the RCP2.6 on the long-term horizon (2071–2099), following the different GCM (in column)/RCM (in line) combination. The last line corresponds to couples where RCMs are used only once. The missing panels indicate the GCM/RCM couples not included in the EXPLORE2 climate projection dataset.
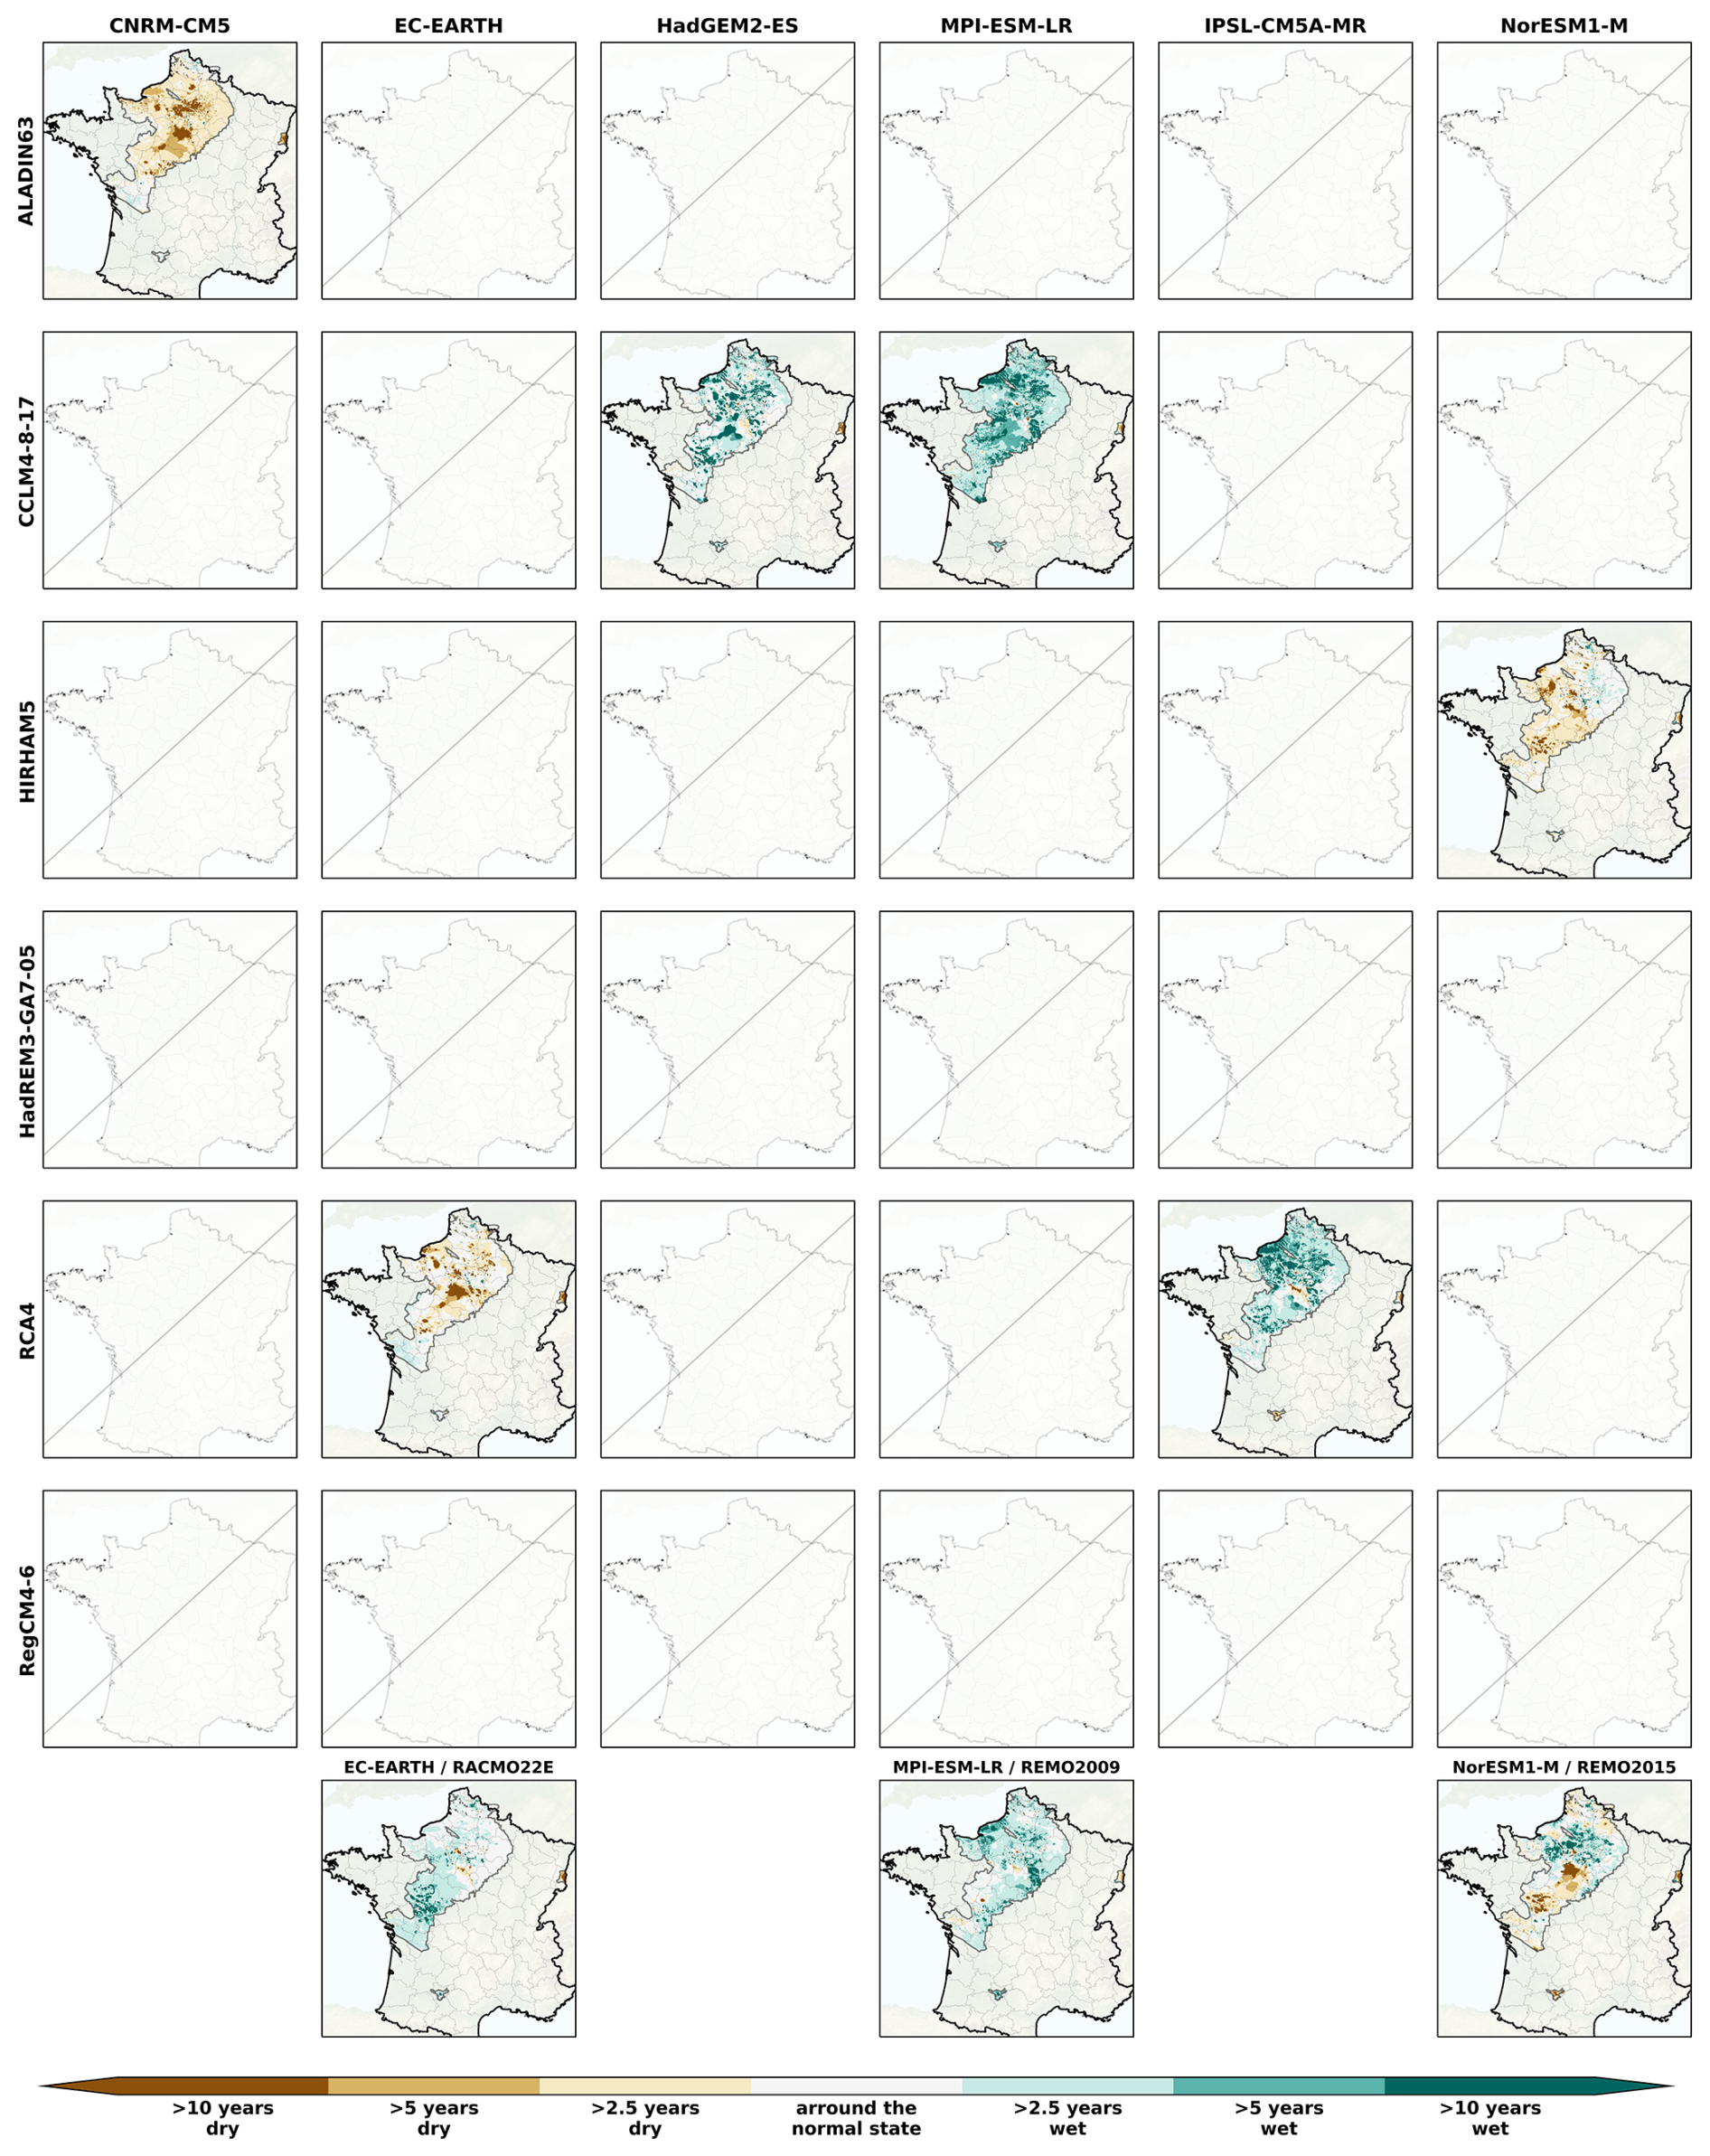
Figure B4Spatial distribution of the SPLI median over the AquiFR domain under the RCP4.5 on the short-term horizon (2021–2050), following the different GCM (in column)/RCM (in line) combination. The last line corresponds to couples where RCMs are used only once. The missing panels indicate the GCM/RCM couples not included in the EXPLORE2 climate projection dataset.
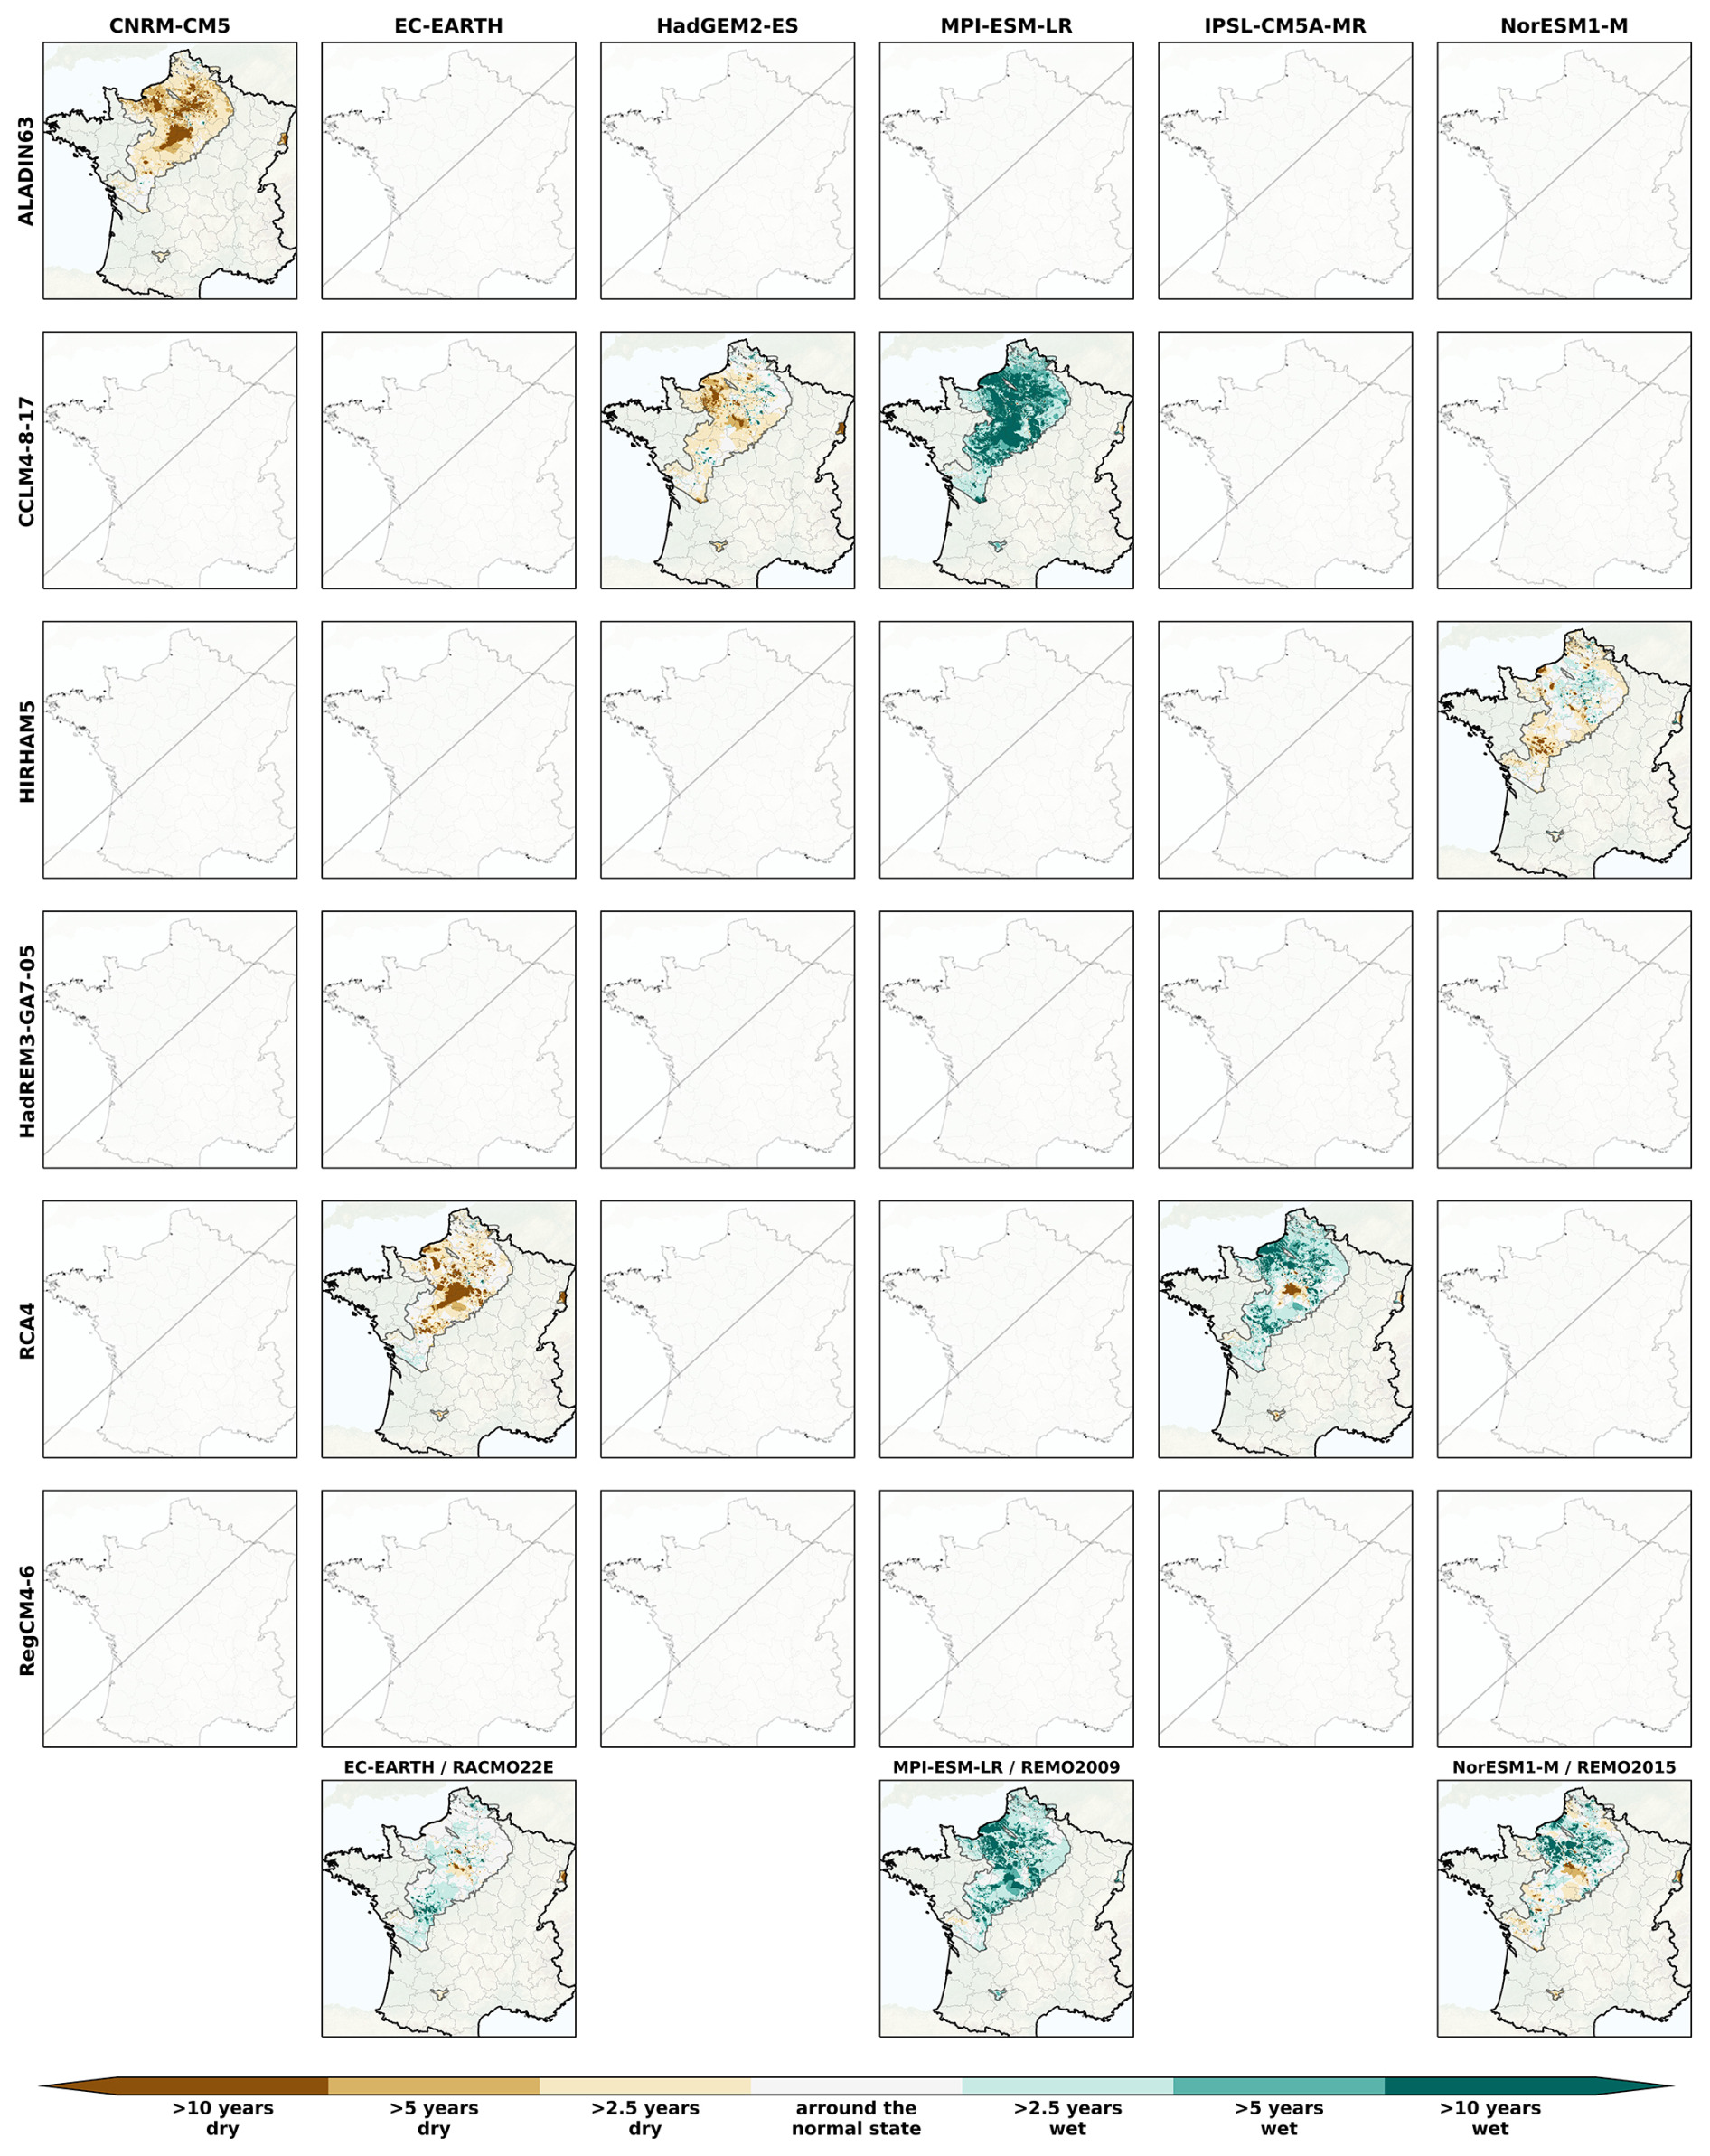
Figure B5Spatial distribution of the SPLI median over the AquiFR domain under the RCP4.5 on the intermediate-term horizon (2041–2070), following the different GCM (in column)/RCM (in line) combination. The last line corresponds to couples where RCMs are used only once. The missing panels indicate the GCM/RCM couples not included in the EXPLORE2 climate projection dataset.
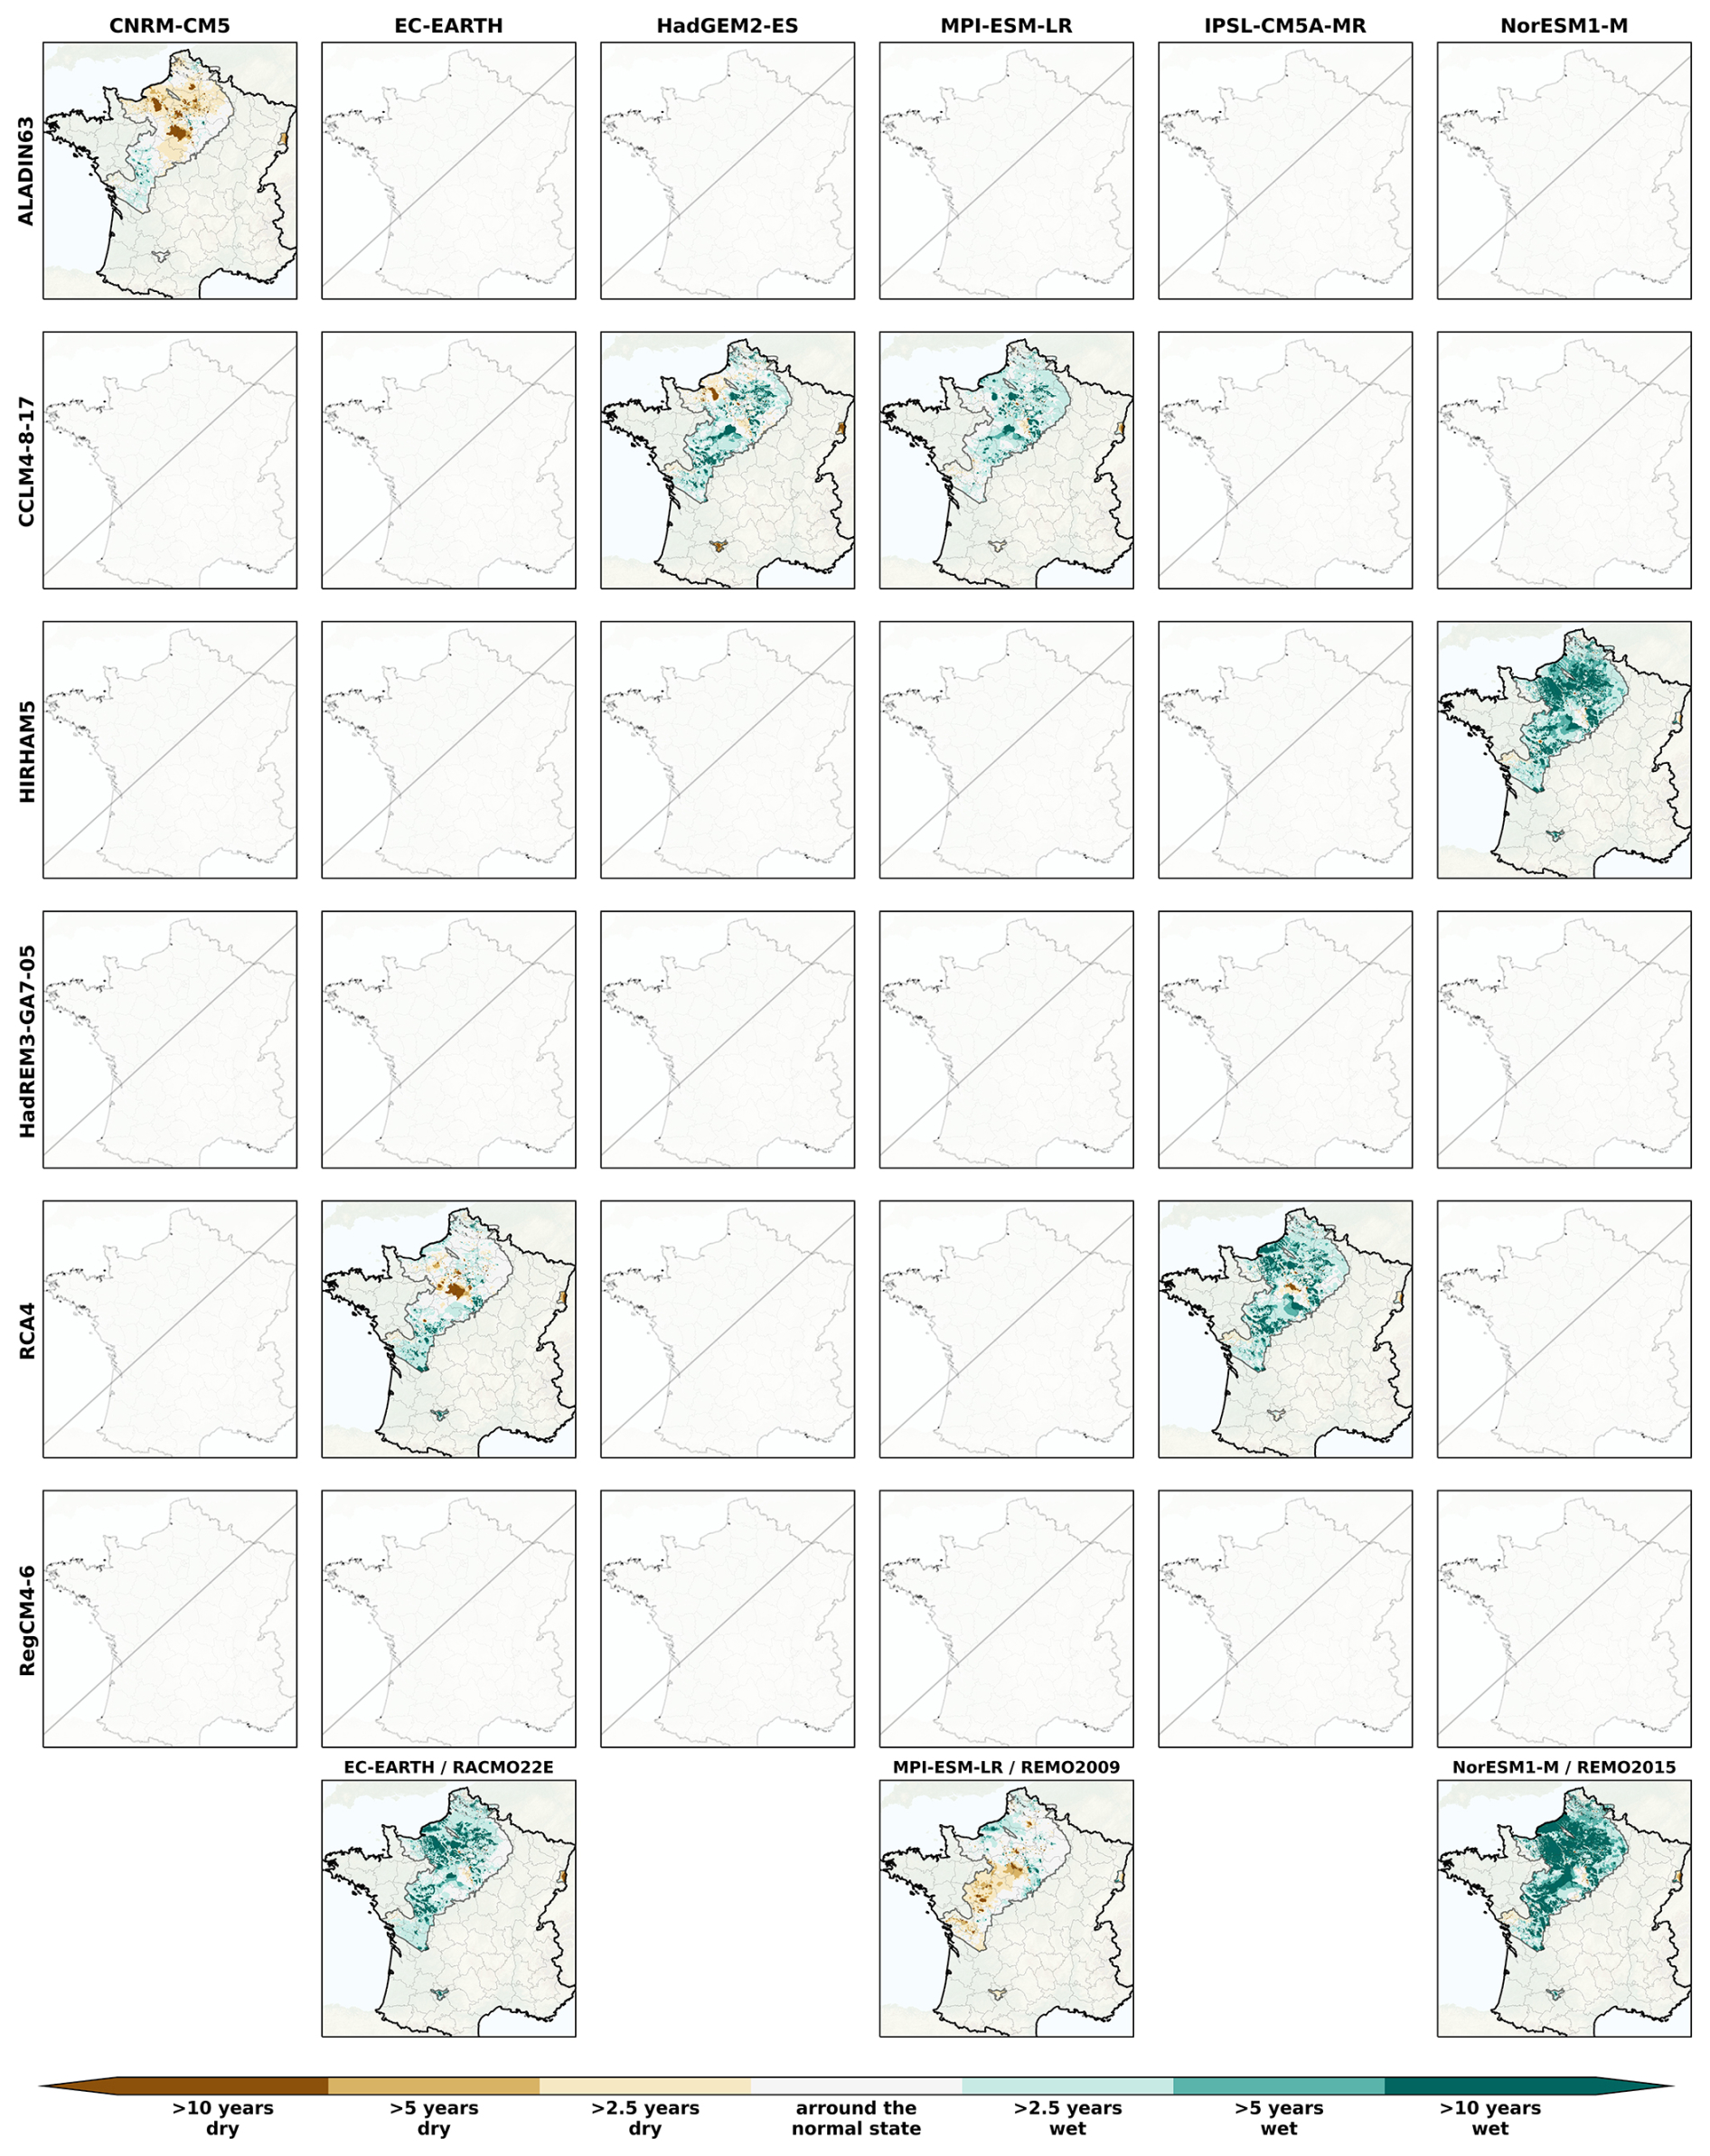
Figure B6Spatial distribution of the SPLI median over the AquiFR domain under the RCP4.5 on the long-term horizon (2071–2099), following the different GCM (in column)/RCM (in line) combination. The last line corresponds to couples where RCMs are used only once. The missing panels indicate the GCM/RCM couples not included in the EXPLORE2 climate projection dataset.
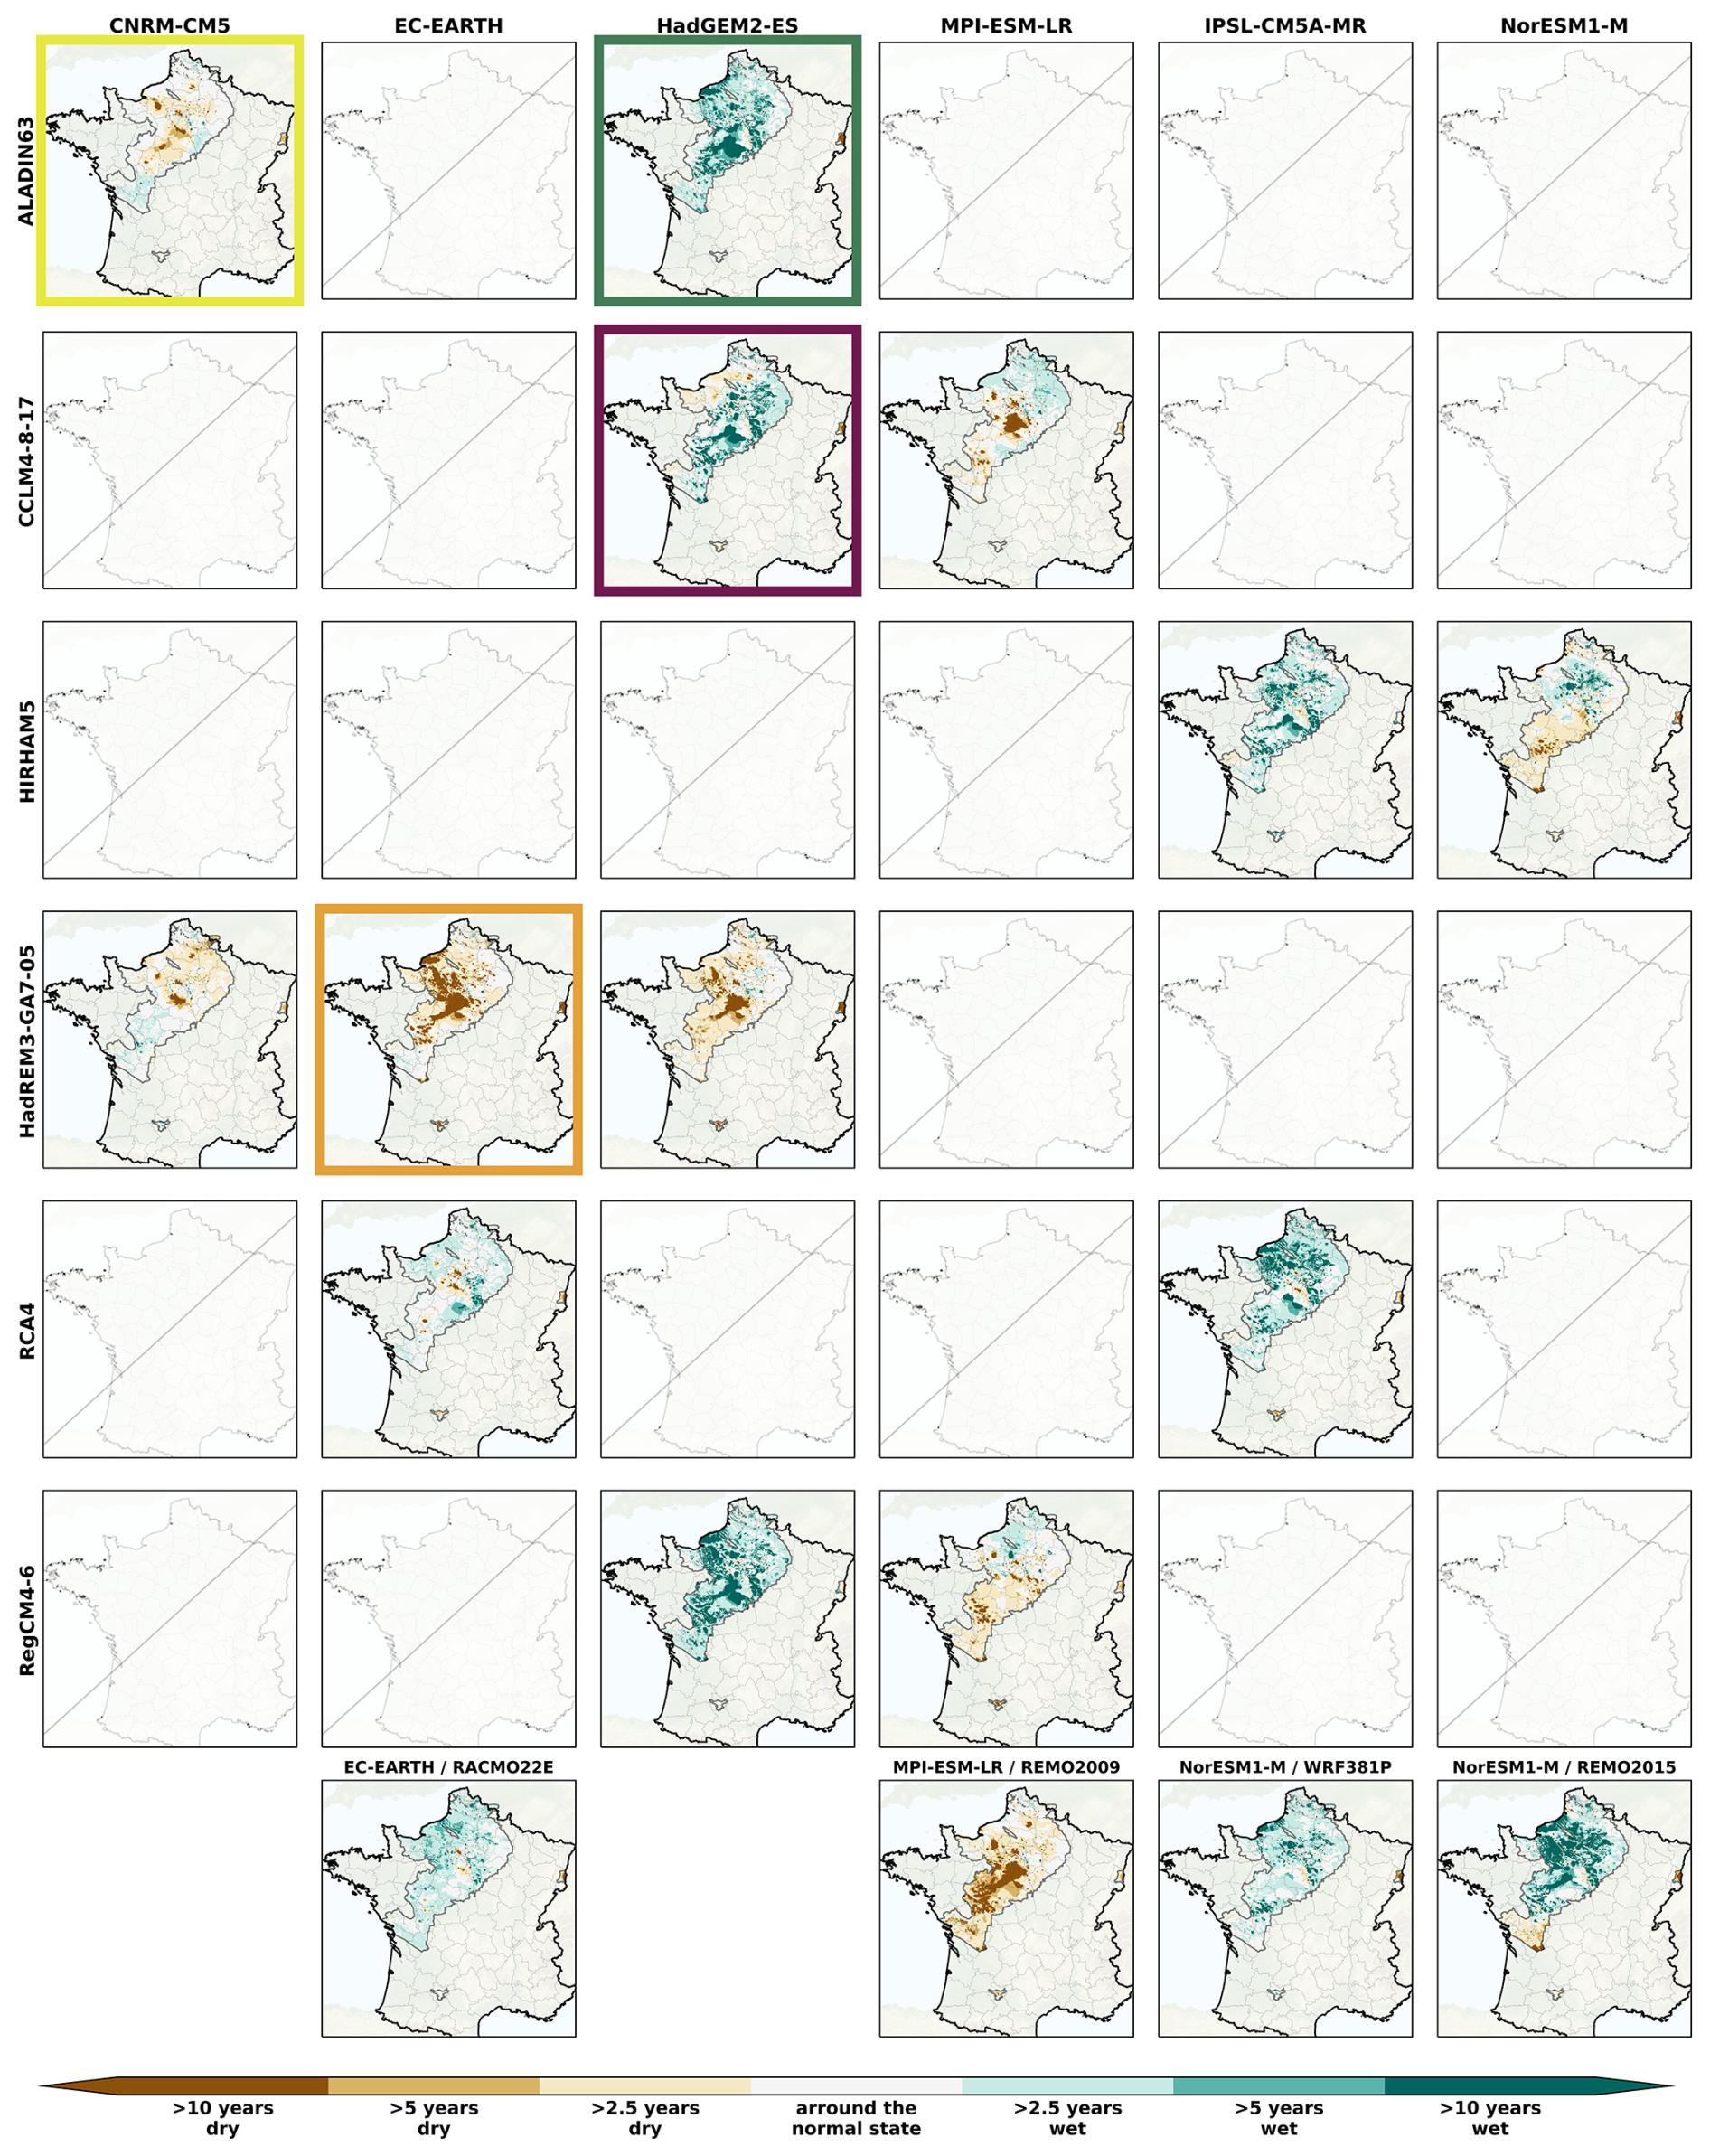
Figure B7Spatial distribution of the SPLI median over the AquiFR domain under the RCP8.5 on the short-term horizon (2021–2050), following the different GCM (in column)/RCM (in line) combination. The last line corresponds to couples where RCMs are used only once. The colored rectangles indicates the GCM/RCM couples corresponding to the storylines (see Sect. 2.1). The missing panels indicate the GCM/RCM couples not included in the EXPLORE2 climate projection dataset.
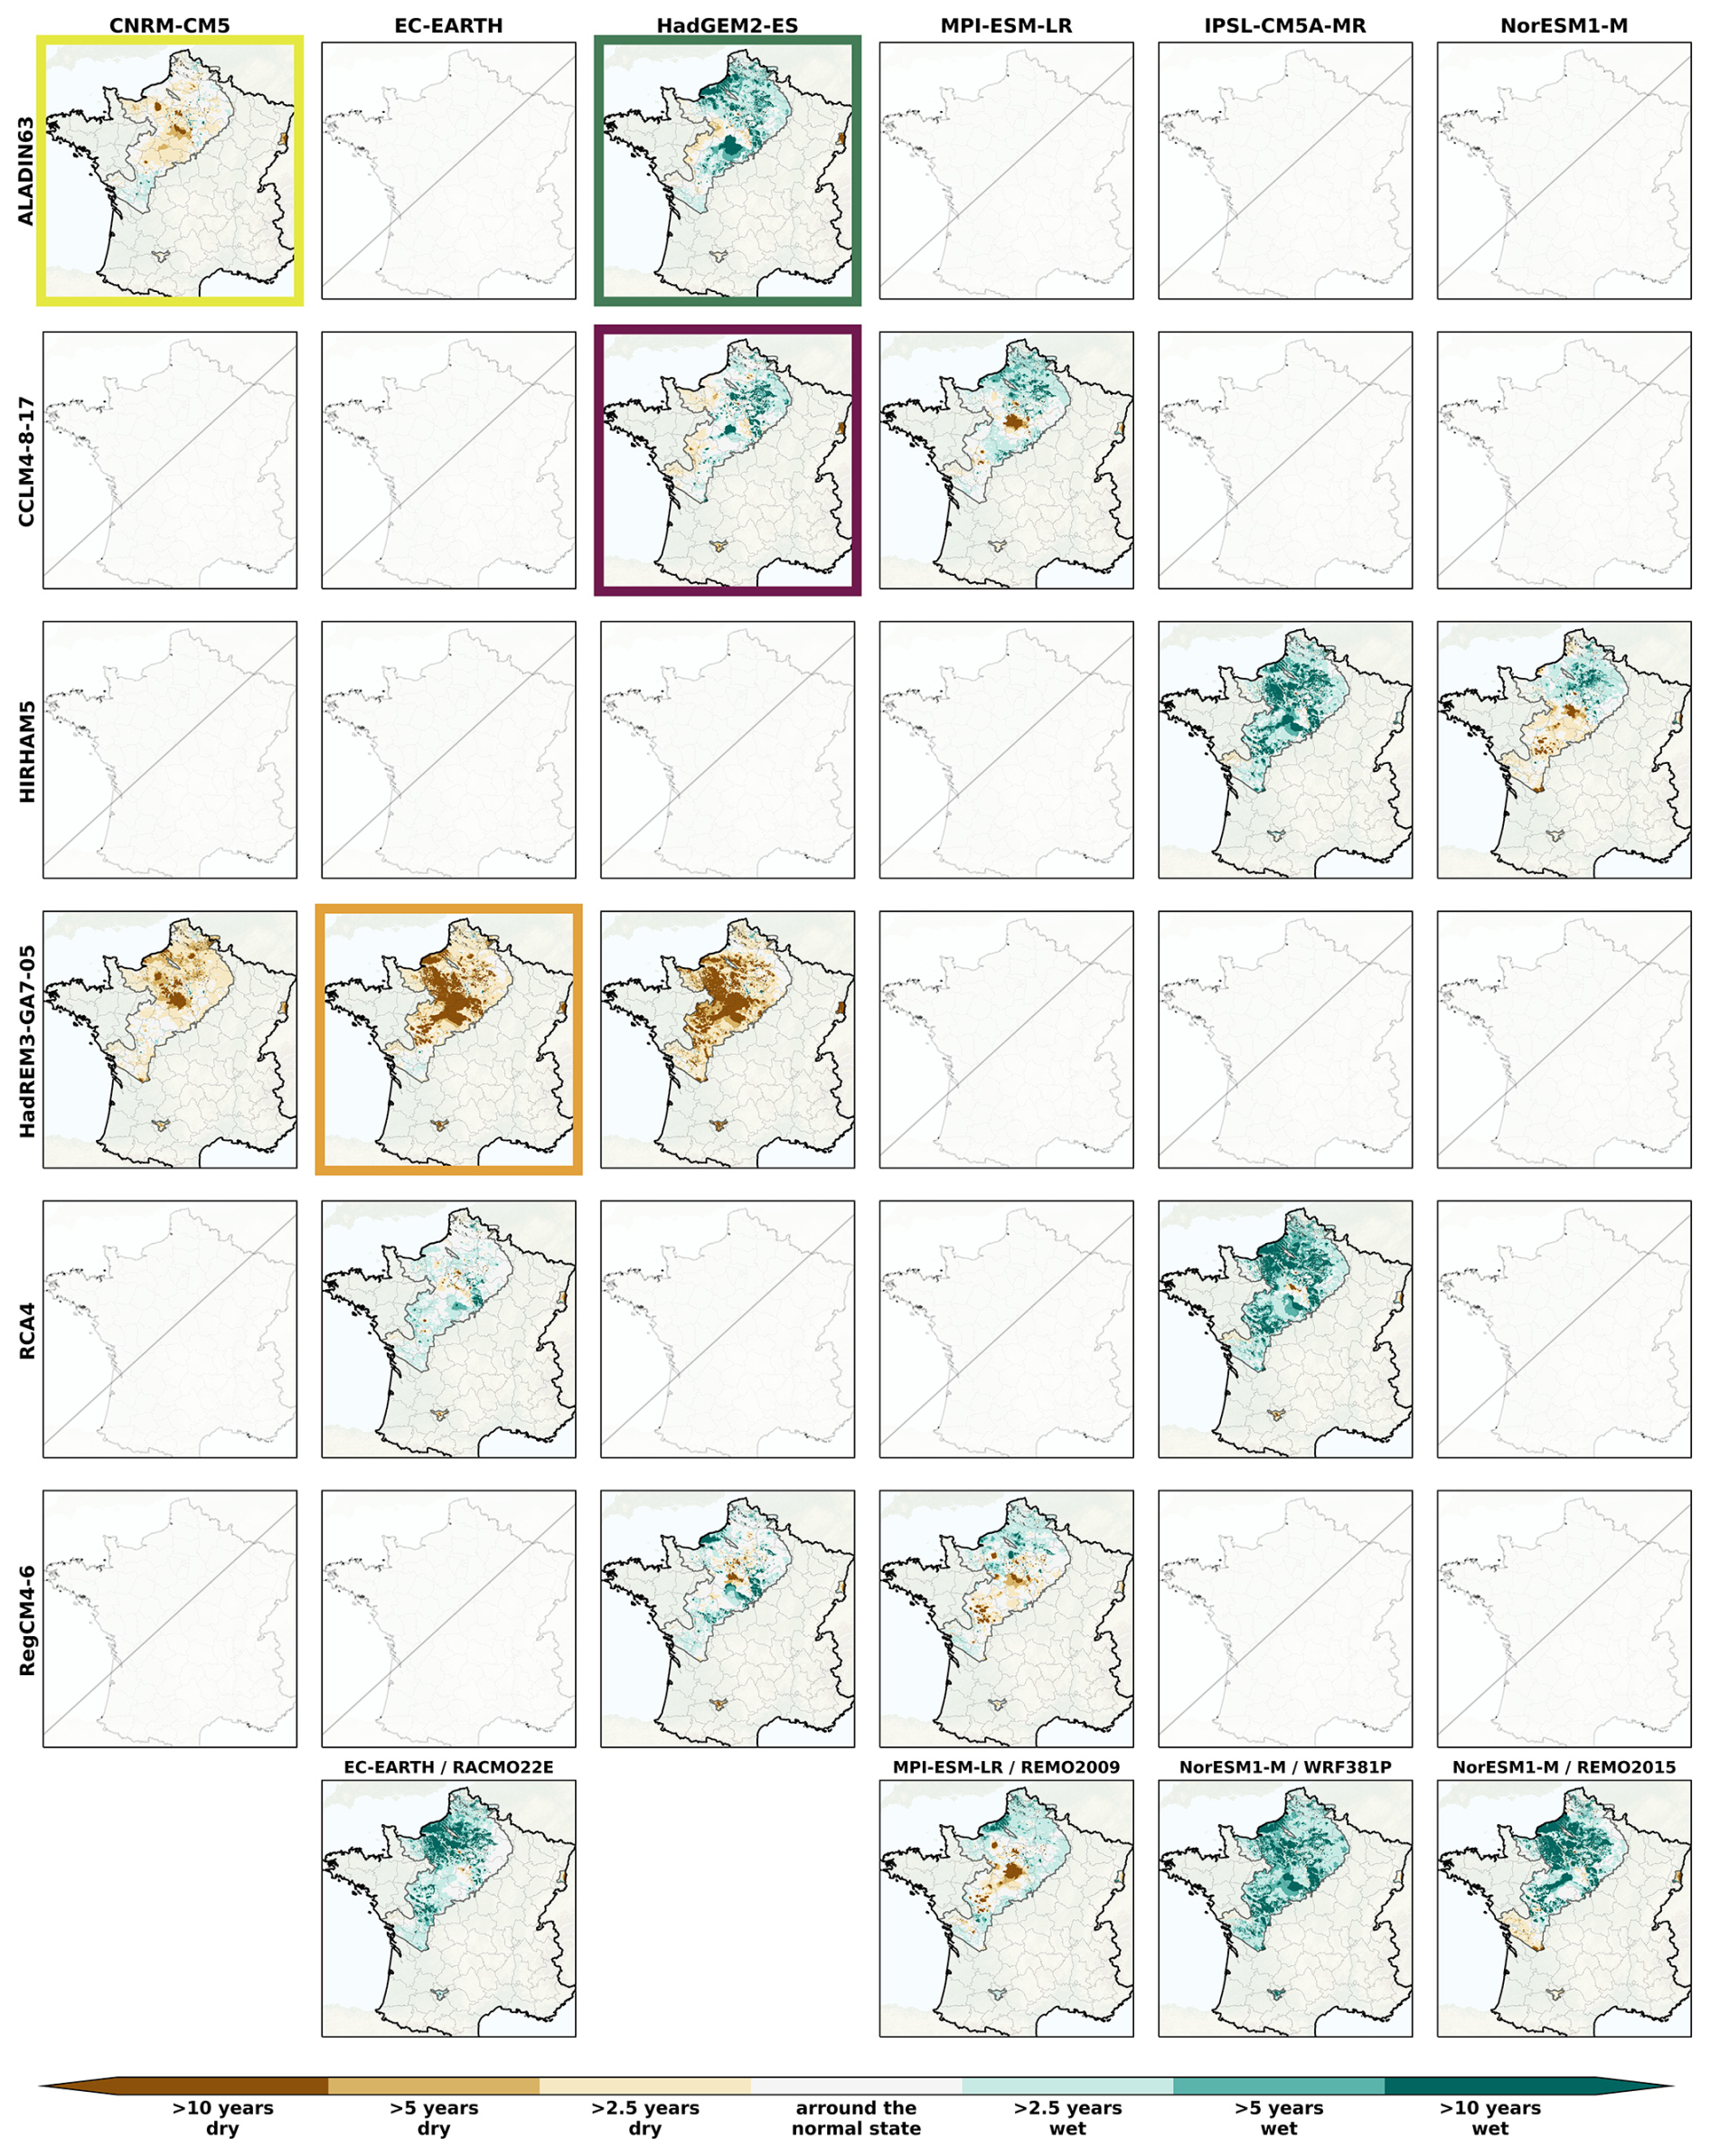
Figure B8Spatial distribution of the SPLI median over the AquiFR domain under the RCP8.5 on the intermediate-term horizon (2041–2070), following the different GCM (in column)/RCM (in line) combination. The last line corresponds to couples where RCMs are used only once. The colored rectangles indicates the GCM/RCM couples corresponding to the storylines (see Sect. 2.1). The missing panels indicate the GCM/RCM couples not included in the EXPLORE2 climate projection dataset.
The elements from Appendix C are related to the analyses performed on the temporal evolution of the running median affected by the categories of events for the four storylines (see Tables C1 and C2) and for all the CPs (see Fig. C1 and Table C3), and for the time proportion spend in extreme events for all the CPs (Fig. C3).
Table C1Results from Kolmogorov-Smirnov (KS) test and Mann-Kendall (MK) test for the orange and green storylines under the RCP8.5 on each category of events from Table 2. The direction of the trend is provided if both tests are significant, as well as the corresponding median areas affected for all three horizons.
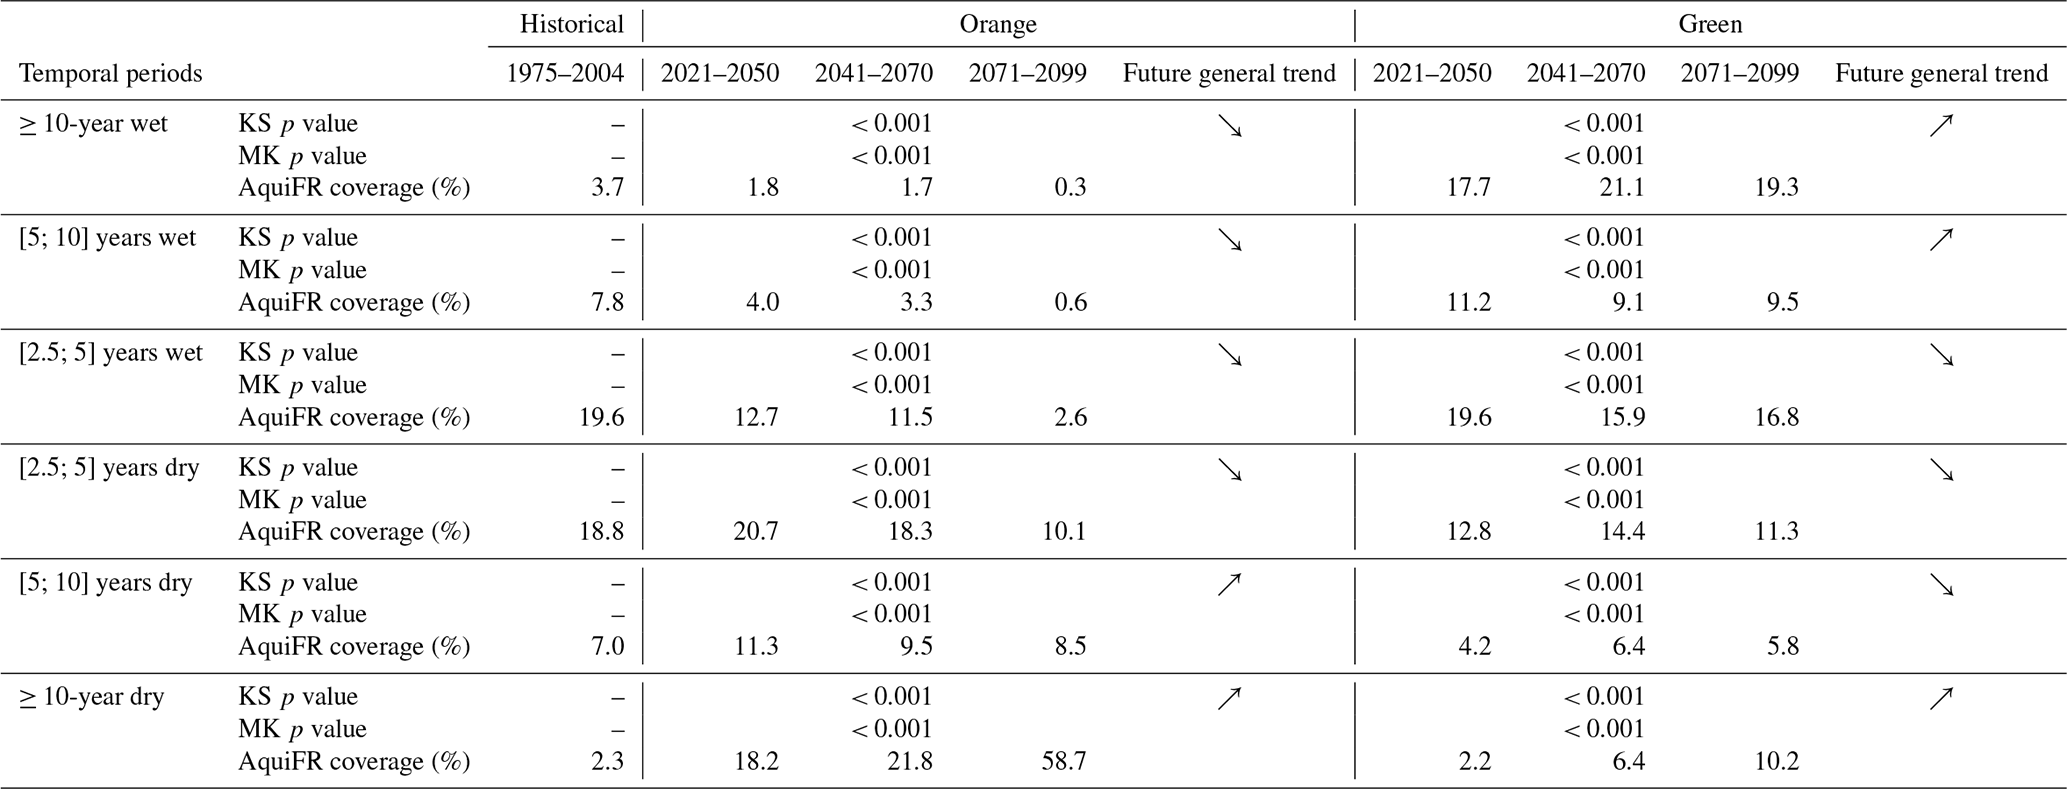
Table C2Results from Kolmogorov-Smirnov (KS) test and Mann-Kendall (MK) test for the purple and yellow storylines under the RCP8.5 on each category of events from Table 2. The direction of the trend is provided if both tests are significant, as well as the corresponding median areas affected for all three horizons.
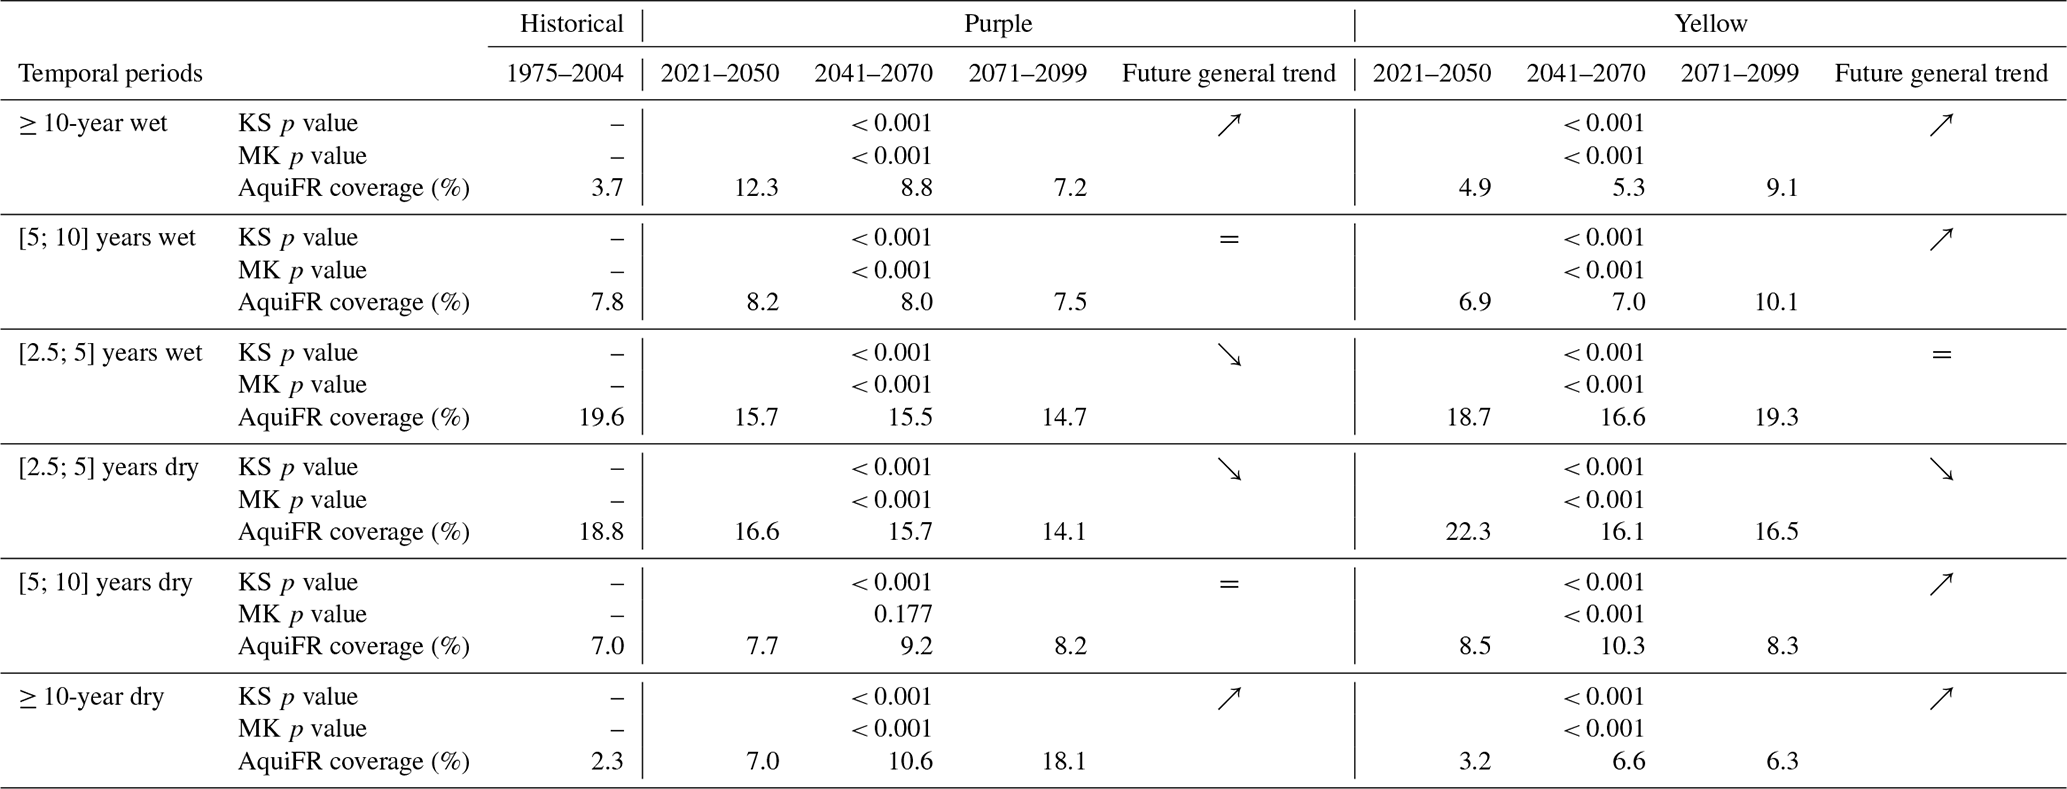
Table C3Results from Kolmogorov-Smirnov (KS) test and Mann-Kendall (MK) test for all the available climate projections on each category of events from Table 2. The direction of the trend is provided if both tests are significant, as well as the corresponding median areas affected for all three horizons.
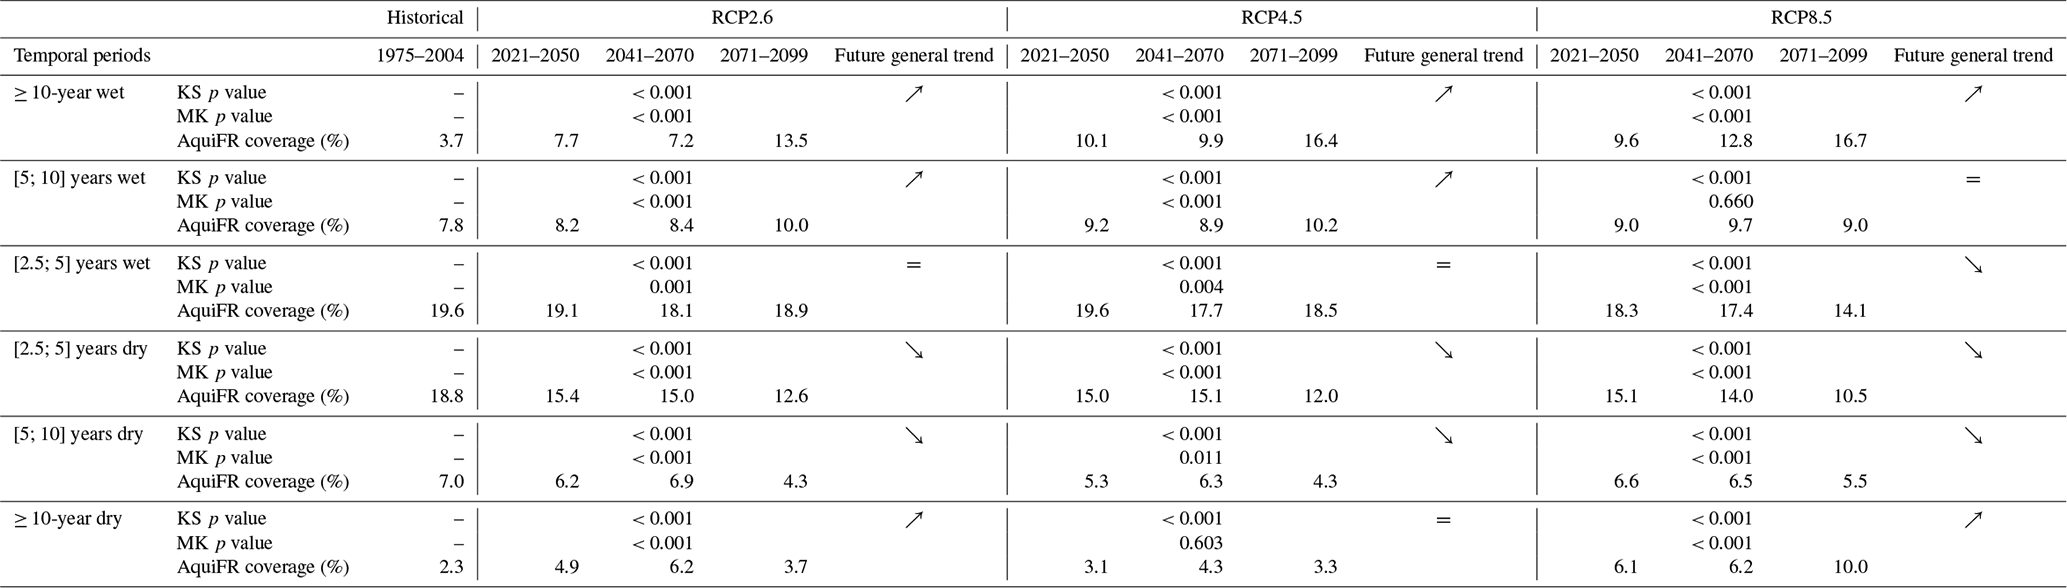
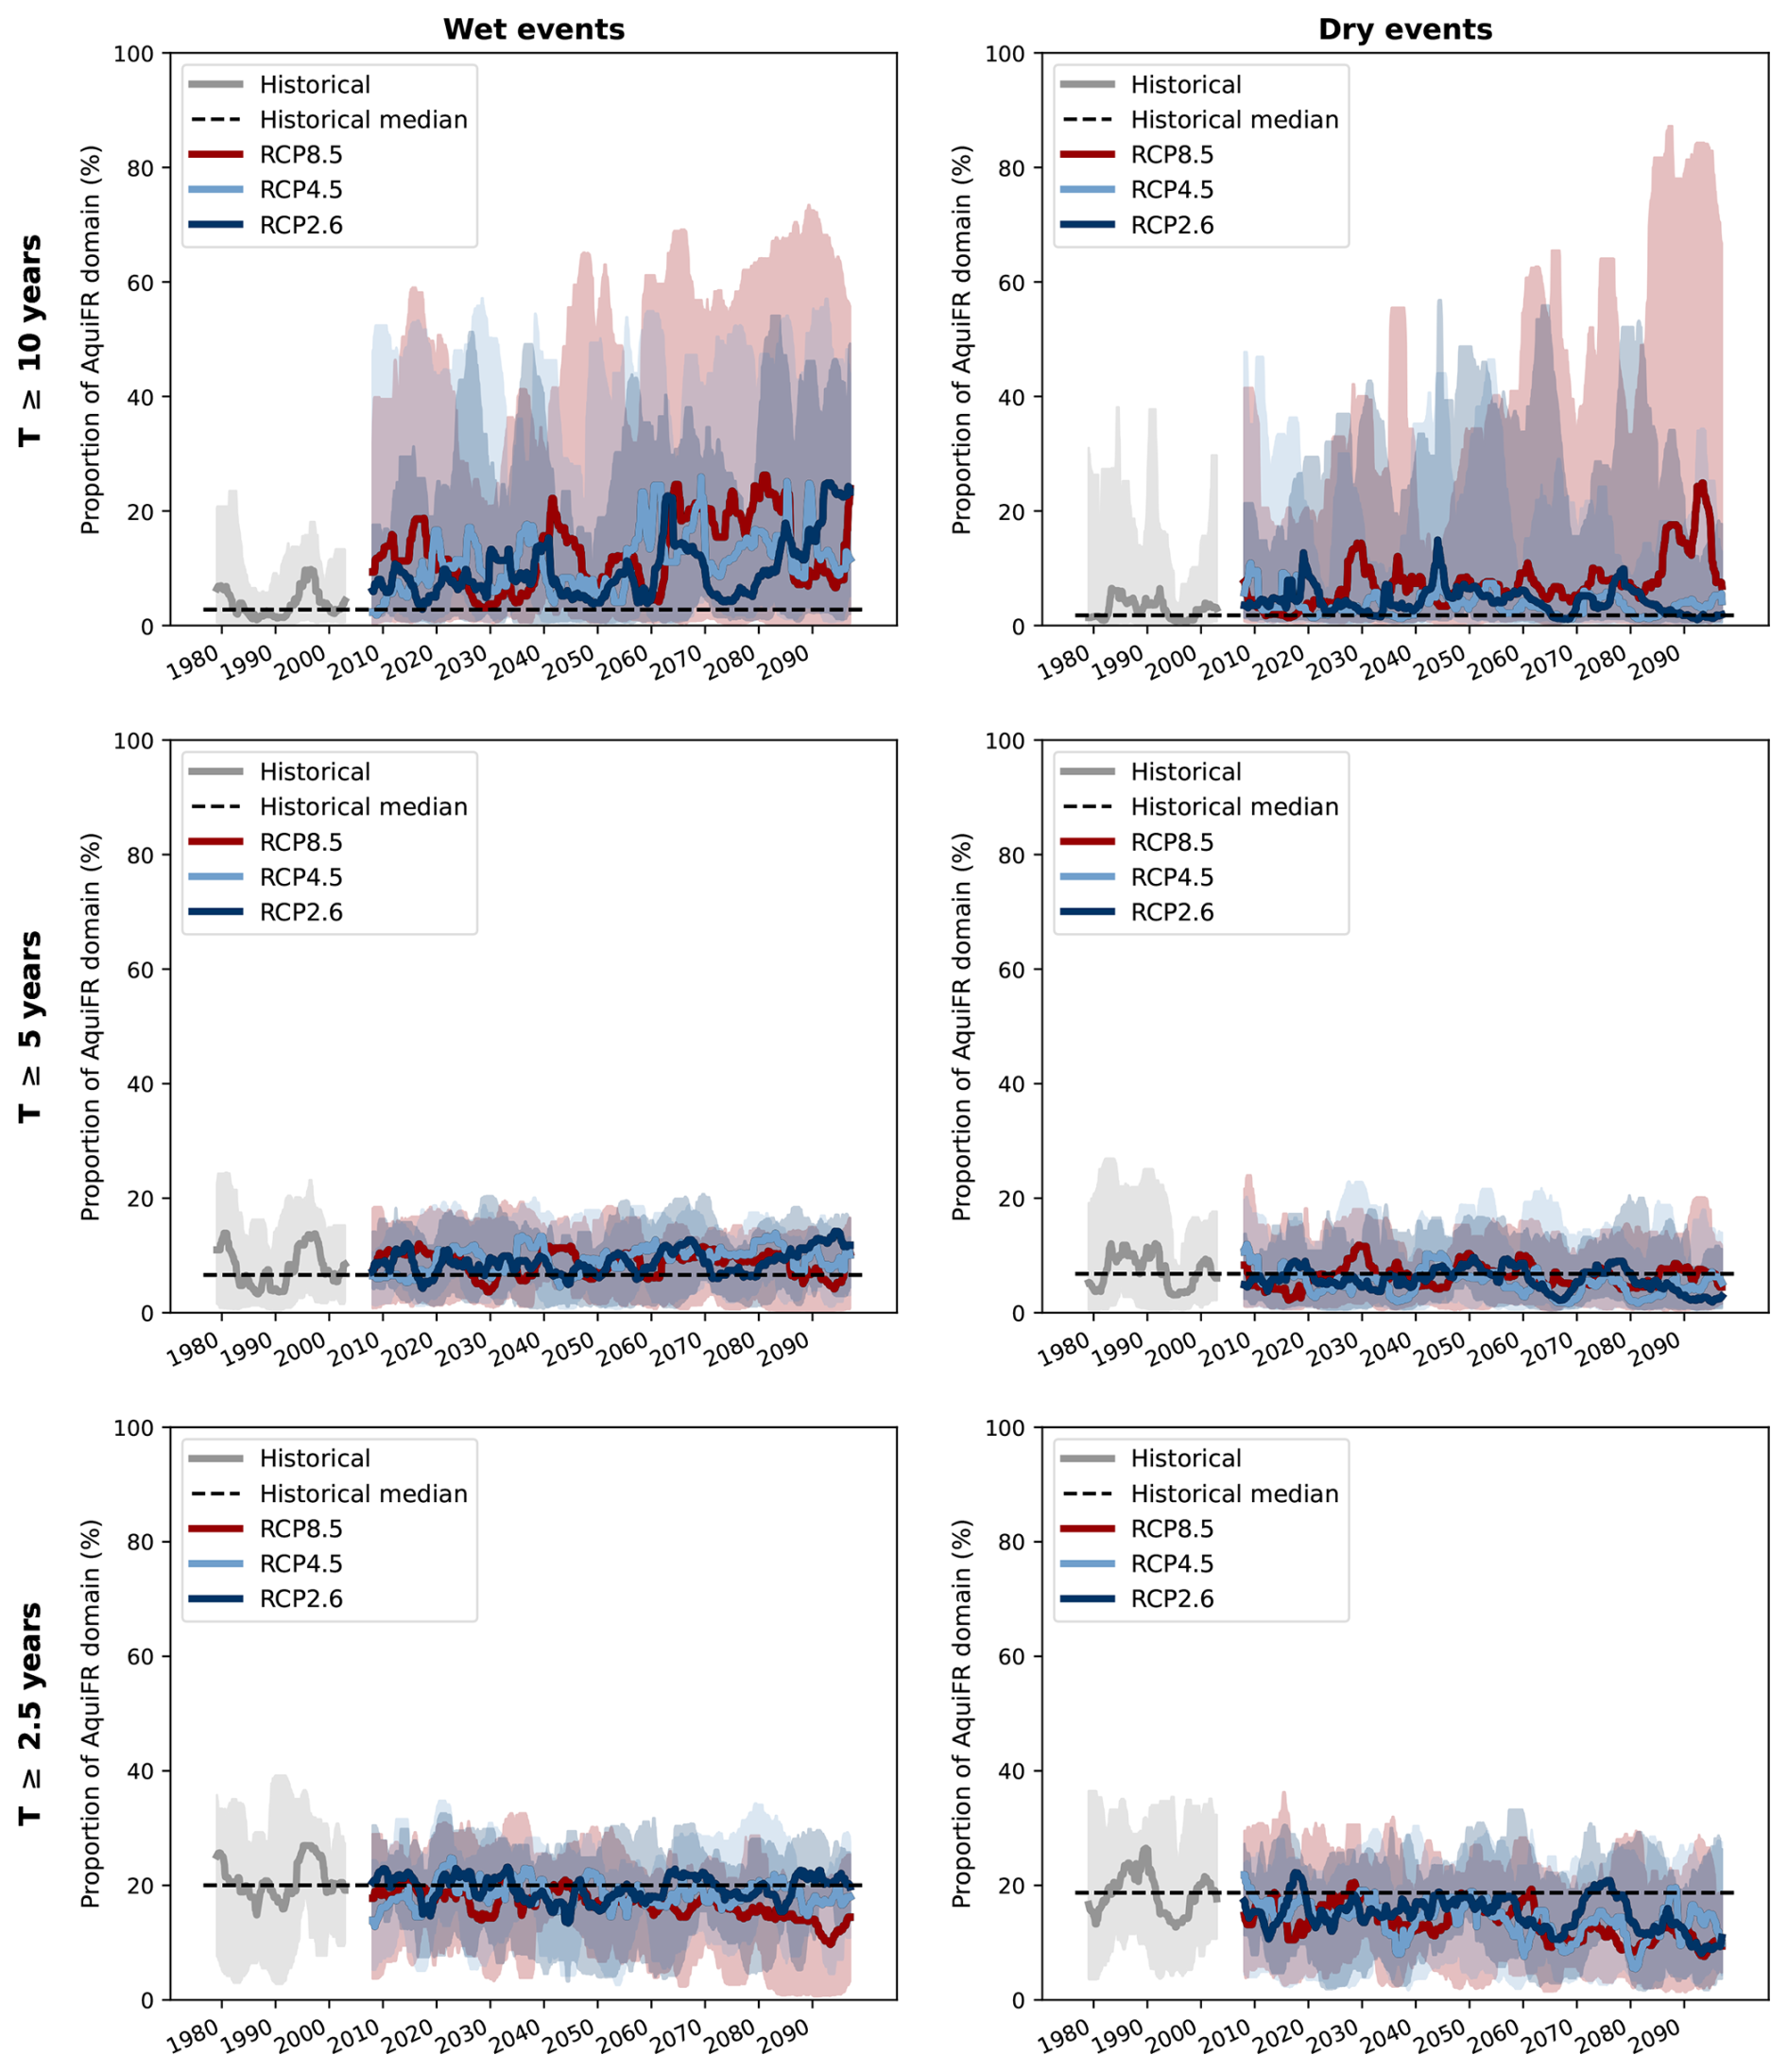
Figure C1Temporal evolution of the 5-year running median of proportion of area from the AquiFR domain affected by the categories of events from Table 2. From top to bottom are represented the 3 return periods, and from left to dry the wet and dry events. The minimum and maximum values over the set of GCM/RCM couples are also plotted. The gap between the historical curve (in grey) and the future curves under the three RCPs corresponds to the exclusion of the 2003–2007 period centred on 2005 in the calculation of running medians (see Sect. 2.3). The dashed black line represents the median value over the historical period gathering all the available projections.
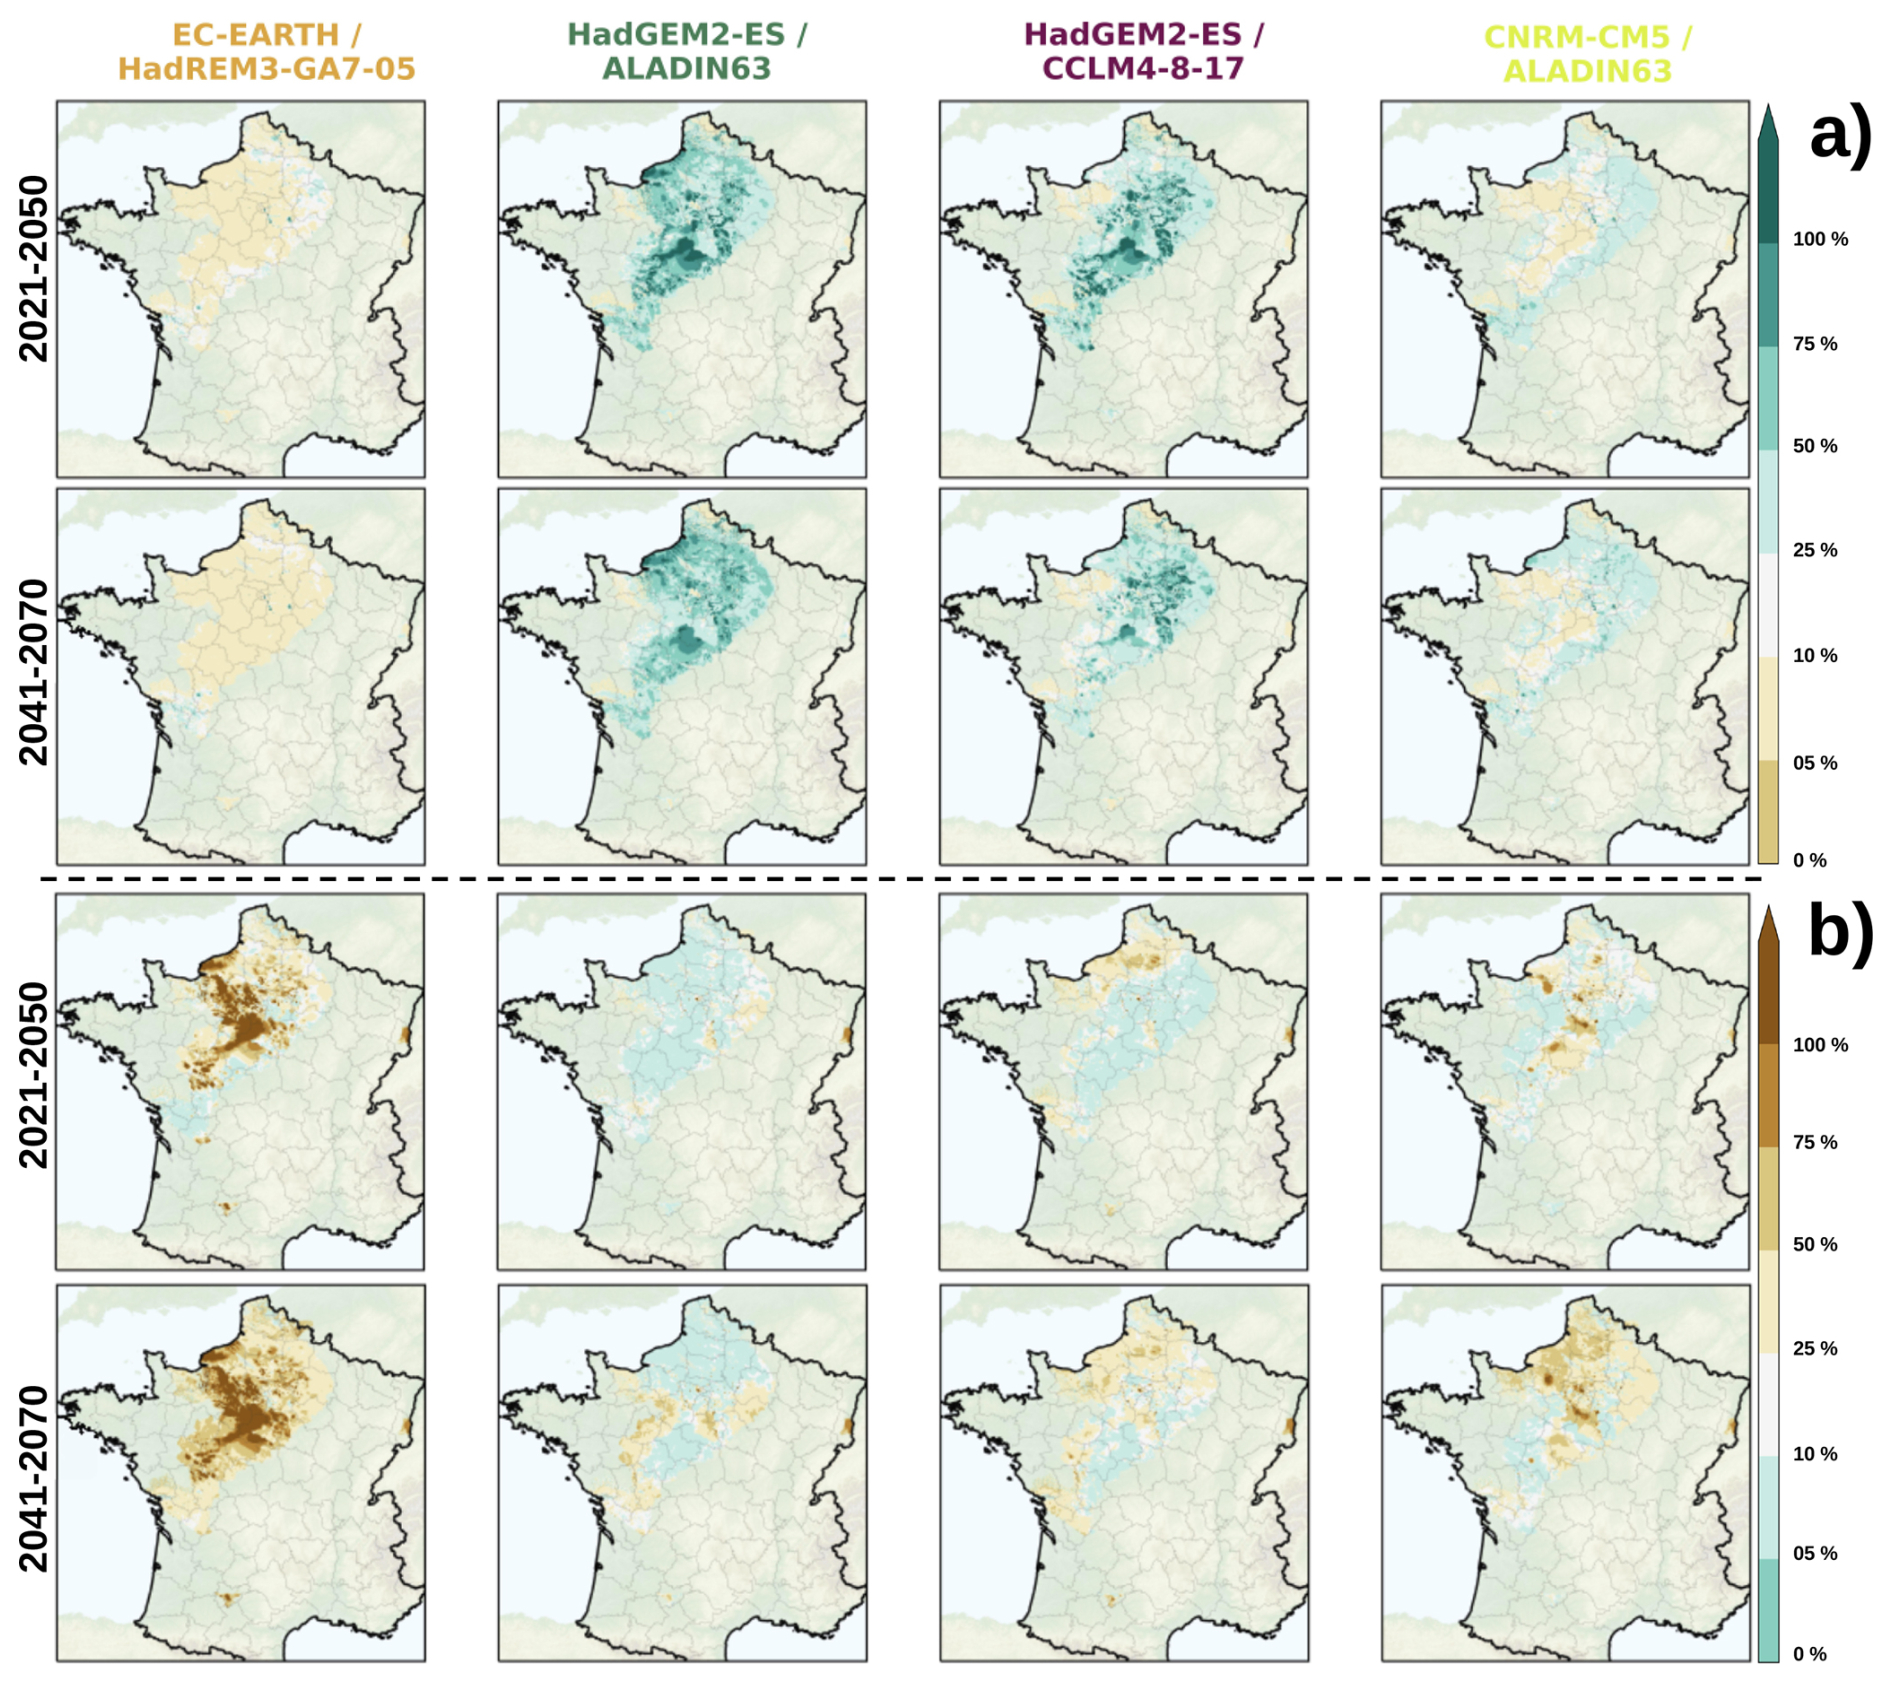
Figure C2Spatial distribution of the median of the time proportion corresponding to extreme wet events (SPLI > +1.28, a) and extreme dry events (SPLI < −1.28, b) for the short-term and intermediate horizons (in line) for the four storylines (in column).
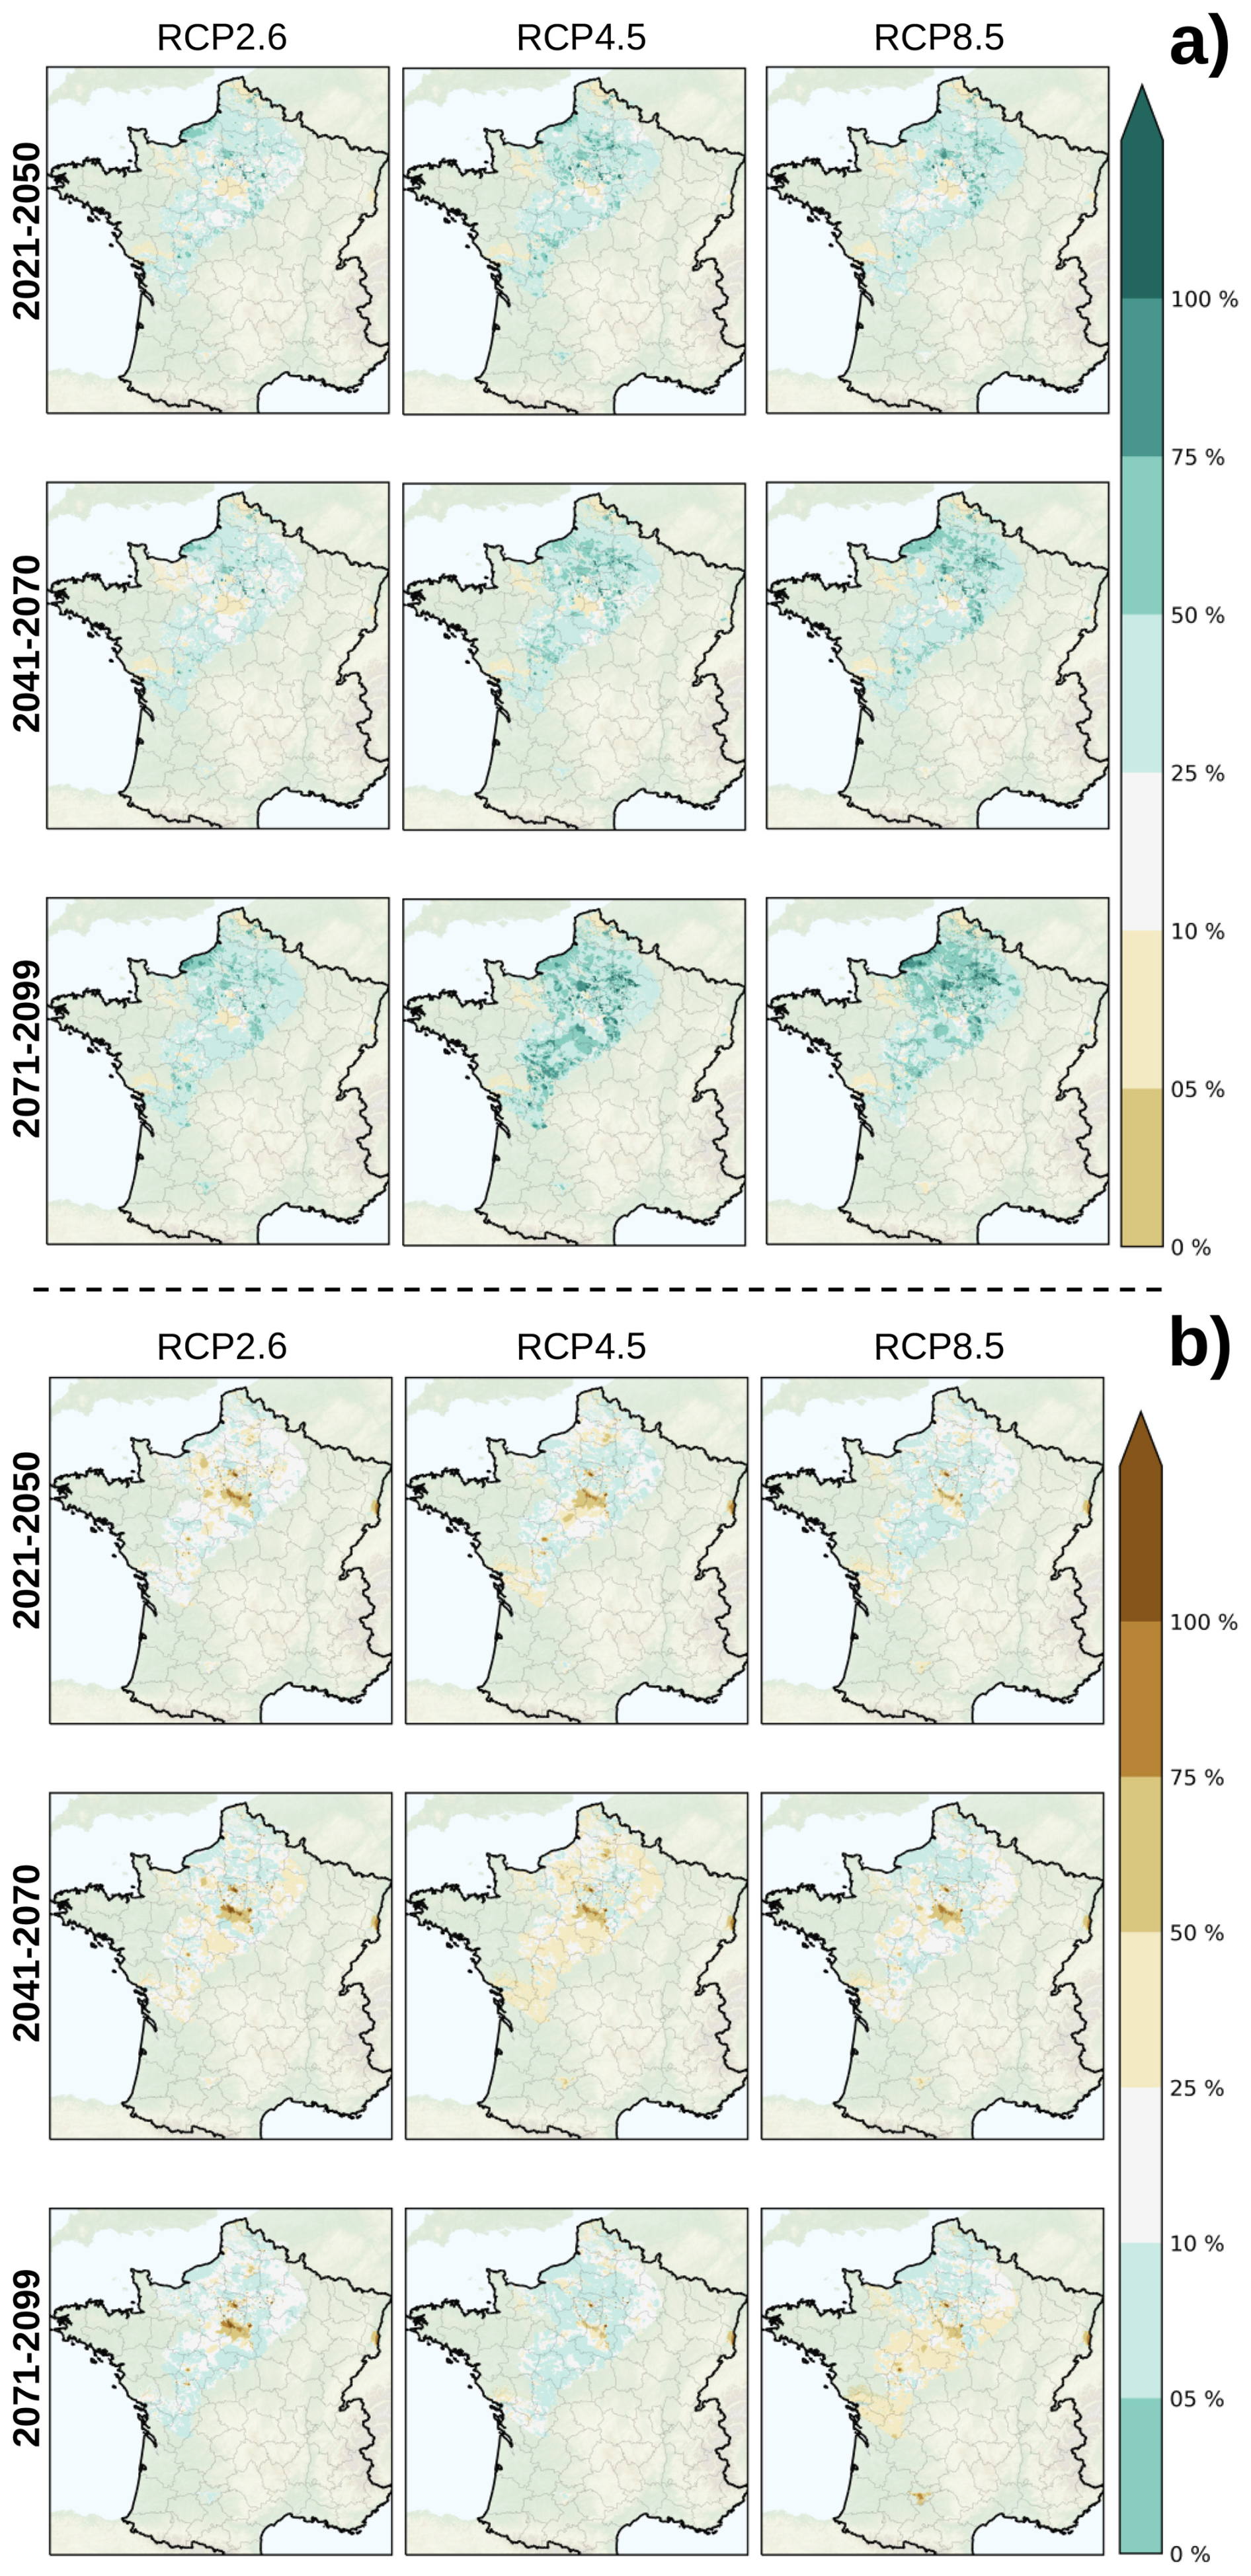
Figure C3Spatial distribution of the median of the time proportion corresponding to extreme wet events (SPLI > +1.28, a) and extreme dry events (SPLI < −1.28, b) per future horizon (in line) and per RCP (in column), from all the CPs.
The elements from Appendix D are related to the analyses performed on four variables from the water balance, i.e., the total rainfall from the CPs and three variables simulated by SURFEX (real evapotranspiration, drainage and runoff), which contributes the most to the groundwater recharge.
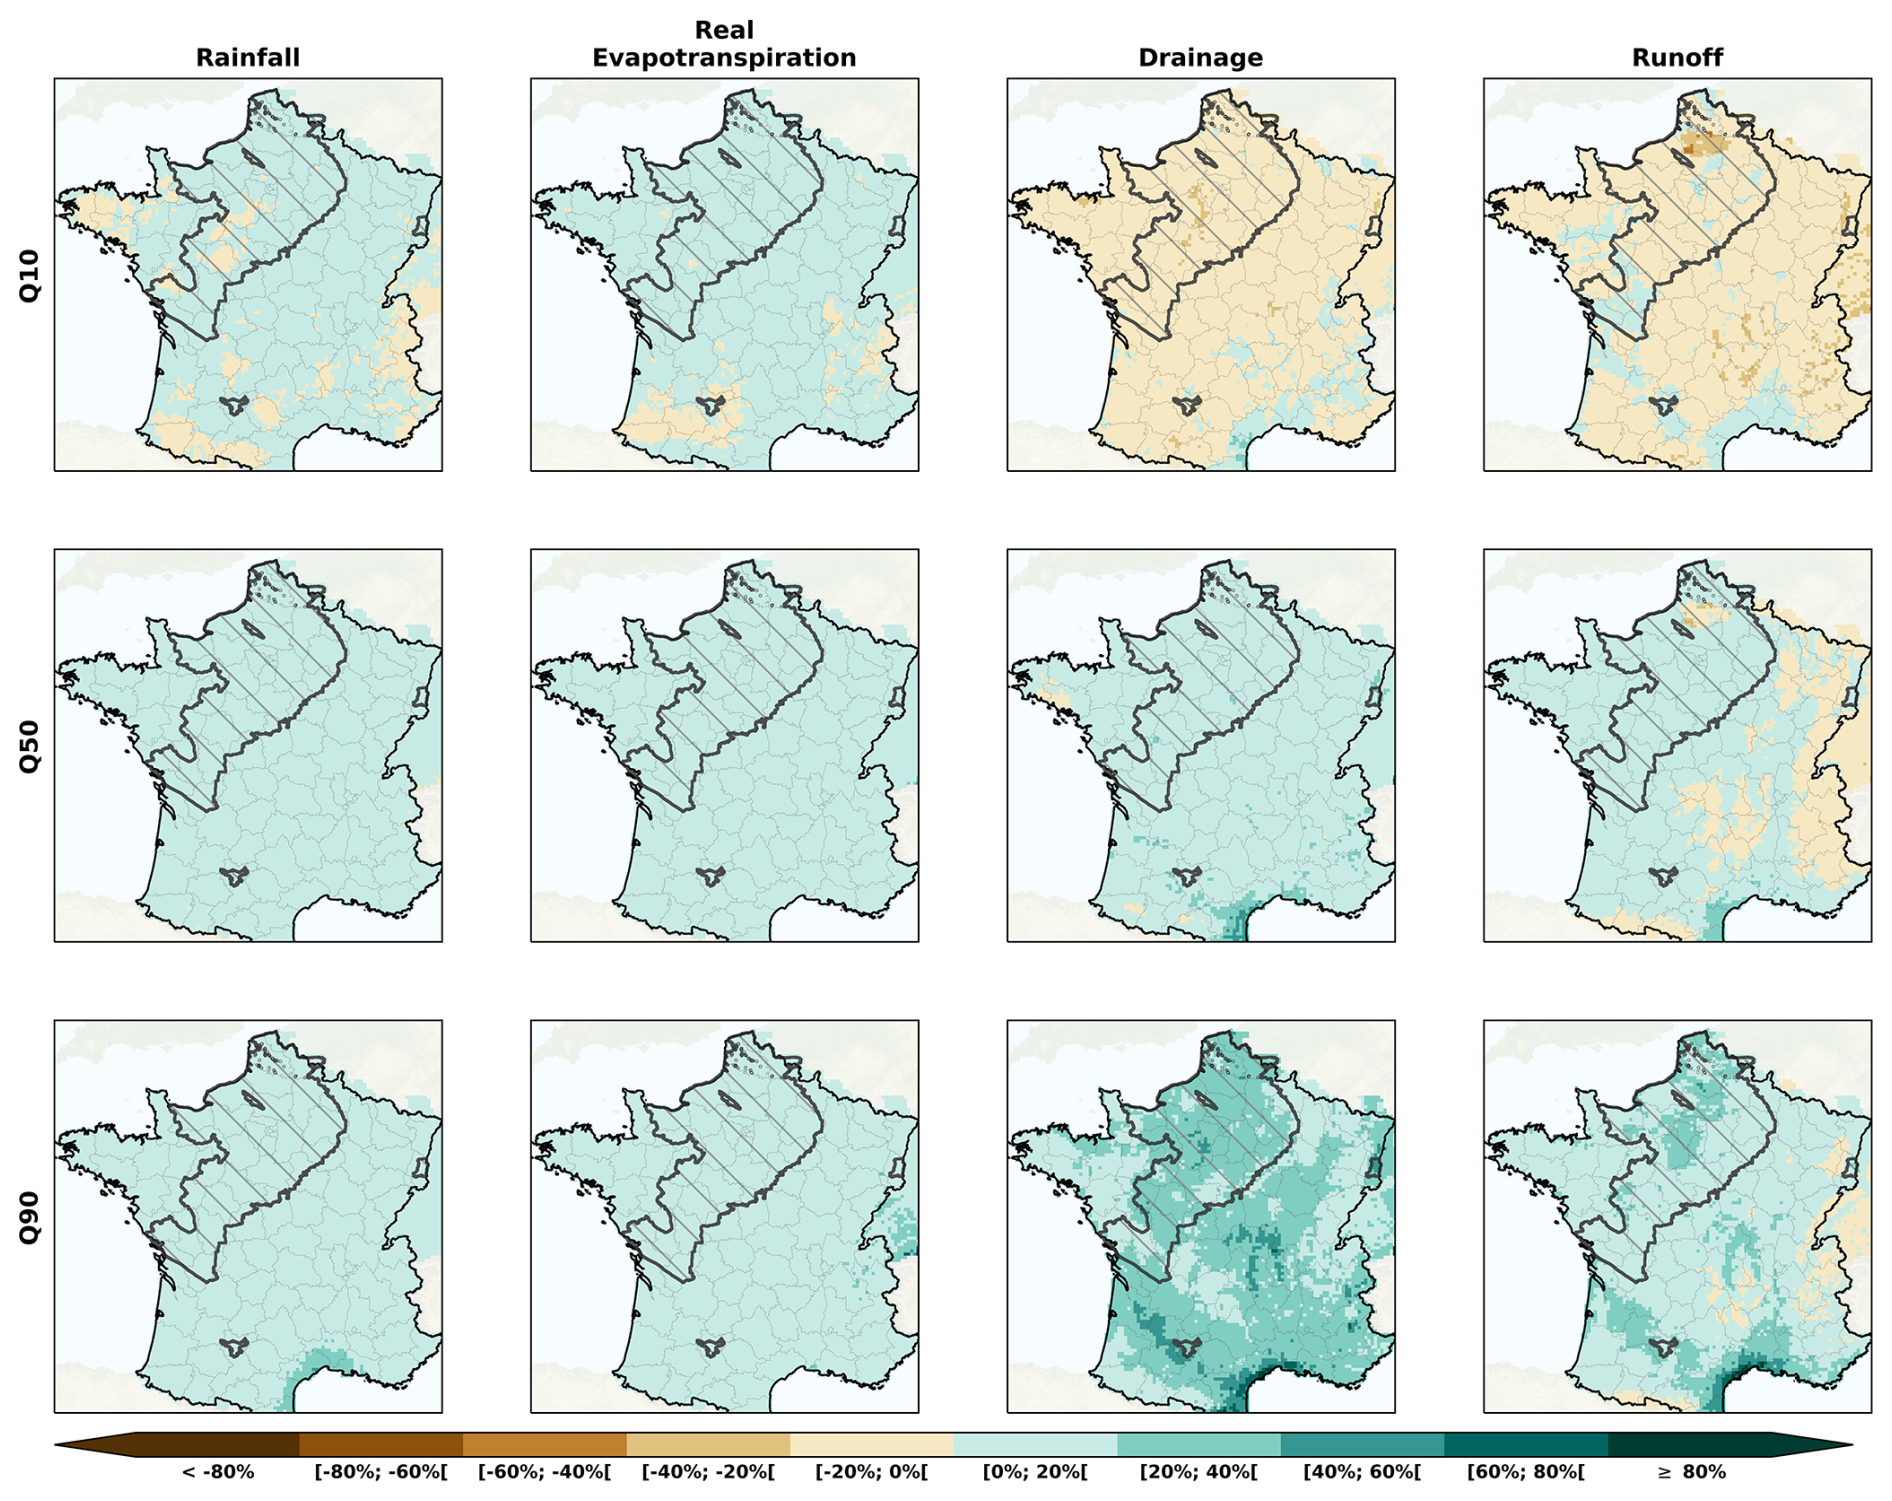
Figure D1Spatial distribution of the total rainfall (1st column) from the CPs for the RCP2.6, and of the real evapotranspiration (2nd column), the drainage (3rd column) and the runoff (4th column) simulated by the land surface model SURFEX. The results are represented by the quantiles Q10, Q50 and Q90 from all the CPs over the long-term horizon (2071–2099).
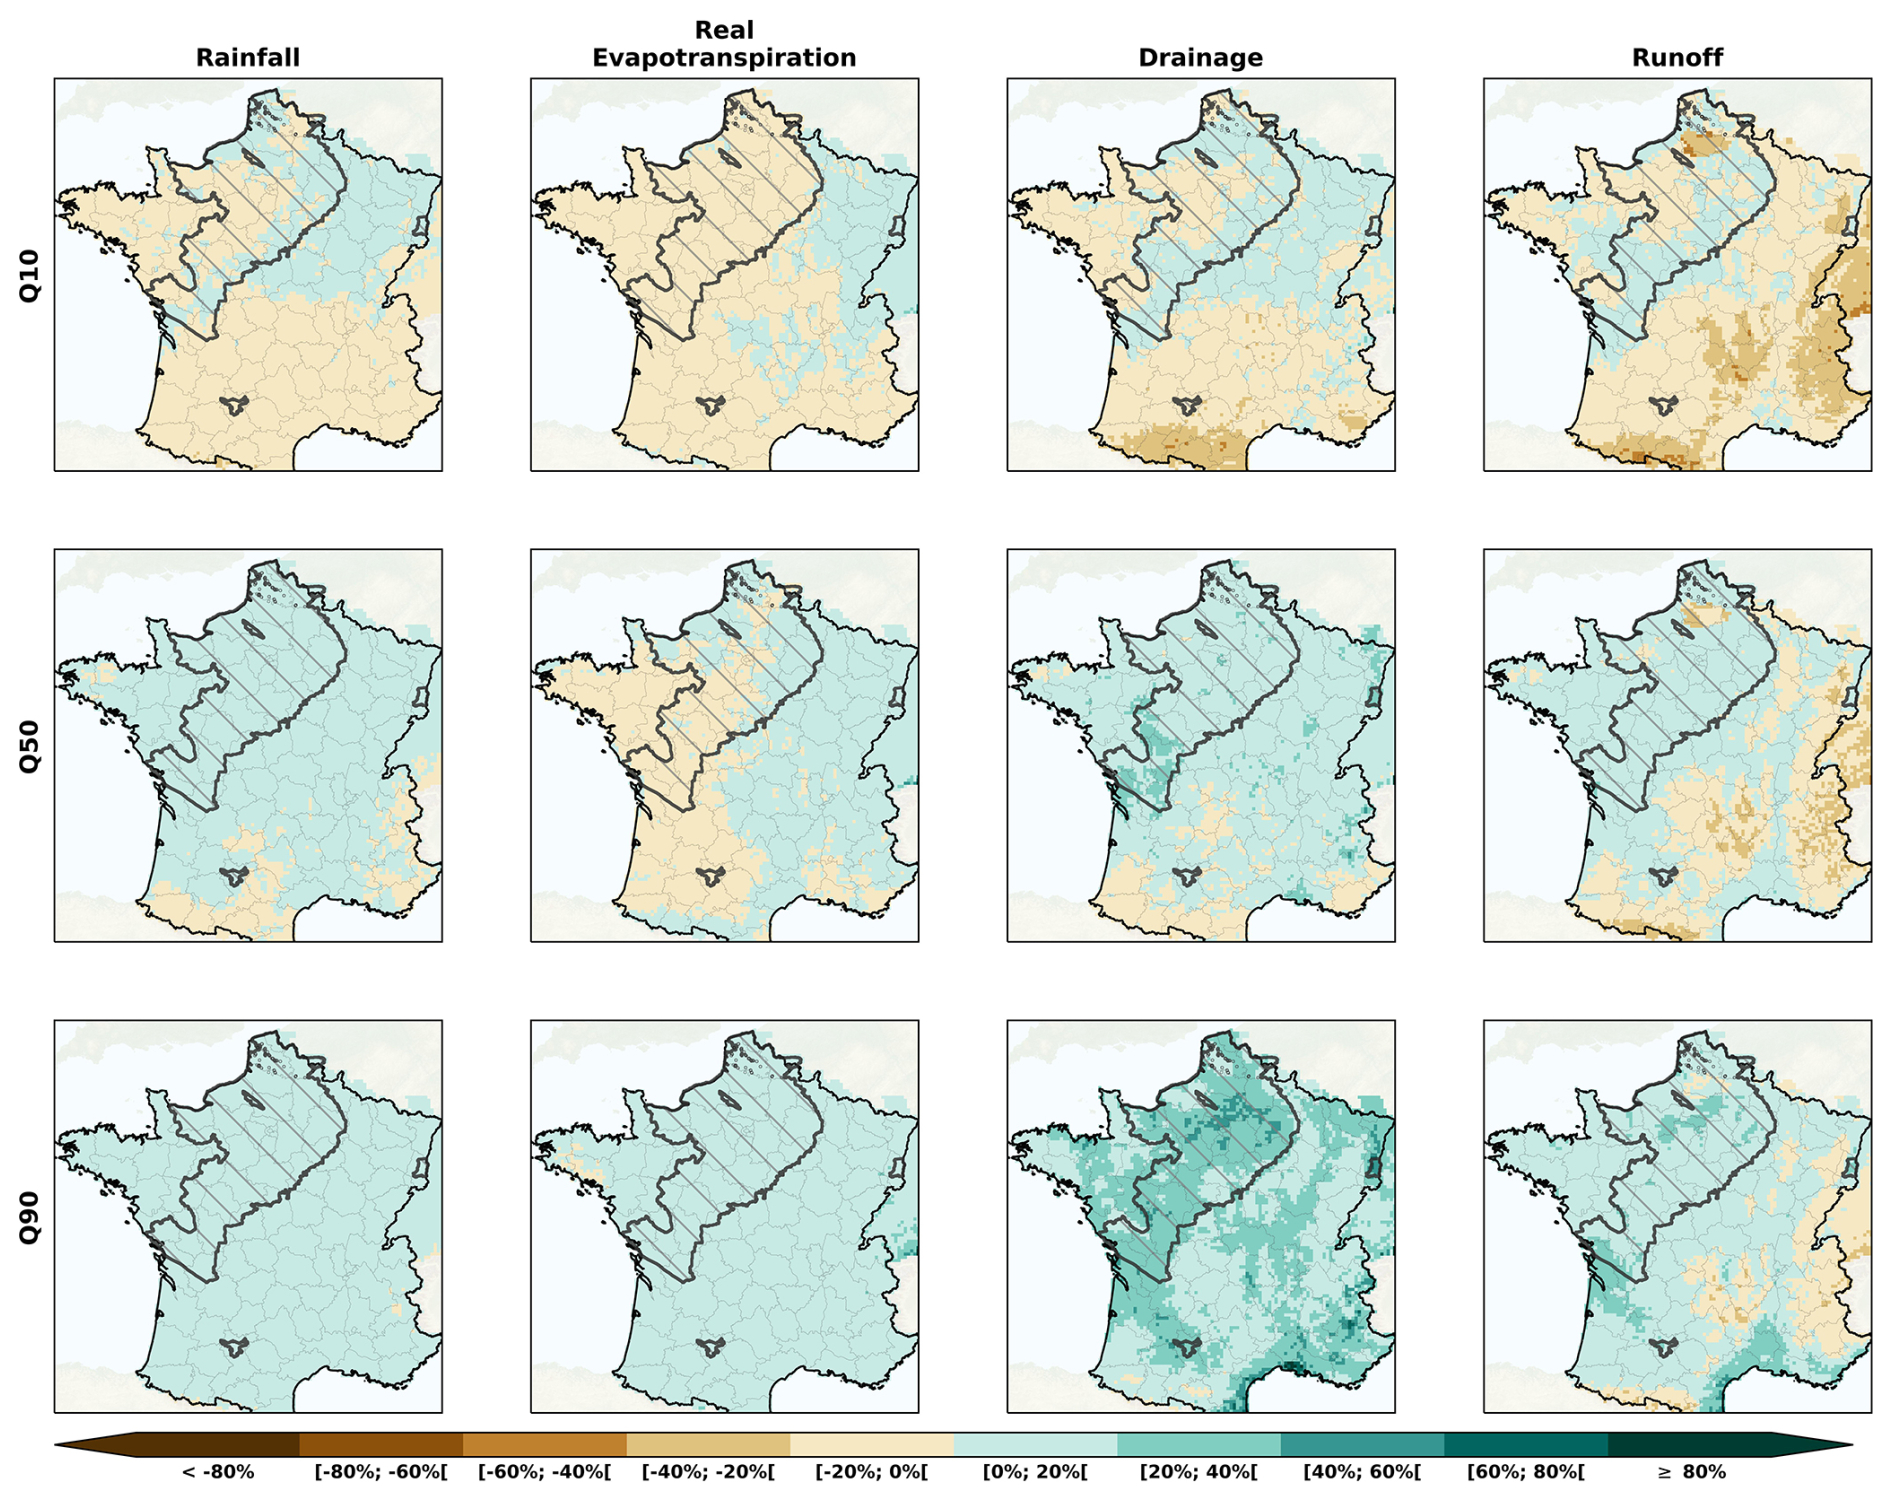
Figure D2Spatial distribution of the total rainfall (1st column) from the CPs for the RCP4.5, and of the real evapotranspiration (2nd column), the drainage (3rd column) and the runoff (4th column) simulated by the land surface model SURFEX. The results are represented by the quantiles Q10, Q50 and Q90 from all the CPs over the long-term horizon (2071–2099).
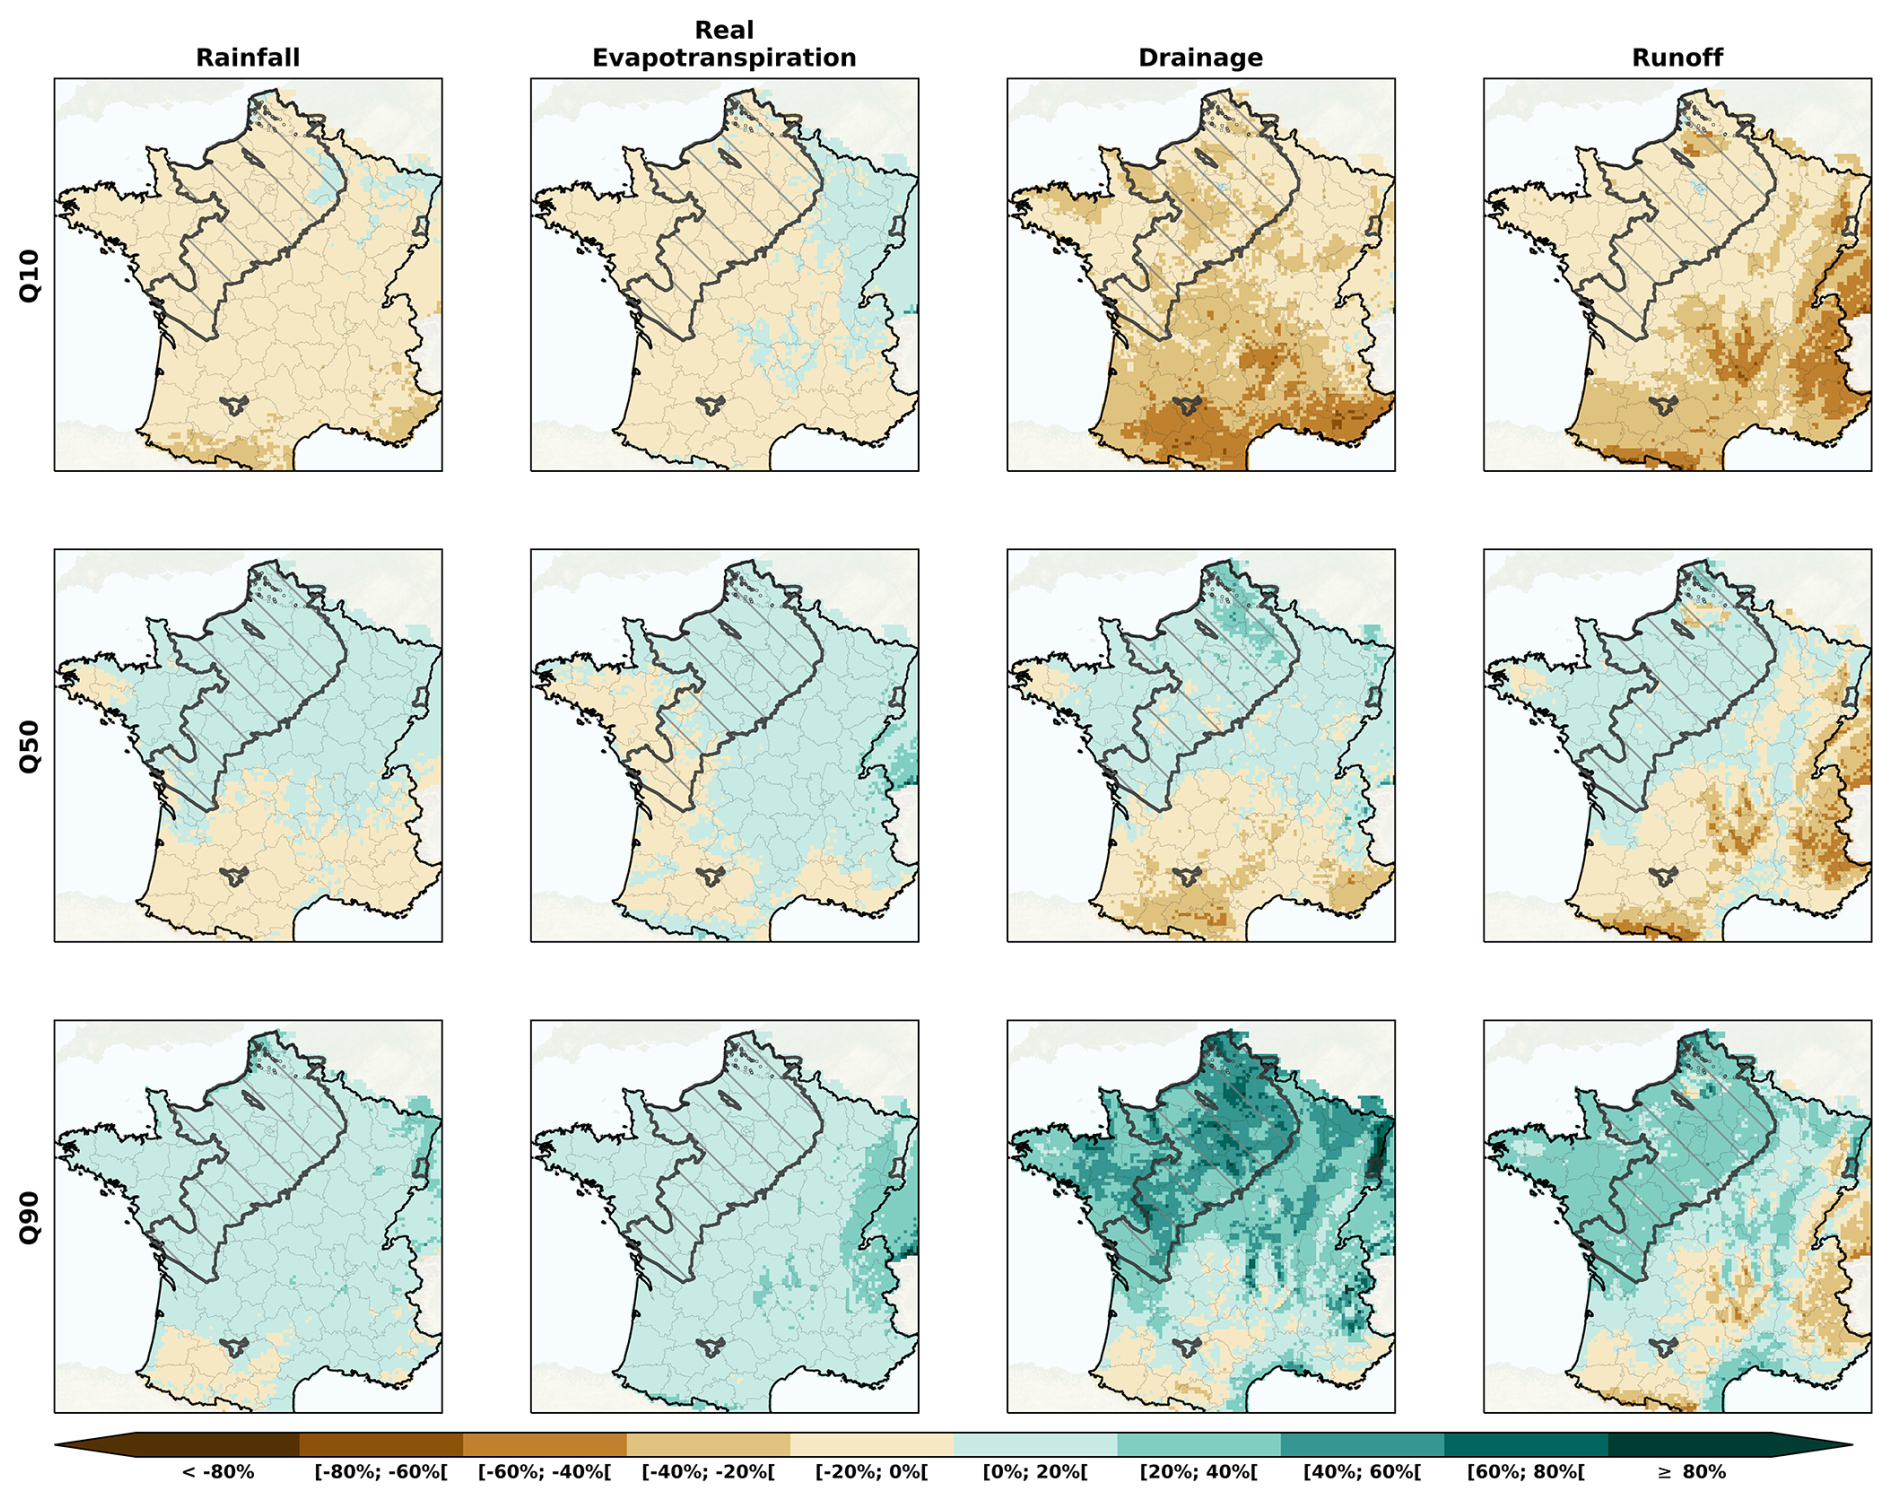
Figure D3Spatial distribution of the total rainfall (1st column) from the CPs for the RCP8.5, and of the real evapotranspiration (2nd column), the drainage (3rd column) and the runoff (4th column) simulated by the land surface model SURFEX. The results are represented by the quantiles Q10, Q50 and Q90 from all the CPs over the long-term horizon (2071–2099).
As part of the AquiFR project led by the OFB (“Office Français pour la Biodiversité” in French for French Office for Biodiversity), the AquiFR modelling platform is not directly hosted on any public repository.
The climate and hydrogeological projections (water table levels and corresponding SPLI values) are available on the DRIAS-Eau database (https://drias-eau.fr/, last access: 25 October 2024).
AJ, JPV, SM and FH conceptualised the work. AJ and JPV performed the simulations and analyses. AJ drafted the paper. JPV, SM and FH all revised the paper and contributed to its analyses and discussions.
The contact author has declared that none of the authors has any competing interests.
Publisher's note: Copernicus Publications remains neutral with regard to jurisdictional claims made in the text, published maps, institutional affiliations, or any other geographical representation in this paper. The authors bear the ultimate responsibility for providing appropriate place names. Views expressed in the text are those of the authors and do not necessarily reflect the views of the publisher.
The authors want to thank the partners of the EXPLORE2 project, which provided the data regarding the climate projections. Especially, the authors want to thank Eric Sauquet for his relevant comments which made this work achievable. Eventually, the authors want also express their gratitude to the Météo-France Meteorological Agency for providing the data used in this work from the SAFRAN database.
This research has been supported by the Office Français de la Biodiversité and the Ministère de l'Écologie, du Développement Durable et de l'Énergie (EXPLORE2 project).
This paper was edited by Heng Dai and reviewed by six anonymous referees.
Baulenas, E., Versteeg, G., Terrado, M., Mindlin, J., and Bojovic, D.: Assembling the climate story: use of storyline approaches in climate-related science, Global Challenges, 7, 2200183, https://doi.org/10.1002/gch2.202200183, 2023. a
Baulon, L., Allier, D., Massei, N., Bessiere, H., Fournier, M., and Bault, V.: Influence de la variabilité basse-fréquence des niveaux piézométriques sur l'occurrence et l'amplitude des extrêmes, Géologues, Société Géologique de France https://hal.science/hal-03138860 (last access: 13 October 2026), 2020. a
Baulon, L., Massei, N., Allier, D., Fournier, M., and Bessiere, H.: Influence of low-frequency variability on high and low groundwater levels: example of aquifers in the Paris Basin, Hydrol. Earth Syst. Sci., 26, 2829–2854, https://doi.org/10.5194/hess-26-2829-2022, 2022. a, b
Birnbaum, Z. W. and Tingey, F. H.: One-Sided Confidence Contours for Probability Distribution Functions, Ann. Math. Stat., 22, 592–596, https://doi.org/10.1214/aoms/1177729550, 1951. a
Bouttier, F. and Marchal, H.: Probabilistic short-range forecasts of high-precipitation events: optimal decision thresholds and predictability limits, Nat. Hazards Earth Syst. Sci., 24, 2793–2816, https://doi.org/10.5194/nhess-24-2793-2024, 2024. a
Boé, J., Radojevic, M., Bonnet, R., and Dayon, G.: Scénarios sécheresse sur le bassin Seine-Normandie, Rapport technique, CECI, CERFACS-CNRS,, Toulouse, France, https://www.drieat.ile-de-france.developpement-durable.gouv.fr/IMG/pdf/rapport_boe_final.pdf (last access: 13 October 2026), 2018. a
Carroget, A., Perrin, C., Sauquet, E., Vidal, J.-P., Chazot, S., Rouchy, N., and Chauveau, M.: Explore 2070 : quelle utilisation d’un exercice prospectif sur les impacts des changements climatiques à l’échelle nationale pour définir des stratégies d’adaptation ?, Sciences Eaux & Territoires, Numéro 22, 4–11, https://doi.org/10.3917/set.022.0004, 2017. a, b, c
Chauveau, M., Chazot, S., Perrin, C., Bourgin, P.-Y., Sauquet, E., Vidal, J.-P., Rouchy, N., Martin, E., David, J., Norotte, T., Maugis, P., and De Lacaze, X.: Quels impacts des changements climatiques sur les eaux de surface en France à l’horizon 2070 ?, La Houille Blanche, 99, 5–15, https://doi.org/10.1051/lhb/2013027, 2013. a
Chery, L. and Cattan, A.: ADES : la banque de données nationale sur les eaux souterraines, La Houille Blanche, 89, 115–119, https://doi.org/10.1051/lhb/2003038, 2003. a
Costantini, M., Colin, J., and Decharme, B.: Projected Climate-Driven Changes of Water Table Depth in the World's Major Groundwater Basins, Earth's Future, 11, 1–16, https://doi.org/10.1029/2022EF003068, 2023. a
David, C. H., Habets, F., Maidment, D. R., and Yang, Z.-L.: RAPID applied to the SIM-France model, Hydrol. Process., 25, 3412–3425, https://doi.org/10.1002/hyp.8070, 2011. a
Dayon, G., Boé, J., Martin, E., and Gailhard, J.: Impacts of climate change on the hydrological cycle over France and associated uncertainties, Comptes Rendus, Géoscience, 350, 141–153, https://doi.org/10.1016/j.crte.2018.03.001, 2018. a, b, c, d
Decharme, B., Delire, C., Minvielle, M., Colin, J., Vergnes, J.-P., Alias, A., Saint-Martin, D., Séférian, R., Sénési, S., and Voldoire, A.: Recent Changes in the ISBA-CTRIP Land Surface System for Use in the CNRM-CM6 Climate Model and in Global Off-Line Hydrological Applications, J. Adv. Model. Earth Syst., 11, 1207–1252, https://doi.org/10.1029/2018MS001545, 2019. a, b
Driouech, F., Déqué, M., and Sánchez-Gómez, E.: Weather regimes – Moroccan precipitation link in a regional climate change simulation, Glob. Planet. Change, 72, 1–10, https://doi.org/10.1016/j.gloplacha.2010.03.004, 2010. a
Evin, G., Hingray, B., Blanchet, J., Eckert, N., Morin, S., and Verfaillie, D.: Partitioning Uncertainty Components of an Incomplete Ensemble of Climate Projections Using Data Augmentation, J. Clim., 32, 2423–2440, https://doi.org/10.1175/JCLI-D-18-0606.1, 2019. a, b
Evin, G., Reverdy, A., and Hingray, B.: Ensemble de projections Explore2 : changements moyens et incertitudes associés, Rapport final, IGE, INRAE, CNRS, Grenoble, France, https://doi.org/10.57745/KCOWZO, 2024. a, b, c
Evin, G., Hingray, B., Thirel, G., Ducharne, A., Strohmenger, L., Corre, L., Tramblay, Y., Vidal, J.-P., Bonneau, J., Colleoni, F., Gailhard, J., Habets, F., Hendrickx, F., Héraut, L., Huang, P., Le Lay, M., Magand, C., Marson, P., Monteil, C., Munier, S., Reverdy, A., Soubeyroux, J.-M., Robin, Y., Vergnes, J.-P., Vrac, M., and Sauquet, E.: Uncertainty sources in a large ensemble of hydrological projections: Regional Climate Models and Internal Variability matter, EGUsphere [preprint], https://doi.org/10.5194/egusphere-2025-2727, 2025. a, b
Fereday, D., Chadwick, R., Knight, J., and Scaife, A. A.: Atmospheric Dynamics is the Largest Source of Uncertainty in Future Winter European Rainfall, J. Clim., 31, 963–977, https://doi.org/10.1175/JCLI-D-17-0048.1, 2018. a
Garner, G., Van Loon, A. F., Prudhomme, C., and Hannah, D. M.: Hydroclimatology of extreme river flows, Freshwater Biol., 60, 2461–2476, https://doi.org/10.1111/fwb.12667, 2015. a
Goubanova, K. and Li, L.: Extremes in temperature and precipitation around the Mediterranean basin in an ensemble of future climate scenario simulations, Glob. Planet. Change, 57, 27–42, https://doi.org/10.1016/j.gloplacha.2006.11.012, 2007. a
Guillaumot, L., Smilovic, M., Burek, P., de Bruijn, J., Greve, P., Kahil, T., and Wada, Y.: Coupling a large-scale hydrological model (CWatM v1.1) with a high-resolution groundwater flow model (MODFLOW 6) to assess the impact of irrigation at regional scale, Geosci. Model Dev., 15, 7099–7120, https://doi.org/10.5194/gmd-15-7099-2022, 2022. a
Guillaumot, L., Munier, S., Abhervé, R., Vergnes, J.-P., Jeantet, A., Le Moigne, P., and Habets, F.: Are regional groundwater models suitable for simulating wetlands, rivers and intermittence? The example of the French AquiFR platform, J. Hydrol., 644, 132019, https://doi.org/10.1016/j.jhydrol.2024.132019, 2024. a, b, c
Habets, F., Boé, J., Déqué, M., Ducharne, A., Gascoin, S., Hachour, A., Martin, E., Pagé, C., Sauquet, E., Terray, L., Thiéry, D., Oudin, L., and Viennot, P.: Impact of climate change on the hydrogeology of two basins in northern France, Climatic Change, 121, 771–785, https://doi.org/10.1007/s10584-013-0934-x, 2013. a, b, c, d
Habets, F., Amraoui, N., Thiéry, D., Vergnes, J.-P., Morel, T., Le Moigne, P., Munier, S., Leroux, D., de Dreuzy, J.-R., Longuevergne, L., Ackerer, P., Besson, F., Etchevers, P., Rousset, F., Willemet, J.-M., Viennot, P., and Gallois, N.: Plateforme de modélisation hydrogéologique nationale AQUI-FR, Rapport final de 2ème phase, OFB, Paris, France, https://hal.science/hal-04006877 (last access: 13 October 2026), 2021. a, b, c, d, e, f, g
Hawkins, E. and Sutton, R.: The Potential to Narrow Uncertainty in Regional Climate Predictions, Bull. Am. Meteorol. Soc., 90, 1095–1108, https://doi.org/10.1175/2009BAMS2607.1, 2009. a
Hingray, B. and Saïd, M.: Partitioning Internal Variability and Model Uncertainty Components in a Multimember Multimodel Ensemble of Climate Projections, J. Clim., 27, 6779–6798, https://doi.org/10.1175/JCLI-D-13-00629.1, 2014. a
Hingray, B., Blanchet, J., Evin, G., and Vidal, J.-P.: Uncertainty component estimates in transient climate projections, Clim. Dynam., 53, 2501–2516, https://doi.org/10.1007/s00382-019-04635-1, 2019. a
Højberg, A. L., Troldborg, L., Stisen, S., Christensen, B. B. S., and Henriksen, H. J.: Stakeholder driven update and improvement of a national water resources model, Environ. Model. Softw., 40, 202–213, https://doi.org/10.1016/j.envsoft.2012.09.010, 2013. a
IPCC: Climate Change 2014 : Impacts, Adaptation, and Vulnerability. Part A: Global and Sectoral Aspects. Contribution of Working Group II to the Fifth Assessment Report of the Intergovernmental Panel on Climate Change, Final Report, Cambridge University Pres, Cambridge, United Kingdom and New York, NY, USA, Intergovernmental Panel on Climate Change (IPCC), ISBN 978-1-107-64165-5, 2014. a, b, c
IPCC: Climate Change 2022 : Impacts, Adaptation and Vulnerability: Working Group II Contribution to the Sixth Assessment Report of the Intergovernmental Panel on Climate Change, Final Report, Cambridge University Pres, Cambridge, United Kingdom and New York, NY, USA, publisher: Intergovernmental Panel on Climate Change (IPCC), https://doi.org/10.1017/9781009325844, 2022. a, b, c
Jacob, D., Teichmann, C., Sobolowski, S., Katragkou, E., Anders, I., Belda, M., Benestad, R., Boberg, F., Buonomo, E., Cardoso, R. M., Casanueva, A., Christensen, O. B., Christensen, J. H., Coppola, E., De Cruz, L., Davin, E. L., Dobler, A., Domínguez, M., Fealy, R., Fernandez, J., Gaertner, M. A., García-Díez, M., Giorgi, F., Gobiet, A., Goergen, K., Gómez-Navarro, J. J., Alemán, J. J. G., Gutiérrez, C., Gutiérrez, J. M., Güttler, I., Haensler, A., Halenka, T., Jerez, S., Jiménez-Guerrero, P., Jones, R. G., Keuler, K., Kjellström, E., Knist, S., Kotlarski, S., Maraun, D., van Meijgaard, E., Mercogliano, P., Montávez, J. P., Navarra, A., Nikulin, G., de Noblet-Ducoudré, N., Panitz, H.-J., Pfeifer, S., Piazza, M., Pichelli, E., Pietikäinen, J.-P., Prein, A. F., Preuschmann, S., Rechid, D., Rockel, B., Romera, R., Sánchez, E., Sieck, K., Soares, P. M. M., Somot, S., Srnec, L., Sørland, S. L., Termonia, P., Truhetz, H., Vautard, R., Warrach-Sagi, K., and Wulfmeyer, V.: Regional climate downscaling over Europe: perspectives from the EURO-CORDEX community, Reg. Environ. Change, 20, 51, https://doi.org/10.1007/s10113-020-01606-9, 2020. a, b
Jaouen, T., Benoit, L., Héraut, L., and Sauquet, E.: Will rivers become more intermittent in France? Learning from an extended set of hydrological projections, Hydrol. Earth Syst. Sci., 29, 3629–3671, https://doi.org/10.5194/hess-29-3629-2025, 2025. a
Jeantet, A., Thirel, G., Lemaitre-Basset, T., and Tournebize, J.: Uncertainty propagation in a modelling chain of climate change impact for a representative French drainage site, Hydrol. Sci. J., 68, 1426–1442, https://doi.org/10.1080/02626667.2023.2203322, 2023. a
Kendall, M. G.: Rank Correlation Methods, London (UK), charles griffin and co. edn., 1948. a
Kennel, C. F., Briggs, S., and Victor, D. G.: Making climate science more relevant, Science, 354, 421–422, https://doi.org/10.1126/science.aag3248, 2016. a
Knutti, R., Masson, D., and Gettelman, A.: Climate model genealogy: Generation CMIP5 and how we got there, Geophys. Res. Lett., 40, 1194–1199, https://doi.org/10.1002/grl.50256, 2013. a, b
Kundzewicz, Z. W., Kanae, S., Seneviratne, S. I., Handmer, J., Nicholls, N., Peduzzi, P., Mechler, R., Bouwer, L. M., Arnell, N., Mach, K., Muir-Wood, R., Brakenridge, G. R., Kron, W., Benito, G., Honda, Y., Takahashi, K., and Sherstyukov, B.: Flood risk and climate change: global and regional perspectives, Hydrol. Sci. J., 59, 1–28, https://doi.org/10.1080/02626667.2013.857411, 2014. a
Lafaysse, M., Hingray, B., Mezghani, A., Gailhard, J., and Terray, L.: Internal variability and model uncertainty components in future hydrometeorological projections: The Alpine Durance basin, Water Resour. Res., 50, 3317–3341, https://doi.org/10.1002/2013WR014897, 2014. a
Lanini, S., Robelin, O., Caballero, Y., and Sauquet, E.: Projections hydrologiques souterraines : recharge potentielle des aquifères, Rapport final, BRGM, INRAE, Orléans, France, https://doi.org/10.57745/ZQPNIE, 2024. a, b
Le Moigne, P., Besson, F., Martin, E., Boé, J., Boone, A., Decharme, B., Etchevers, P., Faroux, S., Habets, F., Lafaysse, M., Leroux, D., and Rousset-Regimbeau, F.: The latest improvements with SURFEX v8.0 of the Safran–Isba–Modcou hydrometeorological model for France, Geosci. Model Dev., 13, 3925–3946, https://doi.org/10.5194/gmd-13-3925-2020, 2020. a, b, c, d, e
Ledoux, E., Girard, G., de Marsily, G., Villeneuve, J. P., and Deschenes, J.: Spatially Distributed Modeling: Conceptual Approach, Coupling Surface Water And Groundwater, in: Unsaturated Flow in Hydrologic Modeling: Theory and Practice, edited by: Morel-Seytoux, H. J., NATO ASI Series, 435–454, Springer Netherlands, Dordrecht, ISBN 978-94-009-2352-2, https://doi.org/10.1007/978-94-009-2352-2_16, 1989. a
Lemaitre-Basset, T., Collet, L., Thirel, G., Parajka, J., Evin, G., and Hingray, B.: Climate change impact and uncertainty analysis on hydrological extremes in a French Mediterranean catchment, Hydrol. Sci. J., 66, 888–903, https://doi.org/10.1080/02626667.2021.1895437, 2021. a, b
Liang, X.-Z., Kunkel, K. E., Meehl, G. A., Jones, R. G., and Wang, J. X. L.: Regional climate models downscaling analysis of general circulation models present climate biases propagation into future change projections, Geophys. Res. Lett., 35, https://doi.org/10.1029/2007GL032849, 2008. a
Mann, H. B.: Nonparametric Tests Against Trend, Econometrica, 13, 245–259, https://doi.org/10.2307/1907187, 1945. a
Marson, P., Soubeyroux, J.-M., Corre, L., Samacoïts, R., Sauquet, E., Robin, Y., and Vrac, M.: The Explore2 – 2022 climate projections dataset for impact studies over France, Data in Brief, 66, 112659, https://doi.org/10.1016/j.dib.2026.112659, 2026. a, b, c, d, e, f, g, h, i, j
Maréchal, J.-C. and Rouillard, J.: Groundwater in France: Resources, Use and Management Issues, in: Sustainable Groundwater Management: A Comparative Analysis of French and Australian Policies and Implications to Other Countries, edited by Rinaudo, J.-D., Holley, C., Barnett, S., and Montginoul, M., Global Issues in Water Policy, 17–45, Springer International Publishing, Cham, ISBN 978-3-030-32766-8, https://doi.org/10.1007/978-3-030-32766-8_2, 2020. a
Masson, V., Le Moigne, P., Martin, E., Faroux, S., Alias, A., Alkama, R., Belamari, S., Barbu, A., Boone, A., Bouyssel, F., Brousseau, P., Brun, E., Calvet, J.-C., Carrer, D., Decharme, B., Delire, C., Donier, S., Essaouini, K., Gibelin, A.-L., Giordani, H., Habets, F., Jidane, M., Kerdraon, G., Kourzeneva, E., Lafaysse, M., Lafont, S., Lebeaupin Brossier, C., Lemonsu, A., Mahfouf, J.-F., Marguinaud, P., Mokhtari, M., Morin, S., Pigeon, G., Salgado, R., Seity, Y., Taillefer, F., Tanguy, G., Tulet, P., Vincendon, B., Vionnet, V., and Voldoire, A.: The SURFEXv7.2 land and ocean surface platform for coupled or offline simulation of earth surface variables and fluxes, Geosci. Model Dev., 6, 929–960, https://doi.org/10.5194/gmd-6-929-2013, 2013. a, b
Maurer, E. P., Hidalgo, H. G., Das, T., Dettinger, M. D., and Cayan, D. R.: The utility of daily large-scale climate data in the assessment of climate change impacts on daily streamflow in California, Hydrol. Earth Syst. Sci., 14, 1125–1138, https://doi.org/10.5194/hess-14-1125-2010, 2010. a
Maxwell, R. M., Condon, L. E., and Kollet, S. J.: A high-resolution simulation of groundwater and surface water over most of the continental US with the integrated hydrologic model ParFlow v3, Geosci. Model Dev., 8, 923–937, https://doi.org/10.5194/gmd-8-923-2015, 2015. a
McKee, T. B., Doesken, N. J., and Kleist, J.: The relationship of drought frequency and duration to time scales, Vol. 17, No. 22, 179–183, California, 8th Conference on Applied Climatology, 17–22 January 1993, Anaheim, California, 1993. a
Meaurio, M., Zabaleta, A., Boithias, L., Epelde, A. M., Sauvage, S., Sánchez-Pérez, J.-M., Srinivasan, R., and Antiguedad, I.: Assessing the hydrological response from an ensemble of CMIP5 climate projections in the transition zone of the Atlantic region (Bay of Biscay), J. Hydrol., 548, 46–62, https://doi.org/10.1016/j.jhydrol.2017.02.029, 2017. a
Meehl, G., Covey, C., Delworth, T., Latif, M., McAvaney, B., Mitchell, J., Stouffer, R., and Taylor, K.: The WCRP CMIP3 multimodel dataset: A new era in climatic change research, Bull. Am. Meteorol. Soc., 88, 1383–1394, https://doi.org/10.1175/BAMS-88-9-1383, 2007. a
Michelangeli, P.-A., Vrac, M., and Loukos, H.: Probabilistic downscaling approaches: Application to wind cumulative distribution functions, Geophys. Res. Lett., 36, https://doi.org/10.1029/2009GL038401, 2009. a, b
Munier, S. and Decharme, B.: River network and hydro-geomorphological parameters at 1/12-degree resolution for global hydrological and climate studies, Earth Syst. Sci. Data, 14, 2239–2258, https://doi.org/10.5194/essd-14-2239-2022, 2022. a
Navarro-Racines, C., Tarapues, J., Thornton, P., Jarvis, A., and Ramirez-Villegas, J.: High-resolution and bias-corrected CMIP5 projections for climate change impact assessments, Sci. Data, 7, 7, https://doi.org/10.1038/s41597-019-0343-8, 2020. a
Noilhan, J. and Planton, S.: A Simple Parameterization of Land Surface Processes for Meteorological Models, Mon. Weather Rev., 117, 536–549, https://doi.org/10.1175/1520-0493(1989)117<0536:ASPOLS>2.0.CO;2, 1989. a
Northrop, P. J. and Chandler, R. E.: Quantifying Sources of Uncertainty in Projections of Future Climate, J. Clim., 27, 8793–8808, https://doi.org/10.1175/JCLI-D-14-00265.1, 2014. a
Nuissier, O., Joly, B., Joly, A., Ducrocq, V., and Arbogast, P.: A statistical downscaling to identify the large-scale circulation patterns associated with heavy precipitation events over southern France, Q. J. Roy. Meteorol. Soc., 137, 1812–1827, https://doi.org/10.1002/qj.866, 2011. a, b
Pasquier, J.-L.: Les prélèvements d’eau douce en France : les grands usages en 2013 et leur évolution depuis 20 ans, Rapport final, Ministère de l'environnement, de l'énergie et de la mer, en charge des relations internationales sur le climat, La Defense, France, 2017. a
Pedregosa, F., Varoquaux, G., Gramfort, A., Michel, V., Thirion, B., Grisel, O., Blondel, M., Prettenhofer, P., Weiss, R., Dubourg, V., Vanderplas, J., Passos, A., Cournapeau, D., Brucher, M., Perrot, M., and Duchesnay, E.: Scikit-learn: Machine Learning in Python, J. Mach. Learn. Res., 12, 2825–2830, 2011. a
Philippe, E., Habets, F., Ledoux, E., Goblet, P., Viennot, P., and Mary, B.: Improvement of the solute transfer in a conceptual unsaturated zone scheme: a case study of the Seine River basin, Hydrol. Process., 25, 752–765, https://doi.org/10.1002/hyp.7865, 2011. a
Phillips, N. A.: The general circulation of the atmosphere: A numerical experiment, Q. J. Roy. Meteorol. Soc., 82, 123–164, https://doi.org/10.1002/qj.49708235202, 1956. a
Potter, N. J., Chiew, F. H. S., Charles, S. P., Fu, G., Zheng, H., and Zhang, L.: Bias in dynamically downscaled rainfall characteristics for hydroclimatic projections, Hydrol. Earth Syst. Sci., 24, 2963–2979, https://doi.org/10.5194/hess-24-2963-2020, 2020. a
Prudhomme, C., Giuntoli, I., Robinson, E. L., Clark, D. B., Arnell, N. W., Dankers, R., Fekete, B. M., Franssen, W., Gerten, D., Gosling, S. N., Hagemann, S., Hannah, D. M., Kim, H., Masaki, Y., Satoh, Y., Stacke, T., Wada, Y., and Wisser, D.: Hydrological droughts in the 21st century, hotspots and uncertainties from a global multimodel ensemble experiment, P. Natl. Acad. Sci. USA, 111, 3262–3267, https://doi.org/10.1073/pnas.1222473110, 2014. a
Rajib, M. A., Sultana, S., Saha, M., and Rahman, M. M.: A multi-model ensembling approach for developing plausible countryscale climate change scenarios for future, Journal of Earth Science and Climatic Change, 5, 1–12, https://doi.org/10.4172/2157-7617.1000179, 2014. a
Randall, D. A. (Ed.): General Circulation Model Development: Past, Present, and Future, Vol. 70, International Geophysics Series, Elsevier Science, San Diego CA, Academic press edn., ISBN 978-0-08-050723-1, 2000. a
Riahi, K., Rao, S., Krey, V., Cho, C., Chirkov, V., Fischer, G., Kindermann, G., Nakicenovic, N., and Rafaj, P.: RCP8.5 – A scenario of comparatively high greenhouse gas emissions, Climatic Change, 109, 33, https://doi.org/10.1007/s10584-011-0149-y, 2011. a
Robin, Y., Corre, L., Marson, P., Bernus, S., Vrac, M., and Thao, S.: Explore 2 : Anticiper les évolutions climlatiques et hydrologiques en France. Projections Climatiques Régionalisées : Correction de Biais et Changements Futurs, Rapport final version 1.2, INRAE, OiEau, IPSL, Météo France, Gif-sur-Yvette, France, https://doi.org/10.57745/99X4CD, 2023. a
Roehrig, R., Beau, I., Saint-Martin, D., Alias, A., Decharme, B., Guérémy, J.-F., Voldoire, A., Abdel-Lathif, A. Y., Bazile, E., Belamari, S., Blein, S., Bouniol, D., Bouteloup, Y., Cattiaux, J., Chauvin, F., Chevallier, M., Colin, J., Douville, H., Marquet, P., Michou, M., Nabat, P., Oudar, T., Peyrillé, P., Piriou, J.-M., Salas y Mélia, D., Séférian, R., and Sénési, S.: The CNRM Global Atmosphere Model ARPEGE-Climat 6.3: Description and Evaluation, J. Adv. Model. Earth Syst., 12, e2020MS002075, https://doi.org/10.1029/2020MS002075, 2020. a
Saleh, F., Ducharne, A., Flipo, N., Oudin, L., and Ledoux, E.: Impact of river bed morphology on discharge and water levels simulated by a 1D Saint–Venant hydraulic model at regional scale, J. Hydrol., 476, 169–177, https://doi.org/10.1016/j.jhydrol.2012.10.027, 2013. a
Sansom, P. G., Stephenson, D. B., Ferro, C. A. T., Zappa, G., and Shaffrey, L.: Simple Uncertainty Frameworks for Selecting Weighting Schemes and Interpreting Multimodel Ensemble Climate Change Experiments, J. Clim., 26, 4017–4037, https://doi.org/10.1175/JCLI-D-12-00462.1, 2013. a
Sauquet, E., Strohmenger, L., Thirel, G., and Le Lay, M.: Quelles évolutions des régimes hydrologiques en France métropolitaine ?, Rapport final, INRAE, EDF, Lyon, France, https://doi.org/10.57745/TLUTKF, 2024. a, b
Sauquet, E., Evin, G., Siauve, S., Aissat, R., Arnaud, P., Bérel, M., Bonneau, J., Branger, F., Caballero, Y., Colléoni, F., Ducharne, A., Gailhard, J., Habets, F., Hendrickx, F., Héraut, L., Hingray, B., Huang, P., Jaouen, T., Jeantet, A., Lanini, S., Le Lay, M., Magand, C., Mimeau, L., Monteil, C., Munier, S., Perrin, C., Robelin, O., Rousset, F., Soubeyroux, J.-M., Strohmenger, L., Thirel, G., Tocquer, F., Tramblay, Y., Vergnes, J.-P., and Vidal, J.-P.: A large transient multi-scenario multi-model ensemble of future streamflow and groundwater projections in France, Hydrol. Earth Syst. Sci., 30, 2277–2300, https://doi.org/10.5194/hess-30-2277-2026, 2026. a, b, c, d, e
Seguin, J.-J.: Proposition d’un indicateur piézométrique standardisé pour le Bulletin de Situation Hydrologique “Nappes”, Rapport finale BRGM/RP-64147-FR, BRGM, Orléans, France, 2015. a, b
Shepherd, T. G.: Storyline approach to the construction of regional climate change information, P. Roy. Soc. A, 475, 20190013, https://doi.org/10.1098/rspa.2019.0013, 2019. a, b
Shepherd, T. G., Boyd, E., Calel, R. A., Chapman, S. C., Dessai, S., Dima-West, I. M., Fowler, H. J., James, R., Maraun, D., Martius, O., Senior, C. A., Sobel, A. H., Stainforth, D. A., Tett, S. F. B., Trenberth, K. E., van den Hurk, B. J. J. M., Watkins, N. W., Wilby, R. L., and Zenghelis, D. A.: Storylines: an alternative approach to representing uncertainty in physical aspects of climate change, Climatic Change, 151, 555–571, https://doi.org/10.1007/s10584-018-2317-9, 2018. a, b, c
Sobaga, A., Habets, F., Beaudoin, N., Léonard, J., and Decharme, B.: Decreasing trend of groundwater recharge with limited impact of intense precipitation: Evidence from long-term lysimeter data, J. Hydrol., 637, 131340, https://doi.org/10.1016/j.jhydrol.2024.131340, 2024. a
Soubeyroux, J.-M., Bernus, S., Corre, L., Drouin, A., Dubuisson, B., Etchevers, P., Gouget, V., Josse, P., Kerdoncuff, M., Samacoits, R., and Tocquet, F.: Les nouvelles projections climatiques de référence DRIAS 2020 pour la métropole, Rapport technique, Météo-France, Toulouse, 2021. a
Stollsteiner, P.: Projet Explore 2070 : Evaluation de l'impact du changement climatique, Rapport finale BRGM/RP-61483-FR, BRGM, Orléans, France, 2012. a, b, c, d
Tapiador, F. J., Navarro, A., Moreno, R., Sánchez, J. L., and García-Ortega, E.: Regional climate models: 30 years of dynamical downscaling, Atmos. Res., 235, 104785, https://doi.org/10.1016/j.atmosres.2019.104785, 2020. a
Taylor, K. E., Stouffer, R. J., and Meehl, G. A.: An Overview of CMIP5 and the Experiment Design, Bull. Am. Meteorol. Soc., 93, 485–498, https://doi.org/10.1175/BAMS-D-11-00094.1, 2012. a
Thiéry, D.: Code de calcul MARTHE – Modélisation 3D des écoulements dans les hydrosystèmes – Notice d’utilisation de la version 7.5, Rapport finale BRGM/RP-64554-FR, BRGM, Orléans, France, 2015. a
Thomson, A. M., Calvin, K. V., Smith, S. J., Kyle, G. P., Volke, A., Patel, P., Delgado-Arias, S., Bond-Lamberty, B., Wise, M. A., Clarke, L. E., and Edmonds, J. A.: RCP4.5: a pathway for stabilization of radiative forcing by 2100, Climatic Change, 109, 77, https://doi.org/10.1007/s10584-011-0151-4, 2011. a
Tramblay, Y. and Somot, S.: Future evolution of extreme precipitation in the Mediterranean, Climatic Change, 151, 289–302, https://doi.org/10.1007/s10584-018-2300-5, 2018. a
Tramblay, Y., Sauquet, E., Arnaud, P., Rousset, F., Soubeyroux, J.-M., Jeantet, A., Munier, S., and Vergnes, J.-P.: Scénarios d'extrêmes hydrologiques, Rapport final, IRD, INRAE, Météo-France, CNRM, BRGM, Montpellier, France, https://doi.org/10.57745/2XDJ5H, 2024. a, b
Tramblay, Y., Thirel, G., Strohmenger, L., Evin, G., Corre, L., Heraut, L., and Sauquet, E.: Evolution of flood generating processes under climate change in France, Hydrol. Earth Syst. Sci., 29, 7023–7039, https://doi.org/10.5194/hess-29-7023-2025, 2025. a, b, c, d
Van Loon, A. F.: Hydrological drought explained, WIREs Water, 2, 359–392, https://doi.org/10.1002/wat2.1085, 2015. a
van Vuuren, D. P., den Elzen, M. G. J., Lucas, P. L., Eickhout, B., Strengers, B. J., van Ruijven, B., Wonink, S., and van Houdt, R.: Stabilizing greenhouse gas concentrations at low levels: an assessment of reduction strategies and costs, Climatic Change, 81, 119–159, https://doi.org/10.1007/s10584-006-9172-9, 2007. a
Verfaillie, D., Déqué, M., Morin, S., and Lafaysse, M.: The method ADAMONT v1.0 for statistical adjustment of climate projections applicable to energy balance land surface models, Geosci. Model Dev., 10, 4257–4283, https://doi.org/10.5194/gmd-10-4257-2017, 2017. a, b, c
Vergnes, J.-P., Roux, N., Habets, F., Ackerer, P., Amraoui, N., Besson, F., Caballero, Y., Courtois, Q., de Dreuzy, J.-R., Etchevers, P., Gallois, N., Leroux, D. J., Longuevergne, L., Le Moigne, P., Morel, T., Munier, S., Regimbeau, F., Thiéry, D., and Viennot, P.: The AquiFR hydrometeorological modelling platform as a tool for improving groundwater resource monitoring over France: evaluation over a 60-year period, Hydrol. Earth Syst. Sci., 24, 633–654, https://doi.org/10.5194/hess-24-633-2020, 2020. a, b, c, d, e
Vergnes, J.-P., Caballero, Y., and Lanini, S.: Assessing climate change impact on French groundwater resources using a spatially distributed hydrogeological model, Hydrol. Sci. J., 68, 209–227, https://doi.org/10.1080/02626667.2022.2150553, 2023. a, b, c, d, e, f
Vetter, T., Huang, S., Aich, V., Yang, T., Wang, X., Krysanova, V., and Hattermann, F.: Multi-model climate impact assessment and intercomparison for three large-scale river basins on three continents, Earth Syst. Dynam., 6, 17–43, https://doi.org/10.5194/esd-6-17-2015, 2015. a
Vidal, J.-P., Martin, E., Franchistéguy, L., Baillon, M., and Soubeyroux, J.-M.: A 50-year high-resolution atmospheric reanalysis over France with the Safran system, Int. J. Climatol., 30, 1627–1644, https://doi.org/10.1002/joc.2003, 2010. a, b
Vidal, J.-P., Hingray, B., Magand, C., Sauquet, E., and Ducharne, A.: Hierarchy of climate and hydrological uncertainties in transient low-flow projections, Hydrol. Earth Syst. Sci., 20, 3651–3672, https://doi.org/10.5194/hess-20-3651-2016, 2016. a
The AquiFR hydrogeological platform, forced by 36 climate projections, simulates future groundwater levels across France. Results reveal significant variability between climate and representative concentration pathways used as socio-economic scenarios, with a dominant signal of rising groundwater levels over most of the study area. Four storylines, representing worst-case scenarios, are selected to inform decision-makers and support the adoption of sustainable groundwater management policies.
The AquiFR hydrogeological platform, forced by 36 climate projections, simulates future...