
the Creative Commons Attribution 4.0 License.
the Creative Commons Attribution 4.0 License.
 | 15 Oct 2026
Evidence of vertical soil hydraulic heterogeneity regulating hydrothermal simulations in Qinghai–Tibetan Plateau wetlands

Xin Wang
Zuoliang Wang
Yongjie Pan
Yan Song
Alpine wetlands on the Qinghai–Tibetan Plateau host vertically structured and highly contrasting pore systems that fundamentally shape land and atmosphere exchanges, yet their hydraulic expressions and process implications remain poorly quantified. This study provides the first process based and depth resolved characterization of these layered pore structures using soil physical analyses and laboratory evaporation experiments. The derived Clapp–Hornberger parameters reveal coherent hydraulic contrasts, with surface layers dominated by macropore connectivity and showing high θs and Ks and low b that promote rapid drainage and evaporation, mid layer domains with lower θs and Ks and larger b that enhance retention in finer pores, and deeper layers that act as stable and persistent storage reservoirs. These properties together generate a vertical regime of rapid near surface drainage, delayed mid layer release, and long lasting deep moisture storage. When implemented in Noah-MP, this hydraulic stratification systematically altered water and energy partitioning during wet and dry periods and showed that vertical hydraulic heterogeneity rather than a single layer parameterization governs the timing and magnitude of evaporation and heat fluxes. These findings provide the first quantitative evidence that pore scale structure regulates profile scale hydrothermal responses in Qinghai–Tibetan Plateau wetlands and establish a physically grounded basis for representing vertically heterogeneous hydraulic processes in land surface models.
- Article
(9174 KB) - Full-text XML
- BibTeX
- EndNote


The Qinghai–Tibetan Plateau, known as the “Asian Water Tower,” hosts extensive wetlands that play a vital role in water conservation and carbon storage. These wetlands regulate the regional climate via evapotranspiration and land atmosphere energy exchanges and influence the downstream river hydrology at the basin scale. Compared with mineral soils of sand, silt, and clay, plateau wetlands form under persistently low temperature and near saturation. Sphagnum and woody residues create a loose, porous, three dimensional network with large surface area. Surface macropores drive preferential flow, rapid infiltration, and drainage, whereas the matrix retains water mainly in mesopores and micropores (Holden, 2009). Consequently, unsaturated hydraulic conductivity and pore connectivity respond strongly to water status and show pronounced heterogeneity, dual porosity, preferential flow, and hydraulic hysteresis (McCarter et al., 2020). Although these characteristics have been widely investigated in soil physics, their responses and impacts in land surface modeling remain insufficiently explored (Rezanezhad et al., 2009). This limitation is not confined to specific regions but represents a general problem in global land surface models. Recent research has shown that current Earth system models have structural and parameterization deficiencies in terms of representing soil hydrological processes (Vereecken et al., 2022). Soils are often treated as homogeneous media, making it difficult for models to describe the multiscale pore structures and unsaturated flow, and many soil hydraulic parameters are derived empirically rather than constrained by physical measurements. These issues lead to systematic biases when simulating water–energy processes in complex ecosystems. Therefore, considering the unique hydraulic features of wetland soils, assessing how soil hydraulic properties and parameterization schemes contribute to uncertainties in current land surface simulations is essential.
Soil hydraulic properties are key factors that control the exchange of water and energy between the land surface and the atmosphere. In land surface models (LSMs), these properties are typically represented by the water retention curve (WRC) and the hydraulic conductivity curve (HCC). Although they are mathematically expressed as simple functional relationships, these properties control almost all of the processes related to soil water movement, including the infiltration and drainage rates, vertical soil moisture distribution, capillary recharge capacity, and evapotranspiration intensity (Shao and Irannejad, 1999). In other words, the parameterization of the water retention and hydraulic conductivity curves largely determines the model's performance when simulating hydrothermal processes, and improving these functions is therefore critical for reducing simulation bias.
Widely used soil hydraulic parameterizations in LSMs include those of Brooks Corey (BC; Brooks and Corey, 1964), Clapp–Hornberger (CH; Clapp and Hornberger, 1978), van Genuchten (VG; van Genuchten, 1980), and Kosugi (1994). BC assumes that the soil remains fully saturated up to the air entry pressure. Beyond that threshold, the hydraulic conductivity and matric potential decrease according to power laws. The scheme is simple but introduces a discontinuity across the wet–dry transition. VG represents the relationship between water potential and water content relation with a smooth, continuous function and is often coupled with the Mualem conductivity model (Mualem, 1976). It performs well over a wide suction range and fits data accurately, but it uses more parameters and relies strongly on measurements. Assuming a lognormal distribution of pore radii, the Kosugi model yields closed form expressions for the retention and conductivity curves. It has a stronger physical basis and captures the multiscale pore structure, but it is computationally heavier and harder to parameterize. CH describes the water retention and hydraulic conductivity curves with power laws using only a few parameters (index b, saturated water content θs, air entry suction ψs and saturated hydraulic conductivity Ks). It is efficient, needs fewer inputs, and can be initialized from texture lookup tables, which is useful when observations or computing resources are limited. Because of this simplicity and efficiency, CH has been widely implemented in mainstream LSMs such as Noah-MP and CLM and is used at global and regional scales for soil hydrothermal simulations, particularly where data are scarce (Dai et al., 2003; Niu et al., 2011).
While more physically based options (e.g., VG and Kosugi) are available, many operational LSM configurations still default to simplified empirical hydraulic functions for reasons of efficiency and data availability. In such settings, CH is a common choice. However, as an empirical statistical formulation, CH provides only a limited physical representation of the pore size distribution and connectivity (Vereecken et al., 2022). Near saturation, it cannot capture preferential flow driven by macropores or the associated rapid infiltration and drainage. In the dry range, its steep power law tail tends to overestimate matric suction and underestimate water retention (Durner, 1994; Tuller and Or, 2001). Three-dimensional X-ray CT (including micro-CT) analyses are consistent with this picture: macropore networks dominate drainage and infiltration under wet conditions, whereas meso- and micropores control retention and slow release under dry conditions (Wildenschild and Sheppard, 2013; Gharedaghloo et al., 2018). Consequently, prescribing a single b value according to the texture class or uniformly across the soil profile, as is common in many LSMs, fails to represent the interlayer variations caused by the vertical heterogeneity in pore size and connectivity. Although the measured water retention curve, hydraulic conductivity curve, and pore size distribution (PSD) can reveal these vertical structural features and their mechanisms, a CH parameterization with a uniform b value still cannot adequately represent the properties of highly organic, multiscale wetland soils (Van Looy et al., 2017).
Global evaluations indicate that the performance of Noah-MP is highly sensitive to the choice of parameterizations. Soil hydraulic schemes, in particular, strongly affect soil water availability, surface energy partitioning, and performance in arid regions (Li et al., 2022; Vereecken et al., 2022). In addition, global high-resolution datasets of soil hydraulic properties and improved pedotransfer functions (PTFs) support regional scheme selection and parameter assignment (Dai et al., 2019; Van Looy et al., 2017). For grasslands and sparsely vegetated areas (including semiarid and desert margins), refining the hydraulic parameterization, together with capillary recharge and plant hydraulics, has been shown to systematically improve the GPP, soil moisture, and surface energy flux simulations (Li et al., 2021; Farmani et al., 2025). For peat and other organic soils, implementing relationships that are specific to peat and including a dynamic shallow water table in LSMs markedly improves water table dynamics and energy fluxes (Chadburn et al., 2015; Largeron et al., 2018). Multisource evaluation of Noah-MP over China further reveals better performance in humid regions than in arid and cold regions, yet substantial biases remain there as well, with soil hydraulic parameterization and input accuracy being major contributors (Liang et al., 2019).
On the Qinghai–Tibetan Plateau, many field studies have investigated how grazing, land degradation, and freeze–thaw cycles affect the soil pore structure, saturated hydraulic conductivity, and the shape of the water retention curve. For example, moderate degradation or a denser root mat can increase the near surface water retention and steepen the retention curve, whereas heavy grazing markedly reduces the surface porosity and saturated conductivity (Li et al., 2006; Zeng et al., 2013; Pan et al., 2017). Studies that combine eddy covariance fluxes with deep soil moisture profiles have also shown that grazing decreases the leaf area and transpiration, allowing deeper layers to retain more water during dry periods and helping to sustain higher productivity (Zhang et al., 2019). However, most of this work focuses on mechanisms of change in hydraulic properties. Few studies have explicitly inserted measured or inversely estimated hydraulic parameters into LSMs to systematically test their impact on simulated hydrothermal fluxes. Recent research highlights that uncertainty in soil hydrology is now a key bottleneck for model accuracy (Vereecken et al., 2022); thus, to improve the physical consistency, we need datasets of measured and inversely estimated hydraulic parameters and model tests that verify the applicability of empirical schemes. A further issue concerns soil classification. Plateau soils may be labeled as loamy sand on the basis of particle size fractions from sieve analysis. However, their high organic matter and humus contents make their thermal, mechanical, and rheological behaviors very different from those of mineral soils. If hydraulic parameters are assigned from lookup tables based on soil texture that were developed for mineral soils, large errors can arise.
Building on the above background, this study focuses on the typical alpine wetland soils of the Qinghai–Tibetan Plateau. We conducted laboratory isothermal evaporation experiments to obtain the measured water retention and hydraulic conductivity curves for layered soils. From these data, we inversely estimated key CH parameters, including b, θs, and Ks, and derived the PSD and pore radius. We then embedded the measured surface and subsurface layer parameters into Noah-MP. Sensitivity experiments were designed for the full summer season and for representative wet and dry episodes. These experiments quantify the impact of parameterization by layer on latent heat flux (LHF) and sensible heat flux (SHF), and a joint analysis of the WRC, HCC, and PSD clarifies how vertical heterogeneity in pore structure governs model performance. The results provide quantitative evidence and a physical basis for incorporating more mechanistic soil hydraulic schemes into LSMs and offer a verifiable pathway to improve regional hydrothermal simulations over the Qinghai–Tibetan Plateau and similar complex ecosystems.
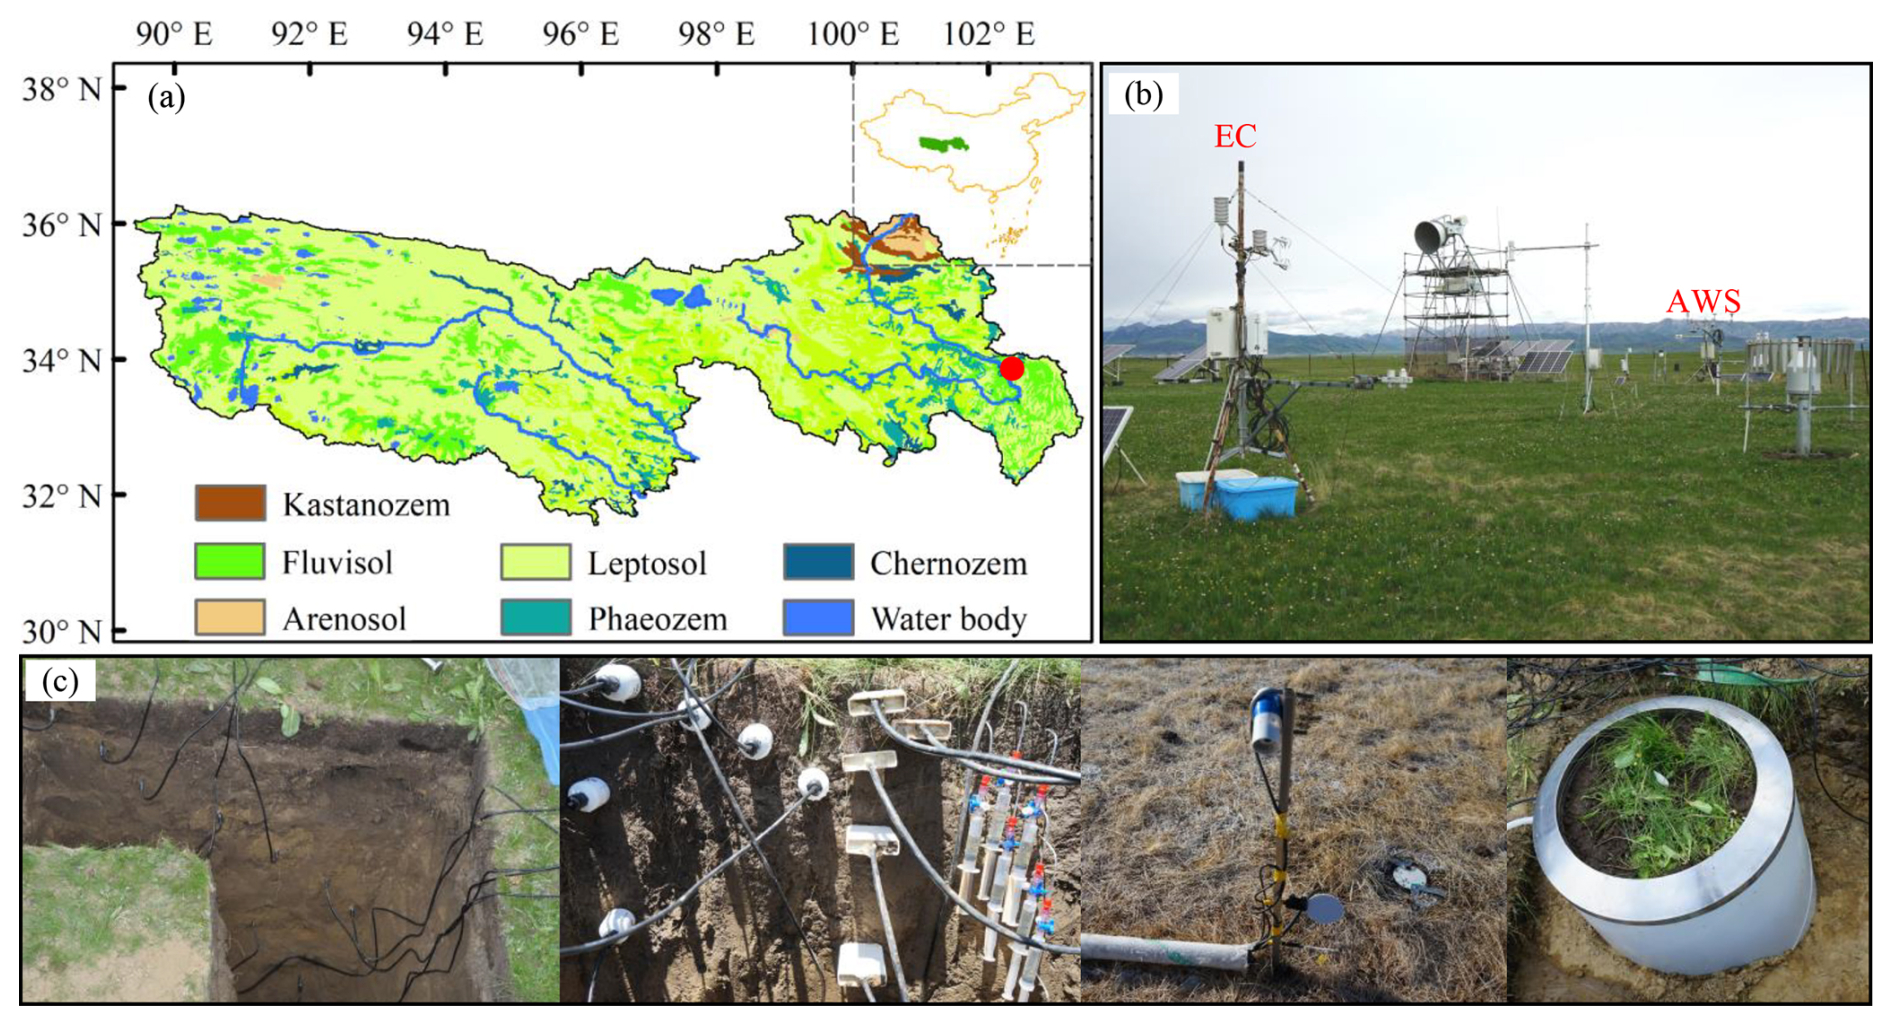
Figure 1Soil classification in the Sanjiangyuan region and overview of the observation site. (a) Spatial distribution of main soil types in the Sanjiangyuan region; (b) summer view of the station and main observation systems, including the eddy covariance (EC) and automatic weather station (AWS); (c) soil profile and monitoring instruments at the observation site, including soil temperature and moisture profile sensors, infrared surface temperature sensors, and a lysimeter.
2.1 Site description
The Sanjiangyuan region, located in the interior of the Qinghai–Tibetan Plateau, is the headwater area of the Yellow, Yangtze, and Lancang Rivers and is a major ecological barrier in China. The region covers km2 (89–103° E, 32–36° N), with a mean elevation exceeding 3000 m. The wetlands are widespread, and according to the hydrologic classification of Vepraskas and Craft (2016), most are surface-water-fed systems. In studies of wetlands at high latitudes, the term peat is often used to denote wetland soils rich in organic matter. It is a broad ecological term rather than a strict soil taxon (Mitsch and Gosselink, 2015). Based on the FAO/UNESCO Soil Map of the World, hydric soils and Leptosols account for 12.88 % and 71.51 % of the area, respectively, with water bodies constituting 6.54 % and other soils constituting 9.07 % (Fig. 1a) of the area. Hydric soils indicate mature wetland environments, whereas Leptosols have shallow profiles and weak pedogenesis.
Field observations were conducted at the Sanjiangyuan Land Surface Process Observation Station (denoted by the red dot in Fig. 1a), which is located in Maqu County (33.5° N, 101.9° E; elevation 3436 m). For 1967–2017, the mean annual precipitation was ∼604 mm, and the mean air temperature was 1.8 °C. The near surface soils are characterized by abundant plant residues, high porosity, low bulk density and high organic matter content (Fig. 3c). The study site is located within this typical alpine wetland setting and is therefore representative of wetlands with similar hydro-pedological characteristics in the eastern Qinghai–Tibetan Plateau (Wang et al., 2024). To characterize the vertical soil structure, a total of 11 undisturbed soil cores were collected from 11 depth intervals, with one core collected from each interval (n=1 per depth). The lack of within-depth replication limits the quantification of local spatial variability. Therefore, the observed vertical patterns should be interpreted as profile-scale evidence from the study site.
The instrumentation includes the eddy covariance (EC), an automatic weather station, infrared radiometers, and soil temperature/moisture profiles (Fig. 1b), where the EC system comprised an EC150 open path gas analyzer, CSAT3 sonic anemometer, and NR01 four component radiometer, together with HMP155A air temperature/relative humidity sensors (Campbell Scientific, USA). The soil profiles were monitored by using CS616 volumetric water content probes and 109L temperature sensors. In addition, infrared surface temperature sensors, soil heat flux plates, and an evaporation lysimeter were deployed to monitor the surface energy and water processes (Fig. 1c). The variables used in this study included the LHF and SHF, air temperature and relative humidity at 2 m, surface temperature, soil water content at 5/10/20/40/80 cm, and precipitation.
All eddy-covariance fluxes underwent standardized quality control, including Webb–Pearman–Leuning (WPL) correction, three-dimensional coordinate rotation, time lag compensation, stationarity tests, and turbulence intensity screening, to remove biases from the sensor response delays, wind direction misalignment, and nonstationary turbulence. Regarding the capacitive/dielectric soil moisture sensors, which are often underestimated at high water contents or near saturation, we conducted concurrent gravimetric sampling and derived calibration curves relating the sensor outputs to the gravimetric volumetric water content, and the raw soil moisture data were then statistically corrected. These procedures ensured the physical consistency and uniform spatiotemporal resolution of the dataset, providing a reliable basis for subsequent model evaluation and analysis.
2.2 CH hydraulic scheme
The CH parameterization represents the soil hydraulic properties by using a variant of the Brooks–Corey model. The water retention curve is expressed as a power law relationship between the soil matric potential (ψ) and volumetric water content (θ):
where ψ (cm H2O) is the matric potential (taken as positive), which represents the capillary suction of the soil; ψs (cm H2O) is the air entry suction, which defines the critical suction at the onset of drainage; θ (–) is the volumetric water content; θs (–) is the saturated volumetric water content; and b (–) is the empirical exponent, which controls the slope of the water retention curve in the dry range and indirectly reflects the concentration of the soil pore size distribution.
The corresponding hydraulic conductivity curve is expressed as follows:
where K(θ) (cm s−1) is the unsaturated hydraulic conductivity, Ks (cm s−1) is the saturated hydraulic conductivity, and the other variables are as defined above. This equation is derived from a simplified form of the Mualem model, assuming that the conductivity decreases exponentially with decreasing θ. The exponent term (2b+3) reflects both the pore connectivity and tortuosity, where the constant “3” represents a fixed baseline and “2b” scales with the sensitivity to the pore size distribution.
In Noah-MP, the CH scheme is used to simulate unsaturated flow and coupled heat and water transport by combining the water retention and hydraulic conductivity curves formulations. However, it neglects certain processes, such as thin film flow under very dry conditions, and does not explicitly represent the multimodal pore size distributions, which may lead to systematic biases when simulating water and energy fluxes, particularly in wetland soils rich in organic matter.
2.3 Physicochemical measurements
A total of 11 undisturbed soil cores were collected along the soil profile, covering depths from the surface to 160 cm. Each core corresponds to a specific depth interval, as summarized in Table 3, forming a complete vertical sampling framework for subsequent measurements.
The soil organic carbon (SOC) was measured by the potassium dichromate oxidation method with external heating. Specifically, 2 g of soil with fibers removed was weighed, mixed with 0.4 mol L−1 K2Cr2O7-H2SO4 solution, and heated to boiling in an oil bath. A small amount of o-phenanthroline indicator was added, and the residual solution was titrated with 0.1 mol L−1 standard ferrous sulfate solution. The amount consumed was obtained from the back titration and converted into the SOC content.
The fiber content (FC) was determined using the von Post method (Page et al., 1982) together with manual fiber separation. The fibrous material was isolated by hand rubbing and sieving, the nonfibrous fractions were removed, and the fibers were dried in an oven and weighed.
The bulk density (BD) was measured with the ring core method. Saturated intact cores were dried in an oven at 105 °C for 48 h, and the BD was calculated as the dry mass divided by the ring volume. The units were kept consistent across samples. The particle size distribution was determined by the hydrometer method. The soil samples were dispersed into a suspension and allowed to settle at a constant temperature, and hydrometer readings were taken at prescribed times to calculate the percentages of sand, silt, and clay.
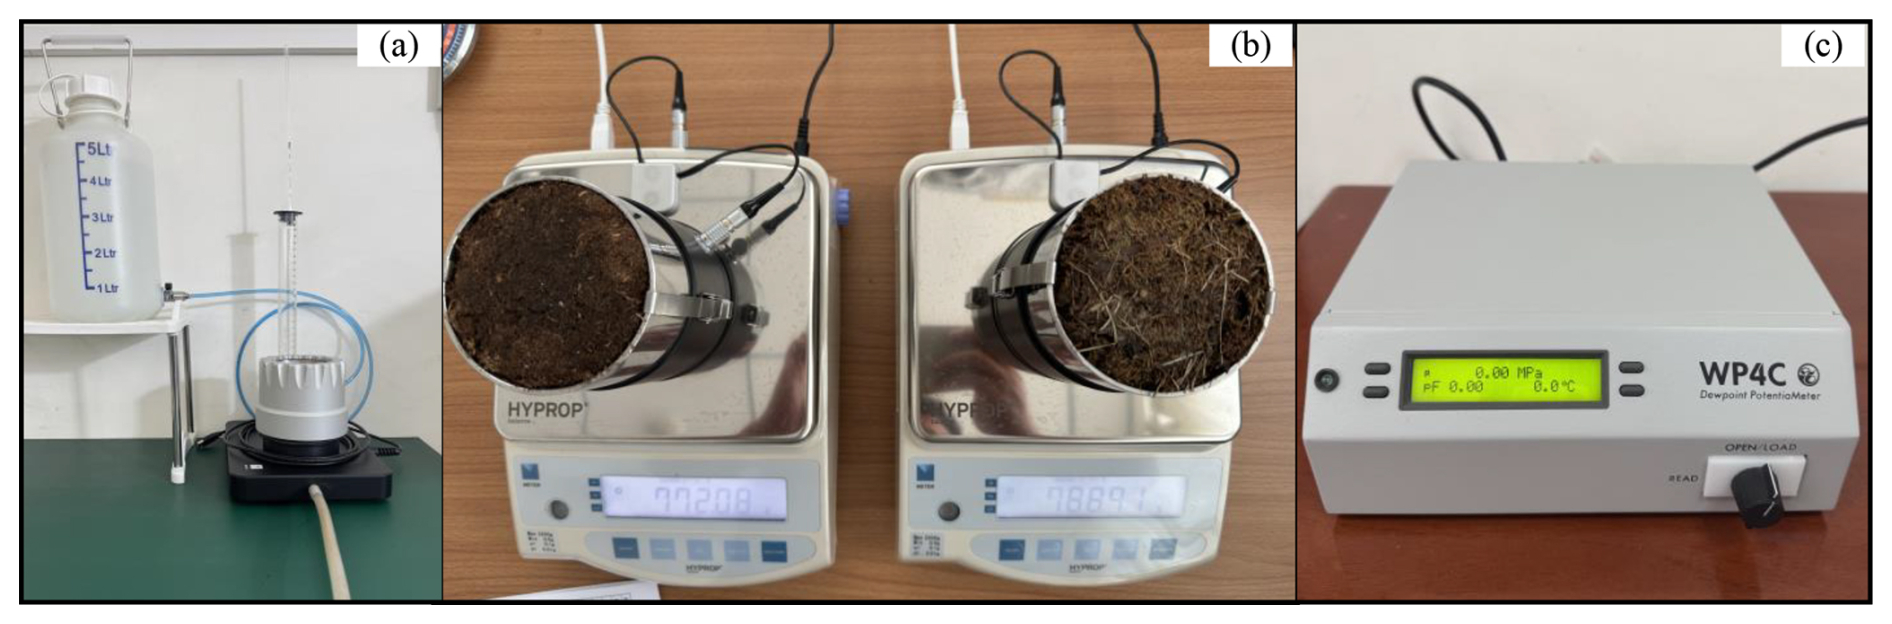
Figure 2Laboratory measurement instruments. (a) KSAT Hydraulic conductivity measurement; (b) HYPROP 2 Evaporation experiment; (c) WP4C Dew point water potential meter.
2.4 Measurements of Ks and θs
The Ks was measured with the falling head method based on Darcy's law (Fig. 2a). A standpipe of constant cross section was connected to the soil core, and we recorded the decline in the hydraulic head over time. The volumetric flow through the sample was computed from the record of head versus time, and Ks was obtained accordingly. Undisturbed field cores were placed in 250 cm3 rings. The water level was kept slightly above the sample surface, and the cores were degassed for 6 h to ensure saturation. An initial head was then applied. The instrument recorded the exponential decay of the head in automatic mode until the stop criterion was met. The KSAT has precision pressure sensors with an resolution of 1 Pa (approximately 0.01 cm water column) and a temperature sensor. The software applied temperature and viscosity correction. Ks was calculated from an exponential fit using:
where Abur is the cross sectional area of the standpipe, Asample is the cross sectional area of the soil core, L is the sample length, and b is the fitted slope of the exponential head decline. The procedure was highly automated to avoid manual reading errors and is suitable for soils with a wide range of permeability.
The θs was determined by a gravimetric procedure. After degassing and saturation, the intact cores were allowed to equilibrate for 24 h, dried in an oven at 75 °C for 48 h and weighed with an analytical balance. The gravimetric water content was computed as the increase in mass due to water (saturated mass minus the mass after oven drying) divided by the mass after oven drying. The BD was obtained as the mass after oven drying divided by the ring volume, and the θs was then calculated as the gravimetric water content multiplied by the BD.
2.5 Evaporation experiment and simplified evaporation method
We estimated the ψs and index b required by the CH scheme by using a transient evaporation experiment combined with the simplified evaporation method (SEM) (Peters and Durner, 2008; Peters et al., 2015). The SEM relied on four simplifying assumptions during the experiment: (i) the matric potential and water content vary linearly with depth; (ii) the vertical water flux varies linearly with depth; (iii) over short time steps, the suction changes linearly with time; and (iv) the evaporation rate remains approximately constant over short time steps. These assumptions provided the basis for inverting the unsaturated hydraulic conductivity from a limited number of tensiometer readings and concurrent mass loss data.
To obtain the near saturated (low suction) segment of the water retention curve , we used a HYPROP-2 system (Fig. 2b) to monitor the matric potential and sample mass during free evaporation of the intact cores under controlled temperature and wind speed. Two tensiometers installed at depths Z1 and Z2 recorded the matric potentials h1 and h2 in real time, while an electronic balance simultaneously logged the sample mass. These measurements were used to derive the temporal evolution of the average volumetric water content (θi) and evaporation flux (q).
The average volumetric water content (θi) was obtained as the arithmetic mean as follows:
To improve the accuracy of the mean suction at intermediate suction stages, the average soil water potential was computed by using the geometric mean:
Assuming that the evaporation flux varies approximately linearly with depth, the flux at the sample center was taken as half of the total evaporation flux.
The suction gradient was derived from the difference between the mean suctions measured by two tensiometers as follows:
The unsaturated hydraulic conductivity was then calculated by using the Darcy–Buckingham law.
Because the measurement range of HYPROP-2 covers only the near saturated domain (low suction range), additional data for the dry range (−0.1 to −300 MPa) were obtained by using a WP4C dew point potentiometer (Fig. 2c), corresponding to the transition from capillary to adsorbed water under low moisture conditions. After merging the HYPROP-2 and WP4C datasets, the continuous water retention and hydraulic conductivity curves were inversely estimated using a single run of the shuffled complex evolution (SCE-UA) global optimization algorithm. The potential non-uniqueness and uncertainty of the inferred parameter sets were subsequently assessed using a Markov chain Monte Carlo (MCMC) approach (Duan et al., 1992; Wang et al., 2024).
2.6 Calculation of the analysis metrics
Based on the water retention and hydraulic conductivity curves obtained for the surface and subsurface soils, this study derived two diagnostic indices, the effective power law exponent and the near saturated connectivity index, to characterize the state dependence and interlayer variability of the soil hydraulic properties and to clarify the role of parameter specification when shaping the model responses.
The effective power law exponent (beff) was computed by following the local logarithmic slope method proposed by Peters et al. (2015), with saturation defined as . Based on the CH formulation, it is expressed as:
The derivatives were calculated by using a central difference scheme combined with Savitzky–Golay filtering for smoothing (Savitzky and Golay, 1964).
Following the conceptual framework of Assouline and Or (2013) regarding near saturated hydraulic connectivity, we introduced a near saturated connectivity index (NSC), defined as follows:
where Kq denotes the geometric mean hydraulic conductivity at the qth percentile (±0.05 range) of saturation, which represents the degree of pore connectivity under near saturated conditions. The physical interpretation of the NSC is analogous to the ratio proposed by Fatichi et al. (2020), as both describe the contribution of macropore connectivity to the total conductivity. The difference is that the NSC is derived from measured conductivity variations within the same soil sample under near saturated and intermediate moisture conditions, whereas Fatichi's ratio separates the structural and textural controls on saturated conductivity through parameter decomposition.
2.7 Equivalent pore radius and pore size distribution
The equivalent pore radius (r) was calculated from the soil matric potential (h) by using the Young–Laplace equation (Hillel, 1998):
where r is the equivalent radius (cm), σ is the surface tension of water (0.072 N m−1), φ is the contact angle (assumed to be perfectly wetting, i.e., cos φ=1), ρ is the density of water (1.0 g cm−3), g is the gravitational acceleration (980 cm s−2), and h is the matric potential (cm, negative for suction). Under these constants and assumptions, Eq. (11) can be simplified as follows:
The equivalent radius represents an idealized one-to-one correspondence between the suction and pore diameter when the soil pores are conceptualized as cylindrical capillaries. It therefore characterizes the statistical scale of the pore sizes rather than their actual geometric form.
The PSD was derived from the water retention curve. First, the soil matric potential (h) in the water retention curve was converted to the equivalent pore radius (r) by using the Young–Laplace equation. Subsequently, the derivative of the volumetric water content with respect to log r was obtained as follows:
The peaks of the resulting PSD curve correspond to different pore size modes.
2.8 Model experimental design
To evaluate the influence of the soil hydraulic parameters on the simulation of hydrothermal processes in alpine wetlands, a series of single point sensitivity experiments were conducted by using the offline version of the Noah-MP land surface model (v5.0). The model was driven and initialized with field observations from the Land Surface Process Observation Station. A temporal resolution of 30 min meteorological forcing data included the precipitation, air temperature, relative humidity, wind speed, and downward shortwave and longwave radiation, and all forcing data were uniformly formatted, temporally aligned, and screened for outliers, with missing values filled via linear interpolation. The initial soil moisture and temperature profiles were obtained directly from in situ measurements to ensure that the initial state of the model was consistent with the observations. The 2023 precipitation, air temperature, and observed soil-moisture conditions remained within the interannual range of variability at the site, indicating that 2023 provided a climatically representative background for the model forcing and evaluation. All simulations are conducted within a single-point framework, and no spatial extrapolation of soil hydraulic parameters is performed.
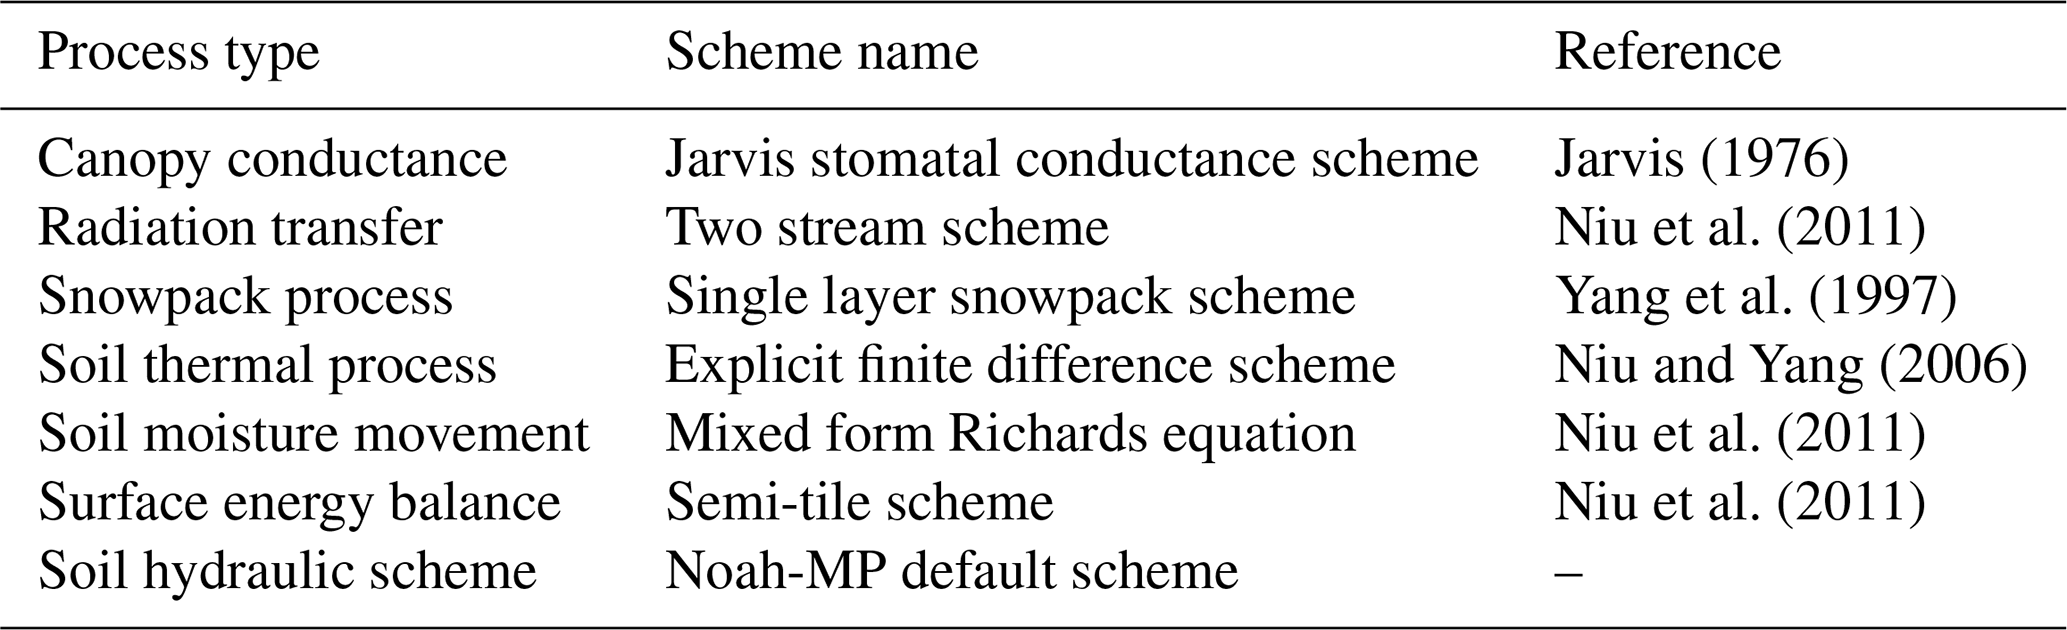
With the exception of the parameters perturbed in the sensitivity experiments, all of the other physical processes retained their default Noah-MP values. The major physical process configurations are summarized in Table 1. As the primary objective was to assess the impacts of the soil hydraulic parameters on the summer hydrothermal dynamics in alpine wetlands, the default physics options in Noah-MP were retained to ensure that any model differences arose mainly from changes in the soil hydraulic parameters.
Frozen-soil processes were represented using the Niu and Yang (2006) parameterizations for supercooled liquid water and frozen soil permeability. The sensitivity experiments were restricted to June–August to minimize the influence of active freeze–thaw processes, which were not separately evaluated in this study. Snow processes played only a transient role at the beginning and end of the simulation year, without influencing the summer sensitivity analysis. The vegetation process used the Jarvis stomatal conductance scheme with default lookup table parameters, and the root water uptake and plant physiological parameters were not modified to minimize the influence of the vegetation dynamics on soil moisture and surface fluxes, thereby isolating the direct regulatory effect of soil hydraulic properties.
Table 1Main physical process configurations in the Noah-MP model.
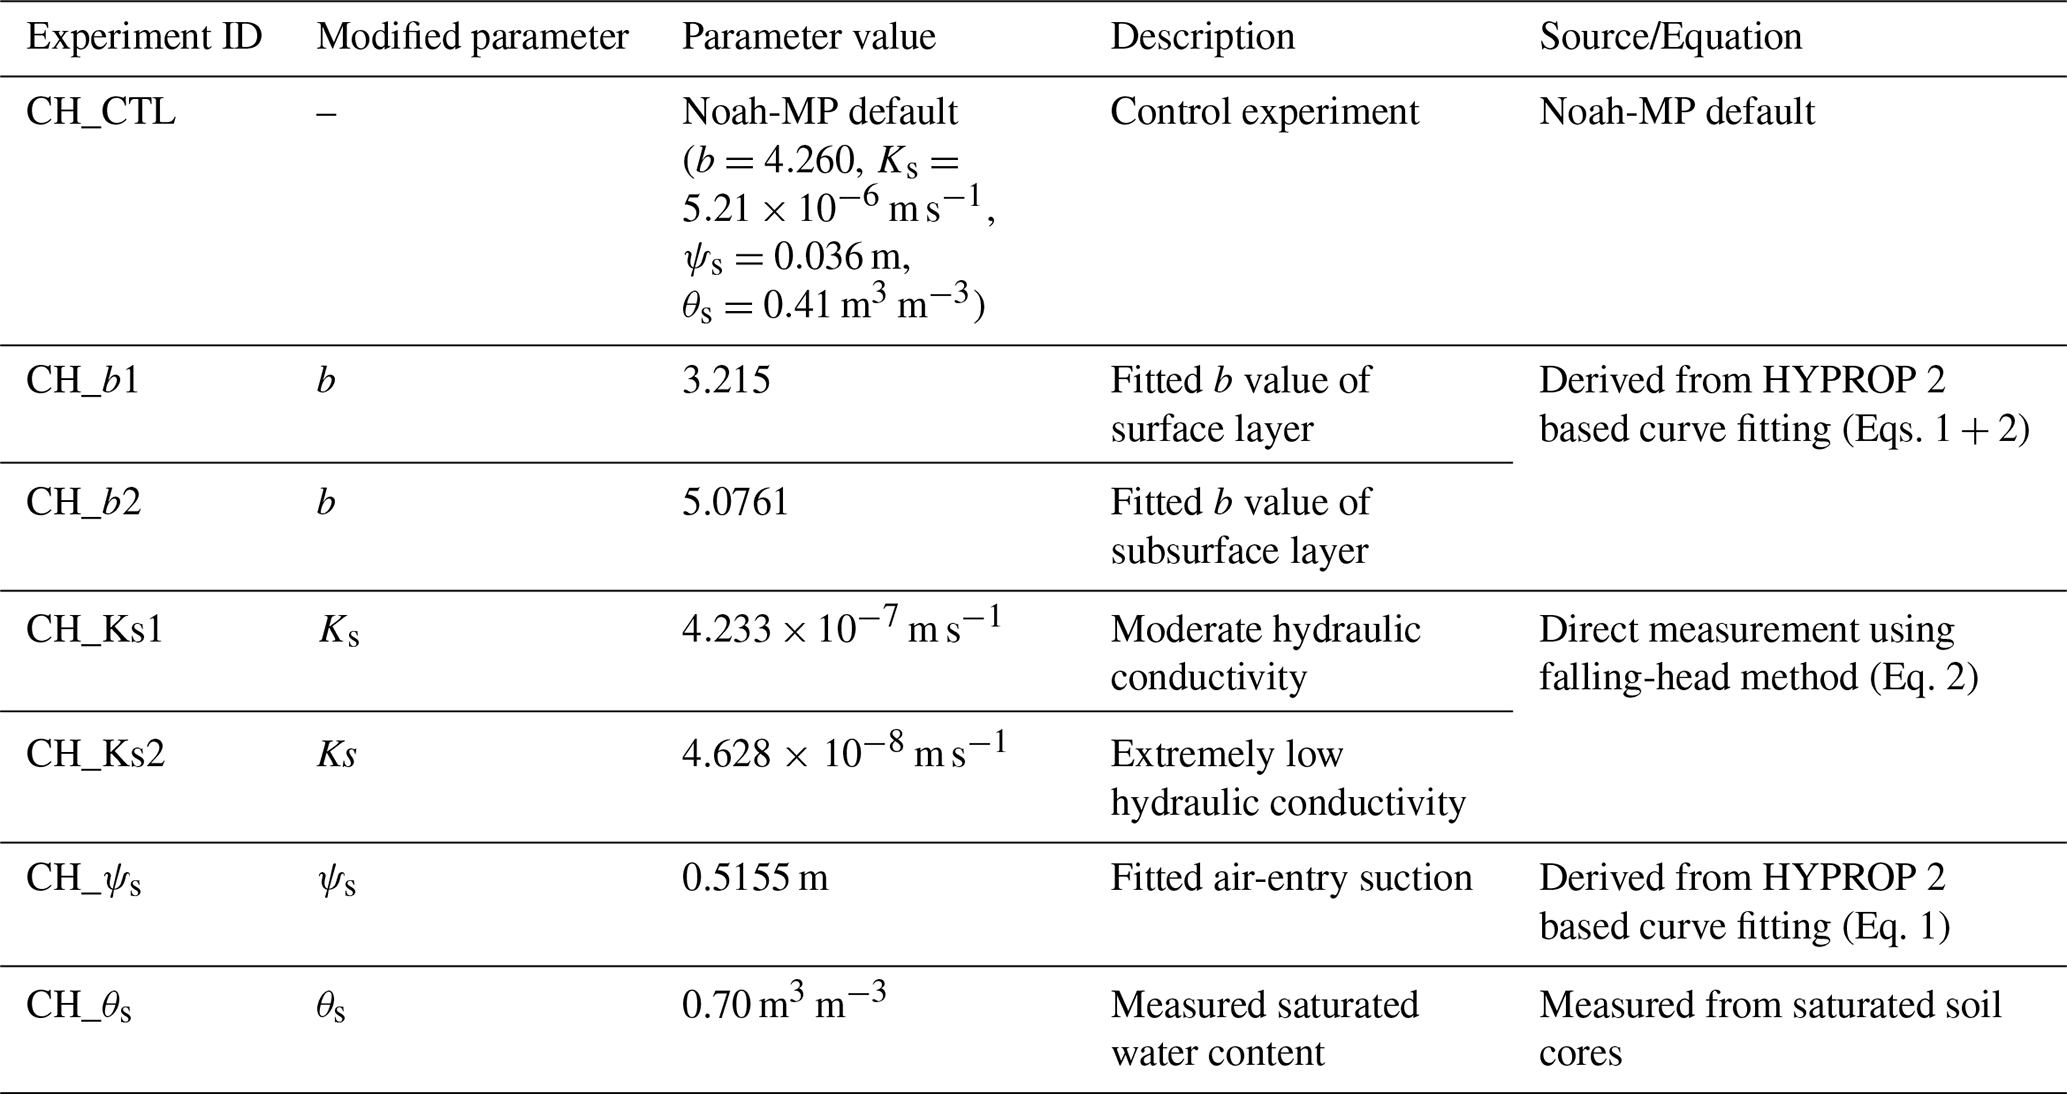
A control experiment (CTL) and six sensitivity experiments were designed (Table 2). A one-at-a-time (OAT) sensitivity approach was adopted in which only one parameter of the CH scheme was replaced in each sensitivity experiment, while all other parameters were kept identical to those in the control run. This design isolated the individual influence of each parameter variation on the simulated hydrothermal processes. Table 2 also summarizes the source, corresponding governing equation, and derivation method of each hydraulic parameter used in the sensitivity experiments.
Table 2Design of model sensitivity experiments and corresponding parameter sources.
The model outputs included 30 min time series of the soil moisture at depths of 0–10 and 10–40 cm, the LHF, and the SHF. The simulated results were compared with the observations, and statistical metrics, including the root mean square error (RMSE), mean bias (Bias), and coefficient of determination (R2), were calculated. The effects of different hydraulic parameters on the accuracy of the simulated surface hydrothermal processes were evaluated separately under three conditions: the entire season, the wet event, and the dry event.
3.1 Soil physical properties
To better understand the structural features of wetland soil, both microscopic imaging and macroscopic characterization were used. The CT scan of a 5 cm surface soil sample from the observation site, which visualizes the complexity of the pore structure, is shown in Fig. 3 (top). The image on the left is a millimeter scale horizontal CT slice showing the cross section of the soil core, and the differences in gray level indicate variations in particle density and porosity. Bright areas represent a compact soil matrix, while dark spots and cracks correspond to pores of different sizes. The color image on the right is a 3-D cylindrical reconstruction based on approximately 3000 CT slices; the color gradient from blue to red quantifies the pore volume (mm3), where blue indicates small micropores and red indicates large macropores. The soil clearly shows vertical heterogeneity. The upper layer (0–4 cm) is dominated by micropores and appears dense, while below 4 cm, macropores become more frequent and partly connected.
This multiscale pore structure is shaped by high organic matter content and partially decomposed plant residues. It maintains both a strong water retention capacity and rapid drainage. Large pores, such as cracks and root channels, promote rapid infiltration and preferential flow during the early infiltration stage, accelerating the drainage and solute transport. In contrast, the micropores retain water with capillary forces in later stages, maintaining the soil moisture and affecting evaporation. If the contrasting roles of multiscale soil pores are ignored in the LSMs, it may not only cause biases in soil moisture memory but also disturb the surface energy partitioning, leading to inaccurate simulations of the LHF and SHF and consequently affecting the accuracy of the surface temperature, evaporation rate, and the representation of the wet–dry cycles.
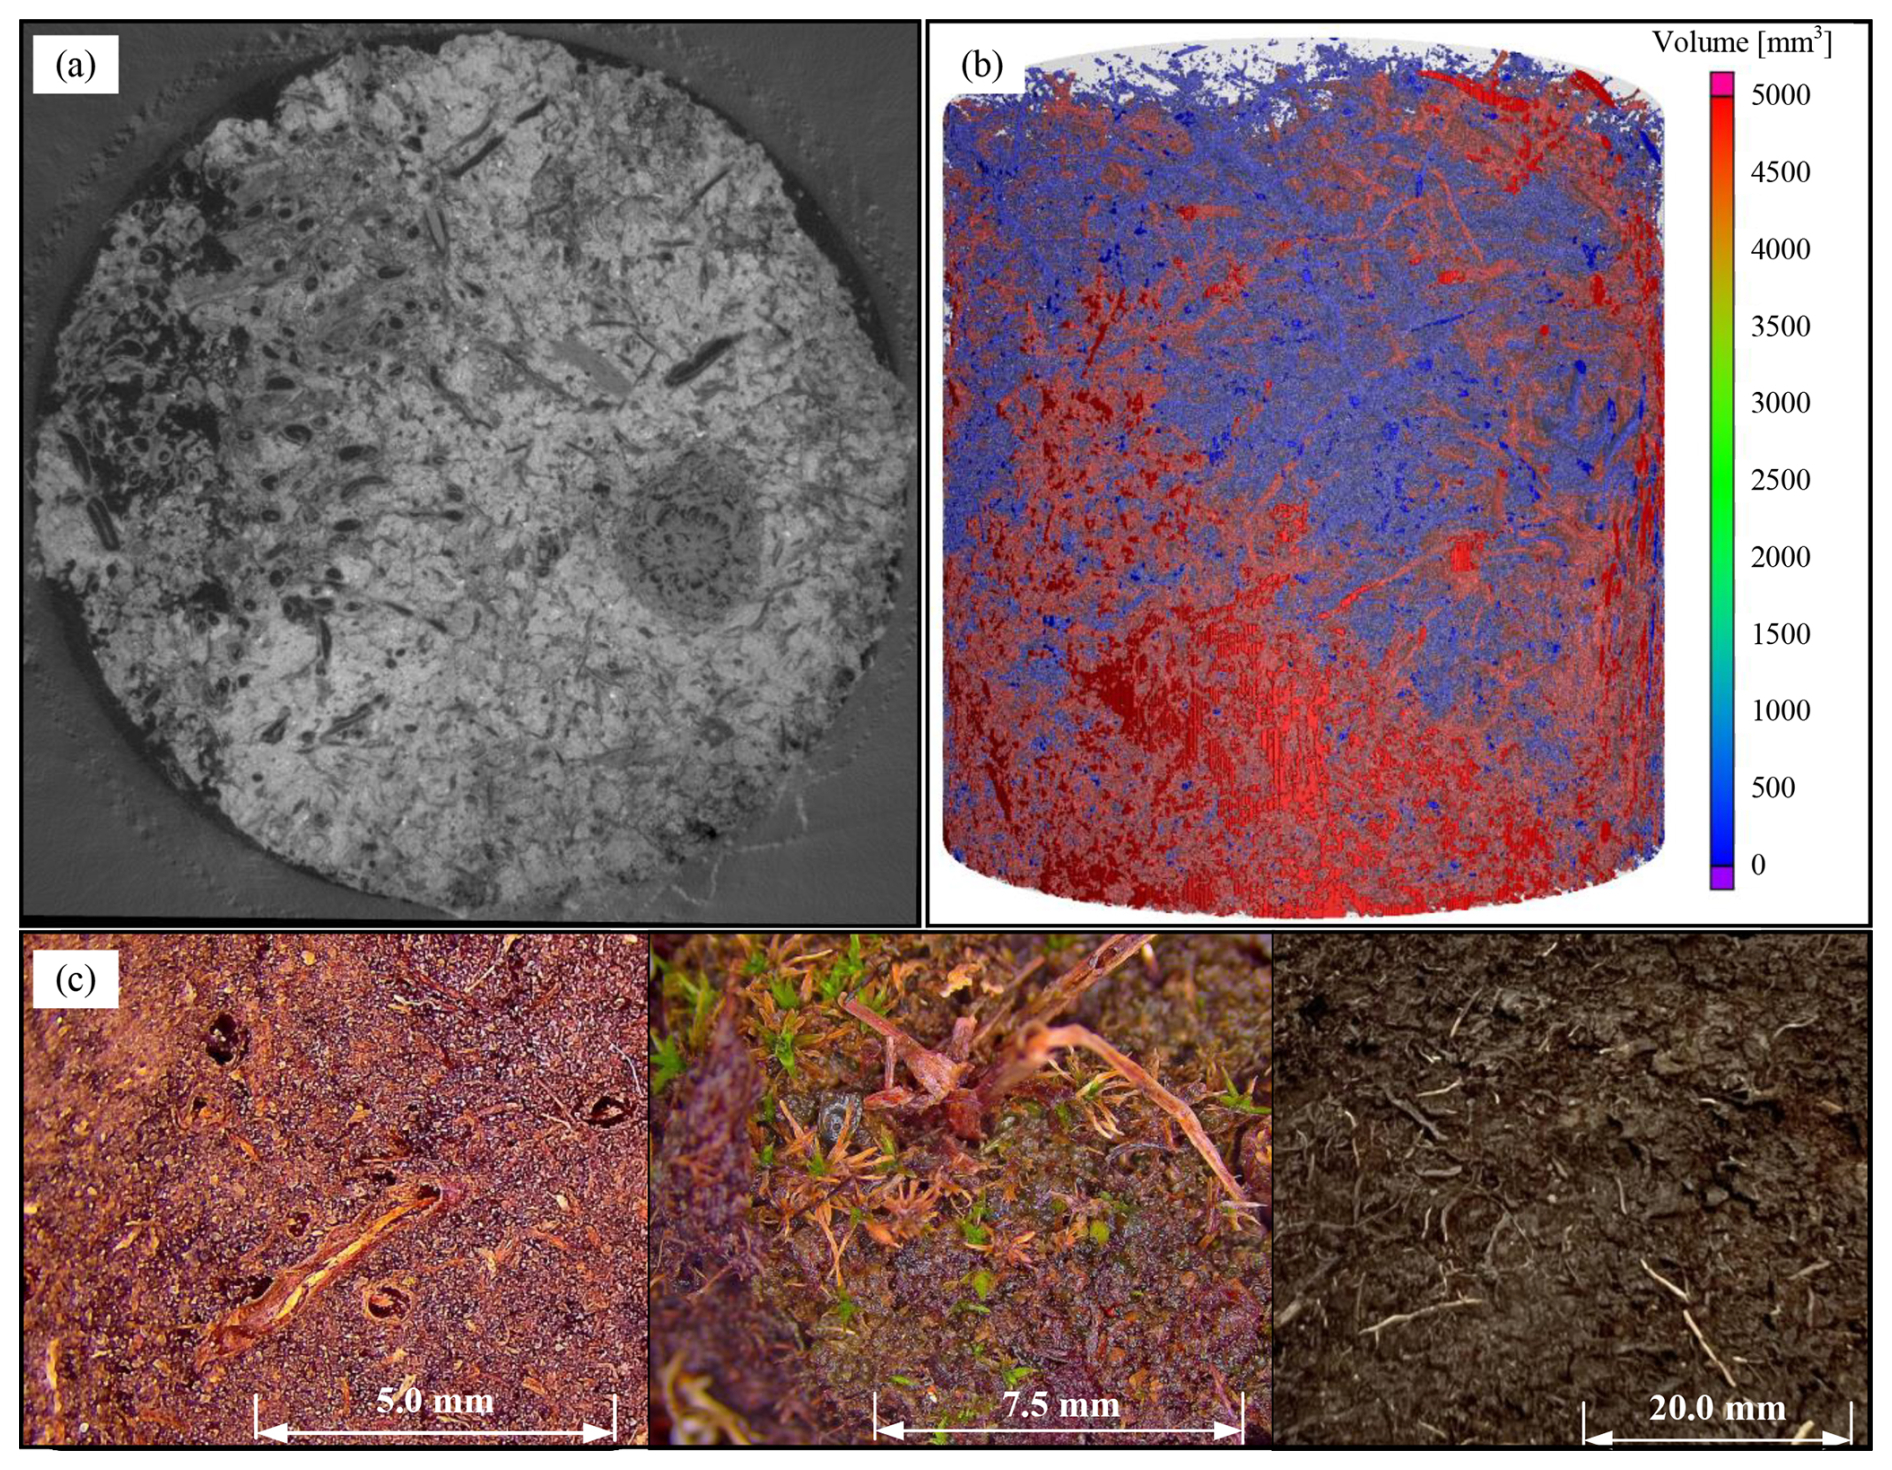
The macroscopic structure of the surface hydric soil in the Qinghai–Tibetan Plateau wetland at different observation scales is shown in Fig. 3 (bottom). At the 5.0 mm scale, elongated root channels and surrounding loose pores are visible, mostly formed by partially decomposed roots. These slender conduits tend to serve as preferential flow paths under alternating wet and dry conditions. At the 7.5 mm scale, densely intertwined sedge roots, litter, and fine plant residues combine with the soil matrix to form many connected biopores, which promote rapid surface infiltration and enhance linkage with macropore networks. At the 20 mm scale (moist state), the soil has a dark-brown to black in which fine root residues and humus are tightly bound, forming a stable micropore network that provides a strong water retention capacity. The structural features observed at different scales correspond well with the multiscale pore distribution revealed by CT imaging, together forming the hydraulic foundation of the wetland soil's distinctive water flow response.
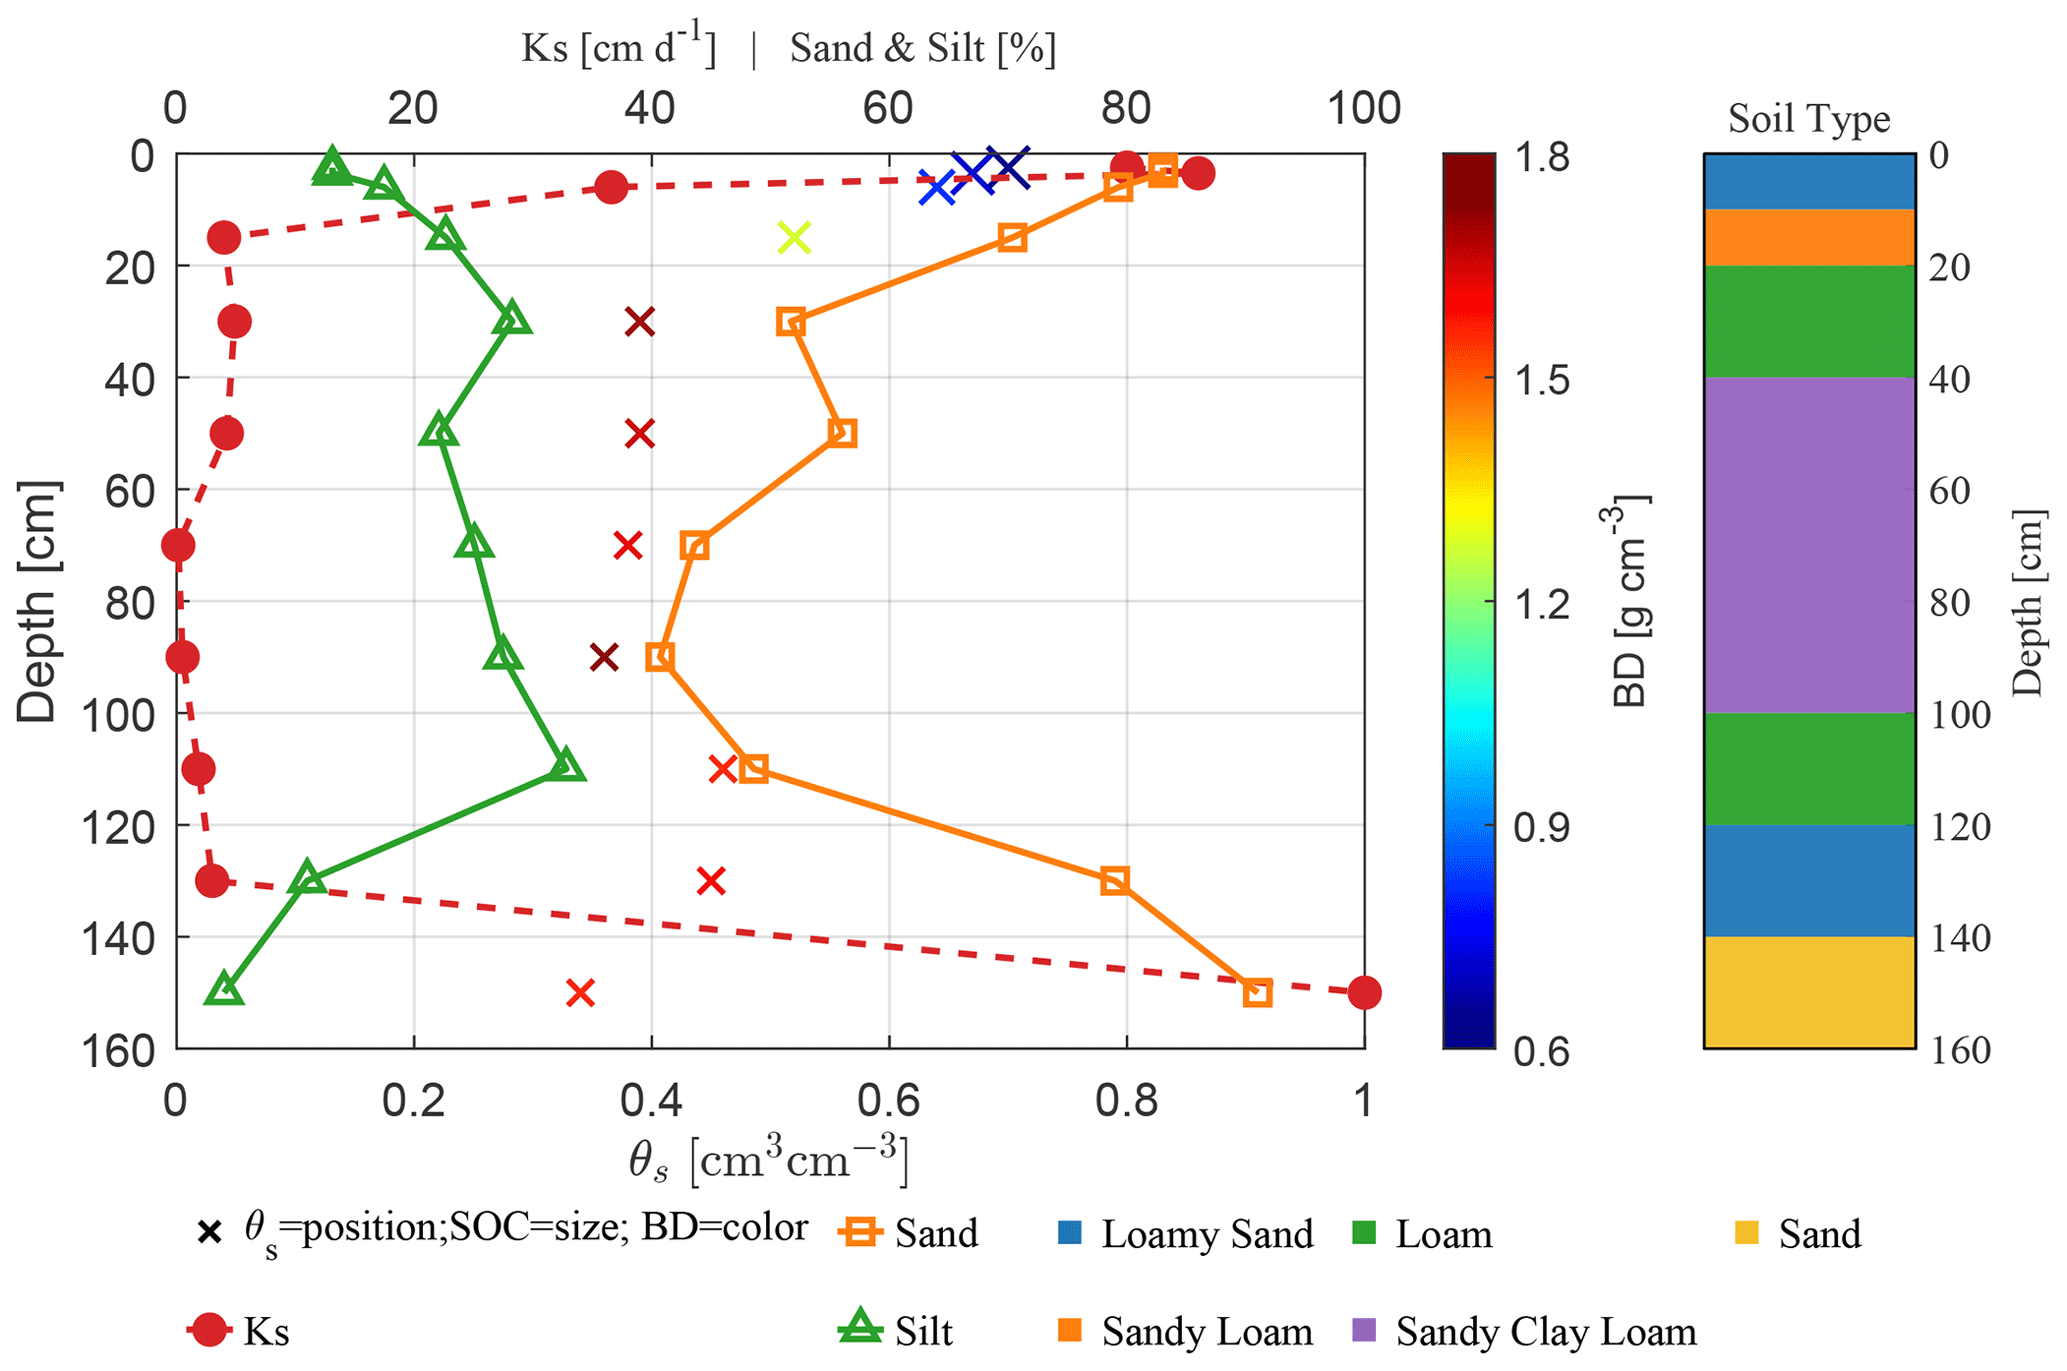
Figure 4Vertical distribution of hydraulic properties in the wetland soil. Crosses indicate sampling positions of θs; cross size represents SOC content, and color corresponds to BD. Red circles denote Ks; orange squares and green triangles represent sand and silt contents, respectively. The colored blocks on the right show the distribution of soil types at different depths (Loamy Sand, Loam, Sand, Sandy Loam, Sandy Clay Loam).
The vertical distribution of the soil hydraulic properties at the wetland observation site is shown in Fig. 4. In the surface layer (0–8 cm), the θs ranged from 0.64–0.70, which is much higher than the typical value of most mineral soils (<0.50). This high θs mainly results from the accumulation of organic matter, which increases the porosity and pore connectivity. High θs values also enhance water storage and capillary redistribution in the surface layer, delaying surface drying after rainfall and forming a natural water buffer zone. In contrast, mineral soils with closely packed particles have limited water retention capacity and tend to drain quickly after rainfall, leading to rapid moisture loss. With increasing depth, θs decreased to 0.34–0.46 with local fluctuations, approaching the characteristics of mineral soils. This outcome reflects a decrease in organic matter and an increase in mineral particle content with depth, which reduces porosity and accelerates downward percolation.
The Ks in the surface layer ranged from 36.6 to 86 cm d−1, much higher than that of typical mineral soils (<10 cm d−1). This result indicates the high permeability of the loose and porous organic layer. Such high Ks values allow rapid drainage during rainfall events, reduce surface ponding, and promote water exchange between the surface runoff and shallow groundwater in the wetland microtopography. In contrast, the compact structure and poor pore connectivity of mineral soils limit infiltration and may lead to surface water retention. In the deeper layers, Ks sharply decreased to 0.14 to 4.89 cm d−1, indicating a transition from a highly permeable layer to a low permeable layer, similar to a compacted mineral horizon. This gradient plays an important role in regulating water retention and vertical redistribution: the upper layer responds quickly to rainfall, while the lower layer retains water for a longer time but may limit the water supply to deep roots.
The distributions of the BD and SOC further support these observations. The surface layer had a low BD of 0.63 to 0.81 g cm−3 and a high SOC of 45 to 99 g kg−1, indicating loose and porous structure rich in organic matter that favors infiltration and root growth. In contrast, the deeper layer had a higher BD (1.57–1.74 g cm−3) and lower SOC (0.88–8.97 g kg−1), indicating dense mineral soil with limited water and gas exchange. In terms of particle composition, the surface soil contained high amounts of sand (40.7 %–91 %) and low amounts of silt (13 %–17 %), forming coarse pores and fast drainage channels, whereas the deeper layer contained lower amounts of sand and higher amounts of silt (22 %–32.8 %), increasing water retention but reducing permeability. This transition from coarse to fine texture is consistent with the decreasing trends of Ks and θs.
Overall, the wetland soil clearly has a vertical gradient characterized by high θs, high Ks, low BD, and high SOC in the surface layer. Compared with mineral soils, it has stronger water storage and faster hydraulic conductivity, while the deeper layer gradually approaches the physical characteristics of mineral soils. This pronounced vertical gradient controls the wetland's response to rainfall events and provides direct field evidence for the introduction of depth-dependent hydraulic parameterization in land surface models. The variations in these properties also influence key parameters in the CH model, such as the index b and ψs, providing a physical basis for the parameter inversion discussed in Sect. 3.2.
3.2 Hydraulic parameters derived from the evaporation experiment
For each depth specific soil core, the hydraulic parameters are derived from HYPROP 2 based curve fitting rather than from averaging multiple samples, while WP4C measurements are used to validate the dry end behavior of the water retention curves. Figure 5 shows the vertical distribution of key hydraulic parameters in the CH model, namely the power law index b and the ψs, which were derived from the evaporation experiment. The b parameter exhibited pronounced heterogeneity along the profile: 3.215 in the surface layer (0–6 cm), peaking at 5.076 in the subsurface (10–20 cm), and gradually decreasing with depth to 1.053 at 130–150 cm. In contrast, ψs exhibited a partially opposite pattern, with larger absolute values near the surface (−0.378 m), a minimum at the subsurface (−0.071 m), and an increase again in the deeper layer (−0.518 m). Compared with the Noah-MP default loamy sand parameters (b=4.26, m), the measured results reveal pronounced vertical variability.
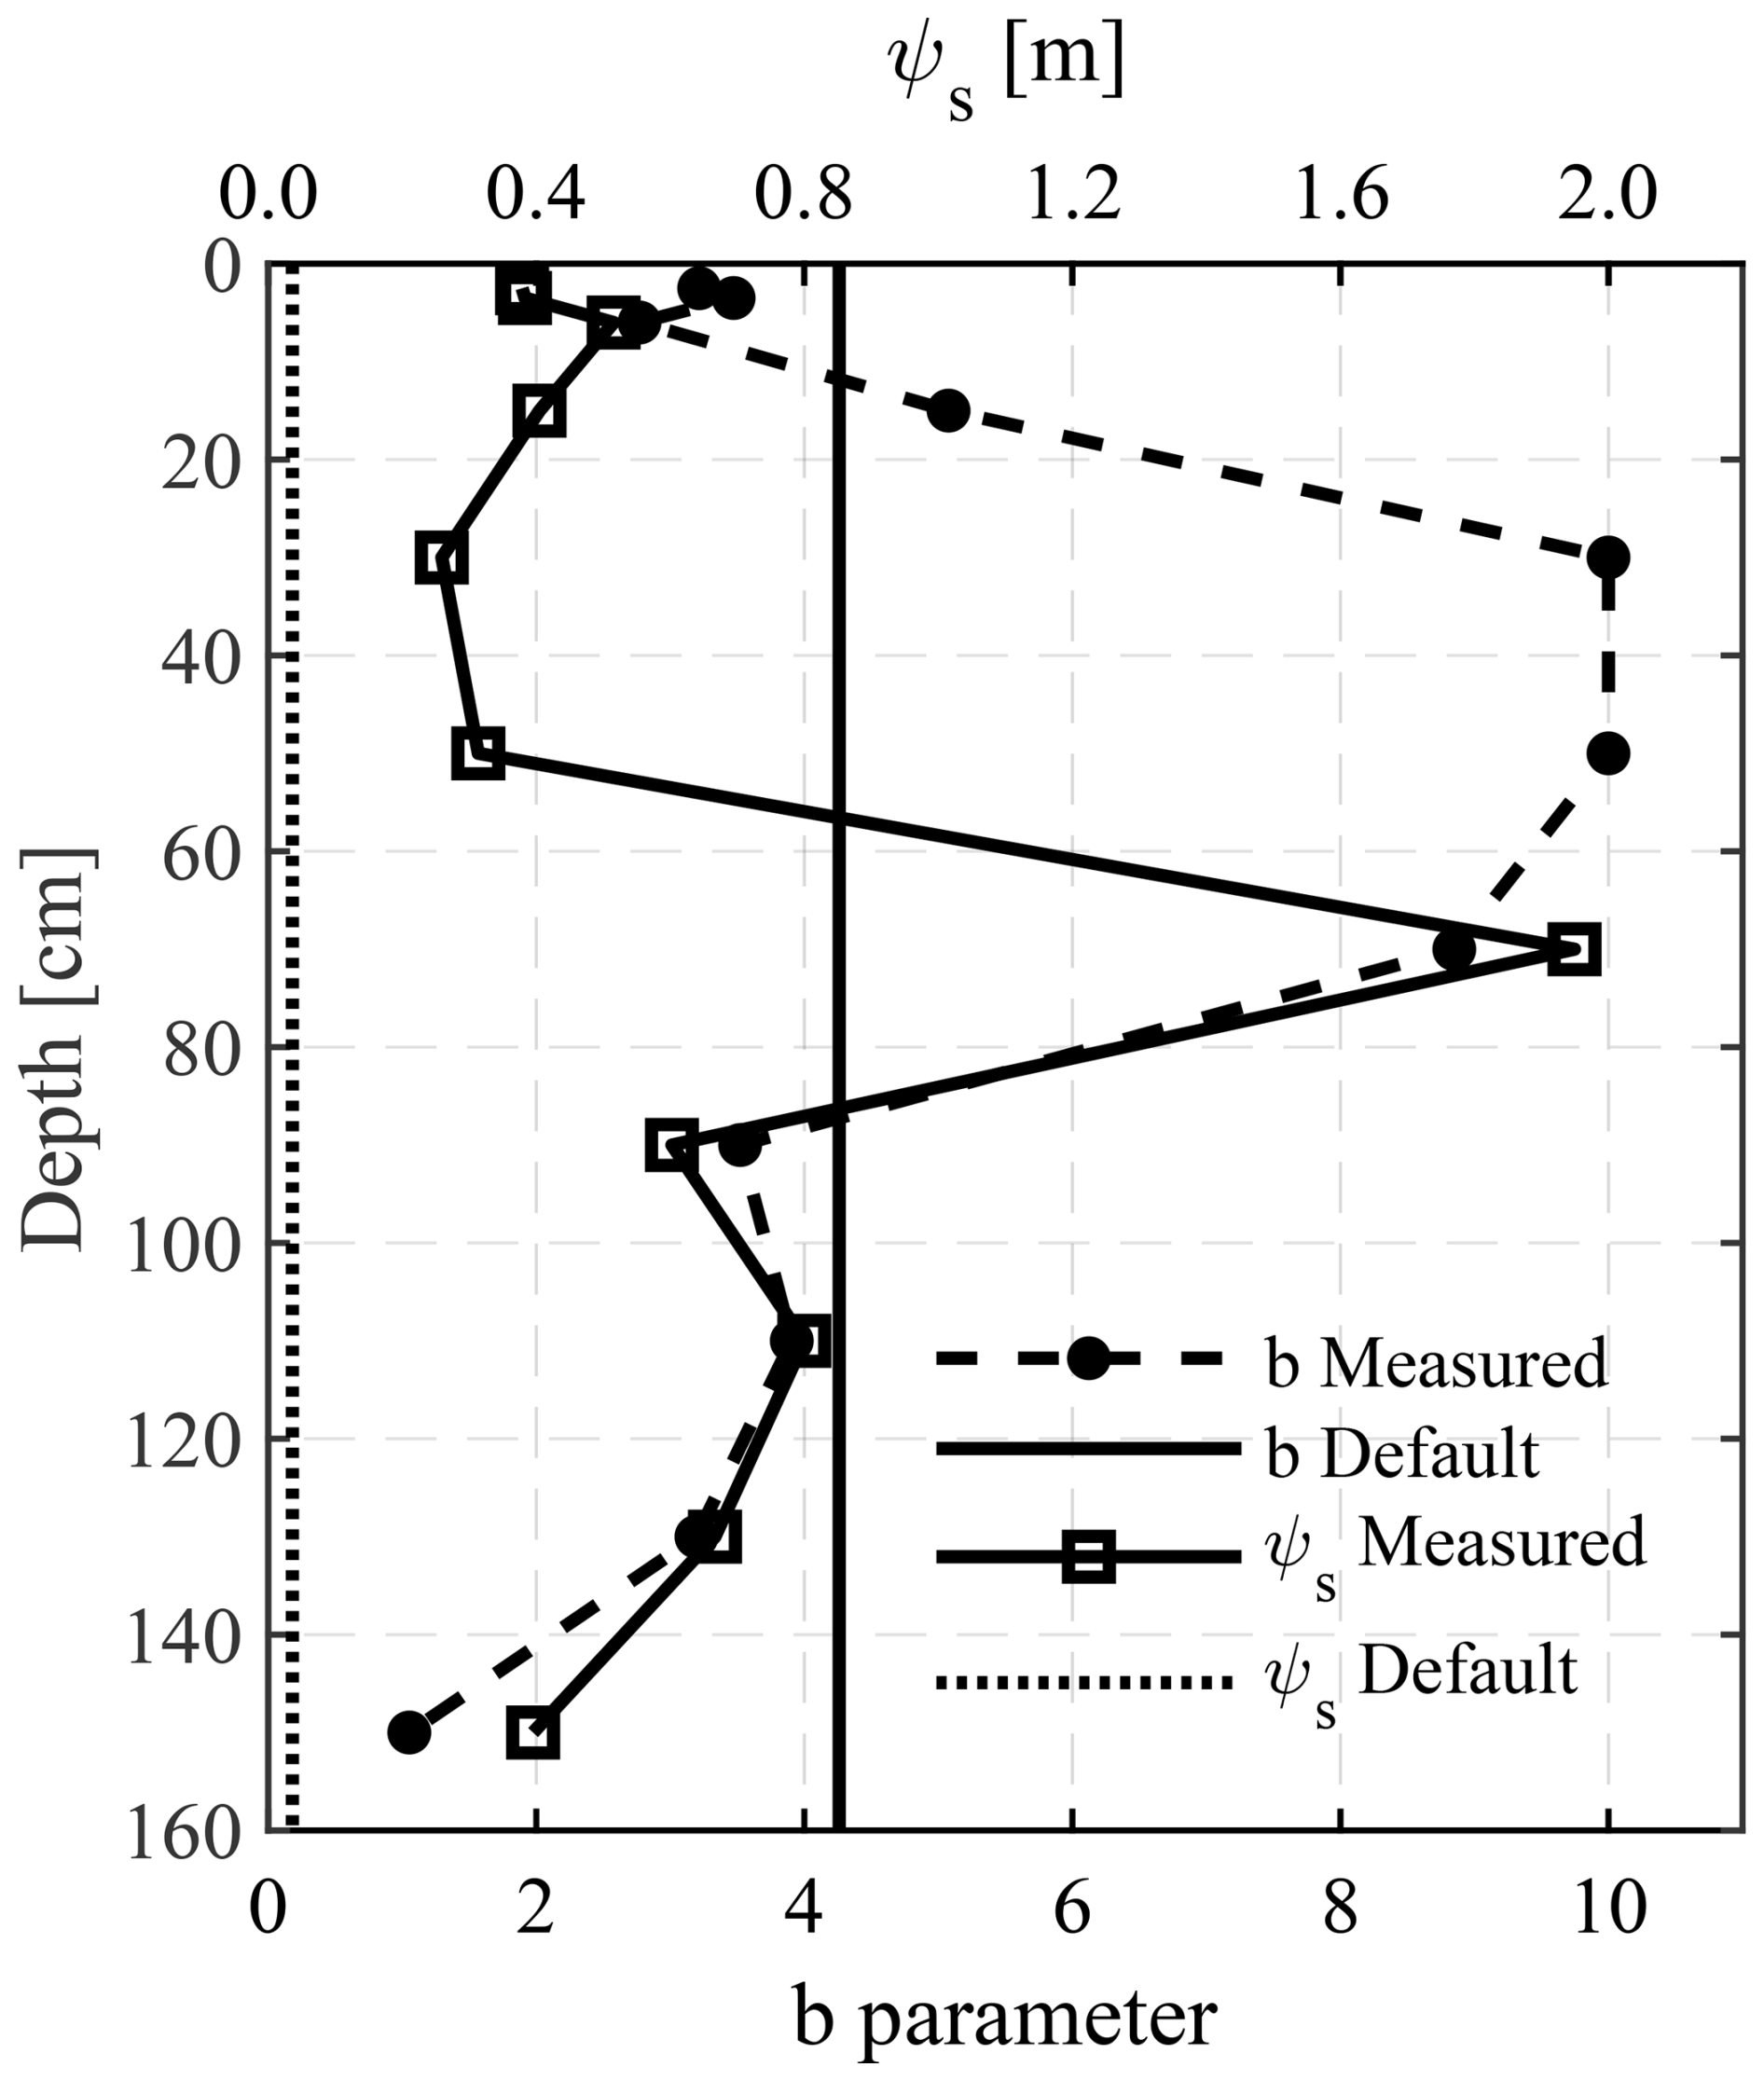
Figure 5Comparison of the ψs and the index b obtained from evaporation experiments with the Noah-MP default parameters.
In the CH formulation, b governs the slope of the water retention curve in the drying range, whereas ψs defines the onset of the near saturated segment. The combination of lower b and higher in the measured profiles produces a flatter water retention curve near saturation and a gentler slope under drying conditions, indicating a strong water retention and slow release behavior. This pattern is in agreement with the physicochemical characteristics described in Sect. 3.1. The surface and deep layers, which are enriched in SOC and exhibit low BD, contain a highly porous structure that enhances capillary water retention. In contrast, the elevated b and reduced ψs in the subsurface may reflect its higher BD, greater silt fraction, and narrower pore size distribution.
Quantitatively, deviations in b from the default values can alter the water retention curve slope by 30 %–50 % in the intermediate moisture range (θ≈0.2–0.4 m3 m−3), whereas the increase in ψs substantially prolongs the transition from saturated to unsaturated conditions. The default parameters fail to capture this structurally driven water retention mechanism in wetland soils, leading to potential overestimation of the drying range storage capacity and misplacement of the water retention curve onset, thereby impairing the accuracy of the simulated evapotranspiration and land–atmosphere hydrothermal fluxes.
3.3 Relationships between the physical properties and hydraulic parameters
The Pearson correlations between the soil physical properties and the CH model parameters are shown in Fig. 6. Pearson correlations were calculated from 11 depth-based paired observations across the soil profile. The correlation patterns reveal the coupled evolution of the soil water retention and conductivity along the vertical profile. The b parameter was significantly negatively correlated with the sand content (, p=0.037), indicating that layers with coarse grains (e.g., the surface and deep layers with 79 %–91 % sand) generally exhibited lower b values (1.053–3.472). Such layers feature flatter water retention curves, weaker nonlinear water retention, and greater water loss potential. In contrast, b was positively correlated with silt (r=0.565, p=0.070), where the elevated silt fraction (22 %–32.8 %) in the middle layer enhanced the water retention capacity, leading to higher b values (5.076–10) and steeper water retention curves with slower desaturation. In addition, b exhibited a positive correlation with BD (r=0.427, p=0.190), suggesting that a denser soil structure increases the water retention curve curvature and delays water release. In contrast, its weak negative correlation with the SOC (, p=0.391) implies that abundant surface organic matter may buffer the increase in b, maintaining smoother moisture dynamics. Overall, the vertical variation in b indicates a transition from rapid water release near the surface to stronger retention in the subsurface, reflecting a heterogeneous retention mechanism characteristic of wetland soils.
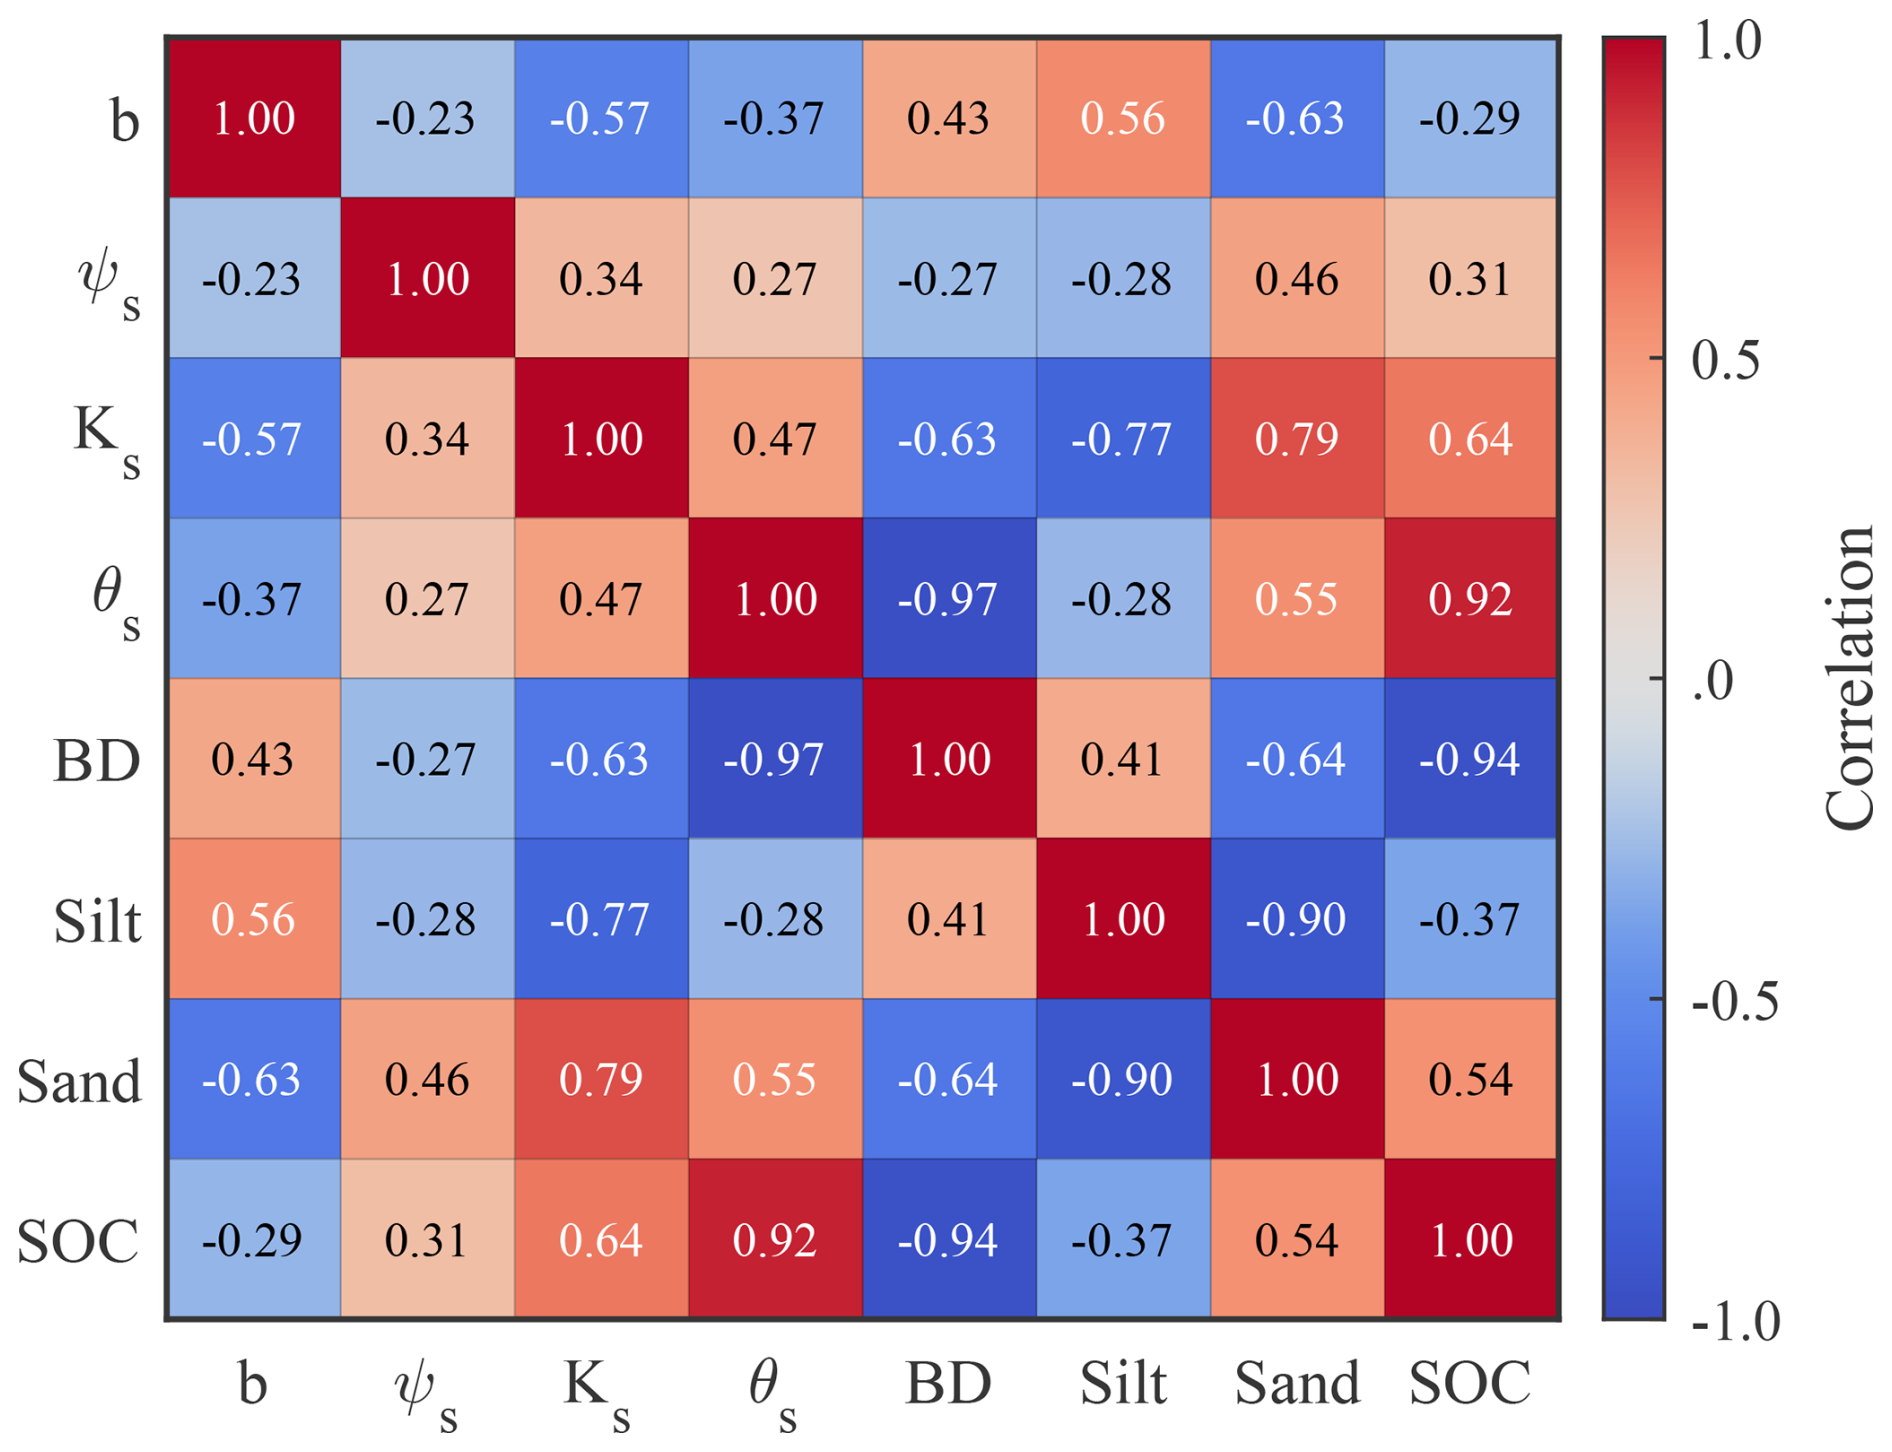
The ψs was positively correlated with sand (r=0.460, p=0.154), implying that a coarse texture reduces capillary retention (smaller ) and weakens near saturated water holding but favors rapid drainage. ψs was also positively correlated with the SOC (r=0.310, p=0.353), indicating that high surface organic matter content (45–99 g kg−1) enhances micropore suction, resulting in more negative ψs (−0.379 to −0.515 m) and stronger water retention. Its weak negative correlation with silt (, p=0.412) suggests that the contribution of fine particles to the increase in suction is limited. Notably,ψs was positively correlated with Ks (r=0.344, p=0.301), indicating that weaker suction (smaller ) facilitates higher hydraulic conductivity. For example, in the surface layer where m, Ks reached 86–100 cm d−1, whereas in the middle layer ( m), Ks decreased to 0.143 cm d−1. This relationship highlights a shift from efficient drainage near the surface to slower percolation in the subsurface.
Finally, the negative correlation between b and ψs (, p=0.494) indicates that the surface layers typically exhibit low b values and more negative ψs (e.g., b=2.770–3.472; to −0.515 m), which enhances the near saturated water retention but accelerates moisture loss under dry conditions. Conversely, the middle layer has a high b (5.076–10) and more negative ψs (−1.949 m), reflecting stronger nonlinearity in water retention curve behavior with enhanced retention but suppressed conductivity. These relationships jointly reveals a distinct hydraulic gradient: low b and small |ψs| near the surface promote rapid infiltration (Ks=36.6–100 cm d−1), whereas high b and large |ψs| in the middle layer suppress water movement (Ks<5 cm d−1).
Overall, the wetland soil profile exhibits a vertically coupled hydraulic mechanism characterized by dynamic water release in the surface layer and strong retention in the subsurface. The conductivity correspondingly transitions from efficient drainage near the surface to slow percolation with depth. This covariation in hydraulic parameters, which is jointly controlled by the soil texture, organic matter, and compaction, provides an intrinsic buffering capacity under uneven precipitation–evapotranspiration conditions and imposes higher demands on land surface model parameterization and vertical discretization.
3.4 Analysis of the soil hydraulic properties
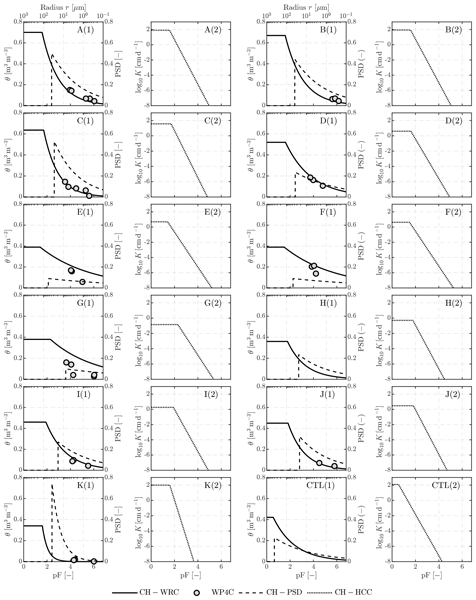
The measured and default water retention and hydraulic conductivity curves of wetland soils at different depths are shown in Fig. 7. Each curve represents the fitted hydraulic response of a single undisturbed soil core at a specific depth, rather than an average across multiple samples. Panel (1) simultaneously displays the WRC and the PSD, while panel (2) shows the HCC. The CTL denotes the Noah-MP default parameterization. In panel (1), the lower x axis represents the matric potential (pF), and the upper x axis corresponds to the equivalent pore radius (radius, µm). The y axis in panel (1) denotes the volumetric water content θ (m3 m−3), and in panel (2), it denotes the hydraulic conductivity K (cm d−1). The letters (A to K) in the upper right corners correspond to the soil layers at different depths, as summarized in Table 3.
Table 3Depth intervals corresponding to the layer labels used in Fig. 7 (vertical profiles of measured vs. default WRC and HCC in wetland soil).
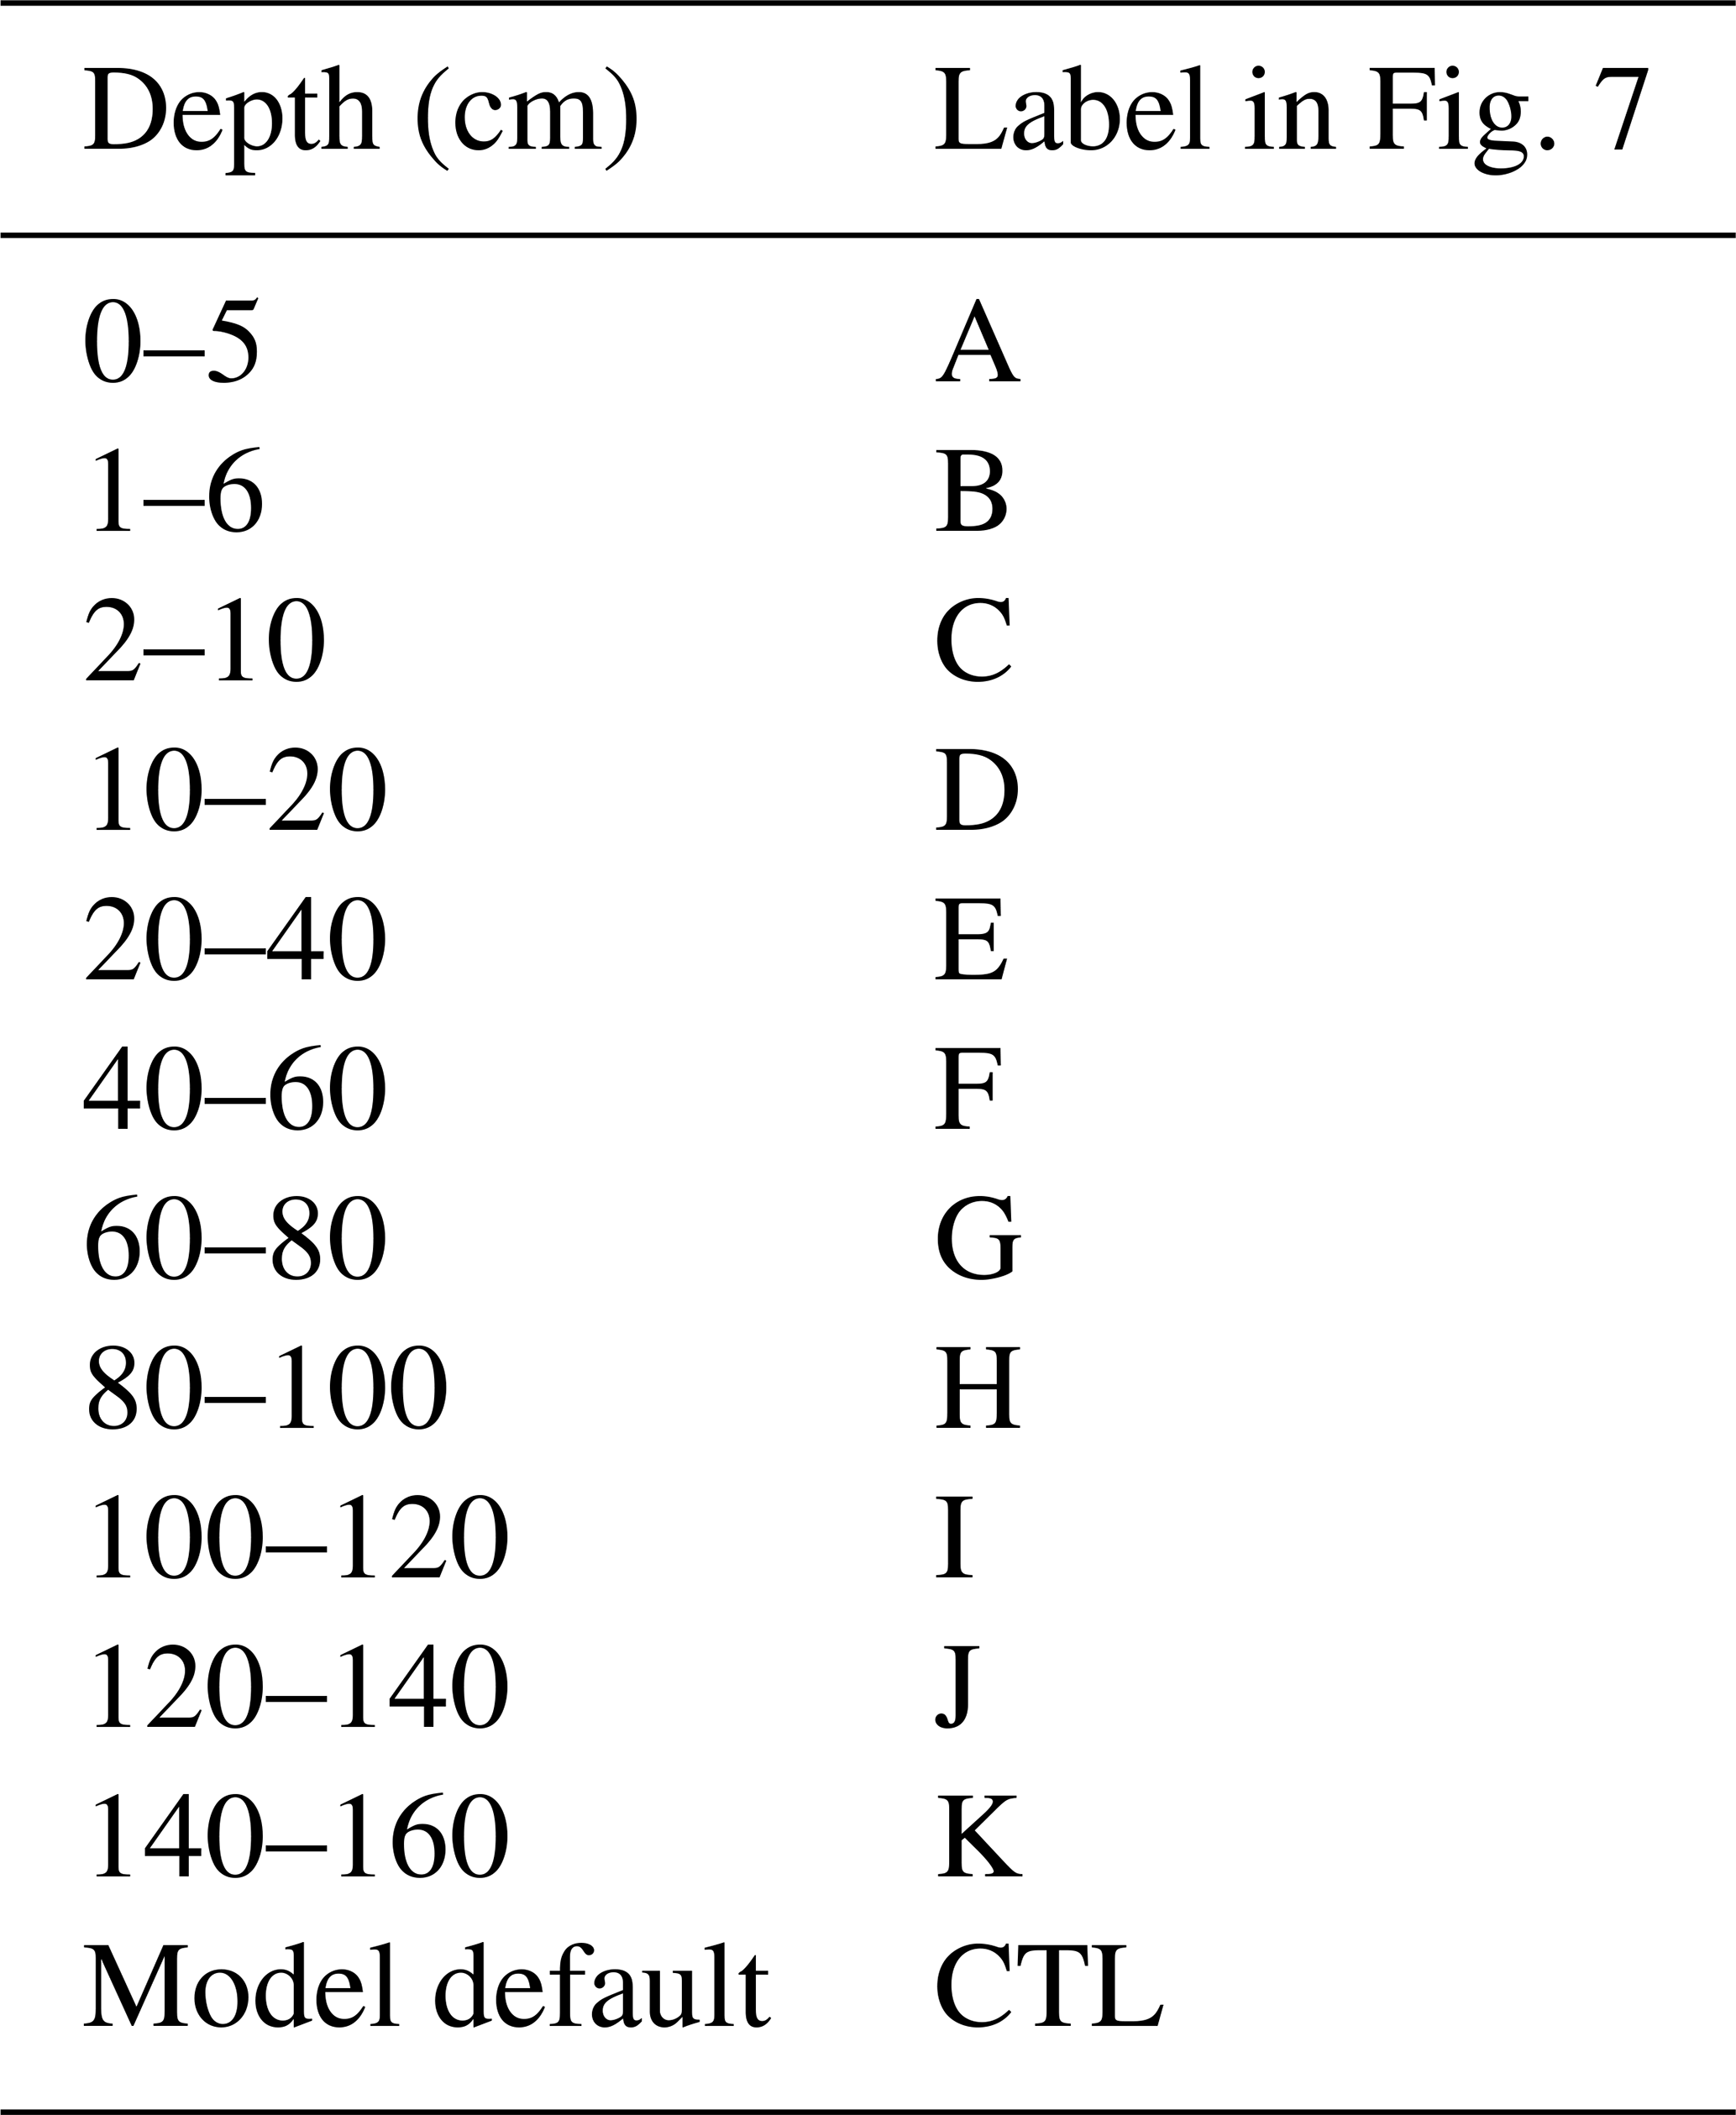
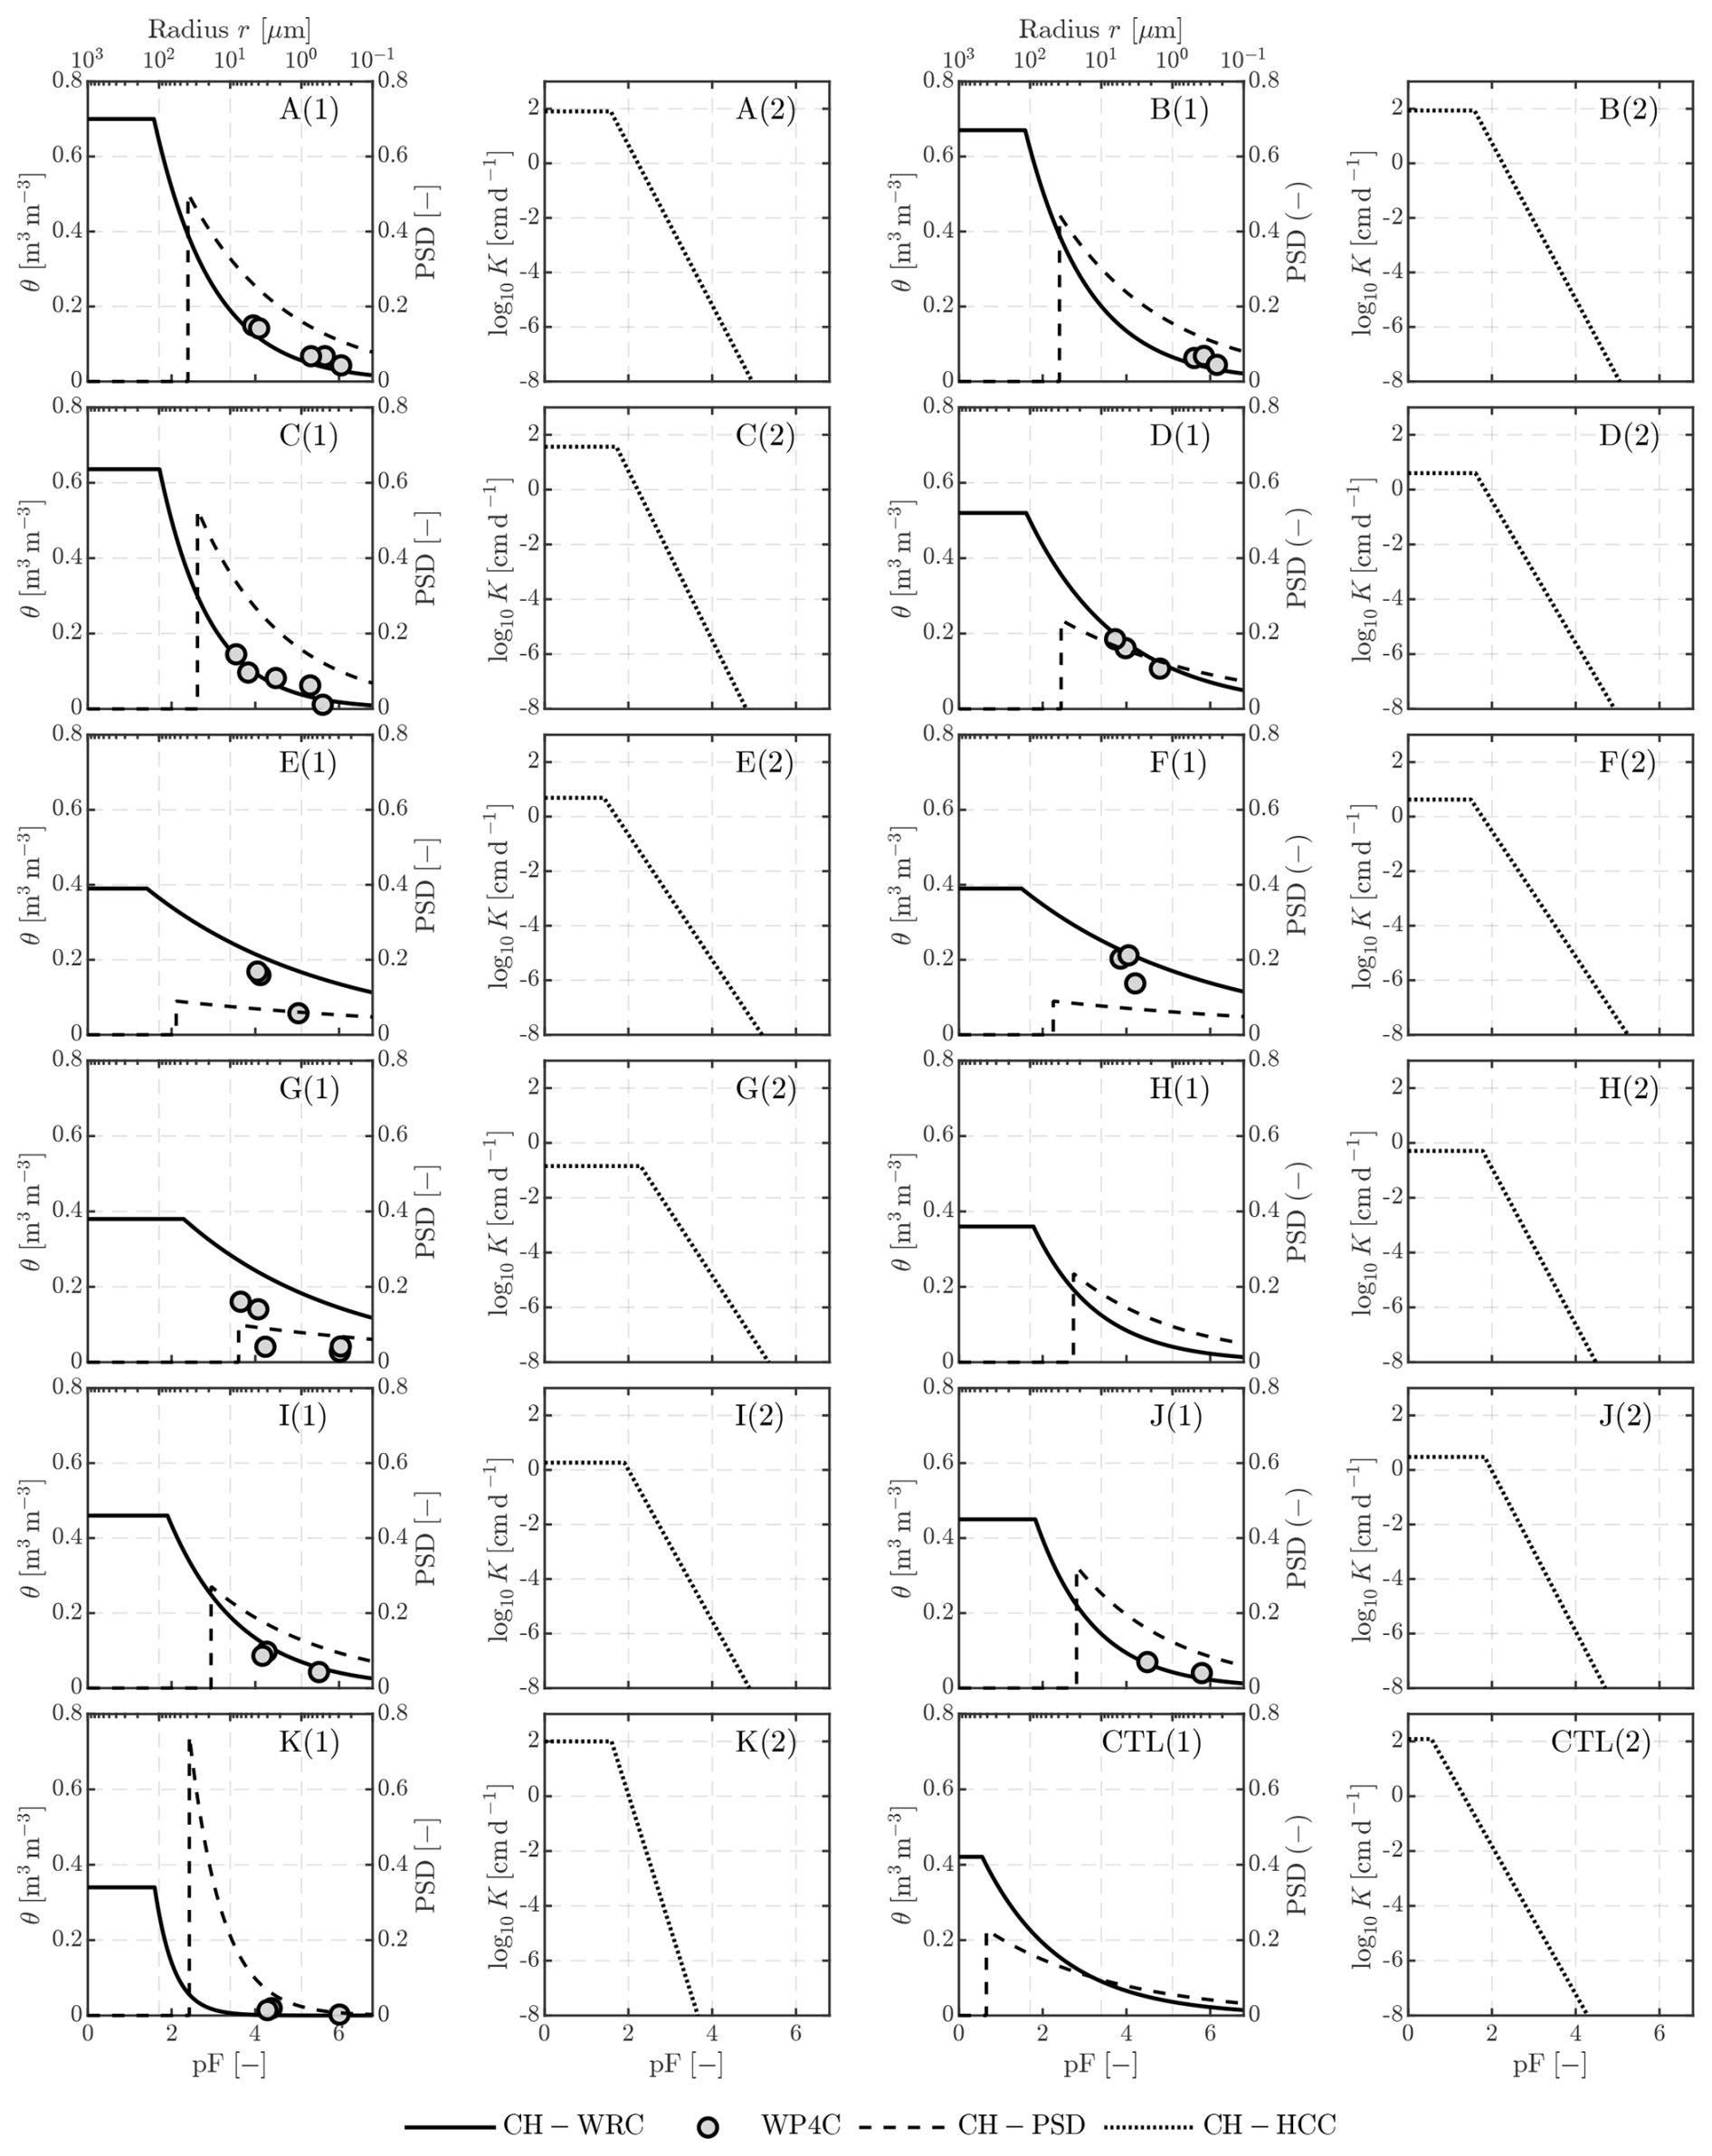
Figure 7Vertical profiles of measured and modeled WRC, PSD, and HCC for different soil depths (solid line: CH–WRC; dashed line: CH–PSD; dotted line: CH–HCC; gray circles: WP4C measurements).
The water retention and hydraulic conductivity curves at various depths further confirm the variations in the key parameters b and ψs identified in Fig. 5 and reveal the vertical differentiation of the water retention and release mechanisms in wetland soils. In the surface layer (A–C, 0–10 cm), the initial water content θ at the near saturated end is markedly greater than that in the middle layer (D–F, 10–60 cm), indicating a higher drainable porosity and better macropore connectivity. Its hydraulic conductivity curve remains relatively high and declines slowly in the low suction range, reflecting strong permeability and sustained hydraulic conductivity. As desaturation begins, the surface layer drains more rapidly, whereas the middle layer, with narrower pores, is characterized by stronger water retention and a faster decrease in conductivity. In the middle layer (D–F, 10–60 cm), the water retention curve becomes markedly steeper within the moderate suction range (pF ≈2–3), where the volumetric water content decreases sharply from approximately 0.50 to 0.25 m3 m−3, indicating a higher proportion of mesopores and a slower dehydration rate. Moreover, the hydraulic conductivity curve decreases abruptly from 10−4 to 10−6 m s−1 over the same range, suggesting weak connectivity between flow pathways. Together, these features demonstrate a pronounced increase in water retention and a decrease in conductivity in the middle layer. In the deeper layers (G–K, 60–160 cm), the water retention curve decreases steeply in the wet range, and the hydraulic conductivity curve exhibits almost no plateau, indicating a micropore-dominated structure with strong capillary suction but low hydraulic efficiency. Notably, the CH model has a limited ability to resolve macropore drainage under low suction conditions, leading to an underestimation of the macropore contributions and a curve shape biased toward medium and small pores. Therefore, the interpretation of the near saturated θ and its physical meaning in the surface layer should be supported by a combined analysis of θs, the BD, and the pore structure imaging. Overall, both the water retention and hydraulic conductivity curves exhibit a clear vertical transition from rapid drainage dominated by macropores to slow release governed by finer pores, reflecting the stratified mechanisms of water retention and transmission in wetland soils.
The WP4C measurements (gray circles) show overall consistency with the CH-modeled water retention curves across depths, confirming the reliability of the inversion parameters. The fitting accuracy is higher in the middle layers (D–F, 10–60 cm) and the deep layers (G–K, 40–160 cm). The model reproduces the relationship between water content and matric potential well, indicating that the retrieved b and ψs are physically representative in intervals dominated by fine pores. However, slight deviations appear in the surface layer (A–C, 0–10 cm) near saturation, reflecting the CH model's limited ability to resolve macropore drainage and its tendency to underestimate the surface hydraulic potential. These results verify the validity of the inversion parameters while revealing the structural limitations of the CH model under near saturated conditions.
The comparison between the measured water retention and hydraulic conductivity curves at different depths and the Noah-MP default results reveals systematic biases arising from parameterization assumptions when simulating soil hydraulic responses. The default water retention curve decreases slowly in the medium-to-high suction range, and the hydraulic conductivity curve maintains a high conductivity plateau near saturation, reflecting an idealized representation of the macropore structures. In contrast, the measured curves in the middle and deep layers are generally steeper and exhibit lower hydraulic conductivity, indicating stronger water retention and pronounced stagnation. The surface layer curves are closer to the default results; however, the limited ability of the CH model to resolve macropore drainage under low suction conditions likely underestimates the surface hydraulic potential, leading the default parameters to overestimate the near surface conductivity and underestimate the subsurface water retention. Particularly for the hydraulic conductivity curve, the default parameterization produces significantly higher conductivities in the middle and deep layers, which may cause the model to overpredict the soil moisture response during dry periods, thereby weakening the wetland's slow release and stable storage behavior. These discrepancies highlight the necessity of optimizing hydraulic parameterization schemes based on the measured pore structure characteristics to improve land surface model simulations of soil moisture dynamics.
The PSD features at different depths can be observed from the upper x axis of Fig. 7(1), which represents the equivalent pore radius (radius, µm). The surface layer exhibits PSD peaks concentrated in the larger pore range (approximately 10–100 µm), indicating a higher proportion of macropores and greater connectivity that facilitate rapid drainage and evaporative replenishment.
In the middle layer, the pores become finer and are distributed mainly within 1–10 µm, indicating that smaller pores dominate, that drainage pathways narrow, and that the water holding capacity increases, which is consistent with higher b and values. In the deeper layer, the PSD peaks further shift toward radii <1 µm, indicating micropore dominance with strong capillary suction but poor permeability. The deepest layer has a slightly flatter PSD, implying a more uniform structure with low but stable conductivity. Overall, the pore radius decreases with depth but then slightly increases, reflecting a vertical transition in wetland soils from rapid drainage in the surface layer to gradual release in the middle layer and stable storage in the deep layer. This stratified hydraulic structure underpins the dynamic hydrological responses of wetland soils under varying hydrometeorological conditions and highlights the importance of accounting for vertical heterogeneity in the pore size distribution when parameterizing land surface models.
3.5 Results of the analytical indicators
The distribution of the effective exponent beff across soil layers under different degrees of saturation (S=0.1–0.9) is shown in Fig. 8. Overall, beff clearly varies with saturation, showing strong state dependence. In the intermediate moisture range (S≈0.3–0.6), most layers maintain values of 2–5, reflecting water retention and slow release governed by mesopores. In the range near saturated (S≥0.8), beff in the surface and middle layers increases sharply, reaching 15 to 20 in some cases, indicating enhanced macropore connectivity and more rapid infiltration and drainage. In contrast, the deep layers (>100 cm) have lower and more stable beff values, suggesting the dominance of micropores and compact structures with limited dynamic conductivity. The missing values at S=0.1 or 0.2 result from the limited number of WP4C samples in the dry range, leading to insufficient coverage at the very dry end. To avoid uncertainties caused by extrapolation, these intervals were retained as NaN, and the interlayer comparisons were performed mainly for S=0.2–0.9.
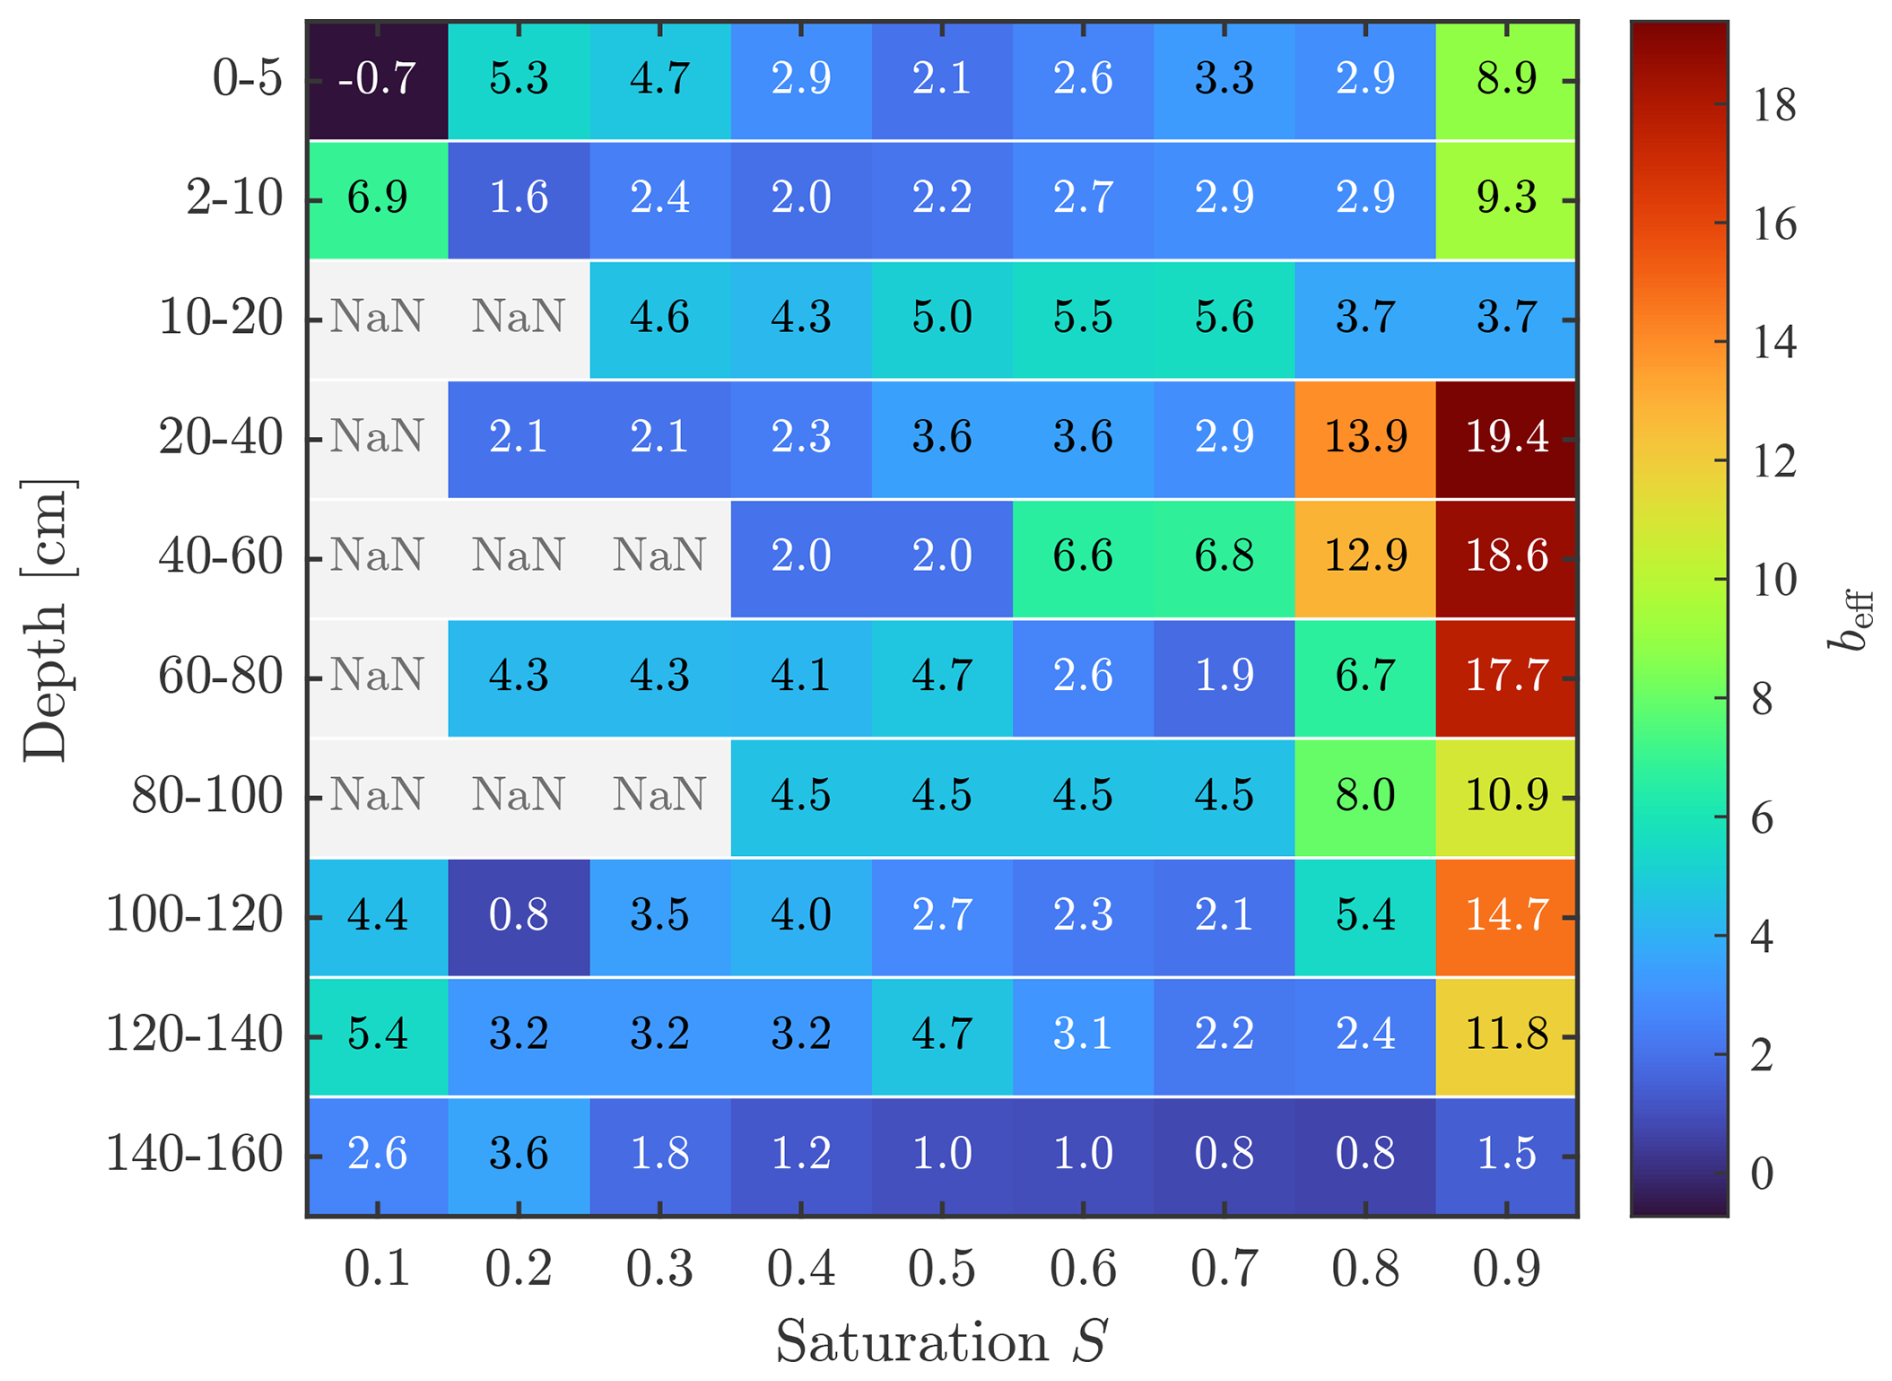
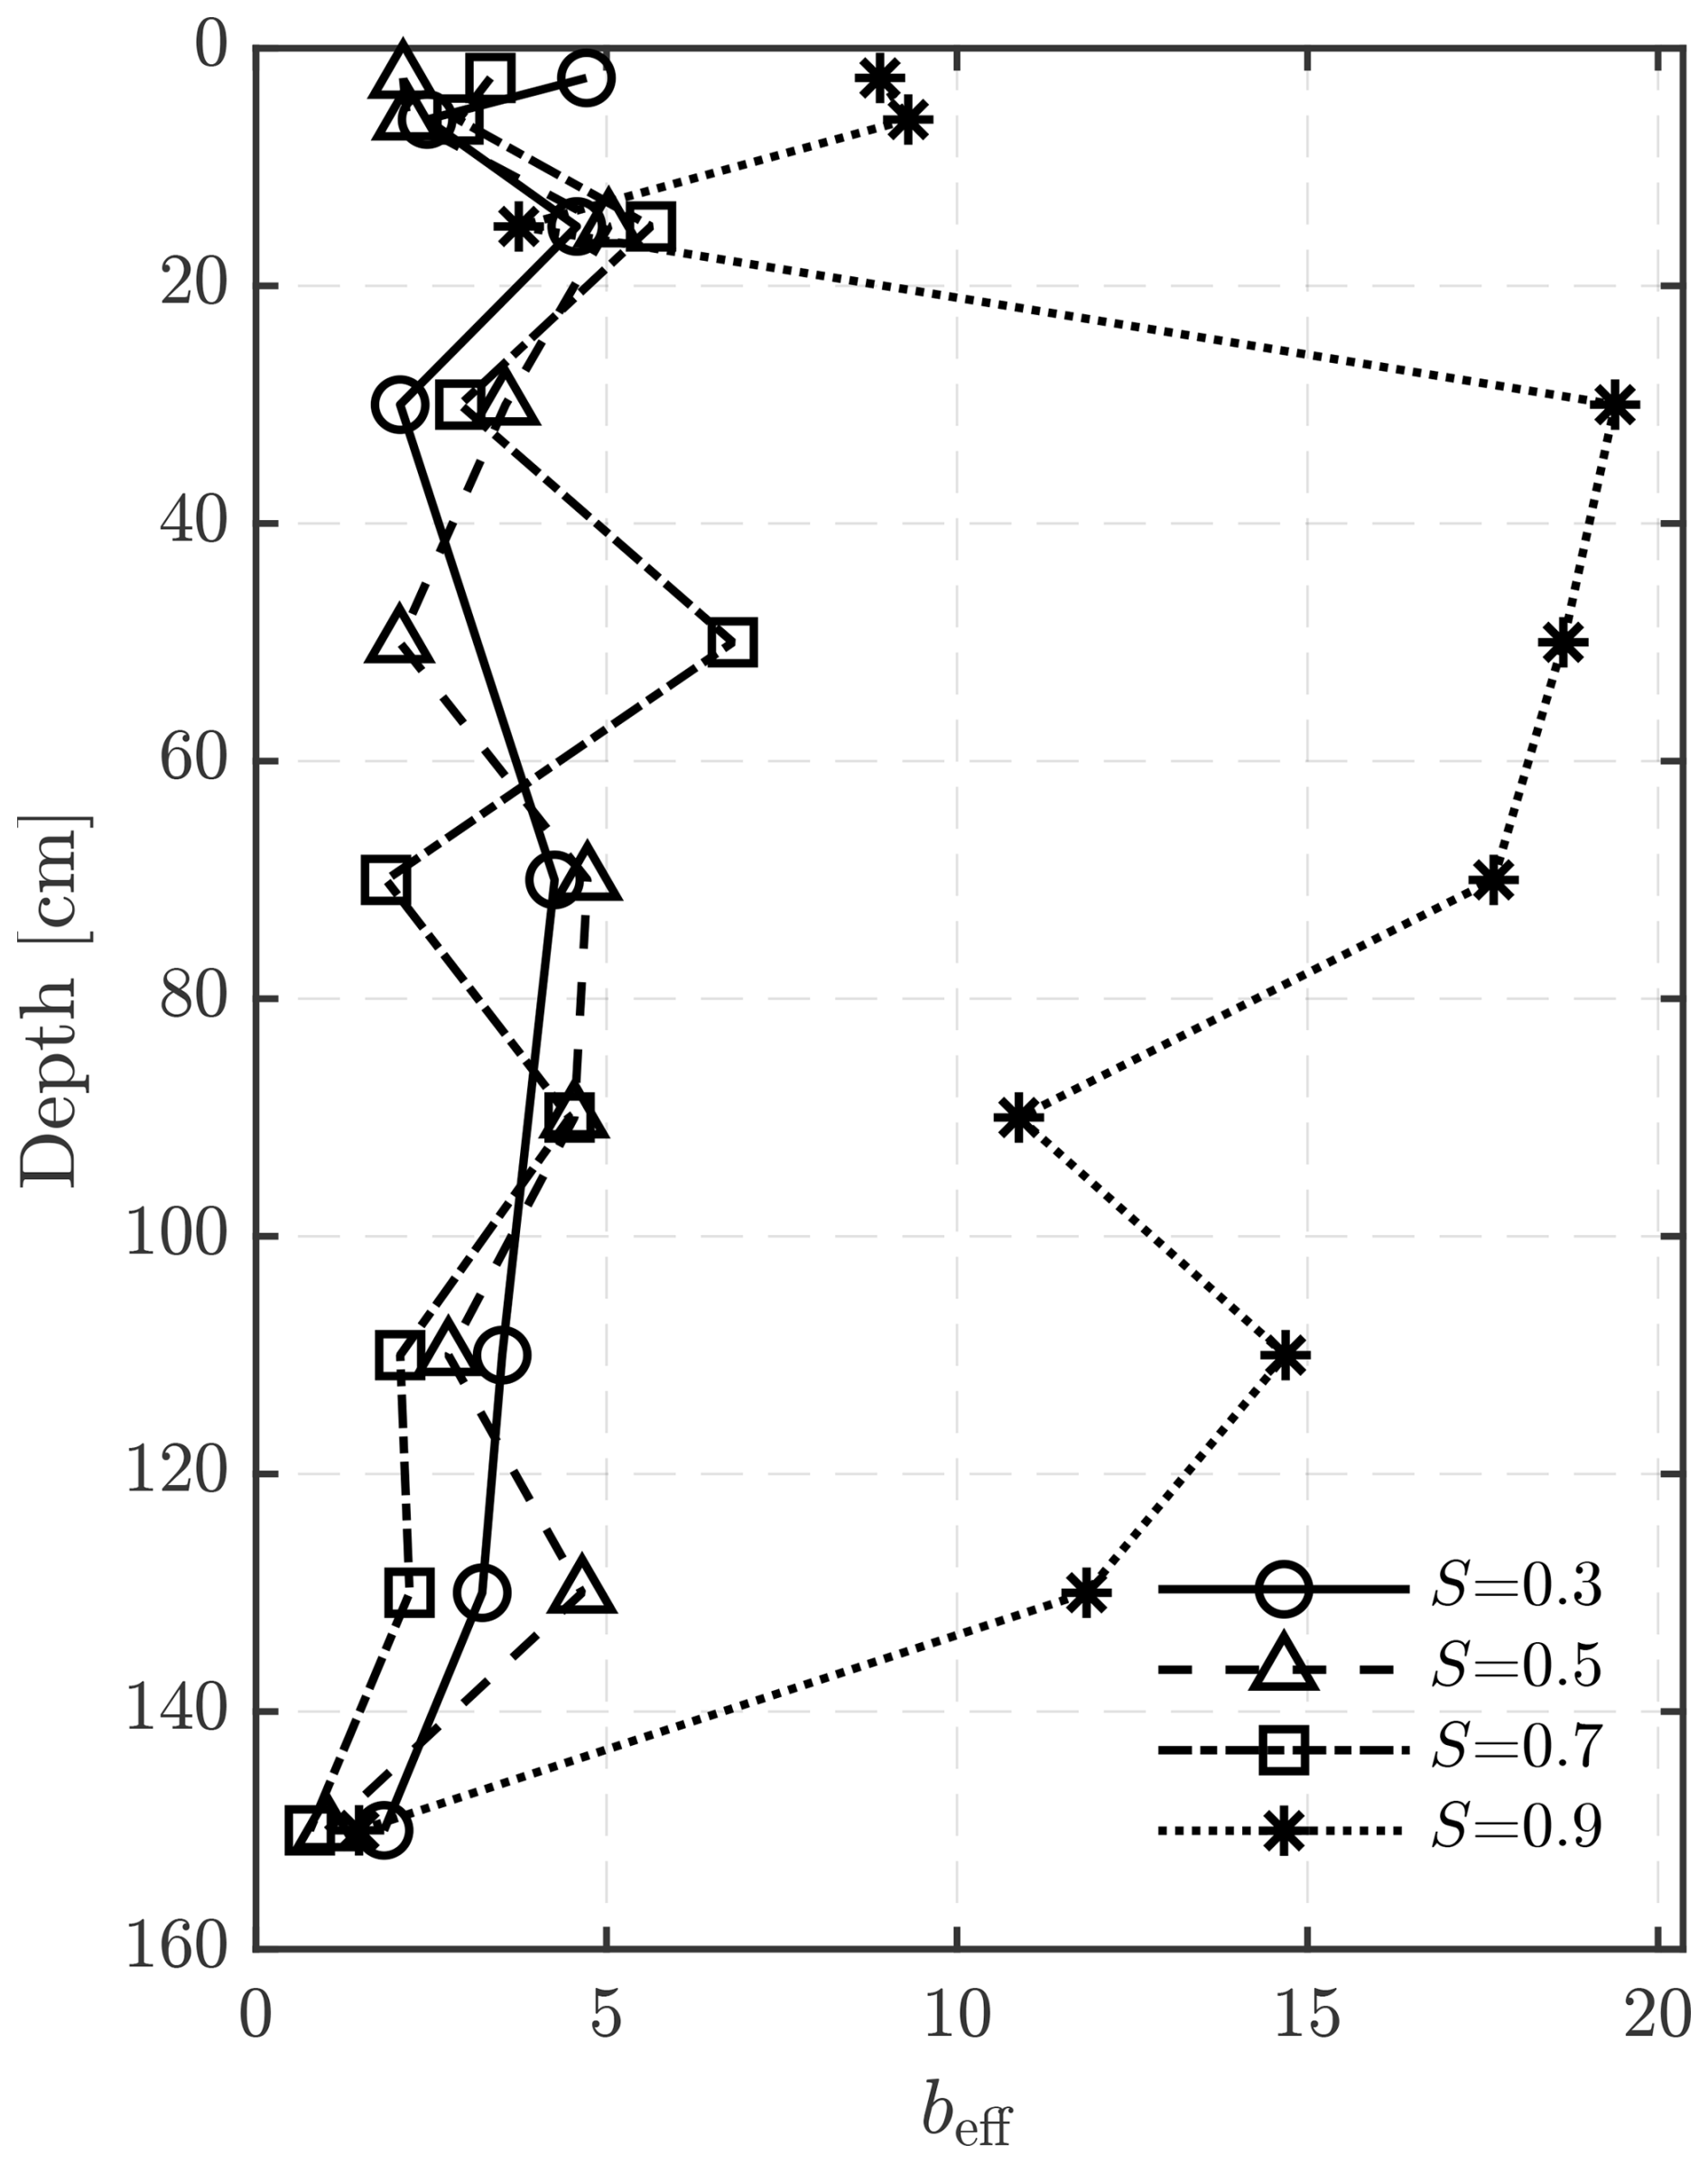
The vertical distribution of the effective exponent beff under typical saturation levels (S=0.3, 0.5, 0.7, and 0.9) is shown in Fig. 9, highlighting the differences among soil layers. Under intermediate moisture conditions (S=0.3 and 0.5), the beff in the subsurface layer (10–40 cm) is significantly greater than that in the surface and deep layers, indicating pronounced mesopore-controlled water retention and slow release, which serve as the main contributors to soil moisture maintenance and sensible heat regulation during dry periods. Under wetter to near saturated conditions (S=0.7 and 0.9), the beff in the surface and middle layers (0–60 cm) increases sharply, reflecting the dominant role of macropores in facilitating rapid infiltration and drainage following rainfall – an essential control on the enhanced LHF during wet periods. The deep layer (>100 cm) maintains consistently low values of beff across all S levels, suggesting limited hydraulic conductivity and primarily providing background soil moisture storage. Overall, the results indicate that different layers play distinct roles in water regulation under varying moisture states and that a single constant b cannot simultaneously capture this state dependence and vertical heterogeneity.
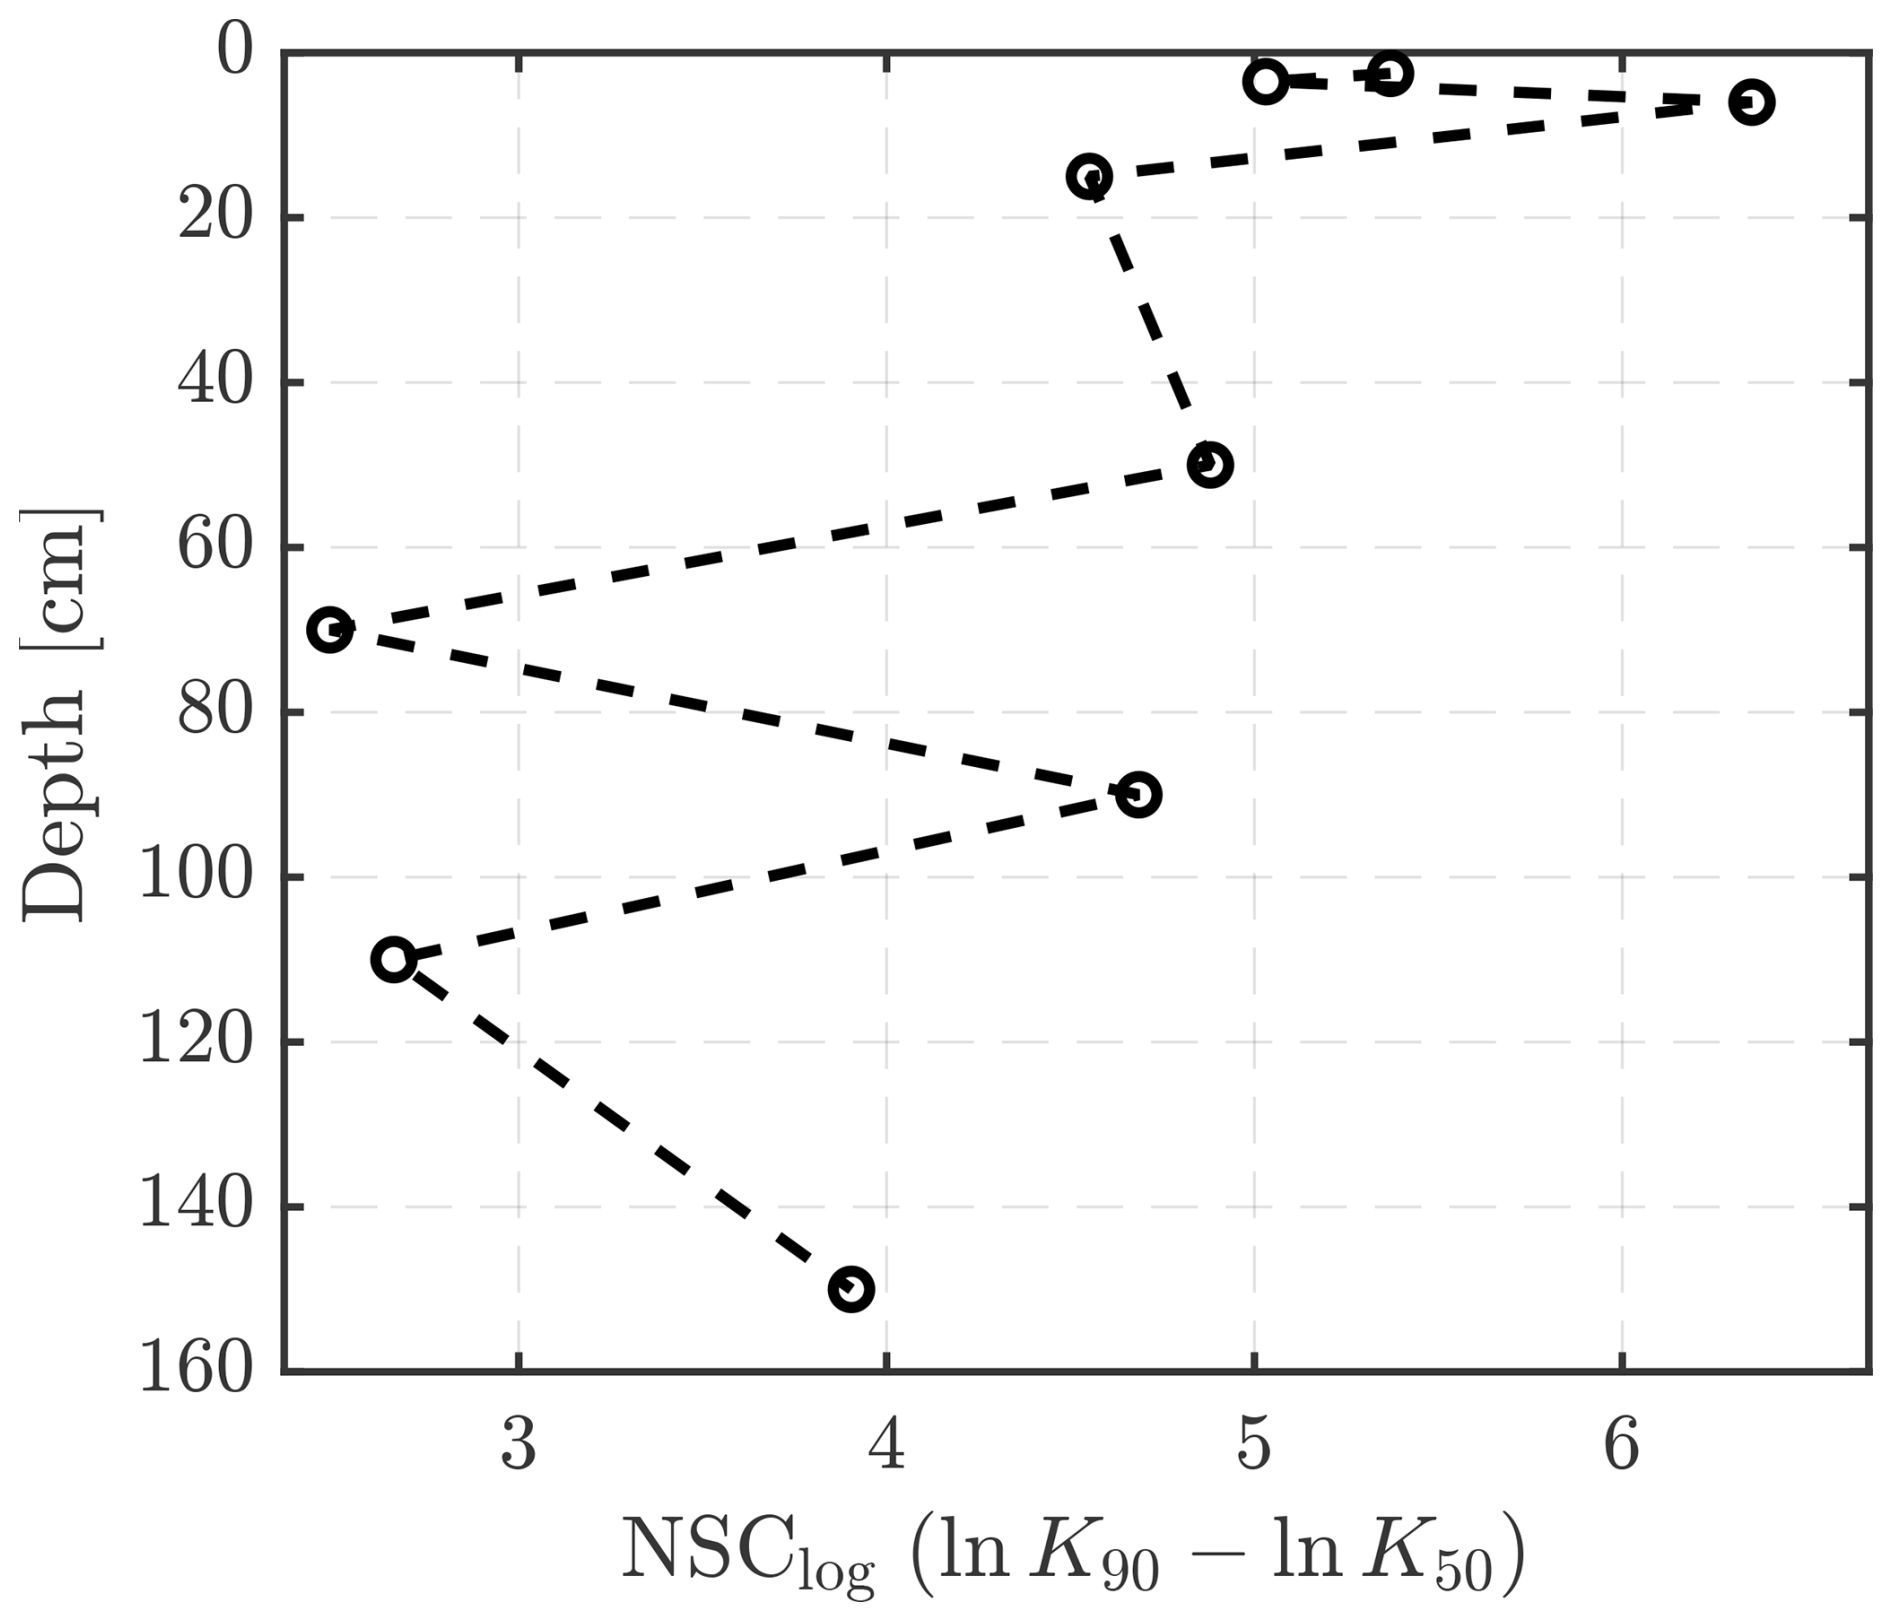
To facilitate direct comparisons of connectivity near saturation among soil layers, we adopted the logarithmic form of NSC, . Figure 10 shows the vertical distribution. Overall, the shallow and middle layers exhibit markedly higher conductivities near saturation than at intermediate moisture, with NSC_log values mostly ranging from 2.4 to 3.9.
These results indicate strong macropore connectivity, enabling rapid water drainage and preferential flow during rainfall or rewetting events. The 60–80 and 100–120 cm layers exhibit the most pronounced increase, with NSC_log values of approximately 2.5 and 2.7, respectively. The deeper layer (140–160 cm) also displays a relatively high NSC_log (∼3.9), primarily due to the extremely low conductivity in the intermediate range, which amplifies the ratio effect. At certain depths (e.g., 120–140 cm), the NSC could not be reliably computed due to the lack of sufficient data points in the intermediate moisture range. Overall, the NSC_log profile highlights that macropore flow dominates water transport under wet conditions in the shallow and middle layers, whereas the deep soil, despite its low absolute conductivity, still exhibits a relative macropore effect.
Notably, the high NSC_log values observed in the 60–120 cm interval do not imply a higher absolute conductivity than that in the surface layer but rather a greater relative increase in conductivity under near saturated conditions. This finding is consistent with the pore structure analysis showing rapid macropore drainage in the surface layer and water retention mediated by mesopores in the subsurface. Although macropores are more abundant near the surface, the intermediate range conductivity there remains high, resulting in a less pronounced NSC ratio. In contrast, the subsurface layer experiences a sharp decrease in conductivity at intermediate saturation, leading to a higher ratio and an apparent increase in NSC_log. Together, these results indicate that the surface layer governs absolute conductivity, whereas the subsurface layer exhibits greater relative hydraulic enhancement, reaffirming the state dependence and vertical heterogeneity of wetland soil hydraulic behavior.
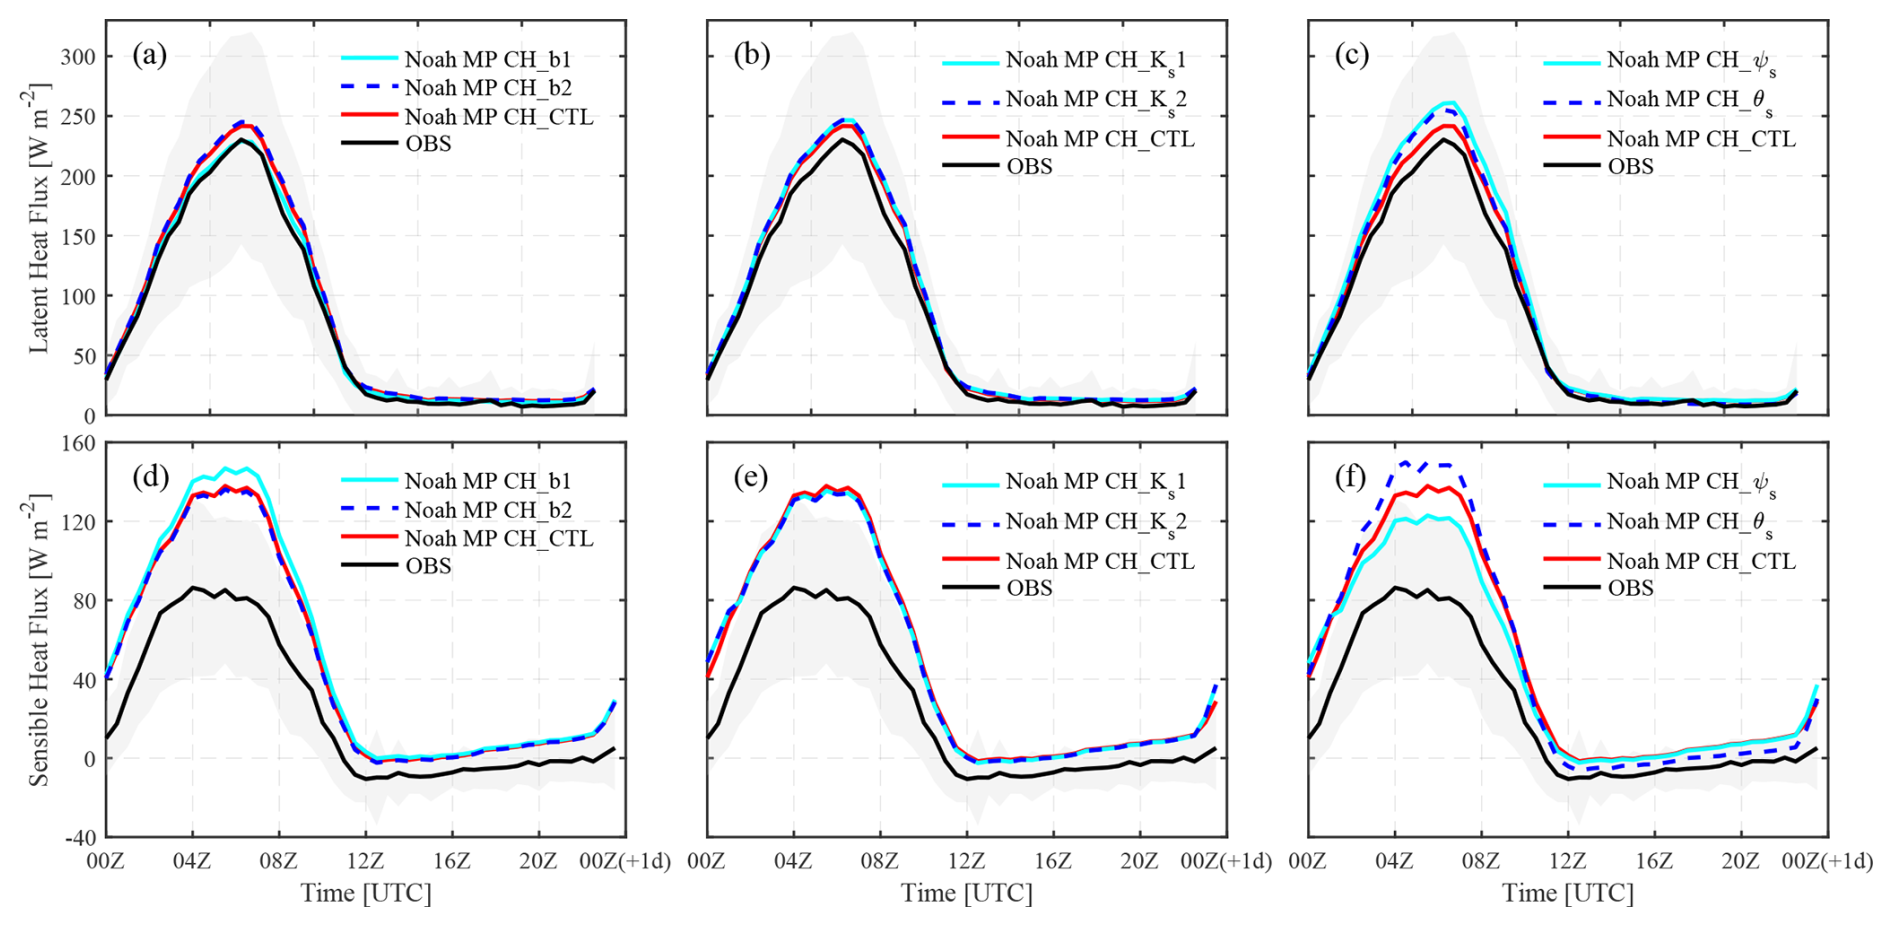
Figure 11Modeled diurnal variations of LHF and SHF under different soil hydraulic parameter scenarios, averaged for June–August 2023. Panels (a) and (d) show sensitivity experiments for the b parameter; panels (b) and (e) for Ks; and panels (c) and (f) for ψs and θs. All times are in Coordinated Universal Time (UTC, Z). Local time = UTC+8 h).
3.6 Noah-MP simulation of surface hydrothermal processes
3.6.1 Overall summer simulation differences
To examine the influence of the soil hydraulic parameters on the simulation of surface hydrothermal processes in alpine wetlands, sensitivity experiments were conducted by using the Noah-MP model. The calibrated parameters (b, Ks, ψs, and θs) were individually substituted, and their effects on the diurnal variations in the LHF and SHF during summer (June–August) were analyzed (Fig. 11).
As shown in Fig. 11a, the b parameter has the strongest influence on the LHF. Compared with the default scheme (CTL, b=4.26, and RMSE = 9.45 W m−2), the use of the surface layer value (CH_b1, b=3.215) significantly improved the simulation accuracy, especially from early morning to noon (03:00–09:00 Z), reducing the RMSE to 3.87 W m−2. In contrast, applying the middle layer value (CH_b2, b=5.0761) increased the deviation (RMSE = 11.06 W m−2). Physically, b controls the slope of the water retention curve, representing pore size distribution characteristics. A lower b indicates a higher proportion of macropores and faster water release, enhancing the evapotranspiration potential, whereas a higher b implies more micropores and slower release, increasing the water retention capacity. The excessive water retention of CH_b2 led to a higher simulated LHF, whereas CH_b1 better captured the rapid response of the surface pores. The corresponding SHF (Fig. 11d) exhibited the opposite pattern: CH_b2 substantially suppressed daytime SHF peaks but produced an overall overestimation (Bias = +24 W m−2). This compensatory pattern of enhanced LHF and suppressed SHF highlights the key role of b in regulating surface energy partitioning.
As shown in Fig. 11b and e, the sensitivity of Ks is relatively weak. When the default value ( m s−1) was replaced by the measured values CH_Ks1 ( m s−1) and CH_Ks2 ( m s−1), the changes in the LHF were minimal, with RMSEs of 11.7 and 11.8 W m−2, respectively, indicating no improvement when compared with the CTL. Only a slight shift was observed during the early morning period (03:00–09:00 Z). As the dominant parameter in the hydraulic conductivity curve, Ks represents the soil's ability to conduct water under saturated conditions. However, under the wet summer background, surface evapotranspiration was mainly controlled by capillary water, and the saturated pathways were not significantly activated. Thus, Ks exhibited low sensitivity. These findings indicate that Ks plays a secondary role in regulating energy fluxes unless extreme drought or heavy rainfall occurs.
The effects of ψs and θs are shown in Fig. 11c and f, respectively. Overall, both parameter schemes simulated higher fluxes than those observed. Regarding the LHF, compared with the CTL (RMSE = 9.45 W m−2), the adjustments to CH_ψs and CH_θs further increased the daytime bias. With respect to the sensible heat (H), CH_ψs was closest to the observations (RMSE = 23.6 W m−2), while CH_θs produced the greatest deviation (RMSE = 34.1 W m−2). These results suggest that modifying ψs slightly improved the fit of H, whereas adjusting θs amplified the overestimation. Physically, ψs affects the initial curvature of the water retention curve, enhancing capillary water retention and delaying surface drying, thereby helping to mitigate positive bias. In contrast, θs defines the upper limit of the soil water storage; under wet conditions, its increase raises the available water content, further amplifying the overestimation of both the LHF and SHF.
Overall, the sensitivity ranking of the four parameters to energy fluxes was . Among them, b and ψs are structural parameters that directly describe the pore structure and water release dynamics, exerting the strongest control on the LHF and SHF. In contrast, θs and Ks are boundary parameters and exhibited limited influence under the conditions of this study. The effects of b and ψs were most pronounced during the high flux period (06:00–10:00 Z), emphasizing the importance of accurately representing the segment of the water retention curve near saturation in the model. Detailed error metrics for each parameter scheme are provided in Table A1.
3.6.2 Simulation results for wet and dry periods
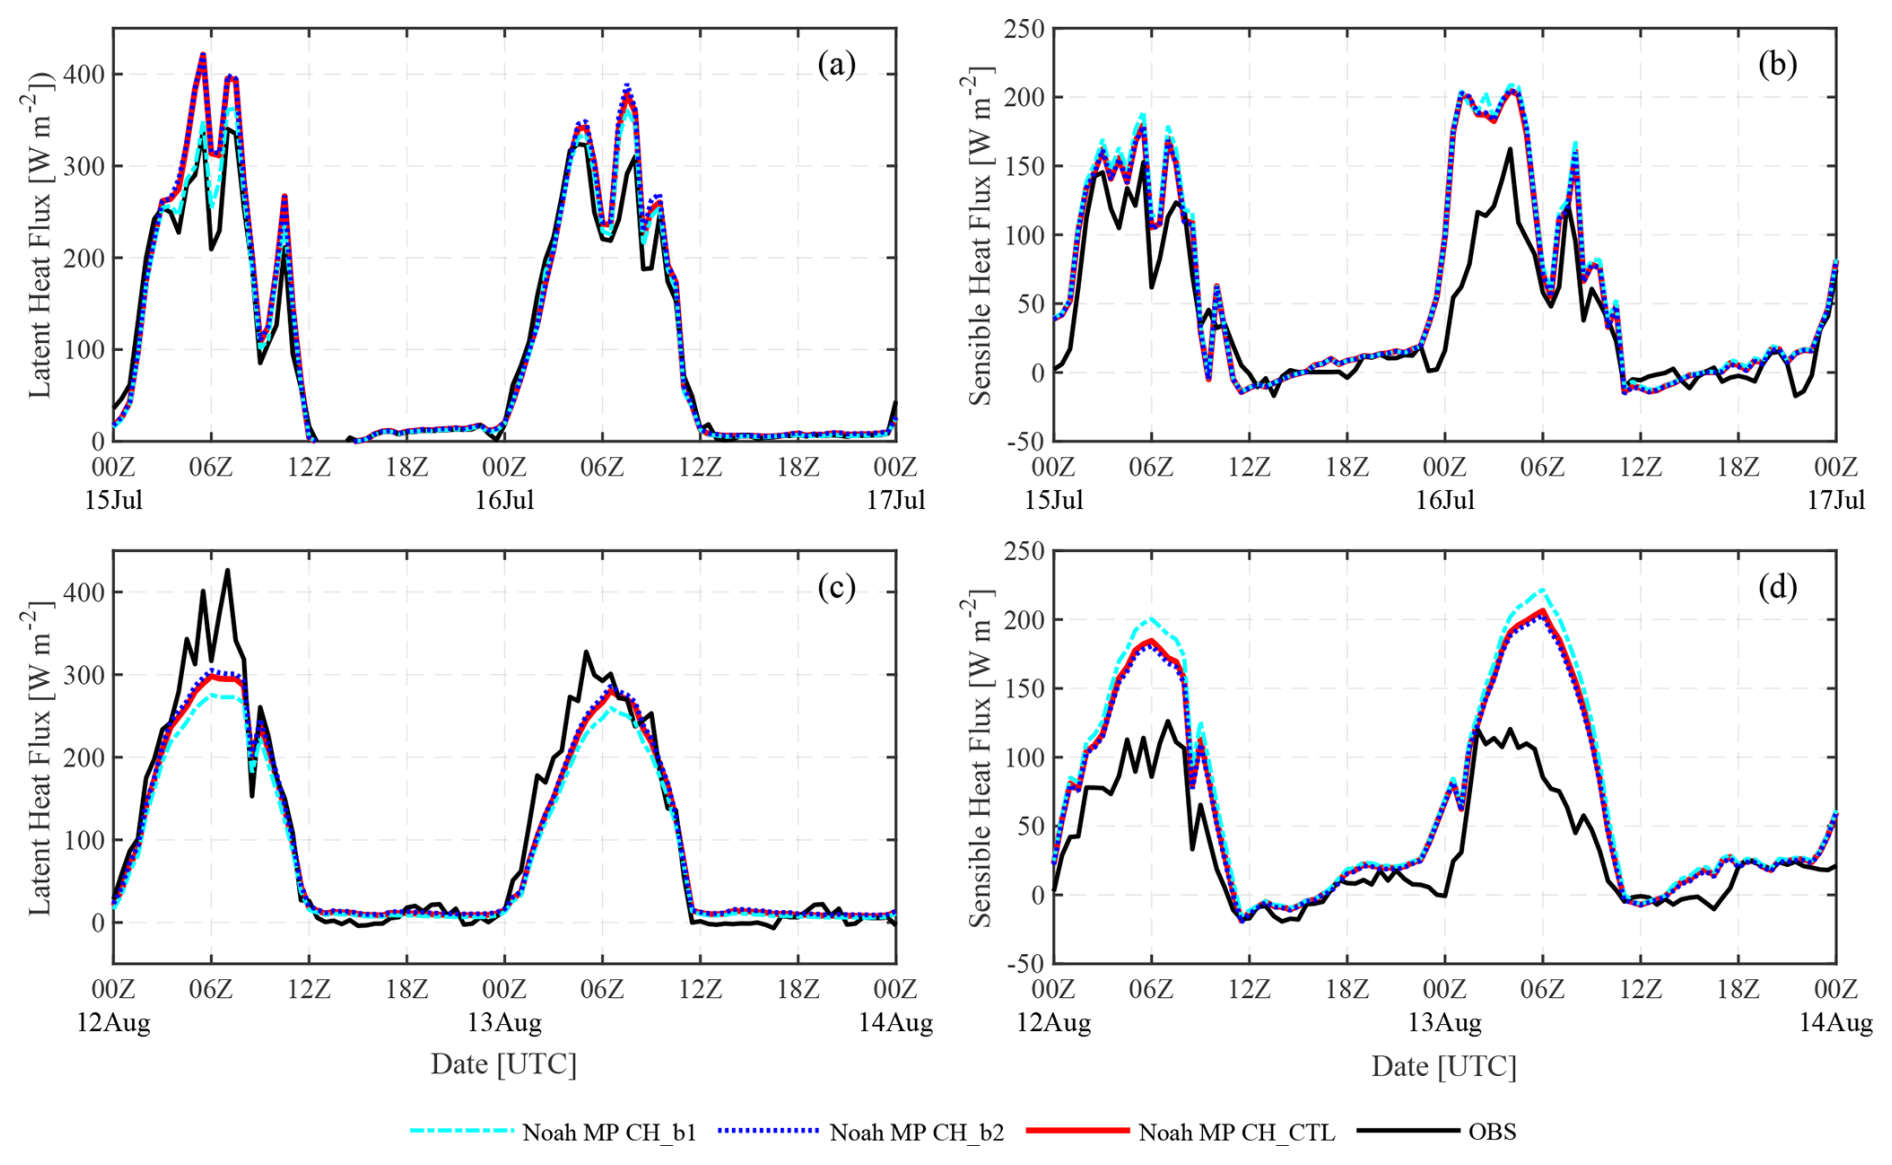
To analyze the regulatory effects of the soil hydraulic parameters on surface hydrothermal processes under extreme hydrometeorological conditions, scenarios based on events were used to avoid the effects of seasonal averaging, which may mask the variability. Based on observations of the precipitation, soil moisture, and the Bowen ratio, the wet and dry periods were identified to be 15–16 July and 12–13 August 2023, respectively. As the previous sensitivity analysis indicated that the b parameter exerts the greatest influence on energy fluxes, this section focuses on event error comparisons among different b schemes.
The simulated LHF and SHF for the wet and dry periods are shown in Fig. 12, and detailed error statistics for each scheme are provided in Table A2. During the wet period, the soil was nearly saturated, and the macropores were fully filled and rapidly drained, with water release primarily driven by gravity. The effect of b was most pronounced under these conditions. A lower b value (CH_b1, b=3.215) indicates a greater proportion of macropores, enhancing rapid drainage and facilitating quick transformation of shallow soil water into evapotranspiration fluxes. As a result, the simulated LHF peak matched the observations better, with the RMSE decreasing from approximately 42 W m−2 in CTL to approximately 28 W m−2. Moreover, rapid drainage reduced the soil heat capacity, making the ground temperature more responsive and leading to higher SHF (Bias = +28 W m−2). In contrast, a higher b (CH_b2, b=5.0761) increased the micropore proportion and water retention, resulting in stronger waterlogging and an overestimated LHF peak (RMSE = 47 W m−2), whereas SHF was further suppressed. These results indicate that under high moisture conditions, b regulates energy partitioning between the LHF and SHF by altering the balance between the macropores and micropores.
During the dry period, most surface macropores were empty, and the soil moisture was governed primarily by capillary and micropore retention, with the hydraulic conductivity decreasing exponentially as water content decreased. The low b scheme still exhibited strong sensitivity, and when rainfall occurred, rapid refilling of the macropores and high conductivity enabled the soil to respond quickly, improving the LHF peak significantly. The simulated SHF peaks also aligned more closely with the observations, indicating that low b strengthens the mechanism of rapid recharge followed by fast evapotranspiration after rainfall. However, the soil moisture in CH_b1 declined too rapidly, intensifying the underestimation under dry conditions and suggesting that the model failed to represent the capillary retention of wetland soils at low water contents. In contrast, a higher b improved the soil moisture retention trend but weakened the flux response, resulting in slower energy release and the underestimation of short term evapotranspiration after rainfall.
Comparison of the wet and dry conditions reveals contrasting mechanisms. Under wet conditions, macropore drainage drives water fluxes, with low b enhancing the LHF but increasing Bias, whereas high b improves the retention but overestimates the peaks. Under dry conditions, capillary storage is dominant, low b captures rainfall–evapotranspiration events rapidly, whereas high b enhances storage and improves the flux accuracy. These results indicate that the single power law structure of the CH model cannot simultaneously represent the rapid response driven by macropores and the slow release governed by micropores, leading to opposite biases under wet and dry conditions.
4.1 Vegetation parameters and their effects
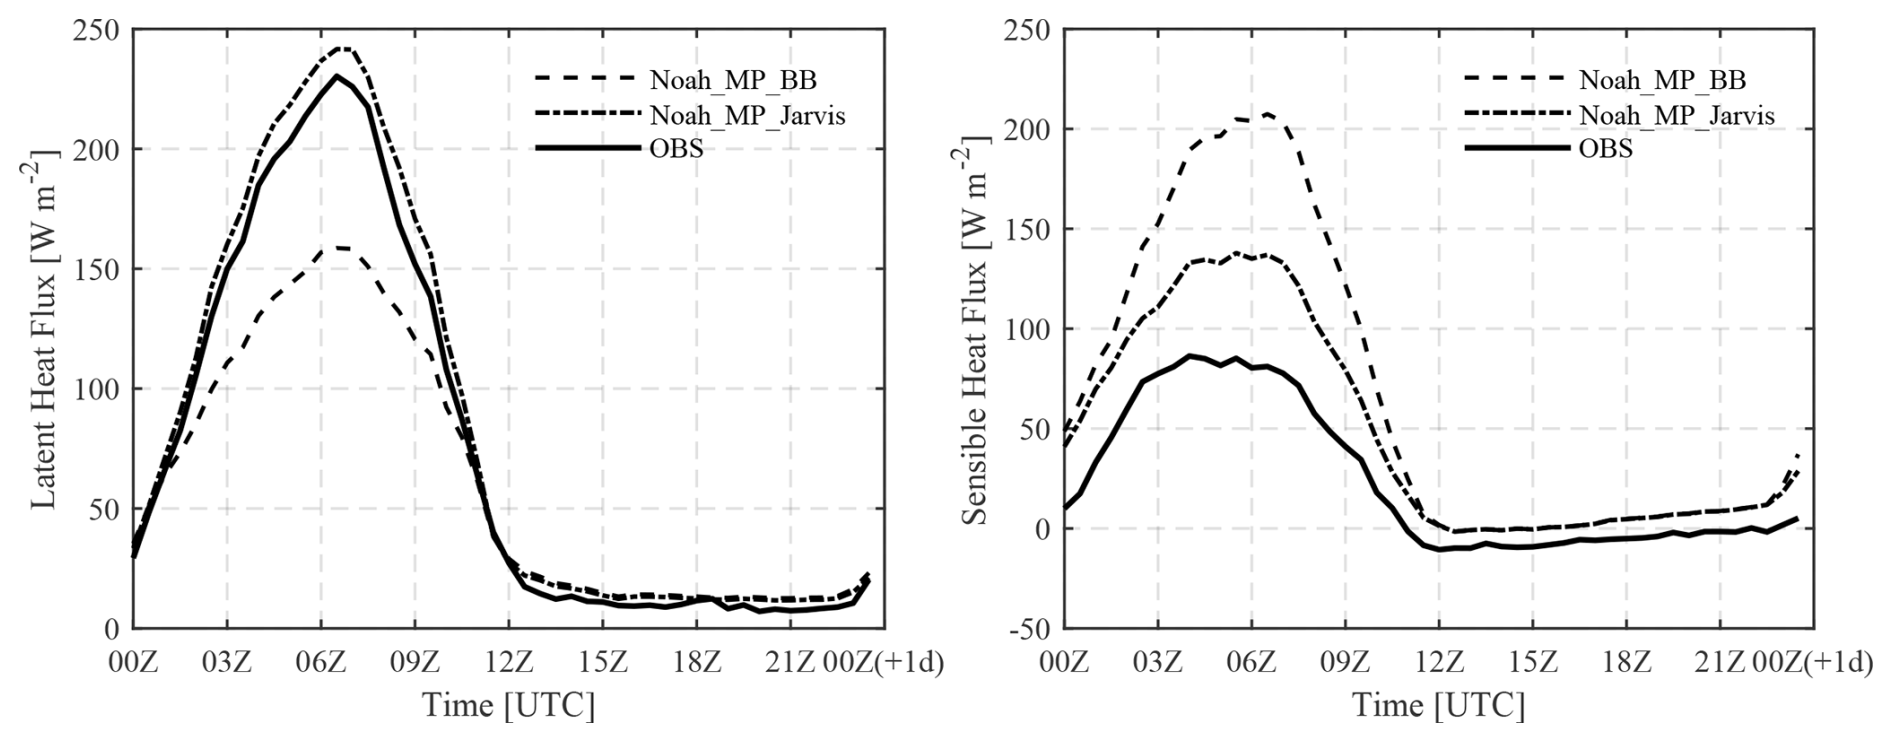
A sensitivity analysis revealed that the perturbations from the stomatal conductance schemes are much smaller than those from the soil hydraulic parameters. Figure 13 compares the Ball–Berry (BB) and Jarvis schemes in terms of simulating the LHF and SHF, and the detailed error metrics are listed in Table A3. The numerical results indicate that the BB scheme yields larger errors: in the LHF simulations, the RMSE exceeds 22 W m−2, and the absolute value of Bias exceeds +14 W m−2, thus underestimating the evapotranspiration peaks; for SHF, Bias is even greater (+45 W m−2) and substantially overestimates the heat fluxes. In contrast, the Jarvis scheme performs better, with an RMSE of 13 W m−2 and Bias of approximately +5 W m−2 for the LHF and an RMSE of 35 W m−2 for SHF. Although positive bias remains, the overall improvement is evident. The Jarvis model regulates conductance as an exponential function of the radiation, temperature, and vapor pressure deficit, allowing for a simple structure and fast response, whereas the BB model couples the stomatal conductance with the photosynthetic rate and CO2 concentration and relies heavily on physiological parameters. In the Tibetan Plateau wetlands, where the LAI is typically <1 and the photosynthetic potential is low, the BB model tends to overestimate transpiration and amplify the energy partitioning errors, whereas the Jarvis scheme provides more stable results with smaller bias. Therefore, the Jarvis scheme was adopted for subsequent simulations to minimize disturbances related to vegetation and to emphasize the dominant role of soil processes.
From a mechanistic perspective, land–atmosphere exchanges in plateau wetlands are constrained mainly by the soil water availability, capillary transport, and pore connectivity rather than by the stomatal control of transpiration. Under sparse vegetation (LAI <1), shallow roots, and low photosynthetic capacity, the BB assumption of root-regulated transpiration is invalid, leading to pronounced diurnal biases in the LHF and SHF. The Jarvis scheme, which directly responds to meteorological drivers, avoids overdependence on plant physiological parameters and produces more reasonable diurnal amplitudes. Nevertheless, the amplitude remains governed by the soil saturated hydraulic conductivity and porosity, and during the afternoon drying period, the soil hydraulic conductivity is the key factor controlling the evapotranspiration dynamics.
Previous studies in sparse or semiarid ecosystems have reached similar conclusions: evapotranspiration is more strongly controlled by the soil water supply than by stomatal regulation (Koster et al., 2004; Seneviratne et al., 2006; Yang et al., 2011). Further simulations revealed that in Tibetan grassland ecosystems, the contribution of vegetation water content to the hydrogen signal detected by cosmic ray neutron sensing (CRNS) is less than 1 %, whereas the sensitivity of the CRNS is limited mainly to the upper 0–20 cm soil layer. The 0–7.5 cm layer alone stores 9.7–17.4 mm of the soil water and thus dominates the surface hydrological response (Wang et al., 2025). Other studies have also confirmed that under sparse vegetation, the surface hydrogen variability is governed primarily by the shallow soil moisture, and vegetation interference can be reasonably neglected (Köhli et al., 2015; Schrön et al., 2017).
In summary, in the Tibetan Plateau wetlands, where soil moisture processes dominate, vegetation parameter perturbations have a limited influence on energy fluxes and hydrogen sources. Instead, soil hydraulic parameters are the primary determinants of the water–heat exchange accuracy. Therefore, within the framework of hydraulic sensitivity analysis, adopting the Jarvis scheme for stomatal conductance to minimize vegetation disturbances is a physically sound and scientifically justified choice.
4.2 Limitations of the hydraulic scheme
The CH model represents the relationship between the water content and matric potential with a power law and uses the saturated water content and the empirical exponent b to describe the water retention curve. The scheme is simple, and its parameters are easy to obtain; thus, it is widely used in large scale simulations. However, its physical basis is weak, and it cannot capture the strong heterogeneity of wetland soils. Furthermore, it does not explicitly include the residual water content or a capillary break, so it fails to reproduce the “bend” of the water retention curve. The monotonic power law form also limits the fit to the nonlinear release behavior of multi-pore structures. In wetlands, abundant organic matter and multiscale pore networks amplify these issues and hinder the recovery of the joint action of macro- and micropores.
In the saturated to near saturated range (low suction), the CH fit is especially weak. When , the curve is simplified to a constant θs plateau with a zero derivative, and a pore size distribution based on the Young–Laplace relation cannot represent macropore drainage. Even when evaporation experiments capture the rapid dewatering stage, the inversion still struggles to resolve the macropore contributions because of this defect, and the inferred PSD shifts toward medium and small pores (pf >5.0). The experimental design adds bias as well. To obtain continuous records of θ over time, sampling is concentrated at –104 cm, whereas macropore drainage at low suction often occurs within minutes and is missed because of limited sampling frequency and sensitivity. These structural and coverage limitations create a blind spot near saturation. The inverted parameters fit the range from mid suction to high suction but miss the segment near saturation, and numerical simulations confirm this deficiency.
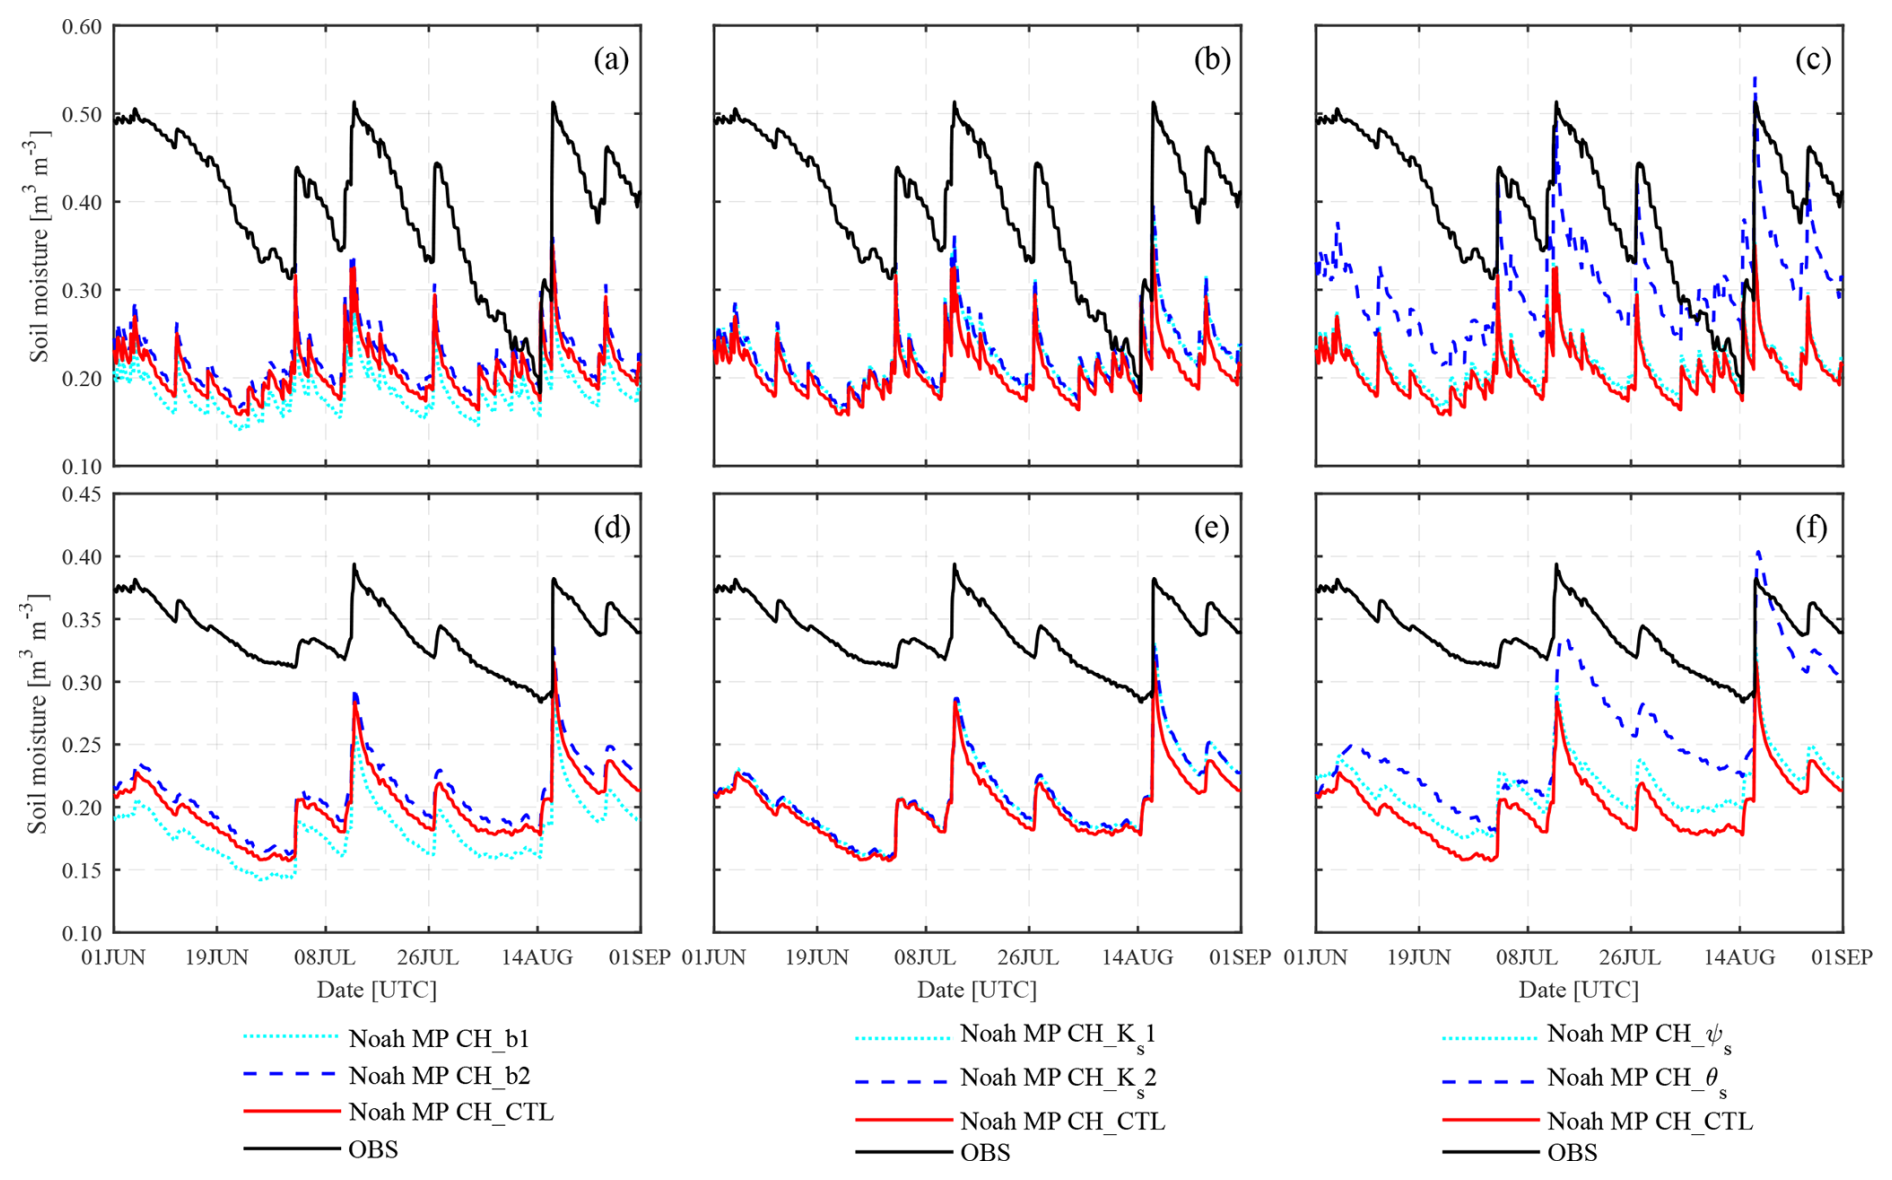
Figure 14Simulated diurnal soil moisture at two depths over June–August 2023. Panels (a) and (d) show b sensitivity experiments, panels (b) and (e) show Ks sensitivity experiments, and panels (c) and (f) show ψs and θs sensitivity experiments).
The modeled surface and subsurface soil moisture, interpolated to 5 and 20 cm, are compared with the observations in Fig. 14, and the detailed error metrics are provided in Table A4. Overall, all of the schemes exhibit a systematic negative bias of approximately −0.05 to −0.08 m3 m−3 and fail to reproduce the observed diurnal amplitude and water accumulation. In the b experiments, CH_b1 (b=3.215) yields an RMSE of 0.072 m3 m−3 at 5 cm, which is greater than that of the CTL (0.058), indicating faster drainage and weaker retention. CH_b2 (b=5.0761) improves the 20 cm layer with an RMSE of 0.051, which is better than that of the CTL (0.063), indicating that a higher b enhances storage. In the Ks experiments, CH_Ks1 and CH_Ks2 are nearly identical to the CTL, with RMSE differences <0.01, indicating a very weak influence by the saturated conductivity on shallow moisture under wet summer conditions. In the ψs and θs experiments, θs markedly improved the 20 cm layer, reducing the RMSE from 0.063 to 0.047 and reflecting the role of storage capacity in retention. ψs yields only small improvements at both depths (RMSE reductions of approximately 0.01–0.015) and does not eliminate the overall underestimation. In summary, the soil moisture simulations highlight the joint control of the structural parameters (b, ψs) and the capacity-related parameter θs, while Ks shows the weakest sensitivity.
For comparison, the Noah-MP default parameters are not based on measurements from this site, however, their small ψs values (e.g., m for loamy sand) induce earlier water retention curve desaturation and higher hydraulic conductivity curve conductivity near saturation, partly capturing macropore drainage and partly offsetting the inversion parameters' blind spot at low suction. This phenomenon partly represents macropore drainage and compensates for the inversion blind spot at low suction. In our experiments, CH simulations produce larger soil temperature biases than they do for moisture and energy fluxes, indicating simplifications in the heat capacity and heat conduction. Future wetland hydrothermal modeling should adopt more physically based pore–water–heat coupling frameworks, such as the VG or VG-PDI, with explicit multi-pore representation, to better describe the near saturated hydrothermal dynamics.
4.3 VG/VG-PDI integration outlook
The results show that the CH scheme, as a statistical formulation, cannot represent the nonlinear release near saturation or the multiscale pore response in wetland soils. Parameter tuning, such as lowering or increasing b, can improve some variables under very wet or very dry conditions, but it does not eliminate systematic bias. A more physically based parameterization is needed to improve wetland hydrothermal simulations.
The van Genuchten (VG) model provides a continuous water retention curve near saturation and is generally considered more physical than the BC or CH. Its parameters α and n flexibly capture the nonlinear relationship between water content and matric potential, and it represents macropore drainage at low suction and transitions smoothly to capillary retention. Studies such as that by Farmani et al. (2025) report that the VG reduces the overestimation of the shallow soil moisture memory in Noah-MP and causes the nonlinear hydraulic response to be closer to observations. The VG still assumes a single pore size distribution but often misses the bimodal or multimodal structures typical of wetlands, especially in organic-rich and highly heterogeneous soils. Its fit near saturation remains limited.
To address these limitations, Wang et al. (2024) proposed and validated the VG-PDI (Peters–Durner–Ida) model, which combines the VG framework with film flow and capillary flow. The two pathways represent diffusion along micropore films and macropore capillary drainage, and they relax the single-distribution assumption. The VG-PDI improves the fit of the water retention and hydraulic conductivity curves at high suction (pf >4), and it captures the typical bimodal pore sizes in wetlands (macropores of approximately 100 µm and micropores of approximately 1 µm) and achieves higher accuracy (R2>0.95) than the standard VG (R2∼0.85). These results indicate that the VG-PDI better represents the nonlinear release and pore structure effects near saturation and at high suction. It offers a practical route to improving hydraulic parameterization in land surface models, especially for the organic-rich and heterogeneous wetlands in the Tibetan Plateau.
By inverting the CH parameters and conducting sensitivity tests, this study delineates and quantifies the applicability limits of the CH in wetlands and clarifies the roles of b and ψs that depend on hydrologic conditions in terms of energy fluxes and soil moisture. Building on these validated findings, we recommend adopting the VG to improve the continuity and nonlinearity of the water retention curve and exploring the VG-PDI with film flow and the dual-domain pore structure to further enhance the representation of complex water and heat transport in alpine wetland land surface models.
This study focuses on a typical alpine wetland in the Tibetan Plateau. By using laboratory evaporation experiments, physicochemical measurements, and CT imaging, we obtained vertical profiles of key CH hydraulic parameters (θs, Ks, b, ψs) and then conducted Noah-MP sensitivity experiments to quantify their impacts on simulations of surface hydrothermal processes. Following a workflow of observation, inversion, and simulation, this study reveals both the mechanisms and the structural limitations by which wetland soil hydraulic parameters control energy and water fluxes. From an ecohydrological perspective, wetland soils show a stratified transmission pattern with rapid drainage in the surface layer, slow release in the middle layer, and stable storage in the deep layer. This vertical heterogeneity provides strong buffering and retention in alpine wetlands, underpins hydrologic stability during alternating precipitation and evapotranspiration, and offers key constraints for land surface model parameterization.
-
The measured parameters show pronounced vertical heterogeneity. Surface soils have high θs and Ks (θs>0.65 m3 m−3, Ks>30 cm d−1) with a high SOC and low BD, indicating the development of macropores and a loose, porous structure. With depth, θs and Ks decrease, and the pore network becomes finer, leading to strong retention in the middle layer and stable storage in the deep layer. Evaporation-experiment inversion shows clear vertical contrasts in b (surface ≈3.2, middle ≈5.1, deep approaching 1.0), and ψs is correlated with the SOC and particle-size composition, indicating that the pore structure and physicochemical properties jointly shape hydraulic behavior.
-
Sensitivity experiments reveal the different roles of the parameters. b is the most sensitive, as a lower b improves the peak representation of the LHF during wet periods but increases the underestimation of the shallow soil moisture. A higher b enhances storage and improves the accuracy of SHF during dry periods. Adjusting θs markedly reduces the RMSE of the soil moisture at 20 cm (0.063→0.047 m3 m−3), reflecting the regulation of the storage upper bound on the retention and wet–dry response. Adjusting ψs partly alleviates the bias in SHF. Finally, under wet summer conditions, Ks is almost insensitive.
-
There is a division of control among parameter types. Structural parameters (b, ψs) affect the pore distribution and release dynamics and therefore govern energy partitioning and water retention. The capacity-related parameter (θs) sets the storage upper bound and is key to improving SM simulations, while Ks plays a limited role under high moisture.
Overall, the power law structure of the CH model cannot simultaneously capture rapid macropore drainage and micropore capillary retention, which leads to structural biases in the water retention and hydraulic conductivity curves. Parameter tuning can improve specific cases but does not eliminate systematic errors. On the basis of the observational evidence and numerical verification at this site, we recommend further evaluating more physically based VG and VG-PDI formulations in Noah-MP to better represent multiscale pores and nonlinear hydraulic responses in alpine wetlands with similar hydro-pedological characteristics.
Table A1Error metrics for diurnal variations of LHF and SHF during the summer period.
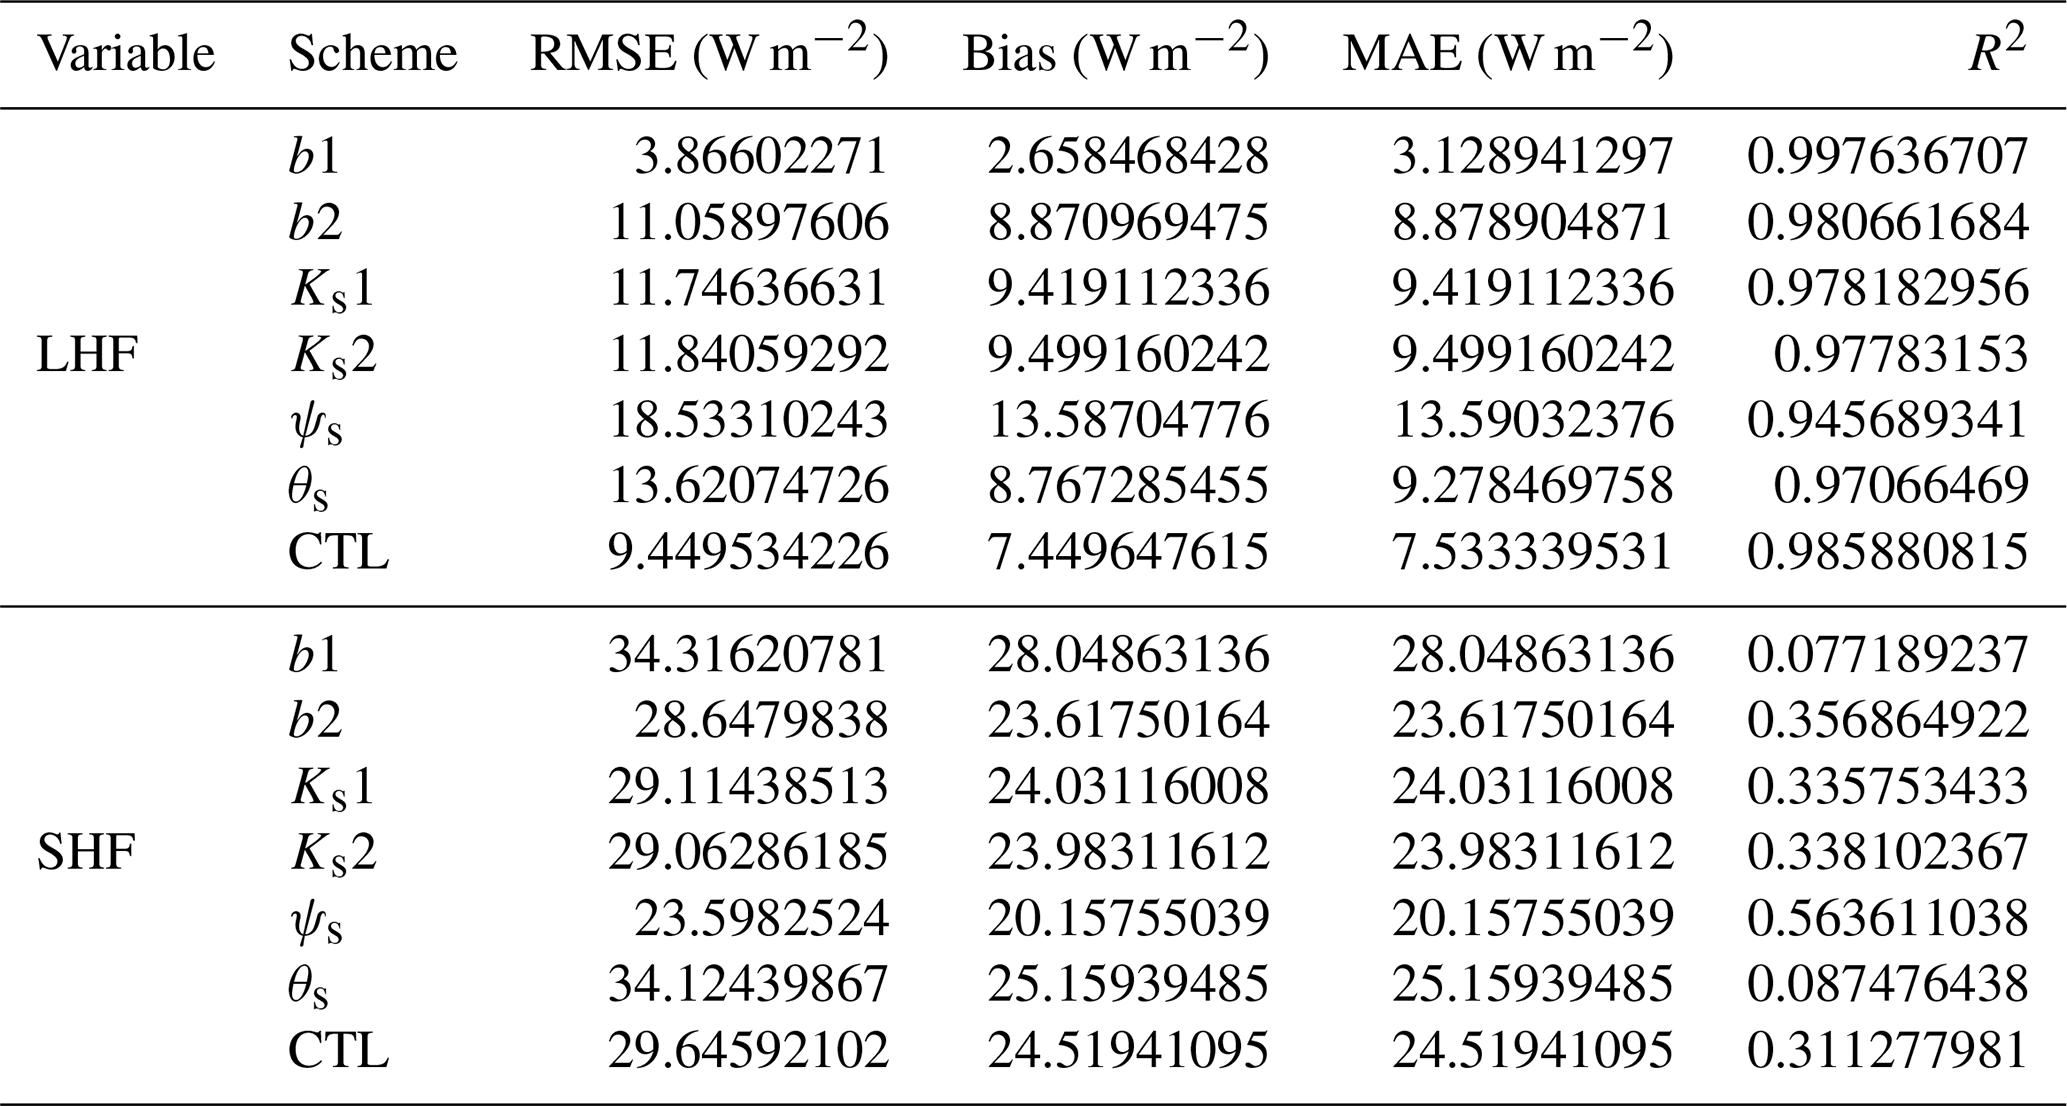
Table A2Error metrics for simulations during representative wet and dry episodes.
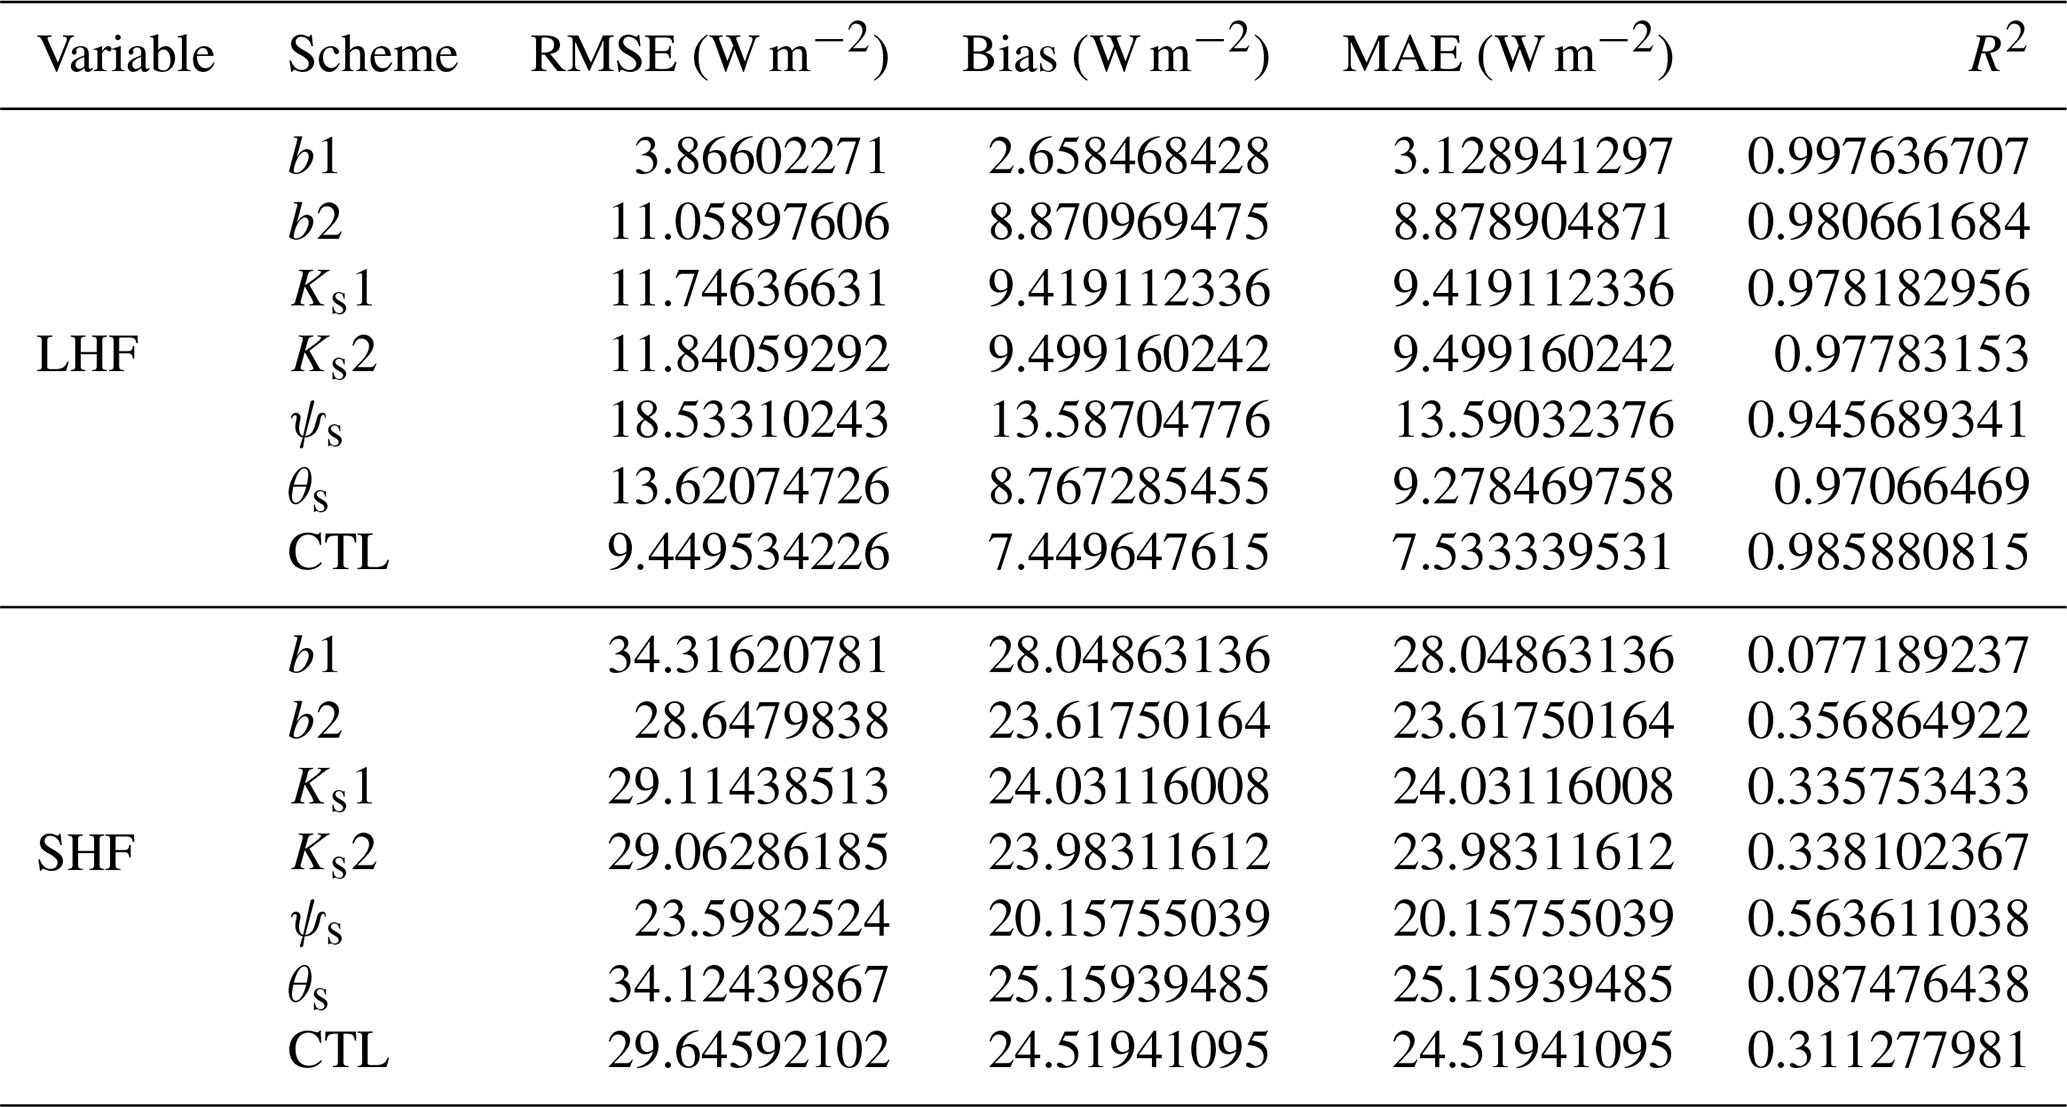
Table A3Error metrics of LHF and SHF under different stomatal conductance schemes (Ball–Berry and Jarvis).

Table A4Error metrics of modeled surface and subsurface soil moisture against observations.
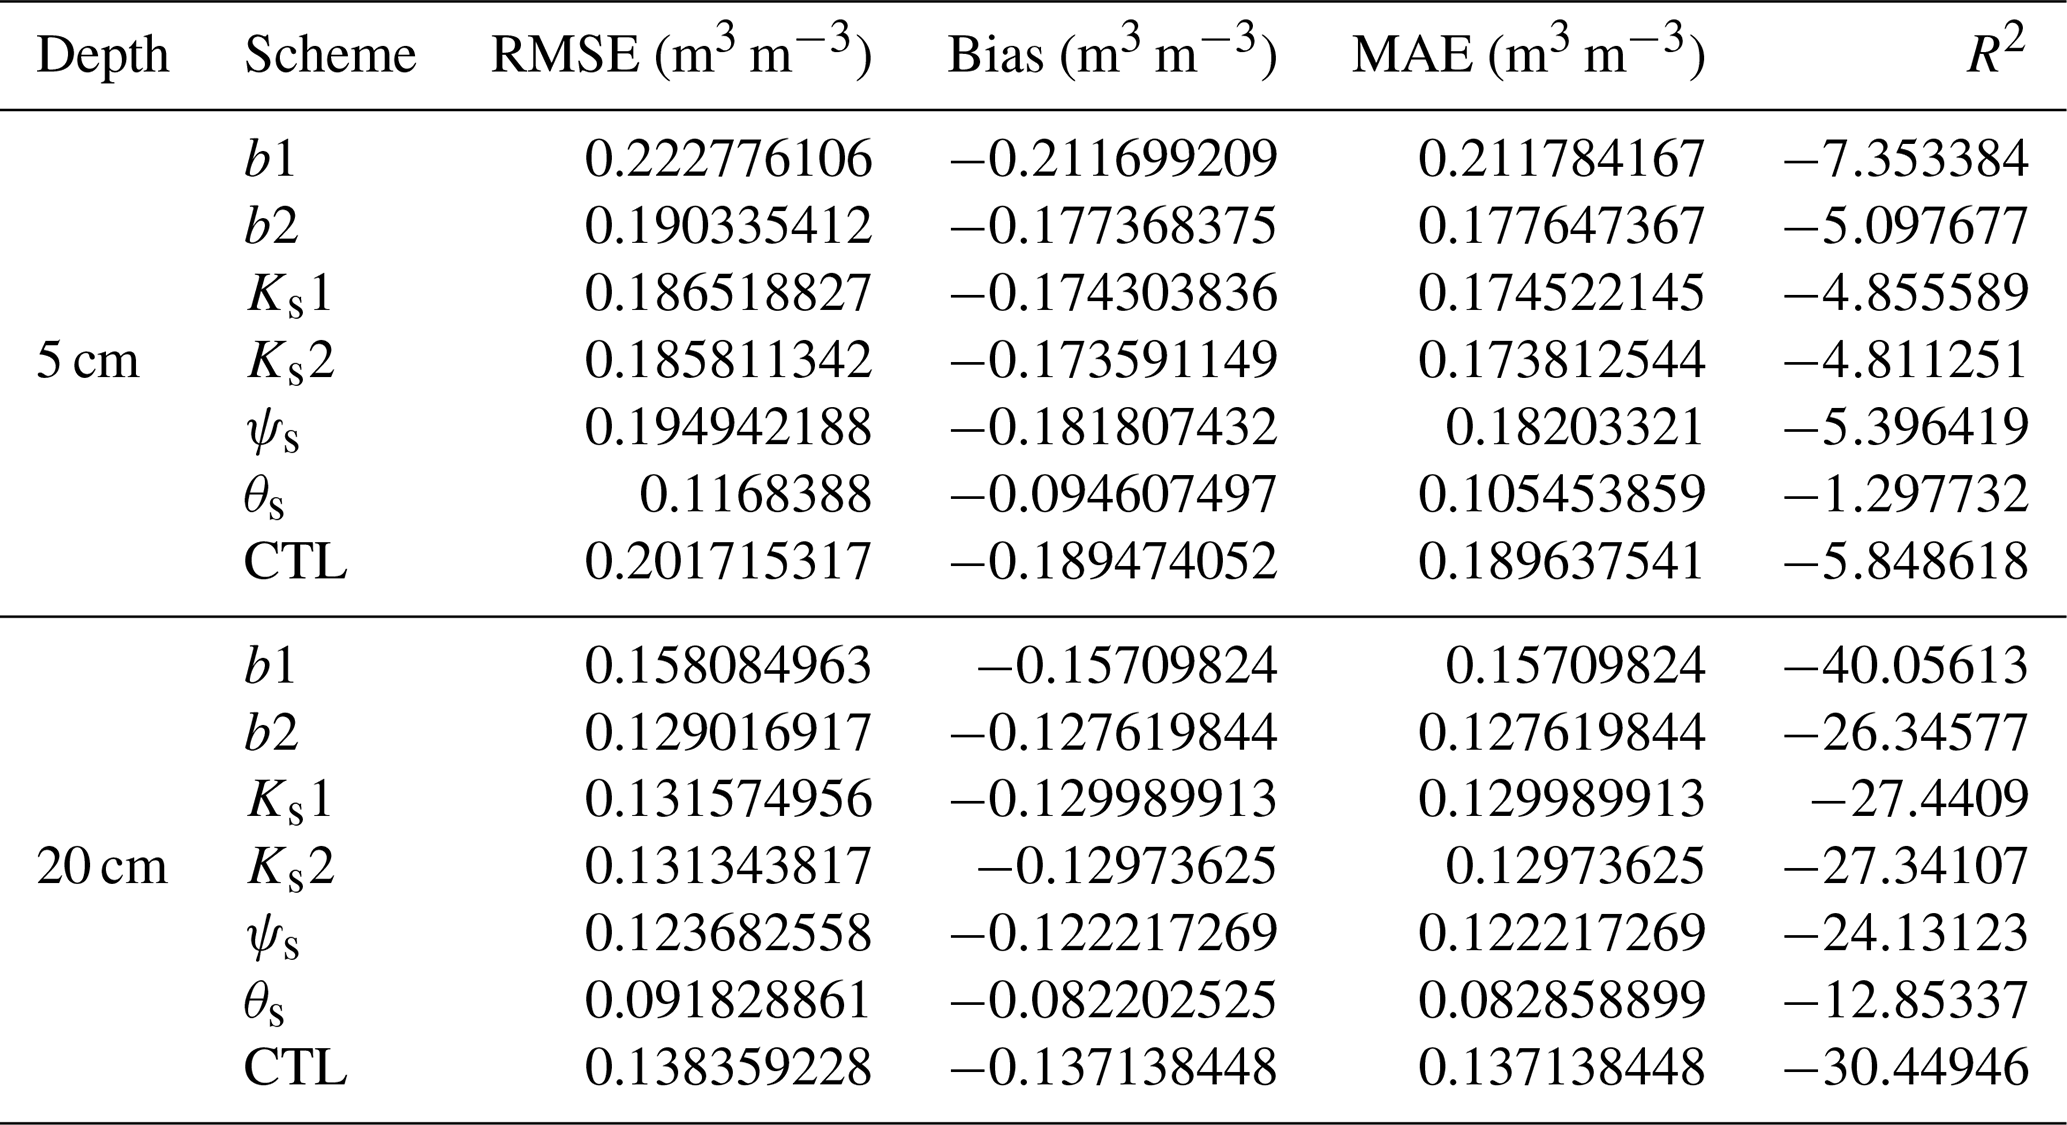
All data used in this study, including soil measurements, model inputs (initial conditions and forcing), and simulation outputs, are available on the online platform Figshare (https://doi.org/10.6084/m9.figshare.32197428; Liu, 2026).
RL: Writing – review & editing, Writing – original draft, Investigation, Funding acquisition, Formal analysis, Conceptualization. XW: Investigation, Methodology, Resources, Data curation, Validation, Conceptualization. ZW: Software, Methodology, Visualization, Conceptualization. YP: Data curation, Visualization. YS: Conceptualization.
The contact author has declared that none of the authors has any competing interests.
Publisher's note: Copernicus Publications remains neutral with regard to jurisdictional claims made in the text, published maps, institutional affiliations, or any other geographical representation in this paper. The authors bear the ultimate responsibility for providing appropriate place names. Views expressed in the text are those of the authors and do not necessarily reflect the views of the publisher.
We thank the editor and the reviewers for their careful evaluation, constructive comments, and patience throughout the review process. Their suggestions helped improve the clarity and quality of the manuscript.
This research has been supported by the National Natural Science Foundation of China (grant nos. 42575094 and 52539002), the Joint Research Program for Ecological Conservation and High Quality Development of the Yellow River Basin (Phase I) (grant no. 2022-YRUC-01-0601), and the program of the State Key Laboratory of Cryospheric Science and Frozen Soil Engineering (grant no. CSFSE-ZZ-2407).
This paper was edited by Patricia Saco and reviewed by Gil Bohrer and two anonymous referees.
Assouline, S. and Or, D.: Conceptual and parametric representation of soil hydraulic properties: A review, Vadose Zone J., 12, https://doi.org/10.2136/vzj2013.07.0121, 2013.
Brooks, R. H. and Corey, A. T.: Hydraulic properties of porous media, Hydrology Paper No. 3, Colorado State University, Fort Collins, CO, USA, 27 pp., 1964.
Chadburn, S., Burke, E., Essery, R., Boike, J., Langer, M., Heikenfeld, M., Cox, P., and Friedlingstein, P.: An improved representation of physical permafrost dynamics in the JULES land-surface model, Geosci. Model Dev., 8, 1493–1508, https://doi.org/10.5194/gmd-8-1493-2015, 2015.
Clapp, R. B. and Hornberger, G. M.: Empirical equations for some soil hydraulic properties, Water Resour. Res., 14, 601–604, https://doi.org/10.1029/WR014i004p00601, 1978.
Dai, Y., Zeng, X., Dickinson, R. E., Baker, I., Bonan, G. B., Bosilovich, M. G., Denning, A. S., Dirmeyer, P. A., Houser, P. R., Niu, G.-Y., Oleson, K. W., Schlosser, C. A., and Yang, Z.-L.: The Common Land Model, B. Am. Meteorol. Soc., 84, 1013–1024, https://doi.org/10.1175/BAMS-84-8-1013, 2003.
Dai, Y., Xin, Q., Wei, N., Zhang, Y., Shangguan, W., Yuan, H., Zhang, S., Liu, S., and Lu, X.: A global high-resolution data set of soil hydraulic and thermal properties for land surface modeling, J. Adv. Model. Earth Sy., 11, 2996–3023, https://doi.org/10.1029/2019MS001784, 2019.
Duan, Q., Sorooshian, S., and Gupta, V. K.: Effective and efficient global optimization for conceptual rainfall-runoff models, Water Resour. Res., 28, 1015–1031, https://doi.org/10.1029/91WR02985, 1992.
Durner, W.: Hydraulic conductivity estimation for soils with heterogeneous pore structure, Water Resour. Res., 30, 211–223, https://doi.org/10.1029/93WR02676, 1994.
Farmani, M. A., Behrangi, A., Gupta, A., Tavakoly, A., Geheran, M., and Niu, G.-Y.: Do land models miss key soil hydrological processes controlling soil moisture memory?, Hydrol. Earth Syst. Sci., 29, 547–566, https://doi.org/10.5194/hess-29-547-2025, 2025.
Fatichi, S., Or, D., Walko, R., Vereecken, H., Young, M. H., Ghezzehei, T. A., Hengl, T., Kollet, S., Agam, N., and Avissar, R.: Soil structure is an important omission in Earth System Models, Nat. Commun., 11, 522, https://doi.org/10.1038/s41467-020-14411-z, 2020.
Gharedaghloo, B., Price, J. S., Rezanezhad, F., and Quinton, W. L.: Evaluating the hydraulic and transport properties of peat soil using pore network modeling and X-ray micro computed tomography, J. Hydrol., 561, 494–508, https://doi.org/10.1016/j.jhydrol.2018.04.007, 2018.
Hillel, D.: Environmental Soil Physics, Academic Press, San Diego, CA, USA, ISBN 978-0-12-348525-0, 1998.
Holden, J.: Flow through macropores of different size classes in blanket peat, J. Hydrol., 364, 342–348, https://doi.org/10.1016/j.jhydrol.2008.11.010, 2009.
Jarvis, P. G.: The interpretation of the variations in leaf water potential and stomatal conductance found in canopies in the field, Philos. T. R. Soc. Lond. B, 273, 593–610, https://doi.org/10.1098/rstb.1976.0035, 1976.
Köhli, M., Schrön, M., Zreda, M., Schmidt, U., Dietrich, P., and Zacharias, S.: Footprint characteristics revised for field-scale soil moisture monitoring with cosmic-ray neutrons, Water Resour. Res., 51, 5772–5790, https://doi.org/10.1002/2015WR017169, 2015.
Koster, R. D., Dirmeyer, P. A., Guo, Z., Bonan, G., Chan, E., Cox, P., Gordon, C. T., Kanae, S., Kowalczyk, E., Lawrence, D., Liu, P., Lu, C. H., Malyshev, S., McAvaney, B., Mitchell, K., Mocko, D., Oki, T., Oleson, K., Pitman, A., Sud, Y. C., Taylor, C. M., Verseghy, D., Vasic, R., Xue, Y., and Yamada, T.: Regions of strong coupling between soil moisture and precipitation, Science, 305, 1138–1140, https://doi.org/10.1126/science.1100217, 2004.
Kosugi, K.: Three-parameter lognormal distribution model for soil water retention, Water Resour. Res., 30, 891–901, https://doi.org/10.1029/93WR02931, 1994.
Largeron, C., Krinner, G., Ciais, P., and Brutel-Vuilmet, C.: Implementing northern peatlands in a global land surface model: description and evaluation in the ORCHIDEE high-latitude version model (ORC-HL-PEAT), Geosci. Model Dev., 11, 3279–3297, https://doi.org/10.5194/gmd-11-3279-2018, 2018.
Li, J., Miao, C., Zhang, G., Fang, Y.-H., Shangguan, W., and Niu, G.-Y.: Global evaluation of the Noah-MP land surface model and suggestions for selecting parameterization schemes, J. Geophys. Res.-Atmos., 127, e2021JD035753, https://doi.org/10.1029/2021JD035753, 2022.
Li, L., Yang, Z.-L., Matheny, A. M., Zheng, H., Swenson, S. C., Lawrence, D. M., Barlage, M., Yan, B., McDowell, N. G., and Leung, L. R.: Representation of plant hydraulics in the Noah-MP land surface model: Model development and multiscale evaluation, J. Adv. Model. Earth Sy., 13, e2020MS002214, https://doi.org/10.1029/2020MS002214, 2021.
Li, X. R., Jia, X. H., and Dong, G. R.: Influence of desertification on vegetation pattern variations in the cold semi-arid grasslands of Qinghai-Tibet Plateau, North-west China, J. Arid Environ., 64, 505–522, https://doi.org/10.1016/j.jaridenv.2005.06.011, 2006.
Liang, J., Yang, Z., and Lin, P.: Systematic hydrological evaluation of the Noah-MP land surface model over China, Adv. Atmos. Sci., 36, 1171–1187, https://doi.org/10.1007/s00376-019-9016-y, 2019.
Liu, R.: Soil Hydraulic Properties and Noah-MP Simulation Dataset for a Qinghai–Tibetan Plateau Wetland, figshare [data set], https://doi.org/10.6084/m9.figshare.32197428, 2026.
McCarter, C. P. R., Rezanezhad, F., Quinton, W. L., Gharedaghloo, B., Lennartz, B., Price, J., Connon, R., and Van Cappellen, P.: Pore-scale controls on hydrological and geochemical processes in peat: Implications on interacting processes, Earth-Sci. Rev., 207, 103227, https://doi.org/10.1016/j.earscirev.2020.103227, 2020.
Mitsch, W. J. and Gosselink, J. G.: Wetlands, 5th edn., John Wiley & Sons, Hoboken, NJ, USA, 747 pp., ISBN 978-1-118-67682-0, 2015.
Mualem, Y.: A new model for predicting the hydraulic conductivity of unsaturated porous media, Water Resour. Res., 12, 513–522, https://doi.org/10.1029/WR012i003p00513, 1976.
Niu, G.-Y. and Yang, Z.-L.: Effects of frozen soil on snowmelt runoff and soil water storage at a continental scale, J. Hydrometeorol., 7, 937–952, https://doi.org/10.1175/JHM538.1, 2006.
Niu, G.-Y., Yang, Z.-L., Mitchell, K. E., Chen, F., Ek, M. B., Barlage, M., Kumar, A., Manning, K., Niyogi, D., Rosero, E., Tewari, M., and Xia, Y.: The community Noah land surface model with multiparameterization options (Noah-MP): 1. Model description and evaluation with local-scale measurements, J. Geophys. Res.-Atmos., 116, D12109, https://doi.org/10.1029/2010JD015139, 2011.
Page, A. L., Miller, R. H., and Keeney, D. R. (Eds.): Methods of soil analysis, Part 2: Chemical and microbiological properties, 2nd edn., Agronomy Monograph 9, American Society of Agronomy and Soil Science Society of America, Madison, WI, USA, 1159 pp., https://doi.org/10.2134/agronmonogr9.2.2ed, 1982.
Pan, T., Hou, S., Wu, S., Liu, Y., Liu, Y., Zou, X., Herzberger, A., and Liu, J.: Variation of soil hydraulic properties with alpine grassland degradation in the eastern Tibetan Plateau, Hydrol. Earth Syst. Sci., 21, 2249–2261, https://doi.org/10.5194/hess-21-2249-2017, 2017.
Peters, A. and Durner, W.: Simplified evaporation method for determining soil hydraulic properties, J. Hydrol., 356, 147–162, https://doi.org/10.1016/j.jhydrol.2008.04.016, 2008.
Peters, A., Iden, S. C., and Durner, W.: Revisiting the simplified evaporation method: Identification of hydraulic functions considering vapor, film and corner flow, J. Hydrol., 527, 531–542, https://doi.org/10.1016/j.jhydrol.2015.05.020, 2015.
Rezanezhad, F., Quinton, W. L., Price, J. S., Elrick, D., Elliot, T. R., and Heck, R. J.: Examining the effect of pore size distribution and shape on flow through unsaturated peat using computed tomography, Hydrol. Earth Syst. Sci., 13, 1993–2002, https://doi.org/10.5194/hess-13-1993-2009, 2009.
Savitzky, A. and Golay, M. J. E.: Smoothing and differentiation of data by simplified least squares procedures, Anal. Chem., 36, 1627–1639, https://doi.org/10.1021/ac60214a047, 1964.
Schrön, M., Köhli, M., Scheiffele, L., Iwema, J., Bogena, H. R., Lv, L., Martini, E., Baroni, G., Rosolem, R., Weimar, J., Mai, J., Cuntz, M., Rebmann, C., Oswald, S. E., Dietrich, P., Schmidt, U., and Zacharias, S.: Improving calibration and validation of cosmic-ray neutron sensors in the light of spatial sensitivity, Hydrol. Earth Syst. Sci., 21, 5009–5030, https://doi.org/10.5194/hess-21-5009-2017, 2017.
Seneviratne, S. I., Lüthi, D., Litschi, M., and Schär, C.: Land–atmosphere coupling and climate change in Europe, Nature, 443, 205–209, https://doi.org/10.1038/nature05095, 2006.
Shao, Y. and Irannejad, P.: On the choice of soil hydraulic models in land-surface schemes, Bound.-Lay. Meteorol., 90, 83–115, https://doi.org/10.1023/A:1001786023282, 1999.
Tuller, M. and Or, D.: Hydraulic conductivity of variably saturated porous media: Film and corner flow in angular pore space, Water Resour. Res., 37, 1257–1276, https://doi.org/10.1029/2000WR900328, 2001.
van Genuchten, M. Th.: A closed-form equation for predicting the hydraulic conductivity of unsaturated soils, Soil Sci. Soc. Am. J., 44, 892–898, https://doi.org/10.2136/sssaj1980.03615995004400050002x, 1980.
Van Looy, K., Bouma, J., Herbst, M., Koestel, J., Minasny, B., Mishra, U., Montzka, C., Nemes, A., Pachepsky, Y. A., Padarian, J., Schaap, M. G., Tóth, B., Verhoef, A., Vanderborght, J., van der Ploeg, M. J., Weihermüller, L., Zacharias, S., Zhang, Y., and Vereecken, H.: Pedotransfer functions in Earth system science: Challenges and perspectives, Rev. Geophys., 55, 1199–1256, https://doi.org/10.1002/2017RG000581, 2017.
Vepraskas, M. J. and Craft, C. B. (Eds.): Wetland soils: Genesis, hydrology, landscapes, and classification, 2nd edn., CRC Press, Boca Raton, FL, USA, 440 pp., https://doi.org/10.1201/b18996, 2016.
Vereecken, H., Amelung, W., Bauke, S. L., Bogena, H., Brüggemann, N., Montzka, C., Vanderborght, J., Bechtold, M., Blöschl, G., Carminati, A., Javaux, M., Konings, A. G., Kusche, J., Neuweiler, I., Or, D., Steele-Dunne, S., Verhoef, A., Young, M., and Zhang, Y.: Soil hydrology in the Earth system, Nat. Rev. Earth Environ., 3, 573–587, https://doi.org/10.1038/s43017-022-00324-6, 2022.
Wang, X., Wang, Z.-L., and Liu, R.: Hydraulic properties within the complete moisture range of hydric soil on the Tibetan Plateau, Water Resour. Res., 60, e2023WR036018, https://doi.org/10.1029/2023WR036018, 2024.
Wang, X., Liu, R., Köhli, M., Marach, J., and Wang, Z.-L.: Monitoring soil water content and measurement depth of cosmic-ray neutron sensing in the Tibetan Plateau, J. Hydrometeorol., 26, 155–167, https://doi.org/10.1175/JHM-D-23-0103.1, 2025.
Wildenschild, D. and Sheppard, A. P.: X-ray imaging and analysis techniques for quantifying pore-scale structure and processes in subsurface porous medium systems, Adv. Water Resour., 51, 217–246, https://doi.org/10.1016/j.advwatres.2012.07.018, 2013.
Yang, Z.-L., Dickinson, R. E., Robock, A., and Vinnikov, K. Y.: Validation of the snow submodel of the Biosphere–Atmosphere Transfer Scheme with Russian snow cover and meteorological observational data, J. Geophys. Res.-Atmos., 102, 19549–19558, https://doi.org/10.1029/97JD00904, 1997.
Yang, Z.-L., Niu, G.-Y., Mitchell, K. E., Chen, F., Ek, M. B., Barlage, M., Longuevergne, L., Manning, K., Niyogi, D., Tewari, M., and Xia, Y.: The community Noah land surface model with multiparameterization options (Noah-MP): 2. Evaluation over global river basins, J. Geophys. Res.-Atmos., 116, D12110, https://doi.org/10.1029/2010JD015140, 2011.
Zeng, C., Zhang, F., Wang, Q. J., Chen, Y. Y., and Joswiak, D. R.: Impact of alpine meadow degradation on soil hydraulic properties over the Qinghai–Tibetan Plateau, J. Hydrol., 478, 148–156, https://doi.org/10.1016/j.jhydrol.2012.11.058, 2013.
Zhang, T., Xu, M., Zhang, Y., Zhao, T., An, T., Li, Y., Sun, Y., Chen, N., Zhao, T., Zhu, J., and Yu, G.: Grazing-induced increases in soil moisture maintain higher productivity during droughts in alpine meadows on the Tibetan Plateau, Agr. Forest. Meteorol., 269–270, 249–256, https://doi.org/10.1016/j.agrformet.2019.02.022, 2019.