
the Creative Commons Attribution 4.0 License.
the Creative Commons Attribution 4.0 License.
 | 29 Sep 2026
Online xylem water isotope monitoring and soil water content profiling reveal spatial root water uptake dynamics in sunflower

Samuel Le Gall
Nicolas Brüggemann
Sharmin Jahan
Mathieu Javaux
Julian Klaus
Harry Vereecken
Dagmar van Dusschoten
Knowledge about plant water stress regulation mechanisms (e.g., plant stem capacitance) from in situ observation is crucial for the study and modeling of plant root water uptake (RWU). We present a proof of concept and a first application of a simple method for online, minimally invasive monitoring of the water stable isotopic composition of sap xylem water of Helianthus annuus (sunflower) by inserting a sampling tube connected to a laser spectrometer in the plant stem. After careful calibration of our method, we applied it successfully to individual sunflower plants grown in soil columns. We followed the dynamics in stem water isotopic composition in response to changing light intensity and to depth-specific, isotopically labeled water pulses. We further establish that these isotopic dynamics matched changes in RWU profiles monitored simultaneously, independently, and non-destructively by the Soil Water Profiler. We finally highlight from modeling exercises the significance of the role of plant stem capacitance: water exchanges between xylem and stem non-conducting tissues were estimated to amount to about one sixth of RWU of Helianthus annuus, showing that the stem itself can be expected to be a quickly accessible reservoir of water for transpiration, very similar to what is found in trees.
- Article
(7597 KB) - Full-text XML
- BibTeX
- EndNote


The development of drought stress in plants arises from a discrepancy between plant atmospheric demand and root water uptake (RWU) (Javaux et al., 2013; Meinzer et al., 1993). This results in a decrease in leaf water potential, stomatal downregulation and the loss of shoot and root water, which may eventually lead to xylem failure and plant death (Mantova et al., 2022). The mechanism, by which a plant or one of its organs (e.g., stem, petiole, leaf) loses water is quantified by the so-called capacitance, i.e., the derivative of the plant (or organ) water retention function (i.e., the ratio of the changes of its water content and its water potential) and typically expressed in cm3 water cm−3 tissue MPa−1 (Fuchs, 2025). Capacitance always occurs, but its magnitude is a function of plant water status (e.g., Campbell et al., 1979): in the absence of stressors, we typically observe cycles of water replenishment and depletion in the evening and the morning, respectively, but the daily total transpired shoot water volume is not affected. When drought conditions prevail, replenishment does not fully occur, which leads to tissue desaturation and decrease in plant transpiration.
The implication that a plant has a hydraulic capacitance is often ignored in modeling (but see for trees, e.g., Janott et al., 2011; Sperry and Love, 2015). For herbaceous plants, modeling of xylem water flow is almost exclusively based on the concept of resistivities, which is acceptable under steady flux conditions but may be questionable under dynamic conditions or when soil becomes dry. Some experiments show that the “capacitive contribution” to the fluxes is not negligible (Li et al., 2002; Meinzer et al., 2009), and recent work, although strictly limited to laboratory conditions (for sunflower see van Dusschoten et al., 2023), indicates that the largest fraction of transpiration during drought originates from shoot water, not RWU.
The relative distribution of RWU [−] across the soil profile, may be observed from stable isotopic (2H, 18O) analysis both in the laboratory and in the field by comparing the isotopic compositions (δ) in soil layers (1…i…n) and stem (alternatively the root crown, see Barnard et al., 2006) xylem water (δxyl [–, expressed in ‰]), assuming that the latter reflects that of RWU (Penna et al., 2020; von Freiberg et al., 2020; Rothfuss and Javaux, 2017):
where qRWU(i) [mL min−1] is the uptake flow in layer i [mL min−1] and QRWU[mL min−1] its sum across layers (i.e., ). Equation (1) relies on the assumption that the water extracted from the soil profile instantly and completely mixes inside the roots and shoot so that there is no delay between the time water is extracted and when it reaches the stem xylem. In other words, it does not consider (a) potentially existing preferential connections between roots and leaves, (b) the fact that conducting tissues have a certain volume, leading to a time delay, and (c) the capacitance effect of the plant non-conducting tissues (and in soil as well). Some authors investigated the hypothesis of perfect mixing and explicitly considered a time delay due to sap flow transport between the uptake and the sampling location (e.g., De Deurwaerder et al., 2020). Equation (1) also assumes no isotopic fractionation during root water uptake or during transport inside the xylem vessels.
One drawback of the isotopic methodology is that it predominantly relies on destructive sampling in the field and subsequent offline determination in the laboratory (Ceperley et al., 2024). It is also associated with well-documented uncertainties, mostly stemming from the necessity to extract water from the soil and from stem samples (Millar et al., 2022). One alternative to access δxyl is to monitor the isotopic composition of transpiration (δTr) non-destructively with gas-exchange chambers, under the assumption – derived from mass conservation of isotopes – that δTr equals δxyl (e.g., Knighton et al., 2020a, b), and therefore can be used for retrieving root water uptake patterns:
Operating a gas-exchange chamber that encloses an entire plant may be applicable to several small crops (possibly in early growth stages) and tree saplings. However, handling is not straightforward (e.g., issues with condensation of water inside the chamber yielding a fractionated isotopic signal). Another alternative is the direct online and continuous monitoring of δxyl, a method that is currently restricted to some deciduous and evergreen tree species (e.g., Kinzinger et al., 2025; Marshall et al., 2020; Seeger and Weiler, 2023; Volkmann et al., 2016). It has revealed water transit times of several hours to days from the root system to the stem, which could point to the importance of plant capacitance. There is, however, no isotopic work studying in a holistic way the equivalences between δRWU, δTr, and δxyl and their relationships to water stress for herbaceous plants.
The objective of the present study was to provide a first proof of concept for the online monitoring of δxyl in an herbaceous individual of Helianthus annuus (sunflower) and to study the plant-scale response to irrigation pulses differing in their timing, location, and isotopic composition values. To achieve this objective, the sunflower stem directly above the soil surface was punctuated and the borehole connected to a laser spectrometer with a sampling tube for online measurements. Importantly, our intention was not to avoid cavitation in the xylem vessels directly impacted by the drilling as it is mandatory for direct xylem pressure measurements (see, e.g., review of Wei et al., 2001). The experiments were conducted in a hydroponics setting and in soil columns under strictly controlled conditions of temperature, humidity and light intensity in a climate chamber. Results of the isotopic monitoring were validated against those of a non-destructive, rapid, and highly precise capacitive soil volumetric water content sensor, the Soil Water Profiler (SWaP, van Dusschoten et al., 2020). Finally, the prevalence and importance of capacitance in plant water flow was evaluated with the data from two independent modeling exercises.
We conducted two independent but complementary experiments. The first experiment in hydroponic conditions (called “calibration experiment” hereafter) aimed to determine the extent to which the stem water vapor collected in situ was isotopically representative of the xylem liquid water. More precisely, the objective was to establish 2H- and 18O-specific calibration functions to convert the stem water vapor isotopic composition () into xylem (liquid) water isotopic compositions (δxyl) values.
The second experiment (called “case study” afterwards) was conducted on two potted sunflowers plants using soil columns under controlled conditions to (i) investigate their response to irrigation pulses that differed in their soil location and timing and (ii) assess the importance of their water flow capacitance. In this experiment, the Soil Water Profiler, SWaP (van Dusschoten et al., 2020) was used to provide independent, quantitative estimates of root water uptake profiles. Because of the absence of experimental replicates and repetitions, our intention was not to draw definitive conclusions on the physiology and water transit times that would be representative of the investigated sunflower cultivar.
2.1 In situ online monitoring
was monitored by drilling a 5 mm deep and 3.5 mm diameter hole in the stem of the plants 2–3 cm above the soil surface and by connecting the borehole to a cavity ring down spectrometer (L2130-i, Picarro, Inc., Santa Clara, CA, USA) with a diameter PTFE tubing. Thereby, at the position of the hole, the xylem is punctured and these xylem vessels will no longer contribute to xylem flow. Water vapor from the stem was passively sampled at a rate of 28 mL min−1 into the PTFE tubing by the laser spectrometer. Sunflower stems contain stomata and have a leaky cuticle (Kutschera and Khanna, 2025) through which outside air can enter stem and become water saturated. To avoid contamination of the water vapor stream in the tubing with air from the climate chamber and to prevent photosynthesis (and therefore transpiration) to happen at the sampling point (which would bias the isotopic measurement), the connection of the PTFE tubing to the plant stem was covered with a sealing paste (Terostat VII, Henkel, Germany).
was calculated by averaging 1 min of collected 1 Hz continuous raw data (that is, exactly 60 data points) and correcting for the dependency of the laser spectrometer on water vapor mixing ratio (Schmidt et al., 2010). was then converted into δstem, the isotopic composition value of the liquid water transported or stored inside the stem that is at thermodynamic equilibrium with stem water vapor. For this, we used the temperature-dependent functions of Horita and Welowski (1994). Finally, the δstem values were calibrated against the measurements of two in-house water vapor isotope standards, each consisting of a vessel filled with a silt loam soil (sand: 21 %, silt: 66 %, and clay: 13 %, saturated water content: 0.45 cm3 cm−3, saturated hydraulic conductivity: 1.00224 cm d−1) and saturated with water of known isotopic composition (i.e., standard 1: ‰ and ‰, standard 2: δ2H=69.3 ‰ and δ18O=24.7 ‰). Each water vapor isotopic standard was measured once per day (see for details Deseano-Diaz et al., 2023).
2.2 Soil water content profiling
The Soil Water Profiler (van Dusschoten et al., 2020) consists of two (5×7 cm2) Cu sheets that act as a capacitor in series with a single turn radio frequency coil thereby creating a resonator. The resonance frequency is very sensitive to the soil electric permittivity and therefore to the soil volumetric water content (SWC). As the sensor slides up and down along the soil column using a precision linear axis it functions as an online and non-destructive measurement of soil volumetric water content profiles and its development over time. SWC can be determined after calibration with 8–10 soil probes of known SWC against the resonance frequency. SWC calculated in this manner has a maximum accuracy of 0.003 cm3 cm−3. When combined with changing conditions in light intensity as can be done in a climate-controlled chamber, one can derive vertically resolved (cm) and high frequency (10 min) dynamics in RWU from the collected data. The main idea here is that light induces rapid changes in transpiration and xylem potential that causes quicker change in local water uptake (qRWU) than in vertical (soil and plant) water redistribution, which allows one to assume that the local change of water content is proportional to qRWU.
2.3 Calibration experiment
To quantify the relationship between the isotopic composition measured in the stem water (δstem) and that of the stem xylem sap (δxyl), we elaborated a hydroponic settings experiment. This had the advantage of providing the plant with one single water source for root water uptake. Our working hypothesis was that, after a certain period when stem water reaches equilibrium (i.e., δstem is no longer a function of time), (1) δxyl equals the isotopic composition of the hydroponic solution and (2) δstem reflects that of the hydroponic solution.
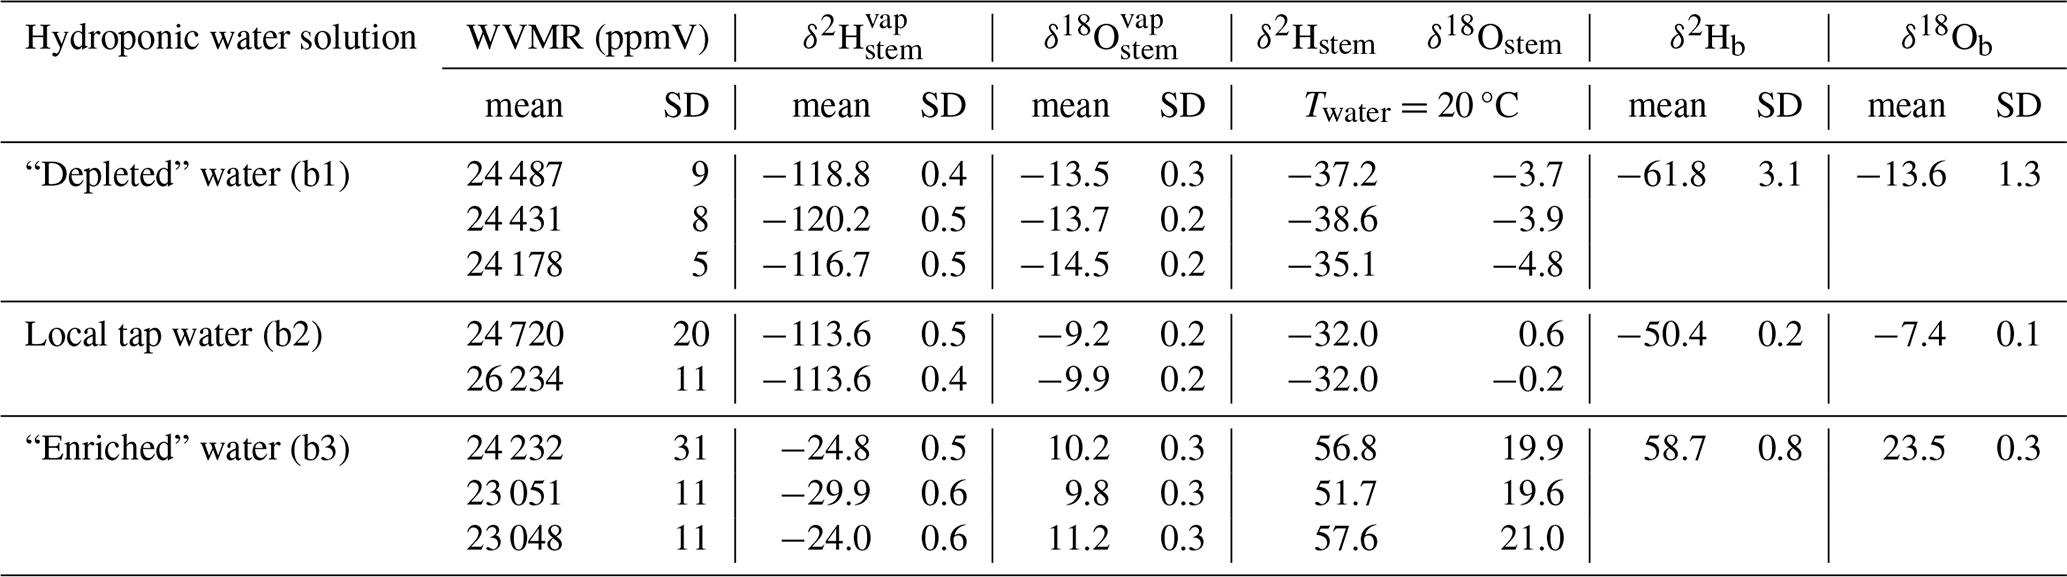
To test both hypotheses, sunflower plants of the “Yellow Spray” cultivar, a small (< 50 cm height) sunflower variety, were grown in aerated hydroponic solution – obtained by combining Dutch Formula GROW™ and Dutch Formula MICRO™ solutions (Advanced hydroponics of Holland, The Netherlands) in 1 and 2 mL L−1 concentration, respectively – for a duration of three months under controlled conditions of light intensity, air temperature (20 °C) and relative humidity (50 %) (see Appendix A). During that time, light intensity was set to follow a 24 h square wave cycle, from 0 µmol m−2 s−1 (20:00–06:00) to 1200 µmol m−2 s−1 (06:00–20:00). When the BBCH 60 vegetative stage was reached, nine plants were removed from the hydroponic solution and placed randomly in one of three 5 L water baths (three plants per bath). Each bath was covered with a polystyrene foam plate to prevent evaporative fractionation and to hold the plant stem; it was filled with water of known and different isotopic composition (i.e., bath 1 (“depleted” water): δ2H ‰ and δ18O ‰, bath 2 (local tap water): δ2H ‰ and δ18O ‰, and bath 3 (“enriched water”), δ2Hb3=58.7 ‰ and δ18Ob3=23.5 ‰). The isotopic composition of the stem water vapor () collected from each plant was calculated (Sect. 2.1) once equilibrium was reached (i.e., a plateau of constant isotopic composition values was observed) and the corresponding δstem was determined at water temperature (20 °C). The 2H- and 18O-specific calibration functions were obtained by comparing the isotopic composition values in the water baths (i.e., δb1, δb2, and δb3) against the stem liquid water isotopic composition values averaged across the plants in each bath (δstem_b1, δstem_b2, and δstem_b3).
2.4 Case study
2.4.1 Experimental design and environmental conditions
Two “Yellow Spray” sunflower plants were grown each inside a PVC column (50 cm height × 9 cm diameter) filled with a loamy sand soil (Müllers et al., 2022) packed to a dry bulk density of 1.5 kg L−1 (Fig. 1 and Appendix A). Soil was packed to this density by adding 0.08 cm3 of water per cm−3 soil beforehand to keep the particle size distribution homogenous across the soil profile following the subsequent water additions during the experiment. Additional water was added until the desired SWC (mostly between 0.2 and 0.25 cm3 cm−3) was reached. At 30 cm depth, a porous aeration stone (Pawfly, China) was installed in the soil to allow for depth- and isotope-specific water labeling of the soil of the two columns. The plants were placed inside a climate-controlled chamber (air temperature: 20 °C, air relative humidity: 50 %) where they were watered until they reached the full flowering stage (BBCH 65). During the experimental period from 06:00–20:00, a 4 hour-cycle of light intensity (CXA2520-0000-000N0YN430H, Lighting Solutions, Lüdenscheid, Germany) was generated in the climate chamber, starting with two hours of high light intensity (1000 µmol m−2 s−1 from 06:00–08:00, 10:00–12:00 etc.) followed by two hours of low light intensity (150 µmol m−2 s−1, from 08:00–10:00, 12:00–14:00 etc.) except for day of experiment (DoE) 2 after 10:00 in the first experiment when high light intensity (1000 µmol m−2 s−1) was maintained.
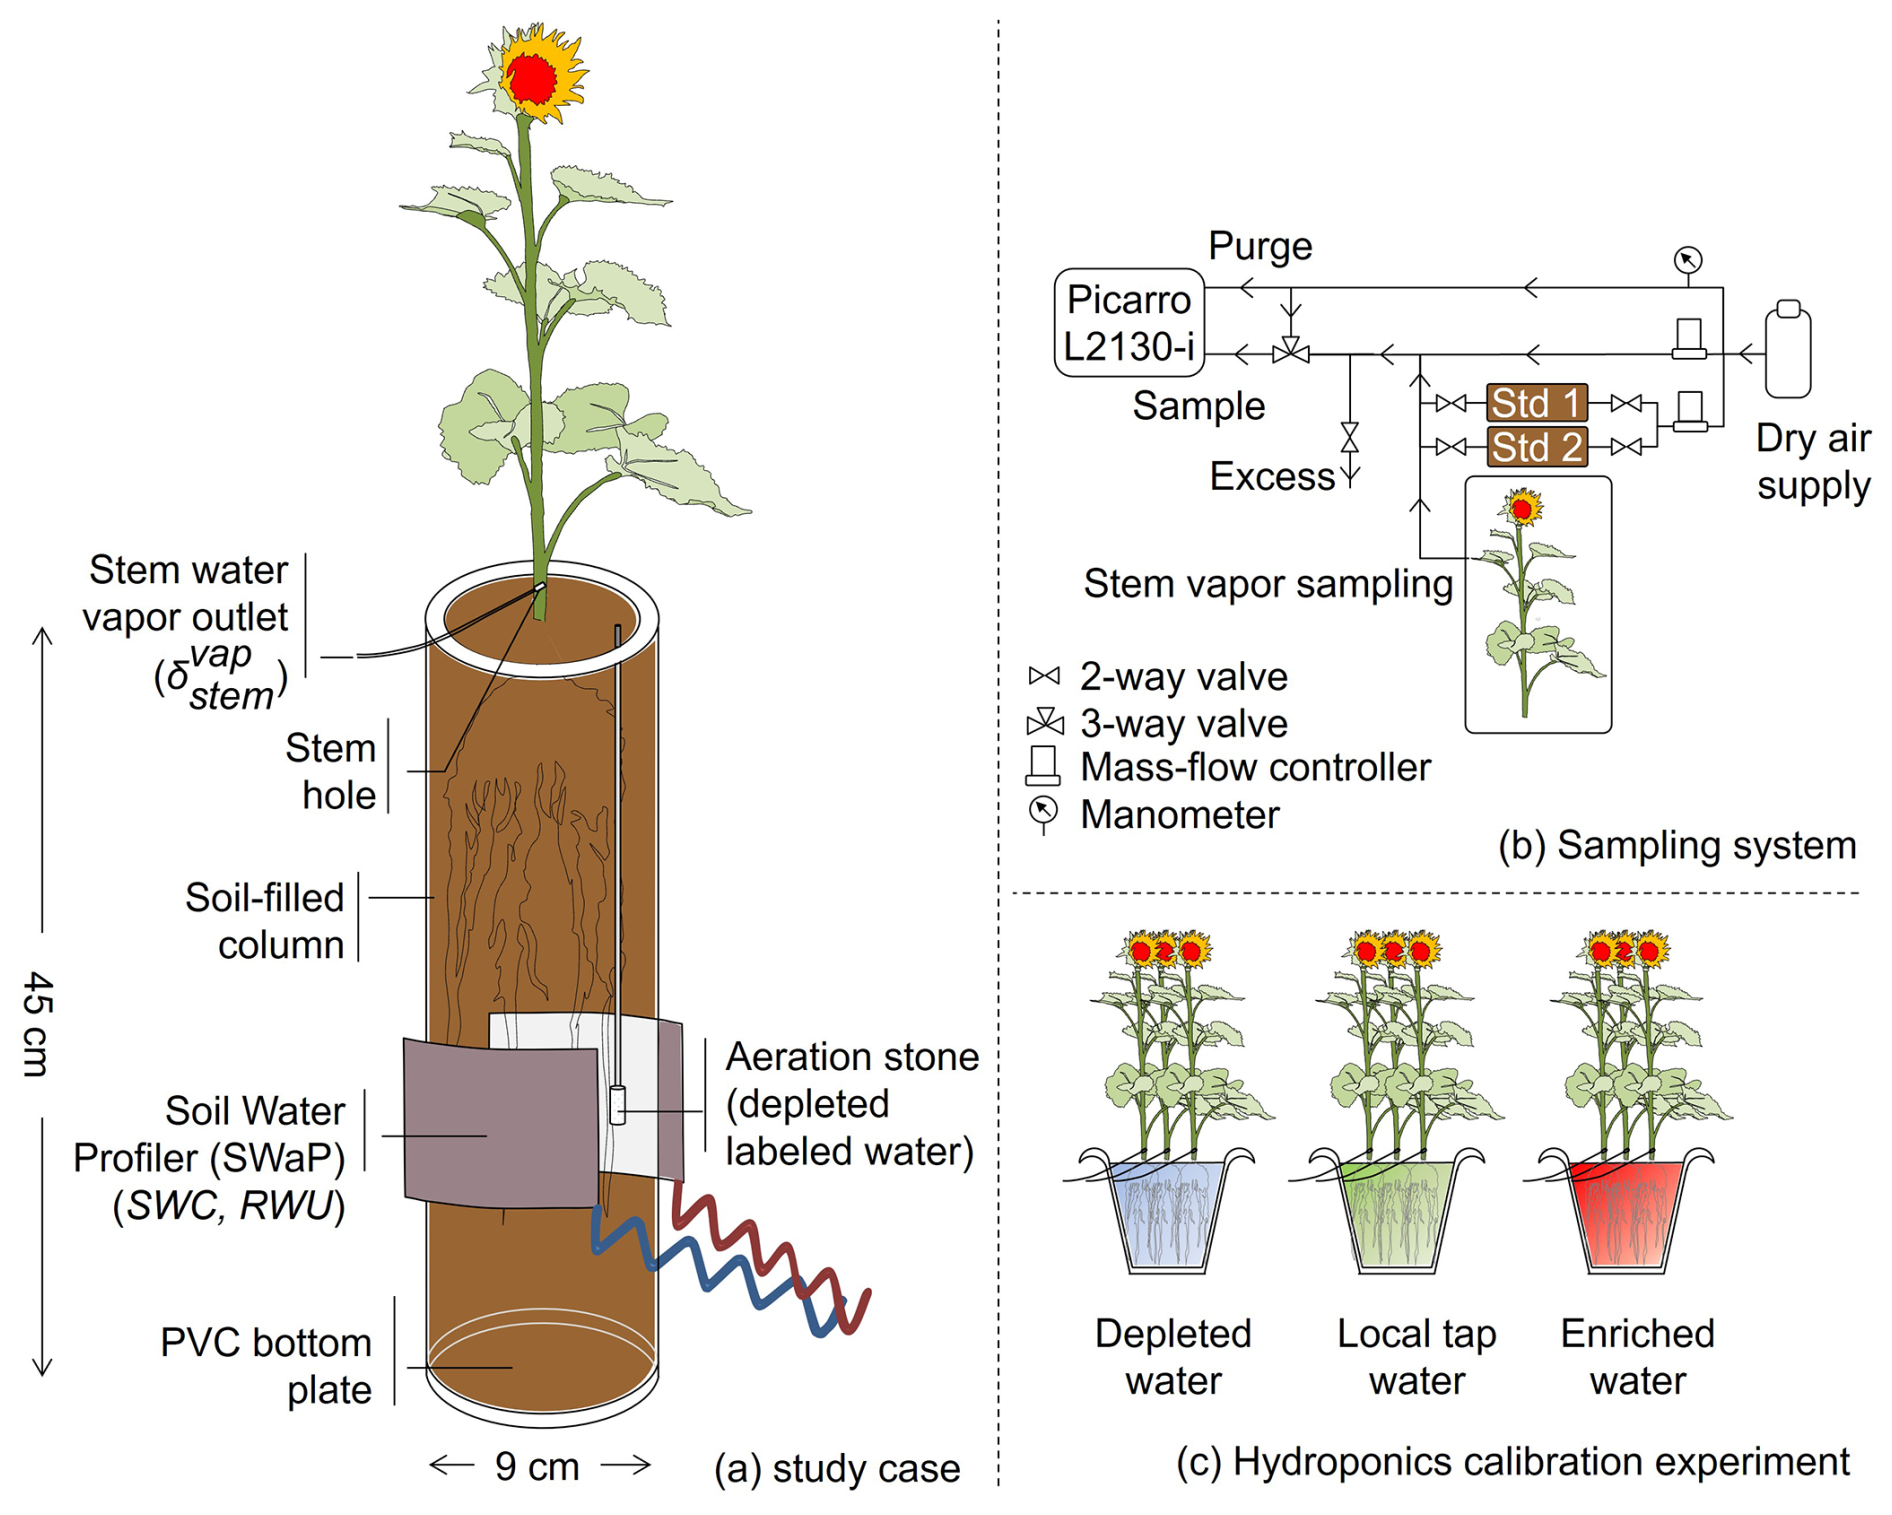
Figure 1Experimental setups and designs: soil column and equipment used in the case study for the monitoring of the stem water vapor isotopic composition () and of the soil water content (SWC) and root water uptake (RWU) profiles with the Soil Water Profiler (SWaP, see also Appendix A) (a). Gas collection system and online isotopic analysis with the laser absorption spectrometer (Picarro L2130-i, Picarro Inc.) (b). Schematic of the hydroponics experiment conducted to obtain the isotopic calibration functions for the conversion to readings into δxyl values (c).
2.4.2 Experimental timeline
A first sunflower (plant #1) with its soil column was placed into the SWaP of the climate-controlled chamber on DoE 1 at 15:10 and shortly after connection to the laser spectrometer, after which the initial conditions in volumetric water content, RWU and isotopic composition were recorded until 16:00. A second sunflower (plant#2) was placed into the climate chamber under the same light panel as plant #1. At 16:00, 16:15, and 17:00, 15, 15, and 30 mL, respectively, of isotopically enriched water (δ2H=80.9 ‰ and δ18O=27.4 ‰) was injected with a needle roughly 2–3 cm below the soil surface in both plant #1 and plant #2 columns. Isotopic and SWaP measurements proceeded for plant #1 overnight. On DoE 2, 15 mL of depleted water ( ‰ and ‰) each was injected at three occasions (09:45, 10:05, and 10:15) into the aeration stones (i.e., at 30 cm depth) in both plant #1 and plant #2 columns. Measurements on plant #1 were terminated on DoE 2 at 13:50.
Plant #2 was placed into the SWaP on DoE 2 at 16:00, connected to the laser spectrometer to record the initial soil water content profile. Then the labeling was done, this time at the top (with enriched water) and at the bottom (with depleted water) in a much shorter time span (i.e., 16:10–16:45) on four occasions – two for each labeled water – each time with 15 mL of water. Measurements on plant #2, and with them the experiment, were terminated on Doe 3 at 11:10.
Upon completion of the experiment, the soil columns were placed in a 4.7 T magnetic resonance imaging (MRI) magnet (Magnex, Oxford, UK) controlled via a MR Solutions spectrometer (Guildford, UK) to take cross-section pictures of the stems of plants #1 and #2 for assessing the impact of the drilling on the sunflower stem tissues.
2.4.3 Data analysis
For the analysis with the SWaP, the soil column was subdivided a posteriori into three layers: an upper layer (0–16.5 cm) encompassing the isotopically enriched water pulse, a middle layer around the aeration stone (16.5–36.5 cm) for the depleted water pulse and a bottom layer (36.5–45 cm) where no labeled water was observed to enter. The boundaries between layers were chosen based on the absence of observable cross-over of water between layers based on the sequential SWaP data. Shifting the position of the boundaries by 1 cm up or down had no significant effect on the observed SWC decay rates of the adjoining layers, indicating minimal to no water flow occurred between layers (see also Appendix Fig. B1 for a graphical explanation). The fractions of the isotopically labeled pulse water can be calculated based on the known amount of present water before the pulses together with the known amounts of added water (Appendix B). Furthermore, it was assumed that, within each layer the added, labeled water and the antecedent, “unlabeled” water were taken up by the roots indifferently (i.e., at the same rate) after allowing the labeled water to diffuse within the layer for at least an hour.
Prior to applying a pulse of isotopic labelled water, the SWC depth profile was assessed with the SWaP to calculate the contribution of non-labelled water to total RWU. After water addition, changes in the SWC profile were continuously monitored until the pulse dispersed in all three directions in the soil, which occurred within about 2 h, identifiable as the maximum observed local SWC in time close to the injection point. Only from that point onward could the contribution of the labeling pulse to total RWU be calculated.
In the second experiment, δstem was calculated with a 10 min temporal resolution, that is, by averaging the last minute (exactly 60 data points) of each consecutive 10 min period. δstem was finally converted to δxyl using the calibration equations obtained from the calibration experiment.
2.4.4 Modeling of δxyl assuming instantaneous steady-state flux conditions
δxyl was calculated using Eq. (1), considering the three layers of soil defined above (i=1: 0–16.5 cm, i=2: 16.5–36.5 cm, and i=3: 36.5–45 cm):
where rRWU (−) is the relative root water uptake, defined as:
with qRWU (mL min−1) the local uptake flow and determined from the time changes in soil water content profile obtained with the SWaP (Sect. 2.2 and 2.4.2). Importantly, δxyl_calc could only be calculated in periods where water was extracted and not added to the different layers. As stated above in the introduction, Eq. (1) (and therefore Eq. 1') assumes that an instantaneous steady-state water flux is achieved, that is, no effect of plant hydraulic capacitance on RWU. In reality this takes longer.
Based on the SWaP data we can safely assume that no transport of water occurred across soil layers, δsoil was calculated from mixing between amounts of isotopically labeled (enriched or depleted) added water (volume Vadd) and antecedent soil water (Vant) in each layer:
with , the total water volume in each layer i, and where Vant is calculated as the product of the soil layer volume and volumetric water content (measured by the SWaP). We acknowledge that, in between labeling pulses, the isotopic composition of soil may locally change as it is directly affected by soil water redistribution (and by RWU indirectly). However, at the layer scale remains constant since there is no water transport across soil layers. Finally, values for the initial soil water isotopic composition (δini), i.e., prior to the first addition of isotopically enriched water in the upper soil layer on DoE 1 16:00–17:00, was determined – since it was not measured in situ during the experiment – and was assumed to be the same for both soil columns (plant #1 and plant #2). More precisely, δini was computed to fall onto an evaporation line with a slope of 4 ‰ ‰−1 (Rothfuss et al., 2015) and passing through the isotopic composition value of local tap water ( ‰ and ‰) in a dual isotope (δ2H vs. δ18O) plot. The calculated soil water δ2Hini (δ18Oini) in the top, middle, and bottom layers of both soil columns (in which plant #1 and #2 were grown) were −47.7 ‰, −50.4 ‰, and −50.4 ‰ (−6.7 ‰, −7.4 ‰, and −7.4 ‰).
2.4.5 Xylem water – stem water replacement model
A quantitative model that describes transient changes in δxyl is beyond the scope of the present study with the limited amount of data available. However, we can simulate the time needed to observe the replacement of water contained in the cortex and pith of the stem with water from the xylem upon labeling using a simple exponential model. Assuming a well-mixed stem water reservoir of effective volume Vstem (mL) exchanging with a fraction fex of the xylem water flow rate QRWU, the fraction of stem water replaced r (−) follows first-order turnover kinetics, yielding (see Appendix C for a graphical representation):
Equation (5) can be inversed from estimates of Vstem and QRWU and the time needed to reach r=1 from soil water content and isotopic composition data to obtain a value for fex (−), the fraction of the xylem water that exchanges with stem water. Importantly, only stem water until the drillhole location is considered here and not the water from the roots and the stem downstream of that location. We also assumed, like above (Eq. 4), that mixing of antecedent water with new, labeled water in the soil is relatively fast compared to mixing in the stem.
3.1 Calibration experiment
More than 99.9 % of the variability in isotopic composition of the hydroponic solutions was explained by a linear model of δstem – computed from the measured stem water vapor isotopic composition, , and the water temperature assuming thermodynamic equilibrium conditions (see Sect. 2.1). The 2H- and 18O- linear equations obtained were:
with root mean square errors (RMSE) of 1.8 ‰ and 0.8 ‰, respectively, and where numbers in parentheses refer to standard errors of the estimated slopes and y-intercepts values (see Appendix D for the isotopic composition data feeding the linear model). The typical time needed for reaching a stable value was 20–45 min, that is, the time upon which antecedent water inside the stem was replaced with the new hydroponic solution. This was comparable to other in-situ approaches (e.g., Rothfuss et al., 2013; Beyer et al., 2020) and was independent from the magnitude of the step change in isotopic composition (i.e., the difference between initial and final value). However, results of another, separate experiment conducted in a soil pot (see Appendix E) showed that δ2H and δ18O response times were significantly shorter and were evaluated to range between 20 and 30 s, which is equal to the response time of the isotope laser spectrometer itself. We noted also that the existence of a thermodynamic equilibrium between stem water and stem water vapor at the time of sampling, a prerequisite of using the calibration functions, could be verified from the water vapor mixing ratio (WVMR) readings of the laser spectrometer. This was, on average, equal to 24 340 (±860) ppmV, yielding a relative humidity of 100 % (or close to 100 %) at 20 °C temperature.
3.2 Case study: Plant responses to timing and depth of the labeling pulse
The two plants of the case study (Figs. 2 and 3) showed similar responses to the labeling pulses with some minor differences that could be explained by the timing of the pulses. Overall, there was a strong agreement between the two independent methods (isotopic in situ monitoring system and SWaP) as seen from the time series of (i) soil water content (SWC) across depths (Figs. 2a and 3a), of (ii) the layer (top, middle, bottom)-specific and total absolute RWU flux rate qRWU and QRWU (Figs. 2b and 3b), and of (iii) the (hydrogen and oxygen) isotopic composition of the stem xylem water (δxyl) obtained from calibration of the δstem observation with Eqs. (6a) and (6b) (see Sects. 2.3 and 3.1, Figs. 2c and 3c).
Shortly after the first enriched labeling pulse was applied to the top layer (0–16.5 cm, on DoE 1 at 16:00–17:00, see orange vertical stripe) of the soil of plant #1 and as the soil water content increased in that layer (Fig. 2a), the contributions to total RWU from the top and middle soil layers ( and ) increased and dropped, respectively (Fig. 2b, orange and green curves). Meanwhile, δxyl of plant #1 started to increase and continued increasing (at a slower time rate) after lights were switched off on DoE 1 20:00 (Fig. 2c). Plant #1 xylem water did not seem to reach complete equilibrium “overnight” as δxyl reached its maximum value (δ2H=10.0 ‰ and δ18O=10.4 ‰) only at the end of the “night period” on DoE 2 at 06:00. As lights were turned on again, QRWU increased (from 0.33 to 1.75 mL/10 min), increased from 0.28 to 1.36 mL/10 min and increased from 0.01 to 0.32 mL/10 min simultaneously in 50 min of time. This translated into a slower (∼ 2 h) but significant (∼ e.g., –15 ‰ for δ2H) decrease in δxyl. After the addition of the second labeling pulse (DoE 2 from 09:45–10:15, violet stripe) with depleted water in the middle soil layer (16.5–36.5 cm) and following the switching of the lights to high intensity (DoE 2 at 10:00) again, dropped significantly (0.73 to 0.22 mL/10 min) as increased (from 0.06 to 0.95 mL/10 min) simultaneously. A change in δxyl was picked up concomitantly at the position of the tubing in the pith of the stem. Again, even after a few hours the isotopic composition of the xylem water had not reached equilibrium while the plant experienced high transport rates (DoE 2, 10:15–13:50). Note that, during the whole period of this first experiment, the contribution of the bottom soil layer to total root water uptake remained rather constant (in average 12(±6) %, Fig. 2b).
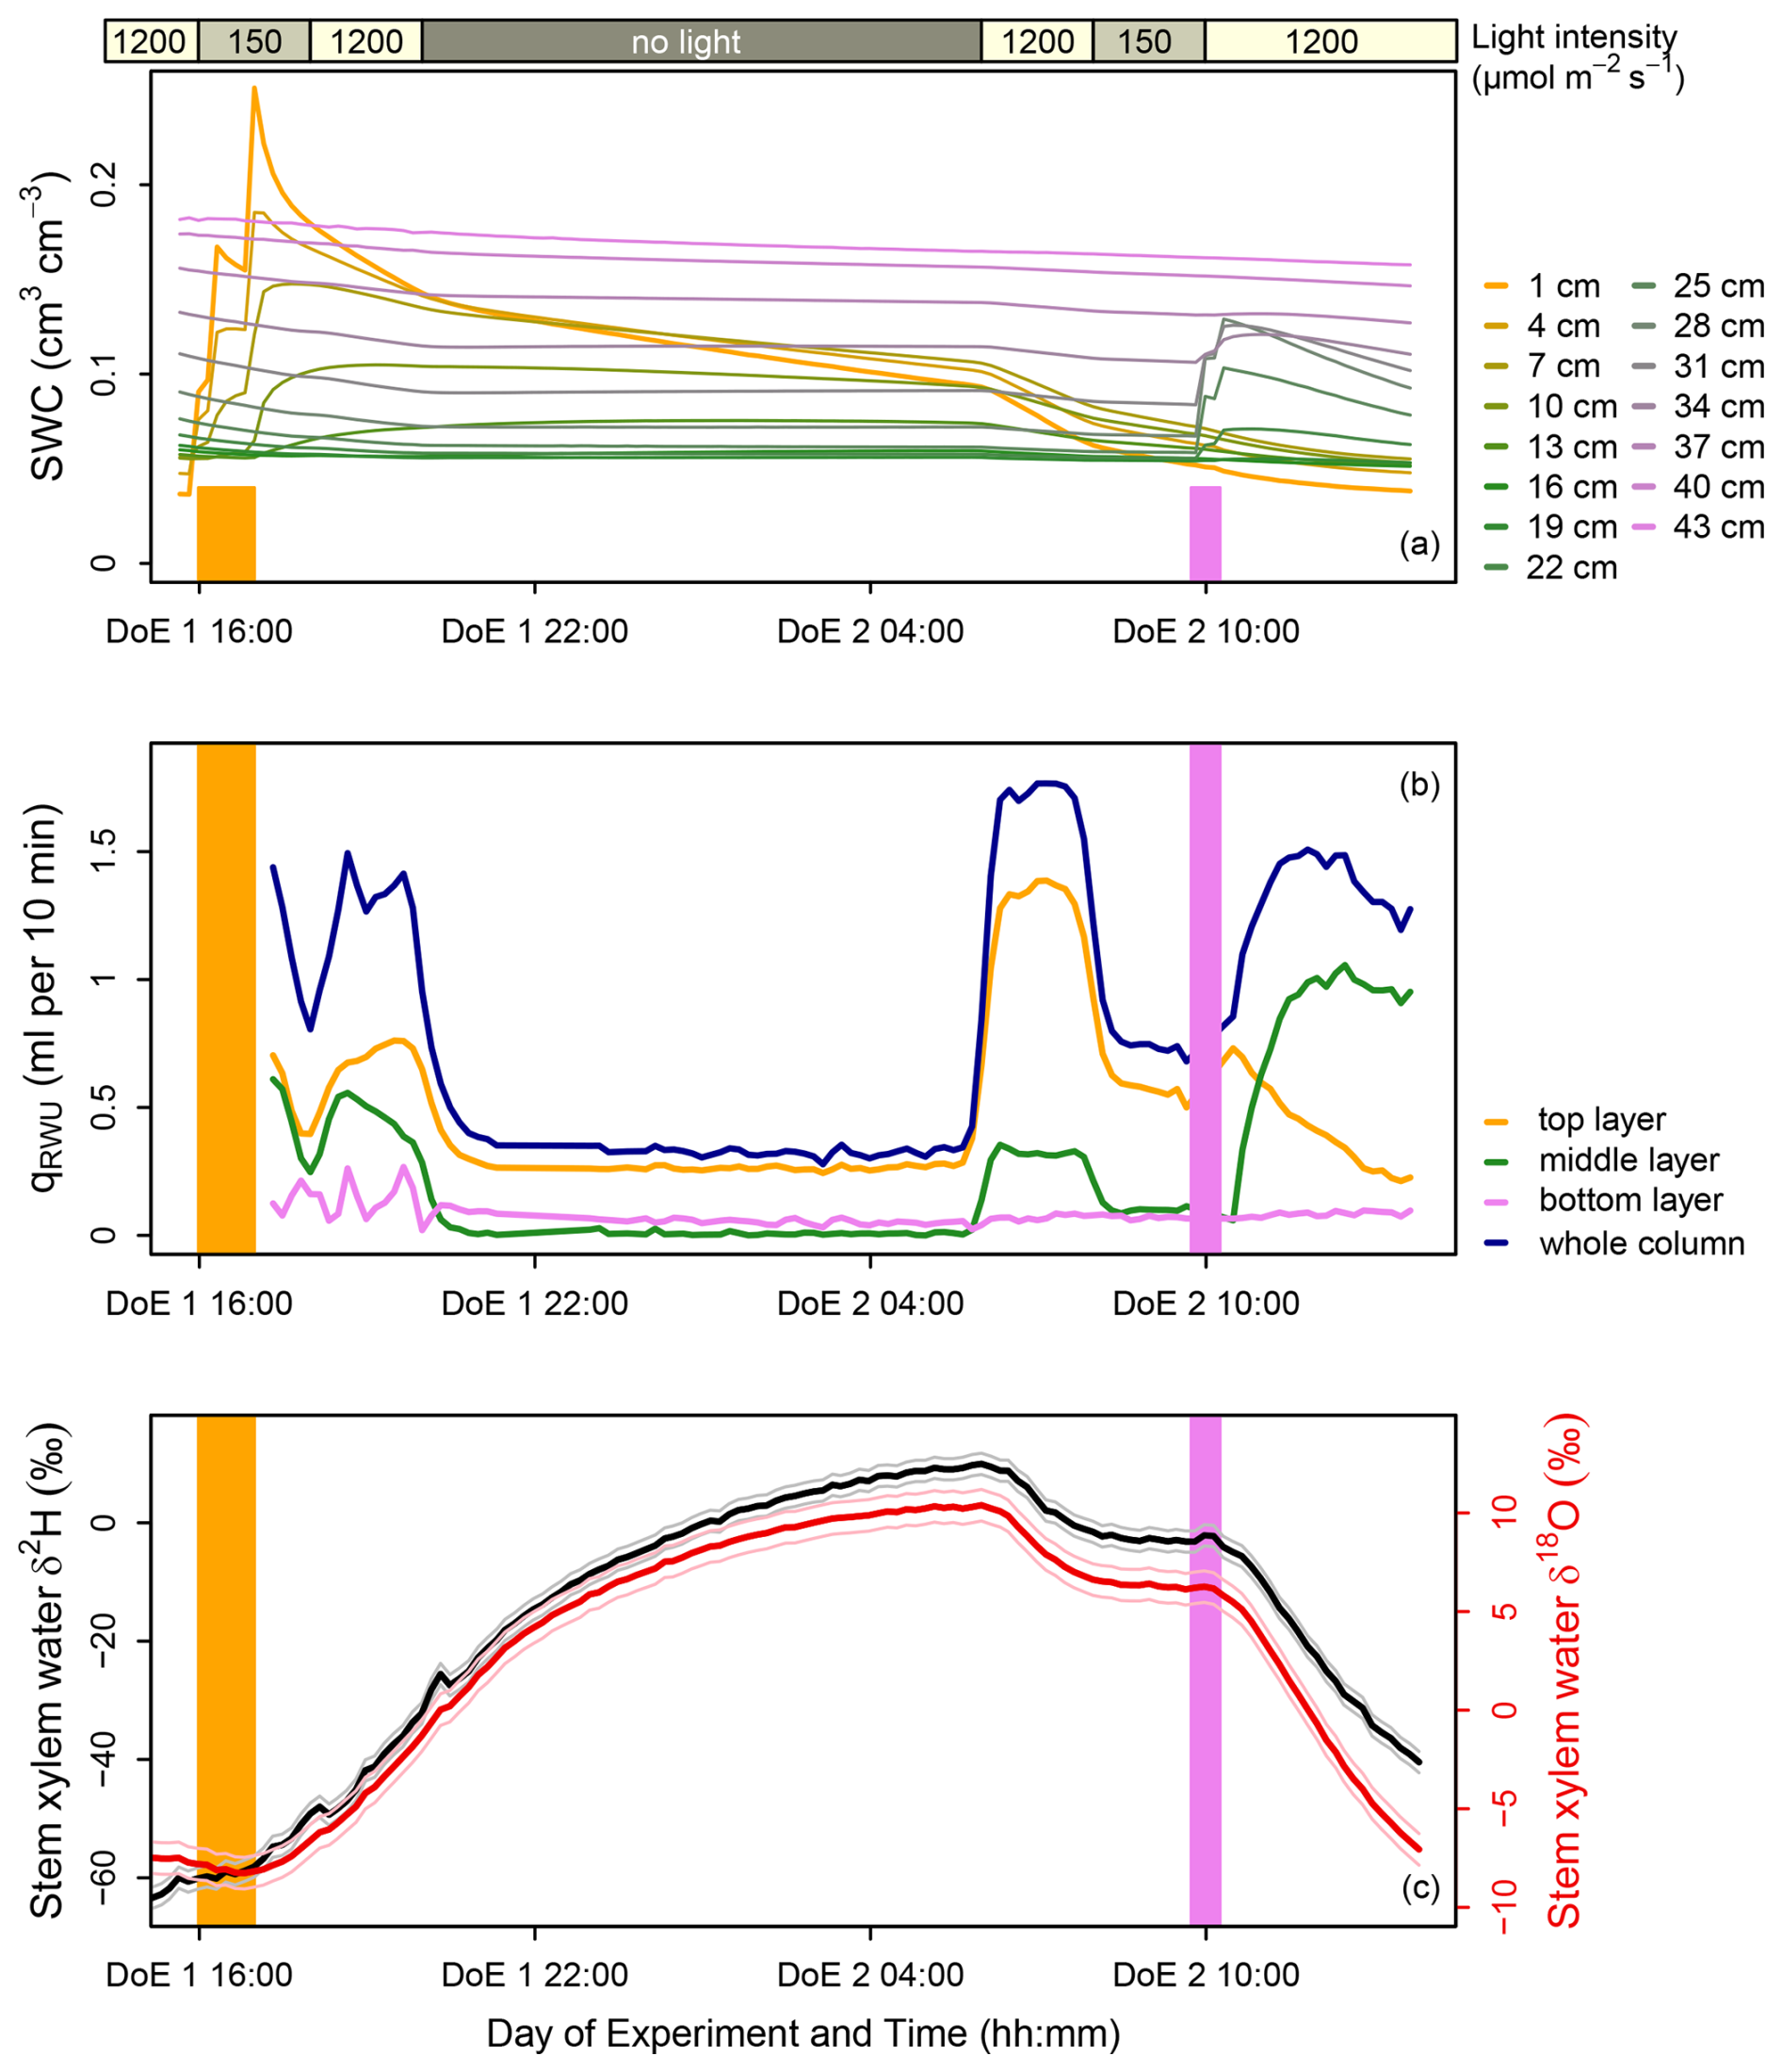
Figure 2Time courses of the soil volumetric water content (SWC, cm3 cm−3, panel a), the whole column and layer (top, middle, and bottom)-specific root water uptake (respectively QRWU and qRWU, mL water per 10 min, panel b), and of the hydrogen (black line) and oxygen (red line) calibrated isotopic compositions of stem xylem water (δxyl) (panel c) during the case study with sunflower plant #1. δxyl was obtained from δstem online measurements and by applying the calibration functions (Eqs. 6a and 6b, see Sect. 3.1). The error in the determination of δstem is indicated on the same plot panel by the grey and light red lines for 2H and 18O, respectively. Note that SWC was measured with the Soil Water Profiler at centimeter depth-resolution but local data value is shown every three centimeters for clarity in panel (a). The orange (violet) stripes indicate the time periods when isotopically enriched (depleted) water was added to the upper (middle) soil layers of the columns. The yellow, light grey, and dark grey boxes above the plot indicate the time periods of high light intensity (1200 µmol m−2 s−1), low light intensity (150 µmol m−2 s−1), and where there was no light inside the climate chamber.
Before the “night” (DoE 2, 20:00 to DoE 3, 06:00) of the second experiment, two labeling pulses were applied in the same order and to the same soil layers but in short succession (DoE 2 from 16:10–16:15 and from 16:35–16:45, see orange and violet stripes, Fig. 3). During the night itself, relatively more water was observed to be extracted from the middle layer in comparison to the first experiment with plant #1 ( increased from 0.05 to 0.55 mL/10 min, Fig. 3b) when SWC remained more or less constant, Fig. 3a). This was associated with a lower δxyl maximum value ( ‰ and δ18O=5.9 ‰) reached during the night (on DoE 3 at 03:30 and 02:00, respectively). When lights were switched on again after the night period on DoE 3 at 06:00, started to even exceed , which was followed by a slightly accelerated drop in δxyl. Similarly to the earlier experiment, δxyl of plant #2 started increasing in response of the pulse and at a slower rate after the lights were switched off.
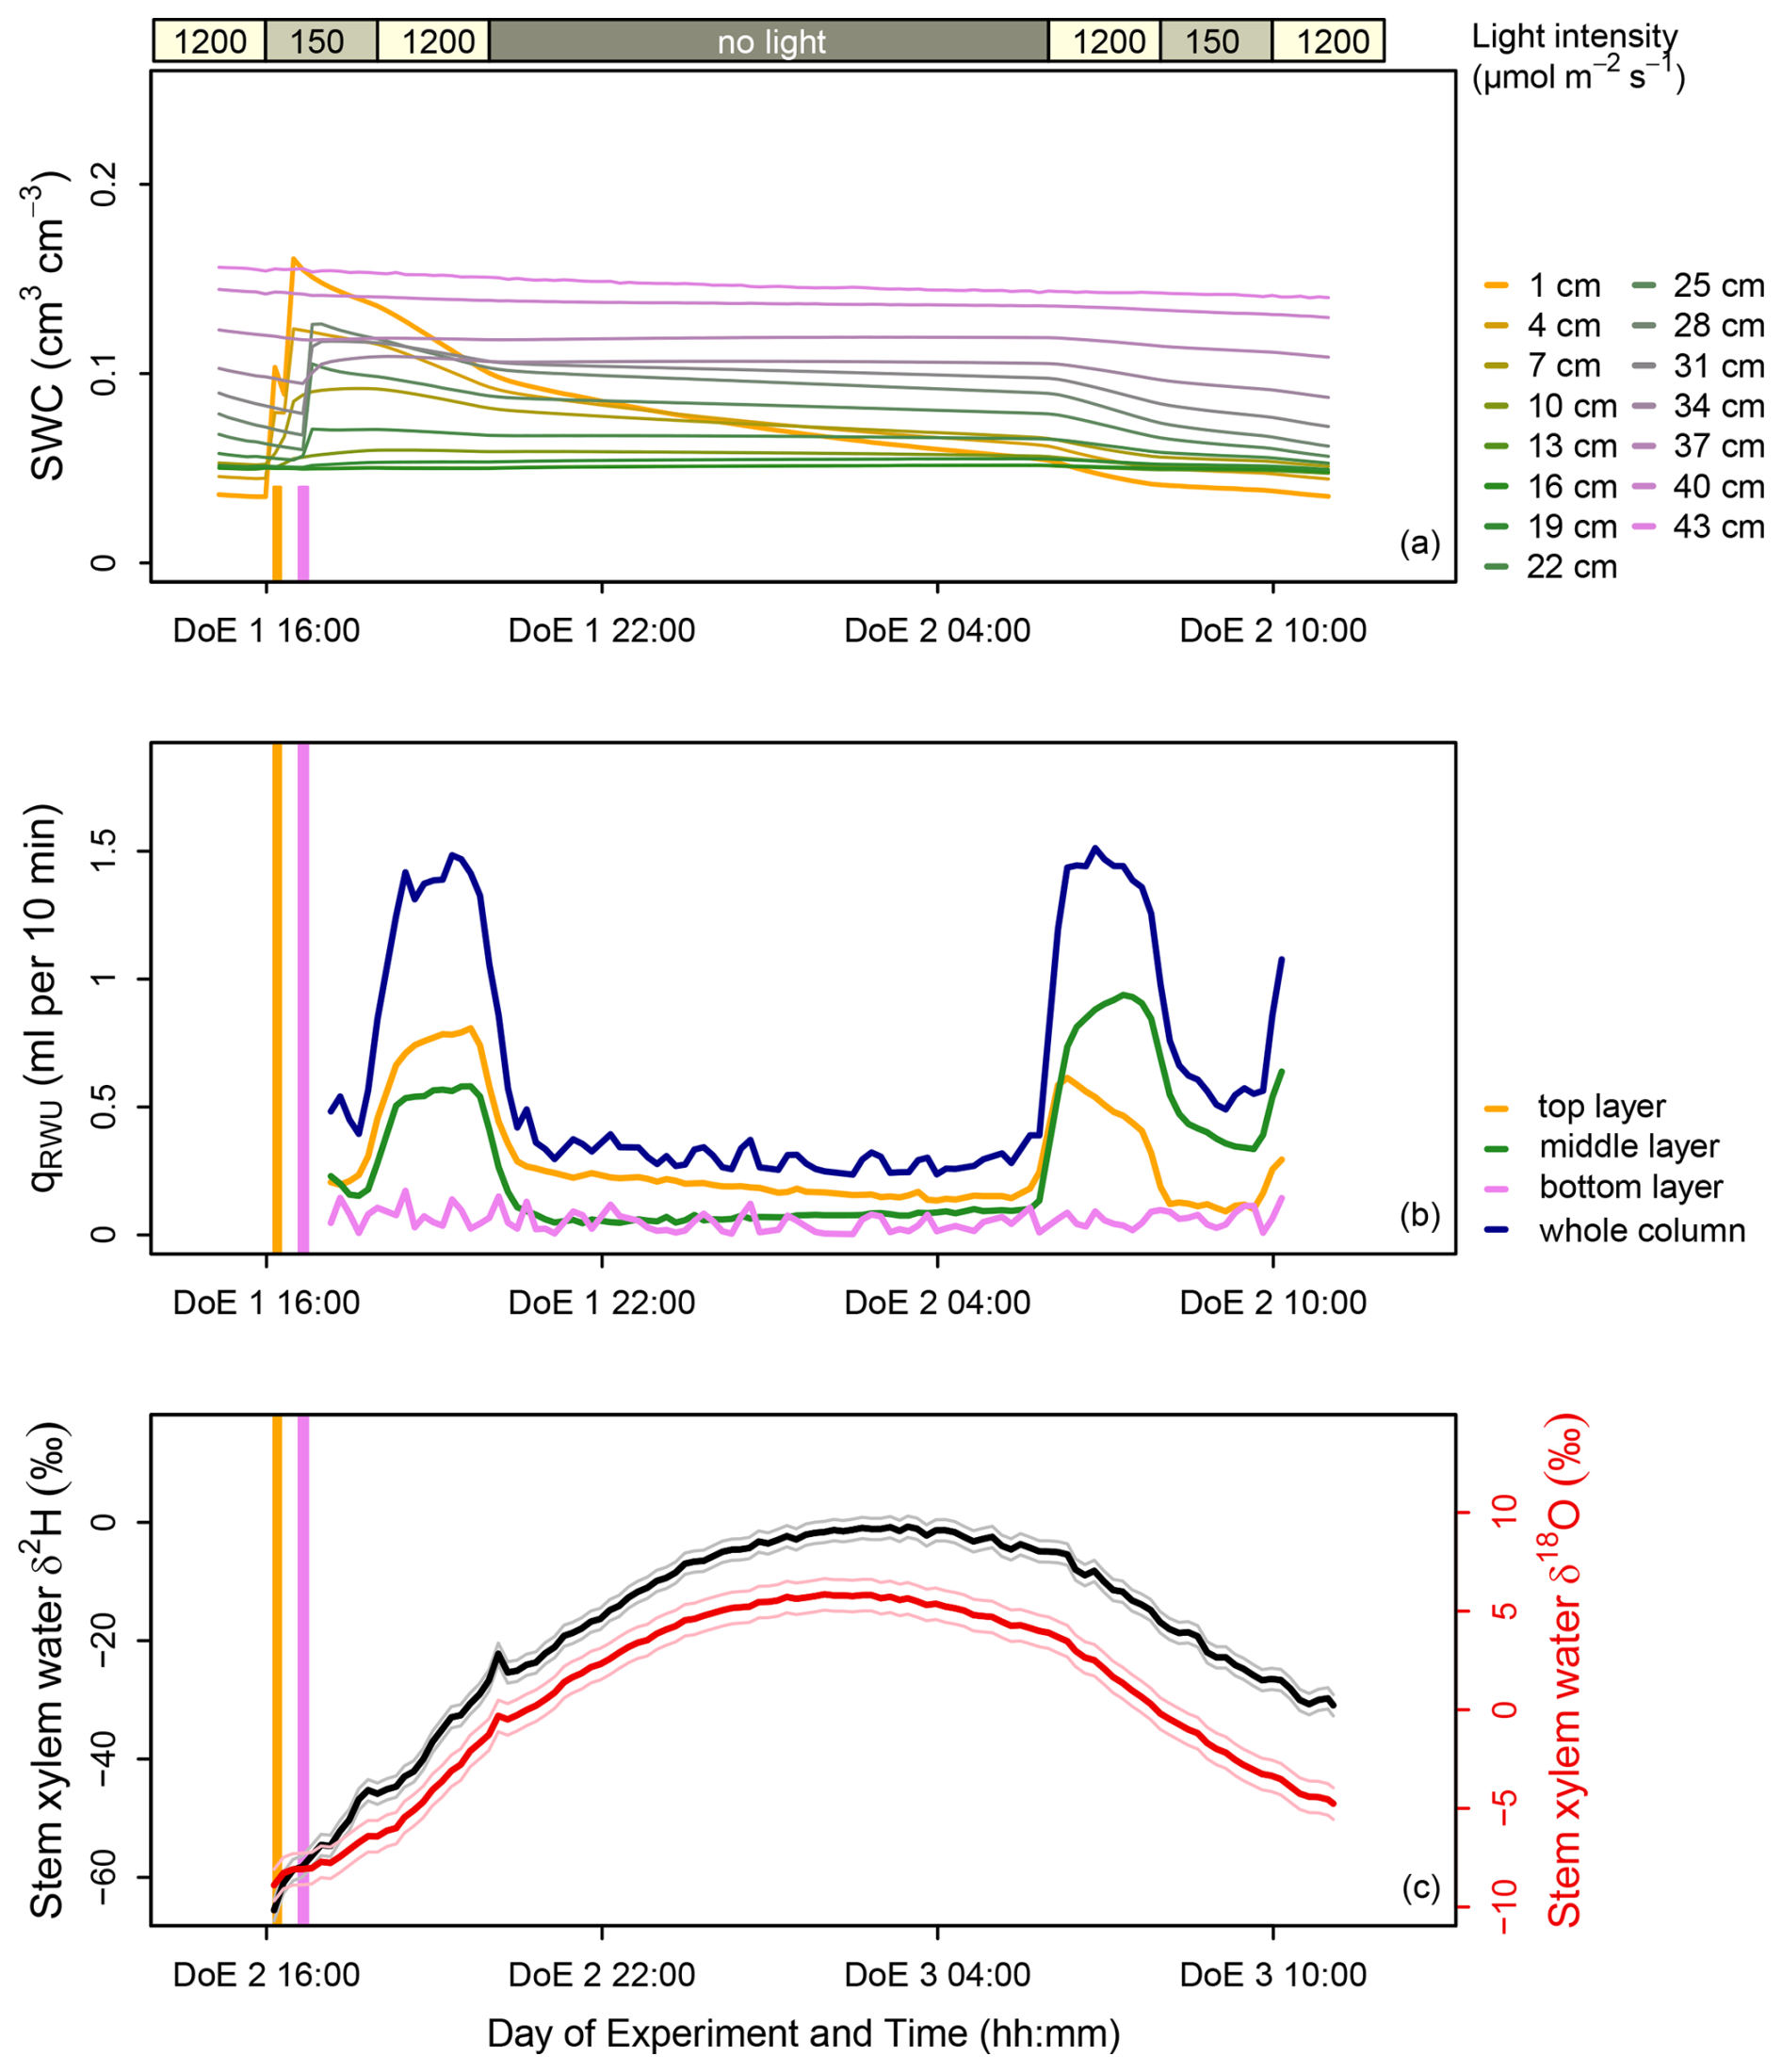
Figure 3Time courses of the soil volumetric water content (SWC, cm3 cm−3, panel a), the whole column and layer (top, middle, and bottom)-specific root water uptake (respectively QRWU and qRWU, mL water per 10 min, panel b), and of the hydrogen (black line) and oxygen (red line) calibrated isotopic compositions of stem xylem water (δxyl) (panel c) during the case study with sunflower plant #2. δxyl was obtained from δstem online measurements and by applying the calibration functions (Eqs. 6a and 6b, see Sect. 3.1). The error in the determination of δstem is indicated on the same plot panel by the grey and light red lines for 2H and 18O, respectively. Note that SWC was measured with the Soil Water Profiler at centimeter depth-resolution but local data value is shown every three centimeters for clarity in panel (a). The orange (violet) stripes indicate the time periods when isotopically enriched (depleted) water was added to the upper (middle) soil layers of the columns. The yellow, light grey, and dark grey boxes above the plot indicate the time periods of high light intensity (1200 µmol m−2 s−1), low light intensity (150 µmol m−2 s−1), and where there was no light inside the climate chamber.
The differences in the magnitude of the δxyl dynamics of plant #1 and plant #2 can be linked back to the temporality of the labeling pulses. The δxyl of plant #1 reached higher values during the night from DoE 1–2 than for plant #2 because labeling with depleted (deep) water occurred only in the morning of the DoE 2 whereas both enriched and depleted water pulses were applied at the beginning of the experiment for plant #2. Consequently, plant #1 had no access to a depleted water source while it was the case for plant #2, thus yielding lower δxyl values in the latter case. Furthermore, we can infer from isotopic data that plant #2 was preferentially extracting water from the upper, enriched layer, despite having access to the lower, depleted soil water. The succession of periods, with low light intensity – high light intensity – no light intensity, had generally a more visible effect on δ2H than on δ18O. In addition, while δxyl of plant #2 decreased monotonically until the end of the monitoring period (DoE 3 from 06:00 to 11:05) and did not seem to be affected strongly to changes in light intensity (DoE 3 06:00-08:00 versus 08:00–10:00), it was not the case for plant #1, for which the rate of decrease was (1) noticeably lower for periods of low light intensity (e.g., DoE 2, 08:00–10:00) than for periods of high light intensity (e.g., DoE 2, 10:00–16:00) and (2) higher after the labeling of the bottom of the soil (DoE 2 from 09:45–10:15).
Noticeably, night-time RWU and transpiration occurred for both plants because of a vapor pressure deficit greater than zero, and the relative contribution of the uppermost layer (0–16.5 cm) to total RWU was much higher for plant #1 (in average 80(±4) % from DoE 1, 20:00 to DoE 2, 06:00) than for plant #2 (in average 64(±10) % from DoE 2, 20:00 to DoE 3, 06:00) – despite having access to depleted water in the bottom of the soil profile. Total RWU was always higher during the periods of high light intensity than low light intensity (Figs. 2c and 3c), when excluding the periods of labeling from the analysis.
3.3 Comparison between calibrated observations and simulations of δxyl
Steady-state simulations and calibrated observations of the isotopic composition of xylem water (δxyl_calc and δxyl) showed similar trends for both investigated plants (i.e., an increase followed by a decrease), however with significant differences in the magnitude and time of the response to the labeling pulses (Fig. 4). This was, for instance, visible on DoE 2 at 06:00 when the lights were switched from 0 to 1000 µmol m−2 s−1. While the time needed for the δxyl in situ observations to reach another stable plateau of values was approximately two hours, there was an instantaneous step change in δxyl_calc.
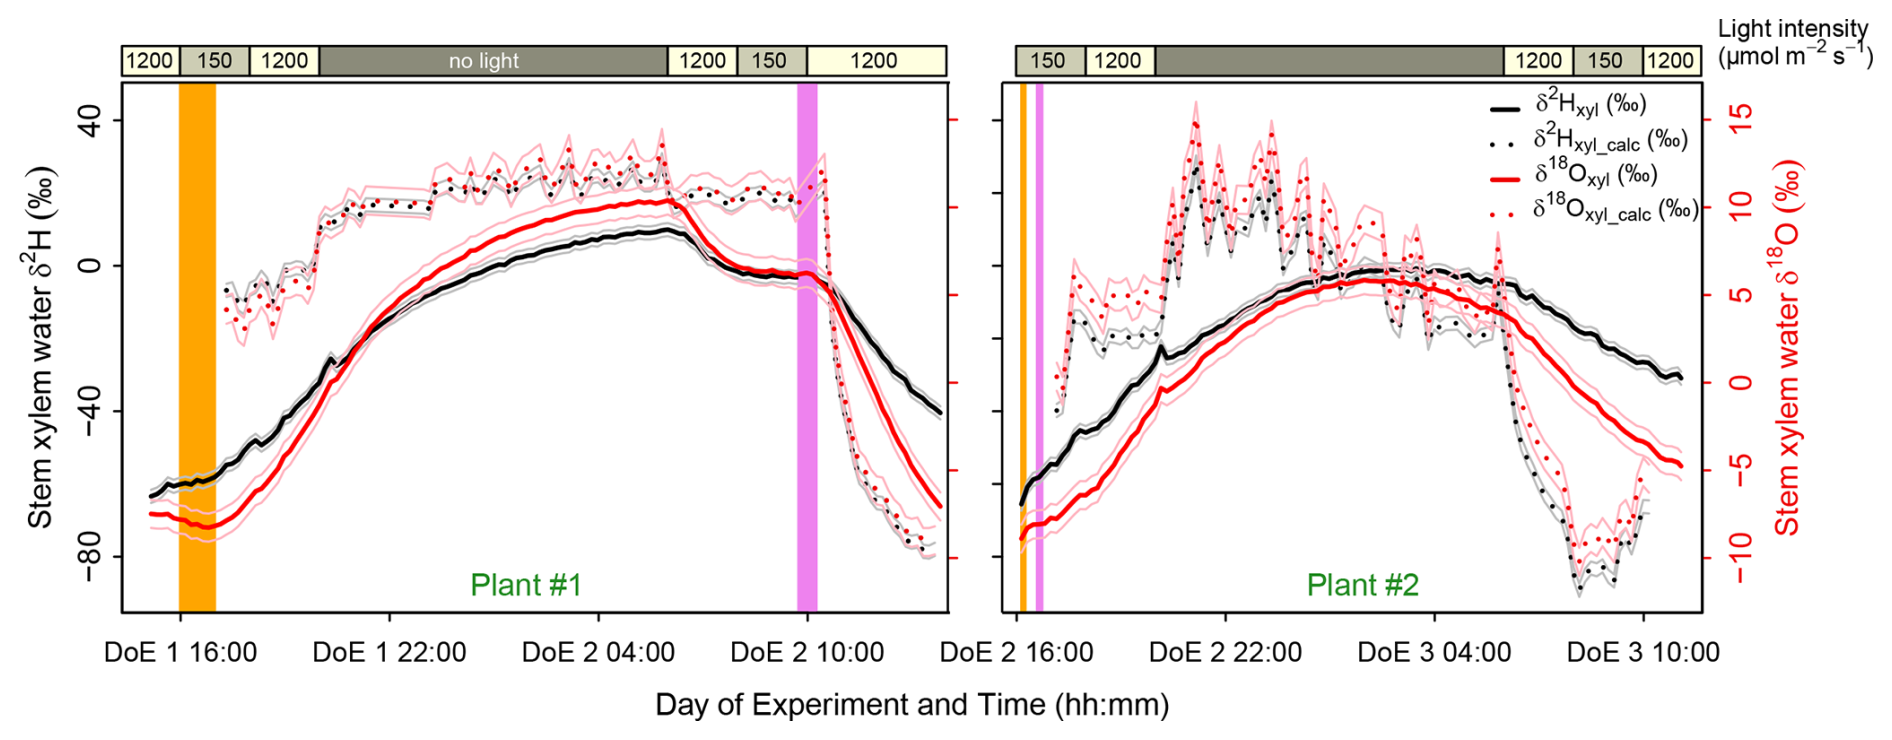
Figure 4Comparison between calibrated observations (solid lines) and simulations (dotted lines) of the hydrogen (black color) and oxygen (red) isotopic compositions of stem xylem water (δxyl) over the courses of the 1st experiment (sunflower plant #1, left hand side) and the 2nd experiment (plant #2, right hand side). δxyl was obtained from δstem measurements and by applying the calibration functions (Eqs. 6a and 6b). The error in the determination of δstem is indicated on the same plot panel by the grey and light red lines for 2H and 18O, respectively. δxyl_calc was obtained from root water uptake measurements with the Soil Water Profiler and from simulated soil water isotopic composition profiles using Eq. (1'). The orange (violet) vertical stripes indicate the time when isotopically enriched (depleted) water was added to the upper (middle) soil layers of the columns. The yellow, light grey, and dark grey boxes above the plot indicate the time periods of high light intensity, low light intensity, and where there was no light inside the climate chamber.
In addition, δxyl_calc of plant #2 showed greater short-term (< 0.5 h) variations than δxyl_calc of plant #1 during the “night” from DoE 2 to 3, while it was not the case for δxyl observations. Reasons for this are found in (i) a more homogeneous SWC profile for plant #2 during that night (Fig. 2c vs. Fig. 3c) and in (ii) a more heterogeneous simulated water isotopic composition profile in the soil column (δsoil_sim) of plant #2 (Appendix F, Tables F1 vs. F2). The latter was a consequence of the third labelling event (DoE 2, 16:10–16:45) where both upper and middle layers of soil were treated (in contrast to the first and second labeling events, where only one of the two layers was treated). During nighttime, the contribution of both the upper and middle soil layers to total RWU was constant for plant #1 but not for plant #2, where the contribution of the middle layer slowly increased as the middle layer was sufficiently wetter to sustain the increased contribution (Figs. 2c vs. Fig. 3c). This led to smaller measured differences in rRWU between the upper and middle layers of the soil. In other words, plant #2 could “easily” switch between the water sources contained in these two layers and these small changes in rRWU had a more important impact on plant #2-δxyl_calc than for plant #1-δxyl_calc because of marked differences in δsoil_sim in the former case.
4.1 On the difference between δstem and δxyl
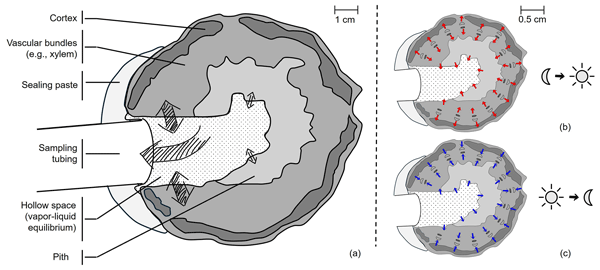
The calibration experiment highlighted that (i) δxyl (i.e, by hypothesis, the isotopic composition value in the water bath in which the plant was grown) and δstem were different but (ii) the difference was the same across the nine sampled plants, and (iii) the difference was dependent on the isotopic composition value of the water bath. Our understanding is that the water vapor collected from inside the stem is in equilibrium with water from the intercellular spaces (Sifton, 1945) and xylem sap water as well as with water contained in other, non-conducting tissues (i.e., the cortex and stem center – or pith, see Fig. 5). In this regard, our in situ monitoring approach resembles another destructive water vapor extraction method, namely the direct water vapor equilibrium technique (Wassenaar et al., 2008), but with a much smaller equilibration volume. Given the strong linear relationships, we believe that the contributing proportions of the non-conducting water pools to the collected stem water vapor were small. However, a definite conclusion was not possible as it would require the determination of isotopic compositions of the individual water “pools” (e.g., xylem, phloem water, parenchyma, etc.).
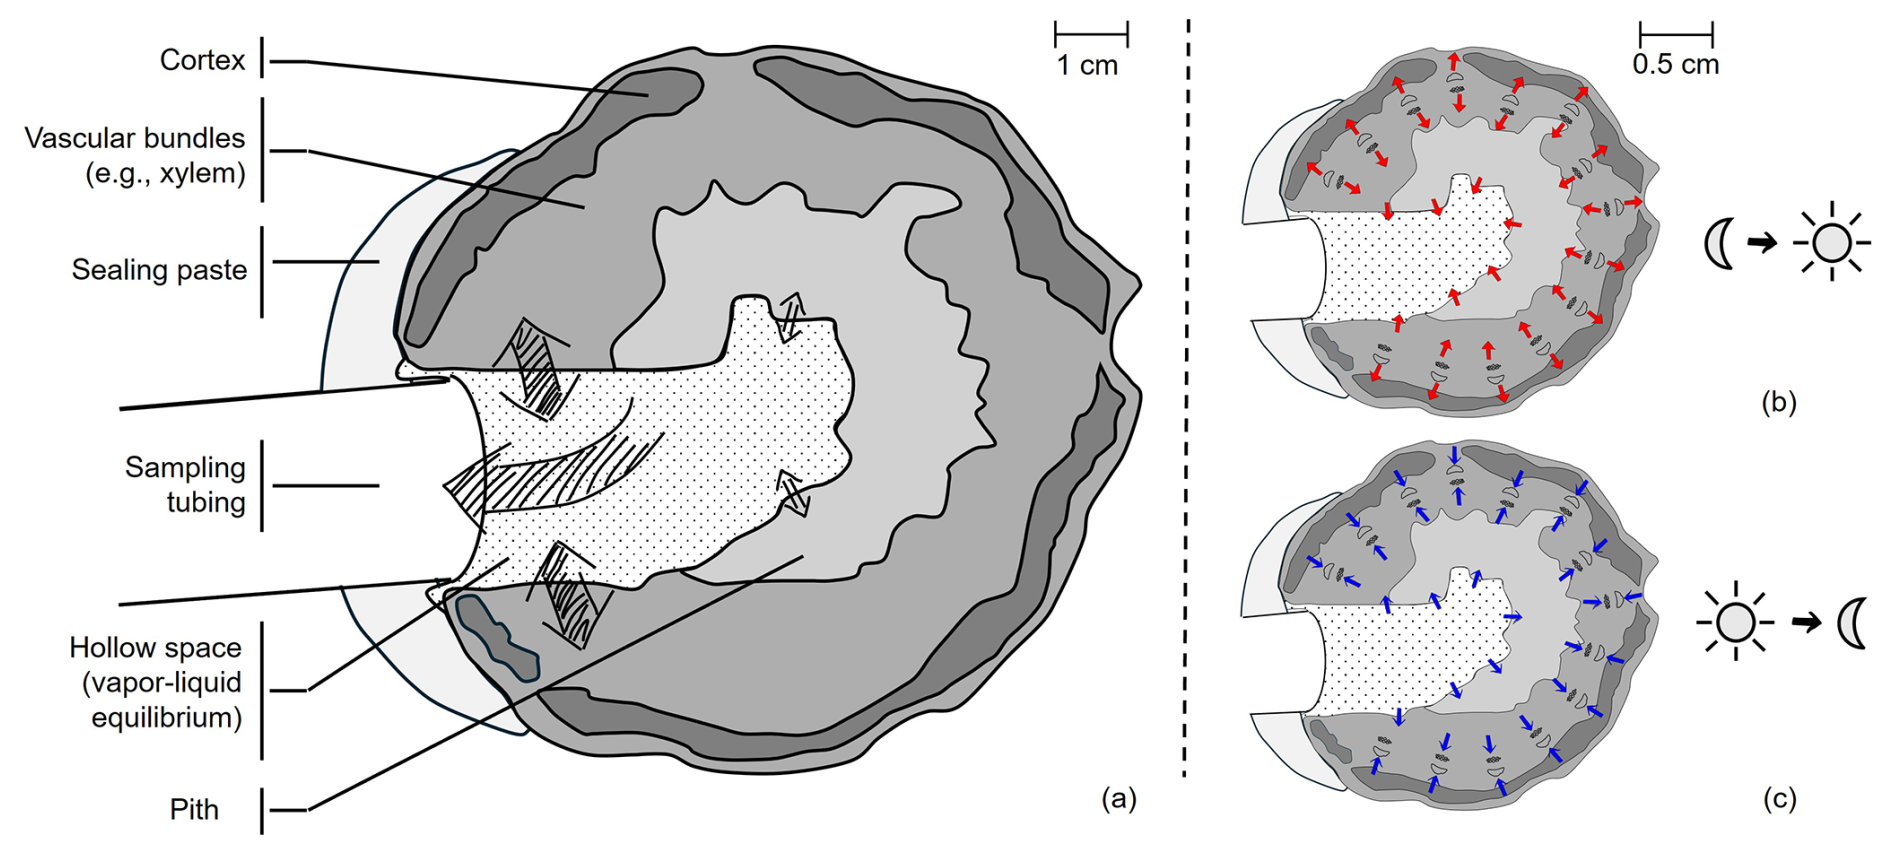
Figure 5Conceptual drawing of one sunflower plant stem section based on one of the magnetic resonance imaging pictures of plant #1 made after the experiment (panel a; see also Appendix G, Fig. G1). The hollow space resulting from the drilling and the installation of the sampling tubing is thought to contain water vapor equilibrated with different (liquid) water bodies contained in different stem tissues, but mainly from the vascular bundles (e.g., xylem vessel). In panels (b) and (c), situations are depicted where lights are switched from low to high intensity and from high to low intensity, respectively. In the first case (b), the opening of the stomata induces an increase in transpiration, which is initially only partly counterbalanced by an increase in root water uptake. Water is mobilized from other non-conducting tissues located in the pith and the cortex and contributes to stem water flow. In the second case (c), the closing of the stomata induces a decrease in transpiration, which is initially only partly counterbalanced by a decrease in root water uptake. Water is redistributed from the vascular bundles (e.g., xylem) back to the pith and to the cortex regions.
A reason for the deviation from the δxyl=δstem case may be found elsewhere, for instance, in possible contamination of the stem water vapor with co-sampled volatile organic compounds and spectral interference in the laser spectrometer measuring cell (Ceperley et al., 2024; Zhao et al., 2011; West et al., 2006), although a dependency of contamination to the isotopic composition value has not been observed to our knowledge. In addition, Millar et al. (2018) pointed out that the direct water vapor equilibrium technique was the least affected by organic contamination. The possibility of isotopic fractionation during root water uptake or gas diffusion from the intercellular spaces into the hollow space, or else through the epidermis via evaporation (e.g., de la Casa et al., 2022) – despite the presence of the sealing paste – may be ruled out because, as stated above, the δxyl – δstem deviation was not constant across the tested isotopic composition range (whereas isotopic fractionation should be isotopic composition-independent). Finally, it could be proved (i.e., by flushing dry synthetic air in the direct vicinity of the connection and observing no effect on the water vapor mixing ratio readings of the laser spectrometer) that contamination of the sampled stem water vapor with climate chamber air was prevented by sealing the tubing-stem connection. However, the stem remains quite porous (see MRI pictures in Appendix G, Fig. 1) so air should infiltrate into the stem, potentially upstream of the sampling location.
To be complete, calibration should be performed at other key growth stages and memory effects should be specifically investigated. The calibration functions should be redetermined from inflorescence emergence (BBCH 50–59) to fruit development (BBCH 70–79), that is, as soon as the stem can hold the sampling tubing. In addition, further experiments should include different isotopic trajectories of the stem water, i.e., with different initial conditions (hydroponic solution water isotopic composition) for the same end conditions (water bath isotopic composition) to investigate possible memory effects. Calibration could also include the destructive sampling (and further laboratory extraction with, e.g., the cryogenic vacuum distillation technique, Orlowski et al., 2018) of the sunflower stem at the sampling point (where the PTFE tubing is connected to the plant) once the in situ measurement is complete and the collected water vapor plant has reached equilibrium. Finally, we are confident that the calibration functions are specific to the plant species, rather than being influenced by the environment in which the plant is grown. Therefore, the obtained calibration functions should be transferable to soil-grown plants. Nevertheless, the calibration experiment could be extended to include sunflowers grown in soil columns for verification and validation.
4.2 On the difference between calibrated observations and steady-state simulations of δxyl
First, the computation of δxyl_calc required that the rRWU data determined with the SWaP and used in Eq. (1') was affected by small errors. Further, Eq. (1') (and therefore Eq. 1) is built on simplifying assumptions: it implies that (1) the plant extracts from the isotopically labeled water and the soil antecedent water indifferently, (2) the water extracted across the soil profile instantly and completely mixes inside the root system and the stem so that there is no delay between the time water is extracted and when it reaches the stem xylem at the position of the tubing, in other words, the role of the plant capacitance is overlooked, (3) there is no isotopic fractionation during root water uptake or during transport inside the xylem vessels.
Our calculations show faster changes in δxyl_calc than what was determined from measurements after calibration (δxyl), however with observed values near to equilibrium (i.e., at the end of the “night” periods in both experiments) rather close to our calculations. Main differences were found in response times between the theoretical case of a plant without an internal water volume and the practical case, where water mixes with a delay inside the root and stem. As depicted in Fig. 5b and c, assumption (2) above would explain short-term δxyl_calc−δxyl deviations following changes in light intensity. For example, when lights are switched from low to high intensity, the almost instantaneous increase in leaf transpiration due to stomata opening is not counterbalanced by an increase in RWU right away, which leads mechanically to an extraction of water from the stem (i.e., dehydration of the stem) starting with the water closest to the xylem, which probably holds the highest concentration of isotopically labelled water. This can be deduced from the observation that the xylem water isotopic composition has not reached its maximum yet at the end of the night (e.g., plant #1). Therefore, the change in relative contributions of root water and stem water to transpiration flow is associated with a change in isotopic composition, especially in the context of labeling. Finally, δxyl_calc is also sensitive to the initial conditions in soil water isotopic composition prior the first labeling (DoE 1 at 16:00, see Appendix F), δini, which was not measured but simulated as well. As destructive sampling was not a viable option due to the limited size of the columns, a possible alternative would be to monitor δsoil in situ using the methods of Rothfuss et al. (2013) or Volkmann and Weiler (2014), albeit at the cost of a substantial modification of our setup.
4.3 Role of plant capacitance in RWU
Drilling the hole in the stem damages xylem vessels and disrupts xylem water flow in affected vessels. Our method cannot directly track the isotopic composition of xylem water (δxyl), rather that of stem water (δstem), in our case mostly pith water (Fig. 5a). Our results show that δstem changed over time, which can only mean that xylem water from undamaged vessels was in exchange with pith water. This implies that stem water capacitance delays the signal observed with our method. This observation is furthermore in line with our SWaP results where we can observe that uptake patterns shift rapidly upon the addition of the labeling pulses, whereas changes in δstem are significantly slower.
The reduction of RWU in the middle layers upon labelling of the top layer in the first experiment implies that the added water gets in contact with roots rapidly as otherwise no reduction in RWU in the lower layer is possible (see green line in Fig. 2b). Even though we cannot instantaneously quantify RWU from layers where water is added, as it takes some time before the added water reaches the sample tubing height from the pulse location, this observation of reduced uptake elsewhere is positive proof that the pulse has arrived at roots, and we may expect δxyl and therefore δstem to rise afterwards. At the tubing position in the stem, the rise of the water isotopic composition is not as rapid as the change that we would observe in the roots. It should also be noted here that 2H can exchange with solid phase protons, especially those of the C-OH groups abundant in carbohydrates. This may cause a slower change in stem water δ2H than δ18O.
Based on the SWaP data we know how much water passed through the stem per hour ( mL h−1). Further, the volume of the stem from which we sampled the water vapor can be roughly estimated from its diameter (∼ 2 mL). If fex=1 is set in the simple replacement model (Eq. 5), that is, all water flowing in the xylem is isotopically exchanging with water from the (non-conducting) stem tissues, stem water would reach a constant δstem in roughly 2 h. On the other hand, if , it would take 10 h for stem water to be replaced nearly fully with the xylem water, which would be roughly in line with our observation for plant #1. As it takes time for water to diffuse in the soil and later from the xylem to the sampling point during which it can exchange with the surrounding tissue, fex gives us an estimated minimal exchange fraction of xylem flow rate of about a sixth of RWU, which clearly is non-negligible. Ignoring the first step above results in an overestimation of fex as the inflow of isotopologues takes time to rise in the xylem of the roots. Ignoring the second step, i.e., the diffusion into the stem and later into the sampled air space, also takes time, but would result in an underestimation of fex. Even though at the current stage quantification of local stem capacitance was not possible, this combination of methods should in principle allow calculating the capacitance of stems of herbaceous plants that may provide valuable new information that is not easily accessible with other methods (water potential measurements in combination with relative water content measurements, Bartlett, 2012). Furthermore, the combination provides valuable insights into the dynamics of both RWU and its relation to exchange in plant stem water content. When so much of the xylem water exchanges continuously with the stem, the stem itself can be expected to be a quickly accessible reservoir of water for transpiration, very similar to what is found in trees (Preisler et al., 2022) and may very well be non-negligible during drought.
Our data shows that the isotopic composition of water in aboveground tissues should not be approached as if there is a static distribution of belowground water reservoirs, but more like a dynamic relative water availability profile that depends on the climatic demand. That is, light changes cause a change in the RWU profile especially when soil dries out (van Dusschoten et al., 2020; Müllers et al., 2023), which has a dynamic effect on the stem water isotopic composition. When the reservoir of the stem is quite large relative to the xylem flow rate, changes in the stem isotopic composition will be expected to be very low, and it is important that this factor is considered when performing in-field studies, especially for larger woody species, as was pointed out by, e.g., Fabiani et al. (2022) and Barbeta et al. (2021).
4.4 Sensitivity to, impacts of, and long-term applicability of the in situ monitoring method
The installation of the tubing inside the stem always worked and yielded an isotope response. The method showed to be sensitive to the insertion depth of the PTFE sampling tubing inside the stem and to the installation height above the soil surface. To work, the tubing had to be inserted (i) only a couple of millimeters inside the stem and (ii) close to the root crown. Not doing so resulted in invalid data during the experiments, e.g., the WVMR was either too low or too high – the latter pointing to the presence of liquid water inside the sample tubing because of a direct contact with the wet (pith) tissue.
While the impact of the drilling on the different stem tissues was visible according to the magnetic resonance imaging (MRI) stereomicroscopic section pictures of plants #1 and #2 (see possible drying patterns, Appendix G, Fig. F1), no plant showed visible signs of stress during both the calibration experiment and the case study. Other independent pre-tests (not described here) indicated that monitoring could be practically done for 96 h continuously. A long-term application is yet to be conducted to test possible restrictions of the method linked to the health of the plant, aging of the hole, or to plant defense mechanisms leading to the sealing of the hole. Note that the monitoring method was tested with a diameter tubing with the objectives of (i) minimizing the effects of the invasive installation and (ii) allowing monitoring at earlier growth stages (i.e., when the stem diameter is too small for a diameter tubing). The tests were, however, not conclusive: the WVMR did not stabilize, and condensation occurred systematically inside the tubing.
In this work, we provided a proof of concept and a first application of a simple method to monitor the isotopic composition of xylem sap water in a non-woody plant species under controlled conditions. Our method proved to be efficiently calibratable (R2=99.9 %) and statistically reproducible in an initial hydroponics experiment. The case study showed that the method also provided consistent results, both from a theoretical standpoint and by comparison with another, independent non-destructive observation technique, the Soil Water Profiler. The combination of these methods also provided valuable insights into the role of the stem capacitance in the RWU process, that is, the relation between the extracted water and stem water. With some further improvements in methodology and data analysis, the combined approach should help improve our understanding of stand-alone isotopic studies for determination of plant water use that are typically based on destructive sampling.
The method should open avenues in the study of the role of plant capacitance on RWU, and generally in the study of residence and transit time of water in plants (e.g., like it is usually done on basis of water stable isotopic data for watersheds; Benettin et al., 2022), notably through the comparison between the isotopic composition of xylem water to that of transpiration (measured from gas-exchange chamber). We encourage the community to consider such an approach for other plant species and under various environmental (e.g., field) conditions (albeit after careful specific calibration, e.g., in hydroponic solution) as it can be applied quite easily, that is, without the need for specific materials or equipment other than the laser spectrometer and a power source.
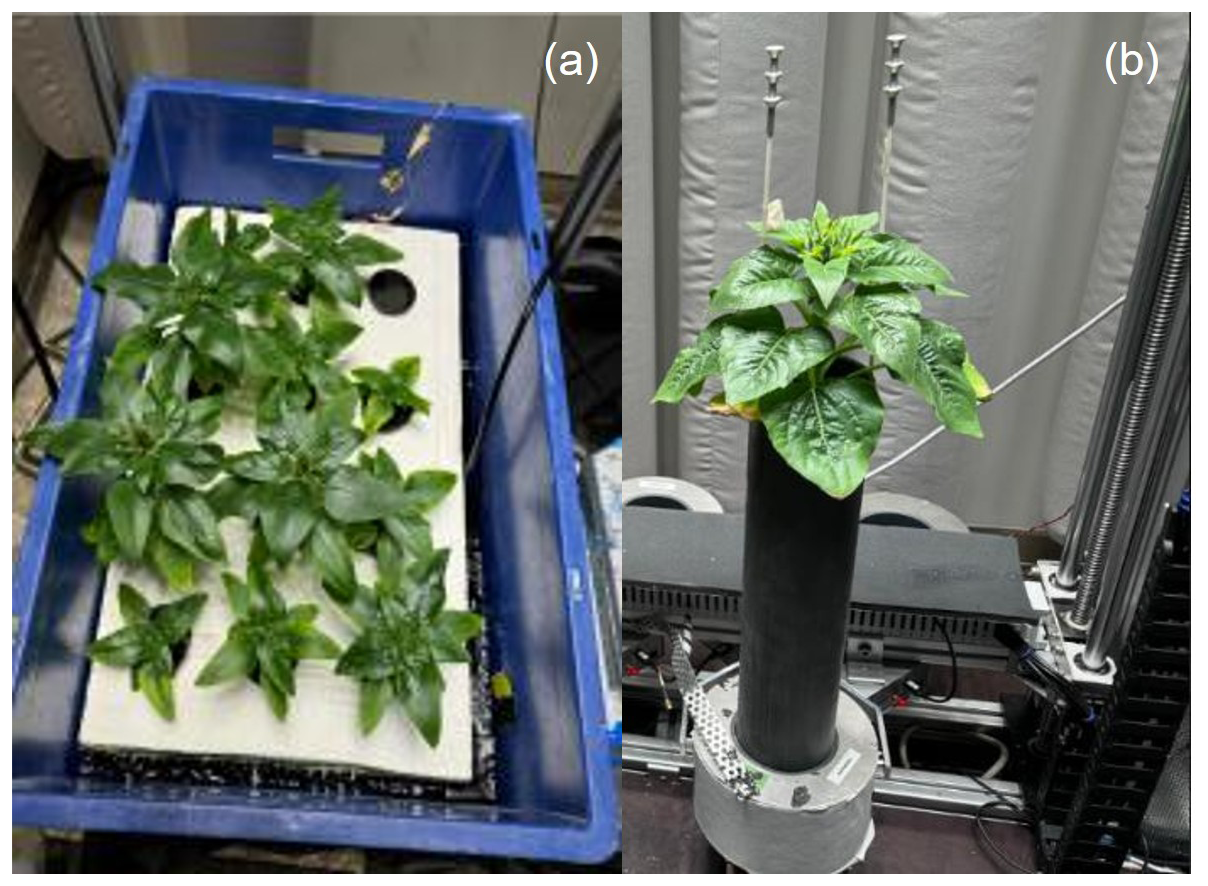
Figure A1(a) Picture of the hydroponics setup for growing the sunflower plants to be used for the calibration experiment. (b) Picture of Plant #1 in its column about a week before the case study was conducted.
RWU (expressed in mL water per time) at time t is the sum of three terms (RWUj, ), i.e., the root water uptake from three a posteriori defined soil layers spreading respectively from 0–16.5 cm (top layer, encompassing the isotopically enriched water pulse), 16.5–36.5 cm (middle layer, encompassing the depleted water pulse), and 36.5–45 cm (bottom layer, where no labeled water was observed to enter):
RWUj(t) is calculated as the sum of the product between the soil slice volume (V, in cm3 soil) and the difference in soil water content (SWC, cm3 water cm−3 soil) measured in that particular slice between time t (dark blue curve in Fig. B1) and time t+dt (light blue curve, Fig. B1) across slices i ():
Note that cm3
RWU therefore equals the integral (represented as the blue-shaded area, Fig. B1) between the two SWC profile curves.
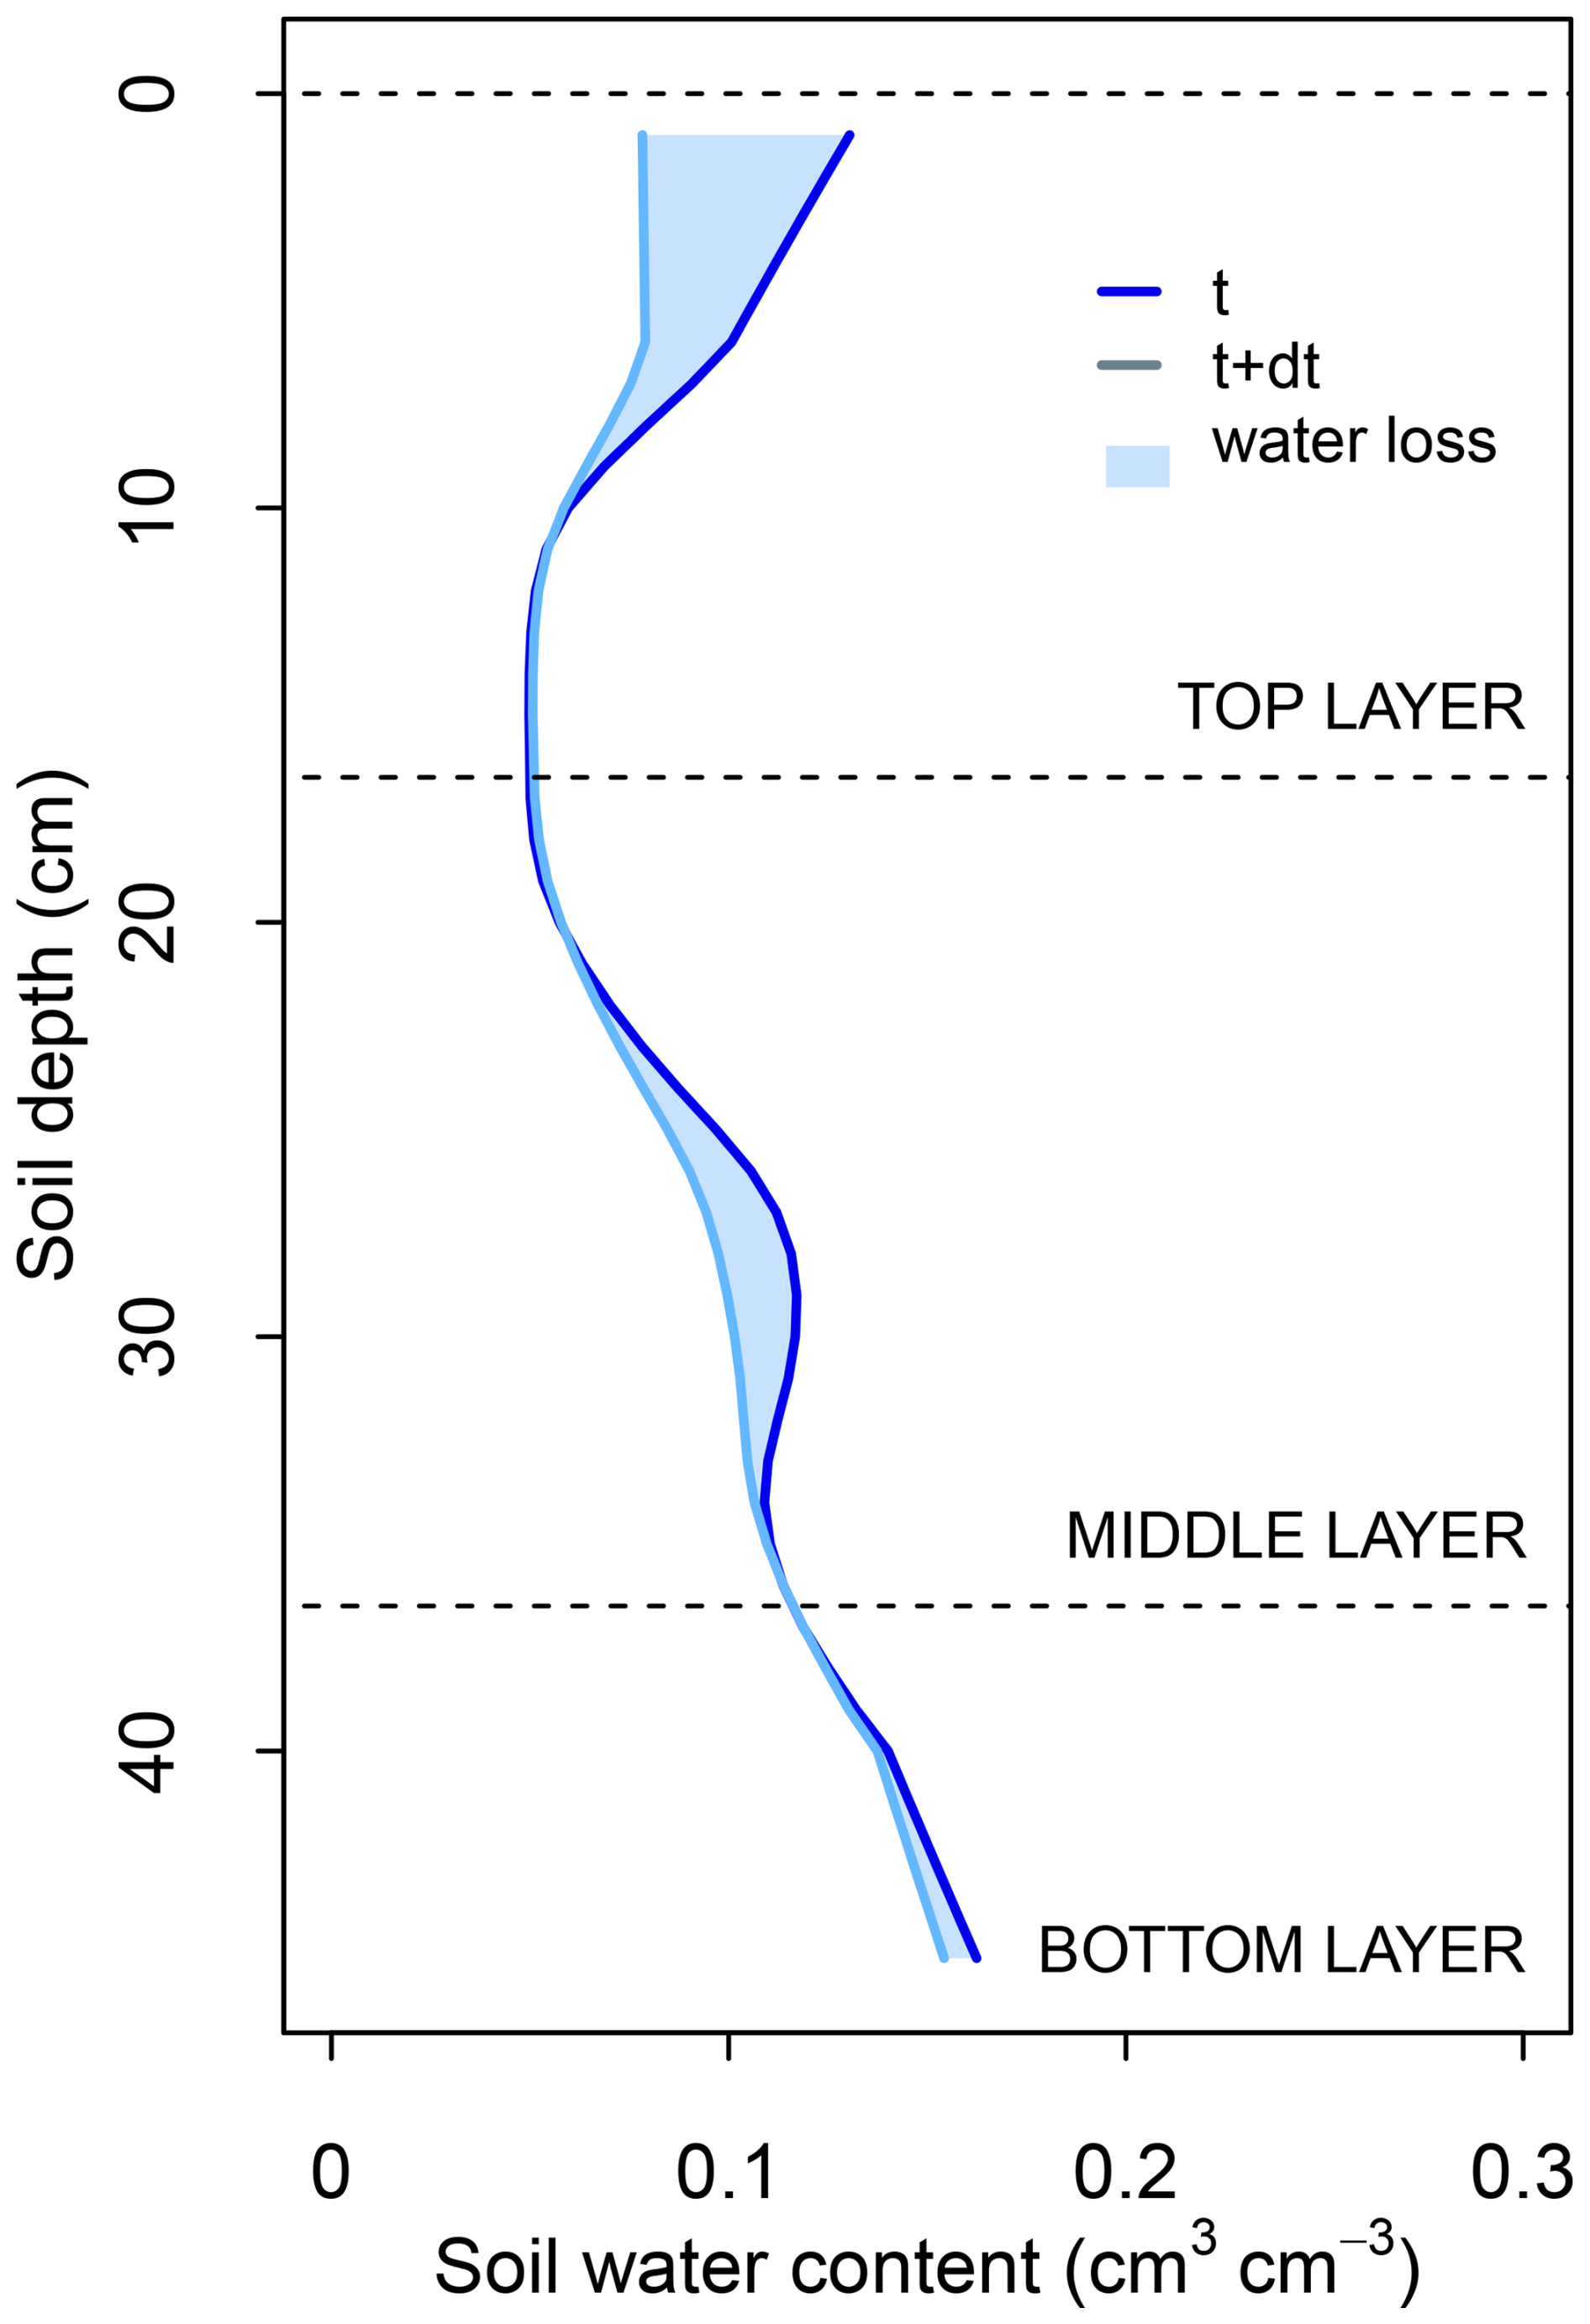
Figure B1Graphical illustration of the method for determining the plant total root water uptake (RWU, expressed in mL water per time) between time t and (t+dt) on basis of the data collected by the Soil Water Profiler.
Water ascending and flowing at rate QRWU (mL min−1) in the xylem vessels (symbolized by the blue capillary in Fig. C1) exchanges with a given fraction of water (fex, –) contained in the stem (of volume Vstem mL, colored in brown, Fig. C1).
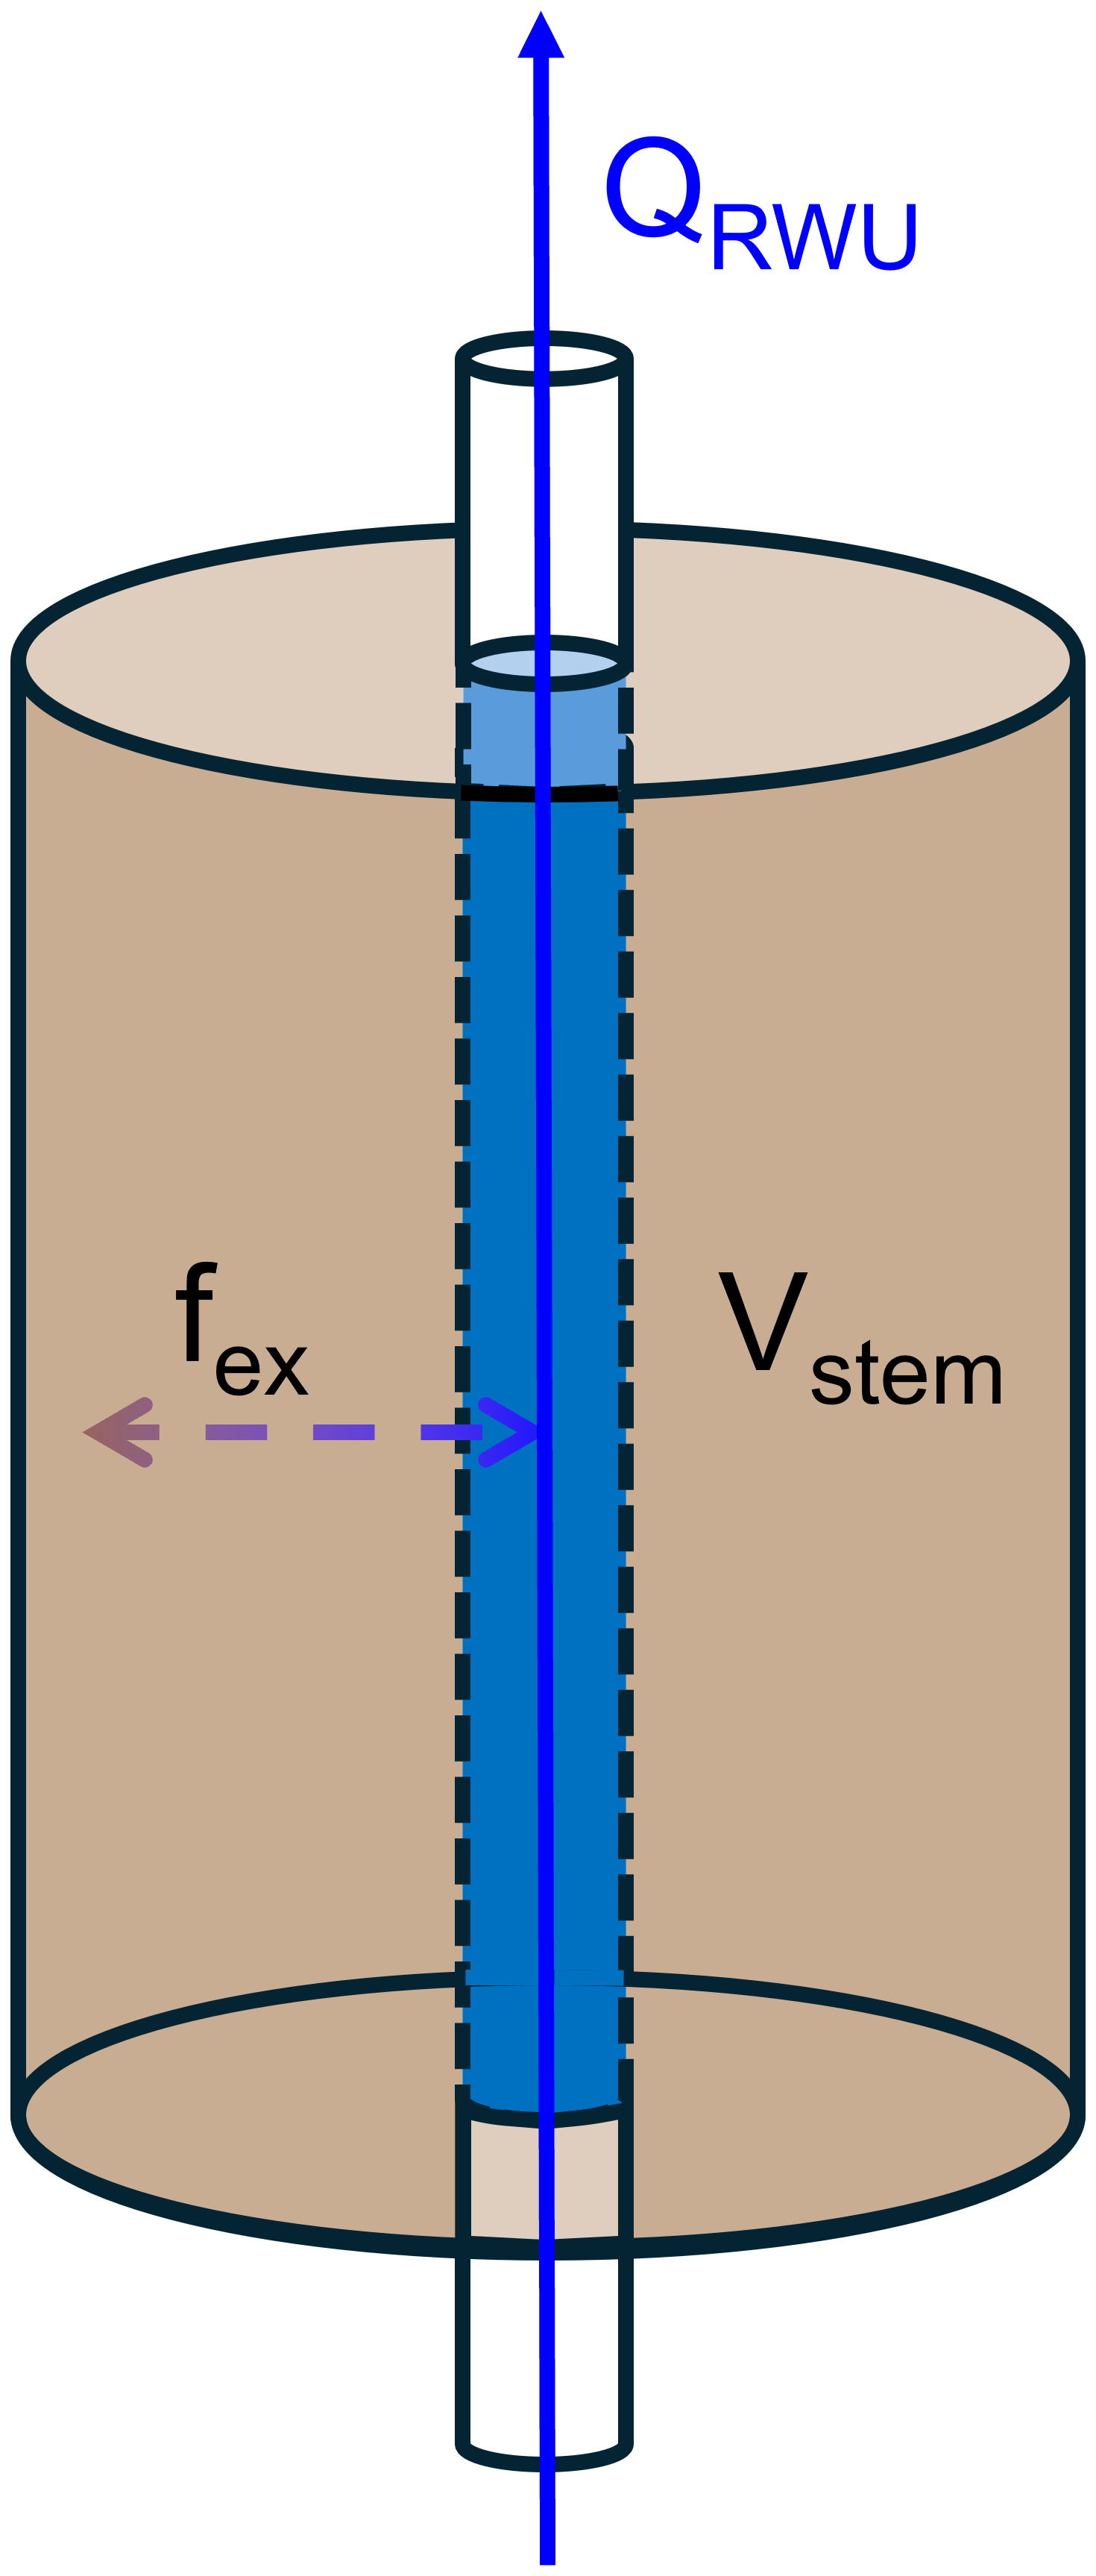
Table D1Mixing ratio (WVMR) and isotopic composition () values of the stem water vapor measured during the course of the calibration experiment, in which sunflower plants were grown in three different hydroponic solution water baths (designated as isotopically “depleted” water – b1, local tap water – b2, and “enriched” water – b3) at 20 °C water temperature. The corresponding stem (liquid) water isotopic composition values, (δ2Hstem and δ18Ostem) are reported as well. The 2H- and 18O-specific calibration functions were obtained by comparing the isotopic composition values in the water baths (i.e., δb1, δb2, and δb3) against the stem liquid water isotopic composition values averaged across the plants in each bath.
The response time, defined here as the difference between the time of perturbation (water addition via isotopic labeling or modification of light intensity) and the time of beginning of change of δ2H or δ18O was estimated between 20 and 30 seconds.
We note a fast decrease as well in water vapor mixing ratio (WVMR, ppmV, blue curve) after each consecutive labeling pulse (i.e., from 16–20 and 37–38 min for the depleted and enriched labeling pulses, respectively) followed by a slower increase (20–37 and 38–48 min, respectively). As per our hypothesis (see Sects. 2.3 and 3.1), the collected stem air is water vapor-saturated, i.e., its WVMR is a (positive) function of temperature. Therefore, the observed dynamics in wvmr should be understood as due to a partial replacement of antecedent (∼ 20 °C) stem water with added and colder (∼ 10 °C) labeled water reaching the stem via root water uptake (RWU). As the temperature of the soil water (antecedent water + added water) increases again with time, so is its WVMR.
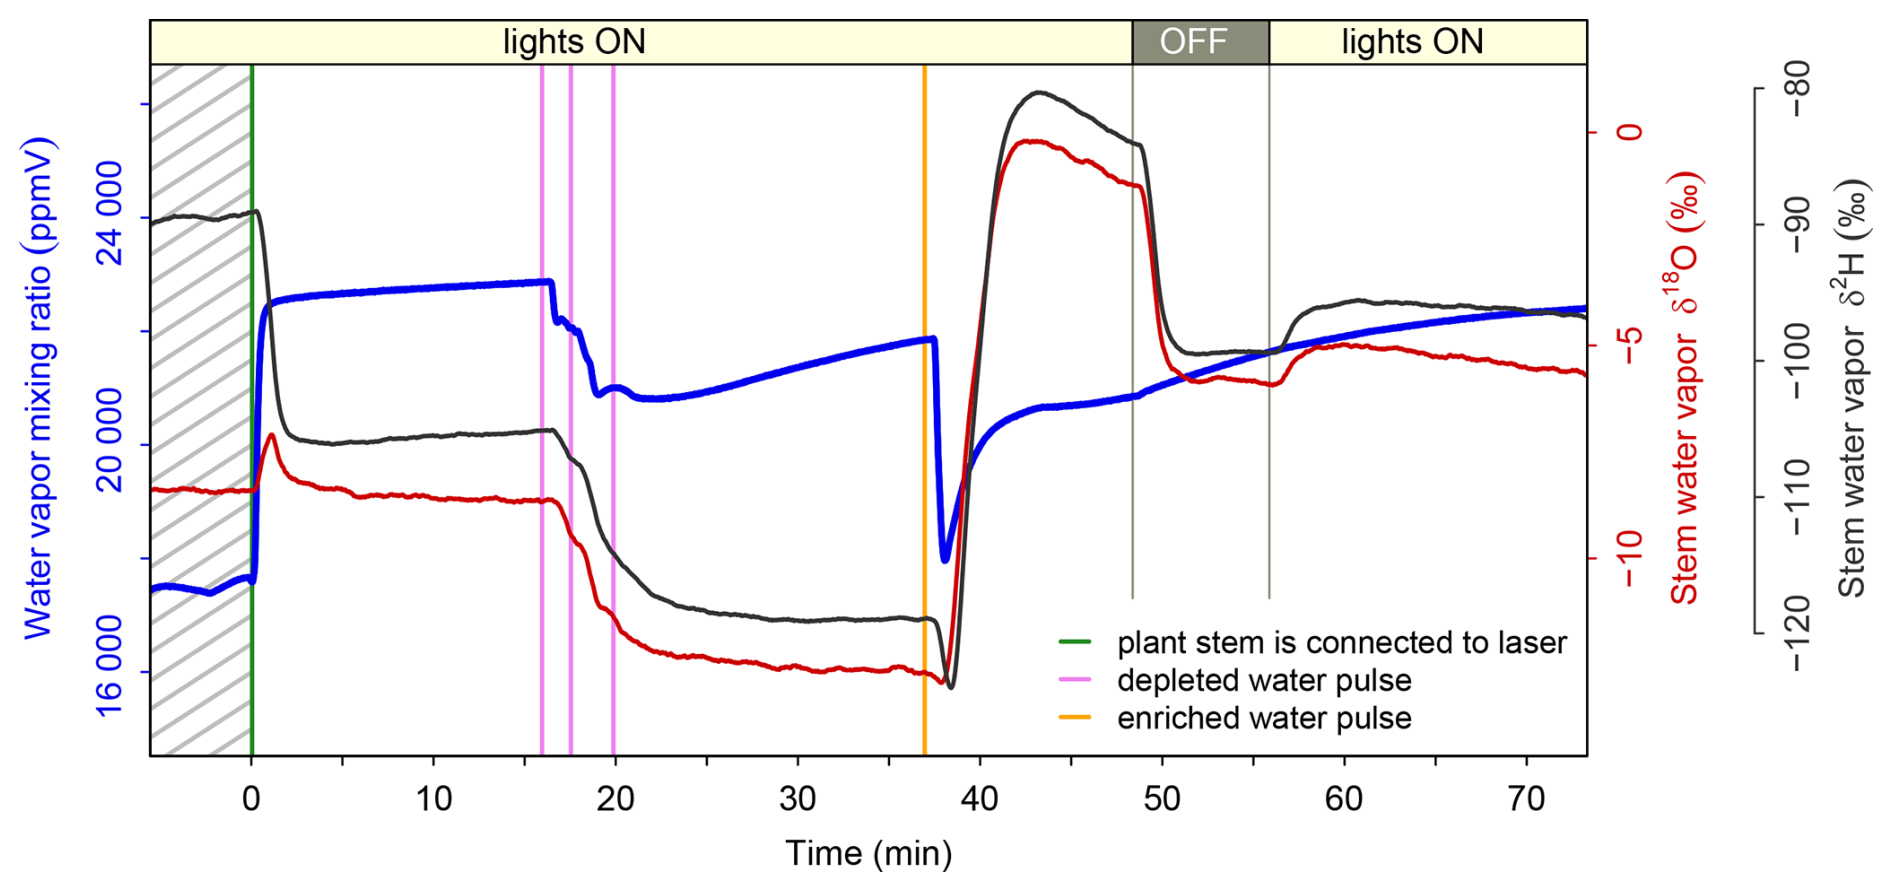
Figure E1Investigation of the response times in stem water vapor δ2H (‰, black curve) and δ18O (‰, red curve) of one individual plant following several “cold” labeling pulses (water temperature ∼ 10 °C versus soil initial water temperature ∼ 20 °C) and following light intensity changes. The depleted and enriched water pulses were applied 16 and 37 minutes (see the violet and orange vertical lines) after connection of the plant stem to the laser spectrometer (as indicated by the green vertical line). LED lights were switched off 48 min after stem connection to the laser spectrometer and turned off again 7 min later.
The changes in light intensity were strongly reflected by changes in stem water vapor δ2H and δ18O and less significantly by changes in WVMR (see 48–55 min). We believe that switching off the lights incrementally stopped transpiration and shortly after RWU to occur. The contribution of the enriched water (rising inside the xylem vessels to the gas sampling location) to the water contained in all types of tissues in the stem section and that equilibrates with the hollow-space water vapor (see Fig. 5, 2nd case, panel c) therefore decreased. This translated isotopically into a decrease in both stem water vapor δ2H and δ18O. This is corroborated by a continuous increase in WVMR as the stem (water) temperature increased.
Table F1Time evolutions of the simulated values of the (hydrogen and oxygen) isotopic compositions of soil water (δsoil_sim) in three layers (top: 0–16.5, middle: 16.5–36.5, and bottom: 36.5–45) used as input data for modeling of the isotopic composition of stem xylem water (δxyl_calc, Sects. 2.4.4 and 3.3 of the main text) of plant #1. DoE stands for the day of experiment. The soil water stable isotopic compositions values simulated initially (δini), that is, prior the first labeling pulse on DoE 1, 15:10–15:59, are reported in the first line of Table F1.
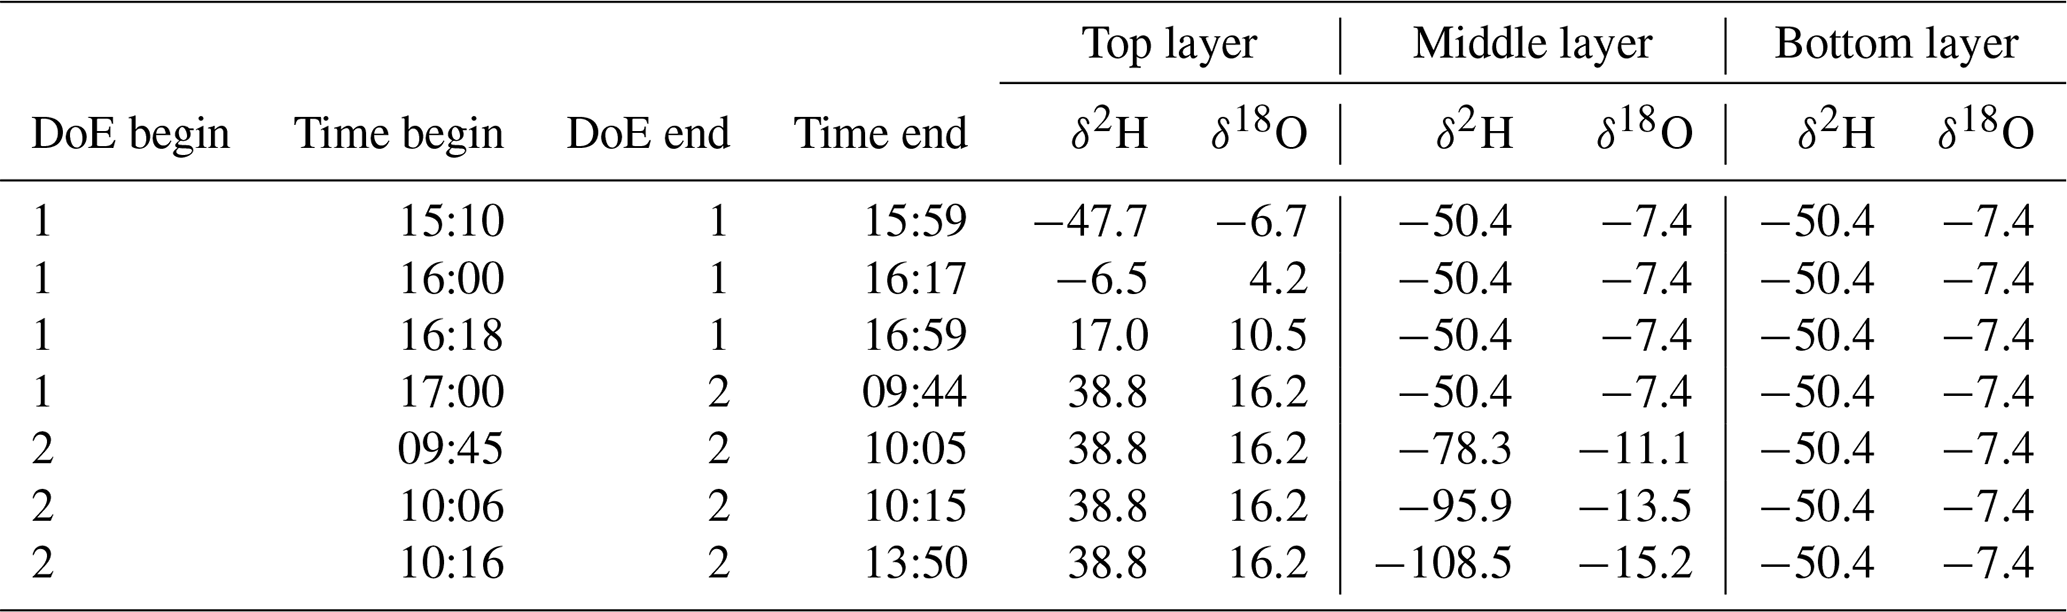
Table F2Time evolutions of the simulated values of the (hydrogen and oxygen) isotopic compositions of soil water (δsoil_sim) in three layers (top: 0–16.5, middle: 16.5–36.5, and bottom: 36.5–45) used as input data for modeling of the isotopic composition of stem xylem water (δxyl_calc, Sects. 2.4.4 and 3.3 of the main text) of plant #2. DoE stands for the day of experiment.
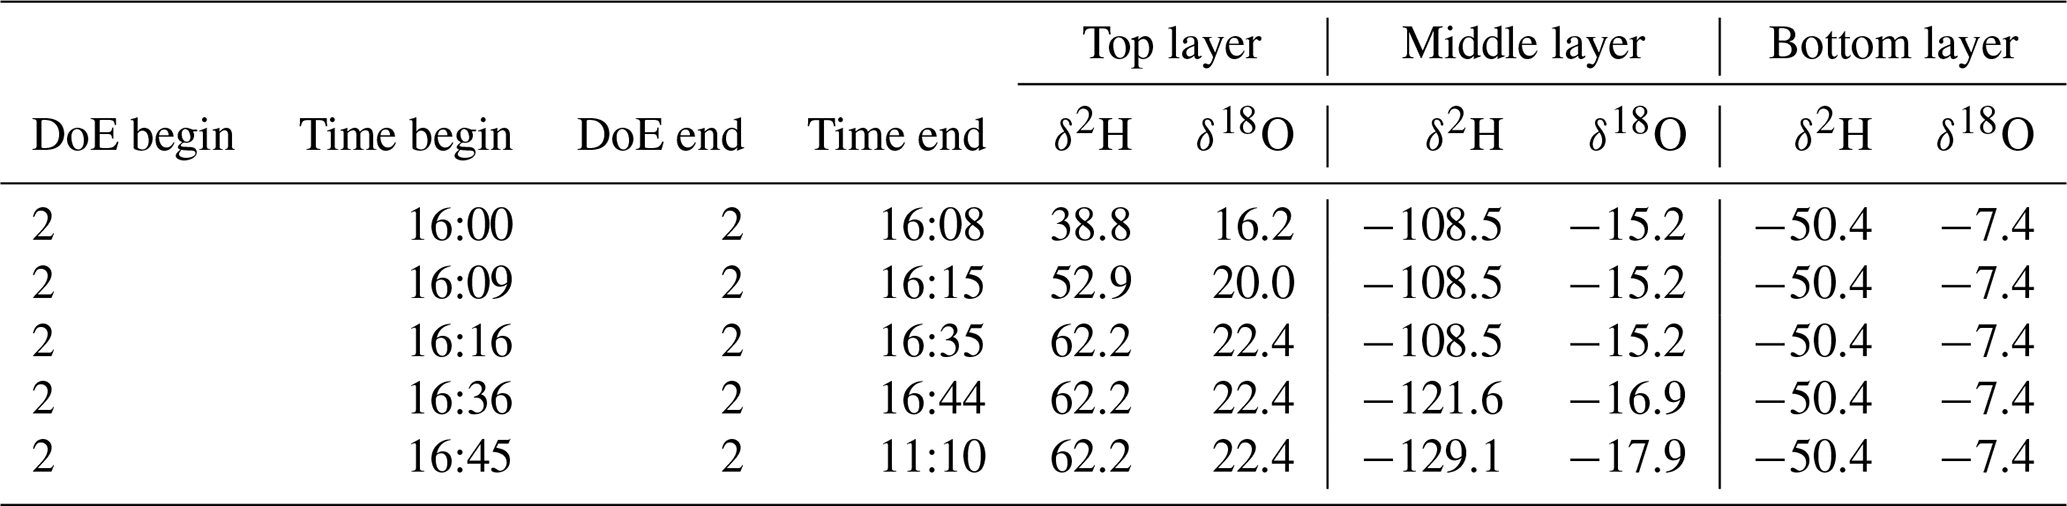
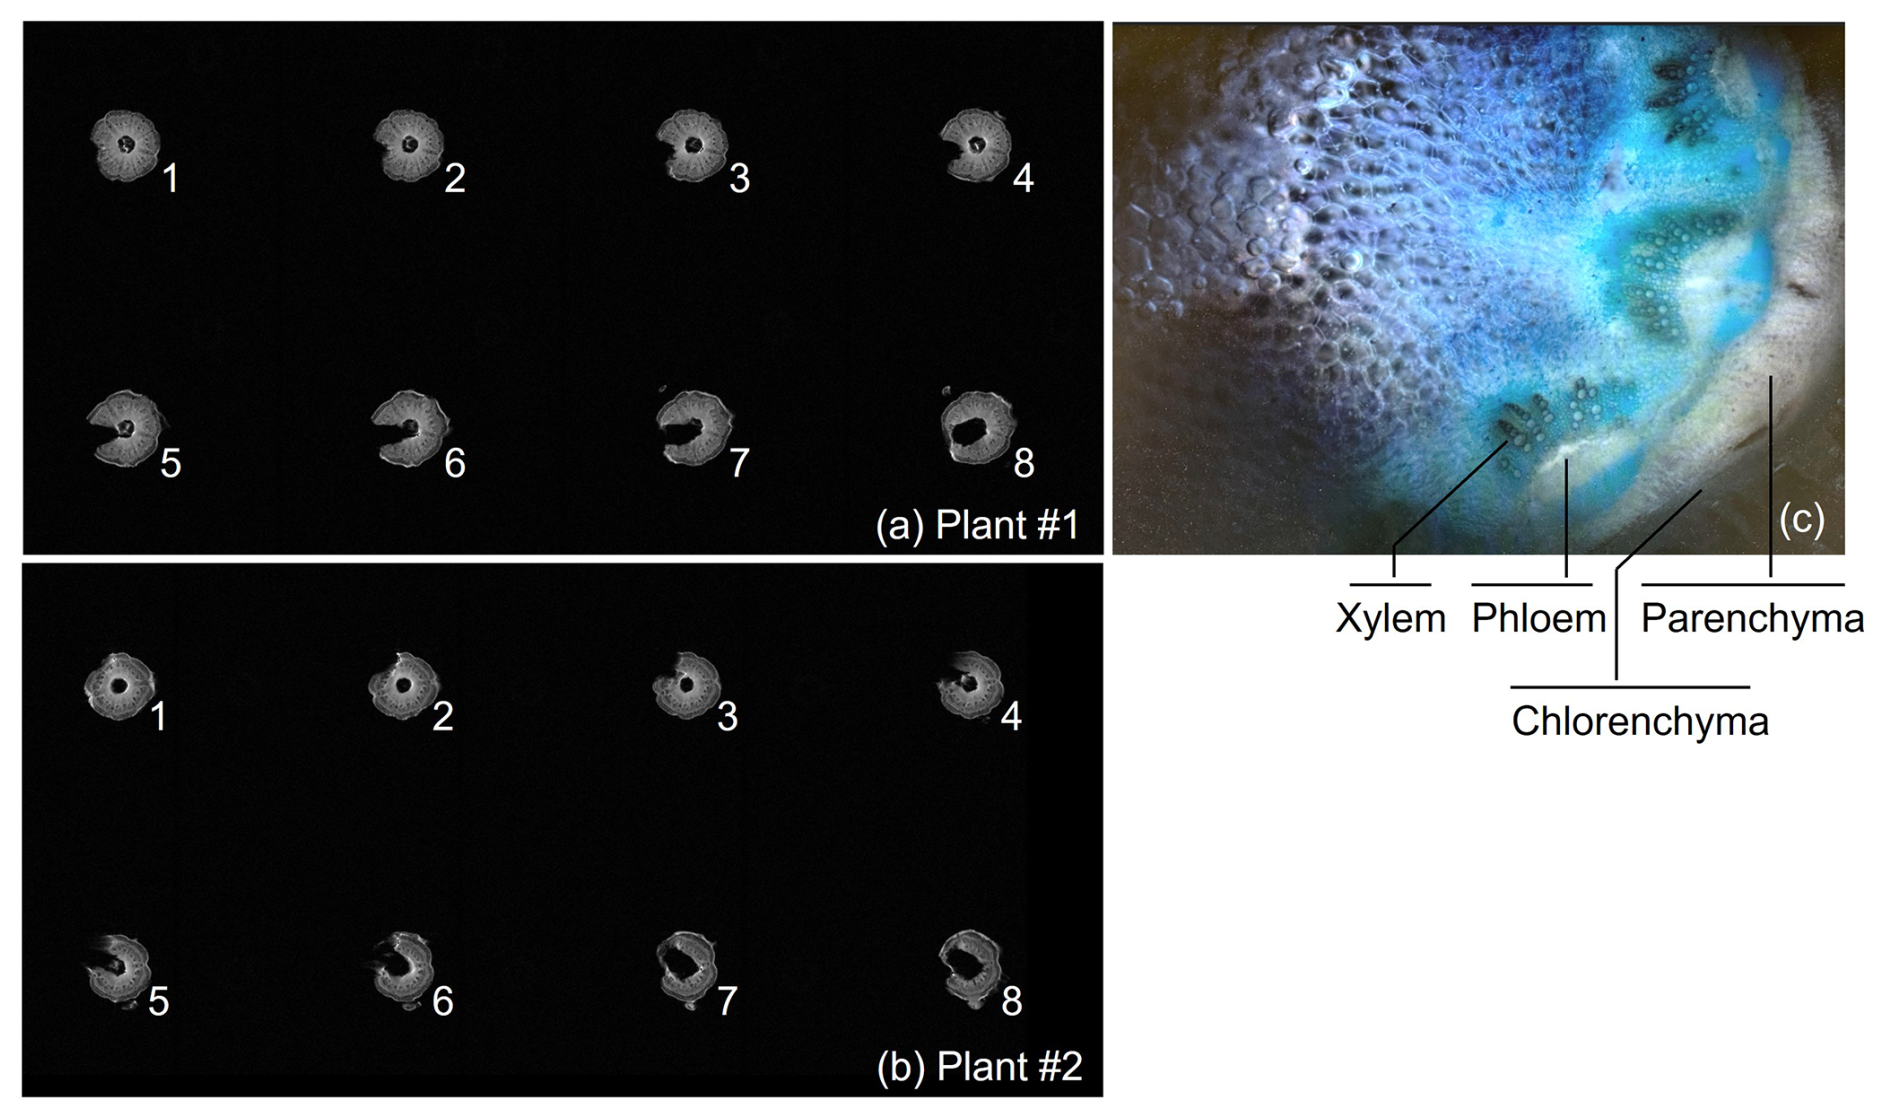
Figure G1Magnetic Resonance Imaging (MRI) pictures of the stems of plant #1 (a) and plant #2 (b). The MRI data shows holes significantly bigger than drilled, certainly a consequence of water vapor removal leading to dehydration of the inner stem. Eight 1.2 mm thick slices are shown (lowermost is number 1 and uppermost is number 8) for each plant. Panel (c) shows a microscopic observation (toluidine blue staining) of the peripheral part a plant stem section with a focus on the vascular bundles (xylem and phloem vessels).
Data made publicly available at: https://doi.org/10.26165/JUELICH-DATA/3GFM7N (Rothfuss, 2026).
YR and DvD: conceptualization, methodology, investigation, formal analysis, visualization, writing – original draft preparation, writing – review and editing, funding acquisition, supervision. SLG: methodology, investigation, formal analysis, visualization, writing – review and editing, supervision. SJ: investigation, formal analysis. NB and HV: writing – review and editing, funding acquisition. MJ and JK: writing – review and editing.
The contact author has declared that none of the authors has any competing interests.
Publisher's note: Copernicus Publications remains neutral with regard to jurisdictional claims made in the text, published maps, institutional affiliations, or any other geographical representation in this paper. The authors bear the ultimate responsibility for providing appropriate place names. Views expressed in the text are those of the authors and do not necessarily reflect the views of the publisher.
The authors would like to thank Beate Uhlig, Johannes Kochs and Daniel Pflugfelder from the Institute of Plant Sciences (IBG-2) and Sirgit Kummer and Holger Wissel from the Institute of Bio- and Geosciences – Agrosphere (IBG-3) of the Research Center in Jülich.
This study was conducted in the framework of and with means from the Bioeconomy Portfolio Theme of the Helmholtz Association of German Research Centers.
The article processing charges for this open-access publication were covered by the Forschungszentrum Jülich.
This paper was edited by Nadia Ursino and reviewed by two anonymous referees.
Barbeta, A., Burlett, R., Martín-Gómez, P., Fréjaville, B., Devert, N., Wingate, L., Domec, J. C., and Ogée, J.: Evidence for distinct isotopic compositions of sap and tissue water in tree stems: consequences for plant water source identification, New Phytol., 233, 1121–1132, https://doi.org/10.1111/nph.17857, 2022.
Barnard, R. L., de Bello, F., Gilgen, A. K., and Buchmann, N.: The δ18O of root crown water best reflects source water δ18O in different types of herbaceous species, Rapid Commun. Mass Spectrom., 20, 3799–3802, https://doi.org/10.1002/rcm.2778, 2006.
Bartlett, M. K., Scoffoni, C., and Sack, L.: The determinants of leaf turgor loss point and prediction of drought tolerance of species and biomes: a global meta-analysis, Ecol. Lett., 15, 393–405, https://doi.org/10.1111/j.1461-0248.2012.01751.x, 2012.
Benettin, P., Rodriguez, N. B., Sprenger, M., Kim, M., Klaus, J., Harman, C. J., van der Velde, Y., Hrachowitz, M., Botter, G., McGuire, K. J., Kirchner, J. W., Rinaldo, A., and McDonnell, J. J.: Transit Time Estimation in Catchments: Recent Developments and Future Directions, Water Resour. Res., 58, e2022WR033096, https://doi.org/10.1029/2022WR033096, 2022.
Beyer, M., Kühnhammer, K., and Dubbert, M.: In situ measurements of soil and plant water isotopes: a review of approaches, practical considerations and a vision for the future, Hydrol. Earth Syst. Sc., 24, 4413–4440, https://doi.org/10.5194/hess-24-4413-2020, 2020.
Campbell, G. S., Papendick, R. I., Rabie, E., and Shayongowi, A. J.: Comparison of Osmotic Potential, Elastic-Modulus, and Apoplastic Water in Leaves of Dryland Winter-Wheat, Agron. J., 71, 31–36, https://doi.org/10.2134/agronj1979.00021962007100010008x, 1979.
Ceperley, N., Gimeno, T. E., Jacobs, S. R., Beyer, M., Dubbert, M., Fischer, B., Geris, J., Holko, L., Kuebert, A., Le Gall, S., Lehmann, M. M., Llorens, P., Millar, C., Penna, D., Prieto, I., Radolinski, J., Scandellari, F., Stockinger, M., Stumpp, C., Tetzlaff, D., van Meerveld, I., Werner, C., Yildiz, O., Zuecco, G., Barbeta, A., Orlowski, N., and Rothfuss, Y.: Toward a common methodological framework for the sampling, extraction, and isotopic analysis of water in the Critical Zone to study vegetation water use, Wiley Interdisciplinary Reviews-Water, 11, e1727, https://doi.org/10.1002/wat2.1727, 2024.
Couvreur, V., Vanderborght, J., and Javaux, M.: A simple three-dimensional macroscopic root water uptake model based on the hydraulic architecture approach, Hydrol. Earth Syst. Sc., 16, 2957–2971, https://doi.org/10.5194/hess-16-2957-2012, 2012.
De Deurwaerder, H. P. T., Visser, M. D., Detto, M., Boeckx, P., Meunier, F., Kuehnhammer, K., Magh, R. K., Marshall, J. D., Wang, L. X., Zhao, L. J., and Verbeeck, H.: Causes and consequences of pronounced variation in the isotope composition of plant xylem water, Biogeosciences, 17(19), 4853-4870, https://doi.org/10.5194/bg-17-4853-2020, 2020.
De la Casa, J., Barbeta, A., Rodríguez-Uña, A., Wingate, L., Ogée, J., and Gimeno, T. E.: Isotopic offsets between bulk plant water and its sources are larger in cool and wet environments, Hydrol. Earth Syst. Sc., 26, 4125–4146, https://doi.org/10.5194/hess-26-4125-2022, 2022.
Diaz, P. A. D., van Dusschoten, D., Kübert, A., Brüggemann, N., Javaux, M., Merz, S., Vanderborght, J., Vereecken, H., Dubbert, M., and Rothfuss, Y.: Response of a grassland species to dry environmental conditions from water stable isotopic monitoring: no evident shift in root water uptake to wetter soil layers, Plant Soil, 482, 491–512, https://doi.org/10.1007/s11104-022-05703-y, 2023.
Fabiani, G., Penna, D., Barbeta, A., and Klaus, J.: Sapwood and heartwood are not isolated compartments: Consequences for isotope ecohydrology, Ecohydrology, 15, e2478, https://doi.org/10.1002/eco.2478, 2022.
Fricke, W.: Night-Time Transpiration – Favouring Growth? Trends Plant Sci., 24, 311–317, https://doi.org/10.1016/j.tplants.2019.01.007, 2019.
Fuchs, M.: Revealing the Hidden Role of Capacitance in the Water Flow Through Plants to the Atmosphere, Plant Cell Environ., 48, 3217–3224, https://doi.org/10.1111/pce.15343, 2025.
Horita, J. and Wesolowski, D. J.: Liquid-Vapor Fractionation of Oxygen and Hydrogen Isotopes of Water from the Freezing to the Critical-Temperature, Geochim. Cosmochim. Acta, 58, 3425–3437, https://doi.org/10.1016/0016-7037(94)90096-5, 1994.
Hübner, G.: Zum Wassertransport in Vicia faba, Flora oder Allgemeine Botanische Zeitung, 148, 549–594, https://doi.org/10.1016/S0367-1615(17)33175-0, 1960.
Janott, M., Gayler, S., Gessler, A., Javaux, M., Klier, C., and Priesack, E.: A one-dimensional model of water flow in soil-plant systems based on plant architecture, Plant Soil, 341, 233–256, https://doi.org/10.1007/s11104-010-0639-0, 2011.
Javaux, M., Couvreur, V., Vanderborght, J., and Vereecken, H.: Root Water Uptake: From Three-Dimensional Biophysical Processes to Macroscopic Modeling Approaches, Vadose Zone J., 12, https://doi.org/10.2136/vzj2013.02.0042, 2013.
Kinzinger, L., Haberstroh, S., Mach, J., Weiler, M., Orlowski, N., and Werner, C.: Continuous In-Situ Water Stable Isotopes Reveal Rapid Changes in Root Water Uptake by Fagus sylavatica During Severe Drought, Plant Cell Environ., 48, 7627–7639, https://doi.org/10.1111/pce.70055, 2025.
Knighton, J., Singh, K., and Evaristo, J.: Understanding Catchment-Scale Forest Root Water Uptake Strategies Across the Continental United States Through Inverse Ecohydrological Modeling, Geophys. Res. Lett., 47, e2019GL085937, https://doi.org/10.1029/2019GL085937, 2020a.
Knighton, J., Kuppel, S., Smith, A., Soulsby, C., Sprenger, M., and Tetzlaff, D.: Using isotopes to incorporate tree water storage and mixing dynamics into a distributed ecohydrologic modelling framework, Ecohydrology, 13, e2201, https://doi.org/10.1002/eco.2201, 2020b.
Kübert, A., Dubbert, M., Bamberger, I., Kühnhammer, K., Beyer, M., van Haren, J., Bailey, K., Hu, J., Meredith, L. K., Ladd, S. N., and Werner, C.: Tracing plant source water dynamics during drought by continuous transpiration measurements: An in-situ stable isotope approach, Plant Cell Environ, 46, 133–149, https://doi.org/10.1111/pce.14475, 2023.
Kühnhammer, K., Kübert, A., Brüggemann, N., Diaz, P. D., van Dusschoten, D., Javaux, M., Merz, S., Vereecken, H., Dubbert, M., and Rothfuss, Y.: Investigating the root plasticity response of Centaurea Jacea to soil water availability changes from isotopic analysis, New Phytol., 226, 98–110, https://doi.org/10.1111/nph.16352, 2020.
Kutschera, U. and Khanna, R.: Stomatal development and epiphytic bacteria in sunflower hypocotyls, Plant Signaling & Behavior, 20, 2548312, https://doi.org/10.1080/15592324.2025.2548312, 2025.
Li, Y., Fuchs, M., Cohen, S., Cohen, Y., and Wallach, R.: Water uptake profile response of corn to soil moisture depletion, Plant Cell Environ, 25, 491–500, https://doi.org/10.1046/j.1365-3040.2002.00825.x, 2002.
Mantova, M., Cochard, H., Burlett, R., Delzon, S., King, A., Rodriguez-Dominguez, C. M., Ahmed, M. A., Trueba, S., and Torres-Ruiz, J. M.: On the path from xylem hydraulic failure to downstream cell death, New Phytol., 237, 793–806, https://doi.org/10.1111/nph.18578, 2023.
Marshall, J. D., Cuntz, M., Beyer, M., Dubbert, M., and Kuehnhammer, K.: Borehole Equilibration: Testing a New Method to Monitor the Isotopic Composition of Tree Xylem Water, Front. Plant Sci., 11, 358, https://doi.org/10.3389/fpls.2020.00358, 2020.
Meinzer, F. C.: Stomatal Control of Transpiration, Trends Ecol. Evol., 8, 289–294, https://doi.org/10.1016/0169-5347(93)90257-P, 1993.
Meinzer, F. C., Johnson, D. M., Lachenbruch, B., McCulloh, K. A., and Woodruff, D. R.: Xylem hydraulic safety margins in woody plants: coordination of stomatal control of xylem tension with hydraulic capacitance, Funct. Ecol., 23, 922–930, https://doi.org/10.1111/j.1365-2435.2009.01577.x, 2009.
Millar, C., Pratt, D., Schneider, D. J., and McDonnell, J. J.: A comparison of extraction systems for plant water stable isotope analysis, Rapid Commun. Mass Spectrom., 32, 1031–1044, https://doi.org/10.1002/rcm.8136, 2018.
Millar, C., Janzen, K., Nehemy, M. F., Koehler, G., Hervé-Fernández, P., Wang, H. X., Orlowski, N., Barbeta, A., and McDonnell, J. J.: On the urgent need for standardization in isotope-based ecohydrological investigations, Hydrol. Process., 36, e14698, https://doi.org/10.1002/hyp.14698, 2022.
Müllers, Y., Postma, J. A., Poorter, H., Kochs, J., Pflugfelder, D., Schurr, U., and van Dusschoten, D.: Shallow roots of different crops have greater water uptake rates per unit length than deep roots in well-watered soil, Plant Soil, 481, 475–493, https://doi.org/10.1007/s11104-022-05650-8, 2022.
Orlowski, N., Breuer, L., Angeli, N., Boeckx, P., Brumbt, C., Cook, C. S., Dubbert, M., Dyckmans, J., Gallagher, B., Gralher, B., Herbstritt, B., Hervé-Fernández, P., Hissler, C., Koeniger, P., Legout, A., Macdonald, C. J., Oyarzún, C., Redelstein, R., Seidler, C., Siegwolf, R., Stumpp, C., Thomsen, S., Weiler, M., Werner, C., and McDonnell, J. J.: Inter-laboratory comparison of cryogenic water extraction systems for stable isotope analysis of soil water, Hydrol. Earth Syst. Sc., 22, 3619–3637, https://doi.org/10.5194/hess-22-3619-2018, 2018.
Penna, D., Geris, J., Hopp, L., and Scandellari, F.: Water sources for root water uptake: Using stable isotopes of hydrogen and oxygen as a research tool in agricultural and agroforestry systems, Agr. Ecosyst. Environ., 291, 106790, https://doi.org/10.1016/j.agee.2019.106790, 2020.
Preisler, Y., Hölttä, T., Grünzweig, J. M., Oz, I., Tatarinov, F., Ruehr, N. K., Rotenberg, E., and Yakir, D.: The importance of tree internal water storage under drought conditions, Tree Physiol., 42, 771–783, https://doi.org/10.1093/treephys/tpab144, 2022.
Rothfuss, Y.: Replication Data for: Sunflower_SWaP-Water_stable_isotope_project, V1, Jülich DATA [data set], https://doi.org/10.26165/JUELICH-DATA/3GFM7N, 2026.
Rothfuss, Y. and Javaux, M.: Reviews and syntheses: Isotopic approaches to quantify root water uptake: a review and comparison of methods, Biogeosciences, 14, 2199–2224, https://doi.org/10.5194/bg-14-2199-2017, 2017.
Rothfuss, Y., Vereecken, H., and Brüggemann, N.: Monitoring water stable isotopic composition in soils using gas-permeable tubing and infrared laser absorption spectroscopy, Water Resour. Res., 49, 3747–3755, https://doi.org/10.1002/wrcr.20311, 2013.
Rothfuss, Y., Merz, S., Vanderborght, J., Hermes, N., Weuthen, A., Pohlmeier, A., Vereecken, H., and Brüggemann, N.: Long-term and high-frequency non-destructive monitoring of water stable isotope profiles in an evaporating soil column, Hydrol. Earth Syst. Sc., 19, 4067–4080, https://doi.org/10.5194/hess-19-4067-2015, 2015.
Schmidt, M., Maseyk, K., Lett, C., Biron, P., Richard, P., Bariac, T., and Seibt, U.: Concentration effects on laser-based δ18O and δ2H measurements and implications for the calibration of vapour measurements with liquid standards, Rapid Commun. Mass Spectrom., 24, 3553–3561, https://doi.org/10.1002/rcm.4813, 2010.
Seeger, S. and Weiler, M.: Dye-tracer-aided investigation of xylem water transport velocity distributions, Hydrol. Earth Syst. Sc., 27, 3393–3404, https://doi.org/10.5194/hess-27-3393-2023, 2023.
Sifton, H. B.: Air-Space Tissue in Plants 2, Bot. Rev., 23, 303–312, https://doi.org/10.1007/Bf02872447, 1957.
Sperry, J. S. and Love, D. M.: What plant hydraulics can tell us about responses to climate-change droughts, New Phytol., 207, 14–27, https://doi.org/10.1111/nph.13354, 2015.
van Dusschoten, D., Kochs, J., Kuppe, C. W., Sydoruk, V. A., Couvreur, V., Pflugfelder, D., and Postma, J. A.: Spatially Resolved Root Water Uptake Determination Using a Precise Soil Water Sensor, Plant Physiol., 184, 1221–1235, https://doi.org/10.1104/pp.20.00488, 2020.
van Dusschoten, D., Pflugfelder, D., and Kochs, J.: Root water uptake in relation to plant transpiration, EGU General Assembly 2023, Vienna, Austria, 24–28 Apr 2023, EGU23-12018, https://doi.org/10.5194/egusphere-egu23-12018, 2023.
Volkmann, T. H. M. and Weiler, M.: Continual in situ monitoring of pore water stable isotopes in the subsurface, Hydrol. Earth Syst. Sc., 18, 1819–1833, https://doi.org/10.5194/hess-18-1819-2014, 2014.
Volkmann, T. H. M., Kühnhammer, K., Herbstritt, B., Gessler, A., and Weiler, M.: A method for in situ monitoring of the isotope composition of tree xylem water using laser spectroscopy, Plant Cell Environ., 39, 2055–2063, https://doi.org/10.1111/pce.12725, 2016.
von Freyberg, J., Allen, S. T., Grossiord, C., and Dawson, T. E.: Plant and root-zone water isotopes are difficult to measure, explain, and predict: Some practical recommendations for determining plant water sources, Methods Ecol. Evol., 11, 1352–1367, https://doi.org/10.1111/2041-210x.13461, 2020.
Wassenaar, L. I., Hendry, M. J., Chostner, V. L., and Lis, G. P.: High Resolution Pore Water δ2H and δ18O Measurements by H2O(liquid)-H2O(vapor) Equilibration Laser Spectroscopy, Environ. Sci. Technol., 42, 9262–9267, https://doi.org/10.1021/es802065s, 2008.
Wei, C., Steudle, E., Tyree, M. T., and Lintilhac, P. M.: The essentials of direct xylem pressure measurement, Plant Cell Environ., 24, 549–555, https://doi.org/10.1046/j.1365-3040.2001.00697.x, 2001.
West, A. G., Patrickson, S. J., and Ehleringer, J. R.: Water extraction times for plant and soil materials used in stable isotope analysis, Rapid Commun. Mass Spectrom., 20, 1317–1321, https://doi.org/10.1002/rcm.2456, 2006.
Zhao, L. J., Xiao, H. L., Zhou, J., Wang, L. X., Cheng, G. D., Zhou, M. X., Yin, L., and McCabe, M. F.: Detailed assessment of isotope ratio infrared spectroscopy and isotope ratio mass spectrometry for the stable isotope analysis of plant and soil waters, Rapid Commun. Mass Spectrom., 25, 3071–3082, https://doi.org/10.1002/rcm.5204, 2011.