
the Creative Commons Attribution 4.0 License.
the Creative Commons Attribution 4.0 License.
 | 25 Sep 2026
Freeze–thaw processes influence shallow groundwater recharge sources and pathways in the Qinghai Lake Basin: insights from water isotopes
Wenhao Zhang

Yuanhong Deng
Guangrong Hu
Fangzhong Shi
Groundwater plays a crucial role in maintaining baseflow in rivers and ensuring water supply, particularly in alpine regions where the freeze–thaw (FT) cycle exerts a strong influence on hydrological processes. However, a systematic understanding is still lacking regarding how FT processes affect the composition of groundwater recharge sources and the transitions among recharge pathways. This study takes the Qinghai Lake basin (QLB) as a case study and combines water isotope and hydrometeorological data to quantify the dynamic characteristics of groundwater recharge sources and pathways during the FT periods. The study found that soil water (57.0 %–76.3 %) was the dominant source of groundwater recharge during the FT periods, followed by rainfall (13.8 %–26.1 %) and snowmelt (7.9 %–22.0 %). The thawing process enhances the vertical connectivity of the soil profile, facilitating the recharge of groundwater from snowmelt and the 60–90 cm soil layer. Furthermore, the lc-excess value of groundwater gradually shifts from values closer to soil water to those closer to precipitation, indicating that piston flow gradually weakens during the process of groundwater recharge by soil water, while preferential flow intensifies, resulting in a pattern where piston flow and preferential flow coexist. Spatially, in the middle and upper regions dominated by permafrost, groundwater is primarily recharged by water from the 0–60 cm soil layer traveling along longer hydrological pathways, whereas in the downstream regions of the basin dominated by seasonal frozen ground, groundwater is primarily recharged by rapid infiltration from the 30–90 cm soil layer. Our research demonstrates that in alpine permafrost regions, freeze–thaw processes regulate water storage and transport, thereby further influencing the recharge sources and pathways of shallow groundwater.
- Article
(6946 KB) - Full-text XML
-
Supplement
(482 KB) - BibTeX
- EndNote


Groundwater is a critical component of terrestrial ecosystems and an important link in the global water cycle (Alley et al., 2002; Kooi, 2016). Globally, over two billion people depend on groundwater as a source of drinking water (Jasechko et al., 2017), and groundwater is also the largest accessible freshwater reserve at present on earth (Hamidi et al., 2023). As the “Asian Water Tower”, the Qinghai–Tibet Plateau (QTP) contains the world's highest and most extensive permafrost region (Wu et al., 2021; Zhang et al., 2022). Groundwater dynamics there not only shape the recharge regimes of the plateau's rivers, lakes, and wetlands (Taylor et al., 2013) but also affect downstream water security and ecological stability (Kuang et al., 2024). Against the backdrop of climate warming, permafrost continues to warm and degrade, and the active layer is deepening (Zhao and Wu, 2019; Zhang et al., 2026a). These changes may drive comprehensive shifts in the sources, magnitude, and pathways of groundwater recharge (Biskaborn et al., 2019; Stroeve et al., 2025). Therefore, elucidating the sources and pathways of groundwater recharge not only helps to improve the understanding of water cycling in permafrost regions but also provides a scientific basis for water resource management and ecological conservation in alpine regions.
Although the influence of permafrost on surface runoff has been widely investigated, a systematic understanding of its role in groundwater recharge remains lacking (Ala-Aho et al., 2021; Zhao et al., 2026). Existing studies based on laboratory experiments (Pittman et al., 2020), field observations (Zuo et al., 2023a), and remote sensing satellites (Hornum et al., 2023) indicate that the influence of permafrost on groundwater recharge exhibits significant spatial heterogeneity (Xie et al., 2026). For example, in the midwestern United States, when snowmelts and then refreezes in mid-winter, it impedes infiltration and increases runoff, resulting in a significant reduction in groundwater recharge from winter and spring snowmelt (Hyman-Rabeler and Loheide, 2023). In contrast, in northeastern China, under soil freezing conditions, winter snowmelt can still penetrate the frozen layer, but its recharge rate is lower than that during the spring snowmelt period (Du et al., 2019). Similarly, Daniel and Staricka (2000) observed in Minnesota that although the frozen layer impedes precipitation infiltration, water can still bypass the frozen layer via preferential flow along macropores, thereby increasing groundwater recharge. Studies in the Arctic region further indicate that increases in vegetation height and snow depth may promote groundwater recharge (Young et al., 2020). In addition to freezing conditions, permafrost degradation may alter subsurface water storage capacity and thereby affect surface water and groundwater connectivity (Van Tiel et al., 2024). Currently, research on groundwater hydrological processes in alpine regions still has the following knowledge gaps: (1) most studies focus on qualitative analysis, and a detailed quantification of groundwater recharge sources remains lacking; (2) there is a lack of studies that investigate groundwater recharge processes from the perspective of the freeze–thaw period; (3) the responses of permafrost and seasonally frozen ground to climate warming, and their implications for groundwater recharge and availability, remain poorly understood.
Stable water isotope techniques provide an effective means of identifying groundwater recharge and transport pathways and have been extensively utilized in alpine regions (McDonnell et al., 1991; McGuire and McDonnell, 2010; Li et al., 2026; Valdivielso et al., 2026). Existing research indicates that the thawing process significantly influences groundwater recharge characteristics. In the Three-Rivers Headwaters Region, for example, groundwater above the permafrost layer is younger (shorter water transit time) during the thawing period, and topographical variations affect groundwater flow pathways (Du et al., 2024). Similarly, in the Tumen River basin in Northeast Asia, the thawing process also enhances the recharge of groundwater from surface water (Wang et al., 2025a). In addition to revealing spatiotemporal variations in recharge, stable water isotopes can also be used to identify specific recharge patterns. For example, in Wengniute County, China, piston flow and preferential flow coexist during groundwater recharge by soil water (Li et al., 2024). In the quantitative attribution of recharge sources, MixSIAR is an open-source R package for Bayesian isotope mixing models that estimate the relative contributions of potential water sources and their associated uncertainties (Moore and Semmens, 2008; Parnell et al., 2010), whereas IsoSource identifies feasible combinations of source contributions based on isotope mass balance (Phillips and Gregg, 2003). MixSIAR models are more accurate than IsoSource models in tracing water sources in permafrost regions (Fang et al., 2022). Nevertheless, in alpine regions, especially under FT processes, studies using stable water isotopes to identify groundwater recharge sources and pathways remain limited.
The Qinghai Lake Basin (QLB), located in the northeastern part of the QTP, features groundwater recharge and transport processes that are strongly regulated by FT cycles, making it an ideal region for studying the impacts of FT processes on groundwater recharge sources and pathways. To this end, we established a comprehensive ecohydrological monitoring network within the QLB. The main objectives of this study are: (1) analyse the hydrogen and oxygen isotopic variation characteristics of precipitation, soil water at different depths, and groundwater during the FT periods in the QLB; (2) quantify the recharge sources of groundwater during the FT periods in the QLB; (3) investigate the influence of FT processes on groundwater recharge pathways. This study will offer a scientific foundation for groundwater resource management in alpine regions, thereby helping to better cope with the challenges that climate change poses to groundwater recharge processes.
2.1 Study area
The QLB lies in the northeastern sector of the QTP, encompassing a total area of 2.97×10⁴ km2 (Fig. 1). Among these, permafrost primarily occurs in the upstream and high-altitude areas, covering approximately 1.23×10⁴ km2, which represents 41.5 % of the basin's entire area. Seasonally frozen soil is mainly distributed in the midstream, downstream, and areas surrounding the lake, covering 1.74×10⁴ km2, accounting for 58.5 % of the total basin area. This basin is located in the transitional zone from the eastern monsoon region to the inland arid region, and belongs to the temperate continental semi-arid climate zone of the QTP, characterized by pronounced dry-wet seasonal variations, strong evaporation, abundant sunshine, and intense solar radiation (Li et al., 2016). Alpine meadows constitute the dominant vegetation type, followed by alpine steppes; together, they cover roughly 85 % of the basin's vegetated area. The basin features diverse soil types, mainly including alpine cold desert soil, alpine meadow soil, and alpine steppe soil, among others. Considering the influences of elevation, topography, and groundwater burial depth, the spatiotemporal variations in this study are classified into the downstream basin and middle and upper reaches of the basin.

Figure 1(a) Location of the QLB on the QTP. (b) Spatiotemporal distribution of permafrost in the QLB, where gray and orange represent seasonal permafrost and permafrost, respectively. (c) Location of the QLB and distribution of sampling points. (d) Groundwater sampling. (e) Precipitation sampling. (f) Soil samples are collected monthly at adjacent locations.
The groundwater system exhibits distinct spatial differentiation: mountainous areas primarily serve as groundwater recharge zones, piedmont plains act as the main migration pathways and infiltration areas for subsurface runoff, while the plains surrounding the lake are predominantly characterized by groundwater discharge. In mountainous areas, pore water is stored as unconfined groundwater in the detrital layer, with a water table depth of approximately 15 m. The piedmont plain mainly consists of unconfined groundwater in Quaternary sand and gravel layers, with a water table depth of 5–25 m and an aquifer thickness of 25–98 m. The plain surrounding the lake is characterized mainly by unconfined and confined groundwater in sand and gravel layers, with a water table depth of approximately 6 m and an aquifer thickness of 10–62 m. Overall, the depth to the groundwater table and the thickness of the aquifer in the watershed exhibit an increasing trend with elevation (Fig. 2).

Figure 2Hydrogeologic profile of the QLB (based on Peng et al., 2015; Li et al., 2022; Peng et al., 2023).
Table 1Basic information on precipitation in the basin, groundwater, and soil sampling points at various depths.
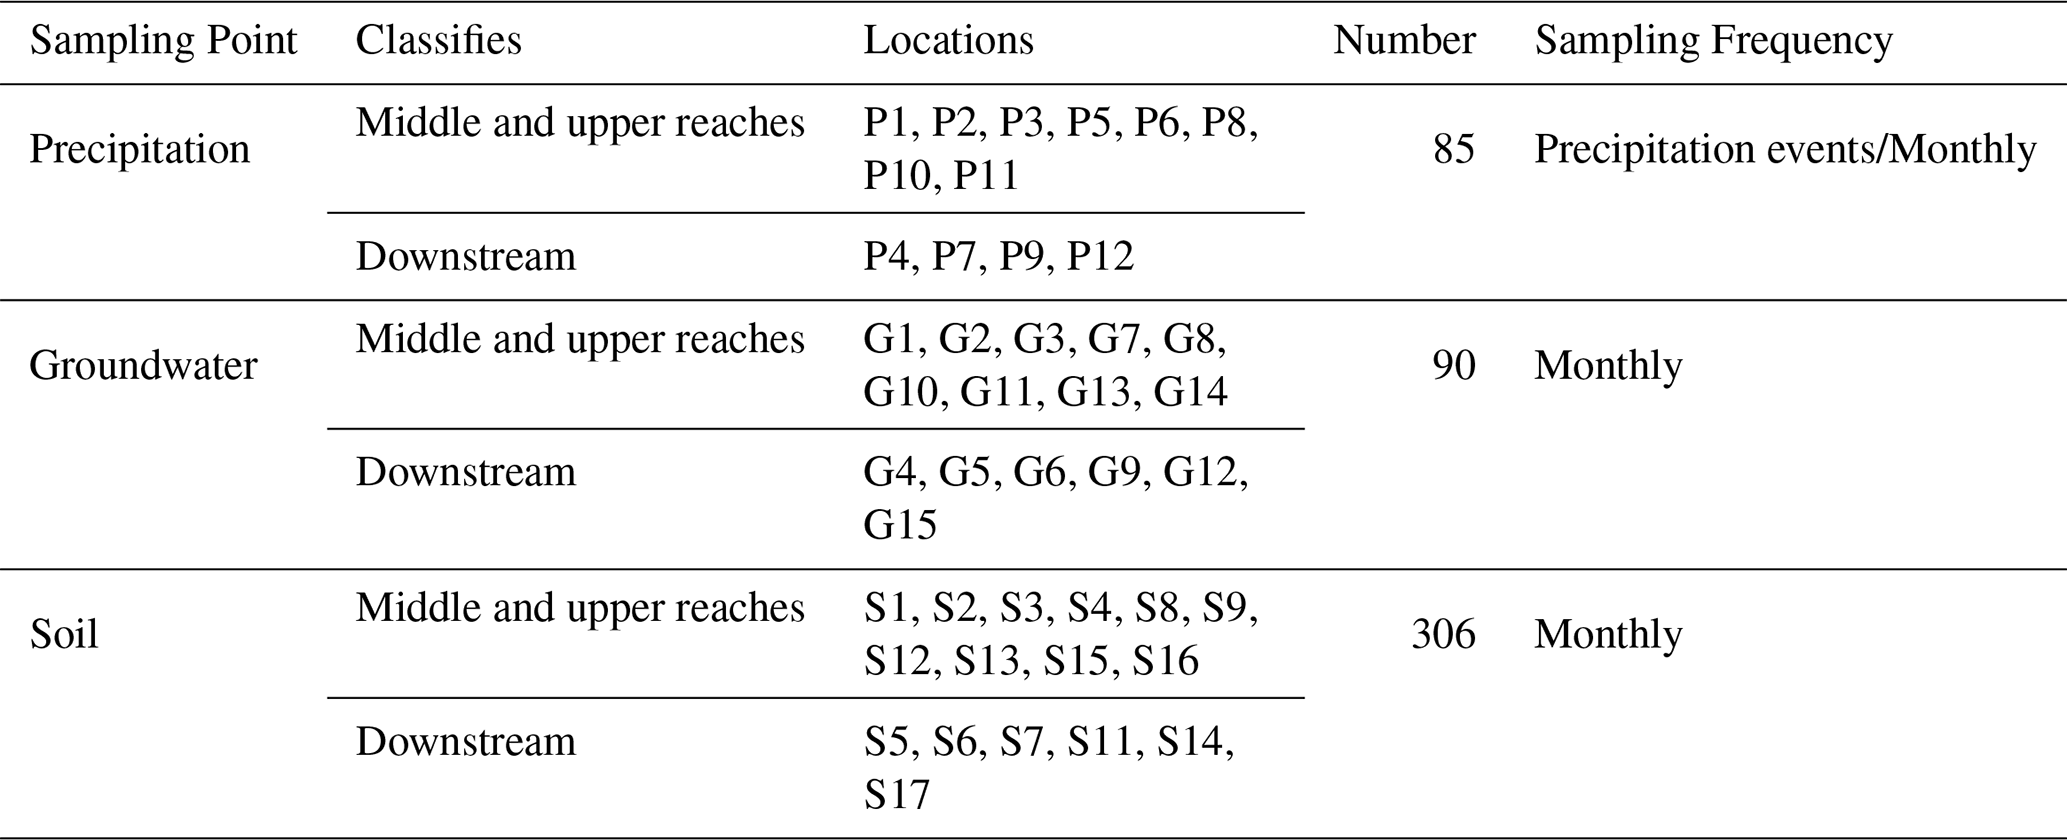
Note: Sampling sites within the QLB are numbered sequentially, starting from the western part of the watershed to the northwestern part, and from upstream to downstream.
2.2 Sample collection
From May to October 2025, we collected precipitation, groundwater, and soil samples on a monthly basis in the QLB, taking into account elevation, soil type, and permafrost distribution. A total of 15 groundwater sampling points, 17 soil sampling points, and 11 precipitation collection points were established (Fig. 1). During the study period, a total of 481 samples were collected, comprising 90 groundwater samples, 306 soil samples, and 85 precipitation samples (Table 1). Groundwater was sampled from the well system used by local herders in the QLB. Before sampling, the well was flushed for 20 s, and after the flow stabilized, water samples were collected into 100 mL polyethylene bottles. Soil samples were collected in layers at depths of 0–30, 30–60, and 60–90 cm using a modified electric soil auger. Sampling depths typically ranged from 60 to 90 cm, with a maximum depth of 110 cm and a minimum depth of 50 cm. Immediately after collection, samples were placed into 12 mL sampling vials and aluminum boxes, sealed with Parafilm, and quickly frozen in a vehicle-mounted refrigerator for preservation. Rainfall samples were collected using standard evaporation-proof rain gauges installed in open areas. Rainfall samples were placed in 100 mL polyethylene bottles and stored frozen. Snow samples were collected from the snowpack using clean, sealed plastic bags. During sampling, the surface layer of snow was first removed, and snow samples were then collected immediately adjacent to the soil interface and allowed to melt naturally at room temperature on the day of sampling. All water samples, including snowmelt, rainfall, and groundwater, were filtered through a 0.45 µm membrane filter before being transferred to 100 mL polyethylene sample bottles.
2.3 Experimental analysis
All experimental analyses of the samples were completed at the State Key Laboratory of Earth Surface Processes and Hazards Risk Governance, Beijing Normal University. Precipitation, groundwater, and soil water were analyzed for δ2H and δ18O using an Isotope Ratio Infrared Spectrometer (DLT-100, Los Gatos Research, Mountain View, USA). The instrument's analytical precision was δ2H: ±0.5 ‰ and δ18O: ±0.1 ‰. The measurement results were calibrated using the LWIA Post Analysis liquid water isotope analysis software. Soil water was extracted using an automatic cryogenic vacuum distillation water extraction system (LI-2100, LICA United Technology Limited, China), followed by δ2H and δ18O measurements. To determine soil water content (SWC), soil samples in aluminum boxes were weighed and dried in an oven at 105 °C for 24 h.

2.4 Methods
2.4.1 Division of FT periods
The soil FT periods in the QLB were delineated based on air temperature (Tair) and soil temperature (Tsoil) data (Table 2). The month containing the first day on which both daily maximum air temperature (Tmax,air) and daily maximum soil temperature (Tmax,soil) remain continuously above 0 °C for 7 consecutive days is defined as the thawing period (Fig. S1 in the Supplement). The month containing the first day on which both the daily minimum air temperature (Tmin,air) and the daily minimum soil temperature (Tmin,soil) remain continuously above 0 °C for 7 consecutive days is defined as the thawed period. The freezing period is defined as the month containing the first day on which both the daily minimum air temperature (Tmin,air) and the daily minimum soil temperature (Tmin,soil) remain continuously below 0 °C for 7 consecutive days. The FT process exhibited a distinct seasonal progression throughout the study period rather than occurring randomly across different sampling months.
In early May, the soil entered the initial thawing stage, and FT cycles emerged. As nighttime air temperatures continued to rise, freeze–thaw cycles disappeared in late May, and the soil subsequently entered a stable thawing period. From July to September, the soil remained completely thawed, and no FT cycles were observed. In mid to late October, as nighttime soil temperature and air temperature dropped below 0 °C, the soil re-entered the freezing period. Accordingly, based on the seasonal variations in air temperature and soil temperature, May to June, July to September, and October were defined as the thawing period, the thawed period, and the freezing period, respectively. For details on the classification, refer to previously published literature on this study area (Zhang et al., 2024; Hu et al., 2022).
2.4.2 Identifying the pattern of groundwater recharge from soil water
To determine how soil water recharges groundwater in the QLB, we employed the line-conditioned excess (lc-excess) method (Landwehr and Coplen, 2006). This index quantifies the degree of deviation of a water body by calculating the vertical distance of a sample relative to the local meteoric water line (LMWL). During the recharge of groundwater by precipitation and soil water, piston flow and preferential flow typically exhibit different stable isotope signatures. Lower lc-excess values indicate that the water body has undergone evaporation, corresponding to piston flow of soil water. In contrast, the smaller the difference between the soil water lc-excess value and the precipitation lc-excess value (Δlc-excess), the more it indicates that preferential flow has occurred along the fast path. This method has been extensively used in permafrost watersheds on the QTP (Li et al., 2025a, b).
Where a and b denote the slope and intercept, respectively, of the LMWL in the study area.
2.4.3 Quantifying the sources of groundwater recharge during the FT period
MixSIAR (R4.5.1) can simultaneously account for source endmember variability, mixing proportion uncertainty, and fractionation effects in multi-endmember mixing scenarios, thereby providing a more robust estimate of each source's contribution to the mixture (Parnell et al., 2010; Wang et al., 2025b). Given the seasonal nature of FT processes, their effects on groundwater recharge extend beyond individual recharge events or daily variations. Therefore, we employed monthly sampling to investigate changes in groundwater recharge sources and pathways over a complete FT period. In this study, rainfall, snowmelt, and soil water from different depths were considered as potential recharge endmembers for groundwater during the FT periods, and MixSIAR was used to quantify the relative contributions of each recharge source. The model employed Markov Chain Monte Carlo with Gelman–Rubin statistics and Geweke diagnostics to test the convergence and stability of the chains, thereby ensuring the reliability of the estimation results.
Where Xij represents the measured value of the j isotope in the i groundwater sample. Pk is the contribution proportion of the k recharge source to the sample; Skj denotes the end-member value of tracer j in source k, and follows a normal distribution with mean μkj and variance ; Ckj denotes the fractionation correction term for tracer j, and follows a normal distribution with mean λkj and variance ; εij denotes the residual term, and follows a normal distribution with mean 0 and variance .
2.4.4 Statistical analysis
One-way analysis of variance (ANOVA) was used to compare soil water indicators (δ18O, δ2H, lc-excess, and SWC) among different soil layers. Multiple comparisons were performed using the least significant difference (LSD) test, with the significance level set at p<0.05. All statistical analyses were performed using SPSS version 22.0.
3.1 Characteristics of δ2H, δ18O, and lc-excess in precipitation, soil water, and groundwater
During the thawing period, precipitation exhibited the most depleted δ2H and δ18O values, along with the highest degree of variability. The isotopic signature of groundwater remained comparatively constant, with δ18O and δ2H ranging from −8.65 ‰ to −6.25 ‰ and from −52.48 ‰ to −36.55 ‰, respectively. In the 0–30 cm soil layer, the δ18O and δ2H of soil water were relatively enriched, with the lowest lc-excess, whereas the δ18O and δ2H of soil water in the 30–60 and 60–90 cm layers were closer to those of groundwater (Fig. 3a). During the thawed period, the δ18O values of precipitation shifted overall from depleted to enriched (δ18O: from −11.57 ‰ to −8.93 ‰). The δ18O and δ2H values of soil water in all soil layers increased. Among these, the 0–30 cm soil water had the highest δ2H and δ18O values, and its lc-excess remained significantly lower than that of the 30–90 cm soil water and groundwater (p<0.05). In contrast, the variations in the 30–90 cm soil water and groundwater were relatively small. During the freezing period, the δ2H and δ18O values of soil water in the 0–30 cm depth interval were more depleted than those during the thawed period, while lc-excess showed a slight increase (Fig. 3b). Meanwhile, the δ18O and δ2H values of the 60–90 cm soil water and groundwater remained close to each other. Overall, precipitation exhibited the largest isotopic fluctuation during the FT periods, followed by soil water in the 0–30 cm layer, while the 60–90 cm soil water and groundwater were the most stable. Meanwhile, soil water δ2H and δ18O gradually decreased with increasing depth, whereas lc-excess gradually increased with depth (Fig. 3c).

Figure 3Variations in δ2H (a), δ18O (b), and lc-excess (c) of precipitation, groundwater, and soil water at different depths during FT periods. The error bar represents the variance of the calculated results across all data points.

Figure 4Changes in the δ2H and δ18O correlation across various water types during (a) thawing, (b) thawed, (c) freezing, and (d) the entire FT periods.
3.2 Relationships among δ2H and δ18O in precipitation, soil water, and groundwater
In the QLB, the δ2H and δ18O values for precipitation, soil water, and groundwater all cluster around the LMWL, but the soil water line (SWL) and groundwater line (GWL) were generally below the LMWL (Fig. 4). During the thawing period, the difference between GWL and SWL was most pronounced. Among them, GWL was closest to the LMWL, whereas the 0–30 cm SWL exhibited the lowest slope and the poorest fit (Fig. 4a). During the thawed period, the slopes and intercepts of the soil water lines for all layers approached the LMWL, with the 30–60 cm SWL being the closest to the LMWL. However, compared to the thawing period, the slope of the GWL remained lower than those of all SWLs, and its R2 decreased (Fig. 4b). During the freezing period, the GWL slope and intercept rose markedly, approaching the LMWL closely. Meanwhile, the SWLs again diverged, exhibiting slopes of 5.28, 4.70, and 4.16 for the 0–30, 30–60, and 60–90 cm layers, respectively (Fig. 4c). During the FT periods, the slope of the SWL generally approached that of the LMWL as depth increased. The slope of the groundwater was 5.81, and the slope for 60–90 cm SWL was 5.90. These two values were the closest to each other (Fig. 4d).

Figure 5Variations in SWC among different depths during the FT periods (a middle and upper reaches; b downstream). The error bar represents the variance of the calculated results across all data points.
3.3 Characteristics of SWC variation during the FT periods
The SWC in the QLB exhibited pronounced spatiotemporal variation characteristics (Fig. 5). In the middle and upper reaches, SWC in the 0–30, 30–60, and 60–90 cm layers was 26.9 %, 28.4 %, and 31.1 %, respectively, showing an increasing trend with depth during the thawing period (Fig. 5a). During the thawed period, the SWC in the 0–30 cm layer of the middle and upper reaches of the basin was the highest (27.8 %), while that in the 30–60 and 60–90 cm layers decreased to 26.2 % and 24.5 %, respectively. During the freezing period, the differences among the layers diminished, with values of 26.9 %, 25.5 %, and 25.9 %, respectively. Throughout the QLB, SWC was lowest in the 0–30 cm layer during the thawing period, while it was relatively higher in the 30–90 cm layer. During the thawed period, the differences among the layers decreased. The SWC in the 0–30 and 30–60 cm layers rose to 26.9 % and 26.3 %, respectively, while that in the 60–90 cm layer dropped to 24.7 %. During the freezing period, SWC generally increased across all soil layers, with the 60–90 cm layer showing the most significant increase, rising to 26.7 %. In the downstream basin, SWC in the 0–30 cm layer during the thawing period was only 15.7 %, significantly lower than the 23.8 % and 23.5 % observed in the 30–60 and 60–90 cm layers, respectively (p<0.05, Fig. 5b). During the thawed period, the SWC in all layers decreased to approximately 16.0 %, and the differences among the soil layers became significantly smaller. During the freezing period, SWC in all layers increased overall, with the most pronounced increase observed in the 60–90 cm layer (28.3 %), which was significantly higher than the 22.3 % and 22.8 % in the 0–30 and 30–60 cm layers, respectively (p<0.05). Overall, SWC in the middle and upper reaches of the basin was generally higher than in the downstream basin.

Figure 6Contribution of rainfall, snowmelt, and soil water from different depths to groundwater in the QLB during the FT periods (a, b thawing; c, d, e thawed; f freezing). The error bar represents the variance of the calculated results across all data points. The x axis labels denote sampling point numbers.
3.4 Quantifying the recharge sources of groundwater during the FT periods
The MixSIAR model results indicate that groundwater recharge sources differ markedly during the FT periods (Fig. 6). During the thawing period, the contributions of soil water from the 0–30, 30–60, and 60–90 cm layers to groundwater were 25.61 %, 23.18 %, and 23.05 %, respectively, all higher than those of rainfall (16.29 %) and snowmelt water (11.88 %) (Fig. 6a, b). During the thawed period, the differences in contributions among sources (except snowmelt) diminished, with rainfall and soil water from different layers contributing 21.06 %, 21.50 %, 22.00 %, and 22.42 % to groundwater, respectively, and snowmelt water contributing 13.01 % (Fig. 6c, d). During the freezing period, the contributions from the 30–60 and 60–90 cm soil water layers rose to 25.30 % and 25.57 %, respectively. The contributions from 0–30 cm soil water, rainfall, and snowmelt water were 21.43 %, 18.34 %, and 9.33 %, respectively (Fig. 6e, f). Overall, during the FT periods, groundwater recharge was primarily sourced from soil water and precipitation, with snowmelt contributing the least. Specifically, soil water in the 60–90 cm layer contributed the most (23.15 %), followed by soil water in the 30–60 and 0–30 cm layers, which had similar contributions (22.94 % and 22.85 %, respectively). Rainfall contributed 19.02 %, while snowmelt contributed the least (12.02 %).
4.1 Effect of FT processes on groundwater recharge sources
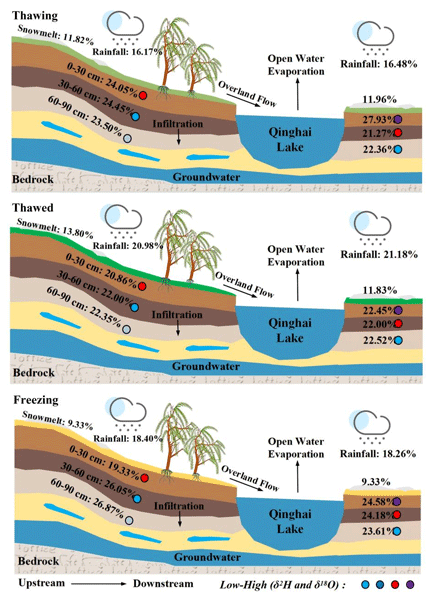
The sources and composition of groundwater recharge are influenced by a variety of factors, including meteorological conditions, topography, geological structures, and permafrost (Pavlovskii et al., 2017; Li et al., 2020; Hyman-Rabeler and Loheide, 2023). During the thawing period, groundwater in the QLB was recharged not only by precipitation but also by antecedent soil moisture storage released during the thawing process (Zhang et al., 2025), and the contribution ratios of these two sources differed significantly (Fig. 6). In the middle and upper reaches of the basin, the contributions of soil water across the three layers were relatively balanced, with rainfall and snowmelt contributing 16.17 % and 11.82 %, respectively (Fig. 7a). Although the contribution from snowmelt is relatively small, it cannot be ignored. In contrast, in the downstream basin, the contribution of soil water in the 0–30 cm layer was 27.93 %, higher than the 21.27 % in the 30–60 cm layer and the 22.36 % in the 60–90 cm layer (Fig. 7b). Overall, the direct recharge of groundwater from snowmelt is relatively weak. It is worth noting that the contribution of snowmelt water is significantly lower than that of rainfall. There are two main reasons for this. On the one hand, during the thawing period, the air temperature is low, leading to slow snowmelt (Fig. S1). On the other hand, under conditions of strong radiation and high winds, part of the snow water in the basin is lost through runoff or sublimation (Imran et al., 2025). Consequently, the proportion that is actually converted into groundwater is relatively small.

Figure 7Contribution of rainfall, snowmelt, and soil water from different depths to groundwater during the FT periods. (a) Middle and upper reaches. (b) Downstream. The error bar represents the variance of the calculated results across all data points.
During the thawed period, air temperature, precipitation, and active layer thaw depth in the QLB all reached their annual peaks. In the middle and upper reaches of the basin, the differences in contributions from various water sources to groundwater during the thawed period were relatively small (Fig. 7a). It is worth noting that the contribution of soil water from the 0–30 cm layer in the middle and upper reaches of the basin was slightly higher than that of the other two layers and also higher than that of the same layer in the downstream basin. This may be related to the fact that during the thawed period, SWC in each layer of the middle and upper reaches of the basin remained at 26.90 %–31.05 %, significantly higher than that in the downstream basin. In the downstream basin, the contribution of rainfall to groundwater rose to 21.18 %, an increase compared to the thawing period (Fig. 7b). The contribution of soil water in the 0–30 cm layer decreased from 27.93 % during the thawing period to 22.45 %, while the contributions in the 30–60 and 60–90 cm layers remained at 25.60 % and 22.50 %, respectively. However, during the thawed period, the SWC of all three layers in the downstream basin was significantly lower than that during the thawing period (Fig. 5b), indicating that antecedent soil water storage had been doubly depleted by both continuous discharge to groundwater and strong summer evaporation. In addition, with the widespread melting of snow cover in summer, the contribution rate of snowmelt to groundwater dropped to 10.60 %.
During the freezing period, the continuous decline in air temperature in the QLB led to bidirectional freezing of the active layer from both the top down and the bottom up (Hu et al., 2023), causing soil water to transition from liquid to solid state. In the middle and upper reaches of the basin, the contribution rates of rainfall and snowmelt to groundwater decreased to 18.40 % and 9.33 %, respectively, while the contribution rate of soil water from the 60–90 cm layer increased to 26.87 %, which was significantly higher than the 19.33 % from the 0–30 cm layer (Fig. 7a). The downstream basin also exhibited similar characteristics. The contribution of snowmelt was the lowest, indicating that snowfall during this period participated in subsequent hydrological cycles more as temporary storage rather than being immediately converted into groundwater recharge.
4.2 Effect of FT processes on groundwater recharge pathways
The FT processes significantly influence groundwater recharge pathways in alpine regions by controlling the active layer's thaw depth, SWC, and soil water infiltration patterns (Wang et al., 2017, 2023a). The differences in soil water recharge pathways to groundwater are mainly attributed to their distinct hydrogeological and topographical conditions. The gentle topography, low elevation, and shallow groundwater table promote preferential flow of shallow soil water along large pores and fissures, leading to rapid infiltration and groundwater recharge (Li et al., 2025b; Rowland et al., 2011) (Fig. 8).

Figure 8Graphical summary of the contributions of rainfall, snowmelt, and soil water from different depths to groundwater recharge during the FT periods.
During the thawing period, as temperatures rise, the active layer thaws gradually from top to bottom, and the water in the permafrost gradually transitions from a solid to a liquid state. Especially in the middle and upper reaches of the basin, the depth of thaw is limited at this time and the lower soil layers have not yet thawed, creating a “near-impermeable layer” that impedes vertical infiltration (Hinzman et al., 2022; Vonk et al., 2023). Consequently, snowmelt and rainfall more readily form a transient saturated zone in the shallow subsurface and migrate as interflow or shallow lateral flow (Wu et al., 2024; Xie et al., 2024), thereby delaying the recharge of groundwater by precipitation and soil water (Du et al., 2024). Subsequently, this interflow or shallow runoff may indirectly recharge groundwater through pathways such as riparian seepage and soil layer redistribution (Xu et al., 2024). Meanwhile, SWC increased sharply during the thawing period (Li et al., 2020). This is consistent with results from modeling analyses indicating that spring hydrological processes in the alpine regions of the QTP are mainly governed by a combination of active layer temperature, thaw depth, and SWC (Wang et al., 2023b). The direct contribution of snowmelt in the middle and upper reaches of the basin is relatively weak, indicating that mountain slopes respond more rapidly to warming (Jay et al., 2023). The surface thawing process, together with the large slope gradients, promotes the generation of interflow (Evans et al., 2018), thereby recharging groundwater indirectly.
During the thawed period, air temperature, precipitation, and the thaw depth of the active layer in the QLB all reached their annual peaks, while the “near-impermeable layer” that limits vertical infiltration largely disappeared (Chang et al., 2015; Starkloff et al., 2017). In particular, in the downstream seasonal frozen ground basin, the vertical connectivity of the soil profile increases substantially after complete thawing (Li et al., 2020). Furthermore, a study in the Zuomaokong River basin on the QTP shows that surface runoff also increases with rising active layer temperature (Wang et al., 2009). Under these conditions, precipitation and soil water from the 0–30 cm layer can more easily move downward through the subsoil and eventually recharge groundwater (Ji et al., 2021). However, during the thawed period, the SWC in all three soil layers in the downstream basin was markedly lower than that during the thawing period (Fig. 5), indicating that the antecedent soil water storage has been depleted by both continuous groundwater discharge and strong summer evaporation (Fig. 3c). Low SWC makes infiltrated precipitation more likely to be retained by the soil rather than directly generating lateral flow (Chowdhury et al., 2011), thereby weakening the recharge of groundwater from soil water in the 0–30 cm layer. This also indicates that, despite increased vertical connectivity, soil water in the 0–30 cm layer has a short residence time (Wallach and Shabtai, 1992; Zuo et al., 2023b) and is more prone to downward transport (Lu et al., 2025). Generally, the higher the SWC, the greater the unsaturated hydraulic conductivity. After precipitation infiltrates, excess water is more easily discharged as interflow and replenishes groundwater (Hu et al., 2022), thereby maintaining a high contribution of shallow soil water to groundwater (Li et al., 2025a).
During the freezing period, the continuous decline in air temperature in the QLB led to bidirectional freezing within the active layer from both the surface downward and from the base upward (Hu et al., 2023), causing soil water to transition from a liquid to solid state. Notably, SWC in the 0–30 cm layer across the entire basin increased compared to the thawed period (Fig. 5c). This is primarily due to the formation of a new freezing front at the surface, which inhibits the continued downward percolation of water in the shallow layers, causing water to accumulate above the freezing front (Zhang and Sun, 2011; Bao et al., 2016). At the same time, the vertical connectivity of the soil profile has not yet been completely sealed (Jiang et al., 2024), and some shallow stored water continues to recharge groundwater downward via preferential flow pathways (Pittman et al., 2020; Cheng et al., 2024), thereby explaining why soil moisture in the 30–60 cm layer continues to make a significant contribution during the freezing period. Hydrological modeling of permafrost basins has also shown that when the active layer has not yet fully frozen at freezing onset, shallow soil water can still effectively recharge groundwater (Lu et al., 2023; Wang et al., 2025c) (Fig. 8).
4.3 Preferential flow and piston flow coexist in the QLB
In the QLB, the relationship between δ18O and δ2H indicates that the GWL lies between the LMWL and the SWL, suggesting that the groundwater recharge process is not a single pattern (Fig. 4). By further comparing the lc-excess indices of groundwater and soil water in the 60–90 cm layer during the FT periods, it is found that the two are not completely consistent, indicating that the recharge process is not controlled solely by piston flow. At the same time, the lc-excess value of groundwater is similar to that of precipitation, indicating that focused recharge via fast pathways still exists (Fig. 3c). Notably, during the thawed period, the lc-excess indices of soil water and precipitation are closest (Δlc-excess from 13.43 to 9.51), indicating that the role of preferential flow is gradually increasing. A study in the source region of the Yangtze River has also found that preferential flow accounted for the largest proportion of soil water infiltration during the thawing period, which is consistent with our findings (Li et al., 2025b). The QLB landscape is mainly defined by highland mountains and lakeside plains. The area surrounding the downstream basin mainly consists of plains, which feature gentle topography and relatively shallow groundwater levels (Li et al., 2022). Consequently, as the thawing process progresses, piston flow is more likely to occur. In contrast, the middle and upper reaches of the basin have a higher elevation and is mainly composed of highland mountains. Under the combined influence of FT cycles and topographic differences (Rooney et al., 2022), surface water is more likely to generate preferential flow along fractures (Wang et al., 2018). Observations in an alpine meadow further confirm that by regulating active layer thickness, FT processes significantly alter the proportions of piston flow and preferential flow (Musa et al., 2016; Li et al., 2026). Similarly, studies at the small watershed scale on the QTP indicate that there are significant differences in the contribution of soil moisture from various slope aspects toward groundwater recharge, making the mountain recharge pattern more complex (Zhang et al., 2024). Overall, during the process of groundwater recharge from soil water, preferential flow and piston flow coexist. As thawing proceeds, the dominance of piston flow gradually weakens, while the role of preferential flow in recharging groundwater progressively strengthens.
4.4 Significance and Limitations
From an integrated perspective encompassing recharge sources, transport pathways and hydrological connectivity across the soil profile, this study systematically elucidates how FT processes regulate shallow groundwater recharge in the QLB. These findings highlight the critical role of soil water in sustaining shallow groundwater recharge in alpine regions. Against the backdrop of permafrost degradation and changing precipitation patterns, the spatiotemporal dynamics of groundwater recharge may be reorganized. Meanwhile, permafrost and seasonally frozen ground exhibit distinct responses to climate warming, resulting in differing effects on groundwater recharge. Moreover, focusing solely on rainfall sources may lead to an underestimation of the contributions of snowmelt and soil water to groundwater recharge. Although snowmelt accounts for a relatively small proportion of the total contribution throughout the FT period, its role should not be overlooked. Nevertheless, this study has three main limitations. First, the snowmelt samples were collected from the snowpack, and processes such as sublimation before snowmelt and evaporation from the soil surface after snowmelt may alter the isotopic composition of snowmelt, thereby leading to an overestimation or underestimation of its contribution to groundwater recharge (Hyman-Rabeler and Loheide, 2023; Gottlieb and Mankin, 2025). Second, during freezing, soil water transitions from the liquid phase to the solid phase. As the freezing front advances, light isotopes may be preferentially retained in the unfrozen liquid water, whereas heavy isotopes become preferentially enriched in the ice phase, resulting in isotopic fractionation and altering lc-excess, thereby complicating the identification of recharge pathways (Zhang et al., 2025). Finally, because piston flow and preferential flow coexist, water may migrate between different soil layers. Given the vertical stacking of soil layers and the continuous mixing of water from different sources, isotopic characteristics from the surface layer may be transported downward and influence the isotopic composition of deeper layers, thereby affecting the accuracy of groundwater recharge source identification. Consequently, this may introduce some error in MixSIAR modeling. Future research should integrate in situ high-frequency monitoring with a multi-tracer approach combining stable isotopes and dye tracing to accurately quantify the pathways through which soil water recharges groundwater.
In the context of climate warming, FT processes profoundly influence the groundwater recharge patterns in alpine regions. Using water isotope data and a MixSIAR model, this study systematically reveals the characteristics of groundwater recharge during the FT periods from the integrated perspective of recharge sources, transport pathways, and soil profile hydrological connectivity. The study found that during the FT periods, groundwater was recharged primarily by rainfall and soil water, while the contribution from snowmelt was relatively small. As the thawing process progresses, vertical hydrological connectivity within the soil profile continues to increase. Groundwater recharge from snowmelt, rainfall, and soil water in the 30–90 cm layer gradually intensifies. Meanwhile, the contribution from soil water in the 0–30 cm layer decreases significantly, indicating a gradual shift in groundwater recharge from shallow soil moisture to deeper soil moisture. The lc-excess value of groundwater gradually shifts from being close to that of precipitation to being close to that of soil water, reflecting the coexistence of preferential flow recharge and piston flow recharge. Spatially, in the middle and upper regions dominated by permafrost, groundwater is primarily recharged by water from the 0–60 cm soil layer traveling along longer hydrological pathways, whereas in the downstream regions of the basin dominated by seasonally frozen ground, groundwater is primarily recharged by rapid infiltration from the 30–90 cm soil layer. Overall, FT processes profoundly regulate the structure of groundwater recharge sources and transport pathways in alpine regions by controlling the connectivity among rainfall, snowmelt, soil moisture, and groundwater. Given that permafrost degradation is expected to continue to intensify in the coming years, we propose that differences among groundwater recharge sources will likely decrease, while differences among recharge pathways may increase. The results of this study provide an important research foundation for understanding groundwater hydrological processes in alpine regions amid permafrost degradation, and contribute to deepening the understanding of the water cycle in alpine regions.
All data in this study are available in Zenodo (https://doi.org/10.5281/zenodo.22153028; Zhang et al., 2026b).
The supplement related to this article is available online at https://doi.org/10.5194/hess-30-6039-2026-supplement.
WZ and XL designed the study. WZ, FS, GH, YD, and XL conducted the analyses. WZ wrote the paper. All authors discussed the results and the first draft and contributed to the final paper.
The contact author has declared that none of the authors has any competing interests.
Publisher's note: Copernicus Publications remains neutral with regard to jurisdictional claims made in the text, published maps, institutional affiliations, or any other geographical representation in this paper. The authors bear the ultimate responsibility for providing appropriate place names. Views expressed in the text are those of the authors and do not necessarily reflect the views of the publisher.
We are grateful to the editor and the anonymous reviewers for their constructive comments and suggestions, which greatly improved the quality of this manuscript.
This study was financially supported by National Natural Science Foundation of China (grant nos. 42521001 and 42330205) and the interdisciplinary Research Foundation for Doctoral Candidates of Beijing Normal University (grant no. BNUXKJC2407).
This paper was edited by Margaret Zimmer and reviewed by two anonymous referees.
Ala-Aho, P., Autio, A., Bhattacharjee, J., Isokangas, E., Kujala, K., Marttila, H., and Kløve, B.: What conditions favor the influence of seasonally frozen ground on hydrological partitioning? A systematic review, Environ. Res. Lett., 16, 043008, https://doi.org/10.1088/1748-9326/abe82c, 2021.
Alley, W. M., Healy, R. W., LaBaugh, J. W., and Reilly, T. E.: Flow and storage in groundwater systems, Science, 296, 1985–1990, https://doi.org/10.1126/science.1067123, 2002.
Bao, H., Koike, T., Yang, K., Wang, L., Shrestha, M., and Lawford, P.: Development of an enthalpy-based frozen soil model and its validation in a cold region in China, J. Geophys. Res.-Atmos., 121, 5259–5280, https://doi.org/10.1002/2015JD024451, 2016.
Biskaborn, B. K., Smith, S. L., Noetzli, J., Matthes, H., Vieira, G., Streletskiy, D. A., and Lantuit, H.: Permafrost is warming at a global scale, Nat. Commun., 10, 264, https://doi.org/10.1038/s41467-018-08240-4, 2019.
Chang, J., Wang, G., Li, C., and Mao, T.: Seasonal dynamics of suprapermafrost groundwater and its response to the freeing-thawing processes of soil in the permafrost region of Qinghai-Tibet Plateau, Sci. China Earth Sci., 58, 727–738, https://doi.org/10.1007/s11430-014-5009-y, 2015.
Cheng, Z., Wang, F., Sun, J., Ding, L., Wang, Y., and Wang, H.: Effect of seasonal freeze–thaw process on spatial and temporal distribution of soil water and its infiltration to recharge groundwater, Hydrol. Process., 38, e15110, https://doi.org/10.1002/hyp.15110, 2024.
Chowdhury, N., Marschner, P., and Burns, R.: Response of microbial activity and community structure to decreasing soil osmotic and matric potential, Plant Soil, 344, 241–254, https://doi.org/10.1007/s11104-011-0743-9, 2011.
Daniel, J. A. and Staricka, J. A.: Frozen soil impact on ground water-surface water interaction, J. Am. Water Resour. Assoc., 36, 151–160, https://doi.org/10.1111/j.1752-1688.2000.tb04256.x, 2000.
Du, F., Li, Z., Gui, J., Zhang, B., Xue, J., and Zhou, H.: Mechanisms of suprapermafrost groundwater recharge streamflow in alpine permafrost regions: insights from young water fraction analysis, Water Resour. Res., 60, e2024WR037329, https://doi.org/10.1029/2024WR037329, 2024.
Du, X., Fang, M., Lv, H., Cheng, T., Hong, P., and Liu, C.: Effect of snowmelt infiltration on groundwater recharge in a seasonal soil frost area: a case study in Northeast China, Environ. Monit. Assess., 191, 151, https://doi.org/10.1007/s10661-019-7285-7, 2019.
Evans, S. G., Ge, S., Voss, C. I., and Molotch, N. P.: The role of frozen soil in groundwater discharge predictions for warming alpine watersheds, Water Resour. Res., 54, 1599–1615, https://doi.org/10.1002/2017WR022098, 2018.
Fang, J., Yi, P., Stockinger, M., Xiong, L., and Shen, J.: Investigation of factors controlling the runoff generation mechanism using isotope tracing in large-scale nested basins, J. Hydrol., 615, 128728, https://doi.org/10.1016/j.jhydrol.2022.128728, 2022.
Gottlieb, A. R. and Mankin, J. S.: Subseasonal temperature variability drives nonlinear snow loss with warming, Water Resour. Res., 61, e2024WR039724, https://doi.org/10.1029/2024WR039724, 2025.
Hamidi, M. D., Gröcke, D. R., Joshi, S. K., and Greenwell, H. C.: Investigating groundwater recharge using hydrogen and oxygen stable isotopes in Kabul city, a semi-arid region, J. Hydrol., 626, 130187, https://doi.org/10.1016/j.jhydrol.2023.130187, 2023.
Hinzman, A. M., Sjöberg, Y., Lyon, S., Schaap, P., and van der Velde, Y.: Using a mechanistic model to explain the rising non-linearity in storage discharge relationships as the extent of permafrost decreases in Arctic catchments, J. Hydrol., 612, 128162, https://doi.org/10.1016/j.jhydrol.2022.128162, 2022.
Hornum, M. T., Bense, V., van der Ploeg, M., Kroon, A., and Sjöberg, Y.: Arctic spring systems driven by permafrost aggradation, Geophys. Res. Lett., 50, e2023GL104719, https://doi.org/10.1029/2023GL104719, 2023.
Hu, G., Li, X., Yang, X., Shi, F., Sun, H., and Cui, B.: Identifying spatiotemporal patterns of hillslope subsurface flow in an alpine critical zone on the Qinghai‐Tibetan plateau based on three‐year, high‐resolution field observations, Water Resour. Res., 58, e2022WR032098, https://doi.org/10.1029/2022WR032098, 2022.
Hu, G., Zhao, L., Li, R., Wu, X., Wu, T., Zou, D., and Li, W.: Dynamics of the freeze–thaw front of active layer on the Qinghai-Tibet Plateau, Geoderma, 430, 116353, https://doi.org/10.1016/j.geoderma.2023.116353, 2023.
Hyman‐Rabeler, K. A. and Loheide, S. P.: Drivers of variation in winter and spring groundwater recharge: Impacts of midwinter melt events and subsequent freezeback, Water Resour. Res., 59, e2022WR032733, https://doi.org/10.1029/2022WR032733, 2023.
Imran, A., Neary, L. K., Hall, R. I., and Wolfe, B. B.: Overlooked and underrated: Influence of snowmelt runoff on lake-level rise rivals river floodwaters at a cold-region freshwater delta, J. Hydrol., 134036, https://doi.org/10.1016/j.jhydrol.2025.134036, 2025.
Jasechko, S., Perrone, D., Befus, K. M., Bayani Cardenas, M., Ferguson, G., Gleeson, T., and Kirchner, J. W.: Global aquifers dominated by fossil groundwaters but wells vulnerable to modern contamination, Nat. Geosci., 10, 425–429, https://doi.org/10.1038/ngeo2943, 2017.
Jay, K. R., Wieder, W. R., Swenson, S. C., Knowles, J. F., Elmendorf, S. C., Holland‐Moritz, H., and Suding, K. N.: Topographic heterogeneity and aspect moderate exposure to climate change across an alpine tundra hillslope, J. Geophys. Res.-Biogeo., 128, e2023JG007664, https://doi.org/10.1029/2023JG007664, 2023.
Ji, W., Huang, Y., Shi, P., and Li, Z.: Recharge mechanism of deep soil water and the response to land use change in the loess deposits, J. Hydrol., 592, 125817, https://doi.org/10.1016/j.jhydrol.2020.125817, 2021.
Jiang, H., Yi, Y., Yang, K., Zhao, L., Chen, D., Kimball, J. S., and Lu, F.: Soil freeze/thaw dynamics strongly influences runoff regime in a Tibetan permafrost watershed: Insights from a process-based model, Catena, 243, 108182, https://doi.org/10.1016/j.catena.2024.108182, 2024.
Kooi, H.: Groundwater flow as a cooling agent of the continental lithosphere, Nat. Geosci., 9, 227–230, https://doi.org/10.1038/ngeo2642, 2016.
Kuang, X., Liu, J., Scanlon, B. R., Jiao, J. J., Jasechko, S., Lancia, M., and Zheng, C.: The changing nature of groundwater in the global water cycle, Science, 383, eadf0630, https://doi.org/10.1126/science.adf0630, 2024.
Landwehr, J. M. and Coplen, T. B.: Line-condition excess: A new method for characterizing stable hydrogen and oxygen isotope ratios in hydrologic systems, Isotopes in Environmental Studies, Edition: 1, IAEA, ISBN 92-0-111305-X, 2006.
Li, D. S., Cui, B. L., Zhao, Y. D., and Zuo, F. L.: Stable isotopes of water as a tracer for revealing spatial and temporal characteristics of groundwater recharge surrounding Qinghai Lake, China, J. Mt. Sci., 19, 2611–2621, https://doi.org/10.1007/s11629-022-7413-7, 2022.
Li, H., Xiang, W., Si, B., Min, M., Miao, C., and Jin, J.: Quantifying recharge mechanisms in low-hilly areas of a loess region: Implications for the quantity and quality of groundwater, J. Hydrol., 643, 131982, https://doi.org/10.1016/j.jhydrol.2024.131982, 2024.
Li, L., Christensen, J. N., Bill, M., Dong, W., Wu, Y., Beutler, C., and Gilbert, B.: Depth of nutrient uptake by deep-rooted plants is regulated by water availability, P. Natl. Acad. Sci. USA, 123, e2528407123, https://doi.org/10.1073/pnas.2528407123, 2026.
Li, X. Y., Ma, Y. J., Huang, Y. M., Hu, X., Wu, X. C., Wang, P., and Liu, L.: Evaporation and surface energy budget over the largest high-altitude saline lake on the Qinghai-Tibet Plateau, J. Geophys. Res.-Atmos., 121, 10–470, https://doi.org/10.1002/2016JD025027, 2016.
Li, Z., Li, Z., Feng, Q., Zhang, B., Gui, J., Xue, J., and Gao, W.: Runoff dominated by supra-permafrost water in the source region of the Yangtze river using environmental isotopes, J. Hydrol., 582, 124506, https://doi.org/10.1016/j.jhydrol.2019.124506, 2020.
Li, Z., Li, H., Wang, B., Gui, J., Liu, X., and Liu, F.: Increased rainfall alters soil moisture dynamics in alpine meadows, J. Hydrol., 134681, https://doi.org/10.1016/j.jhydrol.2025.134681, 2025a.
Li, Z., Xu, B., Lui, X., Li, X., Li, Z., Feng, Q., Wang, D., Zhang, W., Li, H., and Liu, F.: Infiltration mechanism and source of soil water in alpine meadows based on stable isotope tracing, Geoderma, 455, 117224, https://doi.org/10.1016/j.geoderma.2025.117224, 2025b.
Lu, B. Q., Zang, S. Y., Song, L. Q., Sun, L., Li, M., and Bing, D.: Cooling and wetting of soil decelerated ground freezing–thawing processes of the active layer in Xing'an permafrost regions in Northeast China, Adv. Clim. Change Res., 14, 126–135, https://doi.org/10.1016/j.accre.2023.01.002, 2023.
Lu, S., Zhu, G., Qiu, D., Li, R., Jiao, Y., Meng, G., Lin, X., Wang, Q., Zhang, W., and Chen, L.: Optimizing irrigation in arid irrigated farmlands based on soil water movement processes: knowledge from water isotope data, Geoderma, 460, 117440, https://doi.org/10.1016/j.geoderma.2025.117440, 2025.
McDonnell, J. J., Stewart, M. K., and Owens, I. F.: Effect of catchment‐scale subsurface mixing on stream isotopic response, Water Resour. Res., 27, 3065–3073, https://doi.org/10.1029/91WR02025, 1991.
McGuire, K. J. and McDonnell, J. J.: Hydrological connectivity of hillslopes and streams: Characteristic time scales and nonlinearities, Water Resour. Res., 46, https://doi.org/10.1029/2010WR009341, 2010.
Moore, J. W. and Semmens, B. X.: Incorporating uncertainty and prior information into stable isotope mixing models, Ecol. Lett., 11, 470–480, https://doi.org/10.1111/j.1461-0248.2008.01163.x, 2008.
Musa, A., Ya, L., Anzhi, W., and Cunyang, N.: Characteristics of soil freeze–thaw cycles and their effects on water enrichment in the rhizosphere, Geoderma, 264, 132–139, https://doi.org/10.1016/j.geoderma.2015.10.008, 2016.
Parnell, A. C., Inger, R., Bearhop, S., and Jackson, A. L.: Source partitioning using stable isotopes: coping with too much variation, PLoS One, 5, e9672, https://doi.org/10.1371/journal.pone.0009672, 2010.
Pavlovskii, I., Hayashi, M., and Lennon, M. R.: Transformation of snow isotopic signature along groundwater recharge pathways in the Canadian Prairies, J. Hydrol., 563, 1147–1160, https://doi.org/10.1016/j.jhydrol.2017.09.053, 2017.
Peng, H., Xu, W., He, Q., Yuan, Y., Wang, W., and Wang, S.: Hydrogeochemistry and isotope features in the middle and upper reaches of Buha River basin, Arid Zone Res., 32, 1032–1038, https://doi.org/10.13866/j.azr.2015.05.28, 2015.
Peng, H., Wang, Z., Luo, Y. F., Yuan, Y. J., and Wang, W. P.: Evaluation of exploitable groundwater resources in the Buha river basin based on groundwater numerical simulation, Geosci., 37, 943, https://doi.org/10.19657/j.geoscience.1000-8527.2022.031, 2023.
Phillips, D. L. and Gregg, J. W.: Source partitioning using stable isotopes: Coping with too many sources, Oecologia, 136, 261–269, https://doi.org/10.1007/s00442-003-1218-3, 2003.
Pittman, F., Mohammed, A., and Cey, E.: Effects of antecedent moisture and macroporosity on infiltration and water flow in frozen soil, Hydrol. Process., 34, 795–809, https://doi.org/10.1002/hyp.13629, 2020.
Rooney, E. C., Bailey, V. L., Patel, K. F., Possinger, A. R., Gallo, A. C., Bergmann, M., and Lybrand, R. A.: The impact of freeze–thaw history on soil carbon response to experimental freeze–thaw cycles, J. Geophys. Res.-Biogeo., 127, e2022JG006889, https://doi.org/10.1029/2022JG006889, 2022.
Rowland, J. C., Travis, B. J., and Wilson, C. J.: The role of advective heat transport in talik development beneath lakes and ponds in discontinuous permafrost, Geophys. Res. Lett., 38, https://doi.org/10.1029/2011GL048497, 2011.
Starkloff, T., Larsbo, M., Stolte, J., Hessel, R., and Ritsema, C.: Quantifying the impact of a succession of freezing-thawing cycles on the pore network of a silty clay loam and a loamy sand topsoil using X-ray tomography, Catena, 156, 365–374, https://doi.org/10.1016/j.catena.2017.04.026, 2017.
Stroeve, J. C., Notz, D., Dawson, J., Schuur, E. A., Dahl-Jensen, D., and Giesse, C.: Disappearing landscapes: The Arctic at +2.7 °C global warming, Science, 387, 616–621, https://doi.org/10.1126/science.ads1549, 2025.
Taylor, R. G., Scanlon, B., Döll, P., Rodell, M., Van Beek, R., Wada, Y., and Treidel, H.: Ground water and climate change, Nat. Clim. Change, 3, 322–329, https://doi.org/10.1038/nclimate1744, 2013.
Valdivielso, S., Turull, M., Carrero, S., Crisóstomo, B., Jurado, D., i Bassols, J. B., and Díez, S.: Isotopic characterization and recharge dynamics of Karst aquifers in a mediterranean basin, J. Hydrol. Reg. Stud., 64, 103209, https://doi.org/10.1016/j.ejrh.2026.103209, 2026.
Van Tiel, M., Aubry-Wake, C., Somers, L., Andermann, C., Avanzi, F., Baraer, M., and Yapiyev, V.: Cryosphere–groundwater connectivity is a missing link in the mountain water cycle, Nat. Water, 2, 624–637, https://doi.org/10.1038/s44221-024-00277-8, 2024.
Vonk, J. E., Speetjens, N. J., and Poste, A. E.: Small watersheds may play a disproportionate role in arctic land-ocean fluxes, Nat. Commun., 14, 3442, https://doi.org/10.1038/s41467-023-39209-7, 2023.
Wallach, R. and Shabtai, R.: Modelling surface runoff contamination by soil chemicals under transient water infiltration, J. Hydrol., 132, 263–281, https://doi.org/10.1016/0022-1694(92)90182-U, 1992.
Wang, C., Zhang, Z. Y., Fan, S. M., Mwiya, R., and Xie, M. X.: Effects of straw incorporation on desiccation cracking patterns and horizontal flow in cracked clay loam, Soil Tillage Res., 182, 130–143, https://doi.org/10.1016/j.still.2018.04.006, 2018.
Wang, G., Hu, H., and Li, T.: The influence of freeze–thaw cycles of active soil layer on surface runoff in a permafrost watershed, J. Hydrol., 375, 438–449, https://doi.org/10.1016/j.jhydrol.2009.06.046, 2009.
Wang, G., Mao, T., Chang, J., Song, C., and Huang, K.: Processes of runoff generation operating during the spring and autumn seasons in a permafrost catchment on semi-arid plateaus, J. Hydrol., 550, 307–317, https://doi.org/10.1016/j.jhydrol.2017.05.020, 2017.
Wang, J., Ouyang, W., Liu, X., and Wang, L.: Monitoring hydrological changes with satellite data: Spring thaw's effect on soil moisture and groundwater in seasonal Freezing-Thawing zones, J. Hydrol., 626, 130365, https://doi.org/10.1016/j.jhydrol.2023.130365, 2023a.
Wang, J., Hao, X., Liu, X., Ouyang, W., Li, T., Cui, X., and Jin, R.: Groundwater–surface water exchange affects nitrate fate in a seasonal freeze–thaw watershed: Sources, migration and removal, J. Hydrol., 654, 132803, https://doi.org/10.1016/j.jhydrol.2025.132803, 2025a.
Wang, L., Ma, Y., Li, Y., Wang, D., An, J., Shao, Y., and Gao, G.: Responses of leaf-level physiological traits and water use characteristics to drought of a xerophytic shrub in northern China, J. Hydrol., 658, 133204, https://doi.org/10.1016/j.jhydrol.2025.133204, 2025b.
Wang, T., Yang, D., Yang, Y., Zheng, G., Jin, H., Li, X., and Cheng, G.: Unsustainable water supply from thawing permafrost on the Tibetan Plateau in a changing climate, Sci. Bull., 68, 1105–1108, https://doi.org/10.1016/j.scib.2023.04.037, 2023b.
Wang, Z., Shi, X., Shu, L., Yin, X., Zhou, K., and Xu, P.: Quantifying climate factor contributions to groundwater level changes under different soil freezing-thawing states with the WT-PCMCI model, J. Hydrol., 656, 132997, https://doi.org/10.1016/j.jhydrol.2025.132997, 2025c.
Wu, H., Song, F., Min, L., Li, J., Shen, Y., Huang, Y., and Fu, C.: Exploring recharge mechanisms of soil water in the thick unsaturated zone using water isotopes in the North China Plain, Catena, 234, 107615, https://doi.org/10.1016/j.catena.2023.107615, 2024.
Wu, M. H., Chen, S. Y., Chen, J. W., Xue, K., Chen, S. L., Wang, X. M., and Wang, Y. F.: Reduced microbial stability in the active layer is associated with carbon loss under alpine permafrost degradation, P. Natl. Acad. Sci. USA, 118, e2025321118, https://doi.org/10.1073/pnas.2025321118, 2021.
Xie, S., Zeng, C., Zhang, F., Wang, G., and Xiao, X.: Defining lateral subsurface flow and identifying its water sources in an alpine-permafrost hillslope, Catena, 236, 107765, https://doi.org/10.1016/j.catena.2023.107765, 2024.
Xie, S., Xie, Y., Zhang, Y., Li, J., Wang, G., and Zeng, C.: Connecting effects of precipitation, soil hydrological processes, and groundwater dynamics in a continuous permafrost catchment on runoff of northeastern Qinghai-Tibet Plateau, Glob. Planet. Change, 105396, https://doi.org/10.1016/j.gloplacha.2026.105396, 2026.
Xu, P., Weng, B., Gong, X., Xia, K., Yan, D., and Wang, H.: Estimation of shallow groundwater recharge in central Qinghai-Tibet Plateau by combining unsaturated zone simulation and improved water table fluctuation method, J. Hydrol., 630, 130689, https://doi.org/10.1016/j.jhydrol.2024.130689, 2024.
Young, N. L., Lemieux, J. M., Delottier, H., Fortier, R., and Fortier, P.: A conceptual model for anticipating the impact of landscape evolution on groundwater recharge in degrading permafrost environments, Geophys. Res. Lett., 47, e2020GL087695, https://doi.org/10.1029/2020GL087695, 2020.
Zhang, G., Nan, Z., Hu, N., Yin, Z., Zhao, L., Cheng, G., and Mu, C.: Qinghai-Tibet Plateau Permafrost at Risk in the Late 21st Century, Earths Future, 10, e2022EF002652, https://doi.org/10.1029/2022EF002652, 2022.
Zhang, G., Mu, C., Zhang, Y., Zhu, X., Zhao, Y., and Nan, Z.: Quantifying the impacts of increasing light and moderate rainfall on permafrost thermal regimes over the Qinghai-Tibet Plateau: A controlled sensitivity study, J. Hydrol., 134926, https://doi.org/10.1016/j.jhydrol.2026.134926, 2026a.
Zhang, W., Li, X., Deng, Y., Hu, G., and Shi, F.: Datasets for “Freeze-thaw processes influence shallow groundwater recharge sources and pathways in the Qinghai Lake Basin: insights from water isotopes”, Zenodo [data set], https://doi.org/10.5281/zenodo.22153028, 2026b.
Zhang, X. and Sun, S.: The impact of soil freezing/thawing processes on water and energy balances, Adv. Atmos. Sci., 28, 169–177, https://doi.org/10.1007/s00376-010-9206-0, 2011.
Zhang, Y., Li, X. Y., Shi, F., Zhang, X., Hu, G., Zuo, F., and Liu, X.: Spatiotemporal variability of dissolved carbon and sources of dissolved inorganic carbon influenced by freeze–thaw and subsurface flow in an alpine headwater catchment of the Qinghai-Tibetan Plateau, J. Hydrol., 640, 131740, https://doi.org/10.1016/j.jhydrol.2024.131740, 2024.
Zhang, Y., Li, X. Y., and Liu, F.: Seasonal soil water origins and determinants in an alpine hillslope on the northeastern Qinghai-Tibet Plateau, Geoderma, 454, 117190, https://doi.org/10.1016/j.geoderma.2025.117190, 2025.
Zhao, D. and Wu, S.: Projected changes in permafrost active layer thickness over the Qinghai‐Tibet Plateau under climate change, Water Resour. Res., 55, 7860–7875, https://doi.org/10.1029/2019WR024969, 2019.
Zhao, Y., Zheng, C., Gelfan, A., Watanabe, K., Liu, H., Wright, S., and Jiao, W.: Frozen soil hydrological processes and their effects: A review and synthesis, Rev. Geophys., 64, e2024RG000839, https://doi.org/10.1029/2024RG000839, 2026.
Zuo, F., Li, X., Yang, X., Jiang, Z., Li, Z., and Wang, Y.: Correlations of the root–shoot ratio with soil water content in the patchy alpine grassland of the north‐eastern Qinghai–Tibetan Plateau using electrical resistivity tomography, Ecohydrol., 16, e2593, https://doi.org/10.1002/eco.2593, 2023a.
Zuo, F., Li, X., Yang, X., Shi, F., Ma, Y., and Ouyang, W.: Subsurface structure regulates water storage in the alpine critical zone on the Qinghai-Tibet Plateau, J. Hydrol., 627, 130357, https://doi.org/10.1016/j.jhydrol.2023.130357, 2023b.