
the Creative Commons Attribution 4.0 License.
the Creative Commons Attribution 4.0 License.
 | 14 Sep 2026
Impacts of Mediterranean snow droughts on mountain socio-ecohydrology
Francesco Avanzi

Stefano Terzi
Mariapina Castelli
Francesca Munerol
Margherita Andreaggi
Marta Galvagno
Andrea Galletti
Tessa Maurer
Christian Massari
Grace Carlson
Manuela Girotto
Giacomo Bertoldi
Edoardo Cremonese
Simone Gabellani
Umberto Morra di Cella
Marco Altamura
Lauro Rossi
Luca Ferraris
Snow droughts, defined as periods with below-normal Snow Water Equivalent, have recently received substantial attention as an emerging hazard in a warming world, but their impacts are still poorly understood. Here, we shed light on these impacts across the socio-ecohydrologic spectrum, by leveraging heterogeneous data sources from 38 catchments in Italy: 13 years of snow and runoff data, remote-sensing and in-situ measurements of Gross Primary Production, an inventory of emergency water restrictions obtained via a web-scraping tool and direct consultation of national to local regulations, and a survey among 113 mountain huts. We found that the majority of snow droughts in our sample were warm-dry (53 %), that is, the combination of higher-than-usual temperatures and low precipitation, followed by warm-wet snow droughts (22 %). These events resulted in the snow season being shortened by as much as one month across all elevations, more melt-out events compared to non-snow-drought years, approximately −50 % summer runoff, and a decline in runoff ratio. Notably, growing-season Gross Primary Production of vegetation after a snow drought was up to 10 % higher than after a non-snow-drought winter, particularly above 1500 m, which ground-based data suggest was due to an earlier meltout of snow leading to an earlier-than-usual greening date. By focusing on the recent 2022 and 2023 snow droughts, we also found that water-supply restrictions were issued at all elevations, but particularly across foothills rather than floodplain regions. Meanwhile, about 70 % of hut managers at elevations above 2000 m reported water-supply impacts, with 28 % of them even reporting earlier closing dates. Overall, snow droughts emerge as a deeply multi-sectorial and multi-elevation risk, interconnecting the cryosphere with hydrology, ecology, and society.
- Article
(5982 KB) - Full-text XML
-
Supplement
(354 KB) - BibTeX
- EndNote


Seasonal snow has profound implications for life on Earth (Sturm et al., 2017). Perhaps one of the best known of these implications is its critical role as a water resource (Serreze et al., 1999; Barnett et al., 2005). By acting as a seasonal reservoir accumulating water during winter and then releasing it during summer, snow supports water security when demand peaks but precipitation declines (Bales et al., 2006; Viviroli et al., 2020; Avanzi et al., 2024). This buffering mechanism affects virtually all aspects of mountain hydrology (Goulden et al., 2012; Harrison and Bales, 2016; Bales et al., 2018; Oroza et al., 2018; Avanzi et al., 2020, 2021; Kraft and McNamara, 2022; Sprenger et al., 2022; Girotto et al., 2024; van Tiel et al., 2024).
Beyond hydrology, snow also drives ecosystem functioning via fertilization and nutrient pulsing, as well as by maintaining stable soil-temperature conditions (Filippa et al., 2014), thus creating essential ecological niches (Galvagno et al., 2013; Di Mauro et al., 2017). Snow comparatively high albedo contributes to the regulation of the global climate (Dietz et al., 2012; Flanner et al., 2011) and is linked to various teleconnection systems, such as the Asian summer monsoon and El Niño-Southern Oscillation (Barnett et al., 1988). From a societal standpoint, snowpack sustains winter tourism (Unbehaun et al., 2008), hydropower production (Schaefli et al., 2007), and the fulfillment of irrigation-water requirements (Qin et al., 2020; Carlson et al., 2025), which are all sectors with distinct seasonal patterns that would be often untenable without snow.
A warming world with declining snow water resources disrupts this historical equilibrium between hydrology, ecology, and society (Hamlet et al., 2005; Mote et al., 2018; Bozzoli et al., 2024; Musselmann et al., 2017), especially because mountain regions are experiencing amplified warming compared to lowlands (Mountain Research Initiative EDW Working Group, 2015; Pepin et al., 2025). These long-term trends are making mountain regions exposed to unprecedented new risks (Viviroli et al., 2011; Adler et al., 2022). Snow droughts are one such emerging risk: defined as periods with below-normal snow accumulation due to low precipitation and/or high temperatures (and thus below-normal Snow Water Equivalent, see Harpold et al., 2017; Hatchett and McEvoy, 2018; Huning and AghaKouchak, 2020; Gottlieb and Mankin, 2022), snow droughts significantly reduce spring-to-summer runoff (Barnett et al., 2008; Livneh and Badger, 2020; Hammond et al., 2024; Han et al., 2025), decrease runoff efficiency (Rhoades et al., 2022; Hammond et al., 2024; Han et al., 2025), and alter water transit time compared to normal to wet years (Segura, 2021). These events have cascading effects across the water budget that can translate into water crises (Huning and AghaKouchak, 2020; Hammond et al., 2024; Viviroli et al., 2026). These crises may materialize months – or even years – after the peak in snow-drought intensity, depending on the duration of the snow drought itself, the concurrent status of surface and subsurface storage, and when and where the deficit in snow water resources translates into an actual snowmelt deficit (Avanzi et al., 2024).
While the phenomenology of snow droughts as SWE deficit has been established more than 10 years ago (Harpold et al., 2017; Hatchett and McEvoy, 2018), understanding of their impacts remains very sparse and unclear (Huning and AghaKouchak, 2020). This knowledge gap is ubiquitous in drought research (Stahl et al., 2016) and can be explained by the inherent complexity of this hazard, which spans multiple spatial and temporal scales, various sectors, and both direct and indirect impacts. System vulnerability, root causes, inequalities, and governance choices play an additional, non-linear role in mediating the hazard into risk (Hagenlocher et al., 2023; Biella et al., 2025; Toreti et al., 2024). In the case of snow droughts, a distinctive complication arises from the geographic and temporal imbalance between the hazard (i.e. snow deficit in the headwaters) and the potentially affected sectors (mostly in lowlands). This discrepancy is compounded by the remoteness and topographical complexity of the mountainous regions where the hazard originates (Viviroli et al., 2007; Hanus et al., 2024).
Managing snow-drought water crises necessitates a better understanding of their multi-sectoral impacts. Given that mountains are hotspots of water, biodiversity, and culture (Viviroli et al., 2007), doing so requires acknowledging the socio-ecohydrological complexity of snow-drought impacts – across disciplines, scientific fields, and backgrounds. Embracing this perspective is urgent, as it is critical to identifying adaptation strategies that address the cascading effects of ongoing and future snow droughts on both mountain and downstream regions (Viviroli et al., 2020). Some major knowledge gaps in this regard include the magnitude of runoff decline beyond SWE deficits, vegetation response patterns (e.g. whether photosynthetic activity increases or decreases after a snow drought), and the implications for downstream water allocations – particularly how, when, and where such impacts may necessitate emergency measures to mitigate or prevent water crises (Huning and AghaKouchak, 2020; Avanzi et al., 2024).
Here, we aim to shed further light on the impacts of snow droughts by answering three research questions: (i) what is the signature of snow droughts on snow-cover duration and runoff efficiency? (ii) do snow droughts lead to an increase or a decrease in GPP and, if so, what are its spatio-temporal patterns? (iii) What are the temporal characteristics of water-supply and societal impacts of snow droughts across an elevation gradient? In order to do so, we integrated multiple datasets that span 38 headwater catchments across Italy and 13 water years (2011–2023): snow and runoff observations; remote-sensing and in-situ estimates of Gross Primary Production (GPP); an inventory of emergency water restrictions compiled through web scraping (Terzi et al., 2025) and direct consultation of national, regional, and local regulations (Avanzi et al., 2024); and a survey of snow-drought impacts on 113 mountain huts. Although these datasets may appear heterogeneous, their combined breadth is essential to frame snow droughts as a multisectoral hazard and to advance their adaptive management.
We selected Italy as a representative case of a region transitioning from Mediterranean to continental conditions (Rossi and Benedini, 2020). Mediterranean climates are especially susceptible to snow droughts because of the seasonal mismatch between water supply in the cool, wet months and water demand in the hot, dry months (Feng et al., 2019; Avanzi et al., 2020). Over time, both ecosystems and human societies in these regions have adapted to this imbalance by depending on storage as a critical mechanism to maintain evapotranspiration and water availability across seasons (Bales et al., 2018; Bruno et al., 2022). Yet, shrinking snow-derived water resources, together with drought events that are becoming more frequent and spatially extensive, are endangering this essential surface-storage component of local to regional water budgets (Bertoldi et al., 2023; Koehler et al., 2022; Lorenzi et al., 2022; Carrer et al., 2023; Colombo et al., 2023). These dynamics closely mirror conditions in other mountain regions worldwide, where snow is a key hydrological component and is undergoing comparable long-term declines (Bales et al., 2018; Hanus et al., 2024).
2.1 Study region
Italy covers approximately 300 000 km2 and is marked by high topographic, ecologic, and governance complexity. The main mountain ranges are the Alps in the north, which form a sharp rain shadow between the Mediterranean Sea and the European Plain, and the Apennines, which run along the Italian peninsula from north to south and are an additional orographic barrier between the western Mediterranean Sea and the Balkans-Siberian region. Average elevations are higher in the Alps, which host some of the highest peaks in Europe (e.g. Mont Blanc – 4808 m above sea level, a.s.l.; Monte Rosa – 4634 ; and Gran Paradiso – 4061 ), than in the Apennines, where the highest peak is the Corno Grande −2914 The climate is predominantly Mediterranean in the central and southern parts of the country, with cool-wet winters and warm-dry summers, and transitional to continental in the north, with a cold-wet autumn-to-spring season and a warm-dry summer (Peel et al., 2007).
Italy's mountainous regions exhibit clear altitudinal vegetation gradients: mixed deciduous forests (e.g. various oak, ash, and maple species) with secondary open hilly grasslands occupy lower sub-Mediterranean to montane belts (∼400–1000 m), transitioning to beech-dominated montane forests and secondary open montane grasslands (∼700–1800 m) and to conifer-rich subalpine zones (spruce, larch, Swiss stone pine) with alpine grasslands and shrub communities above the treeline. These vertical successions reflect distinct ecological niches shaped by topographically modulated climate factors, i.e. temperature, moisture and seasonality (Baglioni et al., 2025; Redowan, 2015; Fattorini, 2024).
From a water-resources standpoint, Italy hosts approximately m3 of water in the form of snow at peak accumulation, which generally occurs in early March (period: 2011–2021, see Avanzi et al., 2022). This volume is part of m3 of mean annual precipitation (1991–2020, see Mariani et al., 2024) across the country as a whole. While the proportion of SWE over total precipitation may appear small at national scale (∼4 %), the relative contribution of snowfall over total precipitation significantly increases in mountain regions (exact numbers on this proportion are missing, but Bozzoli et al., 2024, show that annual fresh snow can be as high as 2–4 m above 500 ). This together with the seasonal precipitation imbalance of the Mediterranean climate mean that peak SWE can be as high as 60 % of annual streamflow in mountain headwaters (Avanzi et al., 2023), and thus represent a critical factor in supporting water resources over the dry summer months in nearby lowland regions – both via surface runoff and as a source of groundwater recharge (Carlson et al., 2025; van Tiel et al., 2024). Orographic gradients are strong, with precipitation at ∼1500 reaching up to twice that at sea level (Napoli et al., 2019), while measured peak SWE at ∼3000 can be up to 9 times winter precipitation at 1000 (Avanzi et al., 2021; Girotto et al., 2024). Overall, roughly 50 % of incoming precipitation is allocated to evapotranspiration (ET), with the rest available for storage and runoff (Bruno et al., 2022).
The predominant water use is agriculture (56 %), followed by freshwater supply (31 %) and industrial use (13 %, Mariani et al., 2024). Water management in Italy is multi-scale owing to a hybrid centralized-federal governance paradigm where responsibilities are distributed between the national government and local authorities (Rossi and Benedini, 2020). Two relevant classes of local authorities in this context are the 21 regional/autonomous-province authorities and the 7 watershed districts, which are collectively responsible for water-resources management and flood control in their respective area of interest (Sansone, 2024). In addition to the above, all levels of government can issue emergency measures, including emergency water-use restrictions by local mayors (in Italian, “ordinanze sindacali”). According to the Italian law, these measures must be justified by unforeseen and urgent events and are the most localized (and thus most spatially distributed) form of emergency water-resources management in Italy (Avanzi et al., 2024). These “ordinanze sindacali” will be our main focus with regard to societal impacts.
2.2 Data
2.2.1 Hydro-meteorology
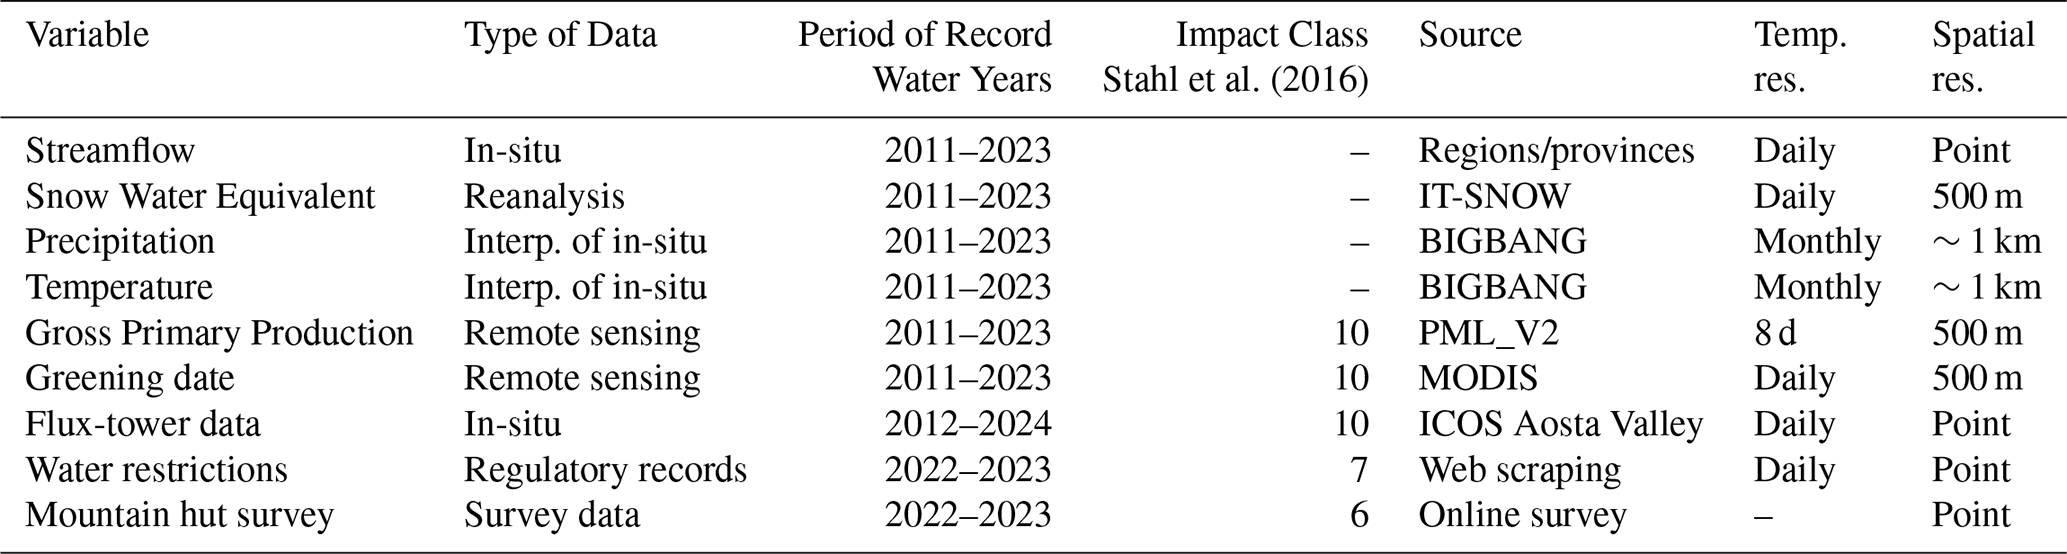
A summary of all data used in this paper, along with the period of record, data type, source, impact class, and resolution is available in Table 1.
Stahl et al. (2016)Table 1Overview of study variables, type of data, periods of record in water years (September to August), impact classes, data sources, and resolution (see the text and the data-availability section for references). Regarding impact classes, 10 stands for “Terrestrial ecosystems”, 7 for “Public water supply”, and 6 for “Tourism and recreation”.
We obtained streamflow data by blending two main sources: (i) the databases of Italy's 21 Regional Administrations and Autonomous Provinces, made accessible to CIMA Research Foundation via the Italian Civil Protection system, and (ii) a comprehensive hydrological dataset covering the Alpine region for the period September 2004 to August 2023 (https://edp-portal.eurac.edu/geonetwork/srv/api/records/9e195271-02ae-40be-b3a7-525f57f53c80, last access 17 April 2025). Based on data availability at the time of the study, we focused here on the period of record 1 September 2010 through 31 August 2023.
Across more than 350 streamflow gauges that were available, we selected a subset of study catchments based on the following criteria: first, the time series of daily mean streamflow contained less than 20 % missing data for the period 2011–2023; second, the same time series did not exhibit spikes or suspicious values based on a visual inspection of the daily data (with suspicious values qualitatively defined as persistent periods of unseasonably or implausibly high or low streamflow based on expert knowledge); and third, the ratio between mean annual, basin-wide SWE estimated by the IT-SNOW reanalysis (Avanzi et al., 2022) and cumulative annual streamflow during 2011–2023 was at least 5 %. The first two criteria ensured a high level of data completeness and quality while the third aimed to identify mountainous headwater catchments where snow significantly contributes to the water balance. In cases where more than one gauging station along the same river fulfilled all of the above requirements, we selected the one most upstream in order to focus our study specifically on mountain headwaters and to avoid the presence of nested catchments in our sample.
The final sample was composed of 38 catchments across the whole of the Italian latitudinal range. While most catchments were located in the Alps, additional coverage included the Apennines, a considerably less studied region of the Italian mountain landscape (see Fig. 1a). Median catchment size was 430 km2, with first and third quartiles equal to 200 and 870 km2, respectively. In terms of elevation, the median value across all catchments was 1830 , with first and third quartiles equal to 1270 and 1956 , respectively. Thus, the investigated catchments represent small-to-medium headwater river systems: for reference, the catchment areas at the sea outlet of the Po, Adige, and Tiber rivers, three of the largest rivers in Italy, are 71 000, 12 200, and 17 375 km2, respectively.
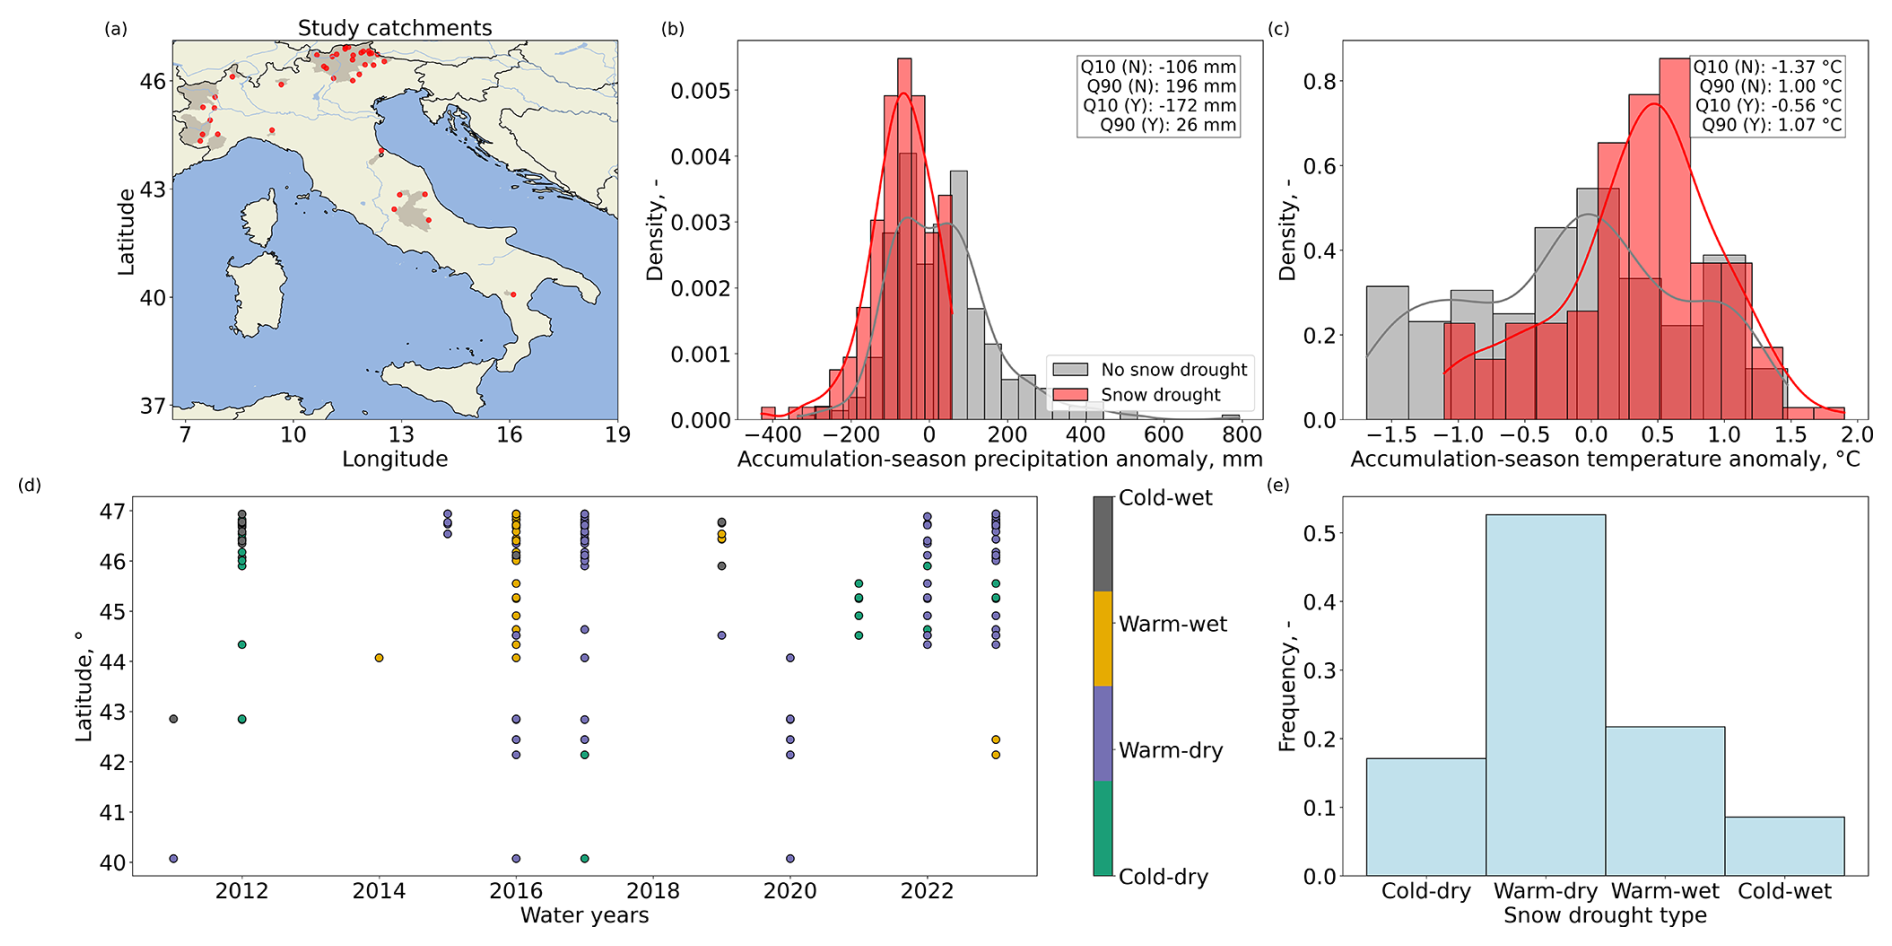
Figure 1Inventory of snow droughts across 38 headwater catchments in Italy, water years 2011–2023. Panel (a) reports the 38 catchments in gray, while red dots represent their respective watershed outlets. Panels (b) and (c) report histograms of anomalies in cumulative snow-season (December–April) precipitation and average snow-season temperatures for all catchments, snow-drought vs. non-snow-drought water years. Panel (d) is a climatology of snow-drought types for all 38 study catchments, ranked by the latitude of the streamflow gauge used in this study. Panel (e) shows the frequency distribution of the four snow-drought classes across all snow droughts in our dataset.
Spatially distributed SWE for the same 2011–2023 period was taken from the IT-SNOW reanalysis, an open-source, quasi-real-time, operational reanalysis of snow-cover patterns across Italy at 500 m and daily resolution (Avanzi et al., 2022). IT-SNOW has been extensively validated using both in-situ and remote-sensing data, typically returning root mean square errors (RMSE) on the order of 30–60 cm and 90–300 mm for in situ, measured snow depth and SWE, respectively. While these accuracies may appear large compared to the application of a snow model at the local scale (see for example Magnusson et al., 2014; Blandini et al., 2025), they are in line with other similar large-scale reanalyses across the world (Avanzi et al., 2022). The reanalysis is currently available for the period 1 September 2010 through 31 August 2025 (https://doi.org/10.5281/zenodo.6861722, Avanzi et al., 2025) and is constantly updated at the end of each water year (here defined as the period between 1 September and the following 31 August, labeled using the calendar year when it ends).
Monthly cumulative precipitation and average air temperatures were taken from the BIGBANG dataset, which provides quality-controlled estimates of the most essential water-balance variables across Italy at 1 km for the period of record 1951 to the near present. Both variables are derived from the interpolation of 2000+, quality-checked, in-situ stations across Italy (Braca and Ducci, 2018). Precipitation maps are the result of a Natural-Neighbor algorithm as implemented in the Spatial Analyst of ESRI ArcGIS 10.3; a double interpolation is performed to filter out precipitation values below 1 mm. Air temperature maps are derived using a Double-Kriging approach that includes elevation and latitude as additional predictors (Braca et al., 2021).
2.2.2 Terrestrial-ecosystem impacts
For terrestrial-ecosystem impacts, we selected the remote-sensing-based GPP dataset integrated into the Penman–Monteith–Leuning Evapotranspiration product, PML_V2, with a resolution of 500 m and an 8 d interval. PML_V2 is estimated by a process-based water-carbon coupled model which uses vapor pressure deficit as a proxy of moisture stress (Gan et al., 2018; Zhang et al., 2019). The PML_V2 products demonstrate strong performance when compared to observations at 95 flux sites worldwide, including 10 plant functional types and a wide range of climatic conditions worldwide. Validation was performed using a leave-one-out method, with Nash–Sutcliffe Efficiency (NSE)=0.76, R2=0.77, and RMSE=1.99 for 8 d GPP. Seven of the calibration and validation sites were in Italy, where the PML_V2 GPP exhibited better performances than other global models, with NSE=0.40, R2=0.68, and RMSE=2.49 on average. This performance is comparable to, or outperforms, major state-of-the-art ET and GPP products that are extensively utilized by the water and ecology research communities (Zhang et al., 2019).
In addition to GPP, we also analyzed the greening date, as day of the calendar year, which was derived from the “Greenup” layer of the MODIS product MCD12Q2v061 (Friedl et al., 2022). This refers to the first date when the Enhanced Vegetation Index (EVI2) exceeded 15 % of the EVI2 amplitude within the greenup segment (Gray et al., 2019). GPP and phenology timeseries for the target catchments were obtained from Google Earth Engine (collections “CAS/IGSNRR/PML/V2_v018” and “MODIS/061/MCD12Q2” respectively).
We complemented these remote-sensing data on terrestrial-ecosystem impacts with two ground-based case studies of GPP measured with flux towers: the first located in a European larch forest (Larix decidua Mill.), IT-TrF (45°49′25.641′′ N, 7°33′39.131′′ N, Oddi et al., 2022) and the second in a subalpine grassland dominated by matgrass (Nardus stricta), IT-Tor (45°50′40′′ N, 7°34′41′′ N, Galvagno et al., 2013). Both sites are part of the Integrated Carbon Observation System (ICOS) and are located in Aosta Valley (western Italian Alps) at 2160 m. In the last 20 years, no land management interventions or major disturbance have occurred at either site. As described in Oddi et al. (2022), the forest site is dominated by European larch (Larix decidua Mill., 92 % by relative abundance as a percentage of cover), with sporadic (8 %) Norway spruce (Picea abies (L.) H.Karst) individuals. Larch trees have no needles during dormancy, from nearly November to April/May. The forest understory is mainly composed of shrubs (Juniperus communis Willd., Rhododendron ferrugineum L., Vaccinium myrtillus L.). The grassland site is an abandoned mountain pasture, with dominant vegetation composed of Nardus stricta L., Festuca nigrescens All., Arnica montana L., Carex sempervirens Vill., and other minor species. Measurements of H2O and CO2 fluxes have been carried out since 2008 at the grassland site and since 2012 at the forest site by means of the eddy covariance technique (Baldocchi, 2003). More details on measurement devices are available in Sect. S3 in the Supplement. The period of record for these flux-tower data went from water years 2012–2024 based on data availability.
Collectively, these datasets contribute to the terrestrial-ecosystem category of the classification by the European Drought Impact Report Inventory (EDII, see Stahl et al., 2016): 10.5 “Reduced plant growth” and 10.6 “(Mid-/long-term) deterioration of habitats”.
2.2.3 Societal impacts
Societal drought impacts were characterized using a dataset of emergency water-use restrictions issued by mayors. This dataset was built by blending two sources. The first is the inventory developed by Avanzi et al. (2024) by manually surveying online catalogues of such restrictions as maintained by regional administrations; peripheral water-resources-management agencies (e.g. Ambiti Territoriali Ottimali, the public bodies in charge of local-to-regional freshwater-supply management in Italy); and municipal repositories (in Italian, “Albi Comunali”). This survey generated an initial list of 886 water-use restrictions for the Po River basin in 2022, the most severe drought in this region since the 1800s (Montanari et al., 2023).
This first dataset was then blended with a list of 76 658 news articles collected by automated scraping of Google News during 2022 and 2023 (Terzi et al., 2025). The implementation of the web scraper is described in the Supporting Information (Sect. S1) and yielded 76 658 articles that were then filtered according to whether they contained the word “decree” (i.e. “ordinanza”) in their title or main body as well as based on the names of those regions or provinces they applied to, eliminating those that did not belong to the Alps or the Appennines (and would thus not be related to snow droughts). This process led to a set of 2054 articles. This web-scraped dataset was finally manually checked by the authors following a set of defined rules for extracting the municipality names for which a decree of restriction was explicitly issued (see again Sect. S1). The dataset resulting from the manual annotation was comprised of 919 news articles.
Blending the two datasets (the first resulting from the manual survey and the second from the web scraper) was performed by removing duplicate news items, such as those pointing to the same municipality or those published very close in time to each other (i.e. within less than 30 d). The resulting dataset identified 1291 municipalities that issued a local decree for water restriction during 2022 and 2023 across Italy. The majority of these decrees covered areas outside our 38 study catchments, which was intentional for two reasons: first, to gain a broader regional perspective and second, to capture the full elevation gradient of emergency water-use restrictions, including areas at lower altitudes than the 38 study catchments.
In order to monitor societal impacts across high-elevation areas that were not monitored by our water-restriction inventory (say, above 1500 m), we also performed an ad-hoc impact survey for mountain huts, that is,e accommodation facilities for hikers providing freshwater supply, refreshment, and overnight-stays. In the European Alps, mountain huts are not only the most iconic component of tourism at high elevations, but also a key driver of high-elevation mountain economy and, often, the only source of fresh-water supply for humans at those elevations (Beltramo et al., 2022). Survey questions were organized in five sections: (i) hut name, coordinates, and elevation; (ii) observed recent changes in water-supply patterns as well as other long-term changes to flora and fauna; (iii) information on seasonal opening and closing dates, both on average and specifically for 2022 and 2023, the two most recent snow droughts in Italy (see Sect. 3); and (iv) information on water-supply methods and storage options. Section (ii) of the survey included a question on the number of years of management of the respondent as a way to quantify their “period of record”. The survey was distributed via email to all guarded huts belonging to the Italian Alpine Club (Club Alpino Italiano, https://www.cai.it/, last access 18 May 2025) and is summarized in the Supporting Information (Sect. S2). We received 113 answers, both from the Alps (where the vast majority of mountain huts are located) and from the Apennines (about 20 % of response rate).
Both sources of impact data regarding society (emergency water-use restrictions and impacts on huts) are restricted to the period 2022–2023, thus covering a shorter period compared to all other data sources in this paper (see Table 1). For the former, this limitation was related to the massive amount of information to be manually processed, which restricted this research to the most recent (and locally most intense) drought. Regarding the latter, we chose to limit our survey to hut managers to the most recent drought episode at the time of our survey and so those years for which recollection of impacts would be strongest.
Collectively, these datasets contribute to the public-water-supply (7.1 “Local water supply shortage / problems”, 7.3 “Bans on domestic and public water use”, 7.4 “Limitations in water supply to households in rural areas”, and 7.5 “Limitations in water supply to households in urban areas”) and the tourism-recreation categories of the classification by the European Drought Impact Report Inventory (EDII, see Stahl et al., 2016).
2.3 Analyses
2.3.1 Snow-drought inventory
We performed a snow-drought inventory for our 38 catchments across the 2011–2023 water years by first computing basin-wide average SWE between 1 December–30 June for each water year and each catchment (this period was chosen according to the typical climatology of snow seasons across elevation bands in Italy as discussed in Avanzi et al., 2022). A snow-drought water year for a given catchment was then defined as one in which this mean SWE fell below the 30th percentile, following Hatchett et al. (2022).
In parallel, we also computed basin-wide cumulative precipitation and average temperature during the typical accumulation period (December–April) for each catchment and water year using the BIGBANG dataset. These variables were used to classify snow-drought water years by catchment (hereafter, simply snow droughts) into three categories: (i) cold-dry snow droughts, when both cumulative accumulation-period precipitation and mean accumulation-period temperature were below the median; (ii) warm-dry snow droughts, when accumulation-period mean temperature was above the median but precipitation remained below the median; and (iii) warm-wet snow droughts, when both variables were above the median. Additionally, we identified a small fraction of cold-wet snow droughts, a rare condition where SWE was below the 30th percentile despite mean accumulation-period temperature being below the median and precipitation above the median.
In the literature, multiple methods have been proposed to classify snow-drought years (Gottlieb and Mankin, 2022). Some approaches use SWE on a specific date and compare it to climatological averages (Hammond et al., 2024), whereas others rely on mean or daily SWE falling below a given percentile (Hatchett et al., 2022). Thresholds based on SWE are frequently combined with analogous thresholds on precipitation or temperature to further distinguish snow-drought types, as done in this study (Hatchett et al., 2017; Cowherd et al., 2023). The selection of both the snow-drought metric and the SWE variable (e.g. mean SWE, peak SWE, or 1 April SWE) inevitably affects whether a given year is classified as experiencing a snow drought (Gottlieb and Mankin, 2022). Although there is still no scientific consensus on a universal definition of snow drought, we opted for average SWE instead of peak SWE because marginal, Mediterranean snowpacks tend to be short-lived (López-Moreno et al., 2024), often resulting in multiple “peak” values within a single season. We further evaluated whether using peak SWE instead of average SWE would substantially change our results and found 82 % agreement between the two metrics, largely due to their strong correlation (mean correlation coefficient of 0.94 across all catchments). Finally, as we elaborate in Sect. 3, our definition and the resulting set of snow-drought years correspond closely with our understanding of years characterized by low snow accumulation in the Italian mountains, providing indirect support for our methodological choices.
In this study, each water year was treated as independent from all others, and snow droughts were defined on an annual basis. Consequently, multi-year snow drought events are not explicitly analyzed. Furthermore, only a single snow drought event was identified per water year, and the entire water year was classified as a snow-drought year according to this criterion.
2.3.2 Hydro-meteorology
We characterized the phenomenology of snow droughts in terms of snow-water resources using three metrics: average snow-season SWE (December to June), snow-season duration, and number of seasonal melt-out episodes. For average snow-season SWE, we computed mean SWE between 1 December–30 June, including no-snow days. Snow-season duration was estimated as the maximum number of consecutive days with SWE above 5 mm, a threshold chosen to reflect the expected accuracy of snow data assimilated in IT-SNOW (Avanzi et al., 2022). Finally, the number of seasonal melt-out episodes was computed as the number of instances in which a pre-existing SWE value dropped below 5 mm between 1 December–30 June. This last statistic is meant as a measure of the tendency of a given snowpack towards ephemerality (Petersky and Harpold, 2018; Petersky et al., 2019), that is, intra-seasonal melt-out events (a behavior that is likely increasing in a warming climate and that might have compounding effects with snow droughts). Each of these metrics was first computed on a per-pixel basis and then averaged across 500-m elevation bands within each basin, from 500 to 3500 , which represents the typical range of mountain elevations across Italy (excluding peaks, which are challenging to characterize using a 500-m snow reanalysis).
The cascading effect of snow droughts on streamflow was studied using three metrics widely adopted in previous studies of snow-drought propagation into streamflow (Hammond et al., 2024; Chartier-Rescan et al., 2025): summer cumulative runoff, annual low-flow days, and the annual runoff coefficient. Summer runoff, normalized by catchment area and expressed as a depth, was calculated by accumulating observed streamflow at the outlet of each study catchment over the period 1 May–31 August, corresponding to the typical timing of snowmelt-driven streamflow in our study region (recall that only cumulative values based on samples with less than 20 % missing data were retained). We defined a low-flow day as one with streamflow below the 20th percentile according to the entire streamflow time-series at that outlet; we then computed the total number of these days for each water year, again retaining only those records with less than 20 % missing data. The annual runoff coefficient was computed as the ratio of water-year cumulative streamflow to cumulative precipitation. The use of an annual, rather than seasonal, time scale for low-flow days and for the runoff coefficient was meant to capture the asynchronicity between winter precipitation (and so snow accumulation) and spring-summer runoff (Feng et al., 2019). In order to provide additional context to this analysis, we computed summer cumulative precipitation and summer mean air temperature for each catchment and water year according to the BIGBANG dataset.
The role of snow drought in dictating SWE and streamflow phenomenology was investigated by performing a Kolmogorov–Smirnov two-sample test between the distribution of each of the metrics during snow-drought and non-snow-drought water years to test if the difference between these distributions was statistically significant (Kottegoda and Rosso, 2008). We considered this difference to be significant with a significance level α=0.05. We did not calculate these statistics using the raw values. Instead, we first derived deviations from the mean values within each basin (hereafter referred to simply as anomalies), and then applied the statistical tests to these anomalies. This approach removes the influence of climatological differences among catchments, allowing us to focus on the contrast between snow drought and non-snow drought years.
2.3.3 Terrestrial-ecosystem impacts
Snow-drought impacts on terrestrial ecosystems were characterized by computing weekly, pixel-by-pixel statistics of daily cumulative GPP, which were then averaged according to the same elevation bands as SWE (see Sect. 2.3.2). We then explored statistical differences in GPP between snow-drought years and non-snow-drought years by calculating the respective weekly quartiles across all 38 study catchments. These statistics are thus average values across all land-cover classes within each elevation band. We also computed differences between mean values of seasonal GPP for each year, catchment, and elevation band. Similarly, we also computed differences in average greening date for all elevation bands and across all catchments, by again differentiating between snow-drought and non-snow-drought years. Statistical differences between snow drought and non-snow drought years were evaluated using a Student's t test (Kottegoda and Rosso, 2008).
The above analysis on GPP and greening date was performed using moderate-resolution satellite products. In addition, we averaged responses from various vegetation-cover types, while it is well known the this factor plays a key role in dictating how droughts impacts the bioshpere (Goulden and Bales, 2014). To complement the analysis of snow drought effects on GPP and phenology at the watershed scale, we also looked at ground-based flux-tower data at one forest (IT-TrF) and one grassland (IT-Tor) site in Aosta Valley. The key added value of this analysis was to to gain further insights into the potentially different impacts of snow droughts on forests and grasslands at the plot scale. Daily cumulative precipitation, average air temperature, snow depth, soil water content at 30 cm, ET, and GPP were collected at both IT-TrF and IT-Tor. We computed quartiles of each of these variables between 2012–2024 and then evaluated deviations between these quartiles and the observed time-series for the exemplary 2022, a recent snow-drought year in this region that had profound impacts on ecosystems (see Sect. 3 and Avanzi et al., 2024, for a context on 2022). This was done separately for the grassland and the forest sites, to elucidate whether the response of GPP and ET was different between these two land-cover classes and how this response related to weather (air temperature and precipitation) and surface hydrology (snow depth and soil water content).
2.3.4 Societal impacts
Emergency water-use restrictions were binned into four elevation bands based on the typical distribution of municipalities in Italy: below 1000 ; between 1000–1500 ; between 1500–2000 ; and above 2000 Restrictions were then clustered by month, separately for 2022 and for 2023, in order to evaluate the potential trend in elevation as the snowmelt deficit propagates downstream. Note that this computation was performed using all available water-use restrictions, including those outside the 38 study catchments, again because our study catchments covered only the headwater portions of rivers while water-supply impacts propagate from these headwaters to adjacent lowlands.
The assessment of the impact on mountain huts was conducted through an analysis of the most pertinent variables for our research objectives: (i) duration of management (in years); (ii) hut elevation; (iii) details on impact on water supply; (iv) impact on seasonal opening and closing periods; (v) water-supply source; and (vi) available water storage options.
3.1 Snow-drought inventory
Across our 38 study catchments and 13 water years, we identified a total of 152 snow droughts (Fig. 1d). The two water years with the highest number of catchment snow droughts were 2016 (31/38, 82 %) and 2017 (30/38, 79 %). During these two water years, snow-drought conditions extended from 47 to 40° N and thus affected the entire latitudinal range of the Italian peninsula. During 2016, nearly 75 % of catchment snow droughts were warm-wet, especially in catchments above 44° N (that is, the Alpine region); more southern catchments in the Apennines were instead characterized by a warm-dry snow-drought condition. Water year 2017 was markedly different, in that all but two catchments in the Apennines below 43° N were characterized by warm-dry snow-drought conditions. These findings agree with the continental drought characterization by García-Herrera et al. (2019), who showed that drought conditions in southern Europe between 2016–2017 were driven by high temperatures in addition to a precipitation deficit.
Three other significant snow-drought water years in Italy since 2011 were 2023 (29/38 catchments or 76 %), 2012 (22/38, 58 %), and 2022 (15/38, 40 %); see Fig. 1d. During both 2022 and 2023, the most predominant class was warm-dry: 13/22 and 22/29 catchments during 2022 and 2023, respectively. On the other hand, 2012 showed predominantly cold-dry conditions below ∼46.5° N and a small fraction of cold-wet snow droughts in high-elevation, inner-Alpine regions above ∼46.5° N. These three snow droughts predominantly affected the Alps, with only some warm-wet catchment snow droughts in the Apennines below 43° N in 2023. The only two years with no catchment snow droughts were 2013 and 2018, followed by 2014 with only one instance in central Italy. These results agree with previous studies assessing precipitation and snowfall by water year in Italy (Chiambretti et al., 2014; Dall'Amico et al., 2025).
Overall, the majority of catchment snow droughts in our sample were warm-dry (53 %), that is, presenting a combination of low precipitation and higher-than-usual temperatures (Fig. 1e). The second most frequent type was warm-wet (22 %), followed by cold-dry (17 %) and, finally, rare cold-wet instances (8 %), which may be a spurious result of our short period of record. In agreement with these results, accumulation-season precipitation and mean temperature across all snow droughts were generally lower and higher than during non-snow-drought water years, respectively (Fig. 1b–c, p-value 10−15 and 10−12, respectively).
3.2 Hydro-meteorology: SWE
Besides the obvious decrease in seasonal SWE at all elevations during snow droughts compared to non-snow drought years, we also found a statistically significant decline in snow-cover duration at all elevations (Fig. 2, first column for SWE and second column for snow-cover duration). In terms of median snow-cover duration, snow droughts lead to an anomaly of −17 d at 500–1000 , −29 d at 1000–1500 , −31 d at 1500–2000 , −19 d at 2000–2500 , −13 d at 2500–3000 , and −8 at 3000–3500 As a result, snow droughts shortened the snow season by as much as one month on median, leaving a clear and statistically significant signal at all elevation levels.
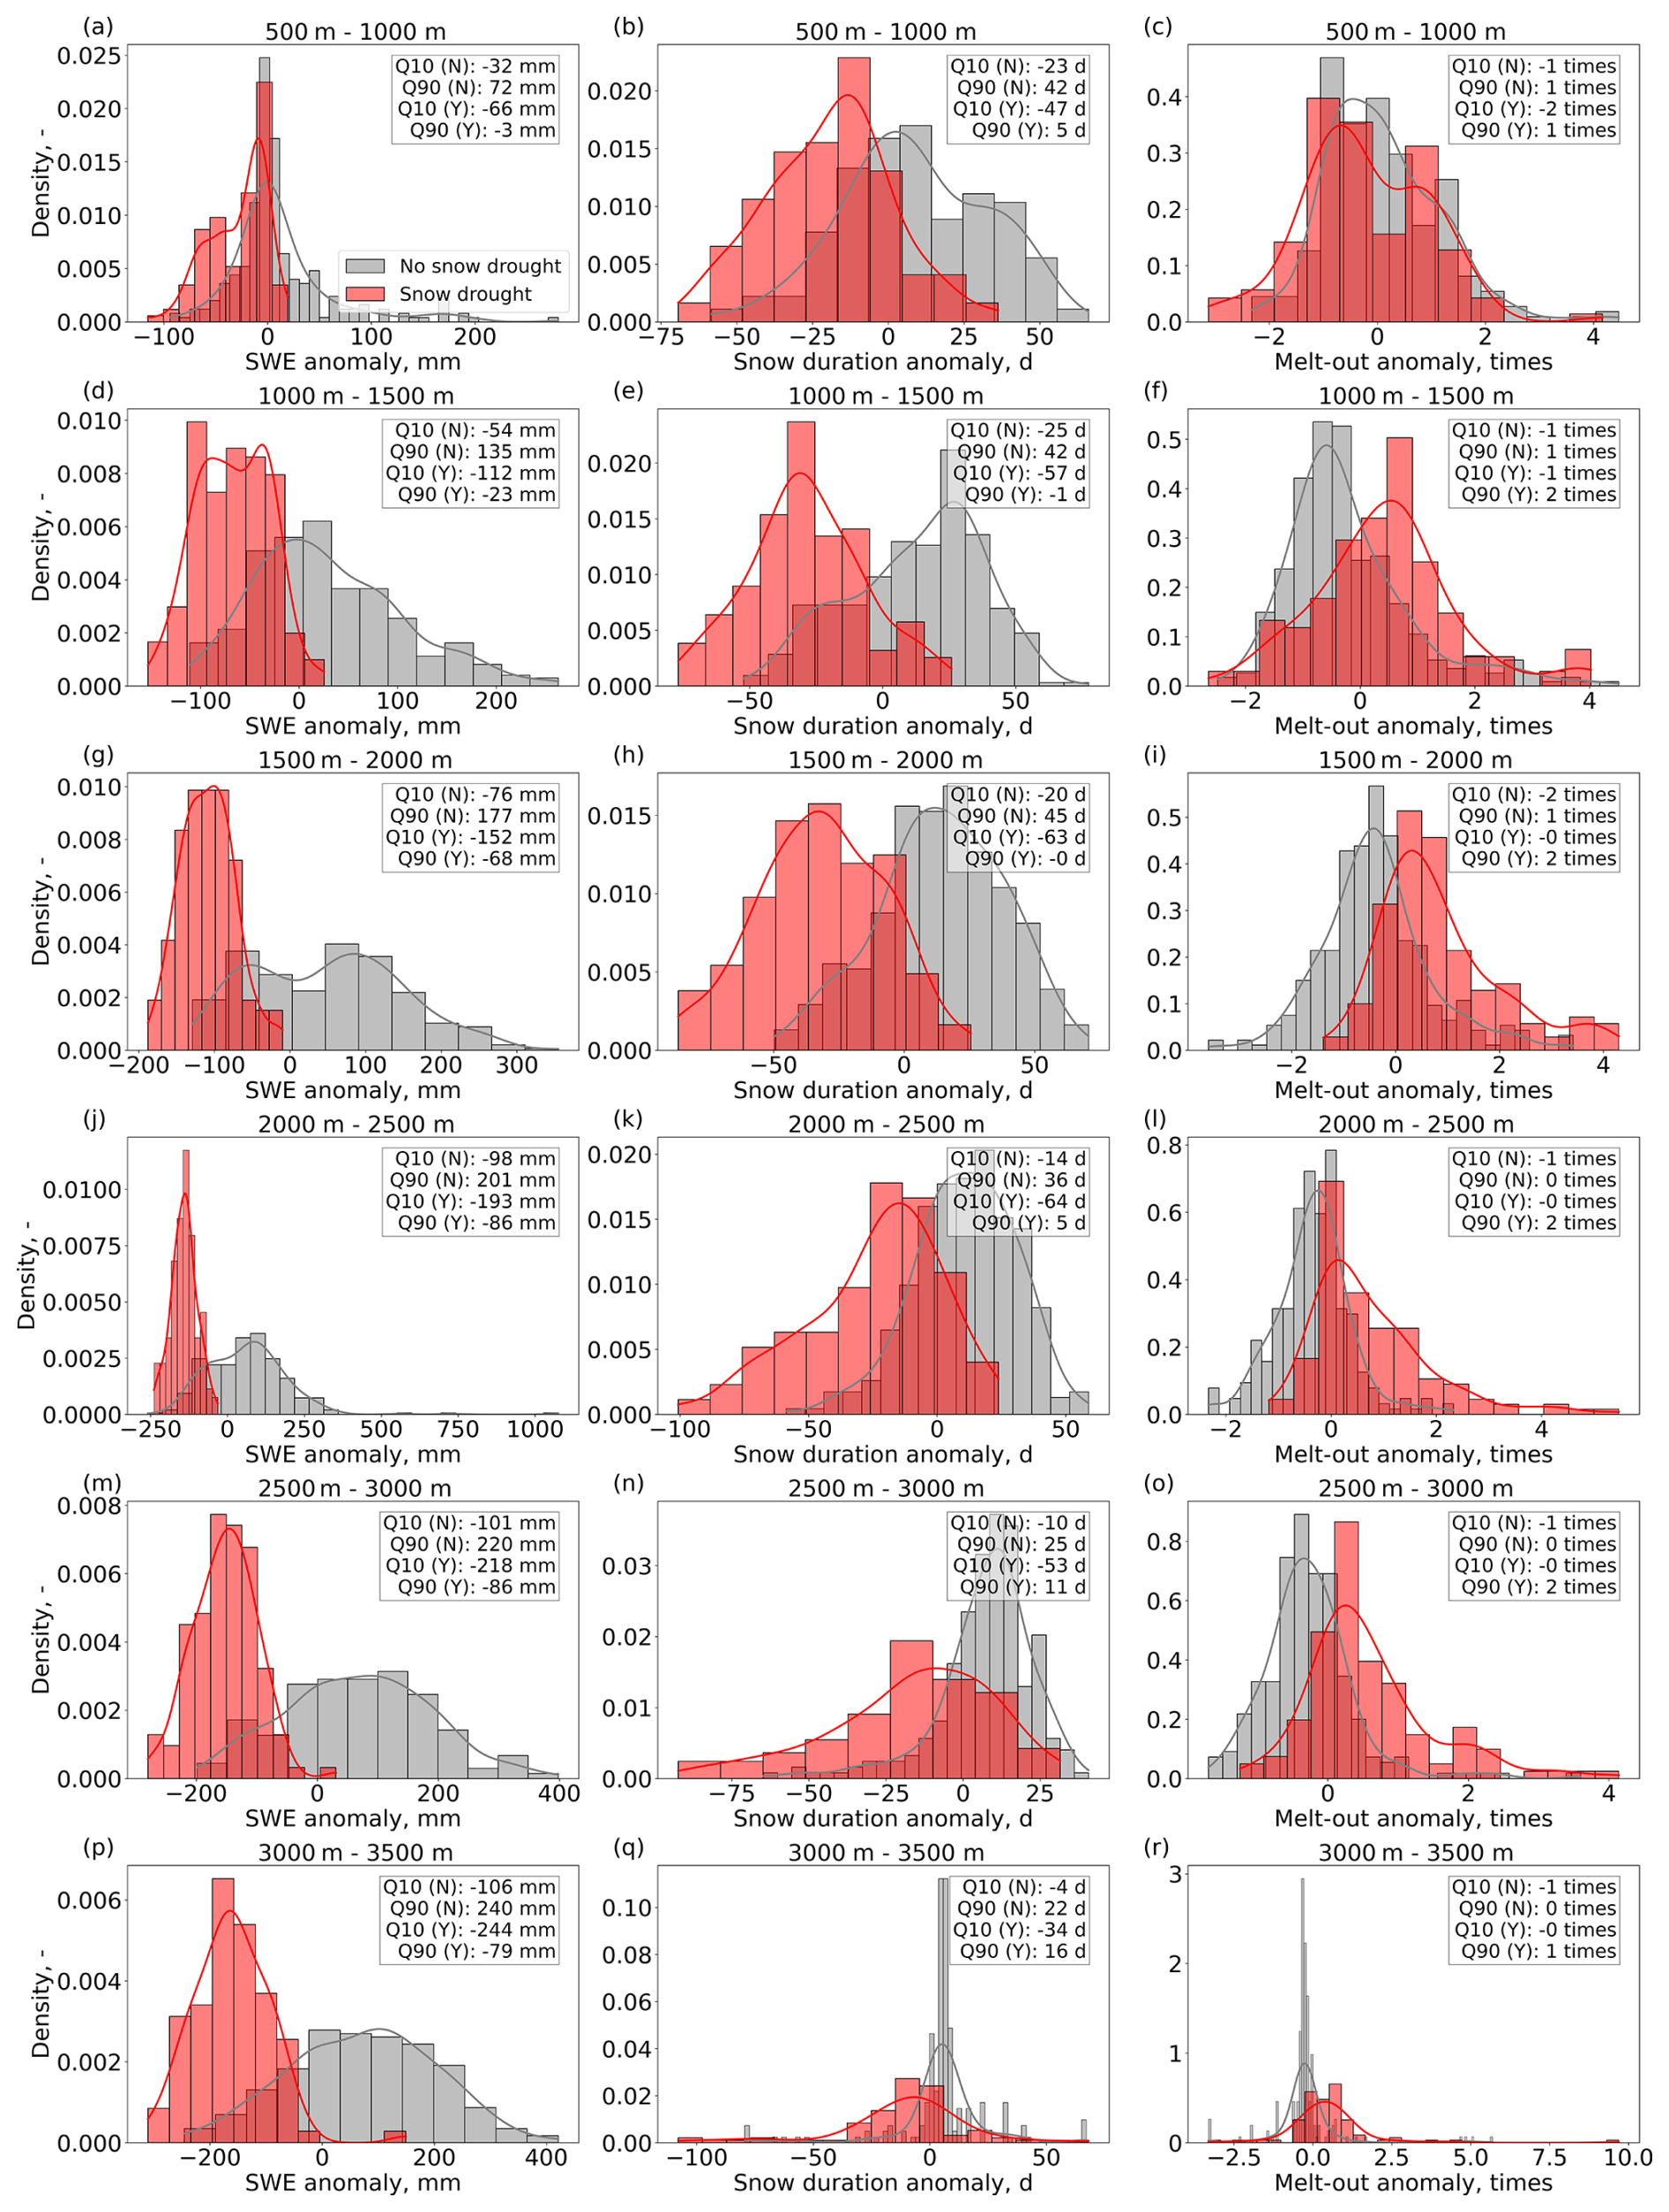
Figure 2Differences in anomalies of seasonal Snow Water Equivalent (SWE, left), snow-cover duration (center), and melt-out episodes (right) between snow-drought (red) vs. non-snow-drought (gray) catchment water years for six elevation bands.
In terms of melt-out episodes, a shift towards an increase in ephemerality clearly emerged above 1000 m and peaked between 1500–3000 m: anomalies were −0.36 times at 500–1000 m, +0.44 times at 1000–1500 m, +0.6 times at 1500–2000 m, +0.40 times at 2000–2500 m, +0.36 times at 2500–3000 m, and +0.39 times at 3000–3500 m.
3.3 Hydro-meteorology: streamflow
Winter snow droughts in our sample led to a median −50 % in summer runoff across all catchments (Fig. 3c), despite no statistical difference in summer precipitation between snow-drought and non-snow-drought water years (Fig. 3a, p-value for summer precipitation 0.20). Instead, the decline in summer runoff observed in the immediate aftermath of a snow drought was observed in combination with a statistically significant increase in summer temperature (Fig. 3b, p-value 10−7). This decline in summer runoff was accompanied by a clear increase in low-flow days (Fig. 3d), with a median anomaly of +33 d yr−1 after snow droughts. In particular, there was a significant change in high percentiles, with the 90th percentile of anomalies increasing from 46 d during non-snow-drought water years to 131 d during snow-drought years. Snow droughts also caused a decline in the annual runoff ratio (Fig. 3e), with a median anomaly during snow-drought years of −0.06.
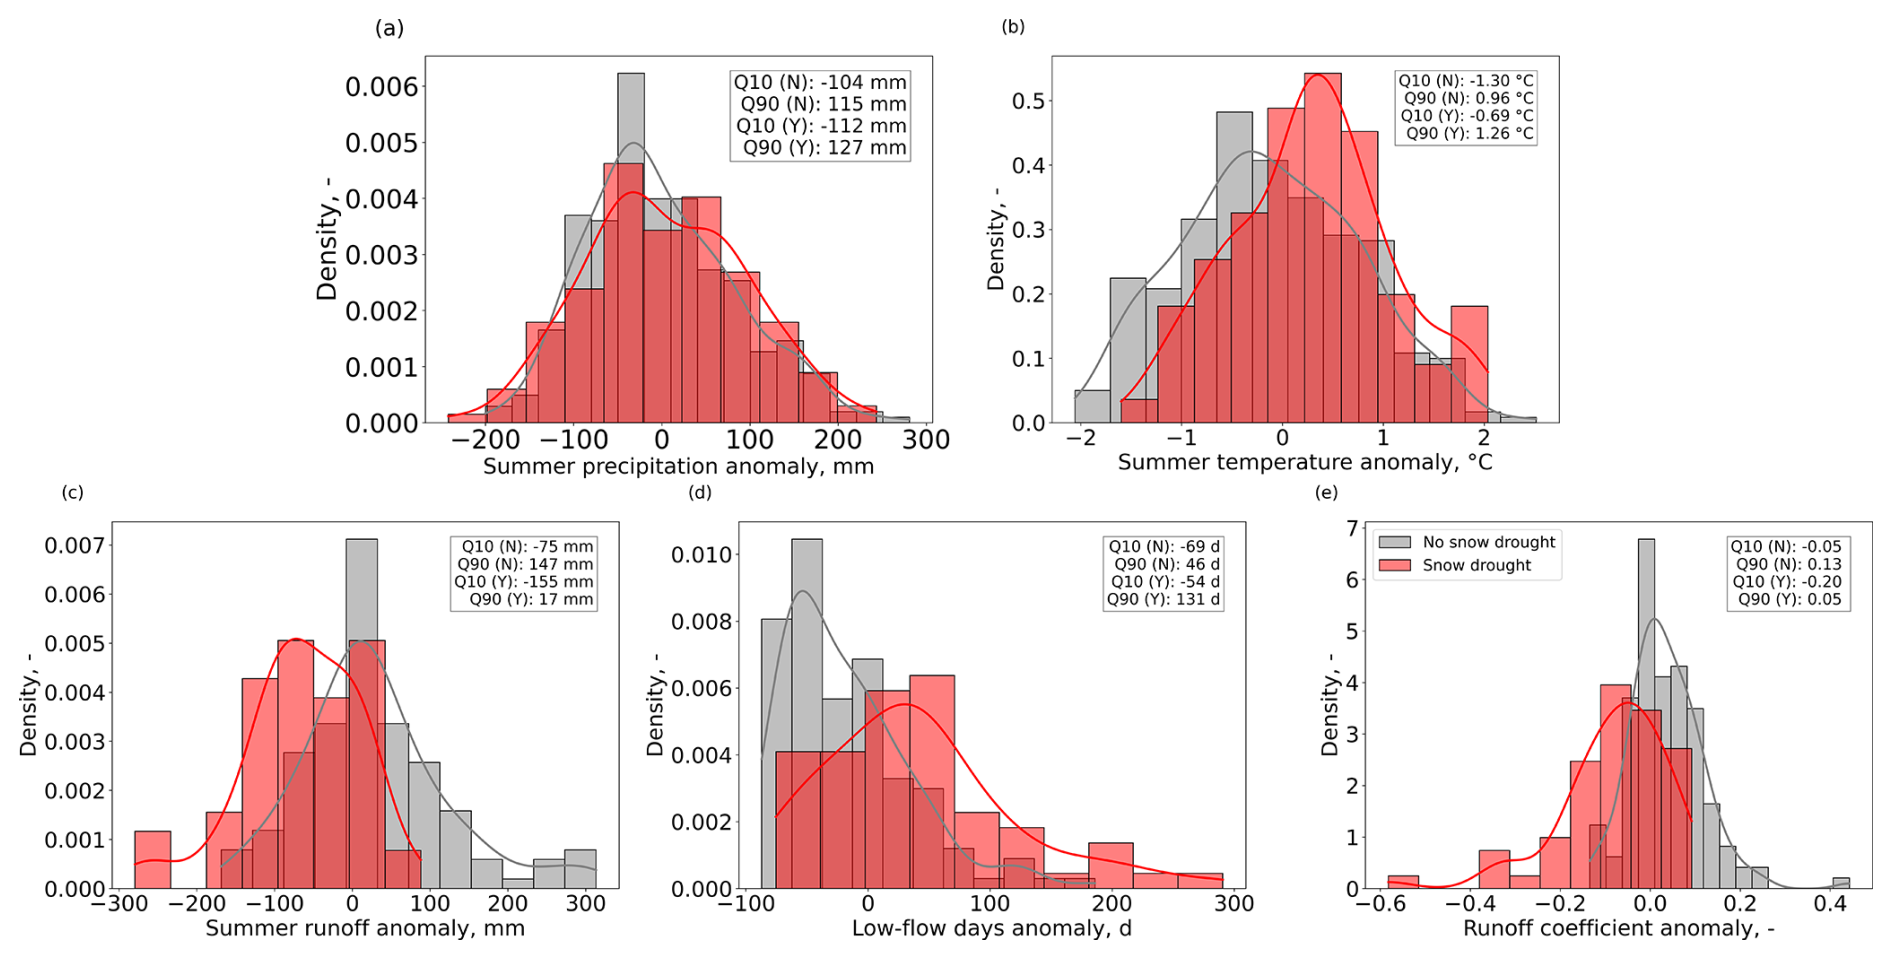
Figure 3Differences in anomalies of summer precipitation (a), summer mean air temperature (b), summer cumulative runoff (c), annual low-flow days (d), and annual runoff coefficient (e) for snow-drought (red) vs. non-snow-drought (gray) catchment water years.
3.4 Terrestrial-ecosystem impacts
GPP showed different responses to snow droughts across elevation gradients (Fig. 4). Below 1000 m, the weekly patterns of GPP between snow-drought and non-snow-drought years were comparable, with the only notable difference being occasionally larger interannual variability during non-snow-drought than snow-drought years that was likely due to the larger cardinality of the former sample (Fig. 4a). In other words, at low elevations GPP after a snow drought was generally comparable to, if not slightly lower than, that after non-snow-drought winters, both in terms of weekly patterns and in terms of seasonal totals (Fig. 4b).
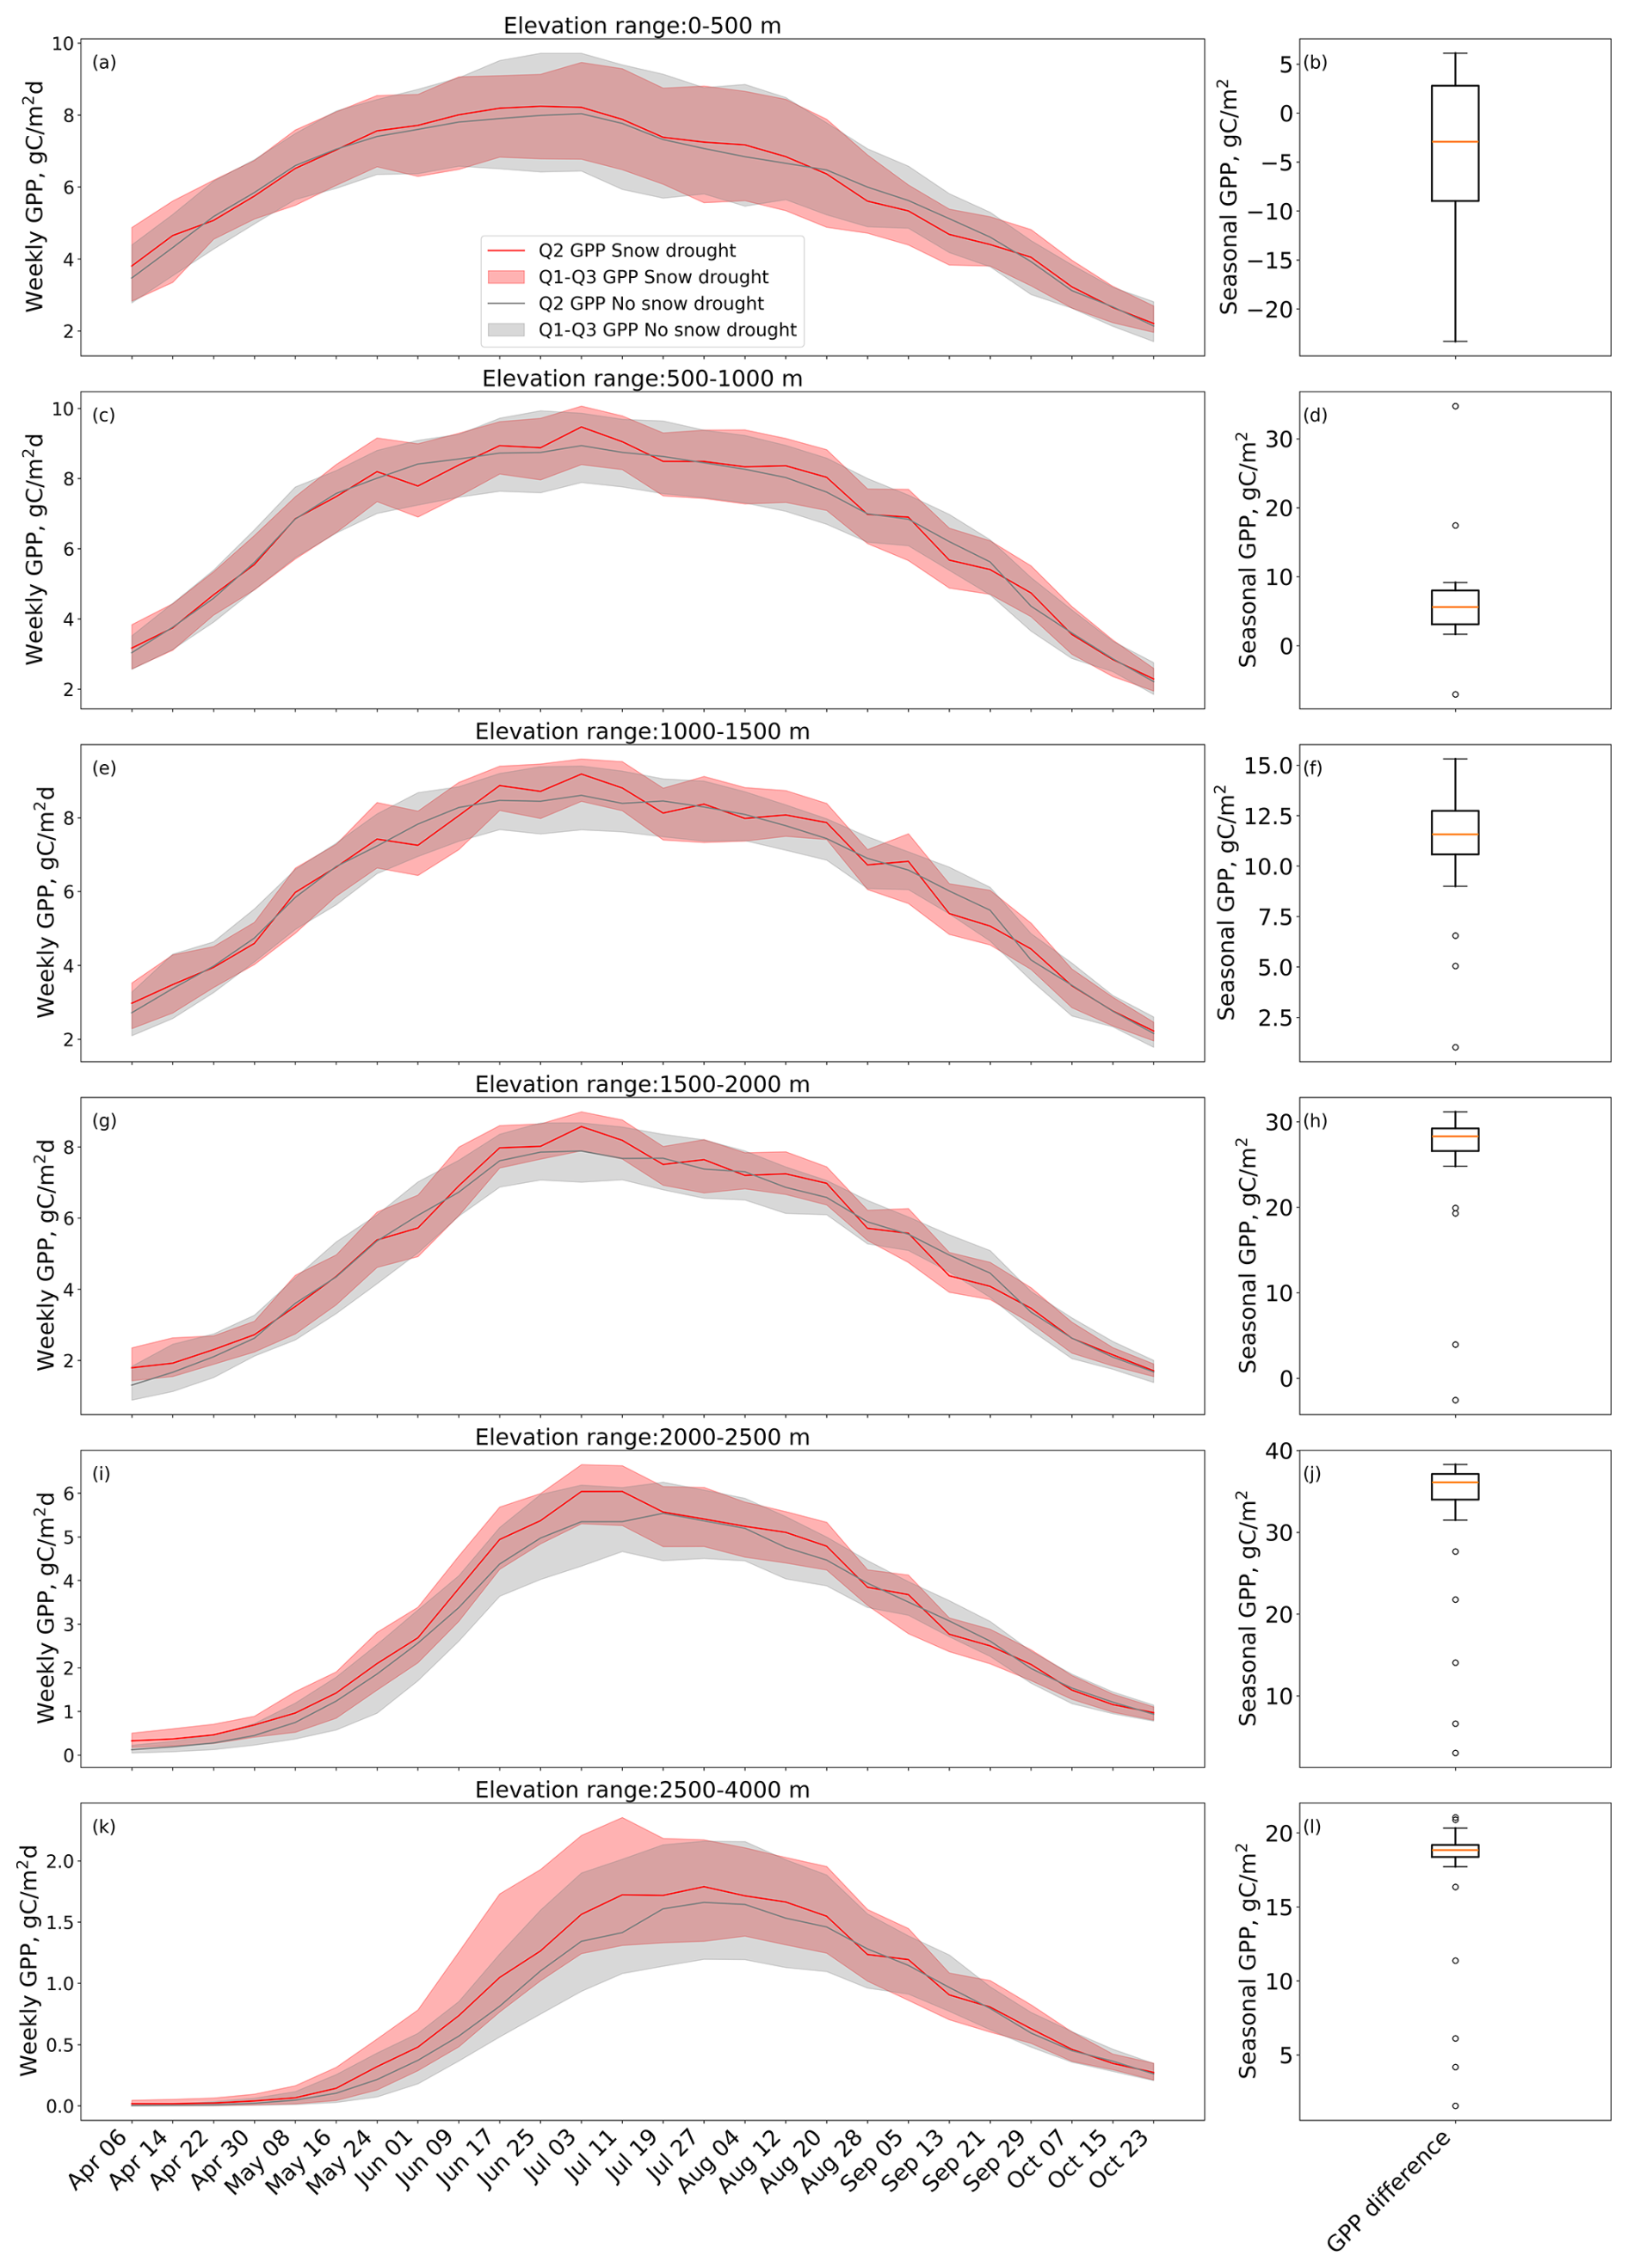
Figure 4Left: temporal patterns in weekly Gross Primary Production for six elevation bands, snow-drought (red) vs. non-snow-drought (gray) catchment water years. Right: differences in average annual GPP between snow-drought and non-snow-drought catchment water years.
As elevation increased, however, two responses emerged: the first was an increase in peak GPP between June–July during snow drought years, especially above 1500 m, and the second was an earlier- and faster-than-expected increase in GPP during springtime following a snow drought, especially above 2000 m (Fig. 4c–k). Because of this earlier and faster onset and higher GPP peak in mid-summer, median seasonal GPP after a snow drought was higher than after a non-snow-drought winter at all elevations and particularly above 1500 m (Fig. 4h, j, and l). Percentage differences between snow-drought and non-snow-drought annual GPP were generally around 0 % below 500 m and then steadily increased up to +10 % above 2500 m. This increase in spring GPP was associated with a statistically significant increase in spring average temperature (anomalies of −0.06°C and +0.15°C during non-snow-drought and snow-drought years, respectively, p-value=0.02), but no statistically significant change in spring precipitation.
Along with this increase in GPP, snow droughts led to an earlier-than-usual greening date at all elevations (Fig. 5), particularly above 2500 m. The difference in median greening date was between 1–3 d below 2500 m, rising to 6–8 d above 2500 m. Above 2500 m, differences in greening dates also showed a significantly larger spread. As a result of temperature control on vegetation development, greening date increased with elevation, both during snow-drought and during non-snow-drought years.
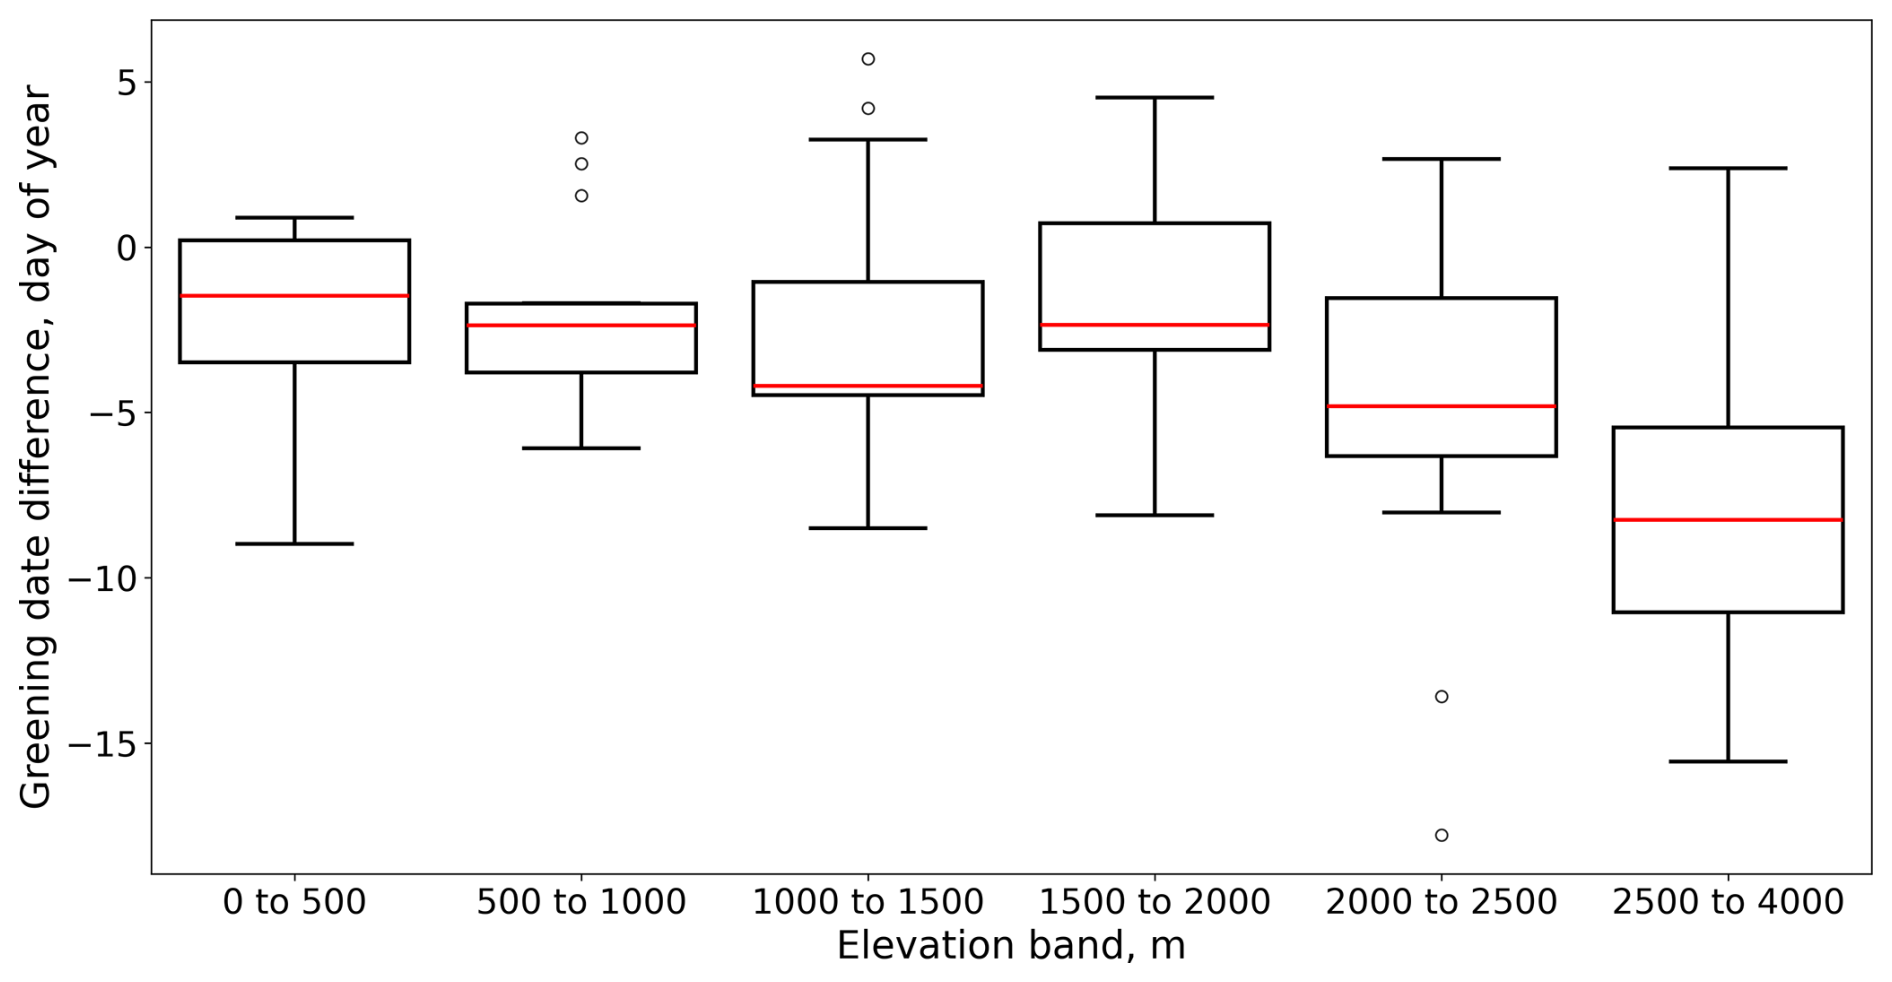
Figure 5Difference in average greening date between snow-drought and non-snow-drought catchment water years according to six elevation bands.
These differences in GPP and greening date between snow drought and non-snow drought years were statistically significant. For GPP, differences were significant at intermediate elevations (1000–1500 m: p=0.019) and at high elevations (e.g. 2000–2500 m: p<0.001). In contrast, green-up timing showed a consistent and statistically significant response across all elevation ranges (e.g. 0–500 m: p=0.016; >2500 m: p<0.001). Together, these results clarify that phenological responses to snow drought are widespread, whereas productivity responses are constrained by elevation.
In-situ flux-tower data for 2022 confirmed that mid- to high-elevation areas were prone to an earlier-than-usual rise in GPP after the snow drought (Fig. 6k–l), but also showed a nuanced difference in response between the grassland and the forest site. In particular, the forest and the grassland sites showed a larger-than-usual and lower-than-usual total GPP at the end of the season, respectively (Fig. 6m–n). At the grassland site, the earlier-than-usual rise in GPP started around the melt-out date and was associated with a month-long period of higher-than-usual temperatures (Fig. 6c), a faster-than-usual depletion of surface soil moisture (Fig. 6g), and an increase in ET (Fig. 6i). Between late July and early August 2022, soil moisture at the grassland site dried out, which coincided with the seasonal peak in both ET and GPP. Both variables then declined compared to the median seasonal climatology and led to a lower-than-usual seasonal cumulative GPP as a result. In contrast, no snow accumulated during this snow drought at the forest site (Fig. 6f), which caused a lower-than-usual peak and a faster-than-usual depletion in soil moisture (Fig. 6h), as well as a decline in ET when the soil dried out (Fig. 6j). Nonetheless, GPP in the forest did not decline during summer and instead maintained rates that were consistent with the median local climatology. This, together with the earlier rise in spring, led to a higher-than-usual cumulative GPP at the end of the season (Fig. 6n).
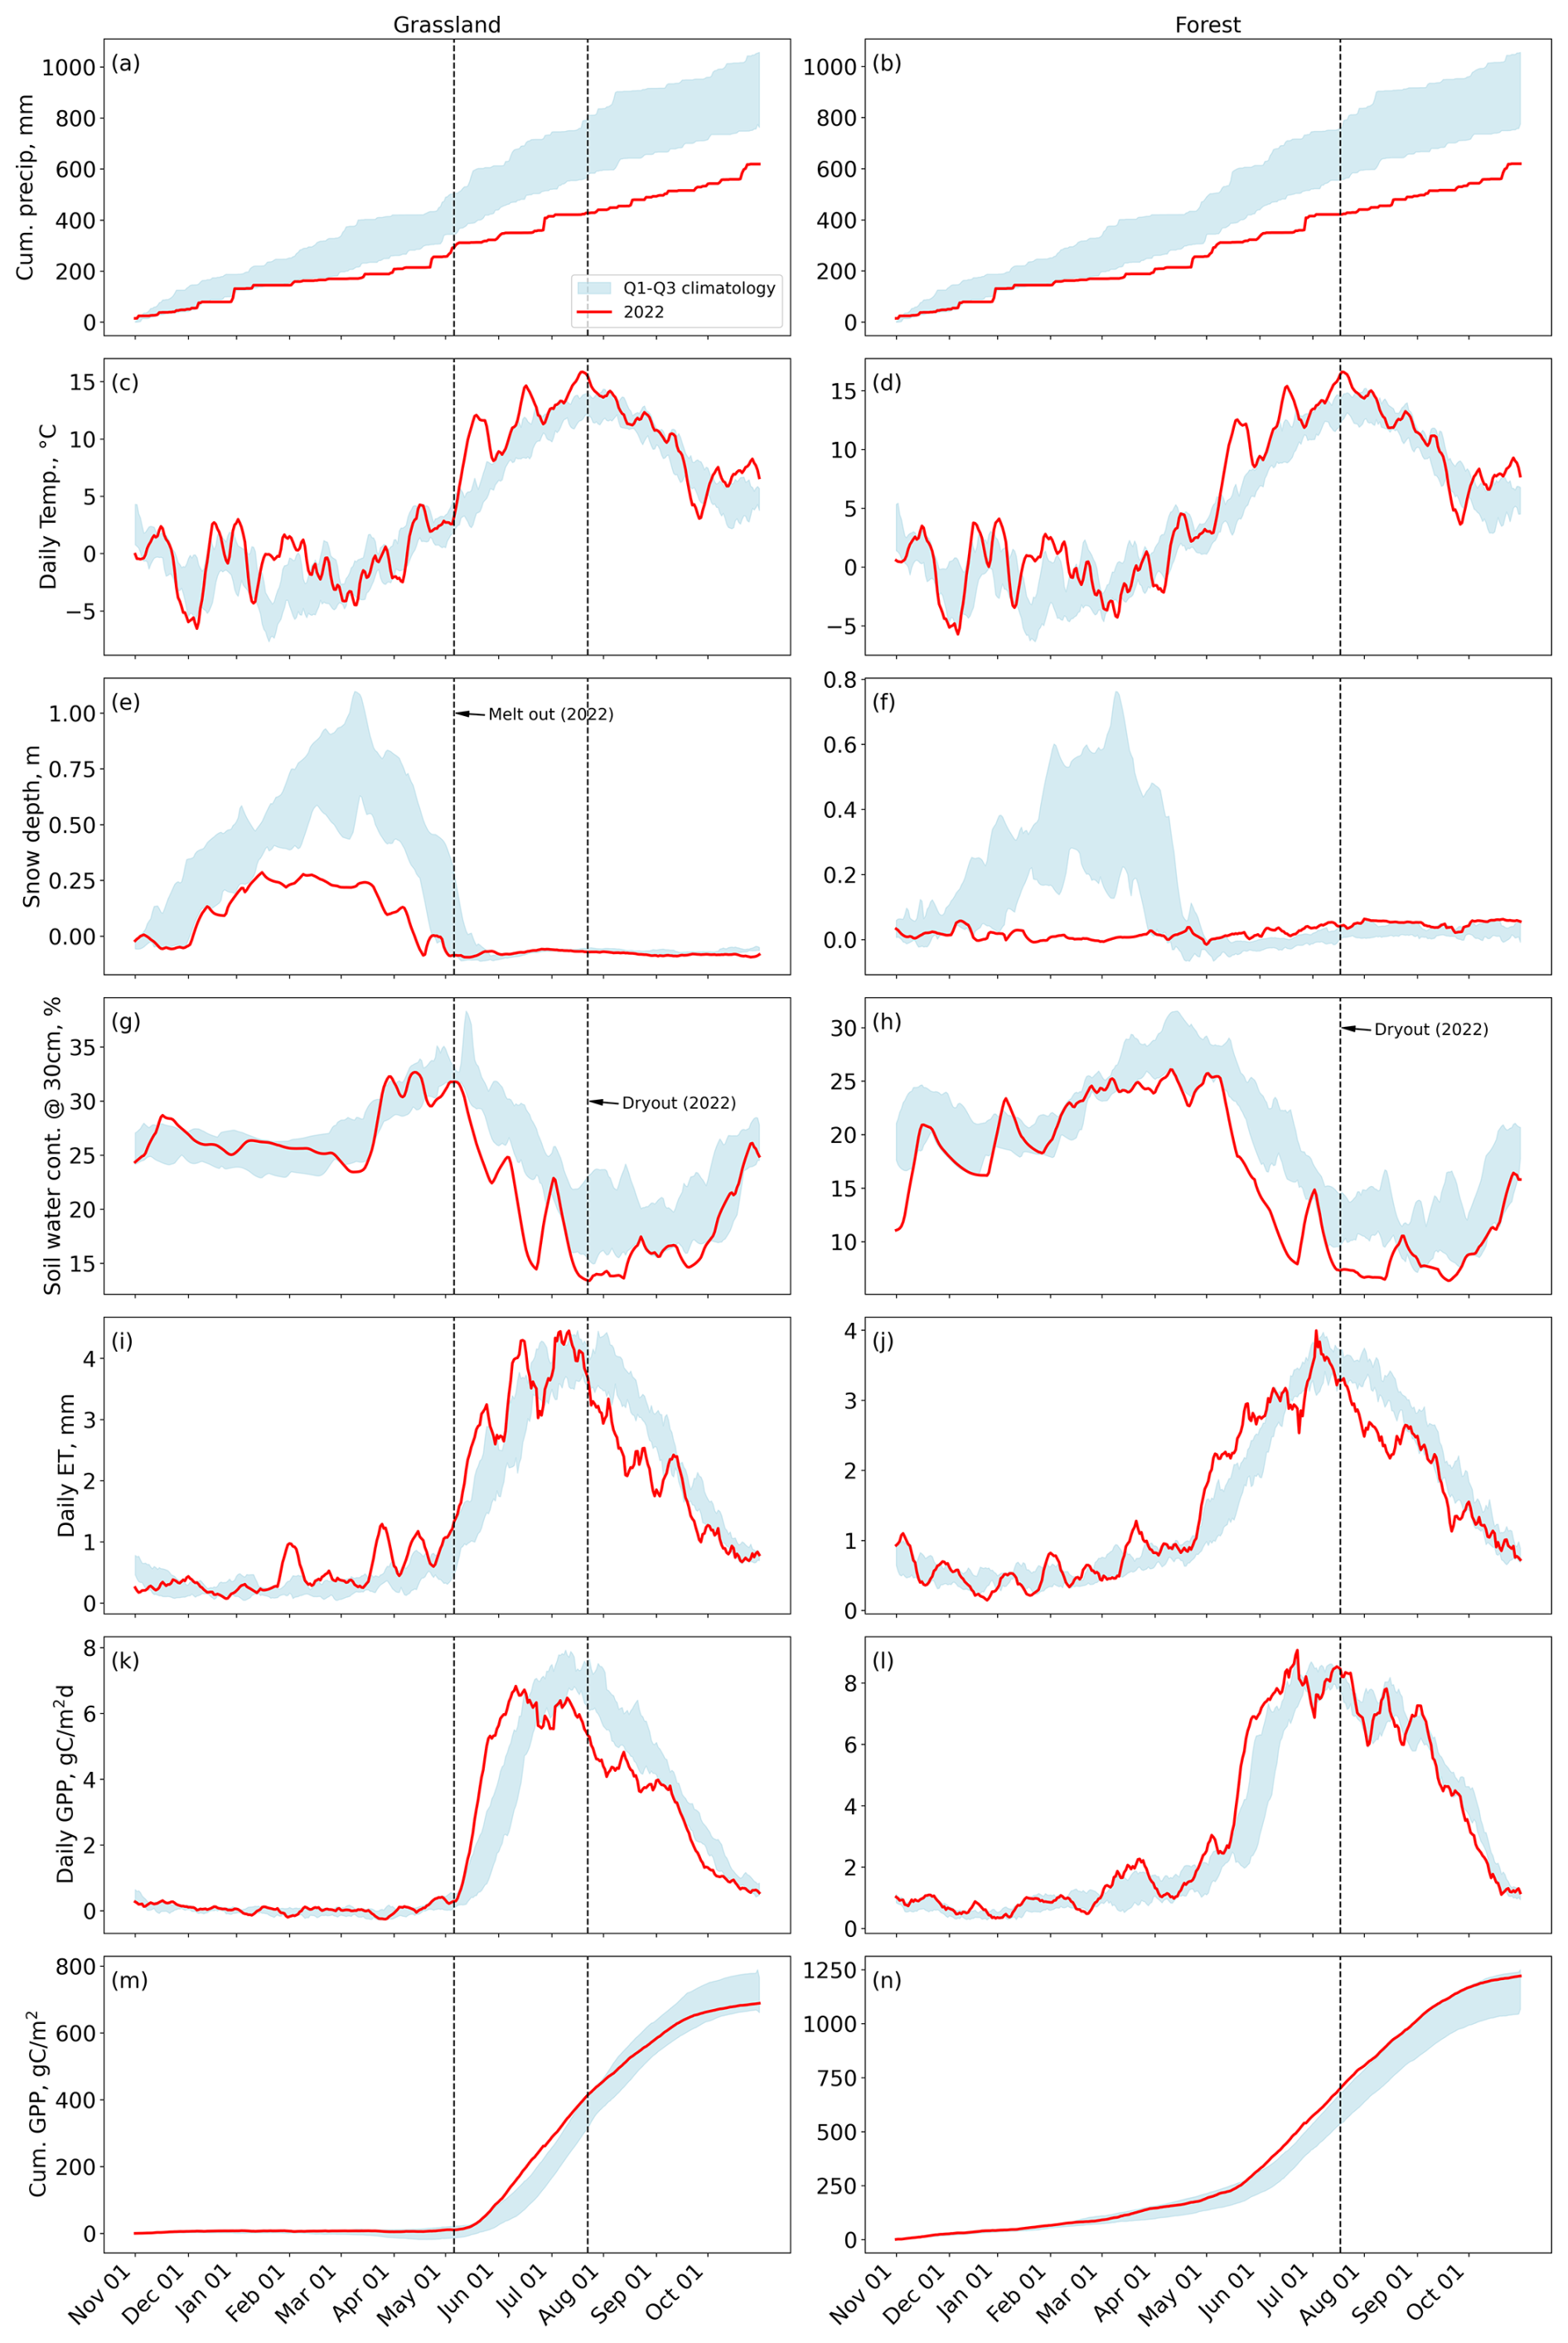
Figure 6Flux response of grassland (left) and forest (right) intensive study plots to the 2022 snow drought (red) compared to the first to third quartile range for the period 2012–2024 (blue): precipitation and air temperature (a vs. b and c vs. d, respectively), snow depth (e vs. f), soil moisture at 30 cm (g vs. h), daily evapotranspiration (i vs. j), daily Gross Primary Production (GPP, k vs. i), and cumulative Gross Primary Production (m vs. n).
3.5 Societal impacts
The inventory of emergency water-use restrictions in Italy during the 2022 and 2023 droughts revealed that these decrees affected nearly 1291 municipalities out of ∼7900 (16 %, see Fig. 7a). Affected municipalities were mostly in the northern and central portions of the country (Fig. 7), coinciding with the epicenter of the concurrent precipitation deficit (see Montanari et al., 2023). The areas with the highest density of restrictions were the foothill regions of the Po River valley and of the Apennines range, rather than very-low-elevation regions of the Po valley (Fig. 7a). The vast majority of these restrictions were found outside the boundaries of our study catchments, which was both because the 2022 and 2023 snow droughts were the result of a multifaceted process including a severe precipitation deficit, ET enhancement, and temperature anomalies (see Montanari et al., 2023) and because these restrictions were driven by water-consumption crises, which generally take place in lowlands where demand peaks, rather than in energy-limited headwaters. Nonetheless, we still found nearly 50 municipalities with such restrictions above 1500
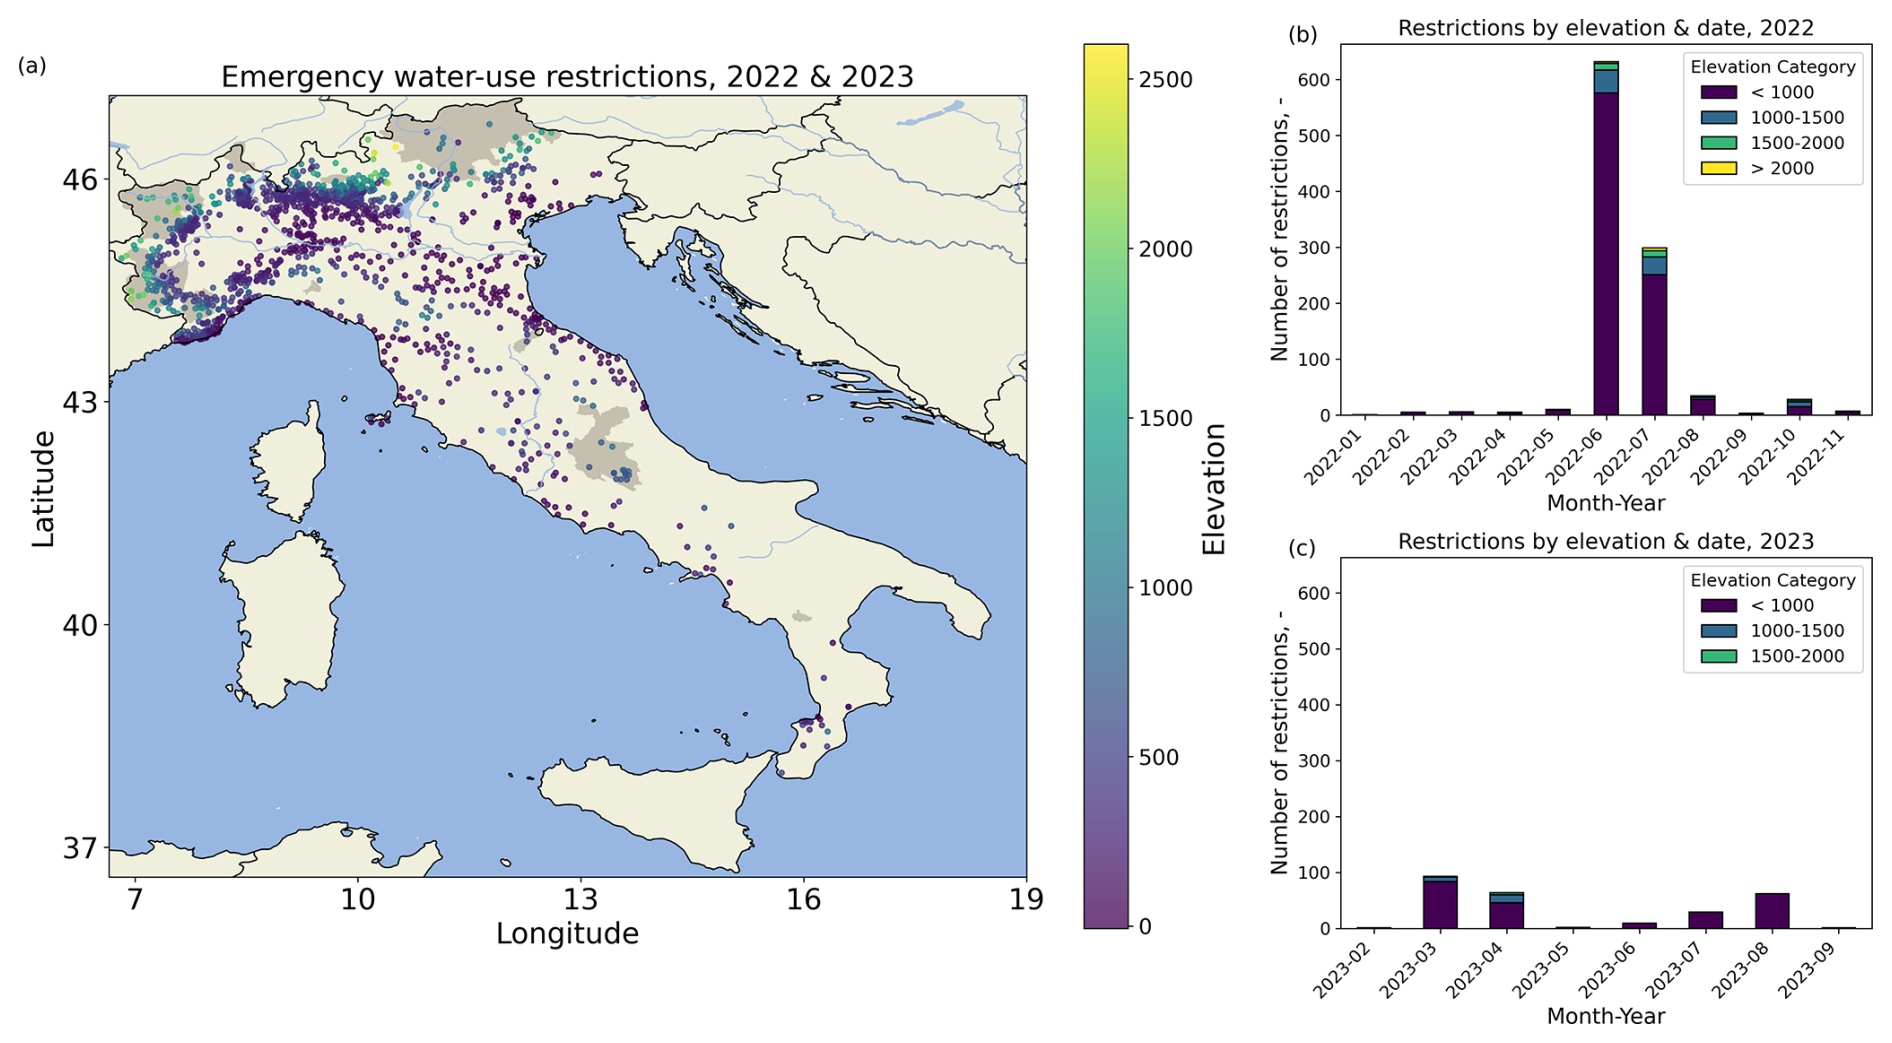
Figure 7Spatial (a) and temporal (b–c) distribution of emergency water-use restrictions during the 2022 and 2023 droughts in Italy.
No clear temporal trend emerged when looking at the elevation distribution of water-restriction publication dates in 2022 (Fig. 7b). At low elevations, a small amount of such restrictions were continuously issued beginning in January 2022, but the peak took place between May–July 2022. This peak concided with the snowmelt deficit (Avanzi et al., 2024), and that is when also municipalities at higher elevation bands issued the most restrictions. A second period of concentrated restrictions was October 2022, which was likely related to that summer's precipitation deficit rather than the previous snow drought between 2021–2022. Only a small amount of restrictions was issued in 2023, mostly following the same “background” pattern observed in 2022 of new restrictions below 1000 m during all months between February–October.
The survey of water-supply impacts of mountain huts received 113 responses across the Italian Alps and the central Apennines (Fig. 8). The average elevation of these huts was between 1800–2200 , that is, well above the typical elevation of municipalities in Italy. Nearly 90 % of these responses came from hut managers with at least 3 years of experience, with nearly 55 % of the respondents having more than 10 years of experience. About 70 % of hut managers reported water-supply impacts during 2022 and 2023, with 28 % reporting also an impact on their opening period. For context, about 80 % of these huts receive water via surface runoff (generally, glacier or snow melt and more rarely precipitation), with only half of the huts having some form of water storage option.
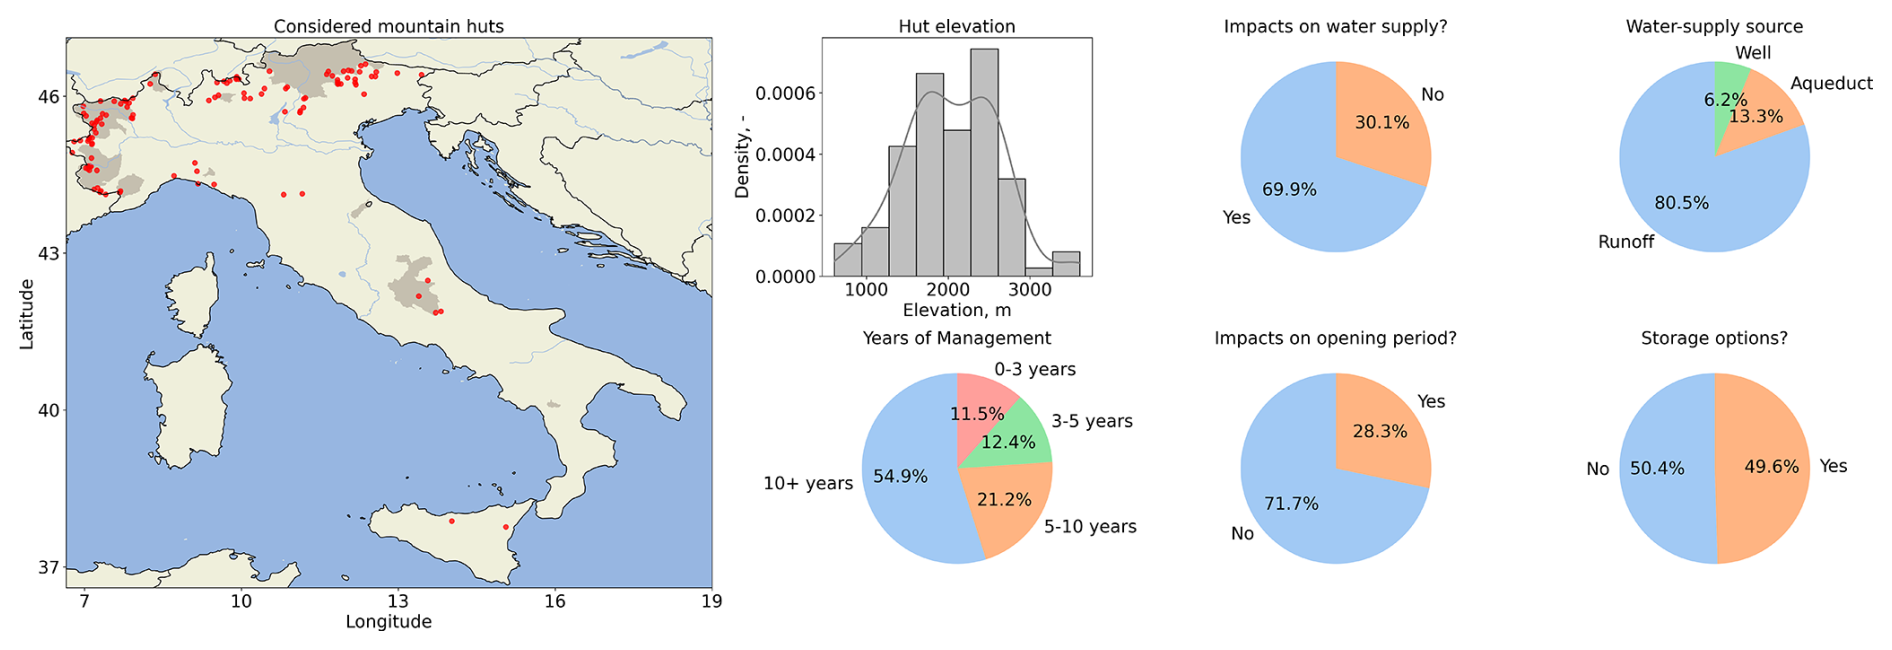
Figure 8Outcomes of the impact survey of snow droughts on mountain huts.
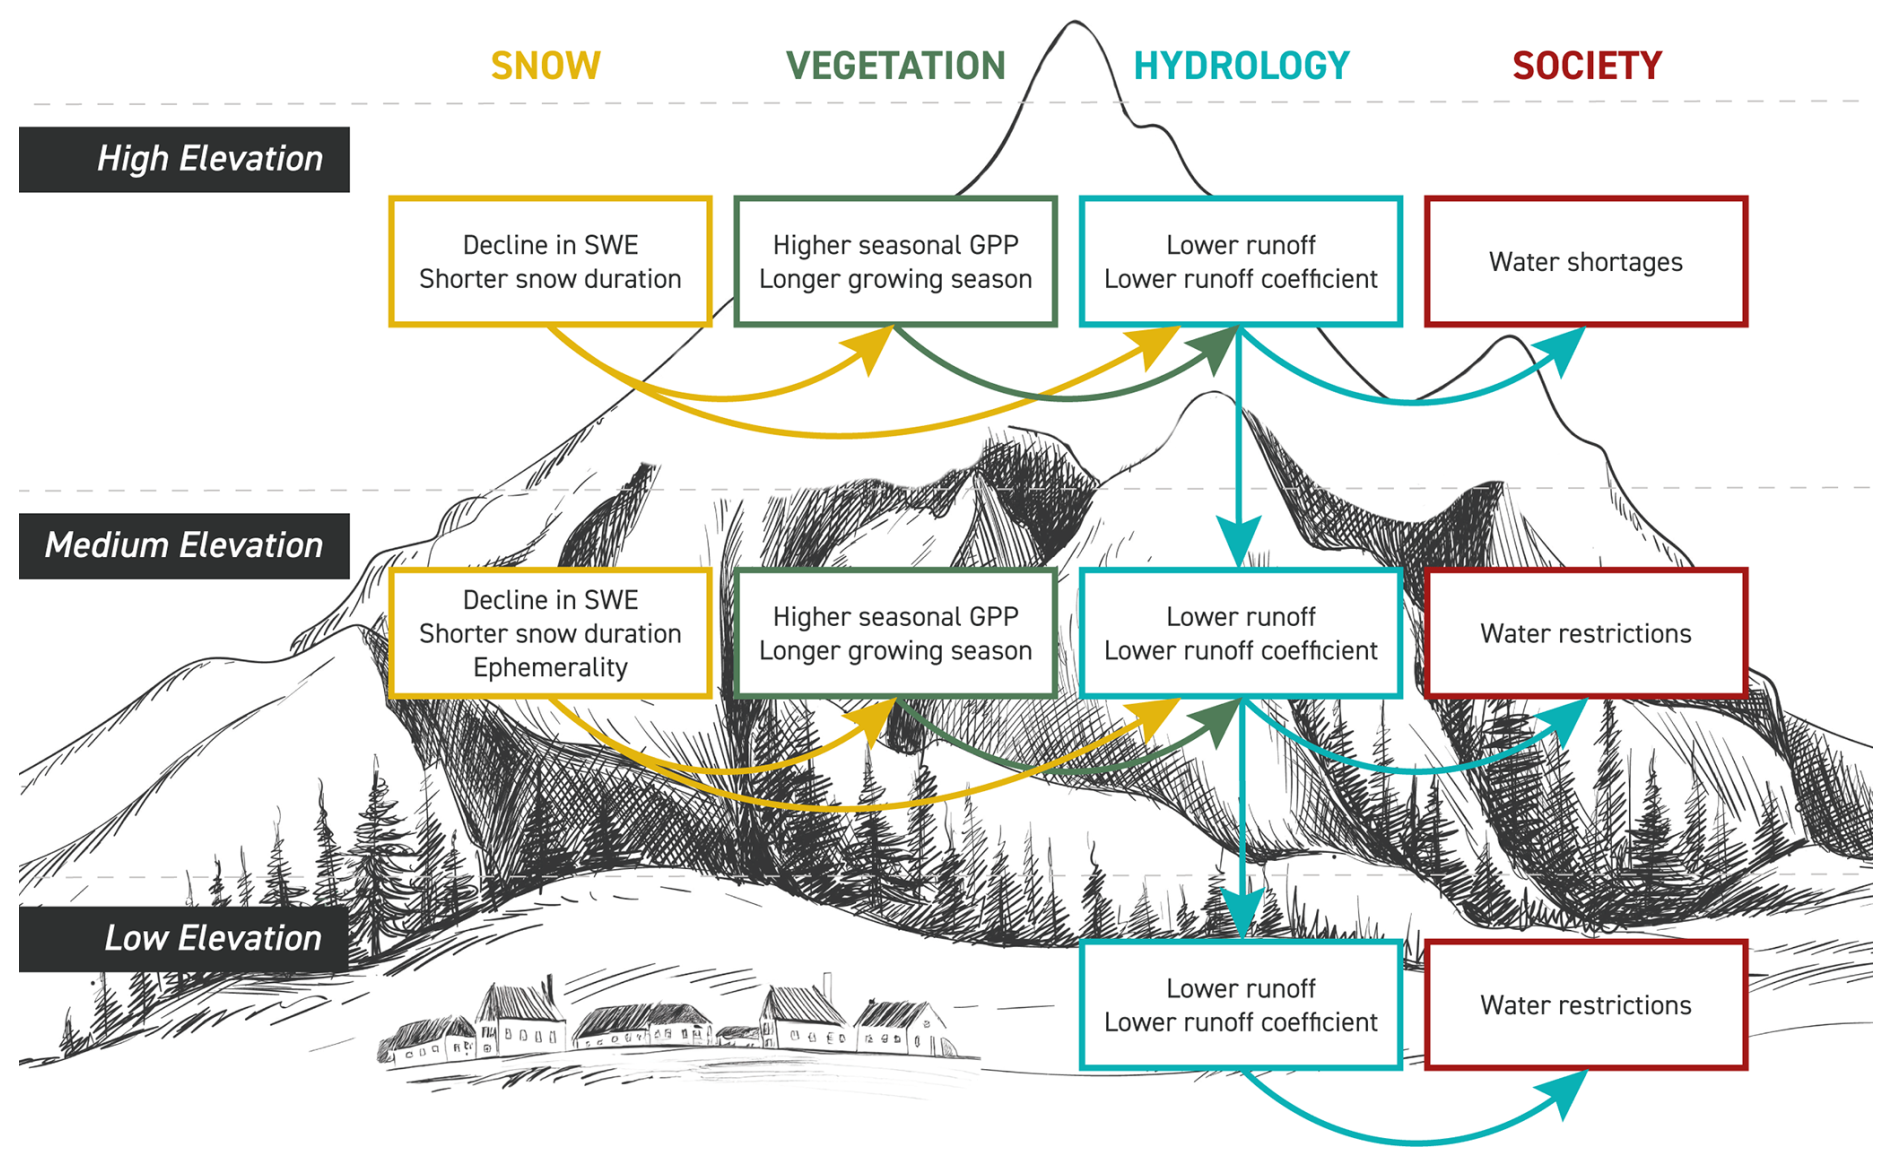
Snow-drought impacts in Mediterranean regions span the entire socio-ecohydrological spectrum: they translate into increased snow ephemerality (Fig. 2), reduced summer runoff and annual runoff efficiency (Fig. 3), enhanced GPP (Fig. 4), and water-supply disruptions (Figs. 7 and 8). These impacts change significantly across elevation gradients, as the mountain-to-lowland landscape transitions from energy limitation upstream to water limitation downstream (Bales et al., 2006, 2018), and are linked with the seasonality of the Mediterranean climate (Bales et al., 2018). Therefore, snow droughts emerge as a deeply multi-sectorial and multi-elevation risk, interconnecting the cryosphere with hydrology, ecology, and society (Fig. 9).
Starting from the cryosphere, the obvious entry point of any snow-drought impact chain is a snow deficit, led by either a precipitation and/or a temperature anomaly (Harpold et al., 2017). In this regard, a first novel insight of our data is that the majority of snow droughts in Italy since 2011 were due to a combination of these two drivers (Fig. 1). This is important, because the combination of low precipitation and high temperatures is a worst-case scenario for mountain systems in Mediterranean regions that has a clear climate-change signature (Huning and AghaKouchak, 2020). It is therefore critical to rethink the traditional separation between cold and warm snow droughts to include the increasingly frequent case of dry-warm snow droughts (Hammond et al., 2024), a trend that is likely also present outside Italy.
In addition, we found that snow droughts not only reduce SWE and the duration of a snow season (a result already highlighted by previous research; see Hammond et al., 2024), but they also increase snow ephemerality, that is, the tendency of a snowpack to intra-seasonal melt-out events (Petersky and Harpold, 2018). According to our data, this shift towards increased ephemerality was particularly clear at intermediate elevations (Fig. 2), which is a critical range where the transition between energy and water limitation takes place – that is, between areas where the water supply originates and areas where it is used. In Mediterranean regions, the continuous presence of a snow cover at those intermediate elevations has several implications that make this shift towards increased ephemerality relevant for our impact chain: it regulates soil temperature (Filippa et al., 2014), stores the bulk of snow-water resources throughout winter and makes them available for summer use (Harrison and Bales, 2016), provides ecological niches in snow (Takeuchi, 2001) as well as across the various soil layers (Rungee et al., 2018), preserves soil moisture from ET (Petersky and Harpold, 2018), and supports winter tourism. This shift towards increased snow ephemerality during snow droughts has rarely been studied (Petersky and Harpold, 2018; López-Moreno et al., 2024), but is a key knowledge gap with regard to snow-drought impacts on mountain socio-ecohydrologic systems.
Moving along our impact chain, vegetation impacts (Figs. 4–6) were related to a shorter and more ephemeral snow season via a longer-than-usual growing season at medium to high elevations and consequently a higher seasonal GPP (see the corresponding yellow arrows in Fig. 9). Snow-drought impacts on vegetation are also understudied (Trujillo et al., 2012; Galvagno et al., 2013; Pulliainen et al., 2017), which means that both findings are comparatively novel. These impacts may appear counterintuitive, as an increase in GPP points to higher ecosystem productivity in the immediate aftermath of an otherwise drier-than-usual period. However, this outcome agrees with a growing body of literature showing ET enhancement during droughts (Mastrotheodoros et al., 2020; Avanzi et al., 2020; Massari et al., 2022; Zhao et al., 2022) due to the increase in atmospheric vapor-pressure deficit associated with the drier (and increasingly warmer) atmosphere (Bales et al., 2018). Indeed, because water and carbon cycles are intrinsically linked through plant stomata, plants face a trade-off: under initial increases of vapor-pressure deficit and provided soil moisture is adequate, plants may maintain or even increase GPP by sustaining high level of stomatal conductance, a strategy consistent with optimality frameworks that balance the benefits of carbon gain against hydraulic risk (Joshi et al., 2022). However, as vapor-pressure deficit and soil moisture stress intensify, the increased cost and risk of maintaining transpiration may override the benefit, forcing stomatal closure and reducing GPP. This behaviour is particularly evident in the observation case studies.
This increase in summer GPP was evident at elevations that are generally energy limited, that is, where the amount of available water is rarely a limiting factor for ecosystem productivity. At those elevations, the snowpack typically acts as a strong physical constraint on canopy development and activity in the spring, thereby delaying plant phenology compared to lower elevations. Once the snowpack disappears and this snow-imposed decoupling between vegetation, light, and temperature ends, plants are suddenly exposed to favorable conditions, leading to an increase in GPP. Consequently, a snow drought year may be advantageous at higher compared to lower elevations: indeed, while at low elevations phenological development occurs within a similar time window regardless of whether it is a snow- or no-snow-drought year, at high elevations the absence of snow enables an earlier onset of growth and GPP. This difference in response between energy-limited and water-limited elevation bands may also explain why this result does not contradict Trujillo et al. (2012), who reported increased vegetation productivity after high-snow winters. Both winters with abundant snowfall and winters with snow drought can enhance the following summer's productivity, but through different mechanisms as mediated by water availability and elevation.
While results in Figs. 4 and 5 were obtained through remote sensing and thus may be affected by retrieval uncertainty and average different responses by diverse ecosystems, on-the-ground data in Torgnon (Fig. 6) confirmed the occurrence of ET enhancement during the early stages of summer 2022. In addition, these data clearly linked the increase in GPP and the longer-than-usual growing season to the shorter-than-usual snow duration and, as a consequence, a faster-than-usual depletion of soil moisture. In this framework, an important difference emerged between grasslands and forests, with the former showing a clear drop in GPP during the second part of the growing season that was not reflected by forests, which instead maintained average GPP even well into the summer season and even when soil moisture was very low. This discrepancy is due to both better adaptation strategies of forests compared to grasslands (Galvagno et al., 2013), and to the former accessing deeper soil moisture than grass via roots-regolith interactions (Bales et al., 2018; Klos et al., 2018; Baldocchi et al., 2021). Because forests occupy at least 46 % of the surface of the Alps (Alpine Convention, 2015), we conclude that GPP enhancement at medium-to-high elevations is a dominant but largely unexplored impact of snow-droughts in Mediterranean region.
This increase in GPP and ET, compounded by shallower and more ephemeral snow and the statistically increase in summer temperatures, may explain the decline in summer runoff and runoff coefficient after a snow drought as visible in Fig. 3. A first potential mechanism at play could be, again, ET enhancement, because of priority allocation of water to ET rather than runoff, which effectively diminishes the proportion of precipitation that is converted to runoff during droughts compared to wet periods (Goulden and Bales, 2014; Bales et al., 2018; Avanzi et al., 2020). A second mechanism could be enhanced soil dryness, which may lead to more precipitation being allocated to infiltration than during non-snow-drought years (Segura, 2021). These mechanisms are likely to co-exist during snow droughts and have a strong potential of escalation along elevation gradients, as allocation to ET or storage upstream further propagates and escalates downstream (Fig. 9). The observed decline both in summer runoff and in annual runoff efficiency after a snow drought agrees with previous work (Segura, 2021; Chartier-Rescan et al., 2025; Hammond et al., 2024), can be directly connected to the finding that droughts alter the precipitation-runoff relationship (Avanzi et al., 2020), and expands these findings to snow-dominated Mediterranean catchments. In this framework, while Matanó et al. (2025) have recently found that snow-dominated regions of the world exhibit fewer changes in catchment response due to drought, our results across a variety of mountainous catchments confirm that dry-warm snow droughts are a crucial hazard for water supply from such regions.
The final impact in this chain of mechanisms is represented by societal water-supply restrictions (Fig. 9). A potentially surprising finding in this regard is that these impacts took place at all elevations (Figs. 7 and 8), rather than being confined to water-limited regions as one may expect. It even appears that the area with the highest density of emergency restrictions was the foothills of the Alpine region (Fig. 7). This, together with the outcome of our survey of mountain huts, leads to the perhaps unexpected conclusion that water-supply impacts of snow droughts may increase rather than decrease with elevation.
This outcome can be explained by several aspects of water-supply vulnerability, which are deeply rooted both in water infrastructure and water policy. Water infrastructure is the first factor. Our survey among mountain-hut managers suggested that impacts were associated with a highly vulnerable water-supply paradigm based on surface runoff from snowmelt, which is obviously exposed to inter-annual variability in snow accumulation and in particularly snow droughts. Such a paradigm is ubiquitous in Alpine mountain regions, while many lowland areas across the Po floodplain rely on groundwater wells which offer greater long-term resilience (Carlson et al., 2025). Next, from a water-policy standpoint, lowland regions may have received greater attention and resilience-related investments than headwater regions. Indeed, lowlands are densely populated and hotspots of agricultural and industrial productivity, which means that they have been the target of a variety of investments and monitoring efforts that reduced their vulnerability to snow droughts (e.g. redundant water ways or dense monitoring networks). On the other hand, high-elevation regions are often ungauged, with little to no water infrastructure. Our survey of impacts from news sources found even anecdotal evidence of emergency water deliveries from the floodplains to the headwaters during the peak of the 2022–2023 snow droughts, a process that anthropogenically inverts the water cycle. These results show for the first time that, during snow droughts, runoff decline escalates downstream, but societal impacts may even escalate upstream, with an implicit intersection at intermediate elevations.
The impacts of snow droughts can only be understood and managed systemically rather than sector by sector. The need for a holistic understanding of snow-drought impacts is particularly urgent given that the majority (53 %) of investigated drought events in our sample were characterized by both low precipitation and high temperatures. This scenario presents an existential challenge for mountain water supply that directly points to increasing aridity in a warming climate. These changes represent a paradigm shift in how mountains contribute to the global water cycle.
Streamflow data were from the database of the Italian Regional Administrations and Autonomous Provinces, accessible by CIMA Research Foundation through the Italian Department of Civil Protection, and a comprehensive hydrological dataset covering the Alpine region for the period September 2004 to August 2023 (https://edp-portal.eurac.edu/geonetwork/srv/api/records/9e195271-02ae-40be-b3a7-525f57f53c80, last access: 17 April 2025). Snow data were from the IT-SNOW open-source snow reanalysis product (https://doi.org/10.5281/zenodo.7034956, Avanzi et al., 2022), while precipitation and temperature data were from the BIBGANG dataset (https://www.isprambiente.gov.it/pre_meteo/idro/BIGBANG_ISPRA.html, last access: 3 October 2025). Remote-sensing-based GPP came from the Penman–Monteith–Leuning Evapotranspiration product, PML_V2 (Gan et al., 2018; Zhang et al., 2019), while the “Greenup” layer was from the MODIS product MCD12Q2v061 (https://doi.org/10.5067/MODIS/MCD12Q2.061, Friedl et al., 2022). Data from IT-Tor and IT-TrF stations were downloaded from the ICOS Carbon portal (Cremonese et al., 2025; Ferraris et al., 2025). Emergency water-use restrictions are available through the various municipal administrations, while we summarized the most significant data from the mountain-hut survey in Fig. 8.
The supplement related to this article is available online at https://doi.org/10.5194/hess-30-5769-2026-supplement.
FA, ST, and GB collected and processed streamflow data. FA processed SWE, precipitation, and temperature data. MC processed GPP and greenind data. MG processed flux-tower data. ST, GB, FA, EC, FM, MA, and AG processed water restriction data. FA and FM prepared and distributed the mountain-hut survey. FA prepared the first draft of the paper, which was then reviewed and discussed among all coauthors towards multiple rounds and focus groups.
At least one of the (co-)authors is a member of the editorial board of Hydrology and Earth System Sciences. The peer-review process was guided by an independent editor, and the authors also have no other competing interests to declare.
Publisher's note: Copernicus Publications remains neutral with regard to jurisdictional claims made in the text, published maps, institutional affiliations, or any other geographical representation in this paper. The authors bear the ultimate responsibility for providing appropriate place names. Views expressed in the text are those of the authors and do not necessarily reflect the views of the publisher.
Francesco Avanzi, Edoardo Cremonese, Giacomo Bertoldi, Mariapina Castelli, Andrea Galletti, and Stefano Terzi were supported by the RETURN Extended Partnership, which received funding from the European Union NextGenerationEU (National Recovery and Resilience Plan – NRRP, Mission 4, Component 2, Investment 1.3 – D.D. 1243 2/8/2022, PE0000005). Francesco Avanzi, Giacomo Bertoldi, Mariapina Castelli, and Stefano Terzi were supported by the Interreg Alpine Space, under Project number ASP0500403, Alpine DROught Prediction, A-DROP. Giacomo Bertoldi was supported by a joint project of the Swiss National Science Foundation 527 (SNF) and Autonomous Province of Bolzano (Italy) – “SnowTinel: Sentinel-1 SAR assisted catchment hydrology: toward an improved snow-melt dynamics for alpine regions” (contract 529 no. 200021L 205190). Francesco Avanzi, Simone Gabellani, Lauro Rossi, and Luca Ferraris were supported by the Italian Civil Protection Department. The authors would like to thank the ICOS PI for providing the data of the IT-TrF and IT-Tor stations. We want to acknowledge Silvia Porcu (CIMA Research Foundation) for her assistance with Fig. 9. This research was performed within the framework of the “Drought in Mountain Regions” working group of the HELPING decade of the International Association of Hydrological Sciences (IAHS).
This research has been supported by the NextGenerationEU (grant no. PE0000005), the Interreg (grant no. ASP0500403), and the Schweizerischer Nationalfonds zur Förderung der Wissenschaftlichen Forschung (grant no. 200021L 205190).
This paper was edited by Manuela Irene Brunner and reviewed by Alexander Gottlieb and one anonymous referee.
Adler, C., Wester, P., Bhatt, I., Huggel, C., Insarov, G., Morecroft, M., Muccione, V., and Prakash, A.: Cross-Chapter Paper 5: Mountains, Cambridge University Press, Cambridge, UK and New York, USA, 2273–2318, https://doi.org/10.1017/9781009325844.022, 2022. a
Alpine Convention: The Statement on the Value of Alpine Forests and the Alpine Convention's Protocol on Mountain Forests in the framework of the international forestry policies beyond 2015, Technical report/working group report, Alpine Convention, ISBN 978-88-97500-25-4, https://www.alpconv.org/en/home/news-publications/publications-multimedia/detail/the-statement-on-the-value-of-alpine-forests-and-the-alpine-conventions-protocol-on-mountain-forest/ (last access: 10 September 2026), 2015. a
Avanzi, F., Rungee, J., Maurer, T., Bales, R., Ma, Q., Glaser, S., and Conklin, M.: Climate elasticity of evapotranspiration shifts the water balance of Mediterranean climates during multi-year droughts, Hydrol. Earth Syst. Sci., 24, 4317–4337, https://doi.org/10.5194/hess-24-4317-2020, 2020. a, b, c, d, e
Avanzi, F., Ercolani, G., Gabellani, S., Cremonese, E., Pogliotti, P., Filippa, G., Morra di Cella, U., Ratto, S., Stevenin, H., Cauduro, M., and Juglair, S.: Learning about precipitation lapse rates from snow course data improves water balance modeling, Hydrol. Earth Syst. Sci., 25, 2109–2131, https://doi.org/10.5194/hess-25-2109-2021, 2021. a, b
Avanzi, F., Gabellani, S., Delogu, F., Silvestro, F., Pignone, F., Bruno, G., Pulvirenti, L., Squicciarino, G., Fiori, E., Rossi, L., Puca, S., Toniazzo, A., Giordano, P., Falzacappa, M., Ratto, S., Stevenin, H., Cardillo, A., Fioletti, M., Cazzuli, O., Cremonese, E., Morra di Cella, U., and Ferraris, L.: IT-SNOW: a snow reanalysis for Italy blending modeling, in-situ data, and satellite observations, Zenodo [data set], https://doi.org/10.5281/zenodo.7034956, 2022. a, b, c, d, e, f, g
Avanzi, F., Gabellani, S., Delogu, F., Silvestro, F., Pignone, F., Bruno, G., Pulvirenti, L., Squicciarino, G., Fiori, E., Rossi, L., Puca, S., Toniazzo, A., Giordano, P., Falzacappa, M., Ratto, S., Stevenin, H., Cardillo, A., Fioletti, M., Cazzuli, O., Cremonese, E., Morra di Cella, U., and Ferraris, L.: IT-SNOW: a snow reanalysis for Italy blending modeling, in situ data, and satellite observations (2010–2021), Earth Syst. Sci. Data, 15, 639–660, https://doi.org/10.5194/essd-15-639-2023, 2023. a
Avanzi, F., Munerol, F., Milelli, M., Gabellani, S., Massari, C., Girotto, M., Cremonese, E., Galvagno, M., Bruno, G., Morra di Cella, U., Rossi, L., Altamura, M., and Ferraris, L.: Winter snow deficit was a harbinger of summer 2022 socio-hydrologic drought in the Po Basin, Italy, Communications Earth and Environment, 5, 64, https://doi.org/10.1038/s43247-024-01222-z, 2024. a, b, c, d, e, f, g, h
Avanzi, F., Gabellani, S., Delogu, F., Silvestro, F., Pignone, F., Bruno, G., Pulvirenti, L., Squicciarino, G., Fiori, E., Rossi, L., Puca, S., Toniazzo, A., Giordano, P., Falzacappa, M., Ratto, S., Stevenin, H., Cardillo, A., Fioletti, M., Cazzuli, O., Cremonese, E., Morra di Cella, U., and Ferraris, L.: IT-SNOW: a snow reanalysis for Italy blending modeling, in-situ data, and satellite observations [Dataset]. In IT-SNOW: a snow reanalysis for Italy blending modeling, in situ data, and satellite observations (2010–2021) (Version v5, Vol. 15, pp. 639–660), Zenodo [data set], https://doi.org/10.5281/zenodo.17226478, 2025. a
Baglioni, L., Morresi, D., Garbarino, M., Urbinati, C., Lingua, E., Marzano, R., and Vitali, A.: Forestlines in Italian mountains are shifting upward: detection and monitoring using satellite time series, Biogeosciences, 22, 4349–4366, https://doi.org/10.5194/bg-22-4349-2025, 2025. a
Baldocchi, D. D.: Assessing the eddy covariance technique for evaluating carbon dioxide exchange rates of ecosystems: past, present and future, Glob. Change Biol., 9, 479–492, 2003. a
Baldocchi, D., Ma, S., and Verfaillie, J.: On the inter-and intra-annual variability of ecosystem evapotranspiration and water use efficiency of an oak savanna and annual grassland subjected to booms and busts in rainfall, Glob. Change Biol., 27, 359–375, 2021. a
Bales, R., Molotch, N. P., Painter, T. H., Dettinger, M. D., Rice, R., and Dozier, J.: Mountain hydrology of the western United States, Water Resour. Res., 42, W08432, https://doi.org/10.1029/2005WR004387, 2006. a, b
Bales, R. C., Goulden, M. L., Hunsaker, C. T., Conklin, M. H., Hartsough, P. C., O'Geen, A. T., Hopmans, J. W., and Safeeq, M.: Mechanisms controlling the impact of multi-year drought on mountain hydrology, Sci. Rep., 8, 690, https://doi.org/10.1038/s41598-017-19007-0, 2018. a, b, c, d, e, f, g, h
Barnett, T., Dümenil, L., Schlese, U., and Roeckner, E.: The effect of Eurasian snow cover on global climate, Science, 239, 504–507, 1988. a
Barnett, T. P., Adam, J. C., and Lettenmaier, D. P.: Potential impacts of a warming climate on water availability in snow-dominated regions, Nature, 438, 303–309, https://doi.org/10.1038/nature04141, 2005. a
Barnett, T. P., Pierce, D. W., Hidalgo, H. G., Bonfils, C., Santer, B. D., Das, T., Bala, G., Wood, A. W., Nozawa, T., Mirin, A. A., Cayan, D. R., and Dettinger, M. D.: Human-induced changes in the hydrology of the western United States, Science, 319, 1080–1083, 2008. a
Beltramo, R., Duglio, S., and Cappelletti, G. M.: Should I stay or Can I Go? Accessible tourism and mountain huts in Gran Paradiso National Park, Sustainability, 14, 2936, https://doi.org/10.3390/su14052936, 2022. a
Bertoldi, G., Bozzoli, M., Crespi, A., Matiu, M., Giovannini, L., Zardi, D., and Majone, B.: Diverging snowfall trends across months and elevation in the northeastern Italian Alps, Int. J. Climatol., 2023, 2794–2819, 2023. a
Biella, R., Shyrokaya, A., Ionita, M., Vignola, R., Sutanto, S. J., Todorovic, A., Teutschbein, C., Cid, D., Llasat, M. C., Alencar, P., Matanó, A., Ridolfi, E., Moccia, B., Pechlivanidis, I., van Loon, A., Wendt, D. E., Stenfors, E., Russo, F., Vidal, J.-P., Barker, L., de Brito, M. M., Lam, M., Bláhová, M., Trambauer, P., Hamed, R., McGrane, S. J., Ceola, S., Bakke, S. J., Krakovska, S., Nagavciuc, V., Tootoonchi, F., Di Baldassarre, G., Hauswirth, S., Maskey, S., Zubkovych, S., Wens, M., and Tallaksen, L. M.: The 2022 drought needs to be a turning point for European drought risk management, Nat. Hazards Earth Syst. Sci., 25, 4475–4501, https://doi.org/10.5194/nhess-25-4475-2025, 2025. a
Blandini, G., Avanzi, F., Campo, L., Gabellani, S., Aalstad, K., Girotto, M., Yamaguchi, S., Hirashima, H., and Ferraris, L.: Learning to filter: snow data assimilation using a Long Short-Term Memory network, The Cryosphere, 19, 4759–4783, https://doi.org/10.5194/tc-19-4759-2025, 2025. a
Bozzoli, M., Crespi, A., Matiu, M., Majone, B., Giovannini, L., Zardi, D., Brugnara, Y., Bozzo, A., Cat Berro, D., Mercalli, L., and Bertoldi, G.: Long-term snowfall trends and variability in the Alps, Int. J. Climatol., 2024, https://doi.org/10.1002/joc.8002, 2024. a, b
Braca, G. and Ducci, D.: Development of a GIS Based Procedure (BIGBANG 1.0) for evaluating groundwater balances at national scale and comparison with groundwater resources evaluation at local scale, in: Groundwater and Global Change in the Western Mediterranean Area, edited by: Calvache, M. L., Duque, C., and Pulido-Velazquez, D., Springer International Publishing, Cham, 53–61, https://doi.org/10.1007/978-3-319-69356-9_7, 2018. a
Braca, G., Bussettini, M., Lastoria, B., Mariani, S., and Piva, F.: Il Bilancio Idrologico GIS BAsed a scala Nazionale su Griglia regolare – BIGBANG: metodologia e stime. Rapporto sulla disponibilità naturale della risorsa idrica, Tech. Rep. 339/2021, Istituto Superiore per la Protezione e la Ricerca Ambientale (ISPRA), Roma, Italy, https://www.isprambiente.gov.it/files2021/pubblicazioni/rapporti/rapporto_ispra_339-21_bigbang_ld.pdf (last access: 19 May 2026), 2021. a
Bruno, G., Avanzi, F., Gabellani, S., Ferraris, L., Cremonese, E., Galvagno, M., and Massari, C.: Disentangling the role of subsurface storage in the propagation of drought through the hydrological cycle, Adv. Water Resour., 169, 104305, https://doi.org/10.1016/j.advwatres.2022.104305, 2022. a, b
Carlson, G., Massari, C., Rotiroti, M., Bonomi, T., Preziosi, E., Wilder, A., Whitaker, D., and Girotto, M.: Intensive irrigation buffers groundwater declines in key European breadbasket, Nature Water, 1–10, https://doi.org/10.1038/s44221-025-00445-4, 2025. a, b, c
Carrer, M., Dibona, R., Prendin, A. L., and Brunetti, M.: Recent waning snowpack in the Alps is unprecedented in the last six centuries, Nat. Clim. Change, 13, 155–160, 2023. a
Chartier-Rescan, C., Wood, R. R., and Brunner, M. I.: Snow drought propagation and its impacts on streamflow drought in the Alps, Environ. Res. Lett., 20, 054032, https://doi.org/10.1088/1748-9326/adc824, 2025. a, b
Chiambretti, I., Dellavedova, P., Segor, V., Valt, M., and Cianfarra, P.: Winter 2013/2014 on the Italian Alps – Analysis and Lesson Learned About Avalanche Risk Treatment and Management Strategies, in: Proceedings of the ISSW 2014, https://arc.lib.montana.edu/snow-science/item/2186 (last access: 11 September 2026), 2014. a
Colombo, N., Guyennon, N., Valt, M., Salerno, F., Godone, D., Cianfarra, P., Freppaz, M., Maugeri, M., Manara, V., Acquaotta, F., Petrangeli, A. B., and Romano, E.: Unprecedented snow-drought conditions in the Italian Alps during the early 2020s, Environ. Res. Lett., 18, 074014, https://doi.org/10.1088/1748-9326/acdb88, 2023. a
Cowherd, M., Leung, L. R., and Girotto, M.: Evolution of global snow drought characteristics from 1850 to 2100, Environ. Res. Lett., 18, 064043, https://doi.org/10.1088/1748-9326/acd804, 2023. a
Cremonese, E., Galvagno, M., and Morra di Cella, U.: ETC L2 ARCHIVE from Torgnon, 2016–2024, ICOS RI, iCOS RI data resource, https://hdl.handle.net/11676/JZIDLUbkyXeyHCypLm6JIaPu (last access: 10 September 2026), 2025. a
Dall'Amico, M., Tasin, S., Di Paolo, F., Brian, M., Leoni, P., Tornatore, F., Formetta, G., Wani, J. M., Rigon, R., and Roati, G.: 30-years (1991–2021) snow water equivalent dataset in the Po River district, Italy, Scientific Data, 12, 374, https://doi.org/10.1038/s41597-025-04633-5, 2025. a
Di Mauro, B., Baccolo, G., Garzonio, R., Giardino, C., Massabò, D., Piazzalunga, A., Rossini, M., and Colombo, R.: Impact of impurities and cryoconite on the optical properties of the Morteratsch Glacier (Swiss Alps), The Cryosphere, 11, 2393–2409, https://doi.org/10.5194/tc-11-2393-2017, 2017. a
Dietz, A. J., Kuenzer, C., Gessner, U., and Dech, S.: Remote sensing of snow – a review of available methods, Int. J. Remote Sens., 33, 4094–4134, https://doi.org/10.1080/01431161.2011.640964, 2012. a
Fattorini, S.: The role of vegetation in elevational diversity patterns of tenebrionid beetles in Central Italy, Diversity, 16, 110, https://doi.org/10.3390/d16020110, 2024. a
Feng, X., Thompson, S. E., Woods, R., and Porporato, A.: Quantifying asynchronicity of precipitation and potential evapotranspiration in Mediterranean climates, Geophys. Res. Lett., 46, 14692–14701, 2019. a, b
Ferraris, D., Filippa, G., and Galvagno, M.: ETC L2 ARCHIVE from Torgnon-LD, 2012–2024, ICOS RI, iCOS RI data resource, https://hdl.handle.net/11676/VJs2fq0IhrnIESzg3bccsxI4 (last access: 10 September 2026), 2025. a
Filippa, G., Maggioni, M., Zanini, E., and Freppaz, M.: Analysis of continuous snow temperature profiles from automatic weather stations in Aosta Valley (NW Italy): uncertainties and applications, Cold Reg. Sci. Technol., 104–105, 54–62, 2014. a, b
Flanner, M. G., Shell, K. M., Barlage, M., Perovich, D. K., and Tschudi, M. A.: Radiative forcing and albedo feedback from the Northern Hemisphere cryosphere between 1979 and 2008, Nat. Geosci., 4, 151–155, https://doi.org/10.1038/ngeo1062, 2011. a
Friedl, M., Gray, J., and Sulla-Menashe, D.: MODIS/terra+aqua land cover dynamics yearly L3 global 500 m SIN grid V061, NASA EOSDIS Land Processes DAAC, Missoula, MT, USA [data set], https://doi.org/10.5067/MODIS/MCD12Q2.061, 2022. a, b
Galvagno, M., Wohlfahrt, G., Cremonese, E., Rossini, M., Colombo, R., Filippa, G., Julitta, T., Manca, G., Siniscalco, C., Morra di Cella, U., and Migliavacca, M.: Phenology and carbon dioxide source/sink strength of a subalpine grassland in response to an exceptionally short snow season, Environ. Res. Lett., 8, 025008, https://doi.org/10.1088/1748-9326/8/2/025008, 2013. a, b, c, d
Gan, R., Zhang, Y., Shi, H., Yang, Y., Eamus, D., Cheng, L., Chiew, F. H., and Yu, Q.: Use of satellite leaf area index estimating evapotranspiration and gross assimilation for Australian ecosystems, Ecohydrology, 11, e1974, https://doi.org/10.1002/eco.1974, 2018. a, b
García-Herrera, R., Garrido-Perez, J. M., Barriopedro, D., Ordóñez, C., Vicente-Serrano, S. M., Nieto, R., Gimeno, L., Sorí, R., and Yiou, P.: The European 2016/17 drought, J. Climate, 32, 3169–3187, 2019. a
Girotto, M., Formetta, G., Azimi, S., Bachand, C., Cowherd, M., De Lannoy, G., Lievens, H., Modanesi, S., Raleigh, M. S., Rigon, R., and Massari, C.: Identifying snowfall elevation patterns by assimilating satellite-based snow depth retrievals, Sci. Total Environ., 906, 167312, https://doi.org/10.1016/j.scitotenv.2023.167312, 2024. a, b
Gottlieb, A. R. and Mankin, J. S.: Observing, measuring, and assessing the consequences of snow drought, B. Am. Meteorol. Soc., 103, E1041–E1060, 2022. a, b, c
Goulden, M. L. and Bales, R. C.: Mountain runoff vulnerability to increased evapotranspiration with vegetation expansion, P. Natl. Acad. Sci. USA, 111, 14071–14075, https://doi.org/10.1073/pnas.1319316111, 2014. a, b
Goulden, M. L., Anderson, R. G., Bales, R. C., Kelly, A. E., Meadows, M., and Winston, G. C.: Evapotranspiration along an elevation gradient in California's Sierra Nevada, J. Geophys. Res.-Biogeo., 117, https://doi.org/10.1029/2012JG002027, 2012. a
Gray, J., Sulla-Menashe, D., and Friedl, M. A.: User guide to collection 6 modis land cover dynamics (mcd12q2) product, NASA EOSDIS Land Processes DAAC, Missoula, MT, USA, 6, 1–8, https://modis-land.gsfc.nasa.gov/pdf/MODIS_Land_Cover_Dynamics_MCD12Q2_C61_Product.pdf (last access: 11 September 2026), 2019. a
Hagenlocher, M., Naumann, G., Meza, I., Blauhut, V., Cotti, D., Döll, P., Ehlert, K., Gaupp, F., Van Loon, A. F., Marengo, J. A., Rossi, L., Sabino Siemons, A. S., Siebert, S., Tsehayu, A. T., Toreti, A., Tsegai, D., Vera, C., Vogt, J., and Wens, M.: Tackling growing drought risks – the need for a systemic perspective, Earths Future, 11, e2023EF003857, https://doi.org/10.1029/2023EF003857, 2023. a
Hamlet, A. F., Mote, P. W., Clark, M. P., and Lettenmaier, D. L.: Effects of temperature and precipitation variability on snowpack trends in the western United States, J. Climate, 18, 4545–4561, https://doi.org/10.1175/JCLI3538.1, 2005. a
Hammond, J., Putman, A., Barnhart, T., Sexstone, G., McCabe, G., Wolock, D., Heldmyer, A., and Kampf, S.: Streamflow timing and magnitude during snow drought depend on snow drought type and regional hydroclimate, Hydrolog. Sci. J., 69, 1702–1716, 2024. a, b, c, d, e, f, g, h
Han, J., Yang, Y., Guo, Y., Li, C., Liu, Z., Tu, Z., and Xi, H.: Changes in snow drought and the impacts on streamflow across northern catchments, Water Resour. Res., 61, e2024WR037492, https://doi.org/10.1029/2024WR037492, 2025. a, b
Hanus, S., Burek, P., Smilovic, M., Seibert, J., and Viviroli, D.: Seasonal variability in the global relevance of mountains to satisfy lowland water demand, Environ. Res. Lett., 19, 114078, https://doi.org/10.1088/1748-9326/ad8507, 2024. a, b
Harpold, A. A., Dettinger, M., and Rajagopal, S.: Defining snow drought and why it matters, EOS, 98, https://doi.org/10.1029/2017EO068775, 2017. a, b, c
Harrison, B. and Bales, R.: Skill assessment of water supply forecasts for western Sierra Nevada watersheds, J. Hydrol., 21, 04016002, https://doi.org/10.1061/(ASCE)HE.1943-5584.0001327, 2016. a, b
Hatchett, B. J. and McEvoy, D. J.: Exploring the origins of snow drought in the northern Sierra Nevada, California, Earth Interact., 22, 1–13, https://doi.org/10.1175/EI-D-17-0027.1, 2018. a, b
Hatchett, B. J., Daudert, B., Garner, C. B., Oakley, N. S., Putnam, A. E., and White, A. B.: Winter snow level rise in the northern Sierra Nevada from 2008 to 2017, Water-Sui., 9, 899, https://doi.org/10.3390/w9110899, 2017. a
Hatchett, B. J., Rhoades, A. M., and McEvoy, D. J.: Monitoring the daily evolution and extent of snow drought, Nat. Hazards Earth Syst. Sci., 22, 869–890, https://doi.org/10.5194/nhess-22-869-2022, 2022. a, b
Huning, L. S. and AghaKouchak, A.: Global snow drought hot spots and characteristics, P. Natl. Acad. Sci. USA, 117, 19753–19759, https://doi.org/10.1073/pnas.1915921117, 2020. a, b, c, d, e
Joshi, J., Stocker, B. D., Hofhansl, F., Zhou, S., Dieckmann, U., and Prentice, I. C.: Towards a unified theory of plant photosynthesis and hydraulics, Nature Plants, 8, 1304–1316, 2022. a
Klos, P. Z., Goulden, M. L., Riebe, C. S., Tague, C. L., O’Geen, A. T., Flinchum, B. A., Safeeq, M., Conklin, M. H., Hart, S. C., Berhe, A. A., Hartsough, P. C., Holbrook, W. S., and Bales, R. C.: Subsurface plant-accessible water in mountain ecosystems with a Mediterranean climate, WIRES Water, 5, e1277, https://doi.org/10.1002/wat2.1277, 2018. a
Koehler, J., Dietz, A. J., Zellner, P., Baumhoer, C. A., Dirscherl, M., Cattani, L., Vlahović, Ž., Alasawedah, M. H., Mayer, K., Haslinger, K., Bertoldi, G., Jacob, A., and Kuenzer, C.: Drought in Northern Italy: long earth observation time series reveal snow line elevation to be several hundred meters above long-term average in 2022, Remote Sens.-Basel, 14, 6091, https://doi.org/10.3390/rs14236091, 2022. a
Kottegoda, N. T. and Rosso, R.: Applied Statistics for Civil and Environmental Engineers, McGraw-Hill, ISBN 978-1-4051-7917-1, 2008. a, b
Kraft, M. and McNamara, J. P.: Evapotranspiration across the rain–snow transition in a semi-arid watershed, Hydrol. Process., 36, e14519, https://doi.org/10.1002/hyp.14519 2022. a
Livneh, B. and Badger, A. M.: Drought less predictable under declining future snowpack, Nat. Clim. Change, 10, 452–458, 2020. a
López-Moreno, J. I., Callow, N., McGowan, H., Webb, R., Schwartz, A., Bilish, S., Revuelto, J., Gascoin, S., Deschamps-Berger, C., and Alonso-González, E.: Marginal snowpacks: the basis for a global definition and existing research needs, Earth-Sci. Rev., https://doi.org/10.1016/j.earscirev.2024.104751, 2024. a, b
Lorenzi, V., Sbarbati, C., Banzato, F., Lacchini, A., and Petitta, M.: Recharge assessment of the Gran Sasso aquifer (Central Italy): time-variable infiltration and influence of snow cover extension, J. Hydrol., 41, 101090, https://doi.org/10.1016/j.ejrh.2022.101090, 2022. a
Magnusson, J., Gustafsson, D., Hüsler, F., and Jonas, T.: Assimilation of point SWE data into a distributed snow cover model comparing two contrasting methods, Water Resour. Res., 50, 7816–7835, https://doi.org/10.1002/2014WR015302, 2014. a
Mariani, S., Braca, G., Lastoria, B., Tropeano, R., Casaioli, M., Piva, F., and Bussettini, M.: Il bilancio idrologico, la disponibilità di risorsa idrica e il bilancio idrico, in: Siccità, scarsità e crisi idriche, edited by: Romano, E. and Portoghese, I., Vol. 1 of Habitat Signa, Cnr Edizioni, Roma, https://doi.org/10.69115/habitatsigna-2024-1/01, 29–46, 2024. a, b
Massari, C., Avanzi, F., Bruno, G., Gabellani, S., Penna, D., and Camici, S.: Evaporation enhancement drives the European water-budget deficit during multi-year droughts, Hydrol. Earth Syst. Sci., 26, 1527–1543, https://doi.org/10.5194/hess-26-1527-2022, 2022. a
Mastrotheodoros, T., Pappas, C., Molnar, P., Burlando, P., Manoli, G., Parajka, J., Rigon, R., Szeles, B., Bottazzi, M., Hadjidoukas, P., and Fatichi, S.: More green and less blue water in the Alps during warmer summers, Nat. Clim. Change, 10, 155–161, 2020. a
Matanó, A., Hamed, R., Brunner, M. I., Barendrecht, M. H., and Van Loon, A. F.: Drought decreases annual streamflow response to precipitation, especially in arid regions, Hydrol. Earth Syst. Sci., 29, 2749–2764, https://doi.org/10.5194/hess-29-2749-2025, 2025. a
Montanari, A., Nguyen, H., Rubinetti, S., Ceola, S., Galelli, S., Rubino, A., and Zanchettin, D.: Why the 2022 Po River drought is the worst in the past two centuries, Science Advances, 9, eadg8304, https://doi.org/10.1126/sciadv.adg8304, 2023. a, b, c
Mote, P. W., Li, S., Lettenmaier, D. P., Xiao, M., and Engel, R.: Dramatic declines in snowpack in the western US, npj Climate and Atmospheric Science, 1, https://doi.org/10.1038/s41612-018-0012-1, 2018. a
Mountain Research Initiative EDW Working Group: Elevation-dependent warming in mountain regions of the world, Nat. Clim. Change, 5, 424–430, 2015. a
Musselmann, K. N., Clark, M. P., Liu, C., Ikeda, K., and Rasmussen, R.: Slower snowmelt in a warmer world, Nat. Clim. Change, 7, 214–219, https://doi.org/10.1038/nclimate3225, 2017. a
Napoli, A., Crespi, A., Ragone, F., Maugeri, M., and Pasquero, C.: Variability of orographic enhancement of precipitation in the Alpine region, Sci. Rep.-UK, 9, 1–8, https://doi.org/10.1038/s41598-019-49974-5, 2019. a
Oddi, L., Migliavacca, M., Cremonese, E., Filippa, G., Vacchiano, G., Siniscalco, C., Morra di Cella, U., and Galvagno, M.: Contrasting responses of forest growth and carbon sequestration to heat and drought in the Alps, Environ. Res. Lett., 17, 045015, https://doi.org/10.1088/1748-9326/ac5b3a, 2022. a, b
Oroza, C. A., Bales, R. C., Stacy, E. M., Zheng, Z., and Glaser, S. D.: Long-term variability of soil moisture in the southern Sierra: measurement and prediction, Vadose Zone J., 17, 170178, https://doi.org/10.2136/vzj2017.10.0178, 2018. a
Peel, M. C., Finlayson, B. L., and McMahon, T. A.: Updated world map of the Köppen-Geiger climate classification, Hydrol. Earth Syst. Sci., 11, 1633–1644, https://doi.org/10.5194/hess-11-1633-2007, 2007. a
Pepin, N., Apple, M., Knowles, J., Terzago, S., Arnone, E., Hänchen, L., Napoli, A., Potter, E., Steiner, J., Williamson, S. N., Ahrens, B., Dhar, T., Dimri, A. P., Palazzi, E., Rameshan, A., Salzmann, N., Shahgedanova, M., de Deus Vidal Jr., J., and Zardi, D.: Elevation-dependent climate change in mountain environments, Nature Reviews Earth and Environment, 1–17, https://doi.org/10.1038/s43017-025-00740-4, 2025. a
Petersky, R. and Harpold, A.: Now you see it, now you don't: a case study of ephemeral snowpacks and soil moisture response in the Great Basin, USA, Hydrol. Earth Syst. Sci., 22, 4891–4906, https://doi.org/10.5194/hess-22-4891-2018, 2018. a, b, c, d
Petersky, R. S., Shoemaker, K. T., Weisberg, P. J., and Harpold, A. A.: The sensitivity of snow ephemerality to warming climate across an arid to montane vegetation gradient, Ecohydrology, 12, e2060, https://doi.org/10.1002/eco.2060, 2019. a
Pulliainen, J., Aurela, M., Laurila, T., Aalto, T., Takala, M., Salminen, M., Kulmala, M., Barr, A., Heimann, M., Lindroth, A., Laaksonen, A., Derksen, C., Mäkelä, A., Markkanen, T., Lemmetyinen, J., Susiluoto, J., Dengel, S., Mammarella, I., Tuovinen, J.-P., and Vesala, T.: Early snowmelt significantly enhances boreal springtime carbon uptake, P. Natl. Acad. Sci. USA, 114, 11081–11086, 2017. a
Qin, Y., Abatzoglou, J. T., Siebert, S., Huning, L. S., AghaKouchak, A., Mankin, J. S., Hong, C., Tong, D., Davis, S. J., and Mueller, N. D.: Agricultural risks from changing snowmelt, Nat. Clim. Change, 10, 459–465, 2020. a
Redowan, M.: Spatial pattern of tree diversity and evenness across forest types in Majella National Park, Italy, Forest Ecosystems, 2, 24, https://doi.org/10.1186/s40663-015-0048-1, 2015. a
Rhoades, A. M., Hatchett, B. J., Risser, M. D., Collins, W. D., Bambach, N. E., Huning, L. S., McCrary, R., Siirila-Woodburn, E. R., Ullrich, P. A., Wehner, M. F., Zarzycki, C. M., and Jones, A. D.: Asymmetric emergence of low-to-no snow in the midlatitudes of the American Cordillera, Nat. Clim. Change, 12, 1151–1159, 2022. a
Rossi, G. and Benedini, M.: Water Resources of Italy, Springer, https://doi.org/10.1007/978-3-030-36460-1, 2020. a, b
Rungee, J., Bales, R., and Goulden, M.: Evapotranspiration response to multiyear dry periods in the semiarid western United States, Hydrol. Process., https://doi.org/10.1002/hyp.13322, 2018. a
Sansone, G.: La governance dell'acqua in Italia, in: Siccità, scarsità e crisi idriche, edited by: Romano, E. and Portoghese, I., Vol. 1 of Habitat Signa, Cnr Edizioni, Roma, https://doi.org/10.69115/habitatsigna-2024-1/02, 49–70, 2024. a
Schaefli, B., Hingray, B., and Musy, A.: Climate change and hydropower production in the Swiss Alps: quantification of potential impacts and related modelling uncertainties, Hydrol. Earth Syst. Sci., 11, 1191–1205, https://doi.org/10.5194/hess-11-1191-2007, 2007. a
Segura, C.: Snow drought reduces water transit times in headwater streams, Hydrol. Process., 35, e14437, https://doi.org/10.1002/hyp.14437, 2021. a, b, c
Serreze, M. C., Clark, M. P., Armstrong, R. L., McGinnis, D. A., and Pulwarty, R. S.: Characteristics of the western United States snowpack from snowpack telemetry (SNOTEL) data, Water Resour. Res., 35, 2145–2160, https://doi.org/10.1029/1999WR900090, 1999. a
Sprenger, M., Carroll, R. W. H., Dennedy-Frank, J., Siirila-Woodburn, E. R., Newcomer, M. E., Brown, W., Newman, A., Beutler, C., Bill, M., Hubbard, S. S., and Williams, K. H.: Variability of snow and rainfall partitioning into evapotranspiration and summer runoff across nine mountainous catchments, Geophys. Res. Lett., 49, e2022GL099324, https://doi.org/10.1029/2022GL099324, 2022. a
Stahl, K., Kohn, I., Blauhut, V., Urquijo, J., De Stefano, L., Acácio, V., Dias, S., Stagge, J. H., Tallaksen, L. M., Kampragou, E., Van Loon, A. F., Barker, L. J., Melsen, L. A., Bifulco, C., Musolino, D., de Carli, A., Massarutto, A., Assimacopoulos, D., and Van Lanen, H. A. J.: Impacts of European drought events: insights from an international database of text-based reports, Nat. Hazards Earth Syst. Sci., 16, 801–819, https://doi.org/10.5194/nhess-16-801-2016, 2016. a, b, c, d
Sturm, M., Goldstein, M. A., and Parr, C.: Water and life from snow: a trillion dollar science question, Water Resour. Res., 53, 3534–3544, https://doi.org/10.1002/2017WR020840, 2017. a
Takeuchi, N.: The altitudinal distribution of snow algae on an Alaska glacier (Gulkana Glacier in the Alaska Range), Hydrol. Process., 15, 3447–3459, 2001. a
Terzi, S., Pomella, A., Frey, J.-C., Piemontese, L., Cremonese, E., and Pittore, M.: Advancing drought impact data collection for the Italian Alps through automatic harvesting and analysis of textual data, EGU General Assembly 2025, Vienna, Austria, 27 Apr–2 May 2025, EGU25-10520, https://doi.org/10.5194/egusphere-egu25-10520, 2025. a, b
Toreti, A., Tsegai, D., Maurer, T., Cremonese, E., Rossi, L., Wens, M., de Moel, H., Sabino Siemons, A.-S., Acosta Navarro, J., Hrast Essenfelder, A., Volpi, D., Cotti, D., Sparkes, E., and Hagenlocher, M.: World Drought Atlas, https://op.europa.eu/en/publication-detail/-/publication/9da1cb20-b090-11ef-acb1-01aa75ed71a1/language-en (last access: 11 September 2026), 2024. a
Trujillo, E., Molotch, N. P., Goulden, M. L., Kelly, A. E., and Bales, R. C.: Elevation-dependent influence of snow accumulation on forest greening, Nat. Geosci., 5, 705–709, 2012. a, b
Unbehaun, W., Pröbstl, U., and Haider, W.: Trends in winter sport tourism: challenges for the future, Tourism Review, 63, 36–47, 2008. a
van Tiel, M., Aubry-Wake, C., Somers, L., Andermann, C., Avanzi, F., Baraer, M., Chiogna, G., Daigre, C., Das, S., Drenkhan, F., Farinotti, D., Fyffe, C. L., de Graaf, I., Hanus, S., Immerzeel, W., Koch, F., McKenzie, J. M., Müller, T., Popp, A. L., Saidaliyeva, Z., Schaefli, B., Schilling, O. S., Teagai, K., Thornton, J. M., and Yapiyev, V.: Cryosphere–groundwater connectivity is a missing link in the mountain water cycle, Nature Water, 2, 624–637, 2024. a, b
Viviroli, D., Messerli, H. H. D. B., Meybeck, M., and Weingartner, R.: Mountains of the world, water towers for humanity: typology, mapping, and global significance, Water Resour. Res., 43, W07447, https://doi.org/10.1029/2006WR005653, 2007. a, b
Viviroli, D., Archer, D. R., Buytaert, W., Fowler, H. J., Greenwood, G. B., Hamlet, A. F., Huang, Y., Koboltschnig, G., Litaor, M. I., López-Moreno, J. I., Lorentz, S., Schädler, B., Schreier, H., Schwaiger, K., Vuille, M., and Woods, R.: Climate change and mountain water resources: overview and recommendations for research, management and policy, Hydrol. Earth Syst. Sci., 15, 471–504, https://doi.org/10.5194/hess-15-471-2011, 2011. a
Viviroli, D., Kummu, M., Meybeck, M., Kallio, M., and Wada, Y.: Increasing dependence of lowland populations on mountain water resources, Nature Sustainability, 3, 917–928, 2020. a, b
Viviroli, D., Drenkhan, F., Scott, C. A., Somers, L., and van Tiel, M.: Cascading downstream impacts of water cycle changes in mountain regions, Nat. Clim. Change, 16, 129–142, 2026. a
Zhang, Y., Kong, D., Gan, R., Chiew, F. H., McVicar, T. R., Zhang, Q., and Yang, Y.: Coupled estimation of 500 m and 8-day resolution global evapotranspiration and gross primary production in 2002–2017, Remote Sens. Environ., 222, 165–182, 2019. a, b, c
Zhao, M., A, G., Liu, Y., and Konings, A. G.: Evapotranspiration frequently increases during droughts, Nat. Clim. Change, 12, 1024–1030, 2022. a