
the Creative Commons Attribution 4.0 License.
the Creative Commons Attribution 4.0 License.
 | 25 Aug 2026
Modeling the long-term fate of injected CO2 in saline aquifers: An integrated framework coupling multiphase flow, dissolution, reaction, and ripening
Ruiqi Chen
Wenjie Xu
Yunmin Chen
Qingping Li
Geological carbon sequestration (GCS) mitigates climate change by storing anthropogenic carbon dioxide (CO2) in geological formations. CO2 undergoes complex physical and chemical transformations in deep geological formations, governed by various interacting trapping mechanisms. Because the trapping mechanisms operate over a wide range of different timescales, their long-term interplay remains unclear. We develop an integrated numerical modeling framework to analyze and track the plume footprint and phase transition processes that occur throughout the entire cycle of the injected CO2 in saline aquifers. The key novelty of the modeling framework lies in its capability to describe multiple hydrodynamic processes and their interactions, including injection, dissolution-driven convection, reactive transport, and gravity-induced Ostwald ripening. The results suggest that dissolution reduces the lateral migration of free-state CO2, while geochemical reactions generate preferential pathways for CO2-rich flow. For the scenarios we analyze, after 500 years of mass transfer, dissolved CO2 accounts for 42.80 % of total trapped CO2 mass, while reactive CO2 contributes less than 1 %. The results also illustrate that low vertical permeability is unfavorable for the long-term transition of CO2 from physical trapping to dissolution trapping. When the permeability anisotropy index γ increases from 0.5 to 10, the total dissolution storage amount within the domain is reduced to one-third over the 500-year simulation period. This integrated modeling framework provides critical insights into the long-term evolution of CO2 plume migration and phase transition behavior, thereby offering a practical tool to quantitatively assess the long-term fate of the injected CO2 in saline aquifers.
- Article
(8389 KB) - Full-text XML
- BibTeX
- EndNote


Geological carbon storage (GCS) is a promising technology that involves storing the greenhouse gas CO2 in underground porous rock formations (Lane et al., 2021; Wei et al., 2021). Once CO2 is injected into the reservoir at the in-situ pressure and temperature, structural, residual, dissolution, and mineral trapping may operate concurrently and evolve over different timescales (Krevor et al., 2023). Structural trapping occurs as CO2 migrates and accumulates beneath a low-permeability caprock because of buoyancy (Medici et al., 2024; Rutqvist, 2012). Residual trapping occurs when CO2 bubbles are trapped in the pore structure of the formation. Dissolution trapping and mineral trapping involve the dissolution of CO2 into brine to form the weak acid H2CO3, inducing the dissolution and precipitation of rock minerals (Dai et al., 2020; De Silva et al., 2015). Understanding the spatiotemporal evolution of trapping mechanisms is crucial for the safety and storage efficiency of GCS projects (Ringrose et al., 2021). However, the complex physical and chemical changes at different stages present challenges in predicting the migration pathways of CO2 in the reservoir.
Field monitoring and laboratory experiments have provided preliminary insights into the long-term migration behavior of CO2 in geological reservoirs (Dance and Paterson, 2016; Györe et al., 2017; Jackson and Krevor, 2020; Sathaye et al., 2014; Zhou et al., 2020). During the injection period, CO2 displaces the native brine within rock pores, characterized by a compact displacement front (Birkholzer et al., 2015). Driven by density differences, the injected CO2 migrates rapidly upward to the top of the reservoir, where it spreads laterally beneath the low-permeability caprock (Jing et al., 2023). The heterogeneity of the reservoir also has a significant impact on the long-term distribution of the plume (Yang et al., 2020). Molecular diffusion allows CO2 to dissolve into undersaturated brine, increasing fluid density and inducing gravitational instability (Emami-Meybodi et al., 2015; Guo et al., 2021). This instability gives rise to convective mixing, which enhances the downward transport of dissolved CO2 into deeper regions of the reservoir (Neufeld et al., 2010). The dissolution of CO2 promotes water–rock interactions, leading to carbon mineralization and thereby improving the security of geological storage (Cui et al., 2018). Acidic conditions facilitate carbonate dissolution, which alters the permeability and porosity of the reservoir rock and can generate dissolution features such as wormholes (Sabo and Beckingham, 2021; Seyyedi et al., 2020). Subsequent changes in pore structure further influence the migration pathways of the CO2 plume. Additionally, under gravitational effects, Ostwald ripening can lead to the secondary redistribution of residual trapped CO2 bubbles (Xu et al., 2019a).
Numerical modeling of geological carbon storage (GCS) involves a broad spectrum of temporal scales, ranging from an injection period lasting several decades to mineral trapping processes that may extend over tens of thousands of years. Moreover, accurately capturing CO2 migration pathways necessitates the precise representation of meter-scale convective fingering, as well as kilometer-scale macroscopic plume evolution (Elenius et al., 2015). Consequently, developing a numerical model that adequately encompasses the entire life cycle of GCS poses considerable challenges. In recent years, several modeling approaches have been proposed to study GCS over its full duration. Several numerical models have simulated large-scale dissolved CO2 plume migration, incorporating injection and dissolution processes without considering geochemical reactions (Elenius et al., 2015; De Paoli, 2021; Singh et al., 2019). Wang et al. (2022) developed a fully-coupled model that additionally considers drainage and imbibition effects, though geochemical reactions were not included. Reactive transport models for GCS mainly focus on the long-term transformation of chemical components, with TOUGHREACT being the most typical example (Xu et al., 2011). These reactions significantly alter formation permeability and porosity, thereby influencing fluid flow and solute transport – key factors governing long-term storage efficiency (Fu et al., 2015; Sainz-Garcia et al., 2017). However, a comprehensive model that integrates multiple phase transition, transport and reaction processes and captures their mutual interactions remains lacking, largely due to disparities in temporal scales and numerical convergence difficulties.
Accordingly, the objectives of this study are to: (i) develop an integrated numerical framework for geological carbon storage that couples multiphase flow, dissolution-driven convection, geochemical reaction, and gravity-induced ripening; (ii) elucidate the spatiotemporal evolution and interactions of major trapping mechanisms governing the long-term migration and phase transition of injected CO2 in saline aquifers; (iii) quantify how reactive transport and associated porosity–permeability changes influence plume migration and dissolution behaviour; and (iv) evaluate the effects of calcite content and reservoir permeability anisotropy on the long-term fate of CO2.
2.1 Two-phase flow and multicomponent transport
In the saline aquifer system, the mass conservation equation governing two-phase flow in a porous medium can be expressed as follows:
where subscript α (w or n) represents the wetting phase (w, brine) and nonwetting phase (n, CO2). ϕ denotes the porosity, ρα and Sα represent the phase density and saturation. Assuming that only two fluid phases coexist in the pore space, the saturation of the non-wetting phase satisfies . The intrinsic permeability tensor k is assumed to be that of a homogeneous and isotropic formation. krα and μα respectively denote the relative permeability and viscosity of phase α, while g represents the gravitational acceleration. The term Qα refers to the mass source terms arising from geochemical reaction and dissolution processes.
Dissolved carbon dioxide in brine is treated as a solute component. The transport equation for dissolved CO2, based on Fick's law, is expressed as follows:
where Xc represents the mass fraction of CO2, uw is brine velocity and Dc is diffusion coefficient. The source terms and represent the dissolution and chemical reaction terms, respectively. The dissolution source term is formulated as a function of CO2 saturation with the mass transfer coefficient κ serving as a key parameter (Martinez and Hesse, 2016). The dissolution of the CO2 phase into the brine phase is assumed to occur only in the two-phase region. Treating the dissolution mass as a source term in this way simplifies the simulation of multi-component two-phase flow problems and improves computational efficiency. The mechanical dispersion and adsorption of solutes in brine are neglected.
where Xc,max is the maximum dissolution mass fraction. Furthermore, the density of brine is assumed to be directly proportional to the local concentration, an approximation commonly referred to as the Boussinesq approximation (Diersch and Kolditz, 2002).
where ρ0 is the density of pure brine and Δρ is the density difference between CO2-saturated and pure brine.
Some studies have shown that the capillary transition zone has a significant impact on the buoyant flow of CO2 dissolution in saline aquifer (Elenius et al., 2014; Emami-Meybodi and Hassanzadeh, 2015). The capillary pressure is defined as the pressure difference between the non-wetting phase and the wetting phase, . The capillary pressure–saturation relationship and relative permeability curves of the media are typically described by the Brooks–Corey model. The parameters used are listed in Table 1. The parameter values are selected from reservoir survey data and relevant literature.
where is normalized wetting phase saturation, Swr and Snr are the residual saturation of the two phases. pc0 denotes entry pressure and λ represents pore-size distribution index.
Table 1Parameters of formation and fluid properties.

a Carrigan et al. (2013). b Mathias et al. (2013); Saaltink et al. (2013). c Iglauer et al. (2011); Pini and Benson (2013). d Bennion and Bachu (2008). e Kolditz et al. (2012). f Martinez and Hesse (2016). g (Ennis-King and Paterson, 2005).
2.2 Geochemical reactions
According to previous studies, calcite has a relatively fast reaction rate among all mineral components in sandstone (Xu et al., 2019b). The full-cycle model focuses on a relatively short timescale and concentrates on calcium minerals (calcite, dolomite), considering quartz, feldspar, and other minerals as insoluble substances because their dissolution/precipitation processes take thousands of years (De Silva et al., 2015). The formation of carbonate is considered to be the main way to sequester CO2 and an important process for achieving permanent trapping in GCS (Bachu et al., 1994). To simplify the model, it is assumed that only calcite is included as a reactive mineral, with an initial content of 5 % (Sainz-Garcia et al., 2017). The main geochemical reactions of calcite dissolution in CO2-rich plume are as follows:
(aq) and (s) denote the aqueous and solid phases, respectively. The transport equation for reactive solute transport, accounting for convection, diffusion, and geochemical reactions, can be expressed as follows:
where rC is the reaction term of dissolved CO2, kr and av respectively represent reaction rate constant and mineral surface area available for reaction per volume of the medium. n is the rate of the reaction which is 1 for the second-order reaction. The concentration of component i (CaCO3 and CO2) is represented as ci = ρi×xi. Mineral dissolution occurs rapidly near the injection wells, leading to a rapid increase in pore structure connectivity. Calcite can quickly dissolve in acid in the form of separating particles and biogenic debris fragments, causing changes in the pore network (Lamy-Chappuis et al., 2014). The resulting enhancement in pore connectivity–particularly when dissolution is localized at constricted pore throats–can significantly increase permeability (Dai et al., 2020). In our study, we assume that only dissolution reactions take place within the simulation domain and salt precipitation processes are neglected. The corresponding evolution of porosity and permeability is updated by the following relationship (Saaltink et al., 2013):
where and represent the mass fraction and concentration of calcite, subscript 0 and r represent the initial state and the quantity involved in the reaction.
2.3 Gravity-induced ripening
Residual trapped bubbles undergo mass transfer toward the top of the reservoir via Ostwald ripening under the influence of gravity. The timescale for the system to reach thermodynamic equilibrium through ripening in a 50 m-thick formation can extend to several tens of thousands of years–approximately two to three orders of magnitude longer than that of density-driven convection.
The following assumptions are introduced in the analysis of the long-term Ostwald ripening process:
-
The gas distribution stabilizes and attains the initial ripening state under the assumption that the maximum concentration has been achieved throughout the domain. Our simulation results show that after 500 years, the average CO2 saturation in the reservoir approaches the residual saturation, and according to Eq. (4), dissolution no longer occurs. Therefore, the simulation results at 500 years were selected as the initial condition for the gravity-induced Ostwald ripening process.
-
All bubbles are considered to be in a residually trapped state, with no connectivity between gas phases.
-
With dx = 10 m and dz = 0.5 m as the grid size, the gas in the horizontal direction has reached capillary equilibrium, and no mass transfer occurs in the horizontal direction during the following mass transfer process. Horizontal mass transfer could cause the residually trapped CO2 at the same depth to become more uniform in size and would not lead to appreciable saturation changes at the macroscopic scale.
The governing equations and simulations used in the ripening process employ the approach presented by Xu et al. (2019a). The governing equation can be expressed as:
where the gas phase saturation Sn is defined as the bubble volume within the given interval dz relative to the local pore volume. The pore occupancy ratio C refers to the proportion of adjacent pores which are occupied by bubbles and subscript b represents the CO2 bubble. The parameter Kd ( ) is a constant related to the pore structure and fluid properties. At and Lt represent the pore throat cross-sectional area and vertical distance, respectively. n0 is the number of connected pores around a pore, Lpore is the distance between the geometric centers of the adjacent pores, and Vpore represents the pore volume. Vmb and Vmw represent the molar volumes of the gas and liquid phases, respectively. KH is the modified Henry's coefficient. For parameters and detailed procedures related to gravity-induced ripening, please refer to Chen et al. (2022).
2.4 Numerical solution
Due to the strong nonlinearity inherent in the density-dependent flow equations, a fully coupled approach is employed for the fluid flow and mass transport governing equations. The resulting system of discrete nonlinear equations is solved using the Newton-Raphson method. Simulations of solute transport and multiphase flow processes are conducted using the finite element software OpenGeoSys (OGS), version 5. Geochemical reactions are handled by a dedicated Python-based module, OGS-Chem. An interface module has been implemented within OGS to exchange data on CO2 and calcite concentrations with OGS-Chem (Chen et al., 2020). Porosity is updated at each time step through the variation of the volume fraction of individual minerals, while permeability is modified by applying Eq. (10).
A script was developed to extract the final longitudinal saturation and permeability distributions from the flow and transport simulation, which then served as the initial conditions for the Ostwald ripening analysis in MATLAB. The ripening simulation models vertical (z-direction) mass transfer only, treating each horizontal column of the grid as a separate, independent 1D simulation. Since the timescale of gravity-induced Ostwald ripening is 2–3 orders of magnitude larger than that of convective mixing and reactions, the mass transfer term associated with ripening is very limited. To balance computational efficiency and convergence, we used the final results of the finite element computation as the initial condition for the ripening post-processing calculation.
2.5 Model validation
During the injection period, the numerical model was validated through comparison with the semi-analytical solution derived from the theoretical model of Mathias et al. (2011). Simulation results demonstrated good agreement with this semi-analytical solution. To further assess the model's performance, a convective mixing scenario was also considered for verification. Due to its sensitivity to mesh discretization (Pau et al., 2010), the model reproduces finger-flow patterns and migration distances similar to those shown in Fig. 3 of Elenius et al. (2015). Details of the validation of the injection and dissolution modules can be found in our previous research (Chen et al., 2024).
2.6 Grid convergence
Due to the contradiction between the simulation of the field scale and the fine-scale requirement of dissolved CO2 flow, there is a conflict in grid discretization. The grid size also determines the difficulty of model convergence. Different grid sizes (δx, δz=0.8, 1, 2, 2.5) are analyzed in turn, and the average dimensionless concentration () in the domain of dissolved CO2 is selected as the evaluation index to assess the grid convergence. When the finger flow reaches the bottom boundary (200 years), the difference in dimensionless average concentration c* within the domain does not exceed 0.01 between δx=0.8 and δx=1. Therefore, in order to balance computational efficiency and accuracy, a resolution of δx=1 was selected in subsequent simulations (Wang et al., 2022).
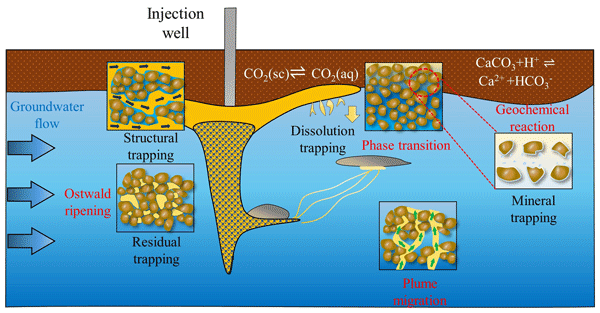
The integrated model considers multiple processes, including CO2 injection, migration, dissolution phase transition, reaction with calcite and subsequent ripening process. A schematic diagram is shown in Fig. 1.

Figure 1Schematic diagram of the life-cycle model involving multiple trapping mechanisms. The figure illustrates the primary physical and chemical processes experienced by CO2 in this model, including injection, dissolution, reaction, and ripening.
The simulation domain is configured as a two-dimensional, rectangular saline aquifer under isothermal conditions. Initially, the domain is fully saturated with brine and has a length of L and a thickness of H. The left boundary of the model represents an injection well, injecting at a constant rate rI for a specified duration TI and then stops. The top boundary is treated as impermeable to simulate the presence of a low-permeability caprock. Both the right and bottom boundaries are assigned zero concentration gradient conditions. A schematic representation of the model setup is provided in Fig. 2.

Considering the complexity of various physical and chemical processes in the life cycle of GCS, the numerical model that describes the footprint of CO2 in the formation needs some assumptions. The model proposed in this study mainly includes the following assumptions:
-
The flow process of both fluid phases in the porous medium follows Darcy's law.
-
The reservoir is homogeneous, isotropic, and has a spatially uniform mineral composition.
-
The increase in brine density caused by dissolution is assumed to be linearly related to concentration variations, following the Boussinesq approximation.
-
Only calcite, present in the initial mineral composition in the formation, participates in geochemical reactions and its dissolution follows a kinetic rate equation. We neglect the salt precipitation process and are therefore unable to capture phenomena such as pore plugging and pressure buildup during plume migration.
-
The system is initially saturated with brine and reaches thermodynamic equilibrium, assuming that the brine is in hydro-static state.
-
CO2 is considered pure without water vapor, and the water produced by geochemical reactions is ignored.
-
Based on the geothermal gradient variation data in the reservoir, the temperature variation within the simulation domain is approximately 1–3 °C. We therefore assume the simulation domain to be an isothermal saline aquifer.
Based on the foregoing assumptions, a long-term simulation of the base case was performed. The evolution of the CO2 plume and pressure distribution, convective mixing dynamics, and reactive transport involving calcite – which induces porosity variations – were systematically examined, with particular emphasis on their mutual interactions. In accordance with the theory of gravity-driven ripening, CO2 mass transfer was simulated over a period of 80 000 years until the system reached a stabilized state. Sensitivity analyses were carried out to evaluate the influence of calcite content and permeability anisotropy. Two sets of numerical experiments were designed: one examining the long-term evolution of the CO2 plume and dissolved CO2 under calcite contents of 0 %, 10 %, and 20 %; the other assessing the effect of permeability anisotropy index γ=0.5, 2, and 10.
4.1 CO2 migration and phase transition
Based on the numerical results, saturation-time curves were extracted for monitoring points located along the top boundary of the reservoir at x=20, 40, 60, 80, 100, and 120 m, as illustrated in Fig. 3. During the injection period, the CO2 plume migrates rapidly upward, causing a sharp increase in saturation at all monitored locations. Points in close proximity to the injection well continue to exhibit a brief saturation increase even after injection ceases, attributable to post-injection buoyancy-driven redistribution. Near the top surface of the reservoir, the CO2 gradually accumulates beneath the caprock, with the maximum saturation at any location not exceeding 0.45.
After cessation of injection, the plume spreads laterally beneath the caprock and gradually dissolves into the brine. As density-driven convection intensifies, the dissolution rate increases, leading to a progressive retreat of the plume's leading edge. This retraction signifies that dissolution limits the lateral extent of the CO2 plume, thereby enhancing the security of the storage complex. This behavior is supported by the saturation evolution observed at x=100 m and x=120 m over several hundred years after injection.

Figure 3The saturation results of CO2 for points spaced at 20 m intervals between 20 and 120 m throughout the entire simulation period.

Figure 4The CO2 saturation distributions are presented at four timesteps: Stopping injection, 1 year after injection, 10 years after injection, and 50 years after injection. After 50 years of dissolution and chemical reactions, the thickness of the CO2 plume has decreased from over 10 to 5 m.
Figure 4 illustrates the evolution of the CO2 plume following the cessation of injection. The plume exhibits a classical funnel-shaped morphology. Within 100 d, buoyancy drives the lower portion of the plume upward to the base of the caprock. The horizontal migration velocity of CO2 decreases markedly due to the rapid dissipation of injection-induced pressure.
After 10 years (Fig. 4c), the leading edge of the plume has advanced approximately 165 m from the injection well. The overall plume thickness is significantly reduced, with the maximum thickness decreasing from 10 to about 5 m. As dissolution continues, physically trapped CO2 is progressively converted into the dissolved phase. By 50 years, the plume front has retreated to within 150 m of the well, with a maximum thickness below 5 m and a peak saturation of less than 0.3 in the domain.
Figure 5 illustrates the temporal evolution of dissolved CO2 following the injection period. After injection ceases, the plume accumulation zone exhibits a relatively uniform dissolution pattern. The region of highest concentration is observed at the top of the reservoir, resulting from the elevated CO2 saturation in this zone. By 50 years, a high-density fingering flow begins to develop, marking a transition from uniform dissolution to distinct convective fingers. The most rapidly migrating finger forms nearest to the injection well, with its tip approaching the bottom of the reservoir.
Within 100 years, the dissolved CO2 at the top has spread through the finger flow into the saline aquifer, reaching approximately half the reservoir height. After 200 years, interaction between individual fingers becomes evident: those close to the injection well have entered the shutdown period, causing high-concentration fluid to spread laterally along the bottom boundary, which in turn suppresses the development of subsequent fingers. Fingers located farther from the well begin to merge, significantly increasing their width, with the leading edges advancing toward the reservoir base.
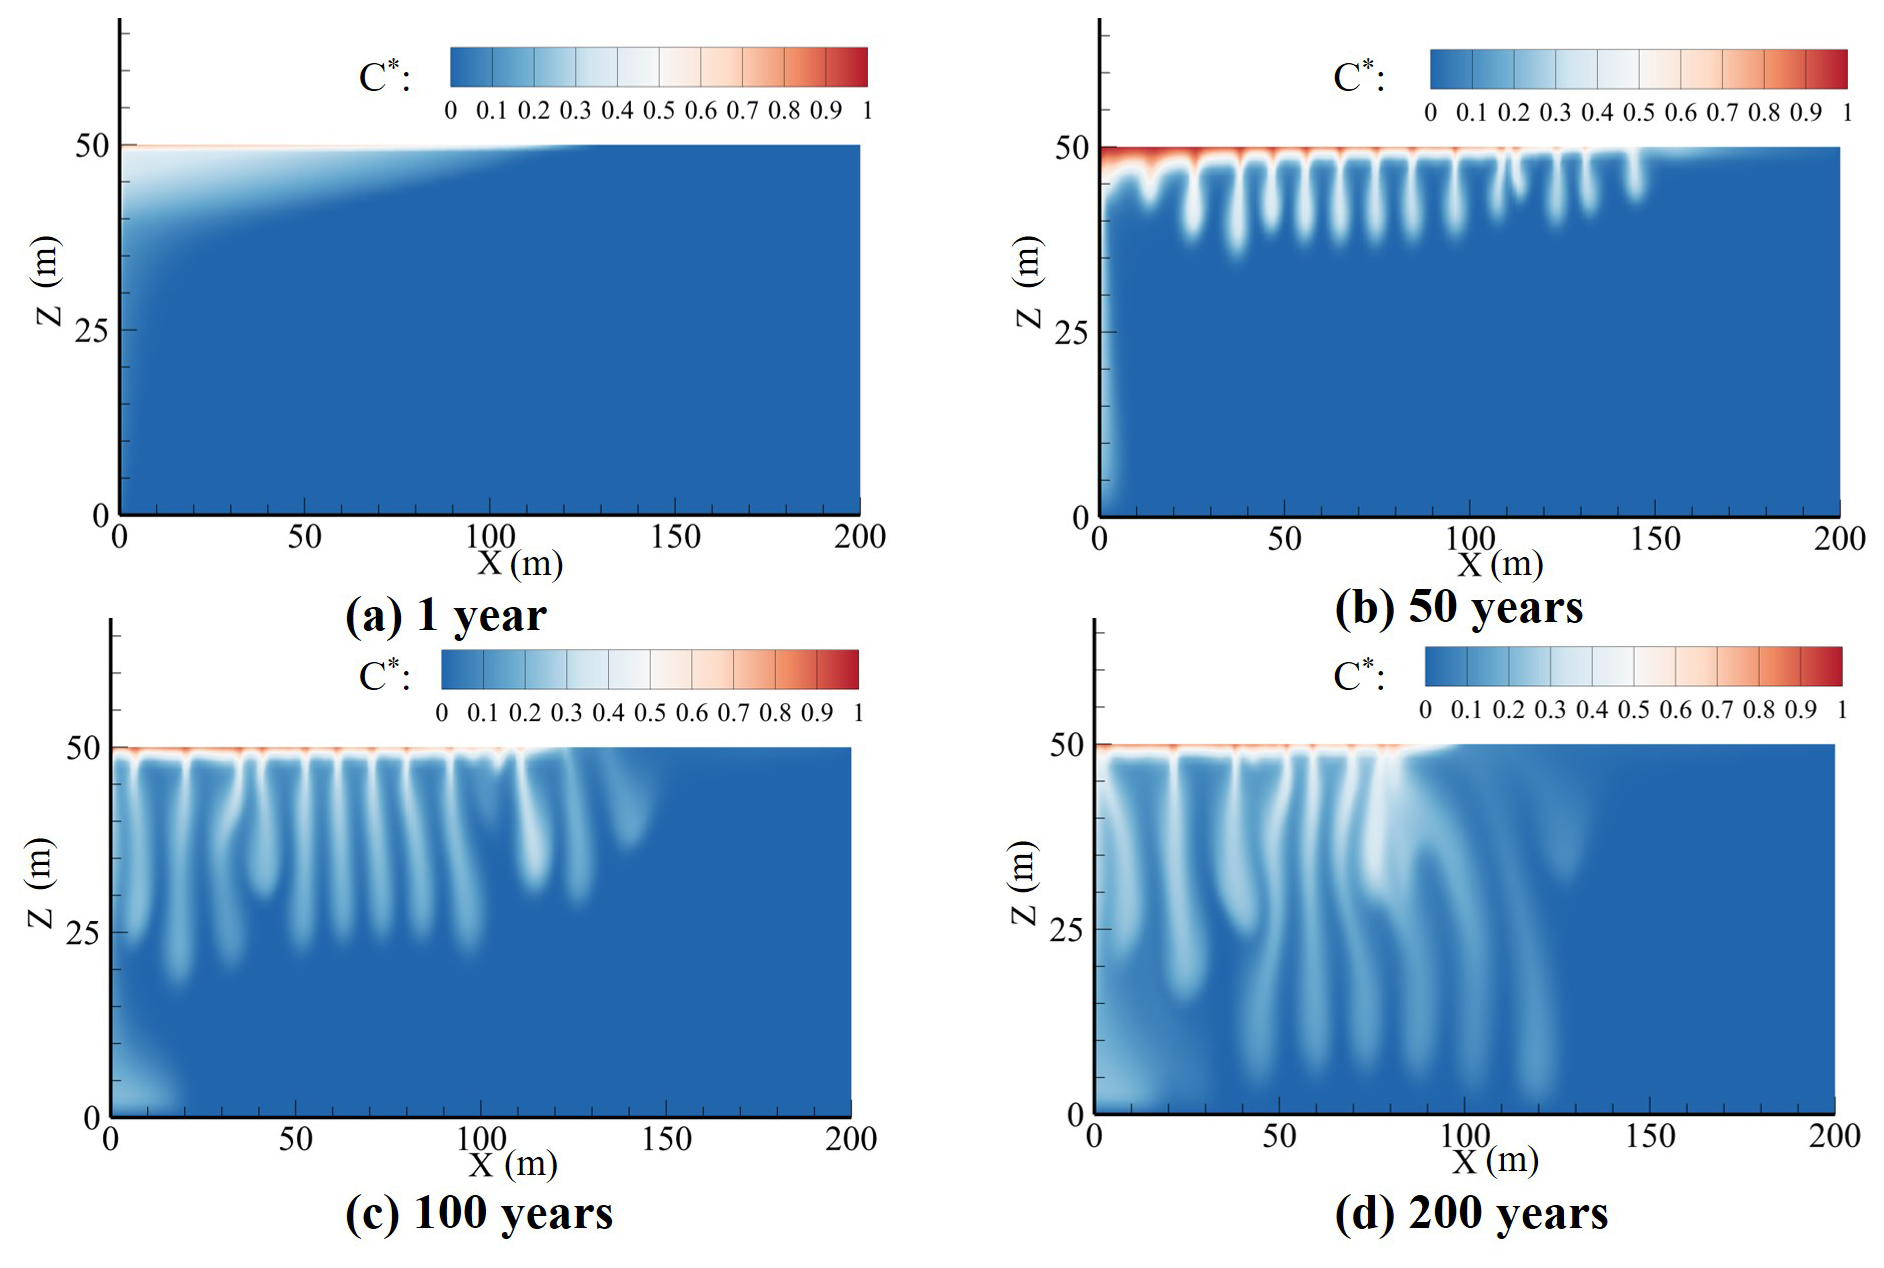
Figure 5The concentration distribution of dissolved CO2 after 1, 50, 100, and 200 years. After 50 years of dissolution, system instability induces finger flow generation, with fingers reaching the bottom after 200 years.
Figure 6 illustrates the spatial-temporal evolution of reservoir permeability induced by geochemical reactions. The simulated results indicate that significant alterations are predominantly concentrated at the top of the reservoir. The impact of dissolution reactions becomes markedly evident approximately 100 years after injection. By 200 years, the preferential flow pathways formed by permeability enhancement exhibit a strong spatial correlation with the fingering structures depicted in Fig. 6. Under sustained acidic conditions, dissolution of calcite results in a local permeability increase of up to approximately 15 %.

Figure 6Permeability variations in the reservoir due to geochemical reactions after 200 and 300 years. The dissolution of calcite and the development trend of finger flow are almost overlapping.

Figure 7Relative proportions of CO2 in the free-phase state, dissolved state, and reactive state at simulation times of 1 and 500 years. The two pie charts illustrate the redistribution of injected CO2.

Figure 8The workflow of data extraction followed by gravity-driven ripening simulations with CO2 saturation distribution after 80 000 years. After 80 000 years of secondary distribution, residual trapped CO2 migrates to the reservoir top under gravity-driven ripening, generating a gas cap at maximum saturation.

Figure 9Variations in porosity after 200 years for different calcite content cases. The most intense reservoir dissolution reactions are concentrated at the top of the reservoir.
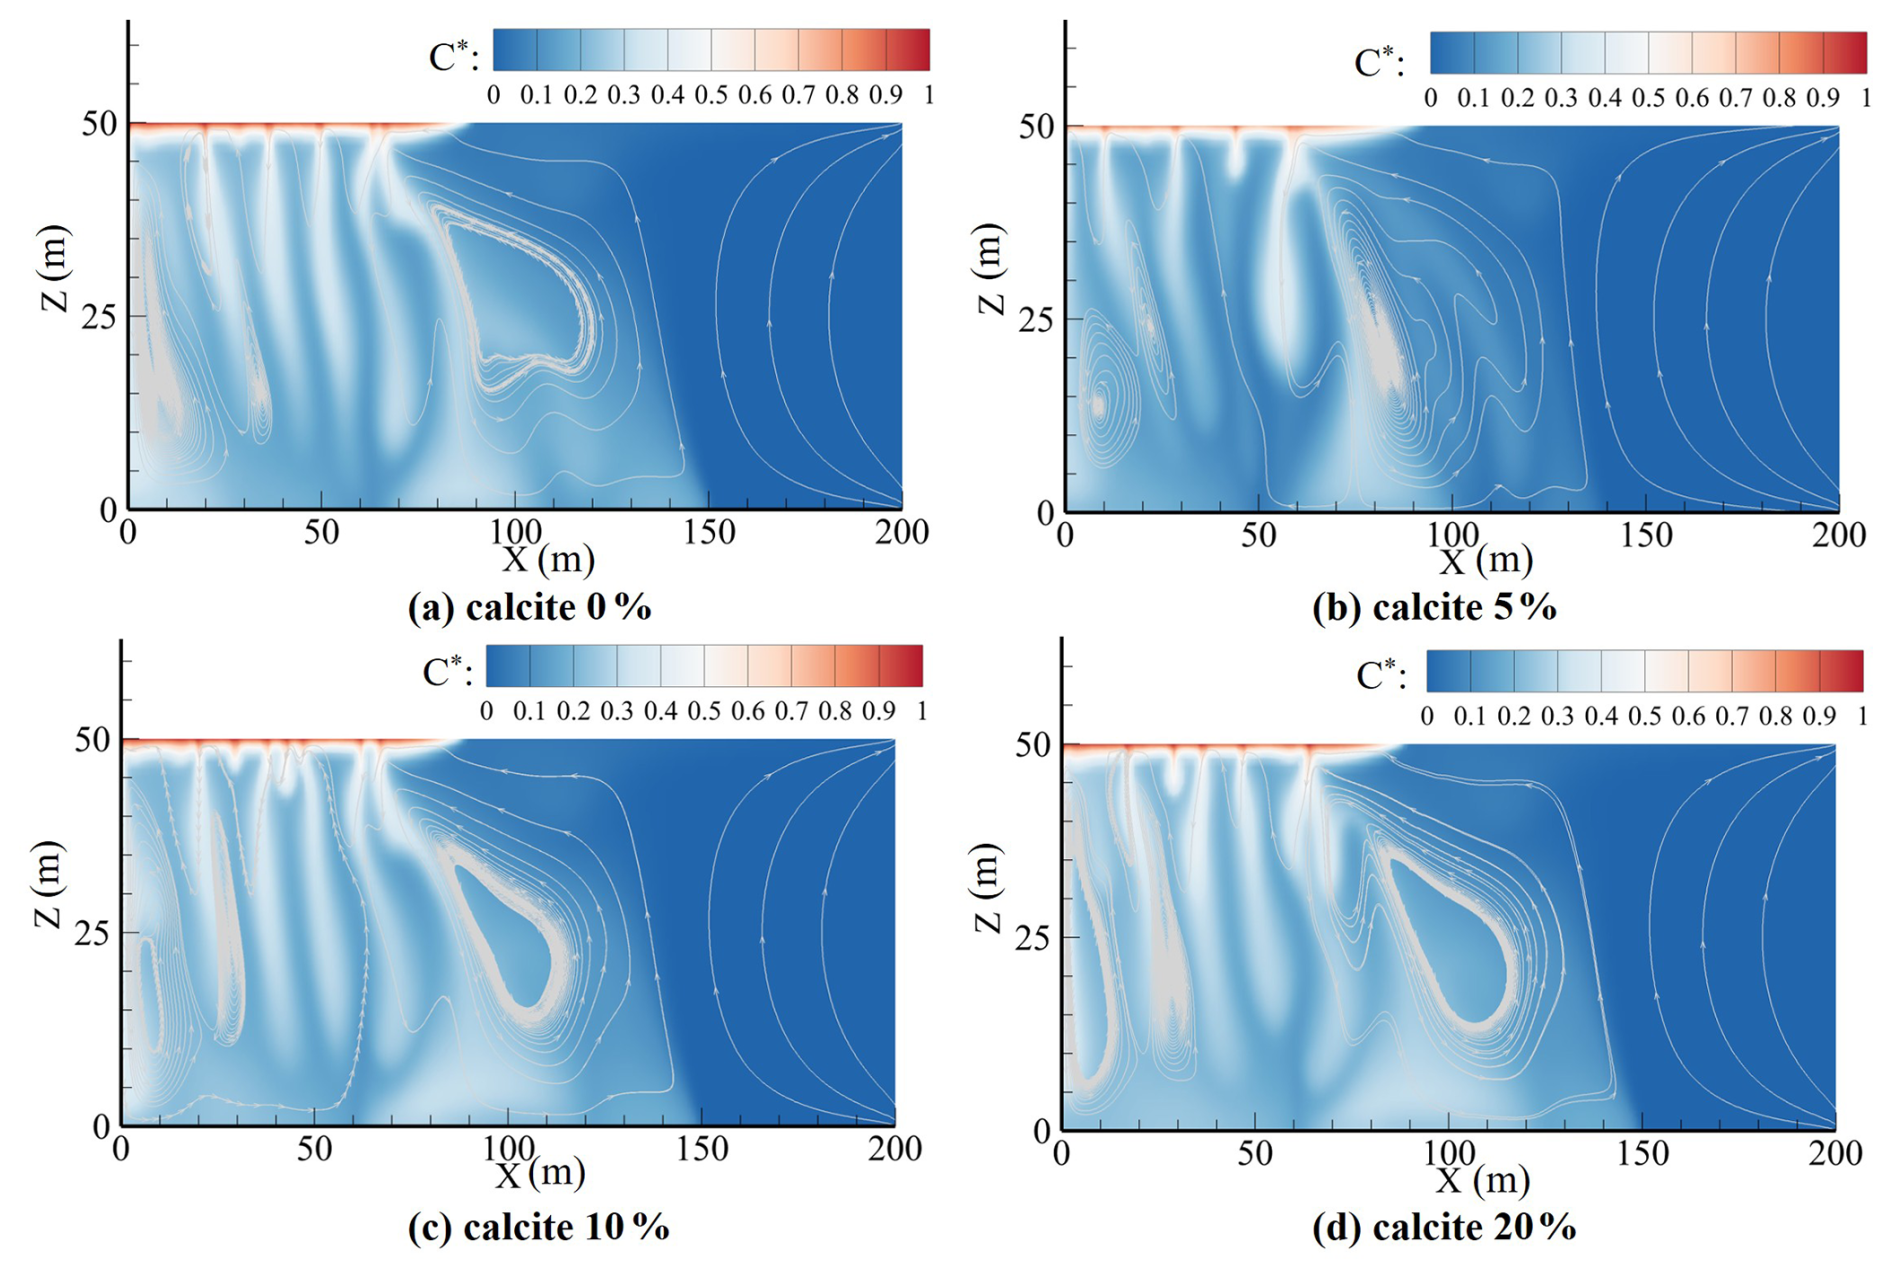
Figure 10Distribution of dissolved CO2 concentrations in cases with different calcite contents after 300 years. The case study with 5 % calcite content indicates that the presence of dissolution reactions may inhibit the early development of finger flow.
Figure 7 illustrates the temporal evolution of the contribution of each trapping mechanism in the study case. Given the practical difficulty in distinguishing between structural and residual trapping, these are collectively categorized as free-phase CO2. The results indicate that free-phase CO2 remains the dominant mechanism throughout the simulated period, accounting for 79.66 % of total trapped CO2 during the early injection period (within 1 year). As dissolution and geochemical reactions progress, the proportion of free-phase CO2 gradually decreases to 56.45 % (500 years). After 500 years, dissolved CO2 accounted for 42.80 % of the total sequestered fraction. Reactive CO2 constitutes less than 1 % of the total. As dissolved CO2 concentration declines in later stages, the reactive fraction stabilizes at 0.75 %.
Figure 8 shows the distribution of CO2 saturation across the domain at 500 years post-injection. Most of the formation maintains a residual gas saturation close to the minimum value. A thin gas layer persists near the top of the injection well, with a saturation below 0.2 and a thickness of less than 5 m. Over an extended period of gravity-driven Ostwald ripening, the residual gas undergoes upward mass transfer, accumulating at the top of the reservoir. This process ultimately forms a gas cap approximately 2 m thick, leaving a bubble-free zone about 45 m thick at the bottom of the formation. However, the complete mass transfer process spans approximately 80 000 years–two to three orders of magnitude longer than the timescale of the geochemical reactions considered in this study. As a result, this long-term ripening behavior can only be evaluated through post-processing calculations based on extracted saturation and permeability data from the primary numerical model.
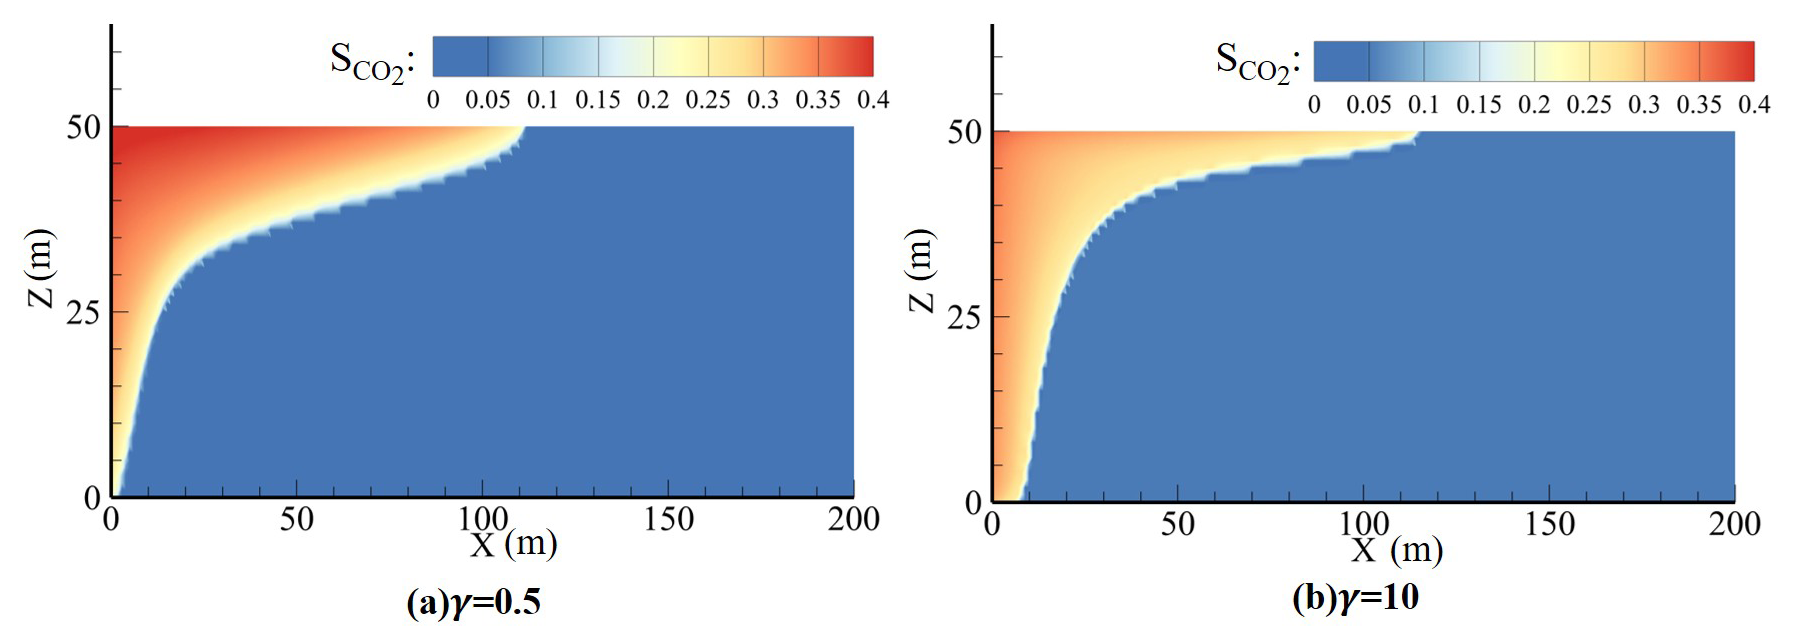
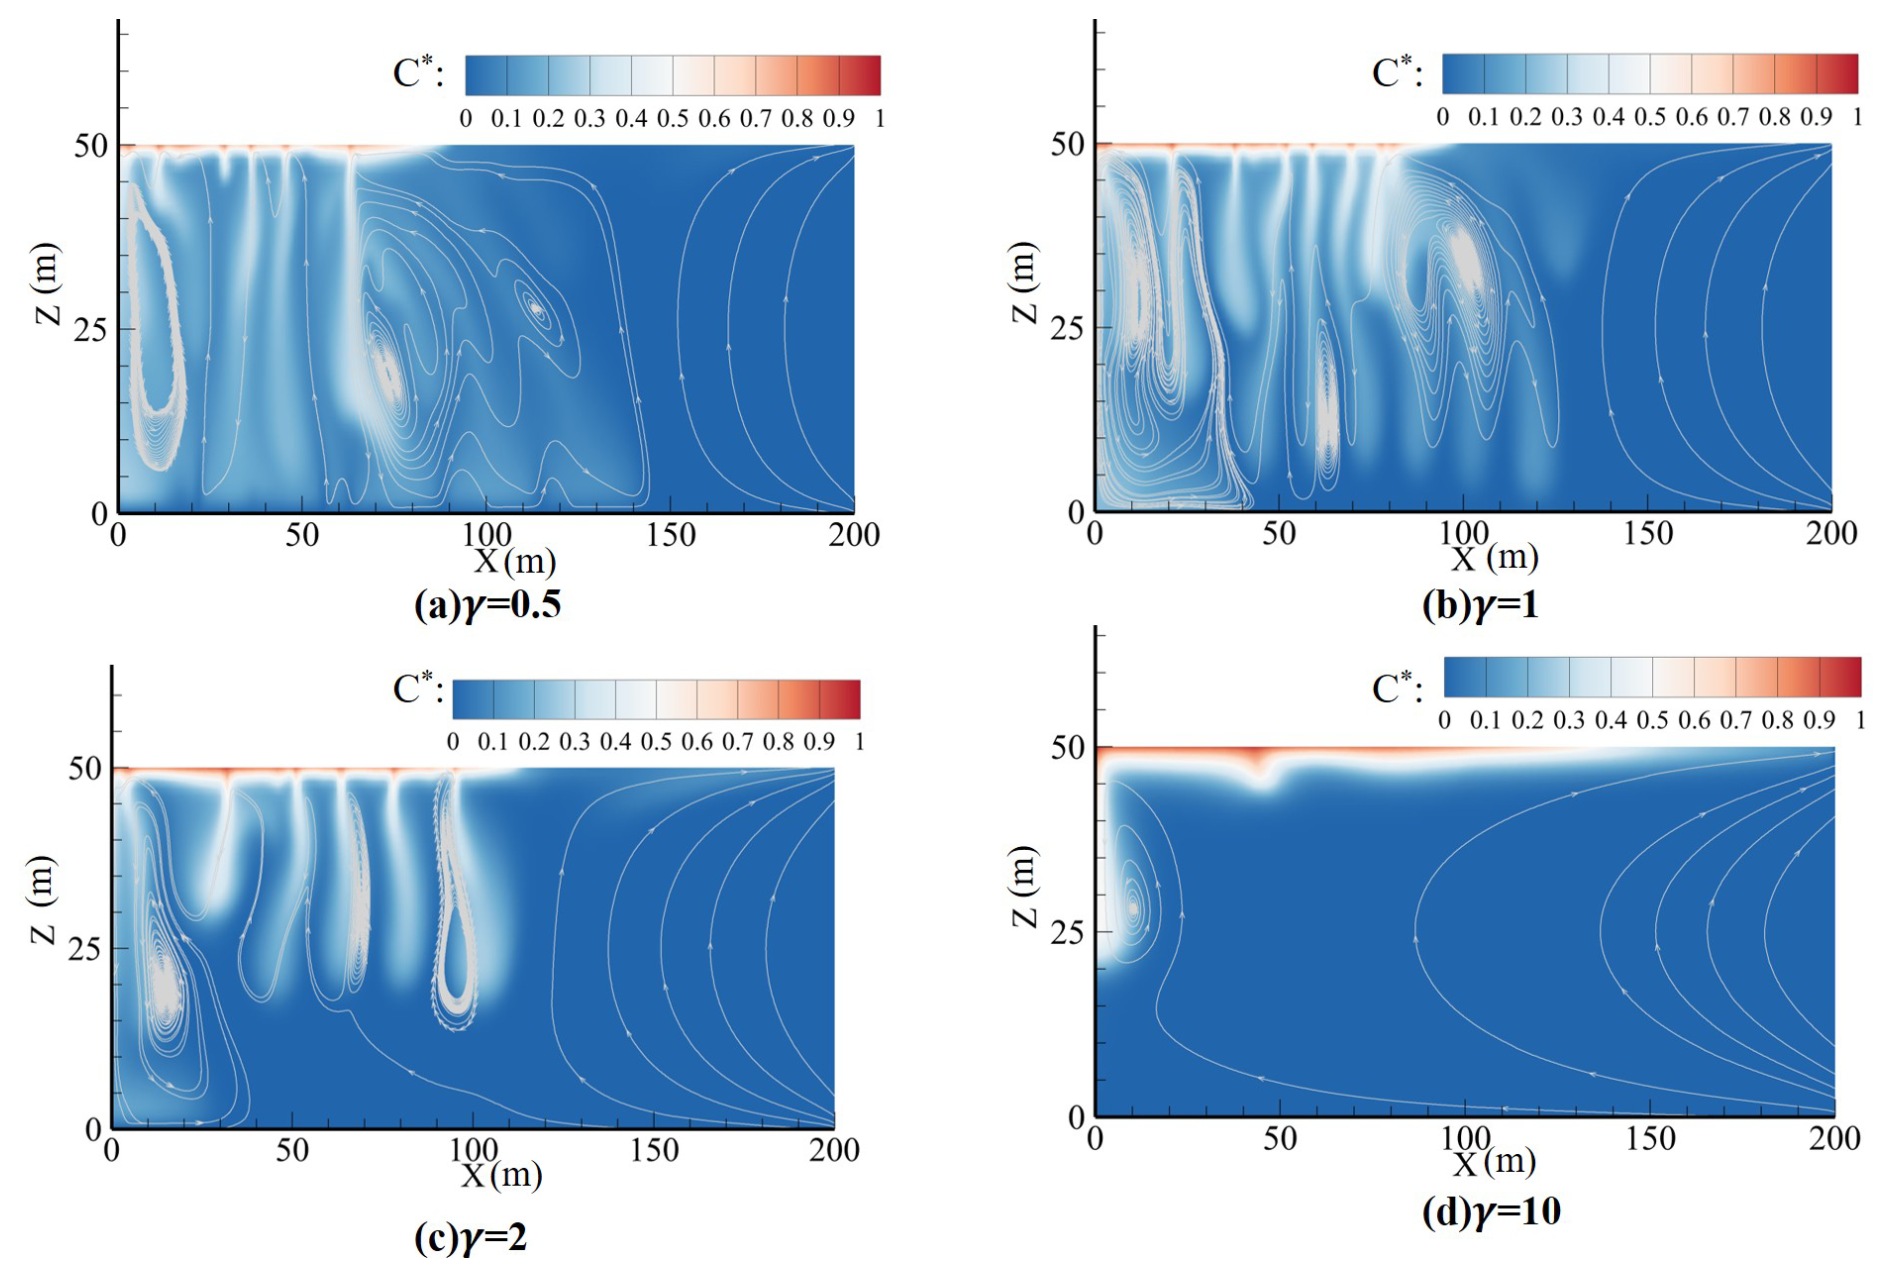
Figure 12Dissolved CO2 concentration and flow field in different formations (γ=0.5, 1, 2 and 10) after 200 years. The decrease in vertical permeability resulted in delayed development of finger flows and a significant reduction in finger flow numbers.
4.2 Effect of calcite content
Based on comparative analyses of cases with varying calcite contents (0 %, 5 %, 10 %, and 20 %), simulations reveal significant alterations in reservoir porosity after 200 years of geochemical reactions. As illustrated in Figs. 9 and 10, the spatial distribution of porosity variation aligns closely with the finger flow pattern across all calcite content scenarios. In the case with an initial calcite content of 20 %, the porosity increase near the top of the reservoir reaches approximately 0.01, corresponding to a relative change of about 10 %. According to Eq. (10), the permeability has increased by approximately 36 % relative to the initial value.
Figure 10 illustrates the distribution of CO2 finger flows under different calcite content conditions after 300 years. As the calcite content increases, a slight increase in the number of fingers is observed, particularly in the 10 % and 20 % cases. This behavior may be attributed to the formation of localized preferential pathways near the top of the reservoir, which facilitate the development of finger flows along these zones of enhanced permeability. Interestingly, the case with 5 % calcite content exhibits the smallest spatial extent of fingering, suggesting that at lower concentrations, the geochemical reactions may inhibit rather than promote the evolution of convective fingers. Overall, the density-driven convective behavior of dissolved CO2 exhibits low sensitivity to calcite content.
4.3 Effect of permeability anisotropy
The distribution of the plume in the anisotropic formation at the time of the cessation of injection is shown in Fig. 11. A permeability anisotropy index γ () was used to represent the ratio of horizontal permeability to vertical permeability. It is assumed that the horizontal permeability remains constant at k0, while the vertical permeability changes according to the permeability anisotropy index. When γ=0.5, the vertical migration of the plume is more efficient, and the injected CO2 can rapidly accumulate at the top of the reservoir to form a funnel shape with a larger thickness. In contrast, when γ=10, the plume exhibits a thinner geometry at the top and migrates laterally over a greater distance. The actual reservoir with smaller vertical permeability is more conducive to the utilization of reservoir space.
Figure 12 displays the spatial distribution of CO2 concentration and flow path characteristics after 200 years with different anisotropic properties of the formation. It can be observed that as the value of γ increases, it takes longer for the CO2 in the physically trapped state to be transformed into the dissolved state, which is due to the lower convective strength, and therefore, the finger flow develops more slowly. As shown in Fig. 12a, for γ=0.5, the finger flow has reached the bottom boundary and formed back-flow to inhibit the vertical migration of the top finger flow. There is no strong convective interaction between the finger flows, and the overall vertical development of the finger flows is maintained in case of γ=2. When γ=10, a high-concentration zone develops at the reservoir top, and fingering flow is largely restricted to the vicinity of the injection well. The resulting fingers exhibit limited vertical development, reaching only about 20 m in height. Under such conditions, the phase transition of physically trapped CO2 is significantly hindered, which compromises long-term storage security.
Figure 13 illustrates the temporal evolution of the average dissolved CO2 concentration in formations with varying γ. Taking the case of γ=0.5 as an example, the rapid increase in the total dissolved storage occurs in two distinct stages. Stage I is governed by the dissolution and phase transition of CO2, enhanced by the high saturation conditions established during injection. Stage II is characterized by large-scale convective mixing driven by gravitational instability, which significantly augments the dissolution flux. A threefold reduction in the total dissolution amount is observed as γ increases from 0.5 to 10 over the 500-year simulation.
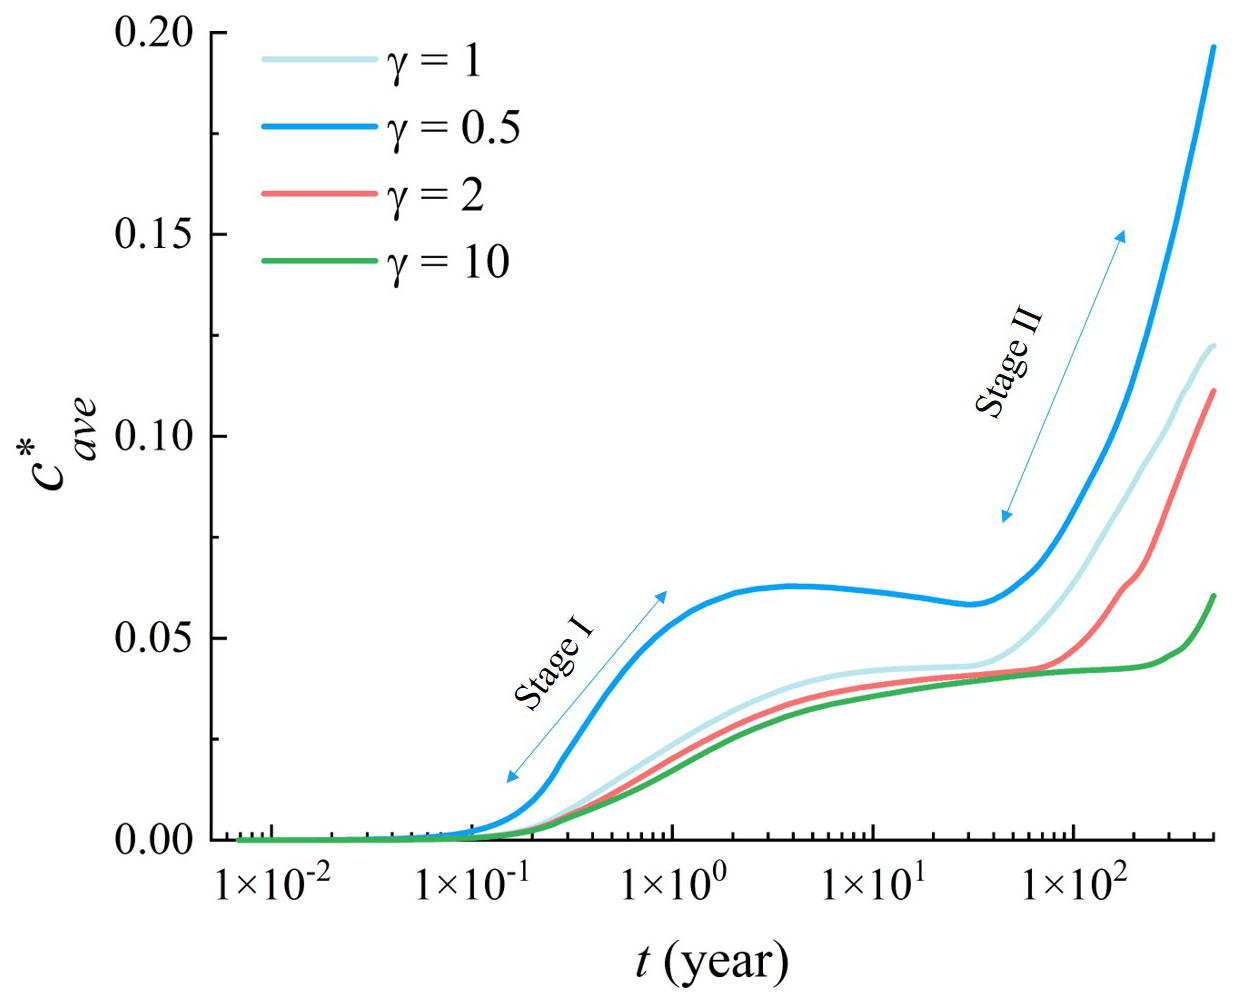
Figure 13Temporal evolution of the average dimensionless concentration in anisotropic formations (γ=0.5, 1, 2 and 10). The total dissolution process is divided into two growth stages, exemplified by γ=0.5, represented by two-way arrows.
We have developed an integrated numerical model for geological carbon storage (GCS) that captures the coupling among multiple phases across timescales ranging from days (during CO2 injection) to millennia (during Ostwald ripening). By incorporating CO2 injection, dissolution, geochemical reactions, and gravity-driven ripening within a unified framework, the model enables a systematic evaluation of their interactions.
The modeling results indicate that dissolution trapping reduces the lateral spread of the CO2 plume by approximately 10 % within 50 years. At 500 years, 56.45 % of the CO2 retained within the model domain remains physically trapped, 42.80 % is dissolved, and less than 1 % has participated in the geochemical reactions. Reactions generate permeability-enhanced pathways that accelerate dissolution. Calcite dissolution promotes the formation of preferential channels that intensify convective fingering, with higher calcite content increasing finger numbers. Geochemical reactions may contribute to a 10 % variation in reservoir porosity over 200 years in reservoirs containing 20 % calcite. The migration and mass transfer behaviors of CO2 are not sensitive to calcite content during the modeling period. Based on the simulation results, vertical permeability anisotropy γ exerts a critical influence on both CO2 migration and dissolution. Lower γ values significantly enhance vertical migration and dissolution efficiency, whereas higher γ values impede the phase transition of physically trapped CO2, thereby reducing long-term storage security. Quantitatively, the total dissolved mass for γ=0.5 is approximately three times greater than that for γ=10. The proposed model offers a predictive tool for assessing and optimizing long-term GCS security.
The data that support the findings of this study are available from the corresponding author upon reasonable request.
The numerical model OpenGeoSys version 5 can be downloaded at https://www.opengeosys.org/stable/releases/#opengeosys-5 (last access: 22 September 2022).
RC: Methodology, Validation, Writing – original draft. WX: Conceptualization, Writing – review & editing, Funding acquisition. YC: Supervision, Funding acquisition. QL: Data curation, Writing – review & editing. TZ: Methodology, Writing – original draft. BG: Visualization, Writing – review & editing.
At least one of the (co-)authors is a member of the editorial board of Hydrology and Earth System Sciences. The peer-review process was guided by an independent editor, and the authors also have no other competing interests to declare.
Publisher's note: Copernicus Publications remains neutral with regard to jurisdictional claims made in the text, published maps, institutional affiliations, or any other geographical representation in this paper. The authors bear the ultimate responsibility for providing appropriate place names. Views expressed in the text are those of the authors and do not necessarily reflect the views of the publisher.
The authors would like to thank Yonggen Zhang, Giacomo Medici, and two anonymous reviewers for their valuable and constructive comments.
This research has been supported by the National Natural Science Foundation of China (grant nos. 52588202 and 42277128), the Youth Taishan Scholars Program of Shandong Province (grant no. tsqn202408078), and the China Postdoctoral Science Foundation (grant no. 2026M790475).
This paper was edited by Yonggen Zhang and reviewed by two anonymous referees.
Bachu, S., Gunter, W. D., and Perkins, E. H.: Aquifer disposal of CO2: hydrodynamic and mineral trapping, Energy Convers. Manage., 35, 269–279, https://doi.org/10.1016/0196-8904(94)90060-4, 1994.
Bennion, D. B. and Bachu, S.: Drainage and imbibition relative permeability relationships for supercritical CObrine and H2Sbrine systems in intergranular sandstone, carbonate, shale, and anhydrite rocks, SPE Reserv. Eval. Eng., 11, 487–496, https://doi.org/10.2118/99326-PA, 2008.
Birkholzer, J. T., Oldenburg, C. M., and Zhou, Q.: CO2 migration and pressure evolution in deep saline aquifers, Int. J. Greenh. Gas Con., 40, 203–220, https://doi.org/10.1016/j.ijggc.2015.03.022, 2015.
Carrigan, C. R., Yang, X., LaBrecque, D. J., Larsen, D., Freeman, D., Ramirez, A. L., Daily, W., Aines, R., Newmark, R., Friedmann, J., and Hovorka, S.: Electrical resistance tomographic monitoring of CO2 movement in deep geologic reservoirs, Int. J. Greenh. Gas Con., 18, 401–408, https://doi.org/10.1016/j.ijggc.2013.04.016, 2013.
Chen, R., Chen, Y., Xu, W., Hu, Y., Zhan, L., Li, J., Zhuang, D., and Li, K.: The influence of the hypergravity field during bubble ripening in porous media, Geophys. Res. Lett., 49, e2021GL097005, https://doi.org/10.1029/2021GL097005, 2022.
Chen, R., Xu, W., and Chen, Y.: A numerical model for evaluating the long-term migration and phase transition behavior of foam-assisted injection of CO2 in saline aquifers, Geoenergy Sci. Eng., 243, 213328, https://doi.org/10.1016/j.geoen.2024.213328, 2024.
Chen, Y. M., Xu, W. J., Ling, D. S., Zhan, L. T., and Gao, W.: A degradation–consolidation model for the stabilization behavior of landfilled municipal solid waste, Comput. Geotech., 118, 103341, https://doi.org/10.1016/j.compgeo.2019.103341, 2020.
Cui, G., Wang, Y., Rui, Z., Chen, B., and Ren, S.: Assessing the combined influence of fluid–rock interactions on reservoir properties and injectivity during CO2 storage in saline aquifers, Energy, 155, 281–296, https://doi.org/10.1016/j.energy.2018.05.024, 2018.
Dai, Z., Xu, L., Xiao, T., McPherson, B. J., Zhang, X., Zheng, L., Dong, S., Yang, Z., Soltanian, M. R., Yang, C., Ampomah, W., Jia, W., Yin, S., Xu, T., Bacon, D. H., and Viswanathan, H.: Reactive chemical transport simulations of geologic carbon sequestration: methods and applications, Earth-Sci. Rev., 208, 103265, https://doi.org/10.1016/j.earscirev.2020.103265, 2020.
Dance, T. and Paterson, L.: Observations of carbon dioxide saturation distribution and residual trapping using core analysis and repeat pulsed-neutron logging at the CO2CRC Otway site, Int. J. Greenh. Gas Con., 47, 210–220, https://doi.org/10.1016/j.ijggc.2016.01.042, 2016.
De Paoli, M.: Influence of reservoir properties on the dynamics of a migrating current of carbon dioxide, Phys. Fluids, 33, 016602, https://doi.org/10.1063/5.0031632, 2021.
De Silva, G. P. D., Ranjith, P. G., and Perera, M. S. A.: Geochemical aspects of CO2 sequestration in deep saline aquifers: a review, Fuel, 155, 128–143, https://doi.org/10.1016/j.fuel.2015.03.045, 2015.
Diersch, H. J. G. and Kolditz, O.: Variable-density flow and transport in porous media: approaches and challenges, Adv. Water Resour., 25, 899–944, https://doi.org/10.1016/S0309-1708(02)00063-5, 2002.
Elenius, M. T., Nordbotten, J. M., and Kalisch, H.: Convective mixing influenced by the capillary transition zone, Comput. Geosci., 18, 417–431, https://doi.org/10.1007/s10596-014-9415-1, 2014.
Elenius, M. T., Voskov, D. V., and Tchelepi, H. A.: Interactions between gravity currents and convective dissolution, Adv. Water Resour., 83, 77–88, https://doi.org/10.1016/j.advwatres.2015.05.006, 2015.
Emami-Meybodi, H. and Hassanzadeh, H.: Two-phase convective mixing under a buoyant plume of CO2 in deep saline aquifers, Adv. Water Resour., 76, 55–71, https://doi.org/10.1016/j.advwatres.2014.11.011, 2015.
Emami-Meybodi, H., Hassanzadeh, H., Green, C. P., and Ennis-King, J.: Convective dissolution of CO2 in saline aquifers: progress in modeling and experiments, Int. J. Greenh. Gas Con., 40, 238–266, https://doi.org/10.1016/j.ijggc.2015.04.003, 2015.
Ennis-King, J. and Paterson, L.: Role of convective mixing in the long-term storage of carbon dioxide in deep saline formations, SPE J., 10, 349–356, https://doi.org/10.2118/84344-PA, 2005.
Fu, X., Cueto-Felgueroso, L., Bolster, D., and Juanes, R.: Rock dissolution patterns and geochemical shutdown of CO2–brine–carbonate reactions during convective mixing in porous media, J. Fluid Mech., 764, 296–315, https://doi.org/10.1017/jfm.2014.647, 2015.
Guo, R., Sun, H., Zhao, Q., Li, Z., Liu, Y., and Chen, C.: A novel experimental study on density-driven instability and convective dissolution in porous media, Geophys. Res. Lett., 48, e2021GL095619, https://doi.org/10.1029/2021GL095619, 2021.
Györe, D., Gilfillan, S. M. V., and Stuart, F. M.: Tracking the interaction between injected CO2 and reservoir fluids using noble gas isotopes in an analogue of large-scale carbon capture and storage, Appl. Geochem., 78, 116–128, https://doi.org/10.1016/j.apgeochem.2016.12.012, 2017.
Iglauer, S., Wülling, W., Pentland, C. H., Al-Mansoori, S. K., and Blunt, M. J.: Capillary-trapping capacity of sandstones and sandpacks, SPE J., 16, 778–783, https://doi.org/10.2118/120960-PA, 2011.
Jackson, S. J. and Krevor, S.: Small-scale capillary heterogeneity linked to rapid plume migration during CO2 storage, Geophys. Res. Lett., 47, e2020GL088616, https://doi.org/10.1029/2020GL088616, 2020.
Jing, J., Yang, Y., Cheng, J., Ding, Z., Wang, D., and Jing, X.: Analysis of the effect of formation dip angle and injection pressure on the injectivity and migration of CO2 during storage, Energy, 280, 128021, https://doi.org/10.1016/j.energy.2023.128021, 2023.
Kolditz, O., Bauer, S., Beyer, C., Böttcher, N., Dietrich, P., Görke, U.-J., Kalbacher, T., Park, C.-H., Sauer, U., Schütze, C., Shao, H., Singh, A., Taron, J., Wang, W., and Watanabe, N.: A systematic benchmarking approach for geologic CO2 injection and storage, Environ. Earth Sci., 67, 613–632, https://doi.org/10.1007/s12665-012-1656-5, 2012.
Krevor, S., de Coninck, H., Gasda, S. E., Ghaleigh, N. S., de Gooyert, V., Hajibeygi, H., Juanes, R., Neufeld, J., Roberts, J. J., and Swennenhuis, F.: Subsurface carbon dioxide and hydrogen storage for a sustainable energy future, Nat. Rev. Earth Environ., 4, 102–118, https://doi.org/10.1038/s43017-022-00376-8, 2023.
Lamy-Chappuis, B., Angus, D., Fisher, Q., Grattoni, C., and Yardley, B. W. D.: Rapid porosity and permeability changes of calcareous sandstone due to CO2-enriched brine injection, Geophys. Res. Lett., 41, 399–406, https://doi.org/10.1002/2013GL058534, 2014.
Lane, J., Greig, C., and Garnett, A.: Uncertain storage prospects create a conundrum for carbon capture and storage ambitions, Nat. Clim. Change, 11, 925–936, https://doi.org/10.1038/s41558-021-01175-7, 2021.
Martinez, M. J. and Hesse, M. A.: Two-phase convective mixing under a buoyant plume of CO2 in deep saline aquifers, Adv. Water Resour., 94, 1–14, https://doi.org/10.1016/j.advwatres.2016.04.015, 2016.
Mathias, S. A., González Martínez de Miguel, G. J., Thatcher, K. E., and Zimmerman, R. W.: Pressure buildup during CO2 injection into a closed brine aquifer, Transp. Porous Med., 89, 383–397, https://doi.org/10.1007/s11242-011-9776-z, 2011.
Mathias, S. A., Gluyas, J. G., González Martínez de Miguel, G. J., Bryant, S. L., and Wilson, D.: On relative permeability data uncertainty and CO2 injectivity estimation for brine aquifers, Int. J. Greenh. Gas Con., 12, 200–212, https://doi.org/10.1016/j.ijggc.2012.09.017, 2013.
Medici, G., Munn, J. D., and Parker, B. L.: Delineating aquitard characteristics within a Silurian dolostone aquifer using high-density hydraulic head and fracture datasets, Hydrogeol. J., 32, 1663–1691, https://doi.org/10.1007/s10040-024-02824-9, 2024.
Neufeld, J. A., Hesse, M. A., Riaz, A., Hallworth, M. A., Tchelepi, H. A., and Huppert, H. E.: Convective dissolution of carbon dioxide in saline aquifers, Geophys. Res. Lett., 37, L22404, https://doi.org/10.1029/2010GL044728, 2010.
Pau, G. S. H., Bell, J. B., Pruess, K., Almgren, A. S., Lijewski, M. J., and Zhang, K.: High-resolution simulation and characterization of density-driven flow in CO2 storage in saline aquifers, Adv. Water Resour., 33, 443–455, https://doi.org/10.1016/j.advwatres.2010.01.009, 2010.
Pini, R. and Benson, S. M.: Simultaneous determination of capillary pressure and relative permeability curves from core-flooding experiments with various fluid pairs, Water Resour. Res., 49, 3516–3530, https://doi.org/10.1002/wrcr.20274, 2013.
Ringrose, P. S., Furre, A.-K., Gilfillan, S. M. V., Krevor, S., Landrø, M., Leslie, R., Meckel, T., Nazarian, B., and Zahid, A.: Storage of carbon dioxide in saline aquifers: physicochemical processes, key constraints, and scale-up potential, Annu. Rev. Chem. Biomol. Eng., 12, 471–494, https://doi.org/10.1146/annurev-chembioeng-093020-091447, 2021.
Rutqvist, J.: The geomechanics of CO2 storage in deep sedimentary formations, Geotech. Geol. Eng., 30, 525–551, https://doi.org/10.1007/s10706-011-9491-0, 2012.
Saaltink, M. W., Vilarrasa, V., De Gaspari, F., Silva, O., Carrera, J., and Rötting, T. S.: A method for incorporating equilibrium chemical reactions into multiphase flow models for CO2 storage, Adv. Water Resour., 62, 431–441, https://doi.org/10.1016/j.advwatres.2013.09.013, 2013.
Sabo, M. S. and Beckingham, L. E.: Porosity–permeability evolution during simultaneous mineral dissolution and precipitation, Water Resour. Res., 57, e2020WR029072, https://doi.org/10.1029/2020WR029072, 2021.
Sainz-Garcia, A., Abarca, E., Nardi, A., Grandia, F., and Oelkers, E. H.: Convective mixing fingers and chemistry interaction in carbon storage, Int. J. Greenh. Gas Con., 58, 52–61, https://doi.org/10.1016/j.ijggc.2016.12.005, 2017.
Sathaye, K. J., Hesse, M. A., Cassidy, M., and Stockli, D. F.: Constraints on the magnitude and rate of CO2 dissolution at Bravo Dome natural gas field, P. Natl. Acad. Sci. USA, 111, 15332–15337, https://doi.org/10.1073/pnas.1406076111, 2014.
Seyyedi, M., Giwelli, A., White, C., Esteban, L., Verrall, M., and Clennell, B.: Effects of geochemical reactions on multi-phase flow in porous media during CO2 injection, Fuel, 269, 117421, https://doi.org/10.1016/j.fuel.2020.117421, 2020.
Singh, M., Chaudhuri, A., Chu, S. P., Stauffer, P. H., and Pawar, R. J.: Analysis of evolving capillary transition, gravitational fingering, and dissolution trapping of CO2 in deep saline aquifers during continuous injection of supercritical CO2, Int. J. Greenh. Gas Con., 82, 281–297, https://doi.org/10.1016/j.ijggc.2019.01.014, 2019.
Wang, Y., Vuik, C., and Hajibeygi, H.: Analysis of hydrodynamic trapping interactions during full-cycle injection and migration of CO2 in deep saline aquifers, Adv. Water Resour., 159, 104073, https://doi.org/10.1016/j.advwatres.2021.104073, 2022.
Wei, Y.-M., Kang, J.-N., Liu, L.-C., Li, Q., Wang, P.-T., Hou, J.-J., Liang, Q.-M., Liao, H., Huang, S.-F., and Yu, B.: A proposed global layout of carbon capture and storage in line with a 2 °C climate target, Nat. Clim. Change, 11, 112–118, https://doi.org/10.1038/s41558-020-00960-0, 2021.
Xu, K., Mehmani, Y., Shang, L., and Xiong, Q.: Gravity-induced bubble ripening in porous media and its impact on capillary trapping stability, Geophys. Res. Lett., 46, 13804–13813, https://doi.org/10.1029/2019GL085175, 2019a.
Xu, T., Spycher, N., Sonnenthal, E., Zhang, G., Zheng, L., and Pruess, K.: TOUGHREACT version 2.0: a simulator for subsurface reactive transport under non-isothermal multiphase flow conditions, Comput. Geosci., 37, 763–774, https://doi.org/10.1016/j.cageo.2010.10.007, 2011.
Xu, T., Zhu, H., Feng, G., Yang, Z., and Tian, H.: Numerical simulation of calcite vein formation and its impact on caprock sealing efficiency – case study of a natural CO2 reservoir, Int. J. Greenh. Gas Con., 83, 29–42, https://doi.org/10.1016/j.ijggc.2019.01.021, 2019b.
Yang, Z., Chen, Y. F., and Niemi, A.: Gas migration and residual trapping in bimodal heterogeneous media during geological storage of CO2, Adv. Water Resour., 142, 103608, https://doi.org/10.1016/j.advwatres.2020.103608, 2020.
Zhou, Q., Yang, X., Zhang, R., Hosseini, S. A., Ajo-Franklin, J. B., Freifeld, B. M., Daley, T. M., and Hovorka, S. D.: Dynamic processes of CO2 storage in the field: 1. Multiscale and multipath channeling of CO2 flow in the hierarchical fluvial reservoir at Cranfield, Mississippi, Water Resour. Res., 56, e2019WR025688, https://doi.org/10.1029/2019WR025688, 2020.