
the Creative Commons Attribution 4.0 License.
the Creative Commons Attribution 4.0 License.
 | 19 Aug 2026
Global escalation of more frequent and intense compound heatwave-extreme precipitation events
Haoyu Jin
Moyang Liu
Xuan Yu
Xu Yang
Lijun Chao
Pengfei Zhang
Guoyan Liu
Compound heatwave-extreme precipitation (CHWEP) events, characterized by the rapid succession of heatwaves and extreme precipitation, pose escalating compound and cascading hazards. Yet, global-scale comparisons of their spatiotemporal evolution relative to single extremes remain limited. This study systematically examines the changes in CHWEP and corresponding single extremes from 1980 to 2100 using climate observations and projections under SSP (Shared Socioeconomic Pathway) 2-4.5 and SSP5-8.5 scenarios. We find that CHWEP exhibit higher frequency, stronger precipitation, and longer heatwave duration in mid-to-high latitudes of the Northern Hemisphere, while tropical CHWEP feature more intense heatwaves than single heatwave events. These spatial contrasts persist in future projections. Under both scenarios, CHWEP and single extreme metrics intensify globally by 2056–2100, with post-heatwave precipitation exceeding that of single precipitation extremes, particularly under SSP5-8.5, highlighting sensitivity to greenhouse forcing. Critically, the co-occurrence is non-random, indicating an emerging physical linkage. In the tropics, the likelihood of extreme precipitation following heatwaves increases markedly. Our findings demonstrate that CHWEPs are evolving into a distinct, intensifying hazard class, necessitating their integration into climate resilience, early warning, and adaptation frameworks.
- Article
(15702 KB) - Full-text XML
-
Supplement
(3840 KB) - BibTeX
- EndNote


Global warming has significantly increased the frequency and intensity of extreme climate events, posing growing threats to human societies and ecosystems (Diffenbaugh et al., 2017; Gu et al., 2022; Myhre et al., 2019). Among these, heatwaves and extreme precipitation are two of the most widespread and hazardous types of extreme weather (Raghavendra et al., 2018; Sun et al., 2024). They are typically treated as independent phenomena, as their physical mechanisms and manifestations are contrasting, and they rarely occur simultaneously at the same location (Sauter et al., 2023a; Sun et al., 2023). However, heatwaves and extreme precipitation can also exhibit a lagged, causally linked relationship. Prolonged heatwaves modify land-atmosphere feedbacks by drying soils, warming the planetary boundary layer, and accumulating atmospheric instability, thereby priming the atmosphere for subsequent extreme rainfall. This physical coupling establishes a sequential “heat-then-rain” compound event chain (Chen et al., 2022; Li et al., 2025; Liu et al., 2024; Yang and Yuan, 2025).
The concept of compound extreme events was first introduced in the IPCC (Intergovernmental Panel on Climate Change) Fifth Assessment Report (AR5) and has been further refined in AR6 into four categories: multivariate, multi-event, temporally compounding, and spatially compounding extremes (Bevacqua et al., 2023; Fang et al., 2025; Fischer and Knutti, 2015). Studies have shown that the impacts of compound events often far exceed the simple sum of single extremes, exhibiting significant nonlinear amplification effects (Ning et al., 2022; Zhao et al., 2022). Among these, compound heatwave-extreme precipitation (CHWEP) events have attracted increasing attention due to their potential to trigger “drought-to-flood” transition disaster chains (Ganguli and Merz, 2024; Götte and Brunner, 2024; Sauter et al., 2023b; Zhou et al., 2023). This study focuses on temporally consecutive heatwaves and extreme precipitation, defined here as compound heatwave-extreme precipitation (CHWEP) events. Existing research remains predominantly regional, leaving global-scale spatiotemporal patterns, long-term trends, and physical drivers of CHWEP events poorly characterized, particularly when benchmarked against single extremes (Jin et al., 2024; Mazdiyasni and AghaKouchak, 2015; Miao et al., 2024; Zhou et al., 2024). Furthermore, projected changes in CHWEP frequency, intensity, and associated compound risks under continued warming remain largely unquantified, representing a critical knowledge gap for climate risk assessment (Séférian et al., 2019; Xiong et al., 2023; You and Wang, 2021; Zscheischler et al., 2018).
In this study, based on multiple reanalysis datasets and the multi-model ensemble from the Coupled Model Intercomparison Project Phase 6 (CMIP6), we define CHWEP events along with their corresponding single heatwave and extreme precipitation events. First, we systematically compare the historical changes (1980–2024) and future projections (2056–2100) in the frequency, intensity, and duration of CHWEP events and their single-component counterparts at the global scale. Second, we investigate the potential linkage between heatwaves and extreme precipitation events through probabilistic analysis, demonstrating that CHWEP events are not merely the result of coincidence. This study systematically contrasts the spatiotemporal evolution of CHWEP events with that of single extremes across historical and future climate periods. By quantifying the distinct dynamics of compound versus standalone hazards, our findings provide a critical scientific foundation for improving extreme weather early-warning systems and offer actionable guidance for enhancing societal climate resilience.
In the remainder of this manuscript, Sect. 2 describes the three reanalysis datasets and four CMIP6 global climate models (GCMs) used to identify temporally consecutive CHWEP events. Section 3 presents the methodologies for defining single heatwave, single extreme precipitation, and CHWEP events, determined by temperature thresholds, extreme precipitation thresholds, and a time window. And further examines the statistical significance of differences among metrics of different event types, as well as the randomness of their co-occurrence. Section 4 presents the results along with interpretability analyses. Section 5 discusses key insights derived from this study. Finally, Sect. 6 provides the concluding remarks.
In this study, we utilize three widely adopted global reanalysis products: ERA5-Land (Sun et al., 2024), MERRA-2 (Chen et al., 2019), and JRA-55 (Kobayashi et al., 2015), which have been extensively validated for climate diagnostics, hydrological modeling, and extreme event detection (Chen et al., 2019; Huang et al., 2015; Wang et al., 2019a). We extracted daily precipitation and daily maximum temperature records spanning 1980–2024. To harmonize spatial resolutions and mitigate dataset-specific biases, all fields were resampled to a uniform 1° × 1° grid via kriging interpolation. An ensemble mean of the three reanalysis products was then computed and used as the definitive input for identifying single extreme events and CHWEPs. To analyze the future evolution of CHWEP events, we used daily precipitation and daily maximum temperature outputs from six CMIP6 GCMs for the period 2056–2100, under two Shared Socioeconomic Pathway (SSP) scenarios: SSP2-4.5 (representing a medium emission scenario) and SSP5-8.5 (representing a high emission scenario) (Table S1) (Balaji et al., 2018; Juckes et al., 2020). These six GCMs were selected based on their demonstrated skill in reproducing historical temperature extremes and their spatial resolutions, which are well-suited for regional-scale analysis (Ridder et al., 2021). Similarly, the model data were interpolated to a 1° × 1° grid using kriging, and the multi-model mean was computed to identify single extreme events and CHWEPs (Hausfather et al., 2022).
3.1 Precipitation and temperature deviation correction
Quantile delta mapping (QDM) is a trend-preserving bias correction framework that adjusts climate model outputs while explicitly retaining projected changes across all statistical quantiles (Dai et al., 2022). By avoiding the artificial dampening of distributional shifts, QDM is particularly well-suited for characterizing extreme weather events under non-stationary climate conditions. It merges traditional quantile mapping (QM) principles with a delta change approach, ensuring that relative differences between quantiles from observational data and climate model outputs are preserved while addressing systematic biases inherent in climate projections. The QDM methodology encompasses two primary steps. It first applies a quantile mapping technique to adjust the bias of climate model outputs based on observed data. In this study, we use the historical-period (1980–2024) average of three reanalysis datasets as the reference baseline. Unlike traditional QM method, QDM preserves projected changes in the distribution of these quantiles across various conditions rather than simply replacing simulated values with observed ones based on corresponding quantiles (Kim et al., 2020). This results in outputs that better represent both historical and future states of climate data while maintaining the behavior of extreme weather phenomena, thus avoiding distortions that may occur with standard quantile mapping approaches (Qin and Dai, 2022). The bias correction formulas for precipitation and temperature are as follows:
where p is the cumulative probability, FM,f is the cumulative distribution function (CDF) of precipitation or temperature under the CMIP6 future scenario, and x is the precipitation or temperature value in the future period, PQDM is the precipitation value after QDM bias correction, QR(p) represents the quantile of precipitation or temperature in the reanalysis data corresponding to cumulative probability p, QM,f(p) is the quantile of precipitation or temperature in the CMIP6 future simulation at cumulative probability p, and QM,h(p) is the quantile of precipitation or temperature in the CMIP6 historical simulation at cumulative probability p, TQDM is the temperature value after QDM bias correction. It is worth noting that since this study primarily focuses on the relative differences between CHWEP events and single extreme events, rather focus on absolute magnitudes, the precise accuracy of the absolute values does not affect the overall conclusions.
3.2 Identification and characteristics of CHWEP events
In this study, we first define heatwave events and extreme precipitation events. A heatwave is identified as a period of at least three consecutive days (≥ 3 d) during which the daily maximum temperature exceeds the 90th percentile threshold of historical daily maximum temperatures (Wang et al., 2019b; Zscheischler et al., 2020). That is, the 90th percentile of the daily maximum temperature time series from 1980 to 2024 at each grid point is used as the threshold for defining heatwaves. Extreme precipitation is defined as a daily precipitation amount exceeding the 90th percentile threshold derived from all wet days (> 1 mm) in the historical period. That is, the 90th percentile of the daily precipitation time series on wet days (> 1 mm) from 1980 to 2024 at each grid point is used as the threshold for defining extreme precipitation events. The purpose of selecting the 90th percentile as the threshold is to obtain a sufficient number of heatwave and extreme precipitation event samples. In the future SSP2-4.5 and SSP5-8.5 scenarios, the thresholds for extreme precipitation and heatwave events are defined using the thresholds established during the historical period based on reanalysis data. The CHWEP event is characterized by the occurrence of an extreme precipitation event within 7 d following a heatwave event (You and Wang, 2021). This 7 d window is chosen to ensure a physically plausible linkage between the two events while maintaining a sufficient sample size for statistical analysis (Ridder et al., 2020; Sauter et al., 2023b). Events that do not meet the CHWEP criteria are classified as single heatwave or single extreme precipitation events (Fig. 1). We defined four metrics to quantify the characteristics of CHWEPs and single extreme events (extreme precipitation and heatwaves) occurring within a given year: Frequency (F), Heatwave intensity (IT), Extreme precipitation intensity (IP), and Duration (D). The calculation formulas are as follows:
where F denotes the annual frequency (i.e., total number of occurrences) of CHWEPs or single heatwave events, the subscripts “C” and “S” indicate CHWEPs and single extreme events, respectively, nC and nS are the total number of occurrences of CHWEPs and single heatwave events in a year, respectively, IT represents the mean daily maximum temperature during the heatwave periods of CHWEPs or single heatwave events in a year, mCT and mST represent the total number of heatwave days within CHWEPs and within single heatwave events in a year, respectively, Ti denote the daily maximum temperature on the ith day, IP denotes the mean daily precipitation during the extreme precipitation periods of CHWEPs or single extreme precipitation events in a year, mCP and mSP represent the total number of extreme precipitation days within CHWEPs and within single extreme precipitation events in a year, respectively, Pi denote the daily precipitation amount on the ith day, D refers to the mean duration (in days) of the heatwave periods within CHWEPs or single heatwave events in a year, dC,j and dS,j denote the heatwave duration (in days) of the jth CHWEP and the jth single heatwave event, respectively.
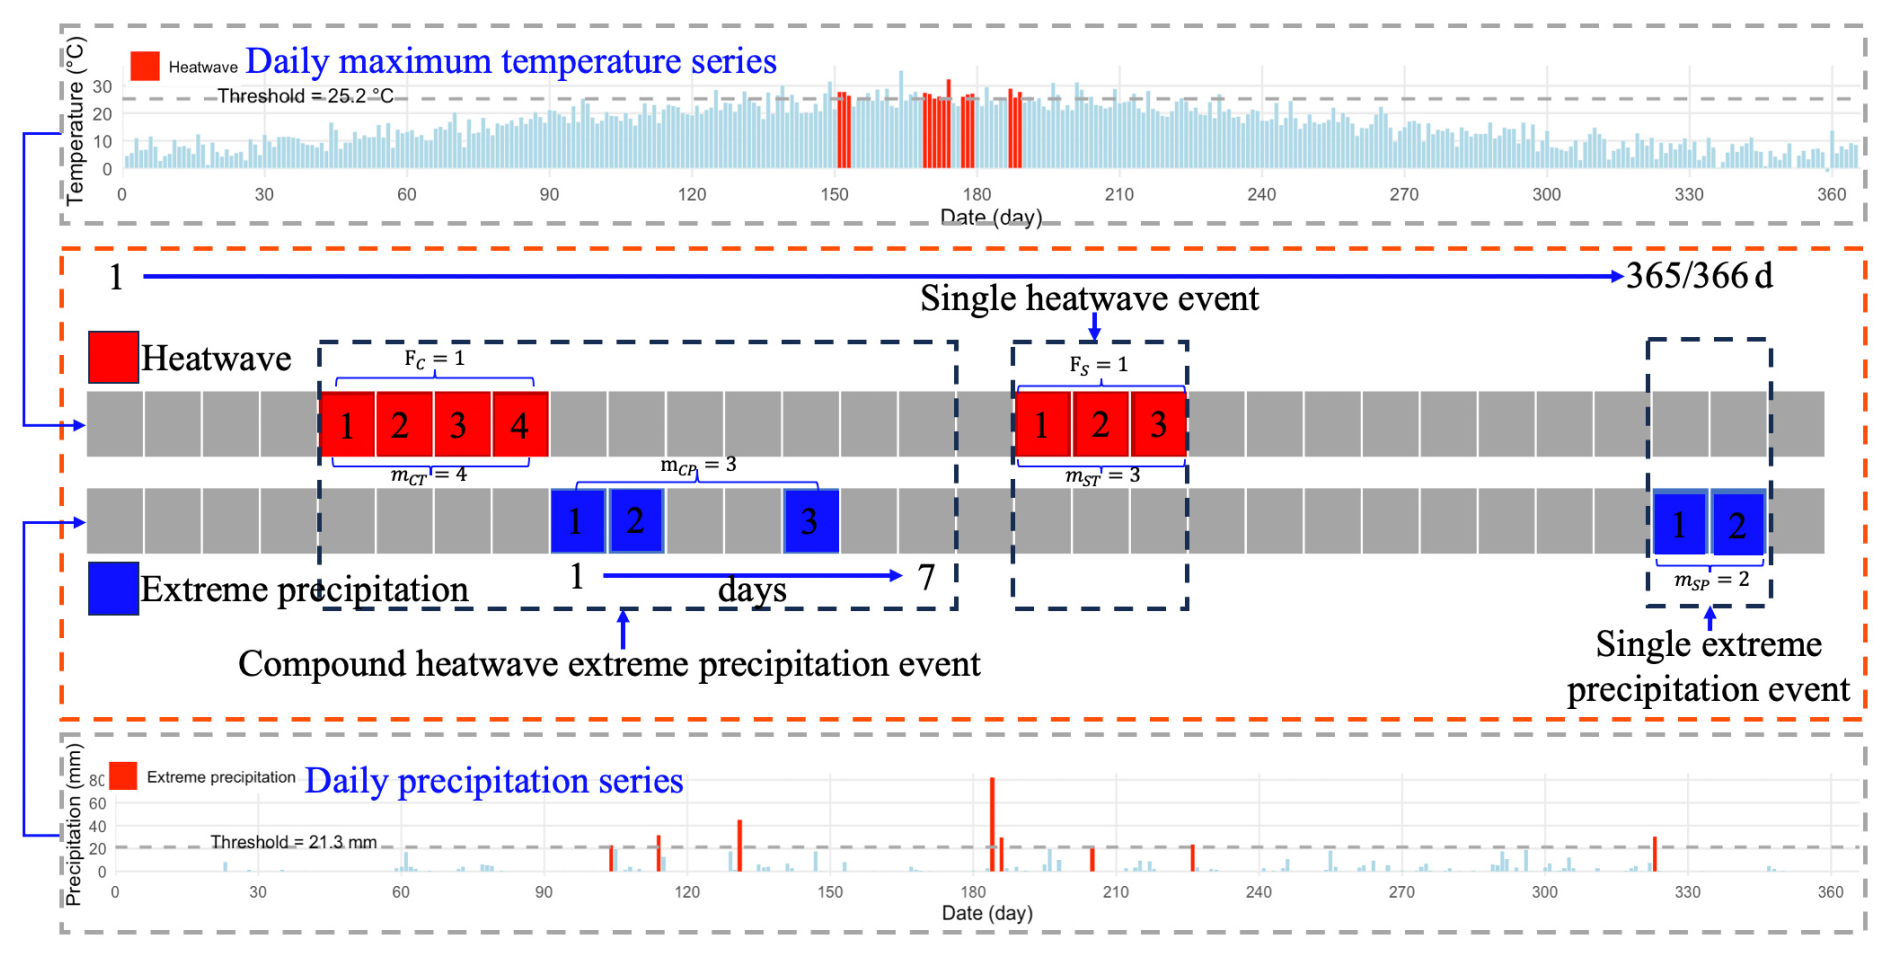
Figure 1Schematic illustration of CHWEP and single extreme precipitation and heatwave events extracted from daily precipitation and daily maximum temperature time series over a year.
3.3 Significance test of median difference
In this study, the Wilcoxon rank-sum test (WRST) was employed to rigorously assess differences in the central tendency of extreme event characteristics. Specifically, we compared CHWEP against single extremes, as well as future projections (2056–2100) against the historical baseline (1980–2024). Unlike parametric tests that rely on mean differences and strict normality assumptions, the WRST is a rank-based non-parametric method specifically sensitive to distributional location shifts. For extreme climate data, these location shifts are robustly interpreted as median differences, which better represent the typical magnitude of events without being distorted by heavy tails, pronounced skewness, or rare outliers (Guerreiro et al., 2018). By operating on ranked values rather than raw measurements, the WRST inherently neutralizes the influence of non-normality and heteroscedasticity, while maintaining high statistical power to detect genuine shifts in the central tendency of two independent sequences (Babüroğlu et al., 2021; Dao, 2022). Consequently, the WRST provides a statistically rigorous and physically meaningful framework for evaluating how compound interactions and future climate forcing alter the characteristic scale of extreme events. In this study, statistical significance was assessed at the 5 % level (α=0.05).
3.4 Event coincidence analysis
CHWEP events may arise either from the random co-occurrence of heatwaves and extreme precipitation, or through a potential physical linkage whereby the occurrence of heatwaves promotes the subsequent development of extreme precipitation (Liu et al., 2024; Ning et al., 2022).
To quantify the statistical dependencies underlying CHWEP events, we employ event coincidence analysis (ECA). ECA is a robust statistical framework designed to evaluate temporal associations between discrete events across multiple time series (Donges et al., 2016; Xiao et al., 2025). By identifying whether events in distinct systems co-occur or follow one another within a narrow time window more frequently than expected by random chance, ECA effectively isolates non-stochastic linkages that warrant further mechanistic investigation (Sun et al., 2024). The method quantifies the strength of such linkages by comparing the observed coincidence rate with the expected coincidence rate under randomness. The corresponding formulas are as follows:
where PH→P denotes the observed coincidence probability from heatwaves to extreme precipitation events, represents the set of occurrence times of heatwave events, NH is the number of heatwave events occurring in a year, denotes the set of occurrence times of extreme precipitation events, with NP being the number of such events in a year, Δ is the time window defining the allowable interval between a heatwave and a subsequent extreme precipitation event, in this study, it is set to within 7 d to obtain sufficient CHWEP event samples, Pcoin represents the probability that extreme precipitation coincidentally occurs exactly within 7 d following a heatwave event, λP is the average occurrence density of extreme precipitation events, defined as , where T is the total observation period, in this study, the number of days in a year, i.e., 365 or 366. R is the ratio of PH→P to Prand. An R greater than 1 indicates that the observed probability is higher than the coincidence probability. σ denotes the standard deviation (SD), N is the length of the sequence, x represents the variable, which in this study corresponds to PH→P, Prand, and R, and is the mean of the variable. We use the SD to quantify the interannual variability of PH→P, Prand, and R, a larger SD indicates greater interannual variation in the variable (Adeloye et al., 2015).
4.1 Historical comparison of CHWEP and single extreme events
CHWEPs exhibit distinct spatial frequency patterns compared to single heatwaves. CHWEPs occur more frequently in the mid- to high-latitude regions of the Northern Hemisphere (Fig. 2a), whereas single heatwaves are more prevalent in tropical regions, the western coastal region of the United States, Spain, northern Africa, the Middle East, and Central Asia (Fig. 2b). This may be because warming temperatures in the mid- to high-latitude regions of the Northern Hemisphere enhance the hydrological cycle, thereby promoting the occurrence of extreme precipitation events, whereas tropical or desert regions exhibit distinct wet and dry seasons, where single heatwave events occur more frequently and last longer. The spatial patterns of heatwave intensity are broadly similar between CHWEPs (Fig. 2c) and single heatwaves (Fig. 2d), with hotspots in the Sahara Desert, the Middle East, and Australia. Similarly, the intensity patterns of extreme precipitation during CHWEPs (Fig. 2e) resemble those of single extreme precipitation events (Fig. 2f), with high-intensity regions located in the equatorial zone, northern Argentina, and southern China. The spatial distribution of heatwave duration also shows strong similarity between CHWEPs (Fig. 2g) and single heatwaves (Fig. 2h), with prolonged durations predominantly observed in the equatorial regions, the Middle East, and India. Additionally, we analyzed the changes in metrics across different regions based on continental boundaries (Fig. S1). Box plots of the frequency, heatwave intensity, extreme precipitation intensity, and heatwave duration for CHWEP and single extreme events in different regions are shown in Fig. S2. Furthermore, we analyzed the mean spatial distributions of CHWEP and single extreme events extracted from the CMIP6 historical data (1980–2024), which show relatively high consistency with those derived from reanalysis data (Fig. S3). Further analysis using Spearman's rank correlation coefficients (SRCC) (Sect. S1) on the correlation between the attributes of CHWEP and single extreme events extracted from the reanalysis and CMIP6 data from 1980–2024 revealed a high correlation, demonstrating the high similarity of the CHWEP and single extreme events derived from both data sources (Fig. S4). Consequently, it is feasible to extract the changes in CHWEP and single extreme events under future scenarios based on CMIP6 future scenario data.
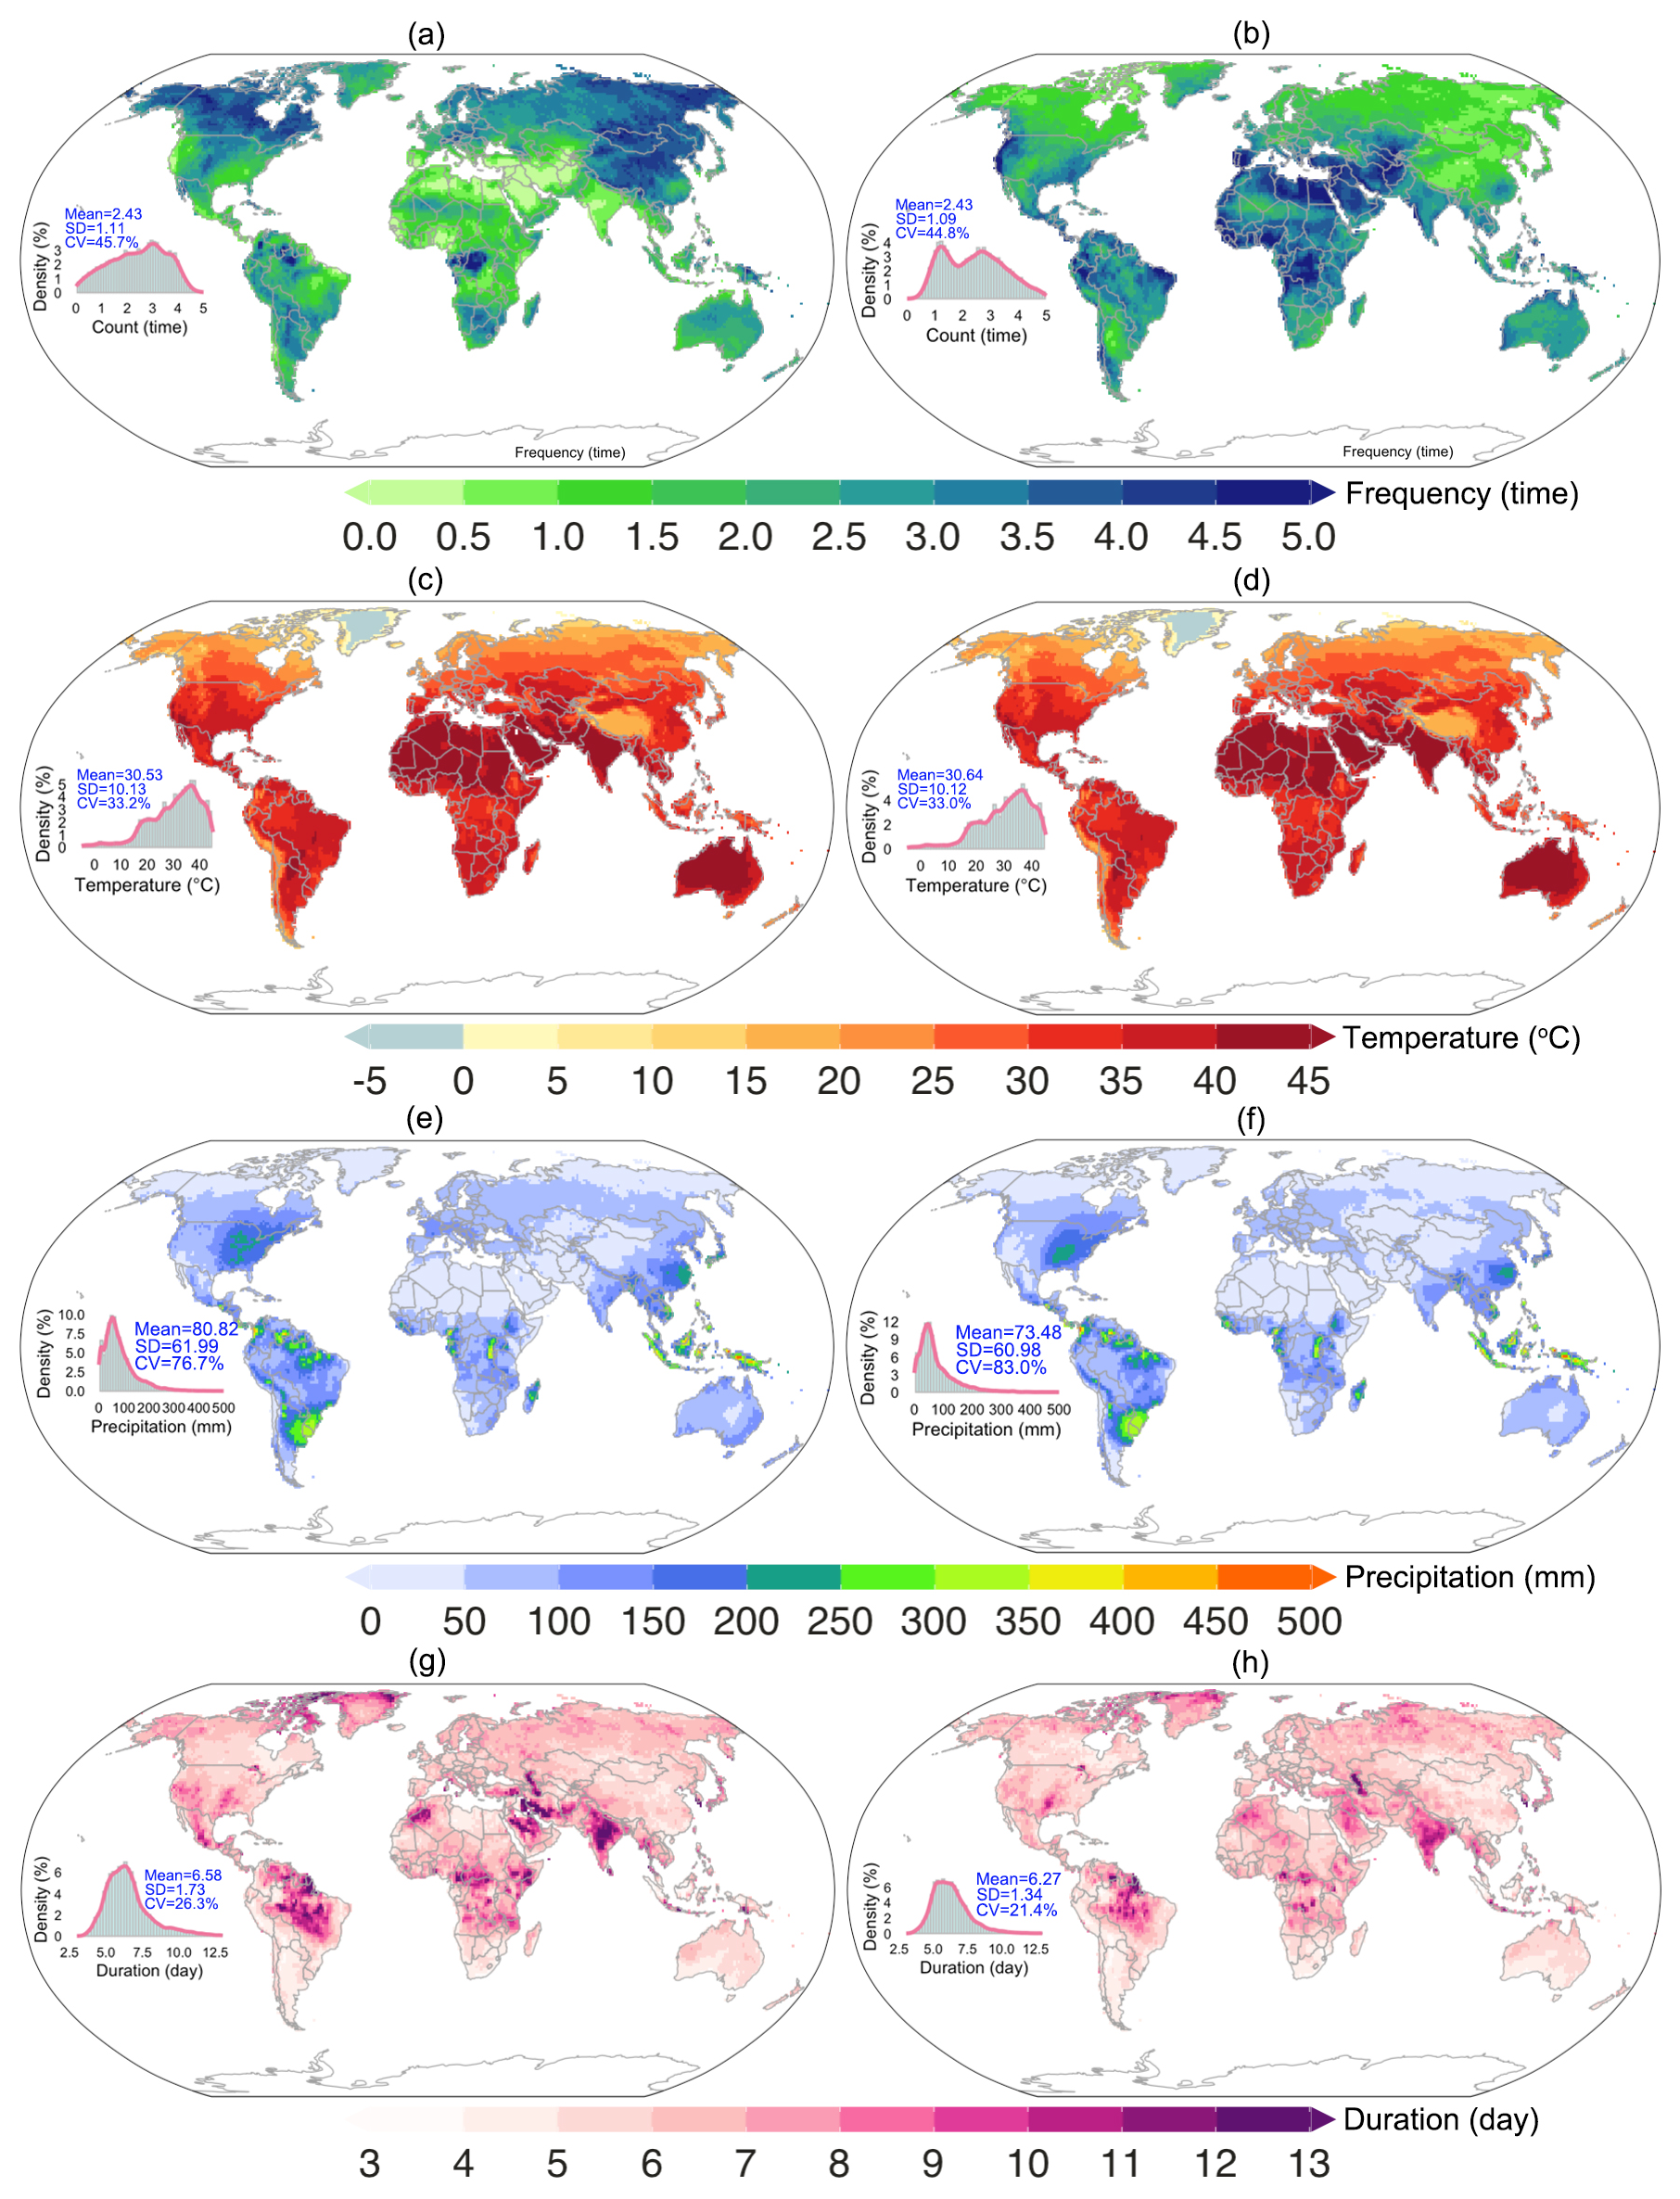
Figure 2Spatial distribution of the mean values of the frequency (a, b), heatwave intensity (c, d), extreme precipitation intensity (e, f), and heatwave duration (e, f) of CHWEP (a, c, e, g) and single extreme events (b, d, f, h) from 1980 to 2024.
CHWEPs occur more frequently than single heatwaves in mid-to-high latitude regions (Fig. 3a). The heatwave intensity associated with CHWEPs is significantly higher than that of single heatwaves in tropical regions (Fig. 3b). In most mid- to high-latitude regions of the Northern Hemisphere, the extreme precipitation intensity during CHWEPs exceeds that of single extreme precipitation events (Fig. 3c). Moreover, the duration of heatwaves within CHWEPs is notably longer than that of single heatwaves in the mid-to-high latitudes (Fig. 3d). These results indicate that the impacts of CHWEPs are more pronounced in mid-to-high latitude regions compared to low latitudes. Box plots of the median differences between CHWEP and single extreme events in frequency, heatwave intensity, extreme precipitation intensity, and heatwave duration across different regions from 1980 to 2024 are shown in Fig. S5. Additionally, we specifically mapped the p-values from the WRST, revealing that the frequency of CHWEP is significantly higher than that of single heatwave events across 72.3 % of the global area (Fig. S6). Furthermore, we analyzed the differences between CHWEP and single extreme events based on CMIP6 data. The spatial patterns of these differences resemble those in Fig. 3, demonstrating that CMIP6 data can reproduce the spatial differences between CHWEP and single extreme events (Fig. S7).
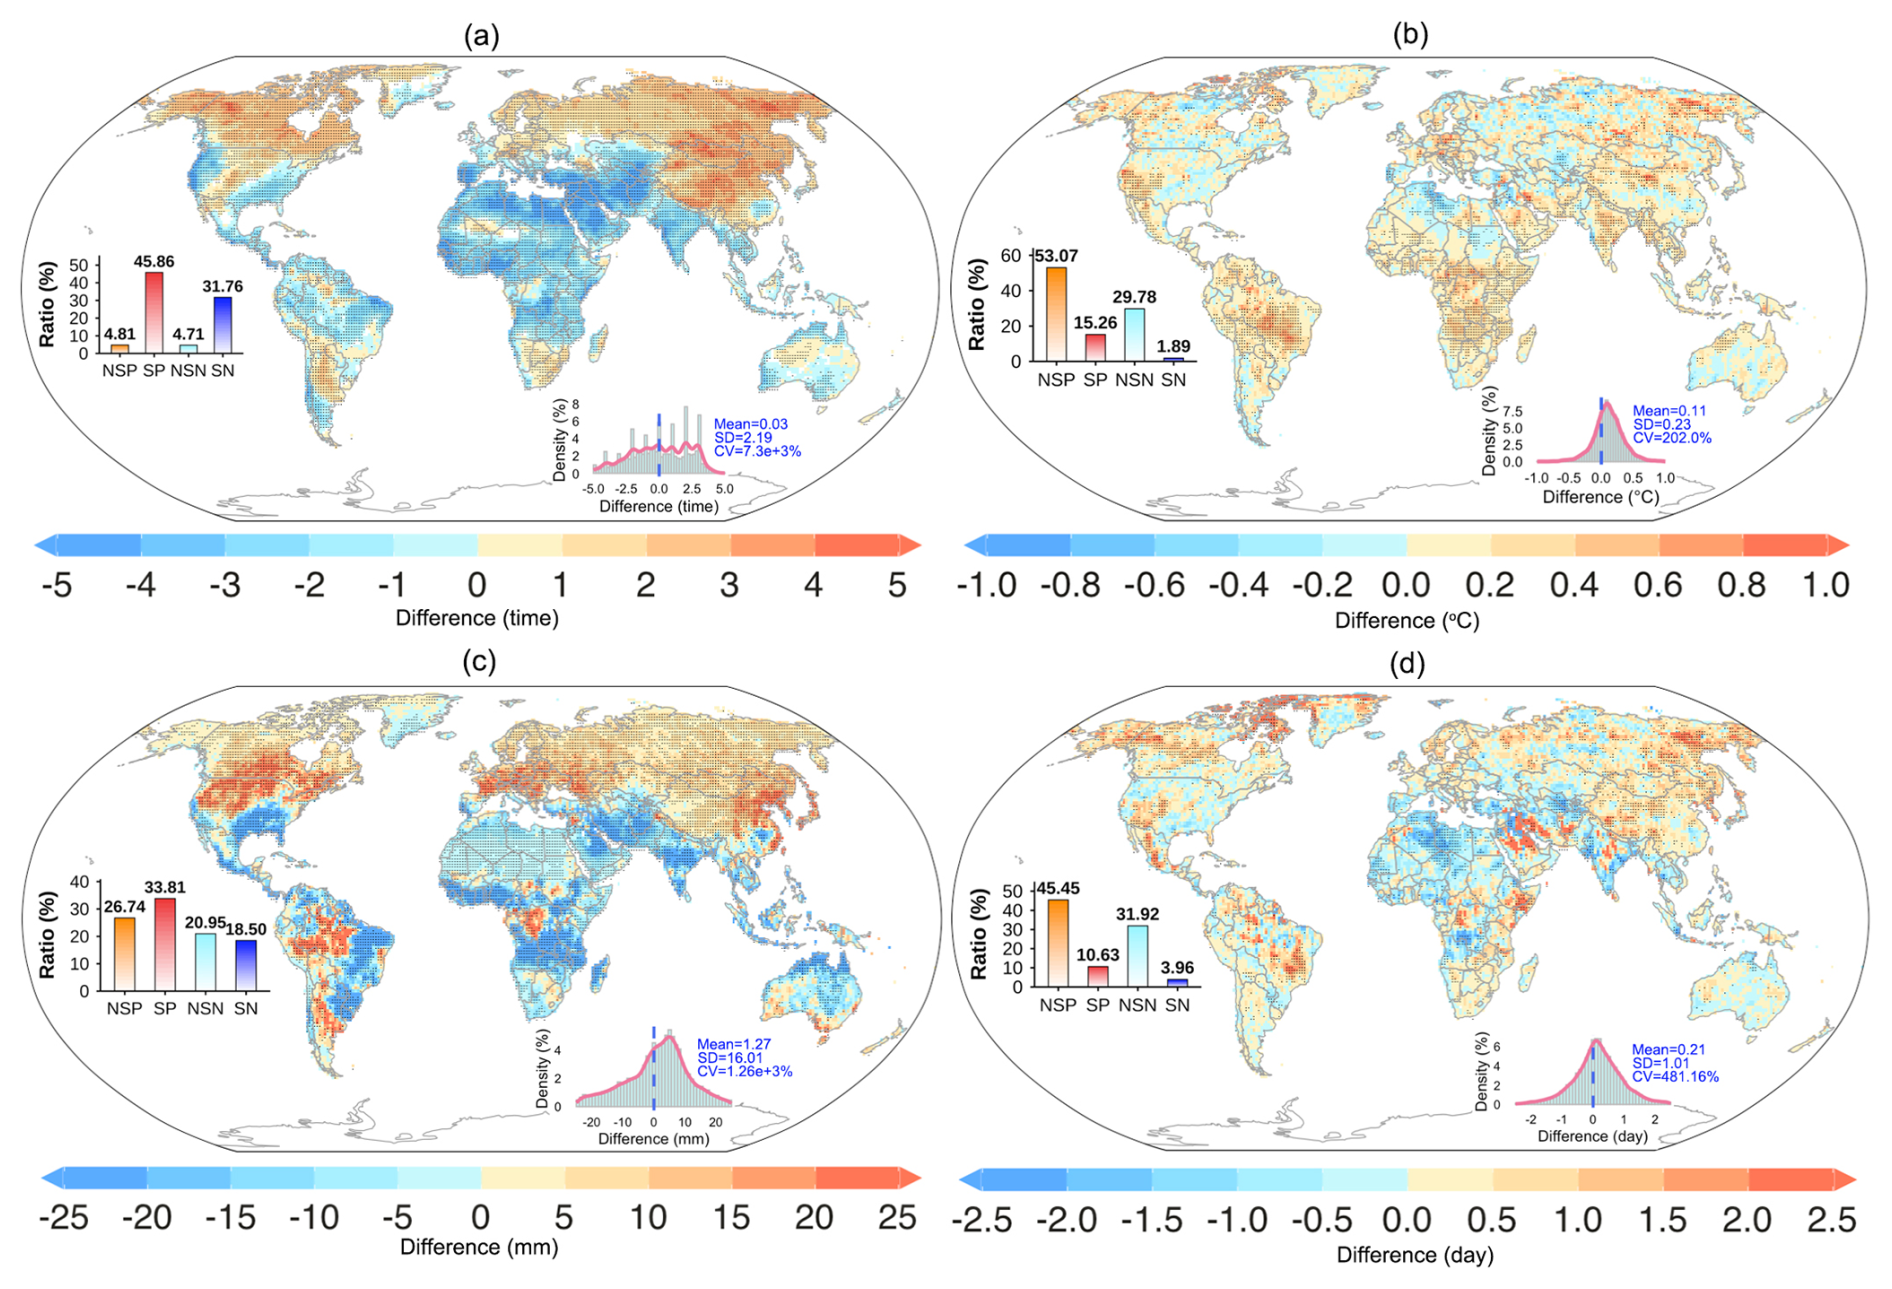
Figure 3Spatial distribution of median differences between CHWEP and single extreme events in frequency (a), heatwave intensity (b), extreme precipitation intensity (c), and heatwave duration (d) from 1980 to 2024. (Note: In the left bar chart, NSP denotes Non-Significant Positive, SP denotes Significant Positive, NSN denotes Non-Significant Negative, and SN denotes Significant Negative. Stippling indicates significance at the 5 % level. The same abbreviations apply hereinafter.)
4.2 Future changes and comparisons of CHWEP and single extreme events
Under the SSP2-4.5 (Fig. S8) and SSP5-8.5 (Fig. S9) scenarios, the spatial patterns of CHWEPs and single extreme events are broadly similar to those observed during the historical period (Fig. 2), indicating a consistent spatial organization of extreme events across time periods. South America (SAM) exhibits the strongest precipitation intensity in both CHWEP and single extreme precipitation events, but the shortest heatwave duration (Fig. S10). The spatial distribution of differences in event characteristics between CHWEPs and single extremes also remains largely unchanged under future projections. Specifically, the frequency of CHWEPs (Fig. 4a), the intensity of associated extreme precipitation (Fig. 4e), and heatwave duration (Fig. 4g) are substantially higher in mid-to-high latitudes compared to single events (Fig. 4b, f, and h). Conversely, heatwave intensity during CHWEPs is greater in tropical regions than that of single heatwaves (Fig. 4c and d). Notably, the magnitude of these differences is more pronounced under the SSP5-8.5 scenario than under SSP2-4.5, suggesting an amplification of compound event characteristics under stronger warming. The median differences in metrics between CHWEP and single extreme events across different regions are shown in Fig. S11.
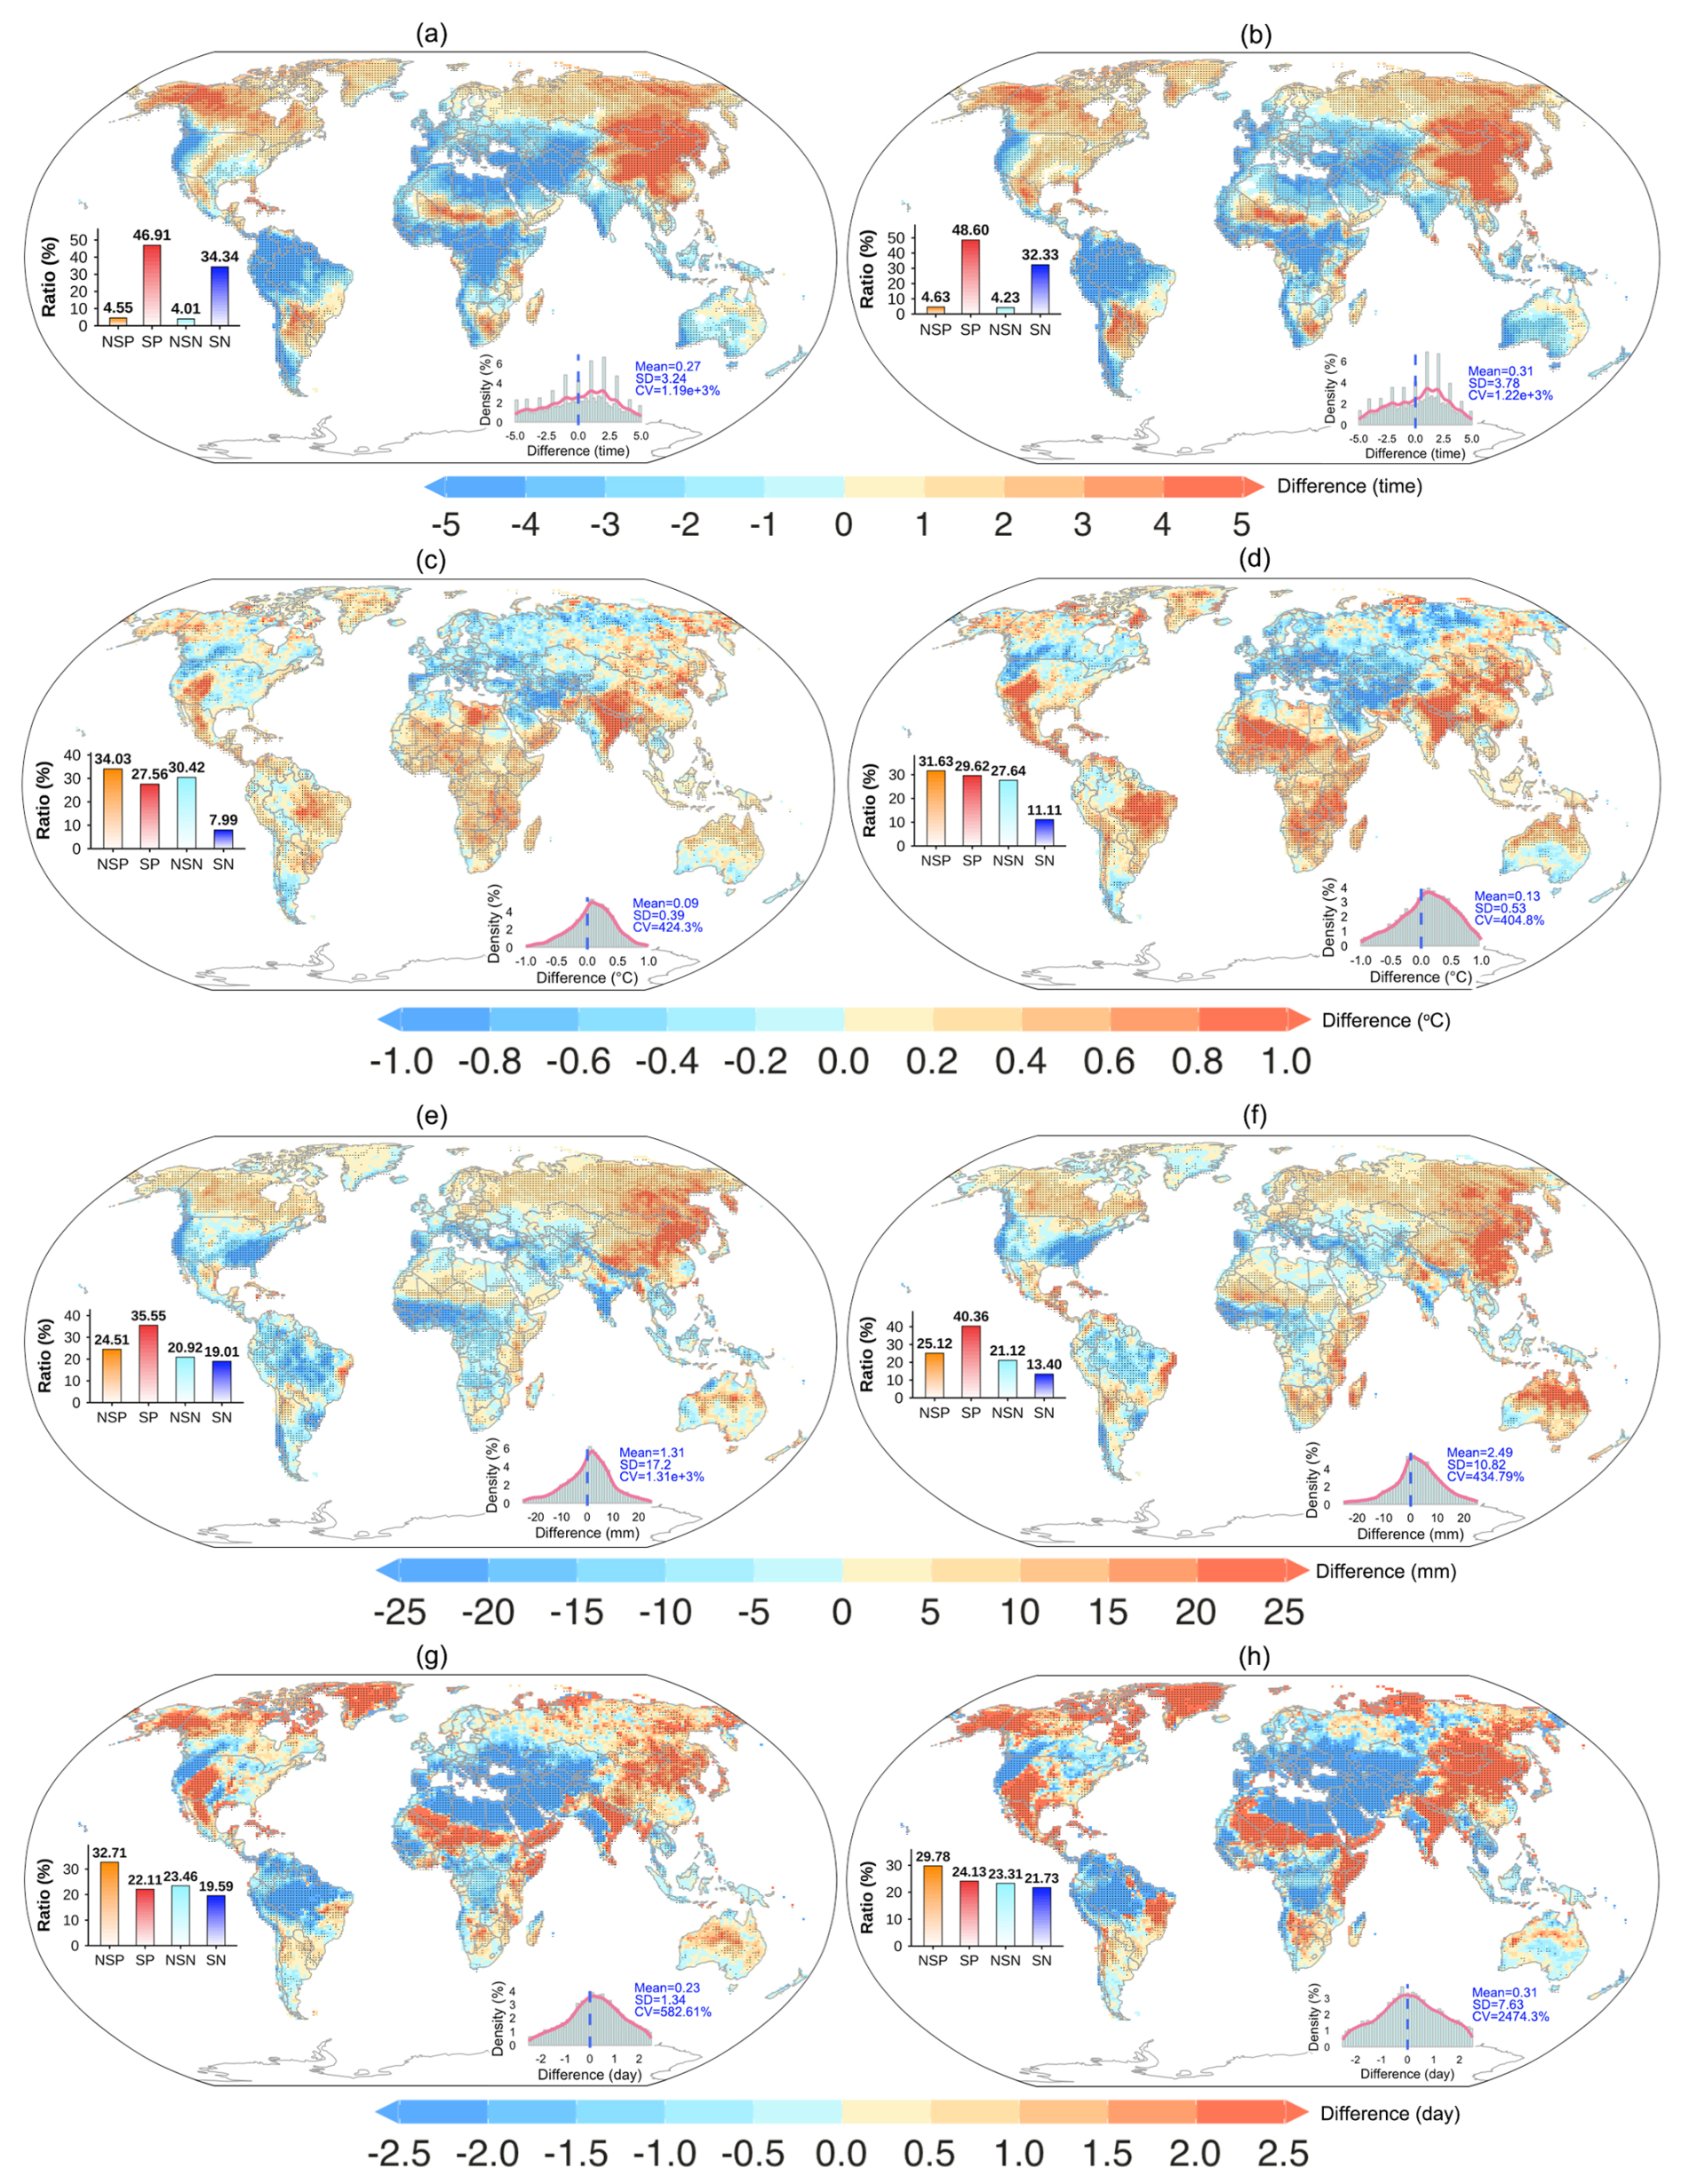
Figure 4Spatial distribution of median differences between CHWEP and single extreme events in frequency (a, b), heatwave intensity (c, d), extreme precipitation intensity (e, f), and heatwave duration (g, h) from 2056 to 2100 under SSP2-4.5 (a, c, e, g) and SSP5-8.5 (b, d, f, h) scenarios.
Globally averaged trends in CHWEPs and single extreme events show that the frequency (Fig. 5a), heatwave intensity (Fig. 5b), extreme precipitation intensity (Fig. 5c), and heatwave duration (Fig. 5d) of both compound and single events are increasing over time. Notably, the rates of increase in frequency and heatwave duration are faster than those of heatwave intensity and extreme precipitation intensity. Furthermore, under the SSP5-8.5 scenario, all extreme event metrics are substantially higher than under the SSP2-4.5 scenario, indicating a strong dependence on the level of future warming.
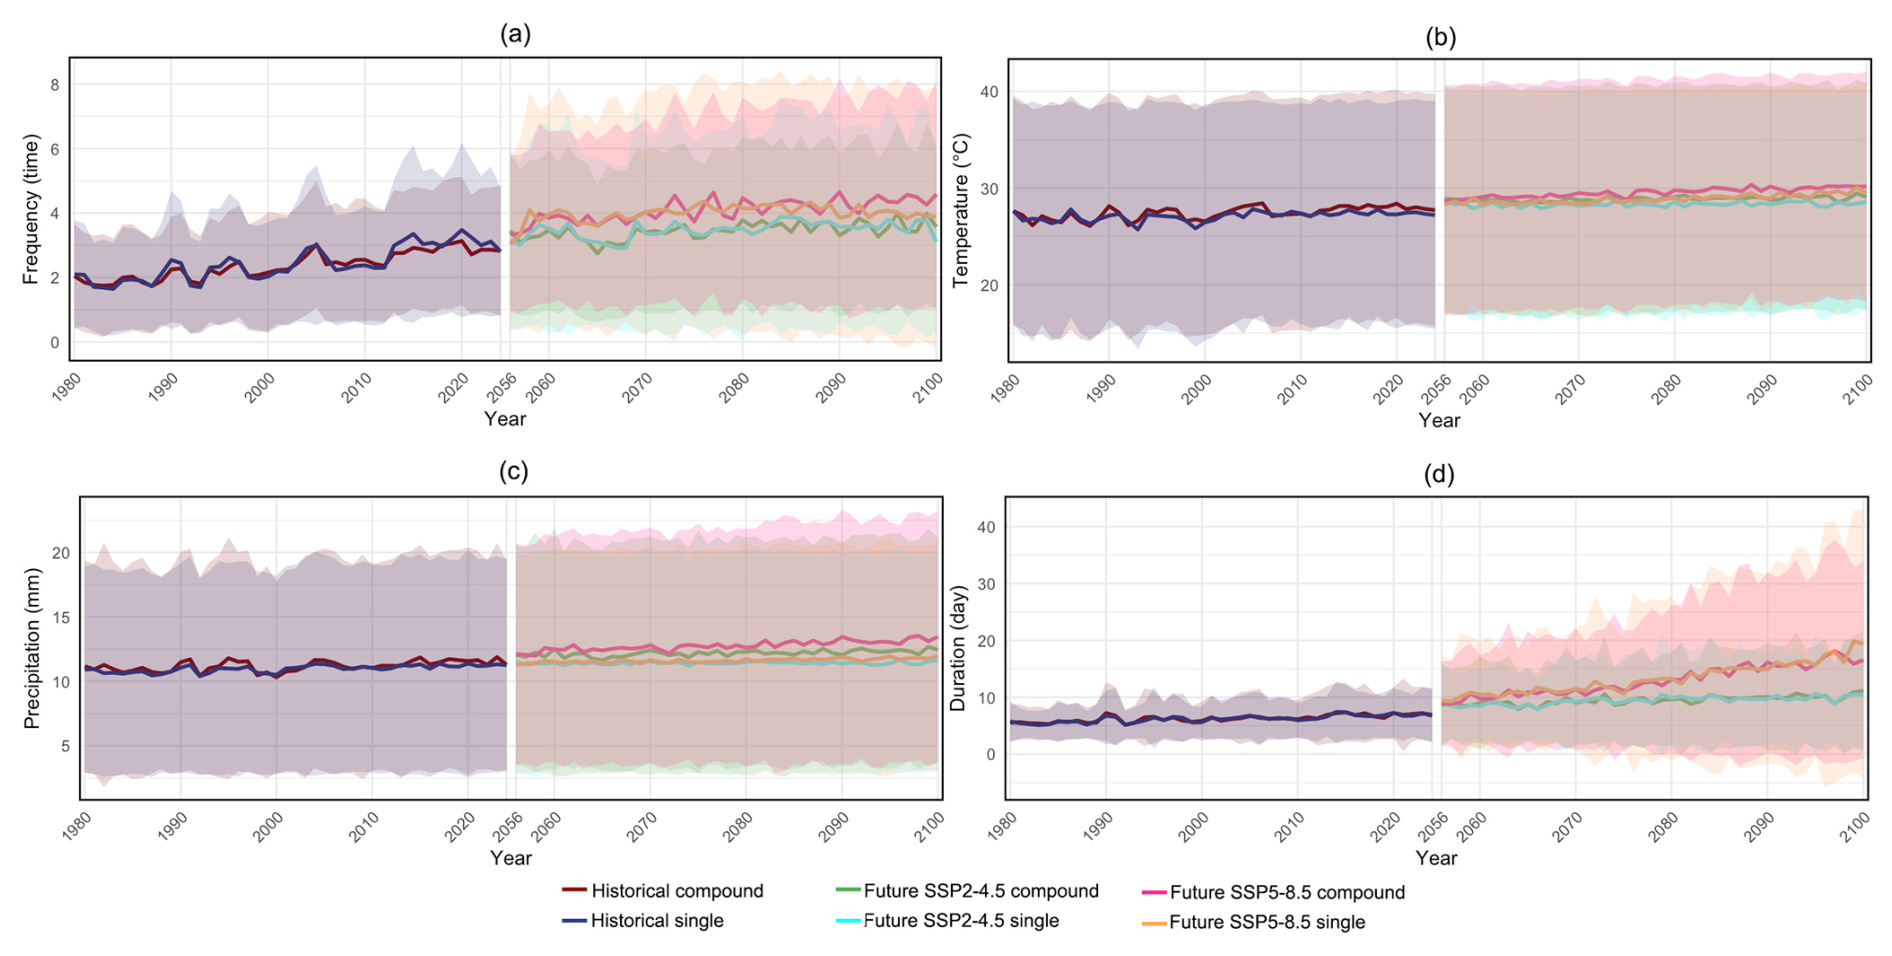
Figure 5Changes in the frequency (a), heatwave intensity (b), extreme precipitation intensity (c), and heatwave duration (d) during the historical and future periods of CHWEP and single extreme events.
Compared to the historical period, both CHWEPs and single extreme events show increases in frequency, heatwave intensity, extreme precipitation intensity, and heatwave duration over more than half of the global land area under the SSP2-4.5 (Fig. S12) and SSP5-8.5 (Fig. S13) scenarios. The magnitude of these increases is substantially larger under the SSP5-8.5 scenario, indicating a strong dependence on the level of global warming. Box plots of the differences in metrics between the future and historical periods for CHWEP and single extreme events across different regions are shown in Fig. S14. The vast majority of metrics show some degree of increase across all continents.
Under the SSP2-4.5 and SSP5-8.5 scenarios, the proportion of grid cells showing positive changes in attribute metrics of CHWEP and single extreme events is overwhelmingly dominant. Under SSP5-8.5, the frequency (Fig. 6a), heatwave intensity (Fig. 6b), and heatwave duration (Fig. 6d) of both CHWEP and single extreme events are higher than under SSP2-4.5, with similar magnitudes of change. Furthermore, we find that under both scenarios, the extreme precipitation intensity associated with CHWEP is significantly greater than that of single extreme precipitation events (Fig. 6c). Notably, under SSP2-4.5, the precipitation intensity in CHWEP even exceeds that of single extreme events under the more severe SSP5-8.5 scenario. These results demonstrate that CHWEP events are characterized by significantly intensified extreme precipitation, with antecedent heatwaves systematically amplifying concurrent rainfall severity. This coupling aligns with thermodynamic scaling, wherein elevated temperatures enhance atmospheric moisture-holding capacity and increase convective instability (Li et al., 2025; Ning et al., 2022; Zhou et al., 2024). The amplification effect is particularly pronounced across the mid- to high-latitude Northern Hemisphere, where land–atmosphere feedbacks and shifting circulation anomalies further modulate extreme hydroclimatic responses.
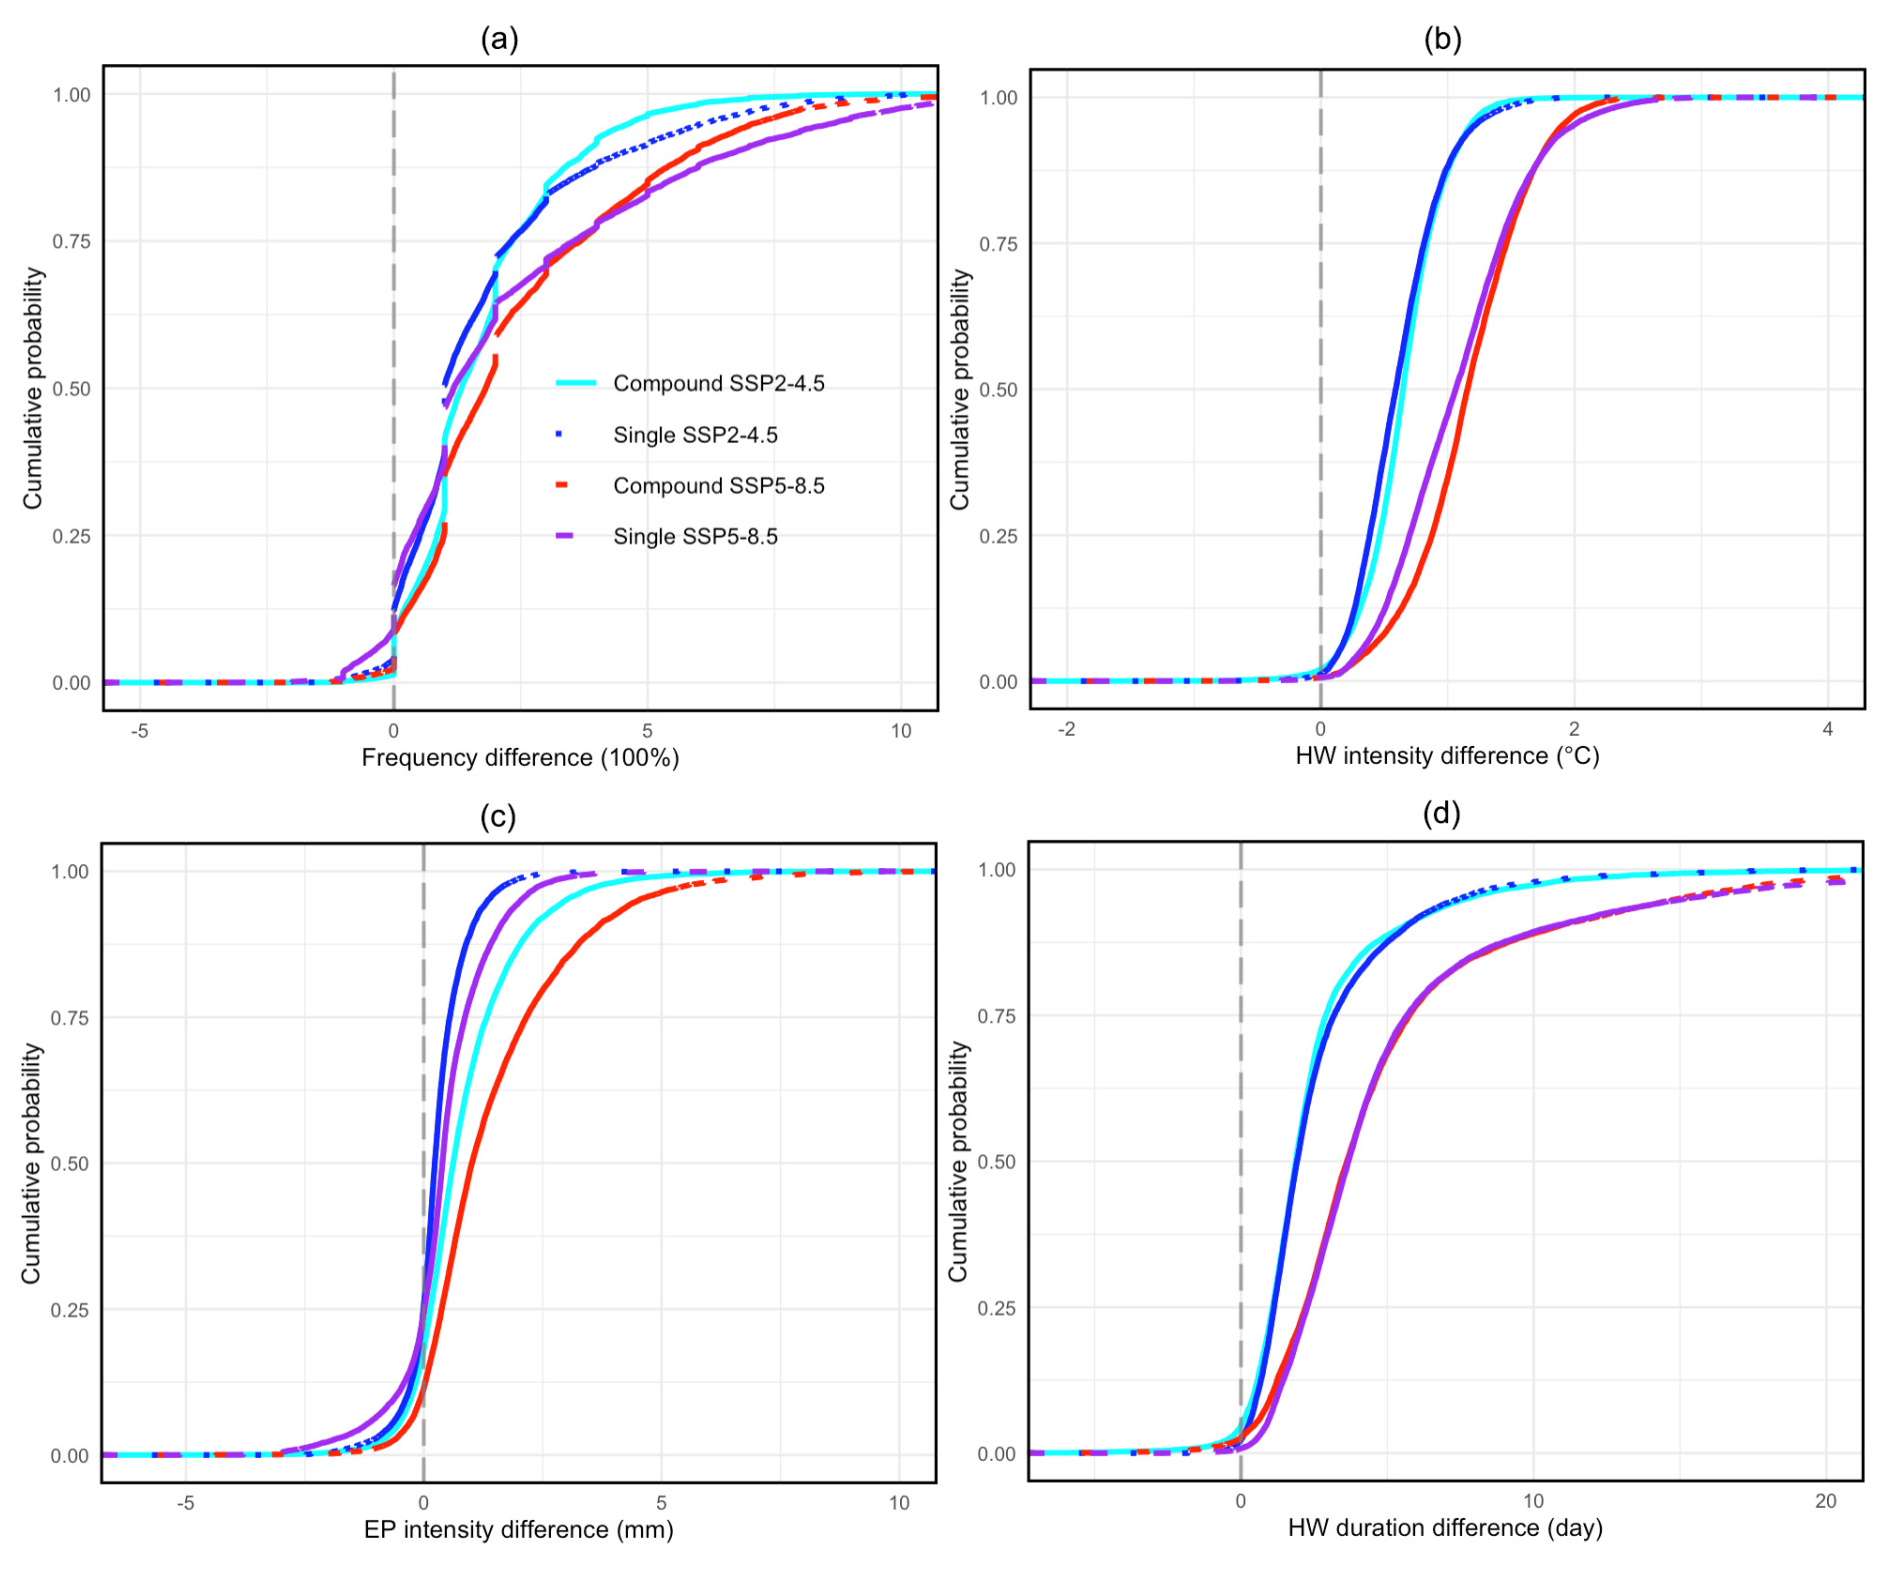
Figure 6Comparison of the cumulative probability of the median differences between the frequency (a), heatwave intensity (b), extreme precipitation intensity (c), and heatwave duration (d) of CHWEP and single extreme events under the SSP2-4.5 and SSP5-8.5 scenarios and the historical period.
4.3 Probability of encountering heatwaves and extreme precipitation events
The observed probability of co-occurring heatwaves and extreme precipitation is higher in mid-to-high latitude regions (Fig. 7a), with smaller SDs, indicating lower variability (Fig. 7d). In contrast, the coincidence probability of their co-occurrence is higher in tropical regions (Fig. 7b), but with greater variability (Fig. 7e). The ratio of observed to coincidence probability exceeds 1 over more than 66 % of the globe (Fig. 7c), particularly in mid-to-high latitudes, where the variability is relatively low (Fig. 7f), suggesting that heatwave events in these regions are more likely to be followed by extreme precipitation. In terms of trends, the observed probability (Fig. 7g), coincidence probability (Fig. 7h), and their ratio (Fig. 7i) are increasing more rapidly in tropical regions, indicating a growing likelihood of CHWEP in the tropics in the future. Box plots of the observed probability and coincidence probability along with their ratio, the SDs of both and the SD of their ratio, and the trends of both along with the trend of their ratio across different regions are shown in Fig. S15.
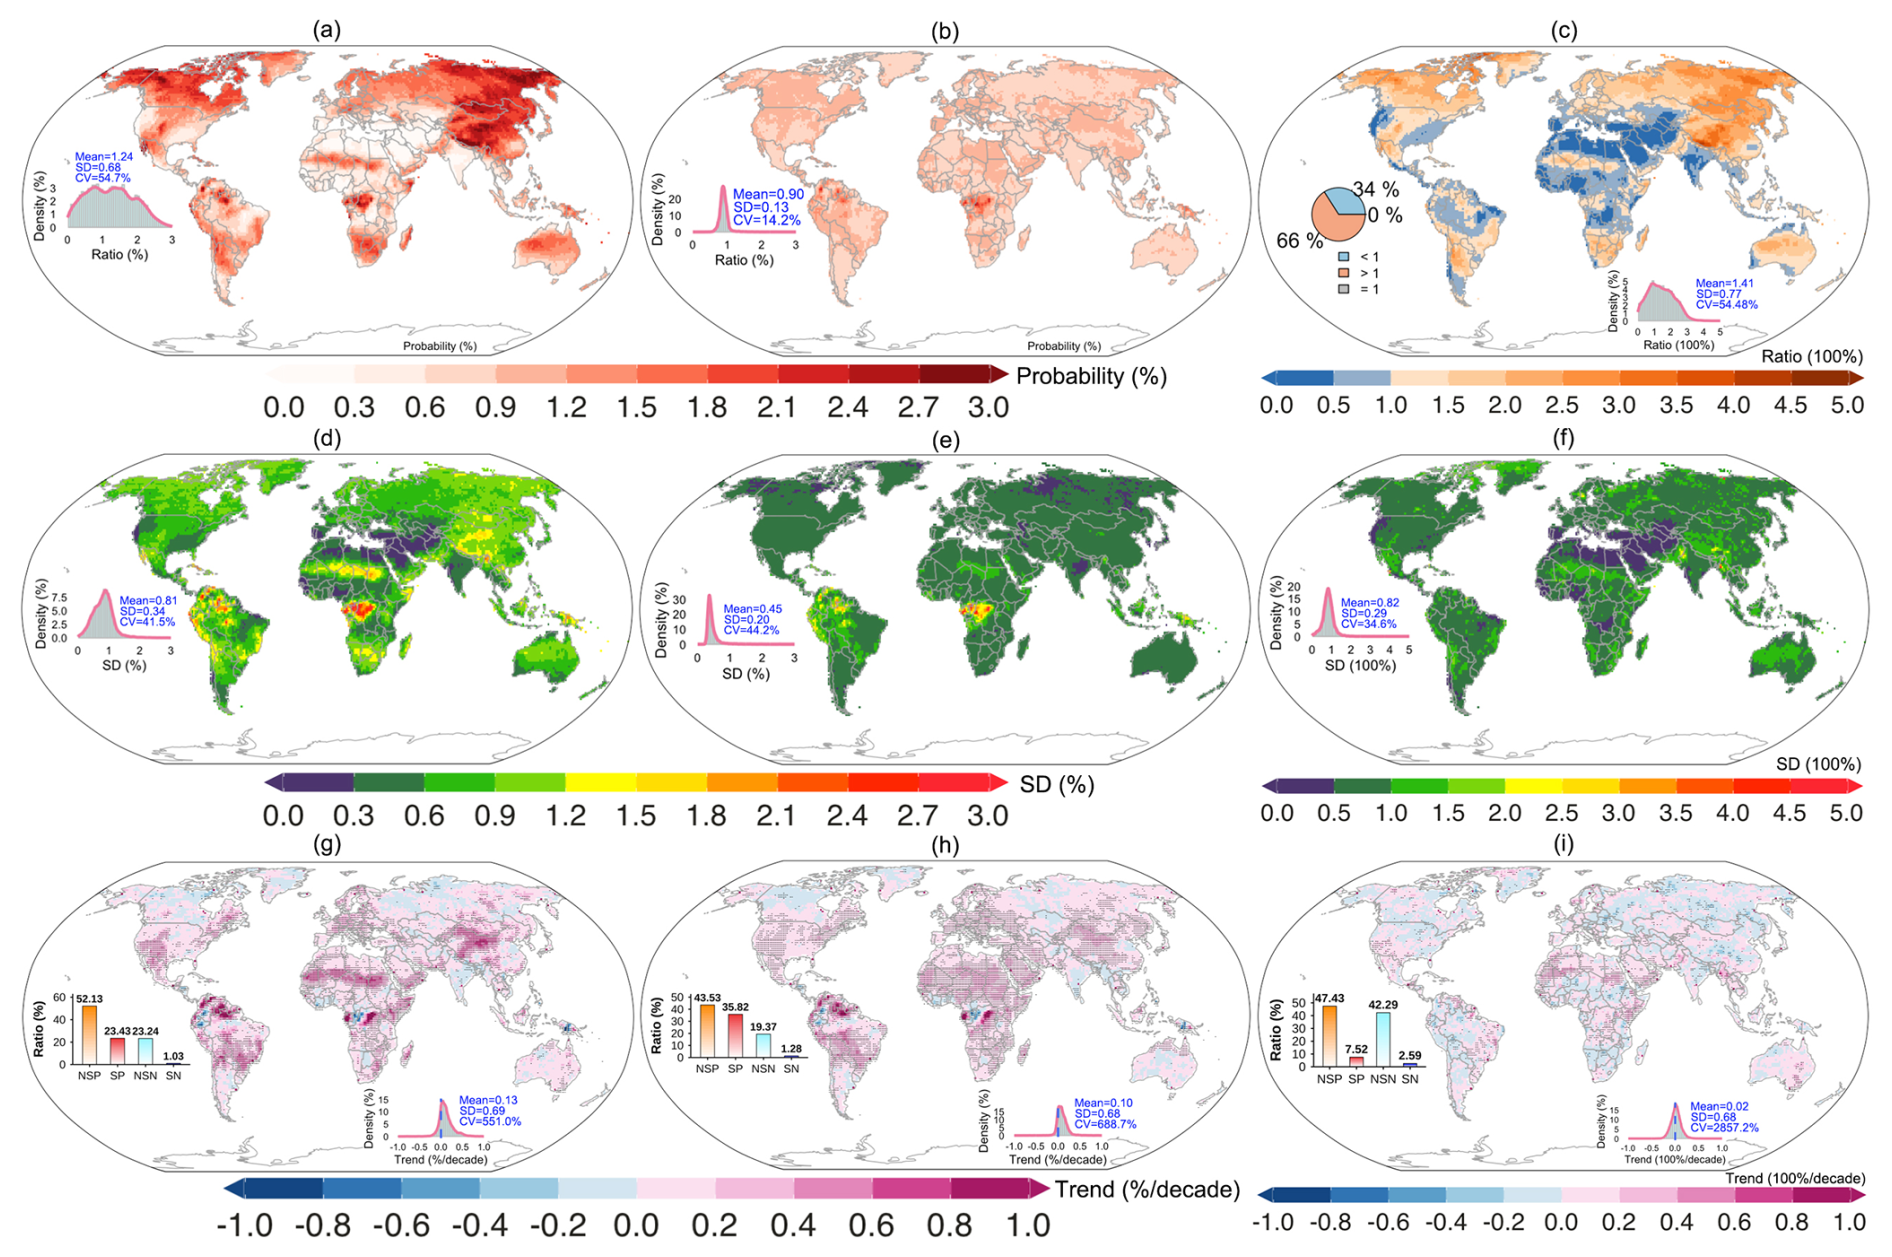
Figure 7Spatial distributions of the mean observed probability (a), mean coincidence probability (b), and mean ratio of observed probability to coincidence probability over the period 1980-2024 in the first row (c), the second row shows the spatial distributions of their SDs (d–f), the third row presents their spatial patterns of linear trends (g–i).
In the future period, the observed probability of co-occurring heatwaves and extreme precipitation remains higher in mid-to-high latitude regions (Fig. 8a and d), while their random co-occurrence probability continues to be higher in tropical regions (Fig. 8b and e). Under the SSP5-8.5 scenario, both observed and random co-occurrence probabilities are notably higher than under the SSP2-4.5 scenario. Under SSP2-4.5, 70.9 % of the globe shows a ratio of observed to random co-occurrence probability greater than 1 (Fig. 8c), increasing to 76.2 % under SSP5-8.5 (Fig. 8f), indicating an intrinsic linkage mechanism between heatwaves and extreme precipitation. This suggests that, in the future, a growing number of regions worldwide will experience extreme precipitation following heatwave events. Box plots of the observed probability, coincidence probability, and their ratio across different regions under the SSP2-4.5 and SSP5-8.5 scenarios are shown in Fig. S16.
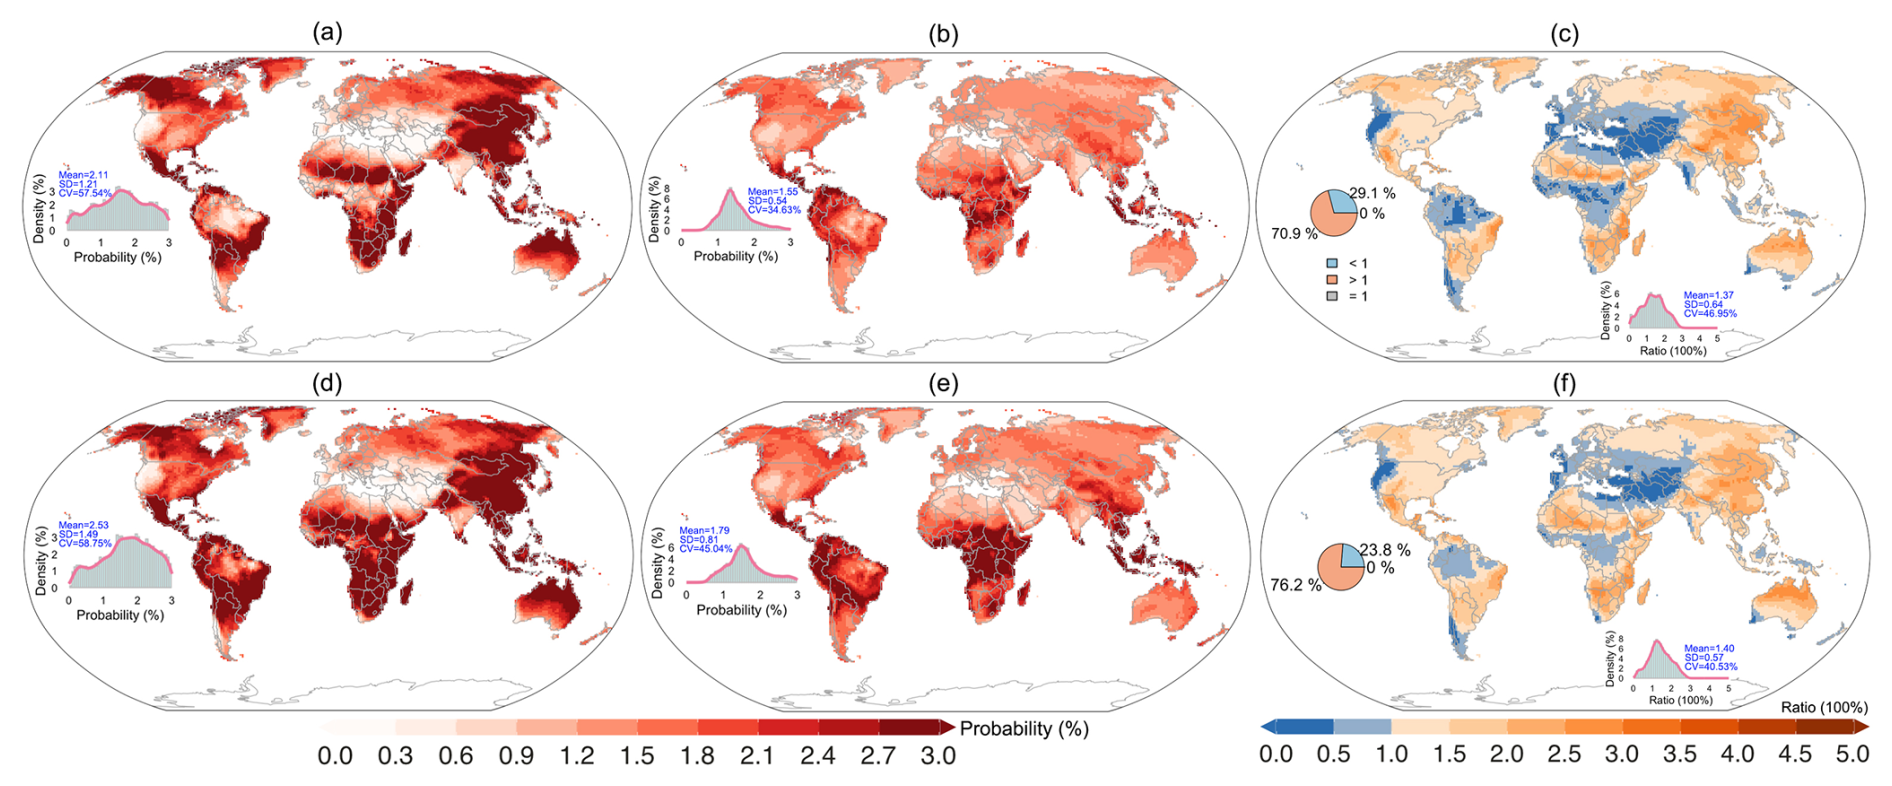
Figure 8Spatial distributions of the mean observed probability (a, d), mean coincidence probability (b, e), and mean ratio of observed probability to coincidence probability (c, f) under the SSP2-4.5 (a–c) and SSP5-8.5 (d–f) scenarios for the period 2056–2100.
Globally, both observed and random co-occurrence probabilities of heatwaves and extreme precipitation exhibit upward trends from the historical to the future period (Fig. 9a), with elevated magnitudes and accelerated growth under the SSP5-8.5 scenario. This projection indicates a substantial increase in the global frequency of CHWEP events under continued warming. Although both probabilities rise, their ratio, observed divided by random, shows no significant temporal trend yet remains consistently greater than 1 (Fig. 9b). This persistent deviation from unity demonstrates that CHWEP occurrences are not attributable to random coincidence alone, rather, heatwaves tend to precondition the atmosphere for subsequent extreme precipitation, supporting a physically coupled linkage between these two hazards.
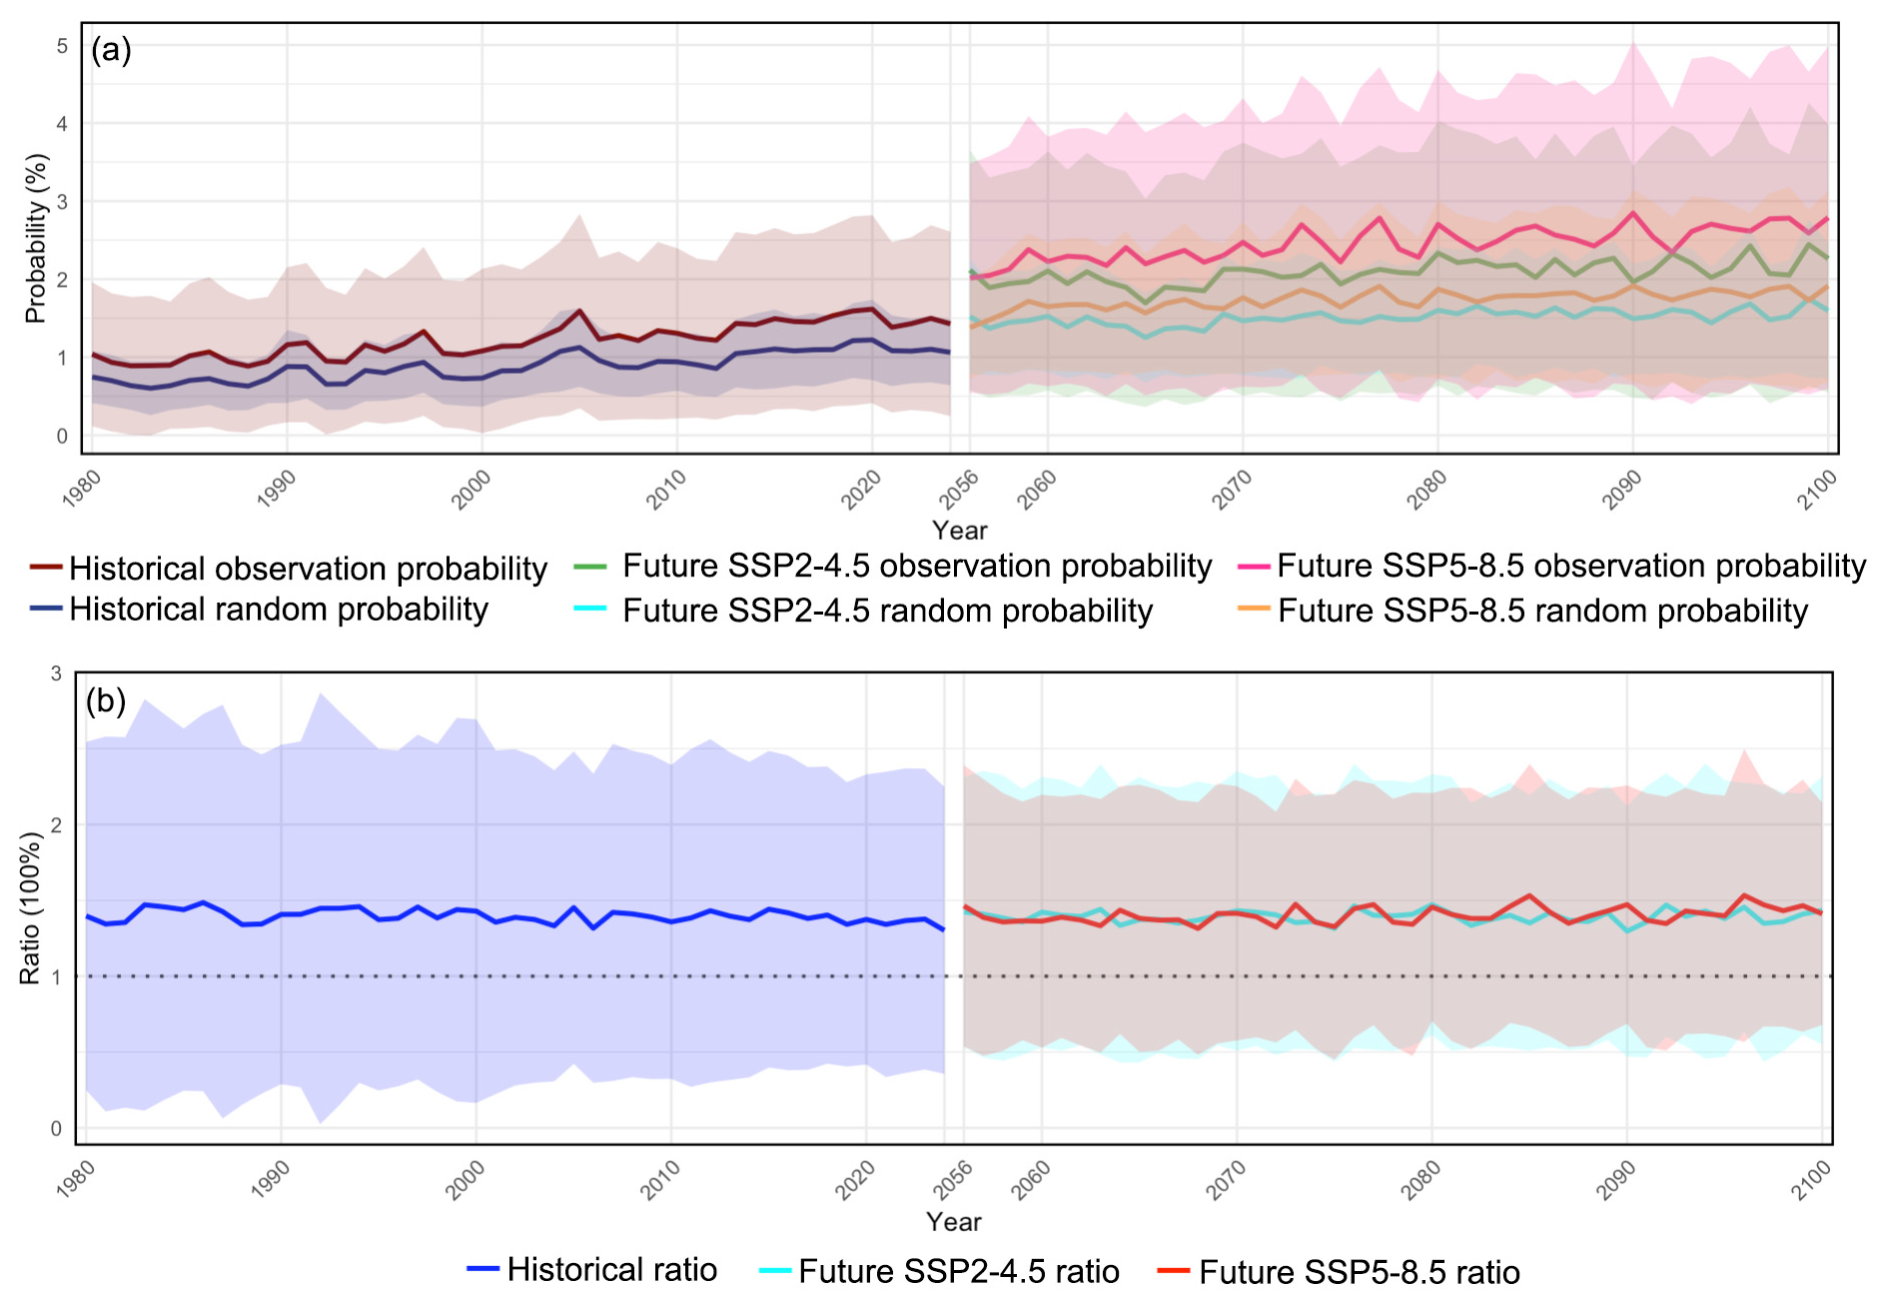
Figure 9Changes in the observed probability and coincidence probability (a), and their ratio (b) for the global co-occurrence of heatwaves and extreme precipitation between the historical period (1980–2024) and the future period (2056–2100).
Under future scenarios, the observed (Fig. 10a and d) and random (Fig. 10b and e) probabilities of heatwave and extreme precipitation co-occurrence increase over most of the globe, with larger increases in tropical regions. The magnitude of change in co-occurrence probability is greater under the SSP5-8.5 scenario than under SSP2-4.5. The ratio of observed to random co-occurrence probability (Fig. 10c and f) increases more in tropical regions but decreases in mid-to-high latitude regions, with larger changes under SSP5-8.5. This indicates that CHWEP events will become more frequent in the future, and the likelihood of extreme precipitation following heatwaves will increase more substantially in the tropics. Box plots of the differences in median values of observed probability, coincidence probability, and their ratio for the co-occurrence of heatwaves and extreme precipitation between the future period (under SSP2-4.5 and SSP5-8.5 scenarios) and the historical period across different regions are shown in Fig. S17, with SAM and Africa exhibiting larger increases in both probability and ratio.
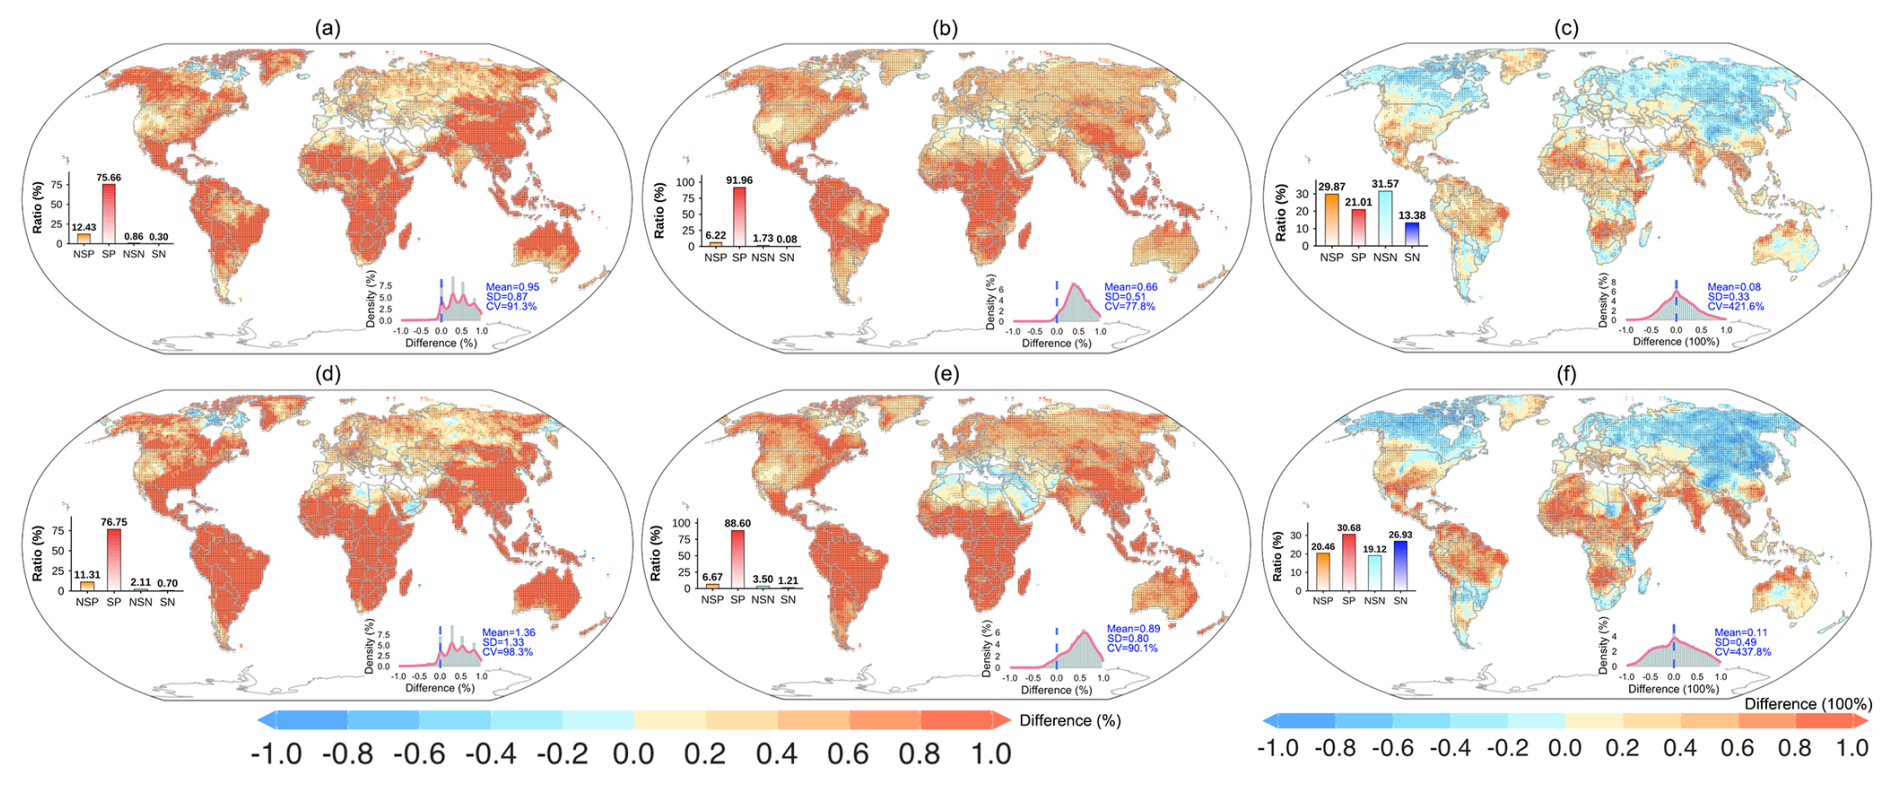
Figure 10Spatial distribution of the differences in median values of observed probability (a, d), coincidence probability (b, e), and their ratio (c, f) for the co-occurrence of heatwaves and extreme precipitation between the future period (under SSP2-4.5 a–c and SSP5-8.5 d–f scenarios) and the historical period.
Compound extreme events are receiving increasing attention from both the scientific community and society, as regions experiencing concurrent or sequential extremes often face compounded or cascading impacts that lead to more severe socioeconomic and ecological damage than single extremes alone (Götte and Brunner, 2024; Sauter et al., 2023a; Sun et al., 2023). This study focuses on CHWEP, revealing that beyond the cumulative impact of sequential extremes, the integrated intensity of compound events exceeds that of single extremes across most regions, resulting in heightened risks (Jin et al., 2024; Xiao et al., 2025). Previous studies suggest that the choice of extreme event thresholds and the time window for defining compound events have limited influence on the identification of their underlying linkages, whereas sufficient sample sizes enable more robust detection of long-term trends (Bevacqua et al., 2021; Diffenbaugh et al., 2017; Fang et al., 2025). Although climate models may exhibit biases in simulating absolute magnitudes, this study emphasizes relative changes, focusing on how compound events evolve rather than their exact intensity, ensuring the robustness of the findings (Chen et al., 2022; Ganguli and Merz, 2024; Lei et al., 2024).
This study shows that both CHWEP and single extreme events are increasing significantly in frequency, intensity, and duration. Understanding the spatial heterogeneity of these increases requires parsing the relative contributions of thermodynamic and dynamic drivers within the climate system. For instance, the greater increase in the frequency and precipitation intensity of both CHWEP and single events in equatorial regions is primarily driven by thermodynamic responses: the Clausius-Clapeyron relationship dictates that a warmer atmosphere holds exponentially more moisture (∼7 % °C−1), directly accelerating the hydrological cycle and increasing the likelihood of precipitation extremes following heat-induced convection trends (Diffenbaugh et al., 2017; Fang et al., 2025). Conversely, the larger increase in temperature intensity in the Northern Hemisphere's mid- to high-latitudes is heavily influenced by dynamic factors, particularly Arctic amplification. The weakened poleward temperature gradient slows down jet streams and favors persistent blocking highs (anticyclones), which not only prolong heatwaves but also create a stable, dry environment that intensifies surface heating (Xiao et al., 2025). Furthermore, the substantial increase in the duration of events over the southwestern United States, the Sahara Desert, and India may attributed to local land-atmosphere feedbacks. In these regions, antecedent heatwaves excessively deplete soil moisture, reducing evaporative cooling and creating a positive feedback loop that reinforces and prolongs the heat dome (Sun et al., 2024).
Crucially, the intensification of CHWEPs not only implies a higher risk of concurrent disasters but also reveals a dangerous “rapid transition” phenomenon, namely, a swift shift from extreme heat to extreme rainfall (Ning et al., 2022; Ridder et al., 2020; Tan et al., 2023; Xie and Zhou, 2023). This abrupt transition is not merely a statistical coincidence, but may conceal a tightly coupled physical cascade. Previous studies have shown that during the heatwave phase, intense surface heating builds up a deep and dry convective boundary layer, creating substantial atmospheric instability (Cook et al., 2020; Liao et al., 2021). Concurrently, intensified evapotranspiration from both land and ocean surfaces supplies additional moisture to the lower troposphere (Bevacqua et al., 2021; Liao et al., 2021). When favorable large-scale dynamic triggers occur, such as the intrusion of upper-level cold air from cutoff lows or the transport of moist, unstable air by low-level jets, the cap on the built-up convective available potential energy (CAPE) is broken (Donges et al., 2016; Tan et al., 2023; Zscheischler et al., 2020). The accumulated energy and moisture are then explosively released, triggering strong convection and extreme precipitation (Cook et al., 2020; Jin et al., 2024; Lei et al., 2024). In essence, the preceding heatwave primes the atmosphere by loading the gun (instability and moisture), and the synoptic disturbance pulls the trigger. This abrupt transformation from drought-like heatwaves to flash flooding poses a severe challenge to traditional disaster preparedness systems, which are typically designed to address single-hazard events (Kumar et al., 2024; You and Wang, 2021; Zhou et al., 2023).
Furthermore, the spatiotemporal evolution patterns of compound and single extreme events revealed in this study provide critical scientific foundations for policymakers, urban planners, and emergency management agencies (Bevacqua et al., 2023; Gu et al., 2022; Myhre et al., 2019). By identifying high-risk regions and key temporal windows, relevant authorities can develop more resilient integrated early warning systems (Almeida et al., 2016; Dike et al., 2022; Sauter et al., 2023b). Advancing predictive models capable of capturing the transition from heatwaves to extreme precipitation is essential for effective water resource management, agricultural planning, public health response, and infrastructure safety (Kumar et al., 2024; Sun et al., 2023). In the context of climate change, where the synergistic and cascading nature of extreme events is intensifying, enhancing societal resilience and long-term sustainability in the face of compound climate disasters has become increasingly urgent and necessary (Miao et al., 2024; Sauter et al., 2023a; Woolway et al., 2021).
In this study, we employed several methodological choices in our experimental design to enhance the robustness of our results, for instance, using the ensemble mean of multiple model outputs, defining extreme events based on the 90th percentile threshold, and applying a 7 d time window to identify event sequences. Multi-model averaging can effectively offset internal random errors and model-specific biases, however, it yields only a single result, failing to reveal the extent of inter-model disagreement and ignoring inter-model uncertainty. Considering these limitations, in future research, it would be beneficial to incorporate a larger number of climate models and individually evaluate each model's performance, test alternative percentile thresholds such as the 95th percentile, explore different time windows such as 5 d, and conduct sensitivity tests, which would help further validate the robustness and generalizability of our findings (You and Wang, 2021). More importantly, it is essential to employ land-atmosphere coupled models and synoptic field analysis to elucidate the physical drivers of compound extreme events, particularly the mechanisms by which stronger extreme precipitation events are generated following heatwaves.
In this study, we systematically characterize the spatiotemporal evolution of CHWEP events relative to single-hazard extremes across global domains. Results show that in mid-to-high latitude regions of the Northern Hemisphere, CHWEPs exhibit higher frequency, greater extreme precipitation intensity, and longer heatwave duration compared to single extremes. In tropical regions, the heatwave intensity within CHWEPs exceeds that of single heatwaves. These spatial contrasts persist under both future SSP2-4.5 and SSP5-8.5 scenarios. Compared to the historical period, metrics of both CHWEPs and single extremes increase across most of the globe in the future, with extreme precipitation following heatwaves becoming notably more intense than single extreme precipitation events. Under the high-emission SSP5-8.5 scenario, the intensification of extremes is greater than under the moderate-emission SSP2-4.5 scenario. The sequential occurrence of extreme precipitation after heatwaves reflects a physically driven linkage rather than random coincidence. In the future, the likelihood of extreme precipitation following heatwaves will increase, particularly in tropical regions. These findings indicate that future CHWEP events will require increased attention, particularly with respect to ecosystem resilience and flood disaster prevention.
All R codes can be provided by the corresponding authors upon request.
The three global reanalysis datasets: ERA5 (https://cds.climate.copernicus.eu/datasets/derived-era5-land-daily-statistics?tab=download, last access: 26 May 2025), MERRA-2 (https://disc.gsfc.nasa.gov/datasets/M2SDNXSLV_5.12.4/summary?keywords=merra2, last access: 26 May 2025), and JRA-55 (https://gdex.ucar.edu/datasets/d628000/, last access: 26 May 2025) can be accessed at the links. The four CMIP6 GCMs for the period 2056-2100, under two Shared Socioeconomic Pathway (SSP) scenarios: SSP2-4.5 and SSP5-8.5 can be accessed at https://aims2.llnl.gov/search/cmip6/, last access: 26 May 2025.
The supplement related to this article is available online at https://doi.org/10.5194/hess-30-5229-2026-supplement.
KZ and HJ acquired the supervision and funding for this research. All authors contributed to the study conception, design, and methodology. ML, XY, and XY undertook the tasks of programming, data collection, result derivation, and interpretation. The original draft was prepared by HJ and ML and subsequently revised by LC, PZ and GL.
The contact author has declared that none of the authors has any competing interests.
Publisher's note: Copernicus Publications remains neutral with regard to jurisdictional claims made in the text, published maps, institutional affiliations, or any other geographical representation in this paper. The authors bear the ultimate responsibility for providing appropriate place names. Views expressed in the text are those of the authors and do not necessarily reflect the views of the publisher.
Data processing and visualization were performed with R (R 4.4.0). The authors express their gratitude to the reviewers.
This study was supported by National Nature Science Foundation of China (grant no. 52579006), Provincial Key Research and Development Program of Guangxi (grant no. JF2503980041), Major Science and Technology Project of Qinghai Province (grant no. 2024-SF-A1), the Science and Technology Innovation Team Project of the “Tianshan Talents” Program of Xinjiang (grant no. 2024TSYCTD0005), the Special Fund Project of Jiangsu Province Science and Technology Program (grant no. BZ2024035), and Shandong Provincial Hydrological Center Project (grant no. 37000000025001720250235), the Fundamental Research Funds for the Central Universities (grant no. B260201936), the Open Foundation of Beijige (grant no. BJG202513), and the Open Foundation of China Meteorological Administration Hydro-Meteorology Key Laboratory (grant no. 24SWQXZ055).
This paper was edited by Lelys Bravo de Guenni and reviewed by three anonymous referees.
Adeloye, A. J., Soundharajan, B.-S., Musto, J. N., and Chiamsathit, C.: Stochastic assessment of Phien generalized reservoir storage–yield–probability models using global runoff data records, J. Hydrol., 529, 1433–1441, https://doi.org/10.1016/j.jhydrol.2015.08.038, 2015.
Almeida, A. T. de, Alencar, M. H., Garcez, T. V., and Ferreira, R. J. P.: A Systematic Literature Review of Multicriteria and Multi-Objective Models Applied in Risk Management, Ima J. Manag. Math., 28, 153–184, https://doi.org/10.1093/imaman/dpw021, 2016.
Babüroğlu, E. S., Durmuşoğlu, A., and Dereli, T.: Novel hybrid pair recommendations based on a large-scale comparative study of concept drift detection, Expert Syst. Appl., 163, 113786, https://doi.org/10.1016/j.eswa.2020.113786, 2021.
Balaji, V., Taylor, K. E., Juckes, M., Lawrence, B., Durack, P. J., Lautenschlager, M., Blanton, C., Cinquini, L., Denvil, S., Elkington, M., Guglielmo, F., Guilyardi, É., Hassell, D., Kharin, S., Kindermann, S., Nikonov, S., Radhakrishnan, A., Stockhause, M., Weigel, T., and Williams, D. N.: Requirements for a Global Data Infrastructure in Support of CMIP6, Geosci. Model Dev., 11, 3659–3680, https://doi.org/10.5194/gmd-11-3659-2018, 2018.
Bevacqua, E., Michele, C. De, Manning, C., Couasnon, A., Ribeiro, A., Ramos, A. M., Vignotto, E., Bastos, A., Blesić, S., Durante, F., Hillier, J. K., Oliveira, S. C., Pinto, J. G., Ragno, E., Rivoire, P., Saunders, K., Wiel, K. van der, Wu, W., Zhang, T., and Zscheischler, J.: Guidelines for Studying Diverse Types of Compound Weather and Climate Events, Earth S. Futur., 9, https://doi.org/10.1029/2021ef002340, 2021.
Bevacqua, E., Suarez-Gutierrez, L., Jézéquel, A., Lehner, F., Vrac, M., Yiou, P., and Zscheischler, J.: Advancing research on compound weather and climate events via large ensemble model simulations, Nat. Commun., 14, 2145, https://doi.org/10.1038/s41467-023-37847-5, 2023.
Chen, S., Gan, T. Y., Tan, X., Shao, D., and Zhu, J.: Assessment of CFSR, ERA-Interim, JRA-55, MERRA-2, NCEP-2 Reanalysis Data for Drought Analysis Over China, Clim. Dyn., 53, 737–757, https://doi.org/10.1007/s00382-018-04611-1, 2019.
Chen, Y., Liao, Z., Shi, Y., Li, P., and Zhai, P.: Greater Flash Flood Risks From Hourly Precipitation Extremes Preconditioned by Heatwaves in the Yangtze River Valley, Geophys. Res. Lett., 49, https://doi.org/10.1029/2022GL099485, 2022.
Cook, B. I., Mankin, J. S., Marvel, K., Williams, P., Smerdon, J. E., and Anchukaitis, K. J.: Twenty‐First Century Drought Projections in the CMIP6 Forcing Scenarios, Earth S Future, 8, https://doi.org/10.1029/2019ef001461, 2020.
Dai, C., Qin, X. S., Zhang, X. L., and Liu, B. J.: Study of climate change impact on hydro-climatic extremes in the Hanjiang River basin, China, using CORDEX-EAS data, Weather Clim. Extrem., 38, 100509, https://doi.org/10.1016/j.wace.2022.100509, 2022.
Dao, P.: On Wilcoxon rank sum test for condition monitoring and fault detection of wind turbines, Appl. Energy, https://doi.org/10.1016/j.apenergy.2022.119209, 2022.
Diffenbaugh, N., Singh, D., Mankin, J., Horton, D., Swain, D., Touma, D., Charland, A., Liu, Y., Haugen, M., Tsiang, M., and Rajaratnam, B.: Quantifying the influence of global warming on unprecedented extreme climate events, P. Natl. Acad. Sci. USA, 114, 4881–4886, https://doi.org/10.1073/pnas.1618082114, 2017.
Dike, V. N., Lin, Z., Fei, K., Langendijk, G. S., and Nath, D.: Evaluation and Multimodel Projection of Seasonal Precipitation Extremes Over Central Asia Based on CMIP6 Simulations, Int. J. Climatol., 42, 7228–7251, https://doi.org/10.1002/joc.7641, 2022.
Donges, J. F., Schleussner, C.-F., Siegmund, J. F., and Donner, R. V: Event coincidence analysis for quantifying statistical interrelationships between event time series, Eur. Phys. J. Spec. Top., 225, 471–487, https://doi.org/10.1140/epjst/e2015-50233-y, 2016.
Fang, P., Wang, T., Yang, D., Tang, L., and Yang, Y.: Substantial increases in compound climate extremes and associated socio-economic exposure across China under future climate change, npj Clim. Atmos. Sci., 8, 17, https://doi.org/10.1038/s41612-025-00910-7, 2025.
Fischer, E. M. and Knutti, R.: Anthropogenic contribution to global occurrence of heavy-precipitation and high-temperature extremes, Nat. Clim. Chang., 5, 560–564, https://doi.org/10.1038/nclimate2617, 2015.
Ganguli, P. and Merz, B.: Observational Evidence Reveals Compound Humid Heat Stress-Extreme Rainfall Hotspots in India, Earth's Futur., 12, e2023EF004074, https://doi.org/10.1029/2023EF004074, 2024.
Götte, J. and Brunner, M. I.: Hydrological Drought‐To‐Flood Transitions Across Different Hydroclimates in the United States, Water Resour. Res., 60, https://doi.org/10.1029/2023wr036504, 2024.
Gu, L., Chen, J., Yin, J., Slater, L., Wang, H., Guo, Q., Feng, M., Qin, H., and Zhao, T.: Global Increases in Compound Flood‐Hot Extreme Hazards Under Climate Warming, Geophys. Res. Lett., 49, https://doi.org/10.1029/2022GL097726, 2022.
Guerreiro, S. B., Fowler, H. J., Barbero, R., Westra, S., Lenderink, G., Blenkinsop, S., Lewis, E., and Xiao-feng, L. I.: Detection of Continental-Scale Intensification of Hourly Rainfall Extremes, Nat. Clim. Chang., 8, 803–807, https://doi.org/10.1038/s41558-018-0245-3, 2018.
Hausfather, Z., Marvel, K., Schmidt, G. A., Nielsen-Gammon, J. W., and Zelinka, M.: Climate simulations: recognize the “hot model” problem, Nature, 605, 26–29, https://doi.org/10.1038/d41586-022-01192-2, 2022.
Huang, D., Jian, Z., Zhang, Y., Huang, Y., and Kuang, X.: Assessment of Summer Monsoon Precipitation Derived From Five Reanalysis Datasets Over East Asia, Q. J. R. Meteorol. Soc., 142, 108–119, https://doi.org/10.1002/qj.2634, 2015.
Jin, K., Wu, Y., Sun, X., Sun, Y., and Gao, C.: Spatial-Temporal Assessment of Future Population Exposure to Compound Extreme Precipitation-High Temperature Events Across China, PLoS One, 19, e0307494, https://doi.org/10.1371/journal.pone.0307494, 2024.
Juckes, M., Taylor, K. E., Durack, P. J., Lawrence, B., Mizielinski, M., Pamment, A., Peterschmitt, J.-Y., Rixen, M., and Sénési, S.: The CMIP6 Data Request (DREQ, Version 01.00.31), Geosci. Model Dev., 13, 201–224, https://doi.org/10.5194/gmd-13-201-2020, 2020.
Kim, S., Joo, K., Kim, H., Shin, J.-Y., and Heo, J.-H.: Regional quantile delta mapping method using regional frequency analysis for regional climate model precipitation, J. Hydrol., 125685, https://doi.org/10.1016/j.jhydrol.2020.125685, 2020.
Kobayashi, S., Ota, Y., Harada, Y., Ebita, A., Moriya, M., Onoda, H., Onogi, K., Kamahori, H., Kobayashi, C., Endo, H., Miyaoka, K., and Takahashi, K.: The JRA-55 Reanalysis: General Specifications and Basic Characteristics, J. Meteorol. Soc. Japan. Ser. Pt. II, 93, 5–48, https://doi.org/10.2151/jmsj.2015-001, 2015.
Kumar, V., Kedam, N., Kişi, Ö., Alsulamy, S., Khedher, K. M., and Salem, M. A.: A Comparative Study of Machine Learning Models for Daily and Weekly Rainfall Forecasting, Water Resour. Manag., 39, 271–290, https://doi.org/10.1007/s11269-024-03969-8, 2024.
Lei, H., Ma, Q., Chang, Y., Gu, Y., Wan, S., Zhu, Z., and Feng, G.: Multiscale Interactions Driving Summer Extreme Precipitation in Central Asia, Geophys. Res. Lett., 51, https://doi.org/10.1029/2024gl108882, 2024.
Li, C., Wei, W., Chan, P., and Huang, J.: Heatwaves in Hong Kong and their influence on pollution and extreme precipitation, Atmos. Res., https://doi.org/10.1016/j.atmosres.2024.107845, 2025.
Liao, Z., Chen, Y., Li, W., and Zhai, P.: Growing Threats From Unprecedented Sequential Flood‐Hot Extremes Across China, Geophys. Res. Lett., 48, https://doi.org/10.1029/2021gl094505, 2021.
Liu, J., Chen, J., Yin, J., Su, T., Xiong, L., and Xia, J.: Understanding compound extreme precipitations preconditioned by heatwaves over China under climate change, Environ. Res. Lett., 19, https://doi.org/10.1088/1748-9326/ad50ee, 2024.
Mazdiyasni, O. and AghaKouchak, A.: Substantial Increase in Concurrent Droughts and Heatwaves in the United States, P. Natl. Acad. Sci. USA, 112, 11484–11489, https://doi.org/10.1073/pnas.1422945112, 2015.
Miao, L., Ju, L., Sun, S., Agathokleous, E., Wang, Q., Zhu, Z., Liu, R., Zou, Y., Lu, Y., and Liu, Q.: Unveiling the dynamics of sequential extreme precipitation-heatwave compounds in China, npj Clim. Atmos. Sci., 7, 67, https://doi.org/10.1038/s41612-024-00613-5, 2024.
Myhre, G., Alterskjær, K., Stjern, C. W., Hodnebrog, Ø., Marelle, L., Samset, B. H., Sillmann, J., Schaller, N., Fischer, E., Schulz, M., and Stohl, A.: Frequency of extreme precipitation increases extensively with event rareness under global warming, Sci. Rep., 9, 16063, https://doi.org/10.1038/s41598-019-52277-4, 2019.
Ning, G., Luo, M., Zhang, W., Liu, Z., Wang, S., and Gao, T.: Rising Risks of Compound Extreme Heat‐precipitation Events in China, Int. J. Climatol., 42, 5785–5795, https://doi.org/10.1002/joc.7561, 2022.
Qin, X. and Dai, C.: Comparison of different quantile delta mapping schemes in frequency analysis of precipitation extremes over mainland Southeast Asia under climate change, J. Hydrol., 606, 127421, https://doi.org/10.1016/j.jhydrol.2021.127421, 2022.
Raghavendra, A., Dai, A., Milrad, S., and Cloutier-Bisbee, S.: Floridian heatwaves and extreme precipitation: future climate projections, Clim. Dyn., 52, 495–508, https://doi.org/10.1007/s00382-018-4148-9, 2018.
Ridder, N., Pitman, A. J., and Ukkola, A.: Do CMIP6 Climate Models Simulate Global or Regional Compound Events Skillfully?, Geophys. Res. Lett., 48, https://doi.org/10.1029/2020gl091152, 2021.
Ridder, N. N., Pitman, A. J., Westra, S., Ukkola, A., Do, H. X., Bador, M., Hirsch, A. L., Evans, J. P., Di Luca, A., and Zscheischler, J.: Global hotspots for the occurrence of compound events, Nat. Commun., 11, 5956, https://doi.org/10.1038/s41467-020-19639-3, 2020.
Sauter, C., Fowler, H. J., Westra, S., Ali, H., Peleg, N., and White, C. J.: Compound extreme hourly rainfall preconditioned by heatwaves most likely in the mid-latitudes, Weather Clim. Extrem., 40, 100563, https://doi.org/10.1016/j.wace.2023.100563, 2023a.
Sauter, C., Catto, J. L., Fowler, H. J., Westra, S., and White, C. J.: Compounding Heatwave-Extreme Rainfall Events Driven by Fronts, High Moisture, and Atmospheric Instability, J. Geophys. Res.-Atmos., 128, e2023JD038761, https://doi.org/10.1029/2023JD038761, 2023b.
Séférian, R., Nabat, P., Michou, M., Saint‐Martin, D., Voldoire, A., Colin, J., Decharme, B., Delire, C., Berthet, S., Chevallier, M., Sénési, S., Franchistéguy, L., Vial, J., Mallet, M., Joetzjer, É., Geoffroy, O., Guérémy, J., Moine, M., Msadek, R., Ribes, A., Rocher, M., Roehrig, R., Salas‐y‐Mélia, D., Sanchez, E., Terray, L., Valcke, S., Waldman, R., Aumont, O., Bopp, L., Deshayes, J., Éthé, C., and Madec, G.: Evaluation of CNRM Earth System Model, CNRM‐ESM2‐1: Role of Earth System Processes in Present‐Day and Future Climate, J. Adv. Model. Earth Syst., 11, 4182–4227, https://doi.org/10.1029/2019ms001791, 2019.
Sun, P., Zou, Y., Yao, R., Bian, Y., Ge, C., and Lv, Y.: Compound and successive events of extreme precipitation and extreme runoff under heatwaves based on CMIP6 models, Sci. Total Environ., 162980, https://doi.org/10.1016/j.scitotenv.2023.162980, 2023.
Sun, P., Bian, Y., Yu, S., Yao, R., Wang, Z., Zhang, Q., Chen, W., Ge, C., Ma, Z., and Du, W.: Are longer and more intense heatwaves more prone to extreme precipitation?, Glob. Planet. Change, 236, 104428, https://doi.org/10.1016/j.gloplacha.2024.104428, 2024.
Tan, X., Wu, X., Huang, Z., Fu, J., Tan, X., Deng, S., Liu, Y., Gan, T. Y., and Liu, B.: Increasing global precipitation whiplash due to anthropogenic greenhouse gas emissions, Nat. Commun., 14, 2796, https://doi.org/10.1038/s41467-023-38510-9, 2023.
Wang, G., Zhang, X., and Zhang, S.: Performance of Three Reanalysis Precipitation Datasets Over the Qinling-Daba Mountains, Eastern Fringe of Tibetan Plateau, China, Adv. Meteorol., 2019, 1–16, https://doi.org/10.1155/2019/7698171, 2019a.
Wang, S., Kim, H., Coumou, D., Yoon, J., Zhao, L., and Gillies, R. R.: Consecutive Extreme Flooding and Heat Wave in Japan: Are They Becoming a Norm?, Atmos. Sci. Lett., 20, https://doi.org/10.1002/asl.933, 2019b.
Woolway, R. I., Kraemer, B. M., Zscheischler, J., and Albergel, C.: Compound Hot Temperature and High Chlorophyll Extreme Events in Global Lakes, Environ. Res. Lett., 16, 124066, https://doi.org/10.1088/1748-9326/ac3d5a, 2021.
Xiao, R., Liu, R., Xie, X., Xu, Y., Bi, Y., and Zhang, W.: Characteristics and evolution of heat wave and extreme precipitation compound events in South China based on copula function, Q. J. R. Meteorol. Soc., e5055, https://doi.org/10.1002/qj.5055, 2025.
Xie, W. and Zhou, B.: On the Atmospheric Background for the Occurrence of Three Heat Wave Types in East China, Weather Clim. Extrem., 39, 100539, https://doi.org/10.1016/j.wace.2022.100539, 2023.
Xiong, J., Guo, S., Wu, Y., Yan, D., Xiao, C., and Lu, X.: Predicting the Response of Heating and Cooling Demands of Residential Buildings With Various Thermal Performances in China to Climate Change, Energy, 269, 126789, https://doi.org/10.1016/j.energy.2023.126789, 2023.
Yang, Y. and Yuan, C.: Causality of compound extreme heat-precipitation events in Northeastern China, Atmos. Res., https://doi.org/10.1016/j.atmosres.2025.107975, 2025.
You, J. and Wang, S.: Higher Probability of Occurrence of Hotter and Shorter Heat Waves Followed by Heavy Rainfall, Geophys. Res. Lett., 48, https://doi.org/10.1029/2021gl094831, 2021.
Zhao, H., Zhang, L., Kirkham, M. B., Welch, S. M., Nielsen‐Gammon, J. W., Bai, G., Luo, J., Andresen, D., Rice, C. W., Wan, N., Lollato, R. P., Zheng, D., Gowda, P. H., and Lin, X.: U.S. Winter Wheat Yield Loss Attributed to Compound Hot-Dry-Windy Events, Nat. Commun., 13, https://doi.org/10.1038/s41467-022-34947-6, 2022.
Zhou, W., Liu, D., Zhang, J., Jiang, S., Shu-ying, X., Wang, J., Cheng, Y., and Chen, N.: Identification and Frequency Analysis of Drought–flood Abrupt Alternation Events Using a Daily-Scale Standardized Weighted Average of the Precipitation Index, Front. Environ. Sci., 11, https://doi.org/10.3389/fenvs.2023.1142259, 2023.
Zhou, Z., Zhang, L., Zhang, Q., Hu, C., Wang, G., She, D., and Chen, J.: Global increase in future compound heat stress-heavy precipitation hazards and associated socio-ecosystem risks, npj Clim. Atmos. Sci., 7, 33, https://doi.org/10.1038/s41612-024-00579-4, 2024.
Zscheischler, J., Westra, S., Hurk, B. van den, Seneviratne, S. I., Ward, P. J., Pitman, A. J., AghaKouchak, A., Bresch, D. N., Leonard, M., Wahl, T., and Zhang, X.: Future Climate Risk From Compound Events, Nat. Clim. Change, 8, 469–477, https://doi.org/10.1038/s41558-018-0156-3, 2018.
Zscheischler, J., Martius, O., Westra, S., Bevacqua, E., Raymond, C., Horton, R., Hurk, B. van den, AghaKouchak, A., Jézéquel, A., Mahecha, M. D., Maraun, D., Ramos, A. M., Ridder, N., Thiery, W., and Vignotto, E.: A Typology of Compound Weather and Climate Events, Nat. Rev. Earth Environ., 1, 333–347, https://doi.org/10.1038/s43017-020-0060-z, 2020.