
the Creative Commons Attribution 4.0 License.
the Creative Commons Attribution 4.0 License.
 | 13 Aug 2026
Systematic overestimation of evapotranspiration over irrigated areas by an offline land surface model
Belén Martí
Aaron Boone
Patrick Le Moigne
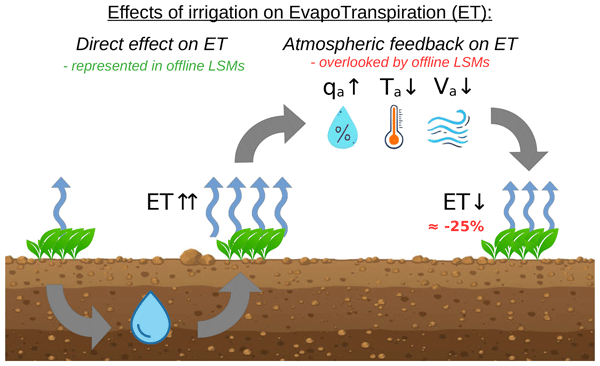
Offline Land Surface Models (LSMs) are essential for a wide range of applications, including water resource management and agricultural planning. A critical variable in these models is evapotranspiration, but its value is easily biased in irrigated areas. In fact, irrigation fundamentally alters local atmospheric conditions – cooling and humidifying the air and reducing wind speeds – factors that contribute to reducing evapotranspiration rates. This phenomenon is called “atmospheric feedback”, but is often missing or poorly represented in offline LSMs because most of the atmospheric forcings used, such as reanalyses and climate model outputs, overlook the atmospheric effect of irrigation. This leads to a tendency for offline LSMs to overestimate evapotranspiration rates over irrigated areas. In this study, the atmospheric effects of irrigation are quantified using data from the Land surface Interactions with the Atmosphere over the Iberian Semi-arid Environment (LIAISE) project field campaign. The various surface processes that influence the dynamics of evapotranspiration in response to the atmospheric feedback are then systematically investigated. The results confirm the importance of considering the atmospheric feedback in the Interactions Soil Biosphere Atmosphere (ISBA) LSM over irrigated areas in many configurations. For well irrigated crops, the average overestimation of evapotranspiration is about 25 %. Conversely, for water-stressed crops, this overestimation is negligible because of the delay in stomatal closure caused by the atmospheric feedback mechanisms, providing a compensatory effect which mitigates the overestimation. These findings highlight the need for improved representation of irrigation-related atmospheric feedback in the atmospheric forcings used as upper boundary conditions in LSMs to improve the accuracy of evapotranspiration estimates in agricultural or hydrological contexts.
- Article
(5646 KB) - Full-text XML
- BibTeX
- EndNote


-
Air cooling, humidification, and wind attenuation from irrigation are quantified for two summer weeks.
-
Standard offline land surface models overestimate evapotranspiration over irrigated areas.
-
The overestimation depends on the model configuration and ranges from 4 % to 35 %.
-
For water-stressed vegetation, stomatal closure reduces the overestimation of evapotranspiration.
Land surface modelling is increasingly important for weather forecasting, climate projections, water resource management, agricultural systems monitoring and, more generally, for assessing the sustainability of our societies. It can be used to improve our understanding of the behaviour of the land surface, atmosphere and hydrology in response to various natural or human modifications of the environment. Evapotranspiration is at the crossroads of many research fields, and proper modelling of its value is key for understanding and predicting aspects such as soil moisture, surface fluxes, and atmospheric dynamics. The representation of evapotranspiration is a focal point in Land Surface Models (LSMs) as it couples the energy, water and carbon cycles in such schemes. It is defined as the flux of water vapour going from the land surface to the atmosphere. Modelling evapotranspiration in response to natural factors using LSMs is still an active area of research, and can produce satisfactory results depending on the context. However, this is not yet the case for responses to anthropogenic factors.
Among the various human interventions that strongly influence evapotranspiration, irrigation is one of the most significant. Irrigation extracts water from rivers or groundwater to make it available to crops, which then release water to the atmosphere through evapotranspiration. In weather and climate science, the effect of irrigation on the atmosphere is an active area of research. In particular, irrigation has been shown to dramatically increase crop evapotranspiration, which then leads to cooling and humidification of the near-surface air (Jochum et al., 2006; Lobell et al., 2008; Sorooshian et al., 2011; Cook et al., 2015; Valmassoi et al., 2020; Lawston et al., 2020; Mcdermid et al., 2023; Lunel et al., 2024a). Irrigation can also affect wind regimes by reducing near-surface wind speed (Sorooshian et al., 2011; Sridhar, 2013; Lunel et al., 2024a) or by affecting the dynamics of mesoscale winds (Phillips et al., 2022; Lunel et al., 2024a, b). Irrigation impacts air temperature, humidity, and wind speed, especially in the lower atmosphere, which, in turn, creates a feedback where changes in the irrigation-altered environment affect surface evapotranspiration. This feedback is hereafter referred to as atmospheric feedback. Even though this feedback has long been recognised, its evaluation was mainly qualitative (Bouchet, 1963), based on observations (Ozdogan and Salvucci, 2004), or on conceptual models (Szilagyi, 2014; Szilagyi et al., 2017). These approaches have their own advantages and limitations, but they all face the challenge of clearly distinguishing the direct effect of irrigation on the atmosphere. Also, they cannot be applied to high temporal or spatial resolution (Szilagyi et al., 2017). Using LSMs can help to overcome these limitations and allow us to investigate some aspects of land-atmosphere interactions in more depth. Specifically the present article relies on a LSM in order to illustrate some model behaviours in the context of irrigated areas modelling and to quantify the atmospheric feedback effect on evapotranspiration.
Most of the recent results on the influence of irrigation on the atmosphere were made possible by surface–atmosphere coupled models, typically run with and without irrigation (Kueppers et al., 2007; Sorooshian et al., 2011; Cook et al., 2015; Lawston et al., 2020; Lunel et al., 2024a). Such coupled models consistently represent the effect of the irrigated surface on the atmosphere and, conversely, of the influenced atmosphere on the surface, i.e. the atmospheric feedback. However, this is not the case for offline (non-coupled) LSMs. In spatially distributed offline LSMs applications, the atmospheric conditions are provided as input upper boundary conditions, which typically come from weather reanalysis or from Global Circulation Model (GCM) outputs, both of which use surface–atmosphere coupled models to produce such data. However irrigation is rarely represented in these coupled models and therefore most meteorological data used in offline LSMs do not consider the effect of irrigation on the atmosphere. The atmospheric conditions resulting from these meteorological forcings are therefore often too warm, too dry, and too windy over irrigated areas (Tuinenburg and de Vries, 2017; Qian et al., 2020). When these meteorological forcings are used in offline LSMs, i.e. when the atmospheric feedback is overlooked, the LSMs output become biased.
This is the case, for example, in many hydrological and agronomic studies which use atmospheric forcings that do not account for irrigation effects (Rosenberg et al., 2003; Woznicki et al., 2015; Nechifor and Winning, 2019; Gorguner and Kavvas, 2020).
To the best of the authors' knowledge, only Decker et al. (2017) focused on quantifying the atmospheric feedback on evapotranspiration with a LSM. The authors used the Community Atmosphere Biosphere Land Exchange (CABLE) LSM coupled to the Weather Research and Forecasting (WRF) atmospheric model to investigate the importance of land–atmosphere coupling over irrigated areas in southeastern Australia. They ran two ensembles of six members, with and without an irrigation parameterization, at a horizontal resolution of 10 km. This allowed them to attribute a 0.5 °C decrease in 2 m air temperature and a 0.2 to 0.5 g kg−1 increase in specific humidity (a 5 % to 10 % increase in relative humidity) over irrigated land owing to irrigation. The cooler and more humid atmosphere was then shown to reduce the evapotranspiration over irrigated land. Ignoring this effect led to a 25 % overestimation of evapotranspiration, and therefore to an equal overestimation of irrigation demand to compensate for evapotranspiration water losses. The authors attributed this effect to the higher humidity rate rather than to the temperature decrease. However, they did not investigate in detail the processes involved in the atmospheric feedback and did not distinguish between evaporation and transpiration. Decker et al. (2017) used a single LSM configuration and provided limited information on the specific setup used to model evapotranspiration. In order to gain a comprehensive understanding of the potential biases that may occur in other LSMs, it is essential to explore a diverse range of evapotranspiration behaviours, i.e. diverse configurations. This can be achieved by varying the parameterizations within a LSM, allowing a more nuanced analysis of different evapotranspiration responses.
One reason why the atmospheric feedback on evapotranspiration has not been studied much with LSMs is that the effect of irrigation on the atmosphere is specially difficult to characterize. Until now, few studies have been able to clearly attribute some atmospheric changes to irrigation. The Land surface Interactions with the Atmosphere over the Iberian Semi-arid Environment (LIAISE) campaign provides the data to take a step towards addressing this issue. The LIAISE project is an international research endeavor aimed at improving the understanding of natural and anthropogenic land surface processes and their subsequent interactions with the Mediterranean Atmospheric Boundary Layer (ABL) and the hydrological cycle at the basin scale (Boone et al., 2025). The LIAISE field campaign took place in 2021 in northeastern Spain within the Ebro basin east of the city of Lleida. This location was chosen because it includes a heavily irrigated area next to a naturally semi-arid area. The LIAISE Special Observation Period (SOP) ranged from 15 to 29 July 2021.
Using data from the LIAISE campaign, Brooke et al. (2024) showed that surface energy partitioning was strongly modified by irrigation, with evapotranspiration increasing by a factor of 10 at the irrigated site compared to the rainfed site. This different energy partitioning results in different vertical ABL structures over the irrigated and rainfed sites. In particular, it is shown that the potential temperature between 0 and 800 m above ground level (a.g.l.) is systematically lower over the irrigated site than over the rainfed site, up to −6 °C. Lunel et al. (2024a) used a surface–atmosphere coupled model with and without an irrigation parameterization for a LIAISE case study, and corroborated that the observations of Brooke et al. (2024) were directly due to irrigation. The authors showed that irrigation induced a mean cooling of −4.7 °C and a humidifying effect of +3.4 g kg−1 on the near-surface atmosphere over the irrigated area during two specific days of the campaign. The near-surface wind speed was also shown to be reduced by the irrigation, and more generally the ABL circulations were modified. In particular, a breeze circulation between the irrigated and rainfed zones could be attributed to the strong surface thermal contrasts induced by the irrigation. More generally, Lunel et al. (2024a) showed that the coupled model SURFace EXternalisée (SURFEX)–Meso-NH (see Sect. 2.1 for details) is able to represent well the effects of irrigation on the atmosphere. Using the same approach of combining model and observations, Lunel et al. (2024b) studied how a local wind called the Marinada was affected by irrigation. The authors found that irrigation was responsible for a general wind speed reduction in the irrigated area and for a delay in the arrival of Marinada relative to a simulation without irrigation. Udina et al. (2024) investigated the effect of irrigation on precipitation during the SOP using the WRF model. The authors found that irrigation causes a decrease in the atmospheric boundary layer height and in the lifting condensation level. These two effects have opposite effects on the chances of cloud formation and precipitation, and the authors were unable to show a clear effect of irrigation on cloudiness or precipitation during the LIAISE campaign. They attribute this lack of effect on clouds and precipitation to the fact that the perturbed weather situations were driven more by the synoptic scale than by local processes.
Mangan et al. (2023) and González-Armas et al. (2024) investigated the drivers of evapotranspiration fluxes during the LIAISE campaign. Mangan et al. (2023) used the unicolumn simplified model Chemistry Land-surface Atmosphere Soil Slab (CLASS) (Vilà-Guerau De Arellano et al., 2015) and local observations to quantify the tendency terms of evapotranspiration. The authors found that the temporal evolution of evapotranspiration is determined to the first order by the incident shortwave radiation, then to the second order by the aerodynamic and surface resistances Ra and Rs. The aerodynamic resistance Ra depends directly on the wind speed and stability, the latter being a function of wind, roughness, temperature and humidity stratification in the surface layer. González-Armas et al. (2024) confirmed the findings of Mangan et al. (2023) by perturbing some parameters in the CLASS model and studying its response in detail. The authors found that photosynthetically active radiation, which is strongly correlated to the incident shortwave radiation, is the primary driver of evapotranspiration, followed by air temperature and vapour pressure deficit. Although carbon dioxide levels also have an influence, the authors found it to be the least important contributor. Note that although González-Armas et al. (2024) did not study the effect of wind, the authors mentioned the fact that its role is also important to consider to fully understand plant evapotranspiration during LIAISE.
Since the LIAISE campaign provides a novel context for which the drivers of evapotranspiration have been well characterized (Mangan et al., 2023; González-Armas et al., 2024), and the influence of irrigation on the atmosphere well quantified (Brooke et al., 2024; Lunel et al., 2024a, b), this campaign also provides a unique framework to study and better understand the various aspects of atmospheric feedback on evapotranspiration. The purpose of this article is to quantify this atmospheric feedback in the Interactions Soil Biosphere Atmosphere (ISBA) LSM, and for various configurations involving parameterizations commonly found in other LSMs. This study consists in a model sensitivity experiment, focusing on the mid-summer atmospheric conditions of the LIAISE campaign, when the evapotranspiration is at its maximum. The study also aims to refine our understanding of the LSM response to the atmospheric feedback, particularly with regard to the modelled ecophysiological processes.
First, the SOP of the LIAISE campaign is modelled using the coupled SURFEX–Meso-NH model at a high spatial resolution with and without irrigation. The results of the two runs are used to quantify the average influence of irrigation on near-surface temperature, humidity and wind during the two weeks of the LIAISE SOP. Second, the atmospheric conditions of the two coupled runs are converted into two atmospheric forcing dataset, which are used in point-scale offline ISBA runs. The thorough study of the difference in modelled evaporation and transpiration resulting from the use of one atmospheric forcing over the other and with different ISBA configurations allows an improved understanding of the surface processes involved in the atmospheric feedback on evapotranspiration. Finally, the atmospheric feedback is quantified globally for different ISBA configurations during the LIAISE SOP.
2.1 ISBA configuration
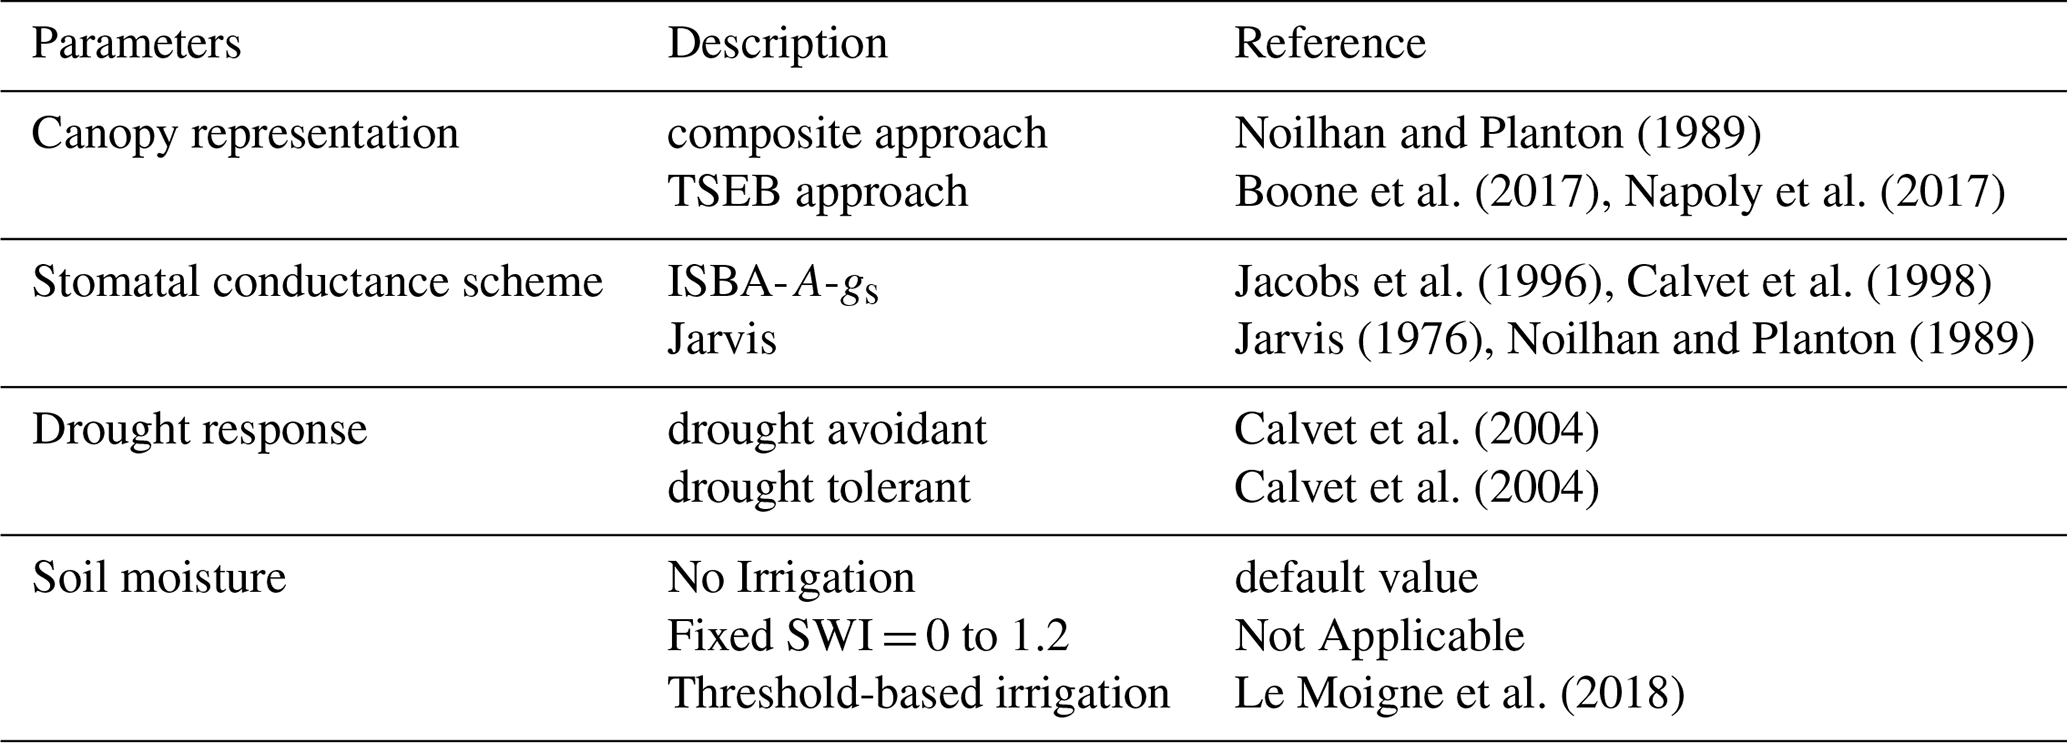
The LSM used in this study is ISBA (Noilhan and Planton, 1989; Noilhan and Mahfouf, 1996). It is fully integrated into the SURFace EXternalisée (SURFEX) platform which is coupled to the Meso-NH atmospheric model. SURFEX is a collaborative platform software package maintained and developed at Météo-France in partnership with other international collaborators, and version 8.1 is used in this work (Masson et al., 2013). ISBA models different types of natural continental land surface cover, from bare ground to forest, including crops, grasslands and glaciers. It offers a wide variety of options for modelling surface processes: the options retained for the present work are discussed below and summarized in Tables 1 and 2. The options not discussed here are left at their default values as given in the SURFEX v8.1 User Guide (Centre National de Recherches Météorologiques, 2020).
Jackson et al. (1996)Decharme et al. (2011)Decharme et al. (2013) Noilhan and Planton (1989)Boone et al. (2017)Napoly et al. (2017)Jacobs et al. (1996)Calvet et al. (1998)Jarvis (1976)Noilhan and Planton (1989)Calvet et al. (2004)Calvet et al. (2004)Le Moigne et al. (2018)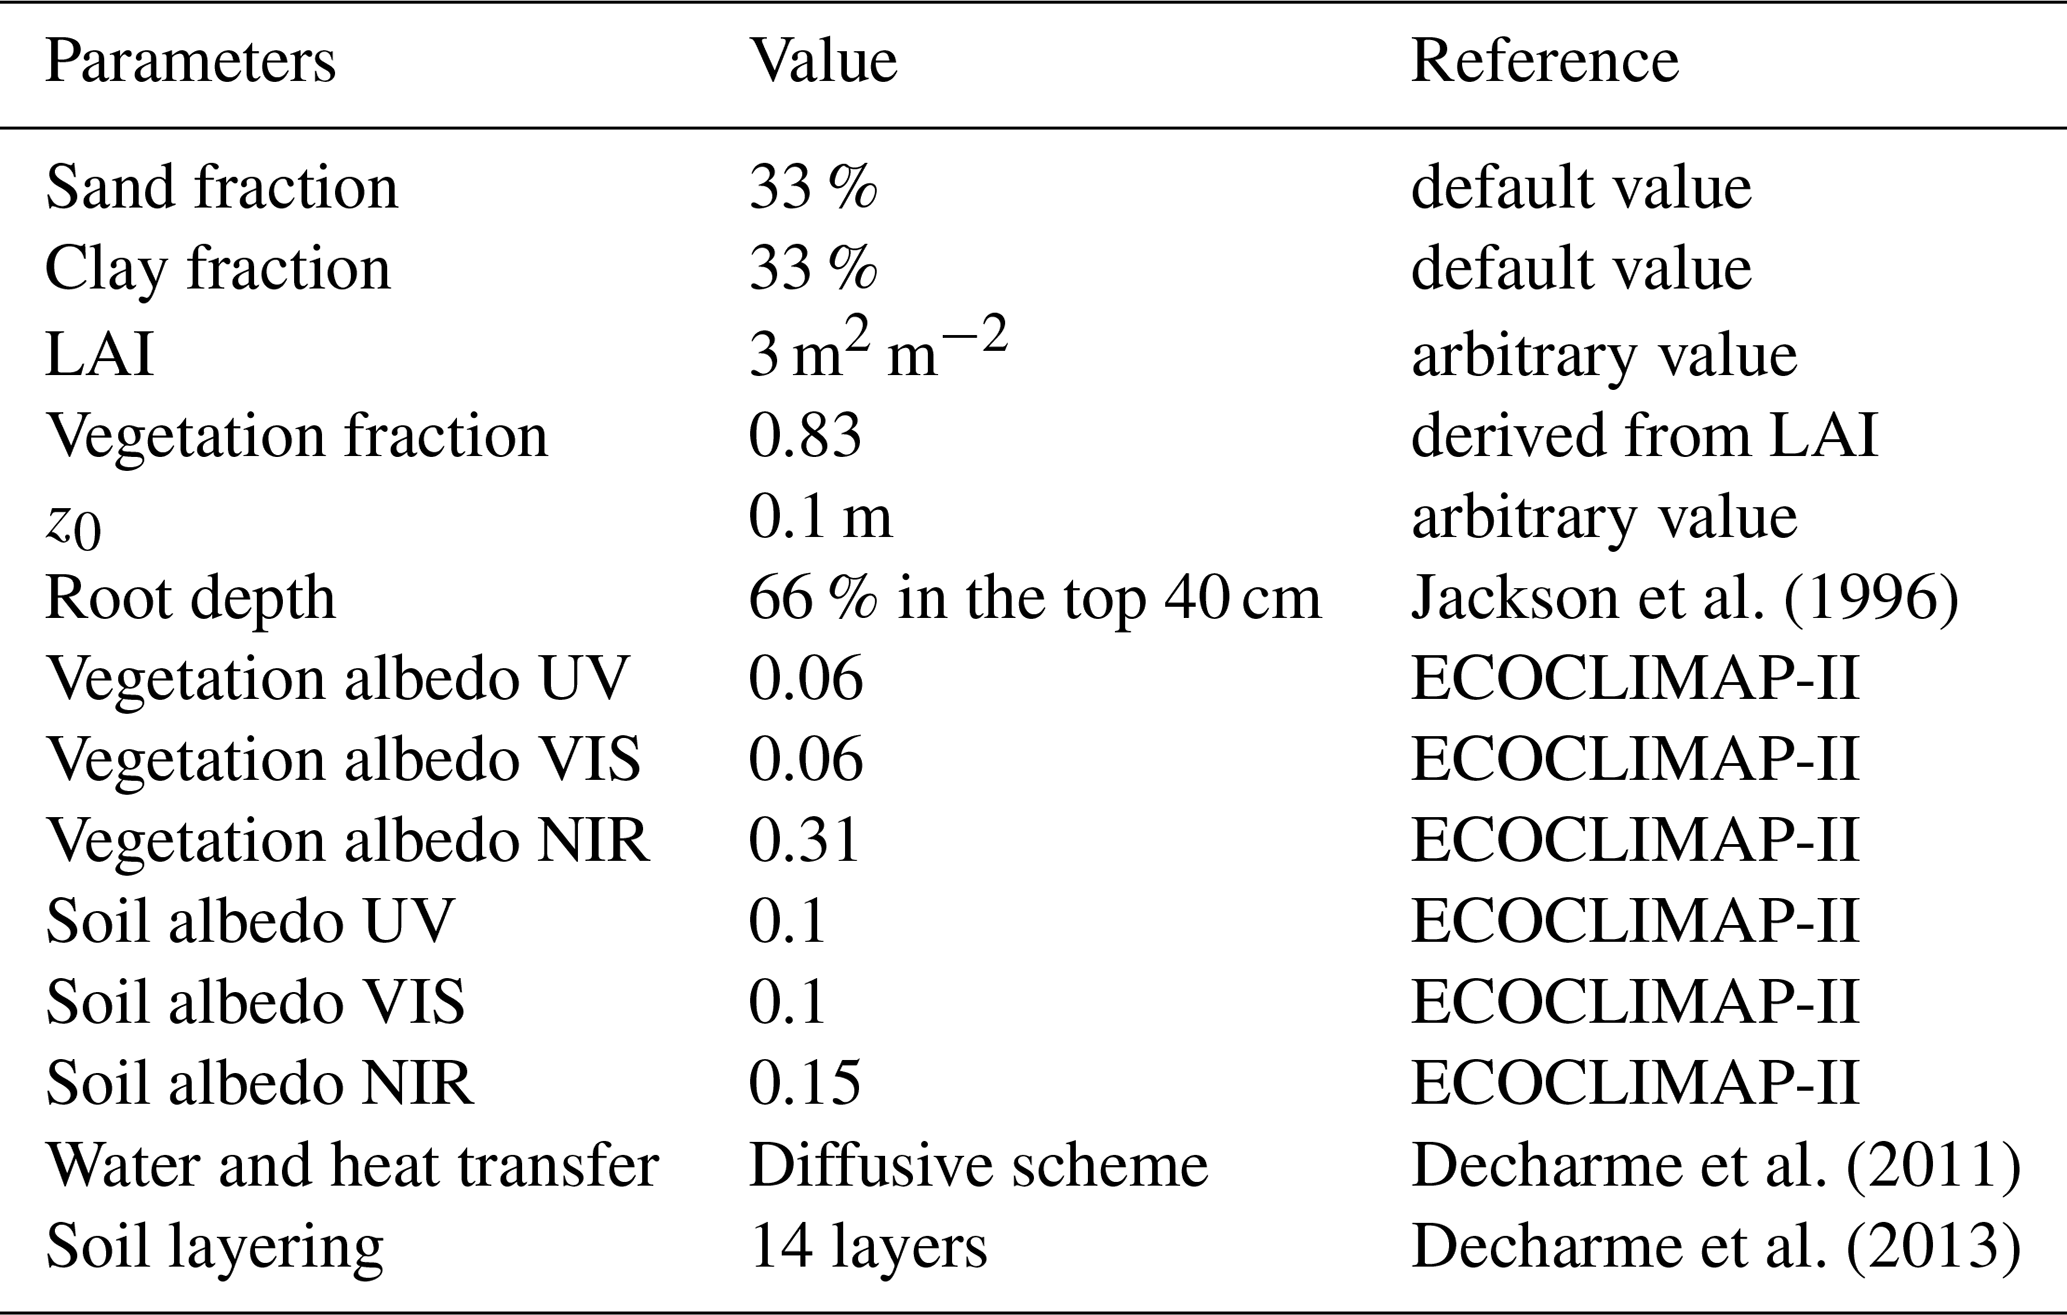
The land surface considered in the offline ISBA point scale simulations is that of a flat summer crop field. This land surface does not represent a particular field from the LIAISE campaign, but rather an average, typical Urgell region field. The sand and clay content are set at 33 % each, making it a loamy clay soil. The Leaf Area Index (LAI) is set to 3 m2 m−2 in order to represent a well-established crop. The roughness length is set to 0.1 m, which is an average value for irrigated crops such as corn and alfalfa (Jacobs and Van Boxel, 1988; Otsuki et al., 1999). Albedo values for the Ultra-Violet (UV), VISible (VIS), and Near Infra-Red (NIR) spectral bands are derived from the land cover database ECOCLIMAP-II (Faroux et al., 2013) for land cover type 527, labeled “Spanish Irrigated Crops”, as described in the SURFEX/ECOCLIMAP-II User's Guide (Centre National de Recherches Météorologiques, 2020). This ISBA configuration has 14 vertical soil layers extending from the surface to a depth of 12 m (Decharme et al., 2013). Soil hydrological parameters are determined using a pedotransfer function based on Cosby et al. (1984) using sand and clay contents. Soil heat and liquid water transfer are modelled using the heat diffusion and Richards equation, respectively (Decharme et al., 2011). The heat transfer is modelled explicitly over the entire 12 m soil column, while water transfer is modelled explicitly down to the deepest root depth. Below this depth, water is assumed to drain to the aquifer and no capillary rise from the aquifer is considered in the current study.
2.2 Evapotranspiration in ISBA
ISBA models evapotranspiration by first modelling the vapour fluxes from the vegetation and from the bare ground separately. The vapour flux from the bare ground, Eg, is given by Eq. (1).
where ρa is the air density [kg m−3], Ra is the aerodynamic resistance at the ground level [s m−1], hu is the relative humidity at the ground surface [−], qa is the air specific humidity [kg kg−1], Ts is the surface temperature [K], and qsat(Ts) is the saturated specific humidity at the surface [kg kg−1].
The water vapour flux from vegetation can be divided into a vapour flux coming from the evaporation of the intercepted water on the leaves and another one coming from the transpiration of the plant. The evaporation of the intercepted water is given by an equation very similar to Eq. (1) with hu=1, and the dynamics of the intercepted water vapour flux is therefore similar to Eg. However, in the LIAISE context, there is very little rainfall and the fields are flood irrigated, so the vegetation is very rarely covered by intercepted water. The vapour flux from the evaporation of the intercepted water is very small and is assumed to be zero in the present work to simplify the equation set. Thus, the vegetation vapour flux comes only from the transpiration process and is given by Eq. (2).
where Ra is the aerodynamic resistance, Rs is the surface resistance, qa is the specific humidity of the air, Ts is the surface temperature, and qsat(Ts) is the saturated specific humidity at the surface. The surface resistance Rs represents the response of the plant to external conditions. The aerodynamic resistances Ra take into account the effect of turbulence, atmospheric stability and wind speed on evaporation or transpiration. It is defined as
where Va is the wind speed, and CE is the turbulent transfer coefficient. It includes the effect of atmospheric stability and is calculated according to Le Moigne et al. (2018).
Equations (1)–(3) are used to calculate transpiration and evaporation. The dependence of the vapour fluxes on humidity qa and wind speed Va is quite straightforward in the equations. The dependence on air temperature is embedded in the surface temperature Ts and the turbulent transfer coefficient CE, since both vary with the overlying air temperature. These are the variables directly affected by the atmospheric feedback. However, the vapour fluxes also depend on the parameterization options used to model Rs and the global surface modelling approach, which determine how the canopy and the ground interact. These different ISBA options are key to evapotranspiration modelling and different values are therefore tested throughout the study to highlight how evapotranspiration is affected by these choices. This also ensures that the present conclusions are not limited to specific configurations. These varying ISBA options are summarized in Table 2 and described in more detail below.
2.2.1 Canopy representation
The modelling approach used for the vegetation canopy is an important feature that influences how the soil and vegetation interact. Depending on the approach used, Ts, qa, Ra will evolve differently and ultimately influence evapotranspiration. In many LSMs, the strategy for modelling the vegetation canopy is to include it in the top surface layer which is then referred to as the composite layer because it mixes soil and vegetation properties (Noilhan and Planton, 1989). This composite approach considers only one temperature and soil moisture for the composite layer, with properties such as thermal inertia or conductivity that may vary depending on the proportion of vegetation in the composite layer. There is only one surface temperature Ts and the atmospheric environment is the same for the vegetation and the ground.The total evapotranspiration, ET, is then the sum of the vapour fluxes from the vegetation transpiration Etr and the bare ground Eg:
where fveg is the fraction of vegetation covering the surface. This composite approach is still used in many Numerical Weather Prediction (NWP) systems due to its simplicity and low computational cost (Giard and Bazile, 2000; European Centre for Medium-Range Weather Forecasts, 2015). However, this simplicity comes at the expense of realism, and the composite approach may yield unrealistic amounts of bare ground evaporation or overestimate the surface soil temperature for large LAI values (Napoly, 2016).
The strategy to overcome this issue is to separate the modelling of the soil and of the vegetation (Niu et al., 2011; Best et al., 2011; Napoly, 2016). This strategy is often called Two-Source Energy Balance (TSEB) in LSMs and is called Multi Energy Balance (MEB) in ISBA (Napoly, 2016; Boone et al., 2017; Napoly et al., 2017) since it also potentially includes a separate snow surface energy budget.
For the current study, it computes two separate Surface Energy Balance (SEB) for the ground and the vegetation, the atmospheric properties are discretized in the vertical in the canopy, meaning that Ra and qa are computed separately for the canopy (giving Ra–c and qa, c) and for the ground (Rc−g and qa, g), and the temperature of the canopy and the ground are resolved separately, giving Ts, c and Ts, g instead of a single surface temperature Ts. Transpiration Etr and bare ground evaporation Eg both participate in modifying the atmospheric properties at the canopy level, and total evapotranspiration is then calculated as the vapour flux between this canopy atmosphere and the overlying atmosphere. The full set of equations used in MEB is described in Boone et al. (2017), but is not detailed here for the sake of brevity.
2.2.2 Stomatal conductance scheme
The surface resistance Rs (Eq. 2) is a key variable for modelling the response of the plant to external conditions. This surface resistance is actually mainly determined by the aperture of the leaf stomata and is therefore often referred to as stomatal resistance. It will be referred to as such in the remainder of this work. Stomatal conductance gs, the inverse of stomatal resistance, is also often used in the literature. Stomatal conductance gs can be modelled using several approaches, two of which are used in ISBA: Jarvis (Jarvis, 1976; Noilhan and Planton, 1989) and A-gs schemes (Jacobs et al., 1996; Calvet et al., 1998).
The Jarvis parameterization is rather simple and aims at modelling only vapour fluxes. Stomatal conductance in this case is mainly a function of incoming radiation, soil water stress, Vapour Pressure Deficit (VPD), air temperature and a few plant characteristics. In the Jarvis parameterization, the influence of each parameter is independent of the others.
The A-gs schemes are more recent parameterizations that model the photosynthetic and transpiration processes more realistically, based on the work of Jacobs et al. (1996). It allows the carbon exchange between vegetation and the atmosphere to be modelled explicitly, as well as the interdependence between the parameters already considered in the Jarvis scheme. It has been adapted to ISBA in the so-called ISBA-A-gs scheme by Calvet et al. (1998). The Jarvis and A-gs stomatal conductance parameterizations are common to many LSMs (Henderson-Sellers et al., 1993; Le Moigne et al., 2018; Boussetta et al., 2021; Oliver et al., 2022).
2.2.3 Drought response
Irrespective of the stomatal conductance parameterization chosen, vegetation characteristics also play a role in determining the stomatal conductance, gs. In particular, the response of plants to water stress is an important feature to consider in ISBA. Calvet (2000) and Calvet et al. (2004) identified two categories of responses under moderate stress, drought tolerance and drought resistance. The drought-tolerant strategy of a plant is to facilitate transpiration in order to increase the evaporative cooling effect, which also leads to a decrease in the photosynthetic carbon assimilation rate. In the drought-avoidance strategy, the plant is more likely to close its stomata when leaf surface temperature Ts is too high or specific humidity qa is too low, in order to reduce transpiration and water loss. Under severe water stress, both strategies lead to a large decrease in stomatal conductance and thus transpiration.
2.2.4 Soil moisture
The last parameter tested for its influence on evapotranspiration is soil moisture. It is essential as it directly influences plant transpiration Etr by modulating Rs through plant water stress and soil evaporation Eg through hu, which is a function of soil moisture through Eq. (5).
To allow comparison of soil moisture values across different soil textures, the Soil Wetness Index (SWI) is often used in LSM parameterizations (Noilhan and Planton, 1989; Best et al., 2011; European Centre for Medium-Range Weather Forecasts, 2015) and is also used in this article. The SWI is defined by the Eq. (6).
where wg is the volumetric soil moisture, wwilt is the volumetric soil moisture at the wilting point, and wfc is the volumetric soil moisture at field capacity, all in m3 m−3. A SWI value of 0 means the soil is at wilting point, and a value of 1 means the soil is at field capacity. Very dry soils may have negative values, and wet soils may have values greater than 1, up to saturation. At wilting point the plant cannot extract water from the soil and transpiration drops to zero. At field capacity, the soil moisture does not limit the plant transpiration. The transpiration is then limited by other factors (incoming radiation, temperature, CO2 concentration, …).
In order to assess the behaviour of the modelled evapotranspiration in different configurations, the parameters discussed above are all tested with different fixed SWI values. These fixed values allow the effect of different levels of water stress on transpiration to be clearly identified. In addition to the fixed SWI runs, ISBA is also run in its standard mode, with an evolving soil moisture without irrigation (NOIRR), and with irrigation parameterizations. The first parameterization keeps the soil at field capacity and is called IRR_FC. NOIRR and IRR_FC are used in both coupled and offline simulations. Another type of irrigation parameterization is used in the offline simulations since it is also commonly used in the literature (Lawston et al., 2015; Wu et al., 2018b; Liu et al., 2021). These parameterizations add 30 or 100 mm of water to the top soil layer when the SWI falls below the 0.5 threshold. They are called IRR_THLD.
2.3 Evapotranspiration with FAO56
Another common way of estimating crop evapotranspiration is the approach used by the United Nations Food and Agriculture Organization (FAO), based on a Penman-Monteith formulation and described in Allen et al. (1998). This equation is widely used for evapotranspiration estimates in agronomy and hydrology (Oudin, 2005; Gavilán et al., 2007; Lemaitre-Basset et al., 2022). It is defined as
where ET0 is the reference evapotranspiration [mm d−1], Va, 2 is the daily mean wind speed at 2 m a.g.l. [m s−1], Rn is the net surface radiation [MJ m−2 d−1], G is the ground heat flux [MJ m−2 d−1], T is the mean daily air temperature at 2 m [K], VPD is the mean daily vapour pressure deficit [kPa], Δ is the slope of the vapour pressure curve [kPa K−1], and γ is the psychrometric constant [kPa K−1]. The numbers 0.408, 900 and 0.34 are factors used for unit conversion and to account for the surface characteristics assumed by the equation. In particular this reference evapotranspiration was designed to represent the evapotranspiration over a surface of green grass about 0.12 m high, actively growing and well irrigated (Allen et al., 1998). Since air temperature, humidity and wind speed are used in the calculation of the reference evapotranspiration, the atmospheric feedback also directly influences the evapotranspiration estimates calculated with Eq. (7). The influence of the atmospheric feedback on these estimates is therefore also examined below.
Note that evapotranspiration values can be expressed in different units as detailed in Appendix A. In the following, the values of evapotranspiration are given both in terms of heat flux in W m−2 and in terms of vapour flux in mm h−1.
2.4 Atmospheric data
To study the atmospheric feedback on evapotranspiration, it is necessary to have two atmospheric data sets, one with and one without irrigation effects on the atmosphere. To obtain these two different atmospheric data sets, the surface–atmosphere coupled model Meso-NH is used. Meso-NH includes ISBA as LSM and has been shown to be able to efficiently represent the effect of irrigation on near-surface atmospheric conditions and in the ABL (Lunel et al., 2024a, b). For the purpose of this study, Meso-NH is run during the two weeks of the LIAISE SOP, at a 2 km horizontal resolution, with and without irrigation activated. The Meso-NH configuration used here is the same as in Lunel et al. (2024b) and is fully described in that article. The lowest atmospheric vertical level of the model is at 2 m a.g.l. The runs with and without irrigation are named NOIRR and IRR_FC respectively, as in Lunel et al. (2024b). The NOIRR run uses a configuration similar to that used for the limited-area operational NWP system AROME (Seity et al., 2011), and the SAFRAN reanalysis (Vidal et al., 2010; Le Moigne et al., 2020).
The IRR_FC run simply adds an irrigation parameterization that keeps the soil moisture of irrigated areas at a constant field capacity throughout the simulation. This parameterization has been shown by Lunel et al. (2024a, b) to be particularly realistic for modelling land-atmosphere fluxes and atmospheric conditions over the irrigated areas in the LIAISE domain for two case study days.
To evaluate the modelled impact of irrigation on the atmosphere during the SOP, the model outputs are compared with data from two in situ stations. The validation of the modelled irrigation impact for the two weeks of the SOP is discussed in Sect. 3.1. These two stations are the La Cendrosa alfalfa field (Canut, 2022) and the Institut de Recerca i Tecnologia Agralimentàries (IRTA) corn field (Martínez-Villagrasa et al., 2022), also described and discussed in Boone et al. (2025), located in the hamlet of La Cendrosa and at the IRTA facility, respectively. Both locations are well within the irrigated area.
The La Cendrosa field station is installed over a flood-irrigated alfalfa field. Numerous instruments have been installed at this site, but the present work uses only the temperature, humidity and wind sensors located at 2 m a.g.l. Alfalfa is on average 30 cm high during the SOP, and thus the displacement height can be estimated to be about 21 cm (Otsuki et al., 1999). In aerodynamic terms, the La Cendrosa values for temperature, humidity and wind are therefore assumed to be 1.8 m above the surface. The IRTA corn field station is located about 1 km from the urban area of Mollerussa, above a flood-irrigated maize field within the IRTA research facility. The station is placed between two rows of maize, about 2 m apart. The soil between the two rows was almost bare, but elsewhere in the field the maize was well grown, with a mean canopy height of 2.3 m, corresponding to a displacement height of approximately 1.6 m (Jacobs and Van Boxel, 1988; Otsuki et al., 1999). The anemometer is located at 3.3 and the thermohygrometer at 2.5 m a.g.l., corresponding to 1.7 and 0.9 m above the displacement height respectively.
The heights of the instruments at the two sites, La Cendrosa and the IRTA corn field, were close to 2 m above the displacement height. The observations are therefore compared directly with the model output at 2 m a.g.l., which corresponds to an explicit atmospheric model level.
The current combination of the coupled Meso-NH model with the two in situ observations stations enables a detailed quantification of the influence of irrigation on the atmosphere in Sect. 3.1, before studying the atmospheric feedback on evapotranspiration in Sect. 3.2.
3.1 Influence of irrigation on the atmosphere near the surface
Before studying how the atmosphere influenced by irrigation affects evapotranspiration, i.e. the atmospheric feedback, the influence of irrigation on the atmosphere needs to be clearly assessed and quantified. To this end, the present article focuses on the entire duration of the LIAISE SOP, from 14 to 30 July. Since the near-surface atmospheric features that most influence evapotranspiration are air temperature Ta, specific humidity qa and wind speed Va, the effect of irrigation on these three variables is examined for the SOP below. These variables taken from the coupled simulations are the inputs that are then used to build the atmospheric forcings used in the offline simulations of Sect. 3.2.
It should also be noted that incoming shortwave radiation, the most influential driver of evapotranspiration (Mangan et al., 2023; González-Armas et al., 2024), was found to be globally unaffected by irrigation in the coupled model for the SOP. This is firstly because there was little cloudiness either in reality or in the model, and secondly because any cloudiness that did occur was due to synoptic scale perturbations (Udina et al., 2024). However, there are some small differences in the shortwave radiation values for some days between the simulations, and in order to neutralize this weak effect, the incident shortwave radiation is set to the same values in both atmospheric forcings. Note that the CO2 level, which is another driver of evapotranspiration (González-Armas et al., 2024), is the same in both coupled simulations and subsequently in both atmospheric forcings.
3.1.1 Impact on air temperature
Between 14 and 30 July 2021, the observed and modelled mean diurnal cycles of near-surface air temperature are shown in Fig. 1 for the locations of the IRTA corn field and La Cendrosa alfalfa field sites. For clarity, only the mean diurnal cycles are shown in the main body of the article. However, the full time series over the SOP can be found in Appendix B1. The difference between the coupled simulations IRR_FC and NOIRR allows quantification of the mean cooling effect of irrigation, which is found to range between −1.5 and −3 °C for the modelled 2 m air temperature, depending on the time of the day. The cooling effect of irrigation significantly reduces the discrepancy between observations and the simulated results from the IRR_FC coupled run.
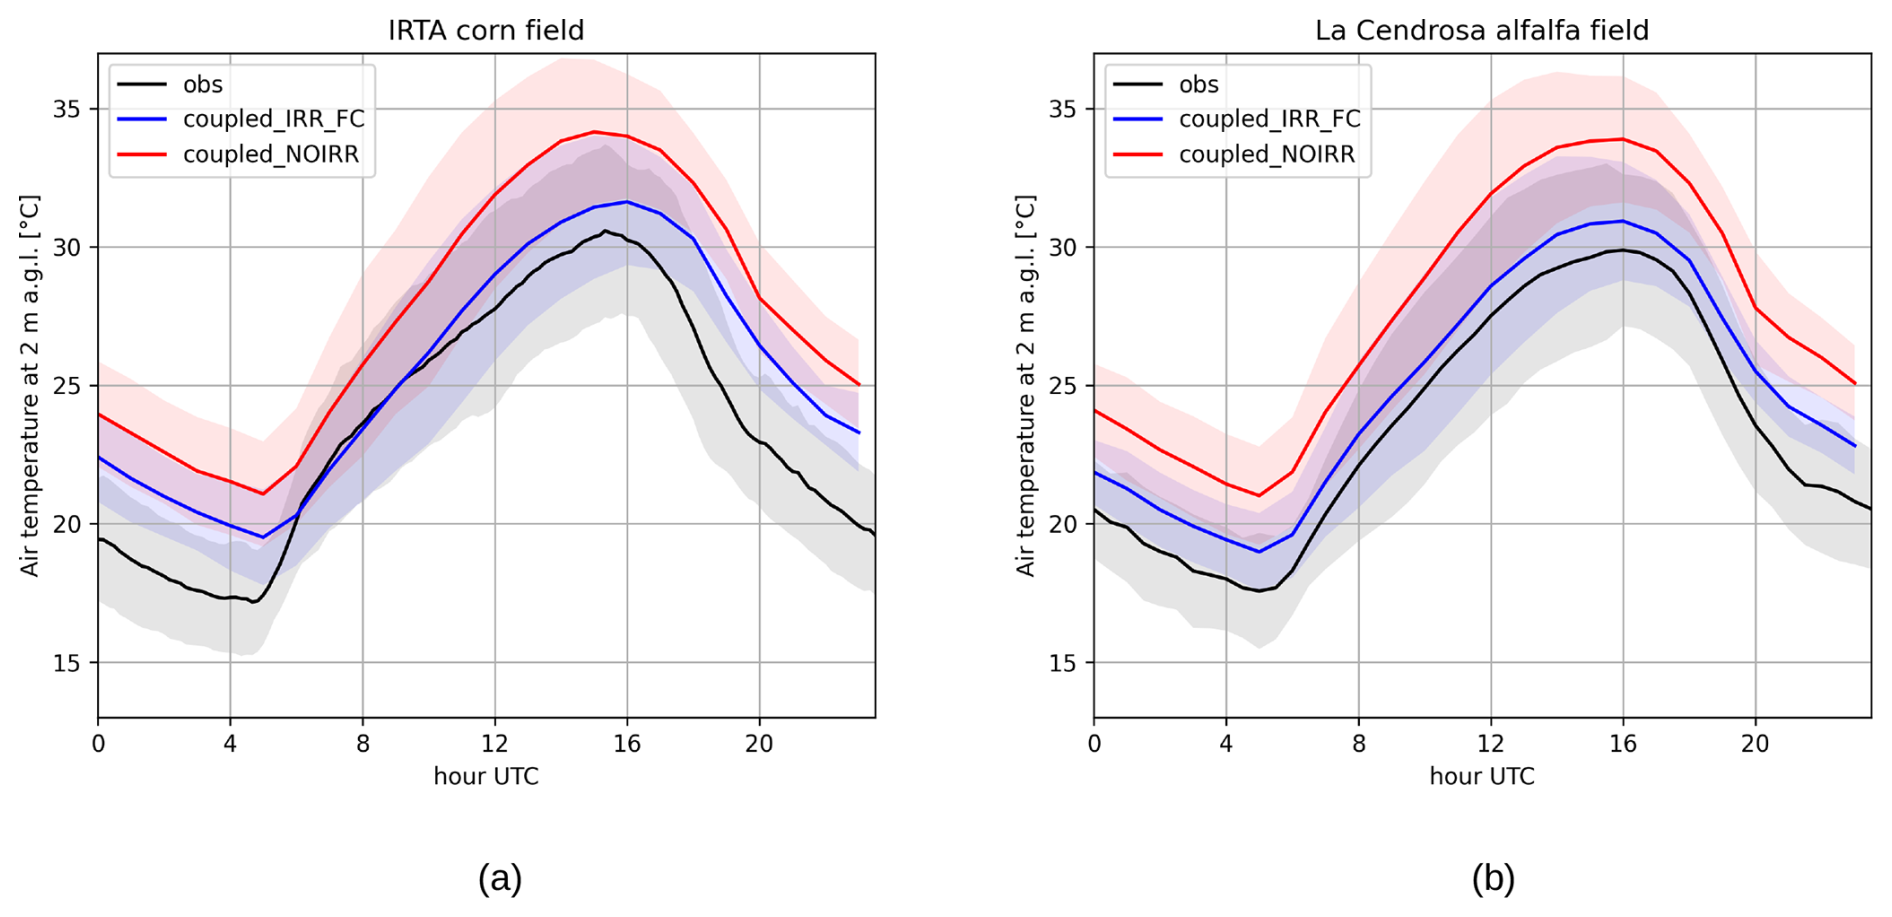
Figure 1Mean modelled and observed 2 m air temperature diurnal cycle during the 15 d of the LIAISE SOP for the IRTA corn field in (a) and for the La Cendrosa alfalfa field in (b). The red and blue lines correspond to the output of the surface–atmosphere coupled runs, with and without irrigation, respectively. The black line represents the observed values. The shades of colour correspond to the standard deviation of the data.
In the morning, between 06:00 and 09:00 UTC over the IRTA corn field (Fig. 1a), the coupled simulation with irrigation manages to accurately model the air temperature. During afternoons and nights, this coupled simulation moves away from the observations. This behaviour suggests that the model has inherent biases that vary over the course of the day, and that the overestimation of air temperature by the coupled simulation IRR_FC during the afternoon and night is not due to a misrepresentation of irrigation effects, as it is well represented in the morning.
Over the alfalfa field of La Cendrosa (Fig. 1b) the modelled cooling effect is slightly more important than over the IRTA corn field. It is about −3 °C throughout the day. The remaining overestimation of air temperature by the model IRR_FC compared to observation is relatively constant throughout the day. It is about 1 °C during the day and about 1.5 °C during the night. For the La Cendrosa alfalfa field, as for the IRTA corn field, the remaining overestimation of the night air temperature by the IRR_FC simulation is most likely due to the difficulty of the model to represent the stable conditions of the night (Bravo et al., 2008; Holtslag et al., 2013).
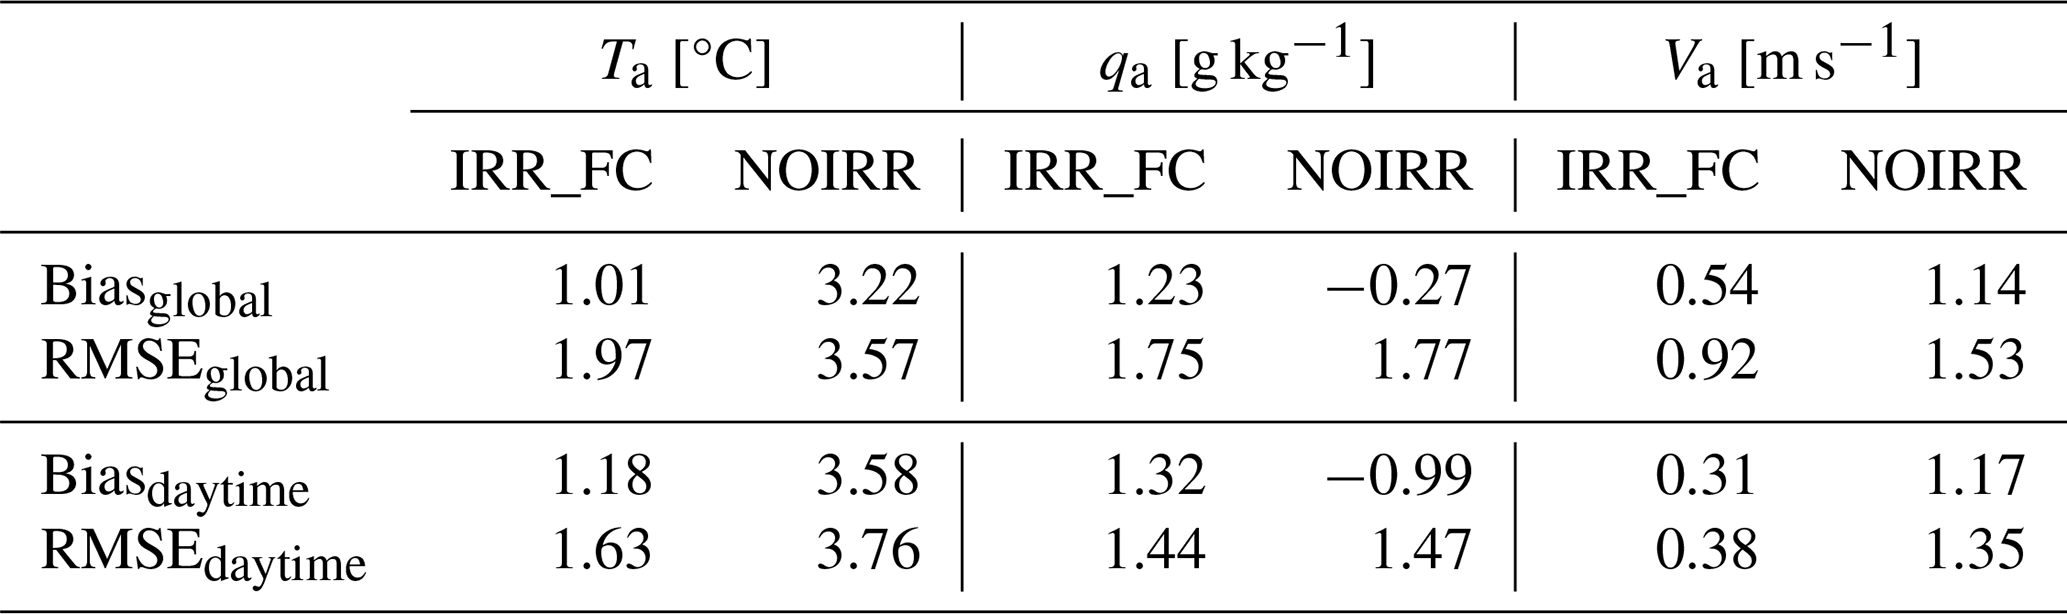
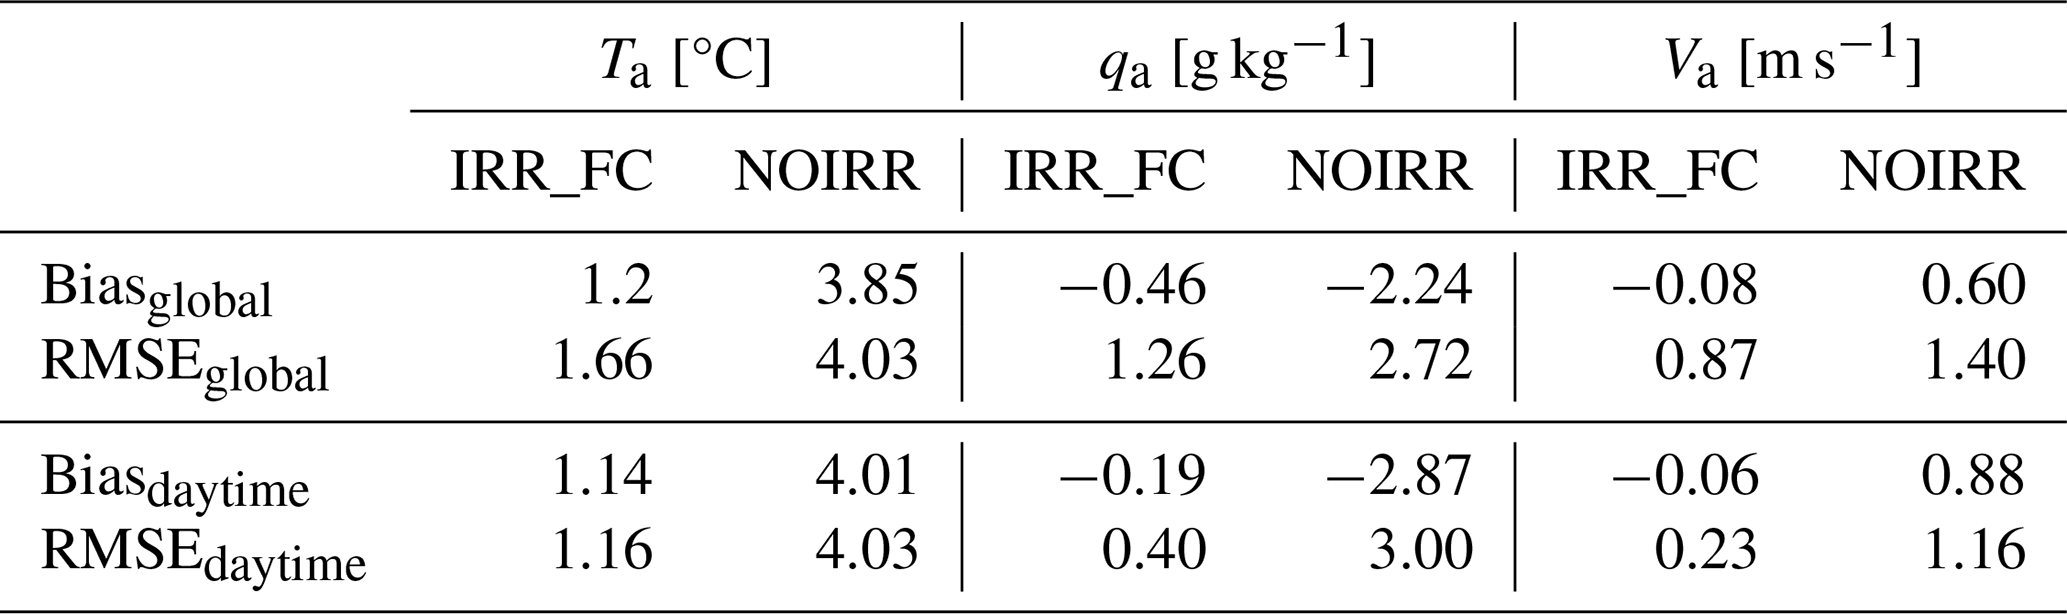
The performance scores of the coupled model runs with and without irrigation are shown in Tables 3 and 4, for the IRTA corn field and the La Cendrosa alfalfa field, respectively. The scores are given for daytime, as it is mainly the daytime values that influence evapotranspiration, and also for the whole period to give a general view of the model behaviour. The average cooling effect of irrigation over the whole period is −2.21 and −2.65 °C for the IRTA corn field and the La Cendrosa alfalfa field, respectively, and −2.40 and −2.87 °C for the daytime only.
Table 3Performance scores for the two coupled simulations NOIRR and IRR_FC for the SOP at the IRTA corn field. The subscripts global and daytime indicate the periods on which the score has been calculated, respectively, over the whole period and during the day, i.e. between 05:00 and 19:00 UTC.
The remaining temperature bias found between the IRR_FC coupled simulation and the observations depends on the day. Lunel et al. (2024a) showed that for 21 and 22 July 2021, adding irrigation to the coupled model causes a reduction in most of this bias, but for some other periods the bias is higher. This may be due to the fact that even if the activation of irrigation improves the model representation of winds, some wind regimes may be missed. As the topography of the region is complex, it is expected that the models do not capture all of the mesoscale winds (Jiménez et al., 2025). In addition, the coupled model has inherent biases, which may be related to the modelling of stable atmospheric conditions, the composite approach used in SURFEX, biases in meteorological variables derived from analyses used at the boundaries of the simulation domain, or potential misrepresentation of the land surface in the vicinity of the Urgell area. In particular, the vegetation in the model around the irrigated area may have too shallow roots as discussed by Canal et al. (2014) and Shrestha et al. (2018), leading to an overestimation of plant water stress and ultimately to warmer air. The precise characterization of the internal model biases in this region would require extensive further work, which is considered beyond the scope of the current study. Lunel et al. (2024a, b) showed that irrigation parameterizations that maintain SWI values within irrigated areas close to field capacity perform very well. Therefore, in the context of this work, it is assumed that the remaining overestimation of air temperature is not due to a misrepresentation of the irrigation effect, but to other shortcomings of the model.
3.1.2 Impact on specific humidity
The mean effect of irrigation on near-surface specific humidity is shown in Fig. 2. In the IRR_FC coupled simulation, the mean specific humidity over the IRTA corn field is overestimated throughout the day (Fig. 2a). The overestimation is specifically important at 08:00 UTC, reaching up to 2 g kg−1. This overestimation of humidity in the morning is due to the lack of vertical mixing in the lower ABL, as already discussed in Lunel et al. (2024a). During the afternoon, the simulation IRR_FC reduces the discrepancy with the observation, although it still overestimates the absolute value. The difficulty of the simulation in modelling the specific humidity at the IRTA corn field could be due to several shortcomings of the coupled model, such as the misrepresentation of the neighbouring town of Mollerussa or the overrepresentation of irrigated areas in the immediate vicinity of the IRTA corn field. In any case, the difference between the simulations NOIRR and IRR_FC allow an estimation of the humidifying effect at the IRTA facility, and it is found to be +2.31 during daytime, and +1.50 g kg−1 globally (Table 3).
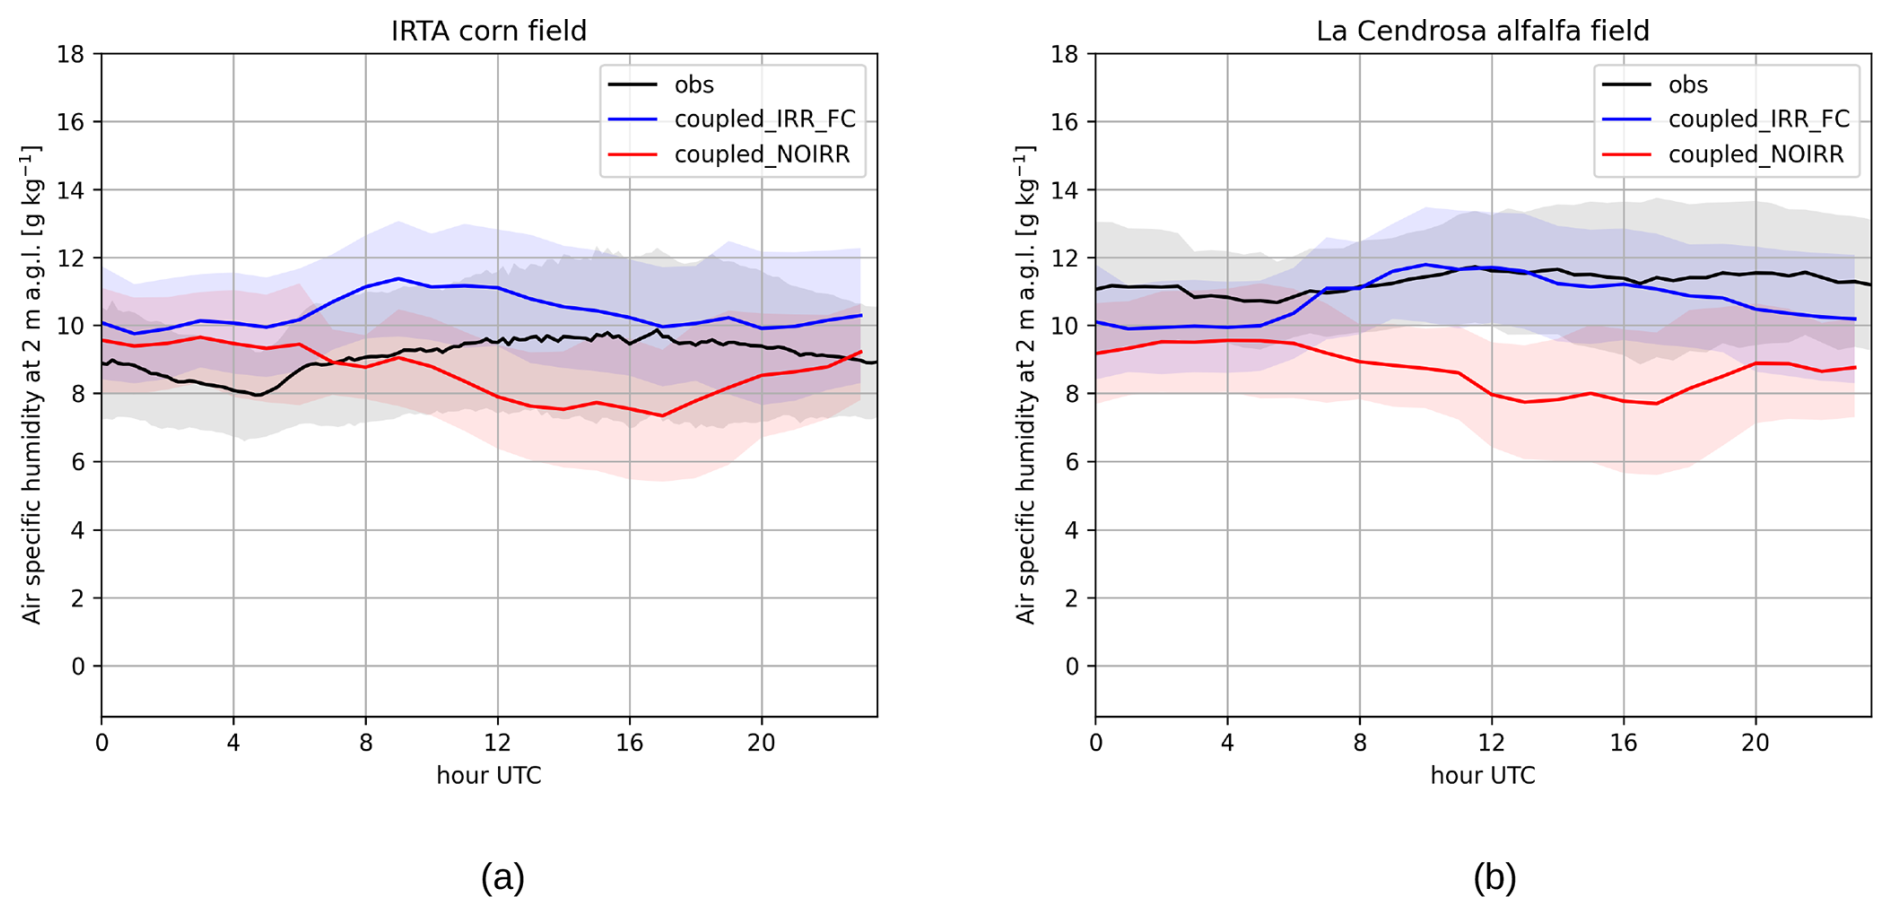
At the La Cendrosa alfalfa field, the specific humidity during the day is well modelled by the simulation IRR_FC as shown in Fig. 2b. At night, the specific humidity is slightly underestimated, probably due to the difficulty of the model in modelling stable nighttime conditions as discussed above. At all times the simulation IRR_FC improves the underestimated humidity of the simulation NOIRR. The humidifying effect at La Cendrosa is found to be +2.68 during daytime, and +1.78 g kg−1 globally (Table 4).
3.1.3 Impact on wind speed
Many studies have shown that irrigation can slow the wind near the surface (Segal et al., 1989; Sorooshian et al., 2011; Sridhar, 2013; Wu et al., 2018a). This is also the case in the Urgell region, as shown in Lunel et al. (2024a) for the 21 and 22 July, and in Fig. 3 for the whole SOP at the two observation sites. The mean reduction in wind speed due to irrigation is −0.60 and −0.68 m s−1 for the corn and alfalfa fields, respectively, during the SOP (Tables 3 and 4). During the day only, the reduction in wind speed due to irrigation is −0.86 and −0.94 m s−1, respectively. This reduction in wind speed is mainly due to the reduced momentum flux between the free troposphere and the surface (Sridhar, 2013; Wu et al., 2018a).
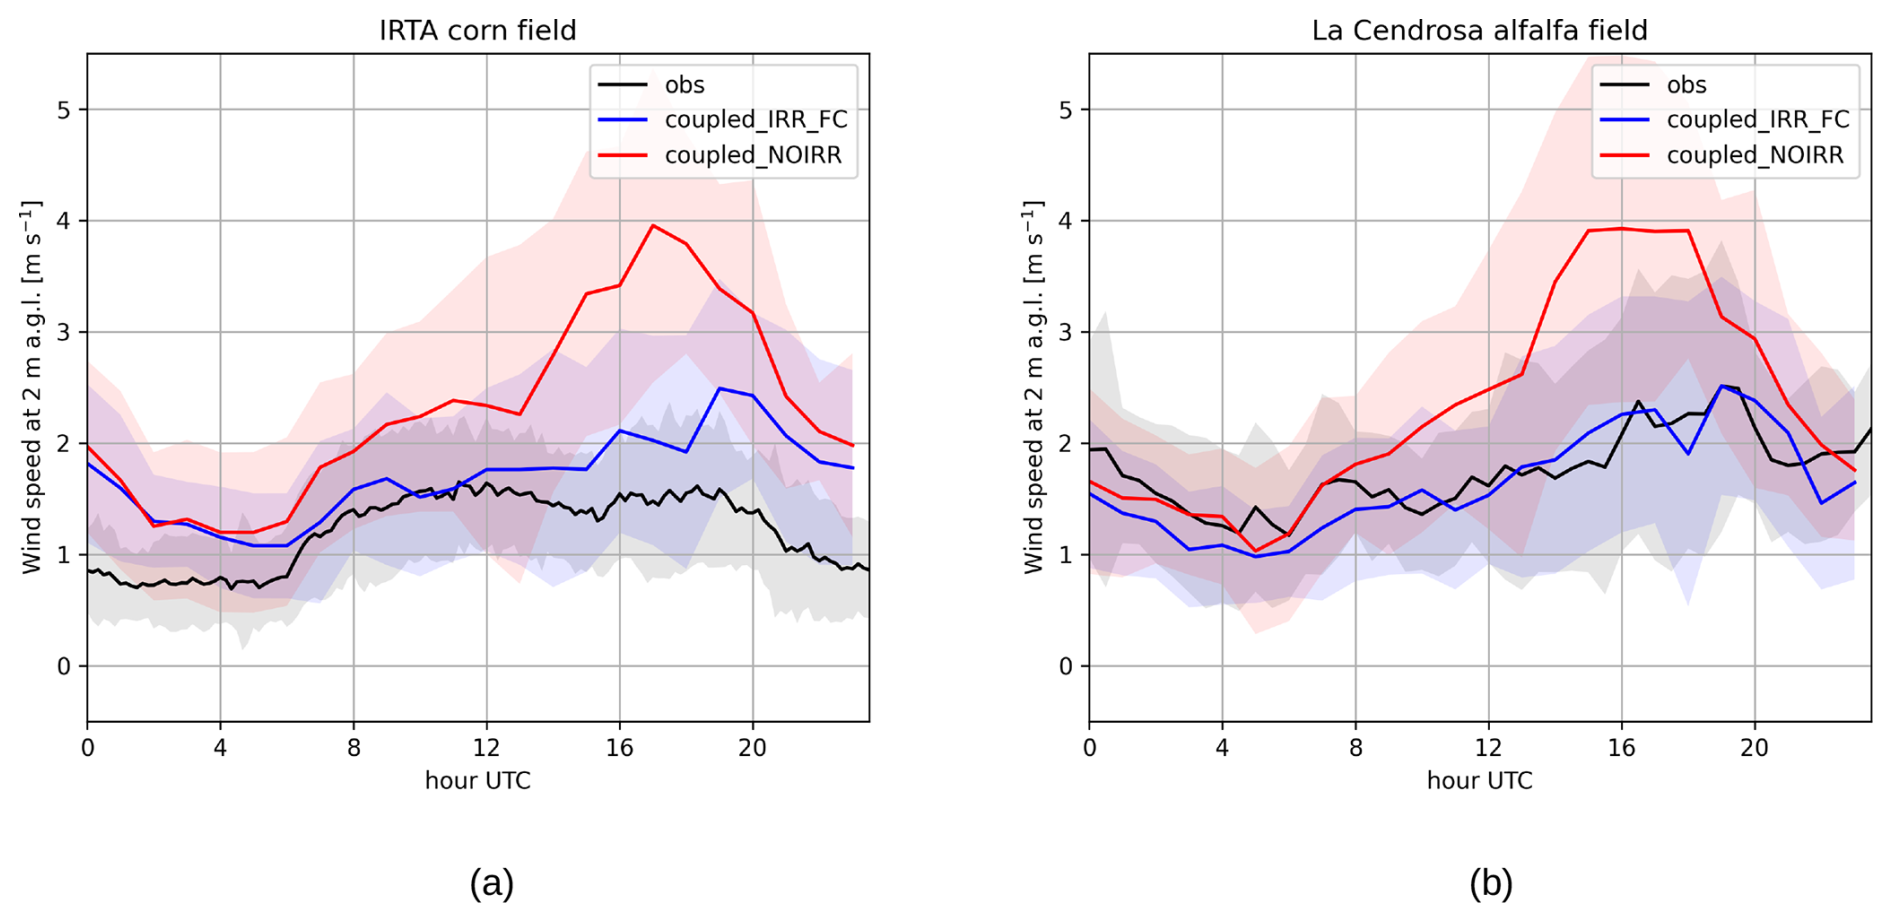
However irrigation can also influence the dynamics of mesoscale winds which are modulated by the complex topography of the Urgell region (Lunel et al., 2024a, b). In particular, the Marinada is the mesoscale wind that blows strongest during the SOP. It corresponds to the peak wind speed found at 17:00 and 19:00 UTC for the NOIRR and IRR_FC coupled simulations in Fig. 3a and b, respectively. In particular, both figures show that the peak wind speed is delayed by irrigation and that the maximum wind speed is significantly reduced by up to 1.4 m s−1, thus confirming the findings of Lunel et al. (2024b) over the longer period of the LIAISE SOP.
The reduction in wind speed due to irrigation allows a more accurate representation of the wind speed in the coupled model compared to observations. Fig. 3b shows that the irrigated coupled simulation IRR_FC performs very well in representing the wind speed at the La Cendrosa alfalfa field. The irrigation parameterization also improves the representation of wind speed over the IRTA corn field, but some biases remain. Figure 3a shows a relatively poor agreement between the irrigated simulation and the observations for the IRTA corn field, especially for the evening and night. Since the modelled wind speed behaviour is very similar in the IRTA corn field as in La Cendrosa, the reason for the poor agreement is more related to the observed wind speed pattern of the IRTA corn field, which is different from that of La Cendrosa mainly because it does not show faster winds between 16:00 and 20:00 UTC, which should correspond to the Marinada. A possible explanation for this is the organization of crop canopies into rows in and around the corn field. As shown by Ulmer et al. (2023), the angle between the rows and the wind can influence the wind speed up to two times the canopy height. This is the case for the corn field where the wind speed sensor is located at 3.6 m a.g.l., in a 2 m wide linear corridor between two rows of corn, with a surrounding canopy at 2.3 m. The rows of corn and most of the surrounding crops are aligned on a southwest-northeast axis. This is almost parallel to the dominant west-southwest wind that blows in the Urgell region, and therefore the crops offer less resistance to the wind coming from this direction. Conversely, the Marinada is a southeasterly wind that is almost perpendicular to the rows, which means that the measured wind may be weaker. In other words, the west-southwest wind sees a relatively lower roughness length than the southeast wind. However, the effect found by Ulmer et al. (2023) is relatively small, about 0.1 to 0.2 m s−1 at 1.7 times the canopy height. Although the field studied in Ulmer et al. (2023) is not the same, it is delicate to assume that all the bias between the observations and the irrigated simulation comes from the observational data. In conclusion, the reason for the absence of the Marinada signal in the wind speed measurements over the corn field would require other types of observations and an in-depth investigation, which is not undertaken in the present work.
This section confirms the strong influence of irrigation on air temperature, humidity and wind speed, and quantifies these effects during the LIAISE SOP with surface–atmosphere coupled simulations. Although the coupled model proves to be able to represent well this influence, it is also shown that biases remain between the model with irrigation and the observations. This could be due to problems inherent in the model or also to some measurement uncertainties. For the remainder of this study, it is assumed that among the various potential model shortcomings, the remaining biases are not so much due to misrepresentation of irrigation effects, but rather mostly to other model shortcomings.
3.1.4 Representativity of the study period in comparison to growing season
One can rightly argue that the two weeks of the LIAISE SOP may not fully represent the entire irrigation period. Nonetheless, this SOP was selected for study in the present work due to the computational intensity of the coupled land-atmosphere model and the fact that most of the LIAISE atmospheric observations were available during this time, facilitating the validation of model outputs. Quantifying the irrigation-induced atmospheric effects outside of this SOP is challenging due to the absence of two coupled models differing solely by the presence or absence of irrigation. However, the representativeness of the SOP relative to the full irrigation period can be assessed globally through indirect methods. To this end, the ERA5 database (Hersbach et al., 2020) can replace the NOIRR simulation. ERA5 is a global reanalysis, obtained with the surface-atmosphere coupled model of the European Center for Medium-range Weather Forecast (ECMWF), run with a horizontal resolution of 31 km and no irrigation parameterization. However, replacing the IRR_FC simulation with another weather simulation product is not feasible since no NWP or reanalysis operational model currently represents irrigation. Therefore the local near-surface observations are used to represent the IRR_FC simulation. For example, the meteorological station at La Cendrosa operated throughout the entire LIAISE Long Observation Period (LOP), which extends from mid-April to mid-October 2021. Appendix C1 illustrates the atmospheric effects of irrigation evaluated over the five months of the LIAISE LOP using ERA5 data and observations, as well as the two simulations NOIRR and IRR_FC. Firstly, it can be seen that the atmospheric effects induced by irrigation over the two weeks of the SOP are similar when obtained using the two simulations or using the observations and ERA5. The cooling effect is found to be about −3.0 °C in both cases. The humidifying and wind speed reduction effect are about +1.9 g kg−1 and −1.0 m s−1 (based on ERA5-observations datasets), and +2.8 g kg−1 and −1.5 m s−1 (based on high-resolution simulations). The small discrepancy in irrigation effect obtained using the two simulations or using the ERA5-observations datasets may be due to the coarse resolution of the ERA5 model. For instance, the coarse horizontal resolution does not enable mesoscale winds to be represented. Nevertheless, the magnitudes of the irrigation effects on the atmosphere are similar, suggesting that the differences between the ERA5 reanalysis and the observations adequately capture the atmospheric effects of irrigation. Therefore these datasets can be used to evaluate the temporal variability of this effect. Over the LOP, the irrigation atmospheric effect appears to be quite pronounced and relatively stable on average from early June to late August. Thus, this study, which focuses on the two-week SOP, is not an exceptional case but can instead be considered representative of the summer irrigation period.
3.2 Evaluation of the atmospheric feedback on evapotranspiration
The previous section demonstrated the significant effect of irrigation on the near-surface atmosphere: the atmosphere becomes cooler, more humid, and less windy. These effects, in turn, affect the surface and, in particular, surface evapotranspiration. This is the atmospheric feedback. This feedback can be consistently represented in coupled surface–atmosphere models, as both the surface and atmosphere models interact at each time step. However uncoupled (i.e. offline) LSMs do not represent the atmospheric feedback. Since coupled models are computationally expensive to run, other research areas such as hydrology and agronomy also use LSMs, but without coupling the surface to the atmosphere. These offline simulations can either be run for a single point (or parcel), or they can be made over a 2D domain. In the former case, the LSM can be forced by observations if available. In either case, the atmospheric conditions can originate from atmospheric model data (hindcast or a forecast) taken directly from coupled simulation outputs. Typically, the atmospheric forcing data used come from reanalysis (an optimal combination between model and observations) for past or near-real time weather, or GCM for future weather. However, irrigation is rarely considered in meteorological and climatological simulations (Mcdermid et al., 2023), and the reanalysis and GCM near-surface atmospheric state variables are very often too dry, too warm, and too windy over irrigated areas in summer (Tuinenburg and de Vries, 2017; Qian et al., 2020). The offline LSMs runs can also represent the soil moisture modifications due to irrigation, thus increasing crop evapotranspiration, but without having the effect of irrigation on the atmosphere represented in the atmospheric forcing, i.e. without accounting for the atmospheric feedback. The purpose of this section is to assess how this warm, dry and windy bias affects the evapotranspiration modelled by the offline ISBA LSM with a particular focus over irrigated areas.
A primarily model-based methodology is used to study the influence of atmospheric feedback on evapotranspiration. Point scale offline simulations are performed using atmospheric forcings that either include or not the effect of irrigation on the atmosphere. These atmospheric forcings are generated directly from the output of the coupled simulations presented in Sect. 3.1, namely NOIRR and IRR_FC, and are hereafter named atmo_NOIRR and atmo_IRR_FC to avoid confusion with offline LSM simulations using these irrigation parameterizations. The atmospheric forcings generated are based on the atmospheric conditions modelled over the hamlet of La Cendrosa and the IRTA facility. It should be noted that from here on out, references to La Cendrosa and the IRTA facility only indicate different atmospheric conditions and, in particular, different irrigation effects on the atmosphere, but do not imply a specific underlying land surface, as it was previously the case with the corn and alfalfa field. Here the atmospheric forcing atmo_NOIRR plays the role of the standard reanalysis or GCM data commonly used in offline LSMs. The results of these offline simulations are then compared on the basis of the presence or absence of irrigation effect in the atmospheric forcing. By comparing only the model results, it is assumed that the biases inherent in the model are largely cancelled out when calculating the difference between the results of the two configurations. The multiple configurations of the offline LSM are run only at the point scale, rather than in a 2D spatial domain. This approach enables a detailed analysis of how evapotranspiration is affected by the atmospheric conditions, which have been thoroughly characterized in Sect. 3.1. Specifically, it allows for an investigation into the processes influencing the evapotranspiration response to atmospheric feedback.
Section 3.2.1 presents results using a fixed configuration of offline ISBA. This allows the investigation of the processes that explain the behaviour of ISBA by focusing on specific days of the SOP. Section 3.2.4 then generalizes the results by combining different possible offline model configurations. This enables a quantification of the evapotranspiration overestimation due to the atmo_NOIRR atmospheric forcing for the whole SOP.
3.2.1 Processes at play
This section aims to better understand the ISBA processes that regulate evapotranspiration under different atmospheric conditions. To focus on the effects of atmospheric conditions, a fixed surface configuration is maintained which includes a single Plant Functional Type (PFT) representing a drought-tolerant crop, a composite approach for the vegetation representation, a stomatal conductance modelled with ISBA-A-gs. The atmospheric forcing used corresponds to the near-surface atmospheric conditions found over the IRTA facility at 2 m a.g.l. in the coupled model runs. The rest of the offline ISBA configuration corresponds to the values presented in Sect. 2. Note that even though the near-surface atmospheric conditions are those of the IRTA facility, the underlying surface of the offline run is not intended to be representative of the actual IRTA corn field. This allows the effect of atmospheric feedback on evapotranspiration to be isolated from the effects of surface characteristics on evapotranspiration.
3.2.2 Without water stress
When a crop is well irrigated, most of the evapotranspiration is driven first by incoming (downward) shortwave radiation and secondly by air temperature, humidity and wind. On 15 July 2021, no clouds were modelled in Meso-NH, and therefore the incoming shortwave radiation was essentially the same in the two atmospheric forcings atmo_IRR_FC and atmo_NOIRR. Thus, for the two offline ISBA runs, the factors for the differences in evapotranspiration are found in air temperature, humidity and wind.
Figure 4 shows the different atmospheric conditions from the two atmospheric forcing dataset for 15 July 2021 at the IRTA facility, and the resulting evapotranspiration modelled by the offline ISBA. The point-scale offline ISBA simulation has a SWI = 1.0. The cumulative evapotranspiration modelled with the atmo_NOIRR atmospheric forcing, i.e. with a warm, dry, and windy atmosphere, is 21 % higher than that produced with the atmo_IRR_FC atmospheric forcing. In other words, all other things being equal, neglecting the irrigation effect in the atmospheric forcing leads to a 21 % overestimation of evapotranspiration for 15 July 2021. This corresponds to an overestimation of the daily mean latent heat flux by 36 W m−2, or an overestimation of the cumulative daily evapotranspiration by 1.37 mm d−1.
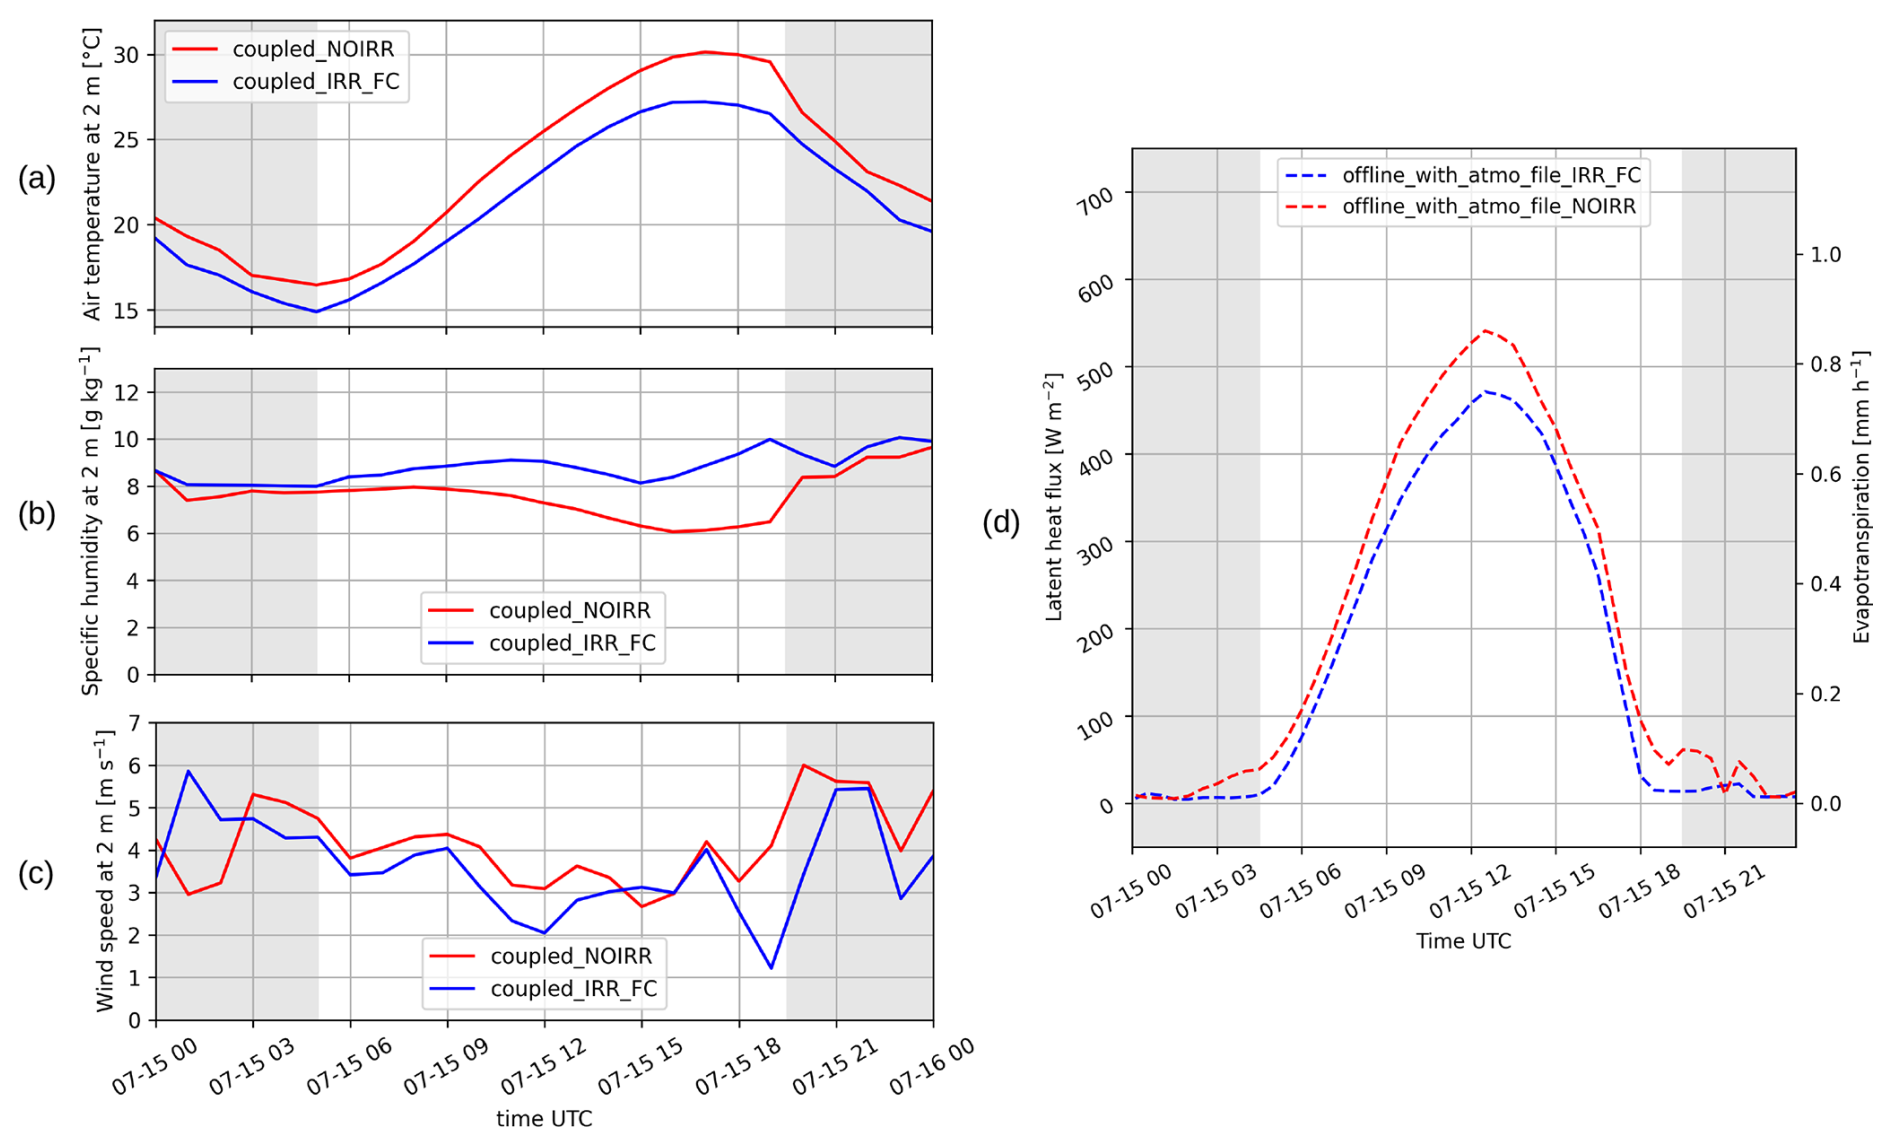
Figure 4Atmospheric conditions and evapotranspiration modelled by ISBA with two different atmospheric forcings, for 15 July 2021 at the IRTA facility. On the left are the air temperature (a), specific humidity (b) and wind speed (c), and on the right the resulting evapotranspiration (d). Both simulations have soil moisture set to field capacity, represent a drought-tolerant PFT, use a composite approach for the vegetation canopy, and model stomatal conductance with the ISBA-A-gs parameterization.
3.2.3 Under water-stress conditions – role of stomatal closure
In irrigated regions, not all crops are necessarily irrigated. These rainfed crops are therefore exposed to atmospheric conditions influenced by irrigation without being irrigated themselves. In this case, the plant may be under water stress and may close its stomata to limit water loss. As stomatal closure is controlled not only by soil moisture but also by temperature, specific humidity and wind speed, the atmospheric feedback also affects stomatal closure, and eventually transpiration. Note that stomatal closure is also controlled by shortwave radiation and CO2 concentration, but these effects are neutralized in the present study as discussed previously.
Figure 5 shows the transpiration modelled by offline ISBA for two different days, for a SWI value of 0.2, and with the two different atmospheric forcings atmo_NOIRR and atmo_IRR_FC at the IRTA facility. On 18 July (Fig. 5a), the temperature is higher than for the 15 July conditions shown in Fig. 4, and the model represents stomatal closure for the simulation with the atmo_NOIRR atmospheric forcing. The stomatal closure is characterized in the time series of transpiration vapour flux by a sudden drop in the flux value found during the day. On 18 July, the stomata close between 12:00 and 15:00 UTC, when the air temperature is highest. The asymmetry of stomatal closure around midday confirms the strong effect of air temperature. Conversely, no stomatal closure is modelled for the simulation using the atmo_IRR_FC atmospheric forcing. In this case, the atmospheric feedback, i.e. the cooling, humidifying effect and the weakening of the wind, prevents stomatal closure. Counter-intuitively, the cumulative transpiration for this day is higher for the simulation with the atmo_IRR_FC atmospheric forcing, i.e. with cooler, more humid and less windy atmospheric conditions. The simulation with atmo_NOIRR underestimates the transpiration rate by 29 % compared to the simulation with atmo_IRR_FC. This corresponds to an underestimation of the daily mean transpiration latent heat flux by 30 W m−2, or an underestimation of the cumulative daily transpiration by 1.14 mm d−1.
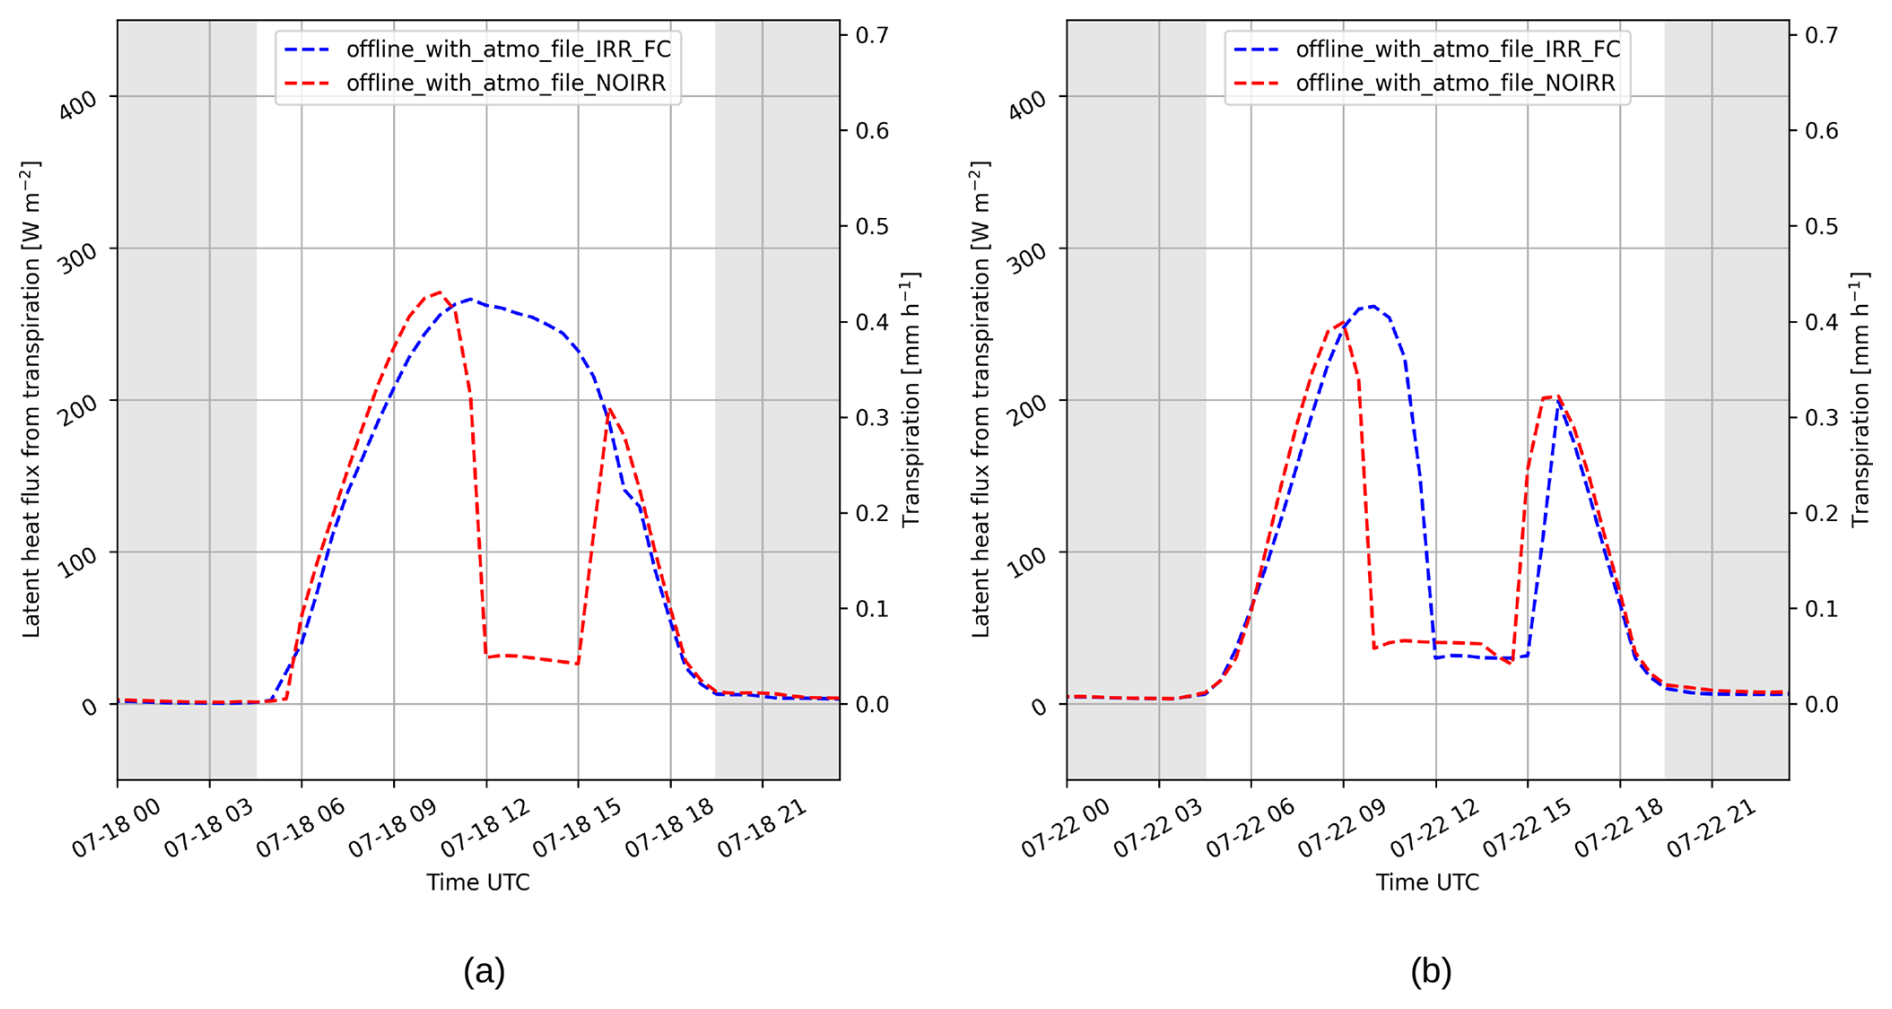
Figure 5Transpiration modelled by ISBA for 18 (a) and 22 (b) July 2021 over a hypothetical dry parcel (SWI = 0.2) located at the IRTA facility. The PFT modelled here corresponds to a drought-tolerant crop, with vegetation modelled with a composite approach and stomatal conductance modelled by ISBA-A-gs.
On a hotter day like 22 July 2021, both simulations show stomatal closure (Fig. 5b). However, the atmospheric feedback still allows stomata to close later in the morning. The simulation with the atmo_IRR_FC atmospheric forcing has stomatal closure between 12:00 and 15:00 UTC, while the atmo_NOIRR forcing results in stomata closure between 10:00 and 14:30 UTC. Somewhat unexpectedly, stomata reopen earlier in the case without atmospheric feedback. This is due to the earlier arrival of the Marinada in the atmo_NOIRR atmospheric forcing, as shown by Lunel et al. (2024b). This behaviour is therefore specific to the region of the present case study and cannot be extended to other regions of the world. Without the Marinada delay, the atmospheric feedback should have led to an earlier reopening of the stomata. The daily transpiration difference is again negative, meaning that the atmospheric feedback led to higher transpiration rates. The offline simulation with atmo_NOIRR atmospheric forcing, i.e. without atmospheric feedback, underestimates the transpiration rate by 10 %. This corresponds to an underestimation of the daily mean transpiration latent heat flux by 7 W m−2, or an underestimation of the cumulative daily transpiration by 0.28 mm d−1.
However, transpiration is only part of evapotranspiration, the other consisting in evaporation from the bare ground (there is no water intercepted on the leaves). The total evapotranspiration is shown in Fig. 6. Stomatal closure can still be seen in the daily evolution of total evapotranspiration, however, the decrease in total evapotranspiration is not as significant as for transpiration only.
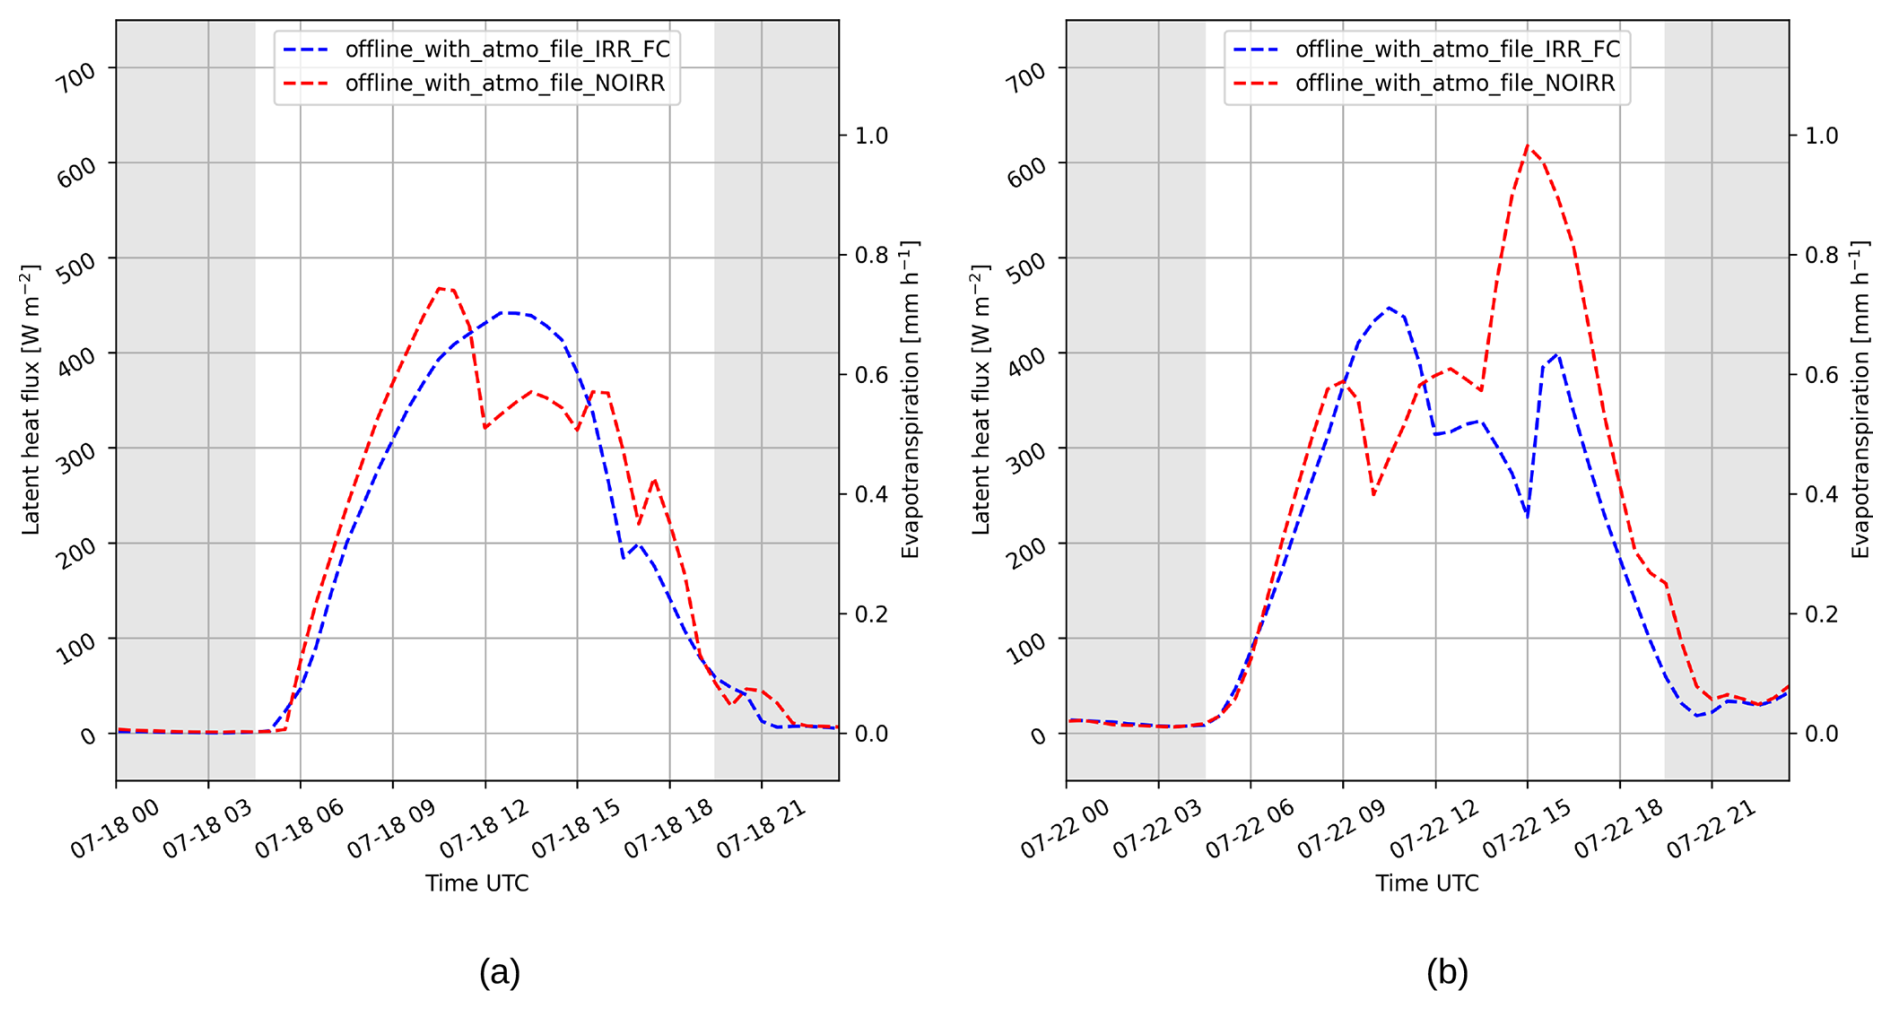
On 18 July at 13:00 UTC, the instantaneous decrease due to stomatal closure for transpiration only is about 220 W m−2, while the decrease for evapotranspiration is about 100 W m−2. The difference in the magnitude of the decrease between transpiration and evapotranspiration is due to a compensating effect of bare soil evaporation. In the composite approach, as vegetation transpiration decreases, more heat is available to the composite layer, and the soil responds quickly by increasing its temperature. In the separate canopy approach of MEB, as transpiration decreases, the canopy converts more radiative energy into thermal energy, increasing the canopy air temperature and also the top soil temperature. Under either approach, the soil warms as transpiration decreases and evaporation from the bare soil increases in response.
Another interesting effect due to evaporation can be seen in Fig. 6. Soil evaporation is also more sensitive to wind speed than transpiration, and evaporation peaks when the sustained wind speed of the Marinada arrives. Combining Eqs. (1) and (3), it can be observed that the ISBA LSM formulates evaporation as proportional to wind speed Va, while transpiration is also modulated by stomatal resistance Rs, leaf. This strong dependence on the wind speed allows the modelled evapotranspiration to reach up to 615 W m−2 (0.98 mm h−1) on 22 July at 15:00 UTC when the Marinada arrives. In this case, it is important to consider the role of the irrigation-induced decrease in wind speed. The excessively windy atmospheric forcing atmo_NOIRR leads to an overestimation of the mean evaporation up to 63 % and 47 % for 18 and 22 July, respectively (Appendix D1a, b). These values correspond to an overestimation of the daily mean evaporation latent heat fluxes by 41 and 47 W m−2, or an overestimation of the cumulative daily evaporation by 1.54 and 1.80 mm d−1. By aggregating the role of evaporation and transpiration, for the days shown in Fig. 6, it can be found that the atmo_NOIRR atmospheric forcing leads to an overestimation of evapotranspiration by about 6 % and 23 % for 18 and 22 July, respectively, corresponding to an overestimation of the daily mean latent heat fluxes by 10 and 39 W m−2, or an overestimation of the cumulative daily evapotranspiration by 0.40 and 1.52 mm d−1.
It should be noted that these results are obtained using the composite approach to vegetation representation, which is known to have limitations with respect to bare ground evaporation (Napoly, 2016). By using the MEB option, the wind speed seen by the ground surface can be modelled more realistically and is significantly lower than that seen by the canopy. The MEB approach also takes into account the sheltering effect of the canopy and the temperature of the top layer of soil is independent of the canopy temperature. This more realistic approach means that ISBA does not compensate for reduced transpiration by increasing evaporation as much as in the composite approach. The overestimation of evaporation then decreases, becoming negligible on 18 July, but remaining on 22 July. The mean evaporation is overestimated by 0.5 % and 17 % for 18 and 22 July, respectively (Appendix D1c, d). These values correspond to an overestimation of the daily mean evaporation latent heat fluxes by 1 and 11 W m−2, or an overestimation of the cumulative daily evaporation by 0.01 and 0.43 mm d−1. With the separate canopy approach of MEB, the behaviour of total evapotranspiration is closer to that of transpiration. On 18 July the evapotranspiration is underestimated by 16 % (24 W m−2 or 0.92 mm d−1), whereas on 22 July it is overestimated by only 5 % (6 W m−2 or 0.24 mm d−1).
Note that the atmospheric feedback on evaporation and the compensation effect must be interpreted with caution. Evaporation from bare soil is strongly dependent on the top soil humidity hu. Although moisture can be evaporated from the soil for soil moisture below the wilting point, i.e. for SWI<0, the rate of evaporation will be low for such dry soils. Note that the model configuration used in Fig. 6 is conceptual and keeps SWI at a value of 0.2, which allows the top soil layer to be moist enough to provide a significant evaporation rate throughout the simulation. In reality, or in a more realistic flood irrigation parameterization, the top soil layer would dry out and evaporation could not compensate as much for the decrease in transpiration. Although the magnitude of the evapotranspiration compensation effect is uncertain, it is important to consider this process when interpreting the evapotranspiration outputs of LSMs in different configurations, as is done in the next section.
3.2.4 General quantification
The previous sections have shown that for equal incoming shortwave radiation, the atmospheric feedback is particularly important to consider in offline ISBA simulations. For well-irrigated plants, the atmospheric feedback is shown to reduce modelled transpiration and evaporation. For water-stressed plants, however, more complex processes are involved. The atmospheric feedback has a clear influence on the timing of stomatal closure, which can compensate for the decrease in transpiration or even lead to the opposite effect, i.e. an increase in transpiration. It has also been shown that transpiration and soil evaporation are not separate processes, but interact with each other through surface temperature. More specifically, a decrease in transpiration leads to an increase in bare soil evaporation in the ISBA LSM.
The previous section explored and quantified these processes for specific days and for a few ISBA configurations. A more systematic assessment of the effect of atmospheric feedback on vapour fluxes is still needed. For this purpose, the overestimation of evapotranspiration due to the atmo_NOIRR atmospheric forcing is quantified for the different offline ISBA configurations presented in Table 2. The influence of the different parameter combinations is also discussed in the light of the previously presented processes. Note that the combinations of soil moisture and different atmospheric conditions presented are realistic. Although irrigation has a significant impact on near-surface atmospheric conditions, synoptic conditions remain the primary driver of atmospheric properties. Consequently, under conditions with sufficiently strong horizontal advection, it is possible to have a hot, dry atmosphere above a small irrigated area with wet soil, or conversely, a non-irrigated parcel with dry soil in the middle of an irrigated area with a relatively cool, humid atmosphere.
Figure 7 shows the overestimation of transpiration and evaporation rates modelled by ISBA for different soil moisture values, different ISBA configurations (listed in Table 2) and for two different locations in the irrigated area of LIAISE. Soil moisture levels are represented by SWI because it is the main moisture control factor for transpiration in the ISBA model. Also evaporation is controlled by the ratio , which is conceptually similar to SWI (cf. Eq. 5). The SWI remains constant throughout each simulation, meaning that the same SWI levels impact transpiration and evaporation in Fig. 7. Note that these idealized constant SWI values are used here to analyze the sensitivity of transpiration and evaporation to soil moisture. In the realistic parameterizations IRR_THLD (described in Sect. 2.2.4), the topsoil layer dries out quickly while the root zone remains wet for a longer period of time.
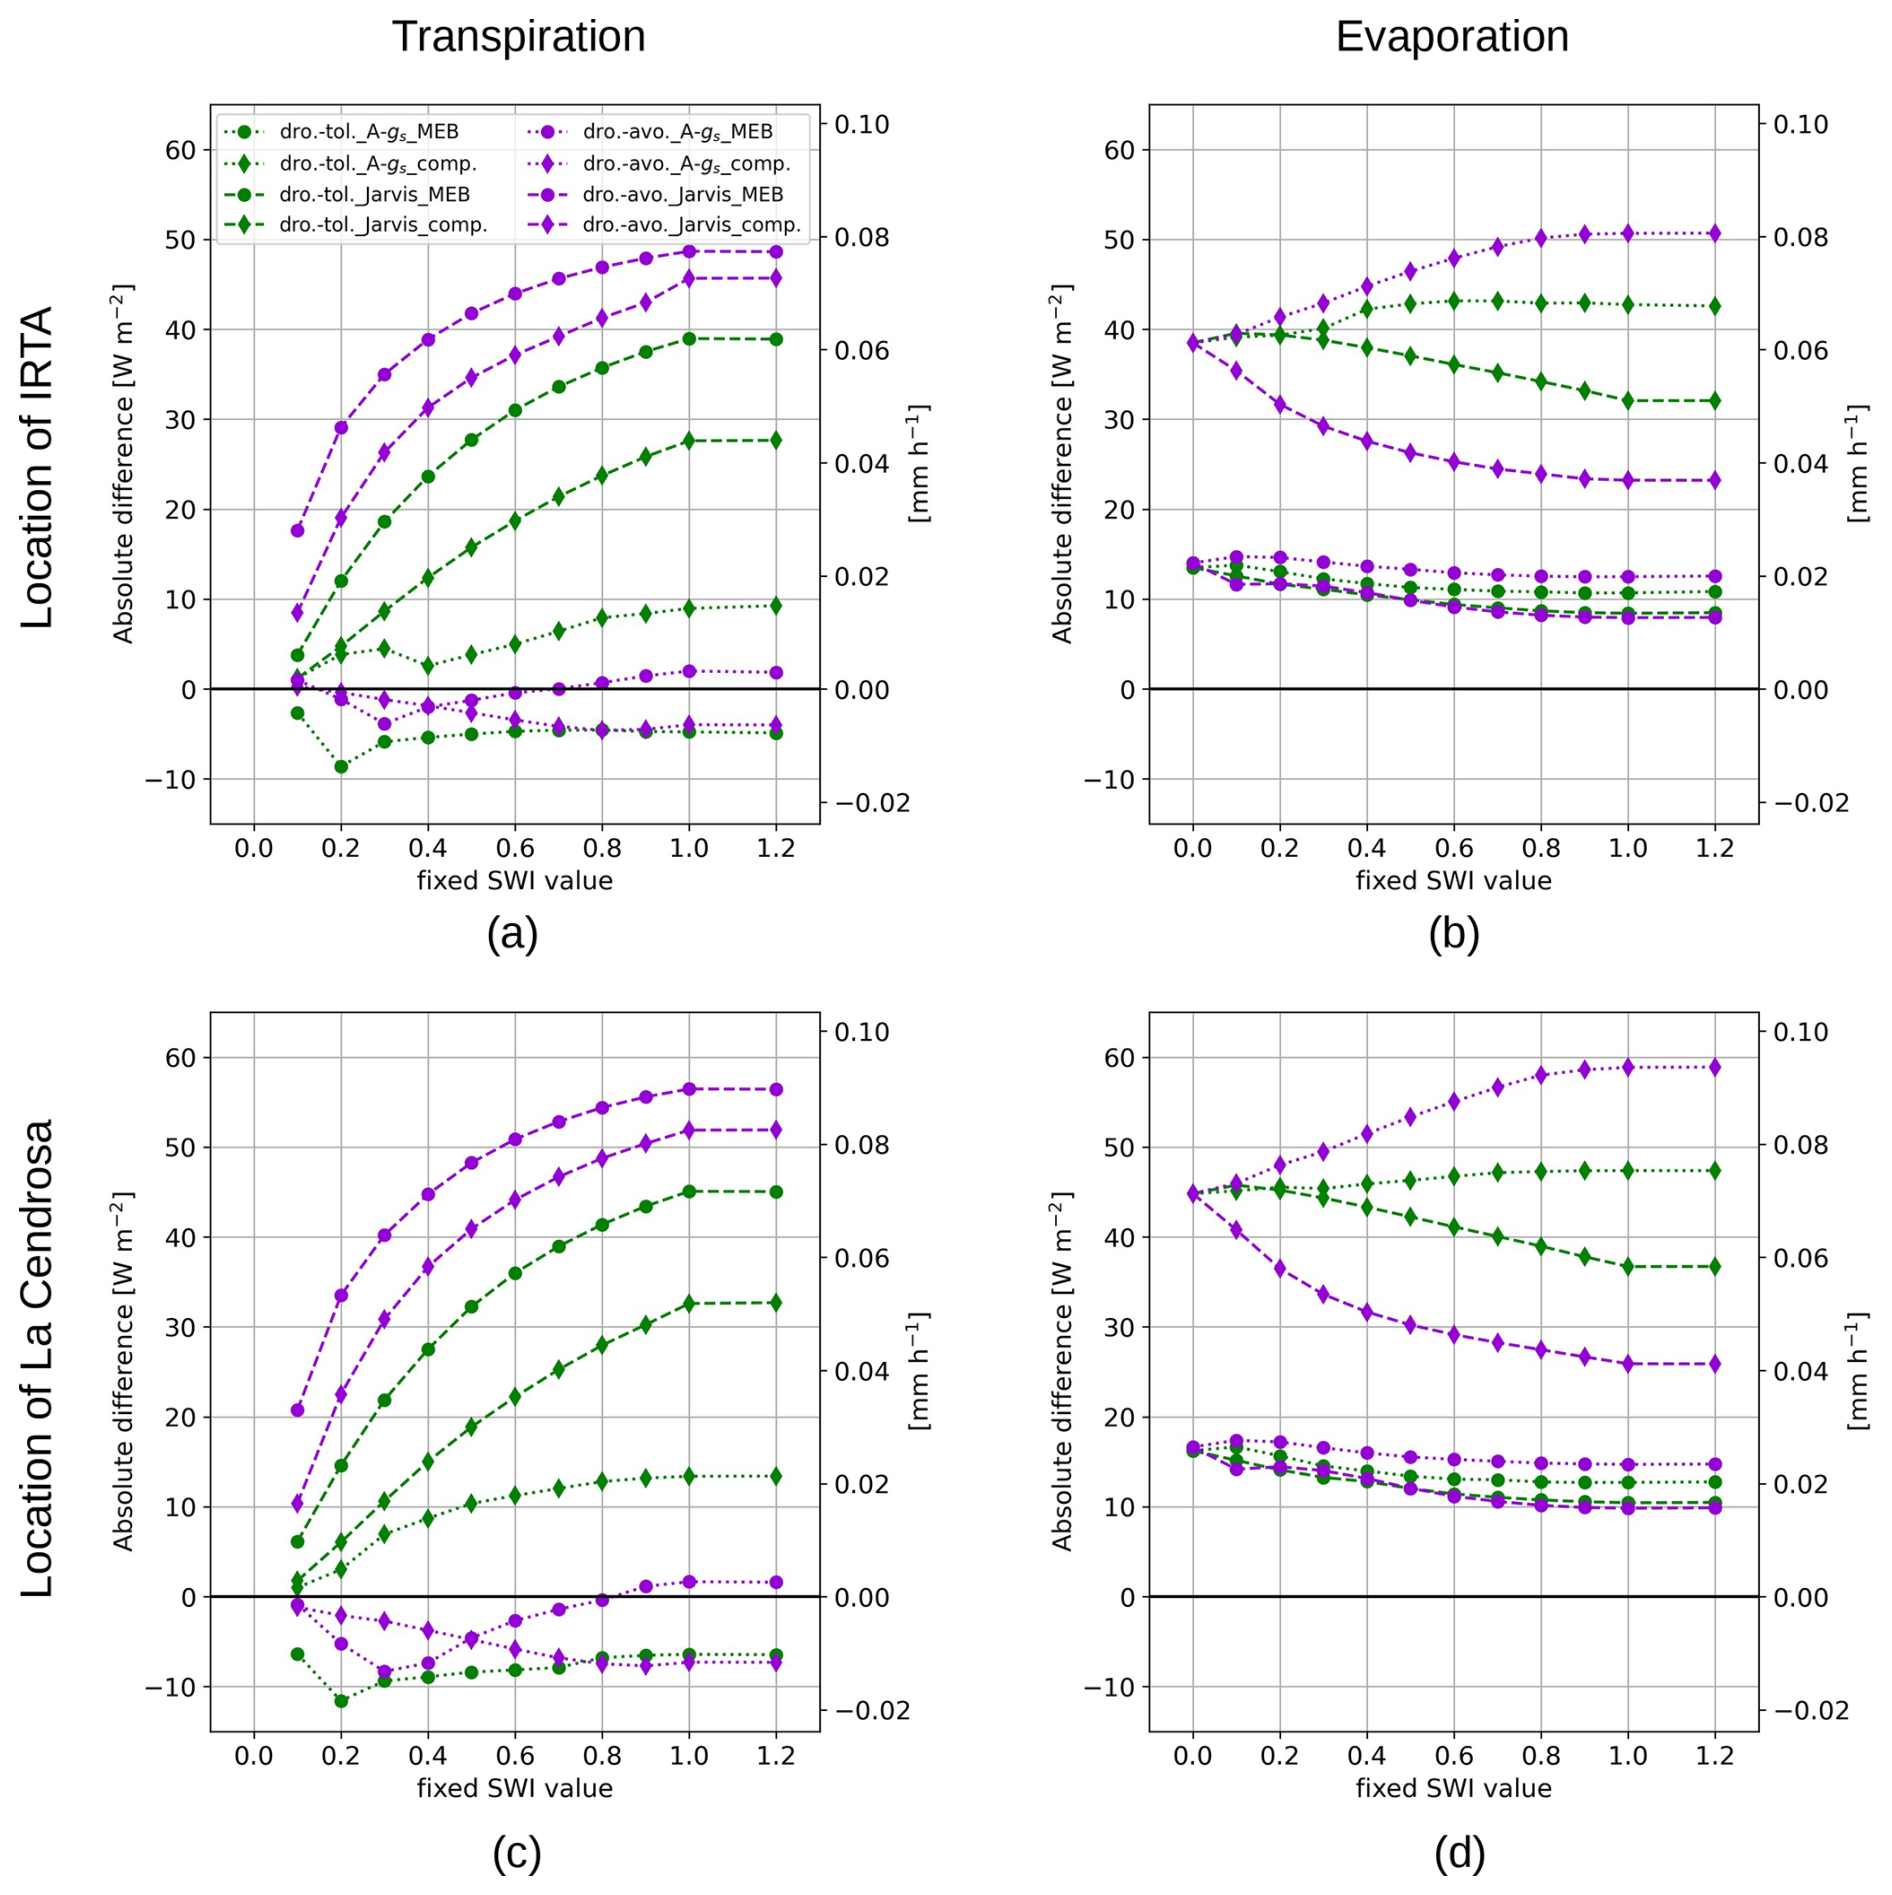
Figure 7Transpiration (left panel) and evaporation (right panel) mean absolute overestimation due to the atmo_NOIRR atmospheric forcing (i.e. due to the absence of irrigation atmospheric effect in the atmospheric forcing) as a function of root zone SWI, at the two locations of the IRTA facility (a, b) and La Cendrosa (c, d). Dro.-tol., dro.-avo., and comp. stand for drought-tolerant, drought-avoidant, and composite approach, respectively. The purple and green lines correspond to the drought-avoidant and drought-tolerant strategies, respectively. The dotted and dashed lines correspond to the ISBA-A-gs and Jarvis photosynthesis strategies, respectively. The round and diamond markers correspond to the MEB and composite approach strategies, respectively.
For transpiration, the absolute value of the overestimation is highly dependent on the soil moisture and the stomatal conductance scheme (Fig. 7a and c). With Jarvis, the mean absolute overestimation of transpiration due to the lack of atmospheric feedback ranges between 28 and 56 W m−2 (1.07 and 2.14 mm d−1) for wet soil where SWI≥1. In relative terms, these values correspond to a 19 % to 35 % overestimation of the mean transpiration vapour flux. For dry soil (SWI=0.1) the overestimation ranges from 1 to 21 W m−2 (0.04 to 0.80 mm d−1), corresponding to a relative overestimation of 4 % to 21 %. No value is shown for SWI=0 as the modelled transpiration is zero. For these drier soils and with Jarvis, the decrease in the absolute value of the overestimation is due to the overall decrease in evapotranspiration, but also partly to the compensating effect of stomatal closure as presented in the previous section. Stomatal closure/opening is regulated by stomatal conductance and the associated scheme. Figure 7a and c show that the Jarvis scheme leads to higher overestimation of transpiration than the ISBA-A-gs scheme. In fact, the Jarvis scheme does not model rapid stomatal closure. Instead, it gradually reduces stomatal conductance during the day and leads to a weak compensation effect with respect to the timing of stomatal closure (not shown).
In contrast, when the ISBA-A-gs scheme is used, stomatal closure compensation is more significant and greatly reduces the overestimation of transpiration for all soil moisture compared to the Jarvis scheme. For ISBA-A-gs and wet soils, the lack of atmospheric feedback can lead to either an overestimation of 14 W m−2 (0.54 mm d−1) or an underestimation of −12 W m−2 (−0.46 mm d−1). This can be explained by the fact that the two weeks modelled for the present study are hot and dry in midsummer and therefore the modelled plants often close their stomata when the atmo_NOIRR atmospheric forcing is used, i.e. when it does not include the atmospheric feedback. However, the atmo_IRR_FC atmospheric forcing allows for more days without stomatal closure to be modelled. On these days the atmospheric feedback actually allows a higher cumulative transpiration rate, as shown in Fig. 5. In the present case, the ISBA-A-gs scheme used with hot and dry atmospheric conditions leads to a low or negligible overestimation of transpiration.
The response of evaporation to ISBA configuration and soil moisture is different from that of transpiration. Figure 7b and d show the mean absolute overestimation of evaporation as a function of soil moisture. The canopy representation is the main factor to consider in this case, with a higher overestimation when the composite approach is used. With the composite approach, the absolute overestimation values range from 26 to 63 W m−2 (0.99 to 2.40 mm d−1) depending on the combination of stomatal conductance scheme, drought response and location. The reason for this is the dependence of evaporation on the temperature of the top soil layer. As the top soil layer is a composite layer, its temperature depends on the cooling caused by transpiration. The lower the transpiration, the higher the top soil temperature and ultimately the higher the evaporation, i.e. evaporation compensates, to a certain degree, for the lack of transpiration. The interaction between transpiration and evaporation through surface temperature (either canopy or composite skin temperature) means these two processes are necessarily intertwined and must be interpreted together. This dependence on transpiration is confirmed by the fact that the absolute differences in evaporation rate do not vary with the stomatal conductance scheme for SWI=0, i.e. when transpiration is zero. It can also be observed that the highest values of evaporation overestimation are found for ISBA-A-gs, i.e. for the stomatal conductance scheme that models more stomatal closure and overestimates transpiration less.
With MEB, bare soil evaporation is more physical. It has independent temperatures for the canopy and the top soil layer and takes into account the shading effect of the canopy on the soil. The top soil temperature is not influenced as quickly by stomatal closure as in the composite approach, and therefore the evaporation overestimation is globally similar for all soil moisture and ISBA configurations, with values ranging from 8 to 18 W m−2 (0.31 to 0.69 mm d−1). In relative terms, these values correspond to a 12 % to 38 % overestimation of the mean soil evaporation vapour flux.
In summary, the overestimation of transpiration is highly dependent on the soil moisture and stomatal conductance scheme, while the overestimation of evaporation is more dependent on the canopy scheme. For the composite approach, the higher the overestimation of transpiration in Fig. 7a and c, the lower the overestimation of evaporation in Fig. 7b and d.
Figure 8 shows the distribution of the total relative overestimations of evapotranspiration, for the two weeks modelled, for different ISBA configurations. These configurations differ in the parameterizations used (see Table 2) and in the atmospheric effects of irrigation (from La Cendrosa and the IRTA facility). The detailed relative overestimation for each configuration is shown in Appendix E1. The results are presented separately for different soil moisture categories in offline ISBA: Non-irrigated and Irrigated. The Non-irrigated column corresponds to the NOIRR case and the Irrigated column corresponds to the IRR_THLD and IRR_FC parameterizations, described in Sect. 2.2.4.
When the soil is not irrigated in the offline simulation, the stomatal closure process plays a key role, and the use of atmo_NOIRR leads to weak or negligible average underestimation of evapotranspiration, between −10 % and 2 %, as discussed in Sect. 3.2.1. Moreover, this small relative underestimation corresponds to small absolute values. This means that a field that is not irrigated, but is subject to atmospheric feedback from surrounding irrigated fields, will not reduce its mean evapotranspiration very significantly.
In contrast, the irrigated field is quite sensitive to the atmospheric feedback. In this case, the use of the atmospheric forcing atmo_NOIRR, which does not include the influence of irrigation on the atmosphere, leads to an overestimation of evapotranspiration of between 4 % and 35 %. For the irrigated offline simulations, the low values of evapotranspiration overestimation (<20 %) are all obtained for ISBA configurations using the stomatal conductance scheme ISBA-A-gs, since this scheme allows more stomatal compensation effect (Appendix E1). A LSM using the Jarvis stomatal conductance scheme is more prone to overestimate evapotranspiration over irrigated areas.
Evapotranspiration can also be calculated without LSM, for example using a formula such as FAO-56 from Eq. (7). This formula implies a wet soil and crops without water stress, thus conceptually representing a land surface similar to that modelled with the irrigated offline ISBA simulations. By entering values for Va, 2, T and VPD either taken from atmo_NOIRR or atmo_IRR_FC, the overestimation due to the lack of atmospheric feedback in the input data can also be evaluated. The overestimation is found to be similar with the FAO-56 formula as with the offline ISBA simulations, i.e. between 20 % and 24 %. The average overestimation for all cases including irrigation (i.e. Irrigated and FAO-56) is 25 %.
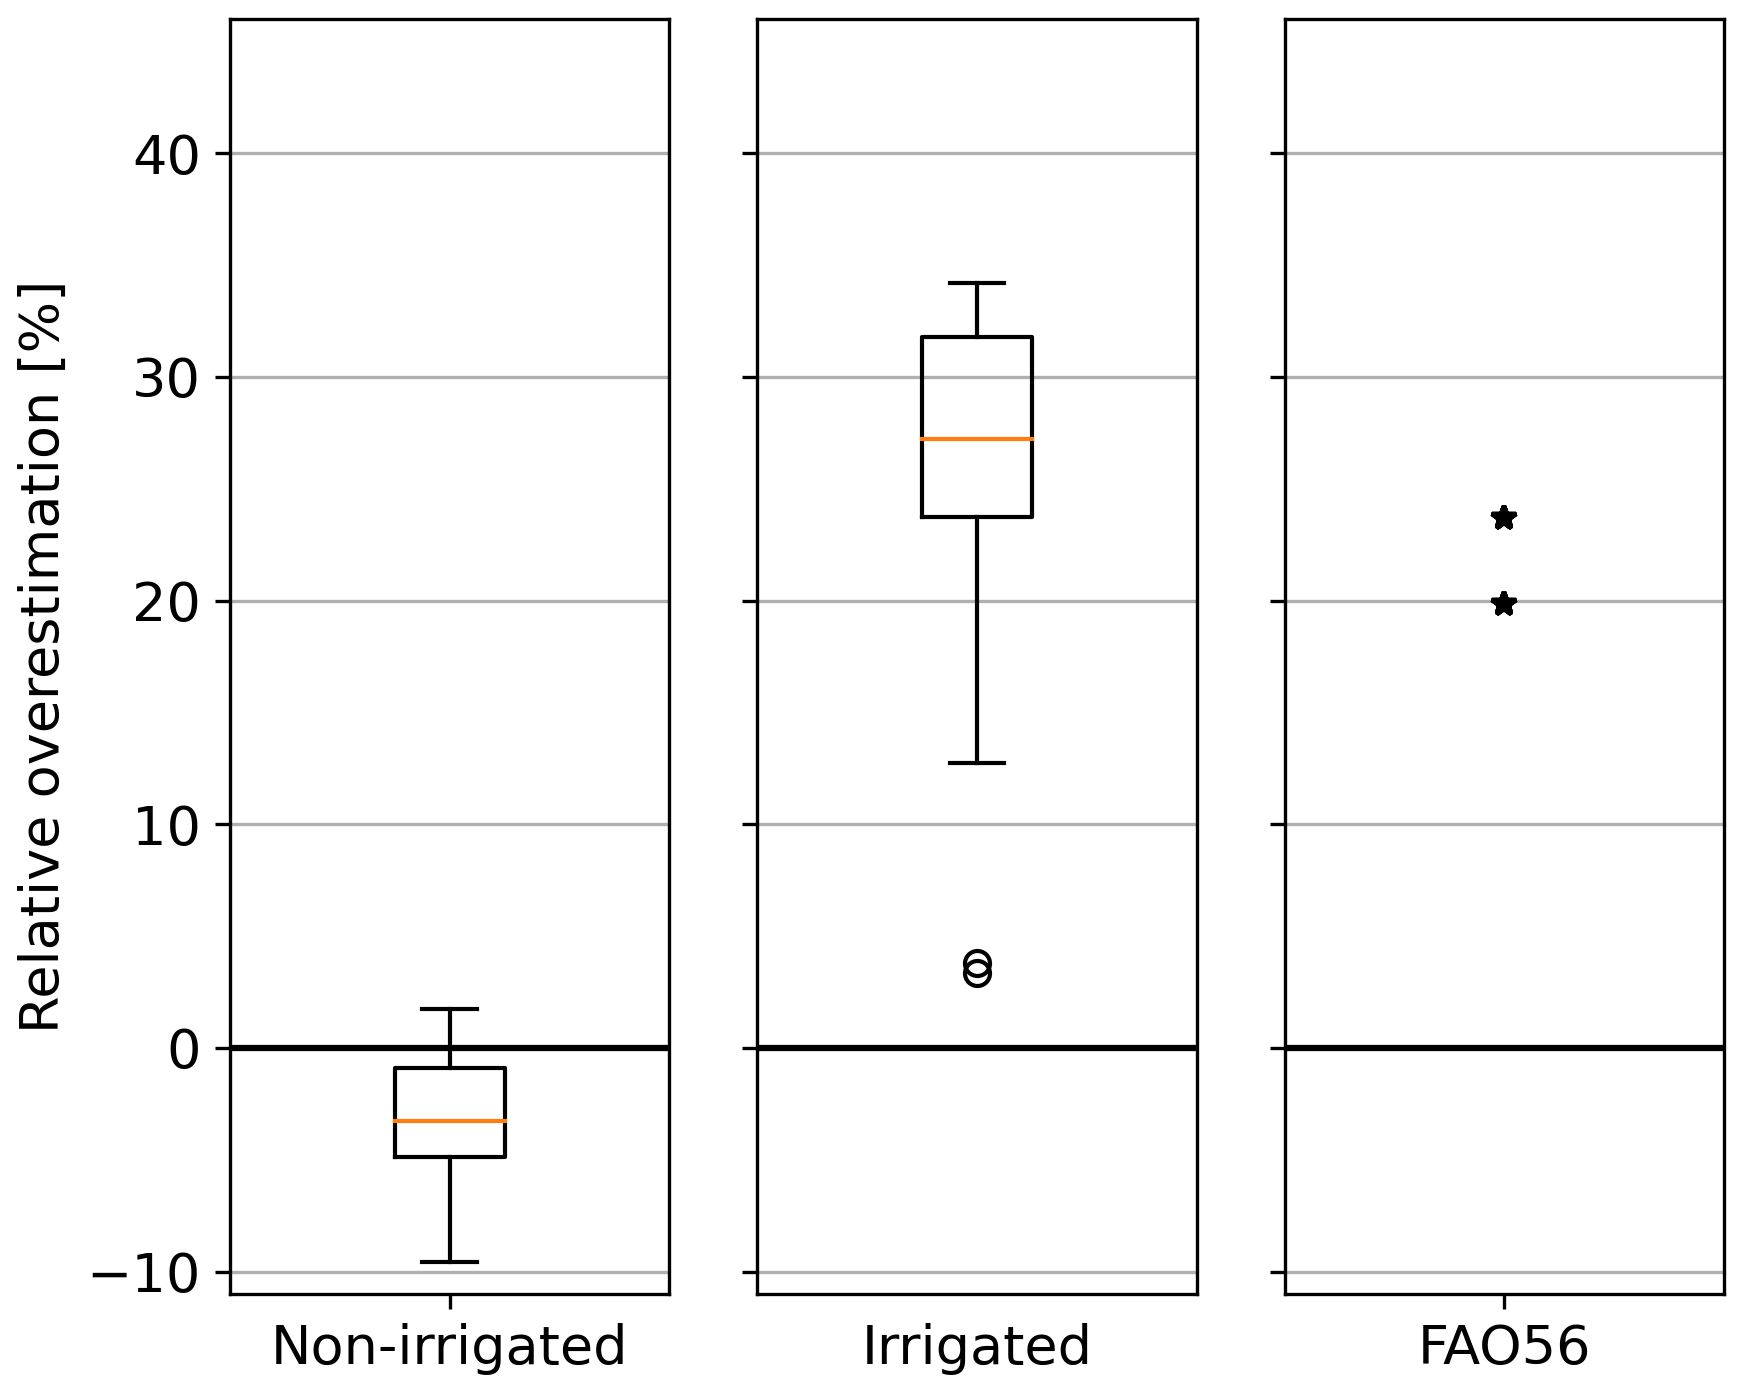
Figure 8Mean relative overestimation of total evapotranspiration due to the hot, dry and windy atmospheric forcing file atmo_NOIRR, for different ISBA configurations, different irrigation parameterizations, and two irrigation-induced atmospheric effects of irrigation.
This article examines the importance of accounting for irrigation in atmospheric forcings that are subsequently used for hydrological or agronomic purposes over irrigated areas. The influence of irrigation on near-surface meteorological conditions, i.e. air temperature, humidity and wind, is shown to be important, and it is quantified for the two weeks of the LIAISE campaign SOP. In the La Cendrosa alfalfa field, comparing the simulation with and without irrigation, it is shown that irrigation reduces the 2 m air temperature by 2.6 °C, increases the specific humidity by 1.8 g kg−1 and reduces the wind speed by 0.7 m s−1 on average during the SOP. These three irrigation-induced effects all contribute to a reduction in crop evapotranspiration. This is called atmospheric feedback on evapotranspiration.
The novelty of this work lies in the detailed analysis of the LSM processes involved in this atmospheric feedback, and in the quantification of this effect for different ISBA configurations. The different configurations studied are commonly found in other LSMs and so it is presumed that the results presented herein are very likely to be valid for these LSMs as well. By focusing on specific days, the effect of atmospheric feedback on both evaporation and transpiration is studied: the atmospheric feedback is shown to substantially reduce evaporation and transpiration for well-irrigated crops. For water-stressed crops, however, other processes are involved. In such conditions, plants close their stomata and it is found that atmospheric feedback has a delaying effect on the timing of stomatal closure and an advancing effect on the timing of stomatal reopening. This compensates for the decrease in transpiration or even leads to the opposite, i.e. an increase in transpiration due to the atmospheric feedback. It is also shown how transpiration and soil evaporation interact. Other things being equal, a decrease in transpiration leads to an increase in bare soil evaporation. This paper highlights and discusses how some parameterizations of ISBA affect these processes. In particular, the use of ISBA-A-gs increases the compensation effect of stomatal closure, and the use of the composite approach to vegetation representation increases the response of soil evaporation to variation in transpiration.
Finally, the overestimation of evapotranspiration resulting from ignoring the atmospheric feedback over irrigated areas is quantified based on model results. It is found to be between 4 % and 33 %, with a mean of 25 %. This article presents a quantification of this overestimation induced by the absence of atmospheric feedback in offline LSM simulations. This quantification is specifically robust thanks to the various LSM configurations used, and to the high level of confidence in attributing atmospheric changes to irrigation in the context of the LIAISE campaign, given the ample literature already published on this campaign (cf. introduction or Boone et al., 2025 for an overview).
Nevertheless, the limited spatiotemporal coverage of our study also imposes limitations. For example, the results may not be generalisable to other climate conditions or other density of irrigated lands because atmospheric effect of irrigation may differ. However, it should be noted that similar values of evapotranspiration overestimation were shown by Decker et al. (2017) for a similar climate, albeit a less densely irrigated region. Another specific feature of the LIAISE SOP was the low cloud cover. The LIAISE campaign SOP took place during a mostly sunny period, during which no influence of irrigation on clouds was found. Therefore the subsequent influence of a shortwave downward radiation modification on evapotranspiration was not explored in the current study. Since irrigation can influence boundary layer clouds in regions characterized by different topographies or for synoptic situations not considered herein (Kawase et al., 2008; Lobell et al., 2008), this factor must be given special attention in other cases. For example, if irrigation leads to increased cloud coverage and reduced shortwave downward radiation, as suggested by Lobell et al. (2008), then the overestimation of evapotranspiration due to non-irrigated atmospheric forcing data could be even greater.
Although the magnitude of this overestimation may vary depending on numerous factors, this bias is nevertheless important and needs to be carefully considered for offline LSM simulations using atmospheric conditions unaffected by irrigation, i.e. most reanalyses and GCMs. This also has implications for impact studies under different future climate scenarios which make estimates of future water needs for irrigation and the impact on plant phenology. In fact, to the best of the authors' knowledge, no reanalysis has yet included irrigation in the LSM that is used in the coupling with the atmosphere. Some GCMs are starting to include it, but may miss some irrigation effects due to low spatial resolution. However, the climate research community has recently initiated an international model intercomparison to improve understanding of the impact of irrigation on the Earth System (Yao et al., 2023). This intercomparison work will provide an opportunity to assess the impact of irrigation in a more systematic way, and could promote the representation of irrigation in future GCM runs. This potentially simple addition to any LSM can lead to important improvements in weather modelling over semi-arid regions, and would also avoid important biases in evapotranspiration modelling for other domains using the atmospheric outputs, particularly impact studies predicting the evolution of future water resources in regions such as the one studied here.
Evapotranspiration values can be expressed in different units. In agronomy and hydrology the term evapotranspiration is often used and is given in mm h−1 or mm d−1. In meteorology the term latent heat flux LE is more often used instead of evapotranspiration and is given in W m−2. However, evapotranspiration and latent heat flux are two ways of looking at the same water vapour flux. The two terms are linked by Eq. (A1) and can be used interchangeably since the latent heat of vaporization of water L is often considered to be constant. Which term is used is more a matter of convention depending on the field, with meteorology tending to use latent heat flux and hydrology and agronomy tending to use evapotranspiration. In the present article the values of evapotranspiration are given both in terms of heat flux in W m−2 and in terms of vapour flux in mm h−1.
where LE is the latent heat flux in W m−2, L is the latent heat of vaporization of water and takes the value 2.26×10⁶ J kg−1, and ET is the evapotranspiration in kg m−2 h−1 or mm h−1.
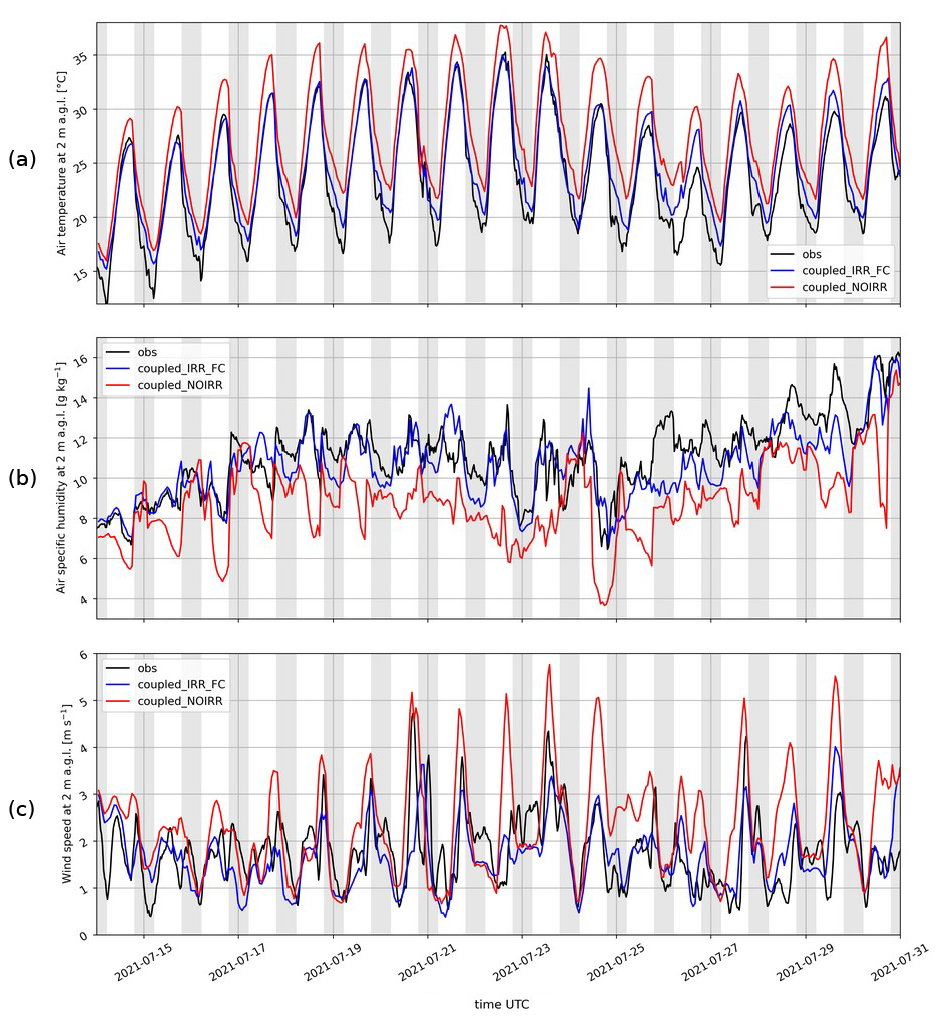
Figure B1Near-surface atmospheric conditions present in the forcing files over the two weeks of the SOP. From top to bottom are the air temperature (a), specific humidity (b), and wind speed (c). The red and blue lines correspond to the output of the surface–atmosphere coupled runs, with and without irrigation, respectively. The black line represents the observed values. Note that the wind speed data has been smoothed using a 2 h moving average to reduce variability and improve readability.
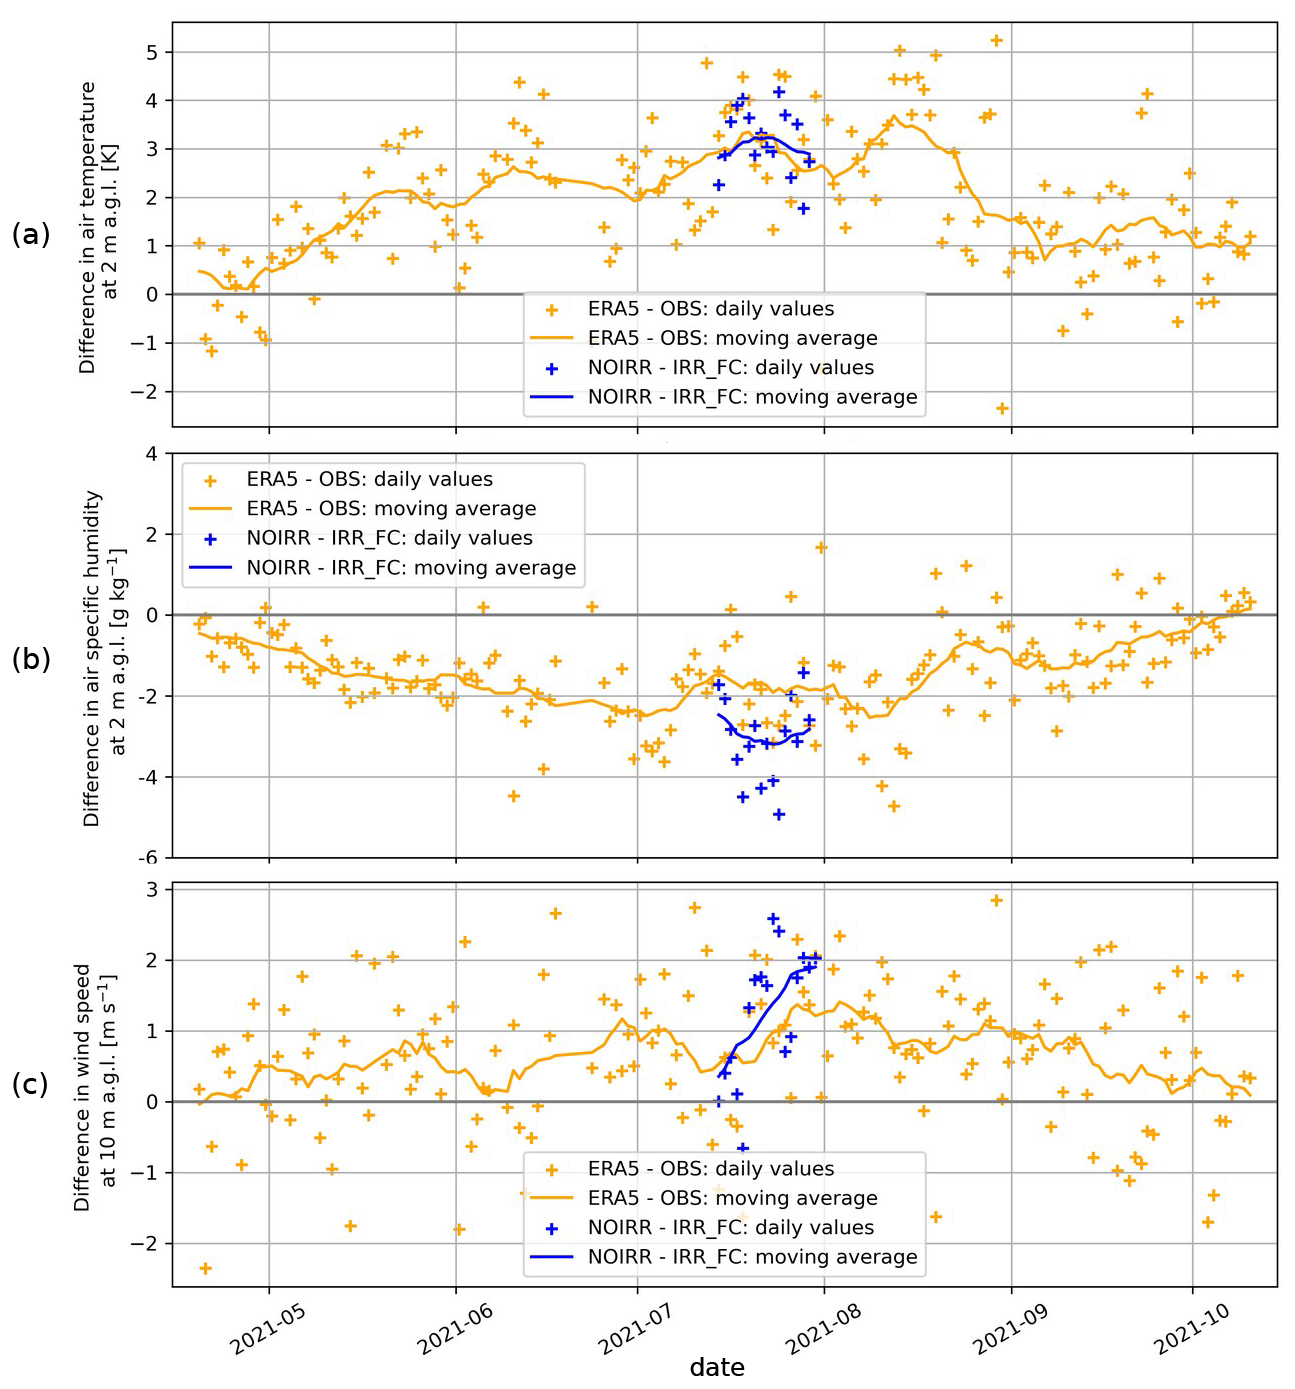
Figure C1Difference of air temperature (a), specific humidity (b), and wind speed (c) at La Cendrosa between data without irrigation effect (simulation NOIRR or ERA5 reanalysis) and data with irrigation effect (simulation IRR_FC or observations). In blue is the difference between the mesoscale simulations NOIRR and IRR_FC, and in yellow is the difference between the ERA5 reanalysis and the observations obtained at La Cendrosa during the LIAISE LOP. The differences shown represent the difference between daytime values only, taken between 8:00 to 16:00 UTC. The crosses represent daily values and the continuous lines represents the moving average considered over two weeks.
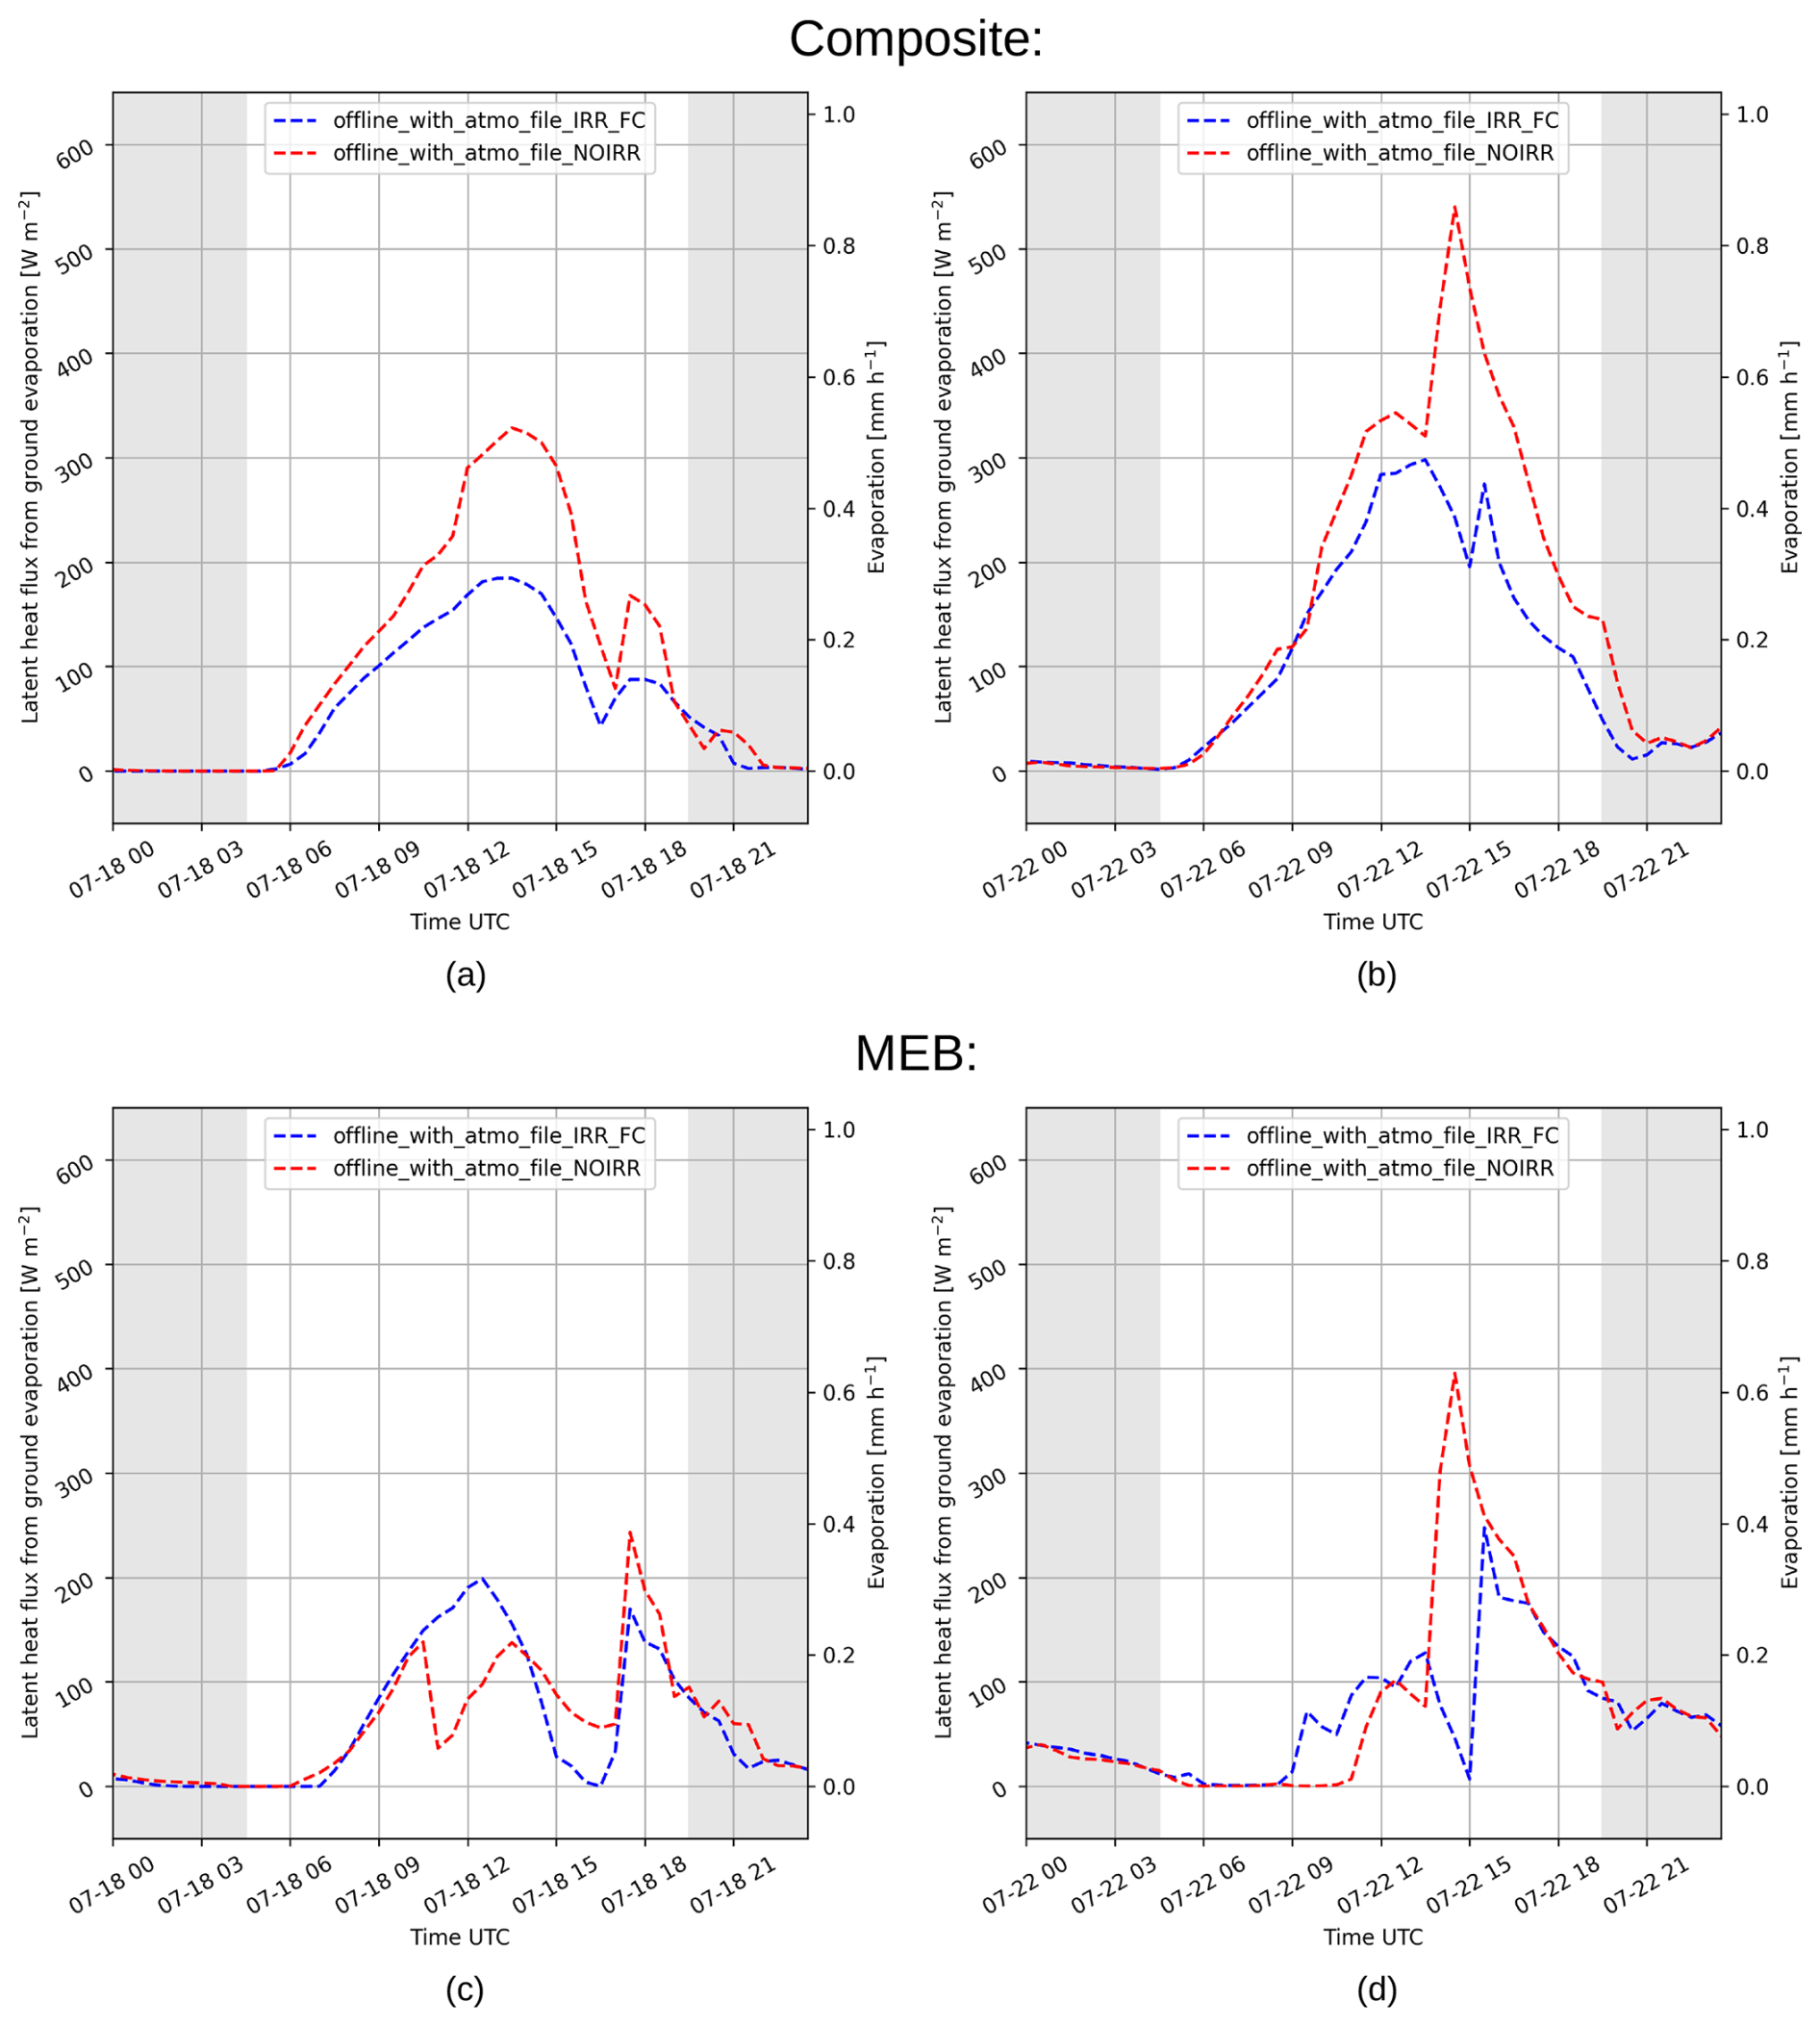
Figure D1Evaporation modelled by ISBA for 18 (a, c) and 22 (b, d) July 2021 over a hypothetical dry parcel (SWI=0.2) located at the IRTA facility. The PFT modelled here corresponds to a drought-tolerant crop, with stomatal conductance modelled by ISBA-A-gs. The vegetation is modelled with a composite approach for the upper panels (a, b) and with the explicit canopy approach (MEB) in the lower panels (c, d).
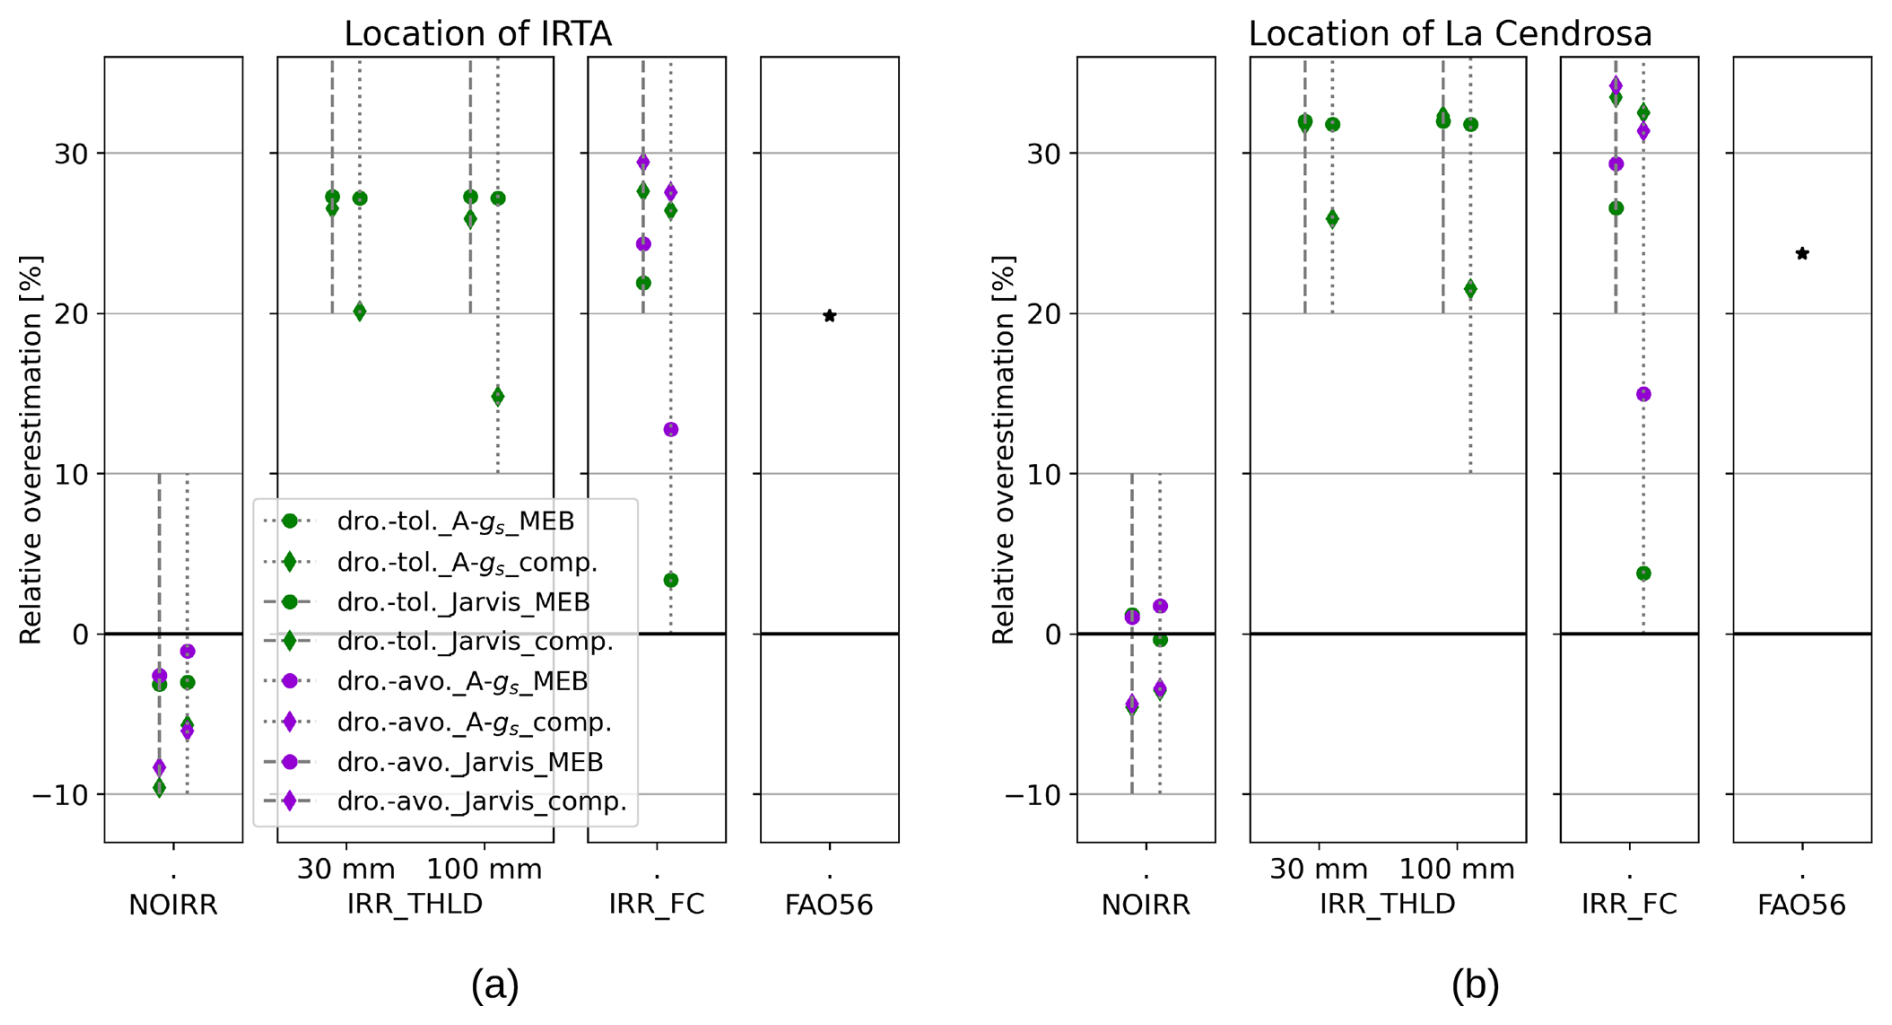
Figure E1Mean relative overestimation of total evapotranspiration due to the hot, dry and windy atmospheric forcing atmo_NOIRR, for different ISBA configurations, different irrigation parameterizations, and two irrigation-induced atmospheric effects of irrigation, namely at La Cendrosa (a) and at the IRTA facility (b). Note that realistic parameterizations IRR_THLD are not applicable to drought-avoiding crops for technical reasons inherent to ISBA as available in SURFEX v8.1.
The observational data sets analyzed in this study are available in the LIAISE database, accessible at https://liaise.aeris-data.fr/page-catalogue/ (last access: 10 August 2026). SURFEX is open-source and available at http://www.umr-cnrm.fr/surfex/ (last access: 10 August 2026). The generated model output data supporting the results of this study are available from the corresponding author upon reasonable request.
T. Lunel performed the simulation, processed the experimental and model data, performed the analysis and wrote the manuscript. B. Martí helped in setting up the simulations and in interpreting the results. A. Boone and P. Le Moigne supervised the research and helped in interpreting the results. All authors discussed the results and commented on the manuscript.
The contact author has declared that none of the authors has any competing interests.
Publisher's note: Copernicus Publications remains neutral with regard to jurisdictional claims made in the text, published maps, institutional affiliations, or any other geographical representation in this paper. The authors bear the ultimate responsibility for providing appropriate place names. Views expressed in the text are those of the authors and do not necessarily reflect the views of the publisher.
The authors would like to gratefully acknowledge Daniel Martinez-Villagrasa and Guylaine Canut and their respective teams for providing observational data from the IRTA and La Cendrosa sites.
This research has been supported by the Agence Nationale de la Recherche, through the HILIAISE project (grant no. ANR-19-CE01-0017).
This paper was edited by Adriaan J. (Ryan) Teuling and reviewed by three anonymous referees.
Allen, R. G., Pereira, L. S., Raes, D., and Smith, M.: Crop evapotranspiration – Guidelines for computing crop water requirements – Irrigation and drainage paper 56, FAO – Food and Agriculture Organization of the United Nations, ISBN 92-5-104219-5, https://www.fao.org/3/X0490E/x0490e00.htm (last access: 10 August 2026), 1998. a, b
Best, M. J., Pryor, M., Clark, D. B., Rooney, G. G., Essery, R. L. H., Ménard, C. B., Edwards, J. M., Hendry, M. A., Porson, A., Gedney, N., Mercado, L. M., Sitch, S., Blyth, E., Boucher, O., Cox, P. M., Grimmond, C. S. B., and Harding, R. J.: The Joint UK Land Environment Simulator (JULES), model description – Part 1: Energy and water fluxes, Geosci. Model Dev., 4, 677–699, https://doi.org/10.5194/gmd-4-677-2011, 2011. a, b
Boone, A., Samuelsson, P., Gollvik, S., Napoly, A., Jarlan, L., Brun, E., and Decharme, B.: The interactions between soil–biosphere–atmosphere land surface model with a multi-energy balance (ISBA-MEB) option in SURFEXv8 – Part 1: Model description, Geosci. Model Dev., 10, 843–872, https://doi.org/10.5194/gmd-10-843-2017, 2017. a, b, c
Boone, A., Bellvert, J., Best, M., Brooke, J. K., Canut-Rocafort, G., Cuxart, J., Hartogensis, O., Moigne, P. L., Miró, J. R., Polcher, J., Price, J., Seguí, P. Q., Bech, J., Bezombes, Y., Branch, O., Cristóbal, J., Dassas, K., Fanise, P., Gibert, F., Goulas, Y., Groh, J., Hanus, J., Hmimina, G., Jarlan, L., Kim, E., Dantec, V. L., Page, M. L., Lohou, F., Lothon, M., Mangan, M. R., Martí, B., Martínez-Villagrasa, D., McGregor, J., Kerr-Munslow, A., Ouaadi, N., Philibert, A., Quiros-Vargas, J., Rascher, U., Siegmann, B., Udina, M., Vial, A., Wrenger, B., Wulfmeyer, V., and Zribi, M.: The Land Surface Interactions with the Atmosphere over the Iberian Semi-Arid Environment (LIAISE) field campaign, Journal of the European Meteorological Society, 2, 100007, https://doi.org/10.1016/j.jemets.2025.100007, 2025. a, b, c
Bouchet, R. J.: Evapotranspiration reelle et potentielle, signification climatique, in: General Assembly Berkeley, Gentbrugge, Belgium, 62, 134–142, 1963. a
Boussetta, S., Balsamo, G., Arduini, G., Dutra, E., McNorton, J., Choulga, M., Agustí-Panareda, A., Beljaars, A., Wedi, N., Munõz-Sabater, J., de Rosnay, P., Sandu, I., Hadade, I., Carver, G., Mazzetti, C., Prudhomme, C., Yamazaki, D., and Zsoter, E.: Ecland: The ecmwf land surface modelling system, Atmosphere, 12, 1–38, https://doi.org/10.3390/atmos12060723, 2021. a
Bravo, M., Mira, T., Soler, M. R., and Cuxart, J.: Intercomparison and evaluation of MM5 and Meso-NH mesoscale models in the stable boundary layer, Bound.-Lay. Meteorol., 128, 77–101, https://doi.org/10.1007/s10546-008-9269-y, 2008. a
Brooke, J. K., Best, M. J., Lock, A. P., Osborne, S. R., Price, J., Cuxart, J., Boone, A., Canut-Rocafort, G., Hartogensis, O. K., and Roy, A.: Irrigation contrasts through the morning transition, Q. J. Roy. Meteor. Soc., 150, 170–194, https://doi.org/10.1002/qj.4590, 2024. a, b, c
Calvet, J.-C.: Investigating soil and atmospheric plant water stress using physiological and micrometeorological data, Agr. Forest Meteorol., 103, 229–247, https://doi.org/10.1016/S0168-1923(00)00130-1, 2000. a
Calvet, J.-C., Noilhan, J., Roujean, J.-L., Bessemoulin, P., Cabelguenne, M., Olioso, A., and Wigneron, J.-P.: An interactive vegetation SVAT model tested against data from six contrasting sites, Agr. Forest Meteorol., 92, 73–95, 1998. a, b, c
Calvet, J.-C., Rivalland, V., Picon-Cochard, C., and Guehl, J. M.: Modelling forest transpiration and CO2 fluxes – Response to soil moisture stress, Agr. Forest Meteorol., 124, 143–156, https://doi.org/10.1016/j.agrformet.2004.01.007, 2004. a, b, c
Canal, N., Calvet, J.-C., Decharme, B., Carrer, D., Lafont, S., and Pigeon, G.: Evaluation of root water uptake in the ISBA-A-gs land surface model using agricultural yield statistics over France, Hydrol. Earth Syst. Sci., 18, 4979–4999, https://doi.org/10.5194/hess-18-4979-2014, 2014. a
Canut, G.: LIAISE_LA-CENDROSA_CNRM_MTO-FLUX-30MIN_L2, LIAISE [data set], https://doi.org/10.25326/320, 2022. a
Centre National de Recherches Météorologiques: User's Guide of SURFEX-v8-1, https://www.umr-cnrm.fr/surfex/ (last access: 10 August 2026), 2020. a, b
Cook, B. I., Shukla, S. P., Puma, M. J., and Nazarenko, L. S.: Irrigation as an historical climate forcing, Clim. Dynam., 44, 1715–1730, https://doi.org/10.1007/s00382-014-2204-7, 2015. a, b
Cosby, B. J., Hornberger, G. M., Clapp, R. B., and Ginn, T. R.: A Statistical Exploration of the Relationships of Soil Moisture Characteristics to the Physical Properties of Soils, Water Resour. Res., 20, 682–690, https://doi.org/10.1029/WR020i006p00682, 1984. a
Decharme, B., Boone, A., Delire, C., and Noilhan, J.: Local evaluation of the Interaction between Soil Biosphere Atmosphere soil multilayer diffusion scheme using four pedotransfer functions, J. Geophys. Res.-Atmos., 116, 1–29, https://doi.org/10.1029/2011JD016002, 2011. a, b
Decharme, B., Martin, E., and Faroux, S.: Reconciling soil thermal and hydrological lower boundary conditions in land surface models, J. Geophys. Res.-Atmos., 118, 7819–7834, https://doi.org/10.1002/jgrd.50631, 2013. a, b
Decker, M., Ma, S., and Pitman, A.: Local land-atmosphere feedbacks limit irrigation demand, Environ. Res. Lett., 12, https://doi.org/10.1088/1748-9326/aa65a6, 2017. a, b, c
European Centre for Medium-Range Weather Forecasts: Integrated Forecasting System (IFS) documentation: Part IV – Physical Processes, Tech. Rep. May, European Centre for Medium-Range Weather Forecasts, https://www.ecmwf.int/sites/default/files/elibrary/2015/9211-part-iv-physical-processes.pdf (last access: 10 August 2026), 2015. a, b
Faroux, S., Kaptué Tchuenté, A. T., Roujean, J.-L., Masson, V., Martin, E., and Le Moigne, P.: ECOCLIMAP-II/Europe: a twofold database of ecosystems and surface parameters at 1 km resolution based on satellite information for use in land surface, meteorological and climate models, Geosci. Model Dev., 6, 563–582, https://doi.org/10.5194/gmd-6-563-2013, 2013. a
Gavilán, P., Berengena, J., and Allen, R. G.: Measuring versus estimating net radiation and soil heat flux: Impact on Penman–Monteith reference ET estimates in semiarid regions, Agricultural Water Management, 89, 275–286, https://doi.org/10.1016/j.agwat.2007.01.014, 2007. a
Giard, D. and Bazile, E.: Implementation of a new assimilation scheme for soil and surface variables in a global NWP model, Mon. Weather Rev., 128, 997–1015, https://doi.org/10.1175/1520-0493(2000)128<0997:IOANAS>2.0.CO;2, 2000. a
González-Armas, R., Vilà-Guerau de Arellano, J., Mangan, M. R., Hartogensis, O., and de Boer, H.: Impact of canopy environmental variables on the diurnal dynamics of water and carbon dioxide exchange at leaf and canopy level, Biogeosciences, 21, 2425–2445, https://doi.org/10.5194/bg-21-2425-2024, 2024. a, b, c, d, e, f
Gorguner, M. and Kavvas, M. L.: Modeling impacts of future climate change on reservoir storages and irrigation water demands in a Mediterranean basin, Sci. Total Environ., 748, 1–20, https://doi.org/10.1016/j.scitotenv.2020.141246, 2020. a
Henderson-Sellers, A., Yang, Z.-L., and Dickinson, R. E.: The Project for Intercomparison of Land-surface Parameterization Schemes, B. Am. Meteorol. Soc., 74, 1335–1350, https://doi.org/10.1175/1520-0477(1993)074<1335:TPFIOL>2.0.CO;2, 1993. a
Hersbach, H., Bell, B., Berrisford, P., Hirahara, S., Horányi, A., Muñoz-Sabater, J., Nicolas, J., Peubey, C., Radu, R., Schepers, D., Simmons, A., Soci, C., Abdalla, S., Abellan, X., Balsamo, G., Bechtold, P., Biavati, G., Bidlot, J., Bonavita, M., De Chiara, G., Dahlgren, P., Dee, D., Diamantakis, M., Dragani, R., Flemming, J., Forbes, R., Fuentes, M., Geer, A., Haimberger, L., Healy, S., Hogan, R. J., Hólm, E., Janisková, M., Keeley, S., Laloyaux, P., Lopez, P., Lupu, C., Radnoti, G., De Rosnay, P., Rozum, I., Vamborg, F., Villaume, S., and Thépaut, J.: The ERA5 global reanalysis, Q. J. Roy. Meteor. Soc., 146, 1999–2049, https://doi.org/10.1002/qj.3803, 2020. a
Holtslag, A. A., Svensson, G., Baas, P., Basu, S., Beare, B., Beljaars, A. C., Bosveld, F. C., Cuxart, J., Lindvall, J., Steeneveld, G. J., Tjernström, M., and Van De Wiel, B. J.: Stable atmospheric boundary layers and diurnal cycles: Challenges for weather and climate models, B. Am. Meteorol. Soc., 94, 1691–1706, https://doi.org/10.1175/BAMS-D-11-00187.1, 2013. a
Jackson, R. B., Canadell, J., Ehleringer, J. R., Mooney, H. A., Sala, O. E., and Schulze, E. D.: A global analysis of root distributions for terrestrial biomes, Oecologia, 108, 389–411, https://doi.org/10.1007/BF00333714, 1996. a
Jacobs, A. F. and Van Boxel, J. H.: Changes of the displacement height and roughness length of maize during a growing season, Agr. Forest Meteorol., 42, 53–62, https://doi.org/10.1016/0168-1923(88)90066-4, 1988. a, b
Jacobs, C. M., Van Den Hurk, B. J., and De Bruin, H. A.: Stomatal behaviour and photosynthetic rate of unstressed grapevines in semi-arid conditions, Agr. Forest Meteorol., 80, 111–134, https://doi.org/10.1016/0168-1923(95)02295-3, 1996. a, b, c
Jarvis, P. G.: The interpretation of the variations in leaf water potential and stomatal conductance found in canopies in the field, Philos. T. Roy. Soc. B, 273, 593–610, https://doi.org/10.1098/rstb.1976.0035, 1976. a, b
Jiménez, M. A., Cuxart, J., Boone, A. A., Le Moigne, P., Lunel, T., Mercader, J., Miró, J. R., Best, M., and Brooke, J. K.: Land‐surface interactions with the atmosphere over the Iberian Semi‐arid Environment (LIAISE): First mesoscale modelling intercomparison, Q. J. Roy. Meteor. Soc., 151, e4949, https://doi.org/10.1002/qj.4949, 2025. a
Jochum, M. A. O., de Bruin, H. A., Holtslag, A. A., and Belmonte, A. C.: Area-averaged surface fluxes in a semiarid region with partly irrigated land: Lessons learned from EFEDA, J. Appl. Meteorol. Clim., 45, 856–874, https://doi.org/10.1175/JAM2365.1, 2006. a
Kawase, H., Yoshikane, T., Hara, M., Kimura, F., Sato, T., and Ohsawa, S.: Impact of extensive irrigation on the formation of cumulus clouds, Geophys. Res. Lett., 35, 1–6, https://doi.org/10.1029/2007GL032435, 2008. a
Kueppers, L. M., Snyder, M. A., and Sloan, L. C.: Irrigation cooling effect: Regional climate forcing by land-use change, Geophys. Res. Lett., 34, https://doi.org/10.1029/2006GL028679, 2007. a
Lawston, P. M., Santanello, J. A., Zaitchik, B. F., and Rodell, M.: Impact of irrigation methods on land surface model spinup and initialization of WRF forecasts, J. Hydrometeorol., 16, 1135–1154, https://doi.org/10.1175/JHM-D-14-0203.1, 2015. a
Lawston, P. M., Santanello, J. A., Hanson, B., and Arsensault, K.: Impacts of irrigation on summertime temperatures in the pacific northwest, Earth Interact., 24, https://doi.org/10.1175/EI-D-19-0015.1, 2020. a, b
Le Moigne, P., Albergel, C., Boone, A., Belamari, S., Decharme, B., Dumont, M., Masson, V., Brun, E., Calvet, J.-C., Giordani, H., Lafont, S., Morin, S., and Vionnet, V.: SURFEX Scientific Documentation, issue no. 3, http://www.cnrm.meteo.fr/surfex/IMG/pdf/surfex_scidoc_v2.pdf (last access: 10 August 2026), 2018. a, b, c
Le Moigne, P., Besson, F., Martin, E., Boé, J., Boone, A., Decharme, B., Etchevers, P., Faroux, S., Habets, F., Lafaysse, M., Leroux, D., and Rousset-Regimbeau, F.: The latest improvements with SURFEX v8.0 of the Safran–Isba–Modcou hydrometeorological model for France, Geosci. Model Dev., 13, 3925–3946, https://doi.org/10.5194/gmd-13-3925-2020, 2020. a
Lemaitre-Basset, T., Oudin, L., and Thirel, G.: Evapotranspiration in hydrological models under rising CO, Climate Change, https://doi.org/10.1007/s10584-022-03384-1, 2022. a
Liu, G., Wang, W., Shao, Q., Wei, J., Zheng, J., Liu, B., and Chen, Z.: Simulating the Climatic Effects of Irrigation Over China by Using the WRF-Noah Model System With Mosaic Approach, J. Geophys. Res.-Atmos., 126, https://doi.org/10.1029/2020JD034428, 2021. a
Lobell, D., Bala, G., Mirin, A., Phillips, T., Maxwell, R., and Rotman, D.: Regional Differences in the Influence of Irrigation on Climate, J. Climate, 2248–2255, https://doi.org/10.1175/2008JCLI2703.1, 2008. a, b, c
Lunel, T., Boone, A. A., and Moigne, P. L.: Irrigation Strongly Influences Near-Surface Conditions and Induces Breeze Circulation: Observational and Model-Based Evidence, Q. J. Roy. Meteor. Soc., https://doi.org/10.1002/qj.4736, 2024a. a, b, c, d, e, f, g, h, i, j, k, l, m, n
Lunel, T., Jimenez, M. A., Cuxart, J., Martinez-Villagrasa, D., Boone, A., and Le Moigne, P.: The marinada fall wind in the eastern Ebro sub-basin: physical mechanisms and role of the sea, orography and irrigation, Atmos. Chem. Phys., 24, 7637–7666, https://doi.org/10.5194/acp-24-7637-2024, 2024b. a, b, c, d, e, f, g, h, i, j, k
Mangan, M. R., Hartogensis, O., van Heerwaarden, C., and Vilà-Guerau de Arellano, J.: Evapotranspiration controls across spatial scales of heterogeneity, Q. J. Roy. Meteor. Soc., 149, 2696–2718, https://doi.org/10.1002/qj.4527, 2023. a, b, c, d, e
Martínez-Villagrasa, D., Martí, B., Cuxart, J., and Wrenger, B.: LIAISE_IRTA-CORN_UIB_SEB-10MIN_L2, LIAISE [data set], https://doi.org/10.25326/344, 2022. a
Masson, V., Le Moigne, P., Martin, E., Faroux, S., Alias, A., Alkama, R., Belamari, S., Barbu, A., Boone, A., Bouyssel, F., Brousseau, P., Brun, E., Calvet, J.-C., Carrer, D., Decharme, B., Delire, C., Donier, S., Essaouini, K., Gibelin, A.-L., Giordani, H., Habets, F., Jidane, M., Kerdraon, G., Kourzeneva, E., Lafaysse, M., Lafont, S., Lebeaupin Brossier, C., Lemonsu, A., Mahfouf, J.-F., Marguinaud, P., Mokhtari, M., Morin, S., Pigeon, G., Salgado, R., Seity, Y., Taillefer, F., Tanguy, G., Tulet, P., Vincendon, B., Vionnet, V., and Voldoire, A.: The SURFEXv7.2 land and ocean surface platform for coupled or offline simulation of earth surface variables and fluxes, Geosci. Model Dev., 6, 929–960, https://doi.org/10.5194/gmd-6-929-2013, 2013. a
Mcdermid, S., Nocco, M., Lawston-Parker, P., Keune, J., Pokhrel, Y., and Jain, M.: Irrigation in the Earth system, Nature Review Earth and Environment, https://doi.org/10.1038/s43017-023-00438-5, 2023. a, b
Napoly, A.: Apport de paramétrisations avancées des processus liés à la végétation dans les modèles de surface pour la simulation des flux atmosphériques et hydrologiques, PhD thesis, Institut National Polytechnique de Toulouse, https://doi.org/10.70675/6ddc0389z268fz4eb1z83e7zcb1beb20cced, 2016. a, b, c, d
Napoly, A., Boone, A., Samuelsson, P., Gollvik, S., Martin, E., Seferian, R., Carrer, D., Decharme, B., and Jarlan, L.: The interactions between soil–biosphere–atmosphere (ISBA) land surface model multi-energy balance (MEB) option in SURFEXv8 – Part 2: Introduction of a litter formulation and model evaluation for local-scale forest sites, Geosci. Model Dev., 10, 1621–1644, https://doi.org/10.5194/gmd-10-1621-2017, 2017. a, b
Nechifor, V. and Winning, M.: Global crop output and irrigation water requirements under a changing climate, Heliyon, 5, e01266, https://doi.org/10.1016/j.heliyon.2019.e01266, 2019. a
Niu, G. Y., Yang, Z. L., Mitchell, K. E., Chen, F., Ek, M. B., Barlage, M., Kumar, A., Manning, K., Niyogi, D., Rosero, E., Tewari, M., and Xia, Y.: The community Noah land surface model with multiparameterization options (Noah-MP): 1. Model description and evaluation with local-scale measurements, J. Geophys. Res.-Atmos., 116, 1–19, https://doi.org/10.1029/2010JD015139, 2011. a
Noilhan, J. and Mahfouf, J.-F.: The ISBA land surface parameterisation scheme, Global Planet. Change, 13, 145–159, 1996. a
Noilhan, J. and Planton, S.: A Simple Parameterization of Land Surface Processes for Meteorological Models, American Meteorological Society, https://doi.org/10.1016/0921-8181(95)00043-7, 1989. a, b, c, d, e, f
Oliver, R. J., Mercado, L. M., Clark, D. B., Huntingford, C., Taylor, C. M., Vidale, P. L., McGuire, P. C., Todt, M., Folwell, S., Shamsudheen Semeena, V., and Medlyn, B. E.: Improved representation of plant physiology in the JULES-vn5.6 land surface model: photosynthesis, stomatal conductance and thermal acclimation, Geosci. Model Dev., 15, 5567–5592, https://doi.org/10.5194/gmd-15-5567-2022, 2022. a
Otsuki, K., Kamichika, M., and Kimura, R.: Relationships between the Zero-plane Displacement and the Roughness Length over Sorghum and Alfalfa Canopies, J. Agric. Meteorol., 55, 15–24, https://doi.org/10.2480/agrmet.55.15, 1999. a, b, c
Oudin, L.: Recherche d'un modèle d'évapotranspiration potentielle pertinent comme entrée d'un modèle pluie-débit global, PhD thesis, Ecole Nationale du Génie Rural, des Eaux et Forêts, HAL-ID nb pastel-00000931, 2005. a
Ozdogan, M. and Salvucci, G. D.: Irrigation‐induced changes in potential evapotranspiration in southeastern Turkey: Test and application of Bouchet's complementary hypothesis, Water Resour. Res., 40, 2003WR002822, https://doi.org/10.1029/2003WR002822, 2004. a
Phillips, C. E., Nair, U. S., Mahmood, R., Rappin, E., and Pielke, R. A.: Influence of Irrigation on Diurnal Mesoscale Circulations: Results from GRAINEX, Geophys. Res. Lett., 1–12, https://doi.org/10.1029/2021gl096822, 2022. a
Qian, Y., Yang, Z., Feng, Z., Liu, Y., Gustafson, W. I., Berg, L. K., Huang, M., Yang, B., and Ma, H.-Y.: Neglecting irrigation contributes to the simulated summertime warm-and-dry bias in the central United States, npj Climate and Atmospheric Science, 3, 31, https://doi.org/10.1038/s41612-020-00135-w, 2020. a, b
Rosenberg, N. J., Brown, R. A., Izaurralde, R. C., and Thomson, A. M.: Integrated assessment of Hadley Centre (HadCM2) climate change projections on agricultural productivity and irrigation water supply in the conterminous United States I. Climate change scenarios and impacts on irrigation water supply simulated with the HUMUS model, Agr. Forest Meteorol., 117, 73–96, https://doi.org/10.1016/S0168-1923(03)00025-X, 2003. a
Segal, M., Schreiber, W. E., Kallos, G., Garratt, J. R., Rodi, A., Weaver, J., and Pielke, R. A.: The Impact of Crop Areas in Northeast Colorado on Midsummer Mesoscale Thermal Circulations, Mon. Weather Rev., https://doi.org/10.1175/1520-0493(1989)117<0809:TIOCAI>2.0.CO;2, 1989. a
Seity, Y., Malardel, S., Hello, G., Bénard, P., Bouttier, F., Lac, C., and Masson, V.: The AROME-France convective-scale operational model, Mon. Weather Rev., 139, 976–991, https://doi.org/10.1175/2010MWR3425.1, 2011. a
Shrestha, P., Kurtz, W., Vogel, G., Schulz, J. P., Sulis, M., Hendricks Franssen, H. J., Kollet, S., and Simmer, C.: Connection Between Root Zone Soil Moisture and Surface Energy Flux Partitioning Using Modeling, Observations, and Data Assimilation for a Temperate Grassland Site in Germany, J. Geophys. Res.-Biogeo., 123, 2839–2862, https://doi.org/10.1029/2016JG003753, 2018. a
Sorooshian, S., Li, J., Hsu, K.-l., and Gao, X.: How significant is the impact of irrigation on the local hydroclimate in California's Central Valley? Comparison of model results with ground and remote-sensing data, J. Geophys. Res.-Atmos., 116, https://doi.org/10.1029/2010JD014775, 2011. a, b, c, d
Sridhar, V.: Tracking the Influence of Irrigation on Land Surface Fluxes and Boundary Layer Climatology, Journal of Contemporary Water Research and Education, 152, 79–93, https://doi.org/10.1111/j.1936-704x.2013.03170.x, 2013. a, b, c
Szilagyi, J.: Temperature corrections in the Priestley–Taylor equation of evaporation, J. Hydrol., 519, 455–464, https://doi.org/10.1016/j.jhydrol.2014.07.040, 2014. a
Szilagyi, J., Crago, R., and Qualls, R.: A calibration‐free formulation of the complementary relationship of evaporation for continental‐scale hydrology, J. Geophys. Res.-Atmos., 122, 264–278, https://doi.org/10.1002/2016JD025611, 2017. a, b
Tuinenburg, O. A. and de Vries, J.: Irrigation Patterns Resemble ERA-Interim Reanalysis Soil Moisture Additions, Geophys. Res. Lett., 44, 10341–10348, https://doi.org/10.1002/2017GL074884, 2017. a, b
Udina, M., Bech, J., Peinó, E., Valmassoi, A., and Boone, A.: Irrigation impact on boundary layer and precipitation characteristics in WRF model during LIAISE-2021, Q. J. Roy. Meteor. Soc., 1–25, https://doi.org/10.1002/qj.4756, 2024. a, b
Ulmer, L., Margairaz, F., Bailey, B. N., Mahaffee, W. F., Pardyjak, E. R., and Stoll, R.: A fast-response, wind angle-sensitive model for predicting mean winds in row-organized canopies, Agr. Forest Meteorol., 329, 109273, https://doi.org/10.1016/j.agrformet.2022.109273, 2023. a, b, c
Valmassoi, A., Dudhia, J., Di Sabatino, S., and Pilla, F.: Regional climate impacts of irrigation in northern Italy using a high resolution model, Atmosphere, 11, 1–20, https://doi.org/10.3390/ATMOS11010072, 2020. a
Vidal, J. P., Martin, E., Franchistéguy, L., Baillon, M., and Soubeyroux, J. M.: A 50-year high-resolution atmospheric reanalysis over France with the Safran system, I. J. Climatol., 30, 1627–1644, https://doi.org/10.1002/joc.2003, 2010. a
Vilà-Guerau De Arellano, J., van Heerwaarden, C. C., van Stratum, B. J. H., and van den Dries, K.: Atmospheric boundary layer: Integrating air chemistry and land interactions, Cambridge University Press, ISBN 1316300277, https://doi.org/10.1017/CBO9781316117422, 2015. a
Woznicki, S. A., Nejadhashemi, A. P., and Parsinejad, M.: Climate change and irrigation demand: Uncertainty and adaptation, J. Hydrol., 3, 247–264, https://doi.org/10.1016/j.ejrh.2014.12.003, 2015. a
Wu, J., Zha, J., Zhao, D., and Yang, Q.: Changes in terrestrial near-surface wind speed and their possible causes: an overview, Clim. Dynam., 51, 2039–2078, https://doi.org/10.1007/s00382-017-3997-y, 2018a. a, b
Wu, L., Feng, J., and Miao, W.: Simulating the Impacts of Irrigation and Dynamic Vegetation Over the North China Plain on Regional Climate, J. Geophys. Res.-Atmos., 123, 8017–8034, https://doi.org/10.1029/2017JD027784, 2018b. a
Yao, Y., Aas, K. S., Arboleda Obando, P., Bentsen, M., Chen, L., Cook, B., Devaraju, N., Ducharne, A., Gosling, S., Hartley, A., Jägermeyr, J., Jones, C., Kim, H., Lawrence, D., Lawrence, P., Leung, R., Lo, M.-H., and McDermid, S. and the IRRMIP members: Irrigation-expansion-induced impacts model-intercomparison project (IRRMIP), EGU General Assembly 2023, Vienna, Austria, 23–28 Apr 2023, EGU23-14584, https://doi.org/10.5194/egusphere-egu23-14584, 2023. a
- Abstract
- Highlights
- Introduction
- Materials and Methods
- Results
- Discussion and conclusions
- Appendix A: Evapotranspiration units
- Appendix B: Full timeseries of atmospheric forcing
- Appendix C: Representativeness of LIAISE Special Observation Period
- Appendix D: Soil evaporation behaviour
- Appendix E: Mean relative overestimation across LSM configurations detailled
- Code and data availability
- Author contributions
- Competing interests
- Disclaimer
- Acknowledgements
- Financial support
- Review statement
- References
- Abstract
- Highlights
- Introduction
- Materials and Methods
- Results
- Discussion and conclusions
- Appendix A: Evapotranspiration units
- Appendix B: Full timeseries of atmospheric forcing
- Appendix C: Representativeness of LIAISE Special Observation Period
- Appendix D: Soil evaporation behaviour
- Appendix E: Mean relative overestimation across LSM configurations detailled
- Code and data availability
- Author contributions
- Competing interests
- Disclaimer
- Acknowledgements
- Financial support
- Review statement
- References