
the Creative Commons Attribution 4.0 License.
the Creative Commons Attribution 4.0 License.
 | 10 Aug 2026
Technical note: Water vapor sampling for stable isotope analysis: systematic testing of sampling conditions and development of a robust protocol
Alberto Iraheta
Elise Malsch-Fröhlich
Malkin Gerchow
Matthias Beyer
Ecohydrological water isotope studies often rely on destructive sampling of soils and plants. Recently, techniques for collecting equilibrated water vapor were developed as alternative. Here, we present a systematic evaluation of water vapor sampling methods with the goal of identifying how key parameters influence δ18O and δ2H values. In controlled laboratory experiments we first tested the isotopic stability of three container types: 250 mL infusion glass bottles, 1 L FlexFoil sample bags, and 500 mL Aluminum-zip bags. The most suitable container was subsequently tested for different storage times (6 h to 7 d), storage temperatures (4 to 40 °C) and sampling flow rates (35 to 125 mL min−1). The 250 mL infusion glass bottles showed the best performance, with deviations to reference standards of ±0.5 ‰ for δ18O and ±1 ‰ for δ2H followed by FlexFoil sample bags (deviations of ±1 ‰ for δ18O and −3 ‰ to +2 ‰ for δ2H). Aluminum bags showed the largest deviations (−2.5 ‰ to −3 ‰ for δ18O and −12 ‰ to −25 ‰ for δ2H). Further extensive testing of the most suitable container type – the infusion glass bottles – revealed that the Mean Absolute Error (MAE) for δ18O remained stable under all tested conditions (<0.6 ‰). For δ2H, best results were obtained using flow rates of 100–125 mL min−1, and storage times of ≤1 d under ambient conditions (20–25 °C) (MAE for δ18O and ±1.5 ‰ for δ2H); hence, our recommendation is using these settings. Although vapor sampling cannot match the analytical precision of conventional methods, it offers a practical, inexpensive framework. The protocol enables reliable water vapor isotope measurements and is especially advantageous in remote areas or locations with limited infrastructure. Therefore, it has great potential for investigating ecohydrological processes in a customizable spatiotemporal resolution without the need of repeated destructive sampling or full in situ setups.
- Article
(2571 KB) - Full-text XML
-
Supplement
(684 KB) - BibTeX
- EndNote


The water stable isotopes oxygen-18 (δ18O) and deuterium (δ2H) are fundamental to advances in modern ecohydrology (Sprenger et al., 2016), as they allow the tracing of water through precipitation, soil, plants, surface water and groundwater in different environments (Zhang et al., 2022; Tetzlaff et al., 2023). Therefore, they were heavily employed as tools to understand hydrological processes in forested and agricultural systems (Haberstroh et al., 2024), studies of exchanges between water, plants, and the atmosphere (Dubbert and Werner, 2019; Allen and Kirchner, 2022; Liebhard, 2022), tracing of water sources and their redistribution in ecosystems (Beyer et al., 2020; Rothfuss et al., 2021; Penna et al., 2018).
The need to generate continuous data sets has been identified repeatedly, as high-resolution time series can capture the natural dynamics of ecohydrological and physiological processes (Simonin et al., 2013; Gaj et al., 2016; Seeger and Weiler, 2023). Established methods provide limited temporal information and often rely on destructive sampling of soil and plant xylem, where water needs to be extracted with methods such as e.g., cryogenic vacuum extraction or centrifugation (Orlowski et al., 2018; Kübert et al., 2020). Extraction techniques for water isotope analysis have recently been increasingly questioned due to its potential impact on the isotope composition of soil and plant water, particularly for deuterium (Chen et al., 2020; Allen and Kirchner, 2022; Wen et al., 2022; Ceperley et al., 2024). Despite these limitations, extraction techniques continue to be widely used in studies to monitor hydrological processes in ecosystems (Barbeta et al., 2022; Koeniger et al., 2011).
To obtain continuous data, the scientific community developed in situ approaches using laser spectroscopy to enable direct measurements of water stable isotopes in soils and plants under field conditions (Kühnhammer et al., 2022; Mennekes et al., 2021). Although highly valuable for ecohydrological research, this approach involves logistical, technical, and financial challenges constraining its widespread deployment (Rothfuss and Javaux, 2017; Volkmann et al., 2016). In this context, field-equilibrated water vapor sampling emerges as a valuable alternative for obtaining temporally higher-resolution water isotope data without the need for destructive sampling (Magh et al., 2022; Gralher et al., 2021; Kübert et al., 2020; Galewsky et al., 2016). Water vapor sampling refers to the collection of water vapor that is in isotopic equilibrium with the media to be analyzed (i.e., plant xylem, soil, or liquid water) and subsequent analysis in the laboratory. In simple terms, instead of using a true in situ water isotope setup, the water vapor is stored in suitable sampling vessels in place of being sent to the laser spectrometer directly. Water vapor sampling is more flexible (not limited to a small number of trees compared to true in situ), cheaper (no isotope analyzer required in the field), and better suited to remote sites (less equipment required); it allows repeated sampling of soils and trees at the desired frequency without destructive sampling, avoids liquid water extraction in the laboratory, and does not require an isotope analyzer in the field (Havranek et al., 2020). Recent studies have explored different methods for water vapor sampling and developed strategies that allow the collection and storage of water vapor while conserving its isotopic signature (Diekmann et al., 2025). Magh et al. (2022) developed the Vapor Storage Vial System (VSVS) The system was evaluated by storing samples between 0 to 14 d with variations of 0.6 ‰ to 4.4 ‰ for δ2H and 0.6 ‰ to 0.8 ‰ for δ18O after storage. Havranek et al. (2023) implemented and evaluated an automated method, the Soil Water Isotope Storage System (SWISS), which combines several components such as permeable probes, glass flasks, stainless steel tubes and switching valves. This system allows automated sampling and storage of equilibrated vapor for later laboratory analysis. The authors reported a precision of ±0.9 ‰ for δ18O and ±3.7 ‰ for δ2H after up to 14 d of storage. Herbstritt et al. (2023) developed a sampling technique based on inflatable bags with diffusion-tight seals and found variations of 0.4 ‰ for δ18O and 1.9 ‰ for δ2H. Dahlmann et al. (2025) established system for water vapor extraction using permeable membranes and special gas bags (Multi-Layer Foil Bags with stainless steel fitting, Sense Trading B.V., Netherlands) for storage. They also tested the possibility of reusing containers and reported relatively small variations after 24 h of storage, with values between 0.7 ‰ and ±2.3 ‰ for δ2H and 0.2 ‰ to 0.9 ‰ for δ18O.
Although these studies represent important methodological advances, none of them provides a technical, practical, and comprehensive sampling protocol identifying ideal sampling materials and procedures as well as storage and analysis conditions. For instance, Dahlmann et al. (2025) and Herbstritt et al. (2023) use bags for collecting water vapor; Magh (2022) and Havranek (2023) utilize glass vials. The differences in the employment, reusability and performance under equal conditions have never been studied; neither the practical implications have.
In this study, we carry out a systematic test of sampling vessels for water vapor storage and analysis as well as an investigation of crucial parameters of the entire sampling-to-analysis workflow (e.g., sampling flow rate to ensure isotopic equilibrium, storage temperatures, maximum storage times).
The objectives of this research are therefore:
- i.
To carry out a systematic laboratory experiments to evaluate the effects of storage time, temperature, and container type on the stability water vapor isotope values.
- ii.
To develop and test a practical, minimally invasive, and efficient method for collecting water vapor samples for application in various environments.
- iii.
To identify optimal conditions for water vapor sampling, storage, and analysis.
The novelty of this contribution lies in the integrated evaluation of factors that affect its isotopic composition. The systematic analysis provided herein will enable a wider, more unified, and tailor-made application of water vapor sampling methods to the specific research environment and objectives.
This section describes the experimental procedures and the tests carried out. The detailed list of materials, instruments and equipment used in the experiments can be found in Sect. S1 in the Supplement.
2.1 Experimental design
To determine the optimal sampling method for analyzing isotopes in water vapor, several experiments were conducted in the laboratory, as shown in Fig. 1. The study consisted of two consecutive phases. In phase 1, we tested different storage containers in two experiments (referred to as experiments 1 and 2). We evaluated three sample storage containers: 250 mL infusion glass bottles, 500 mL Aluminum-zip bags, and 1 L FlexFoil sample bags. In experiment 1, we filled these containers with dry air and stored them at three temperatures (4, 20–25, and 40 °C) for three storage times before measurement (6 h, 1 d, and 3 d) to evaluate hermeticity (the leak-tightness of the containers). In experiment 2, we used isotopic reference standards and filled the containers with equilibrated water vapor, then repeated the procedure from experiment 1 to assess isotopic stability. For the final selection of the most suitable sampling container for water vapor analysis, we defined six decision criteria (Fig. 1).
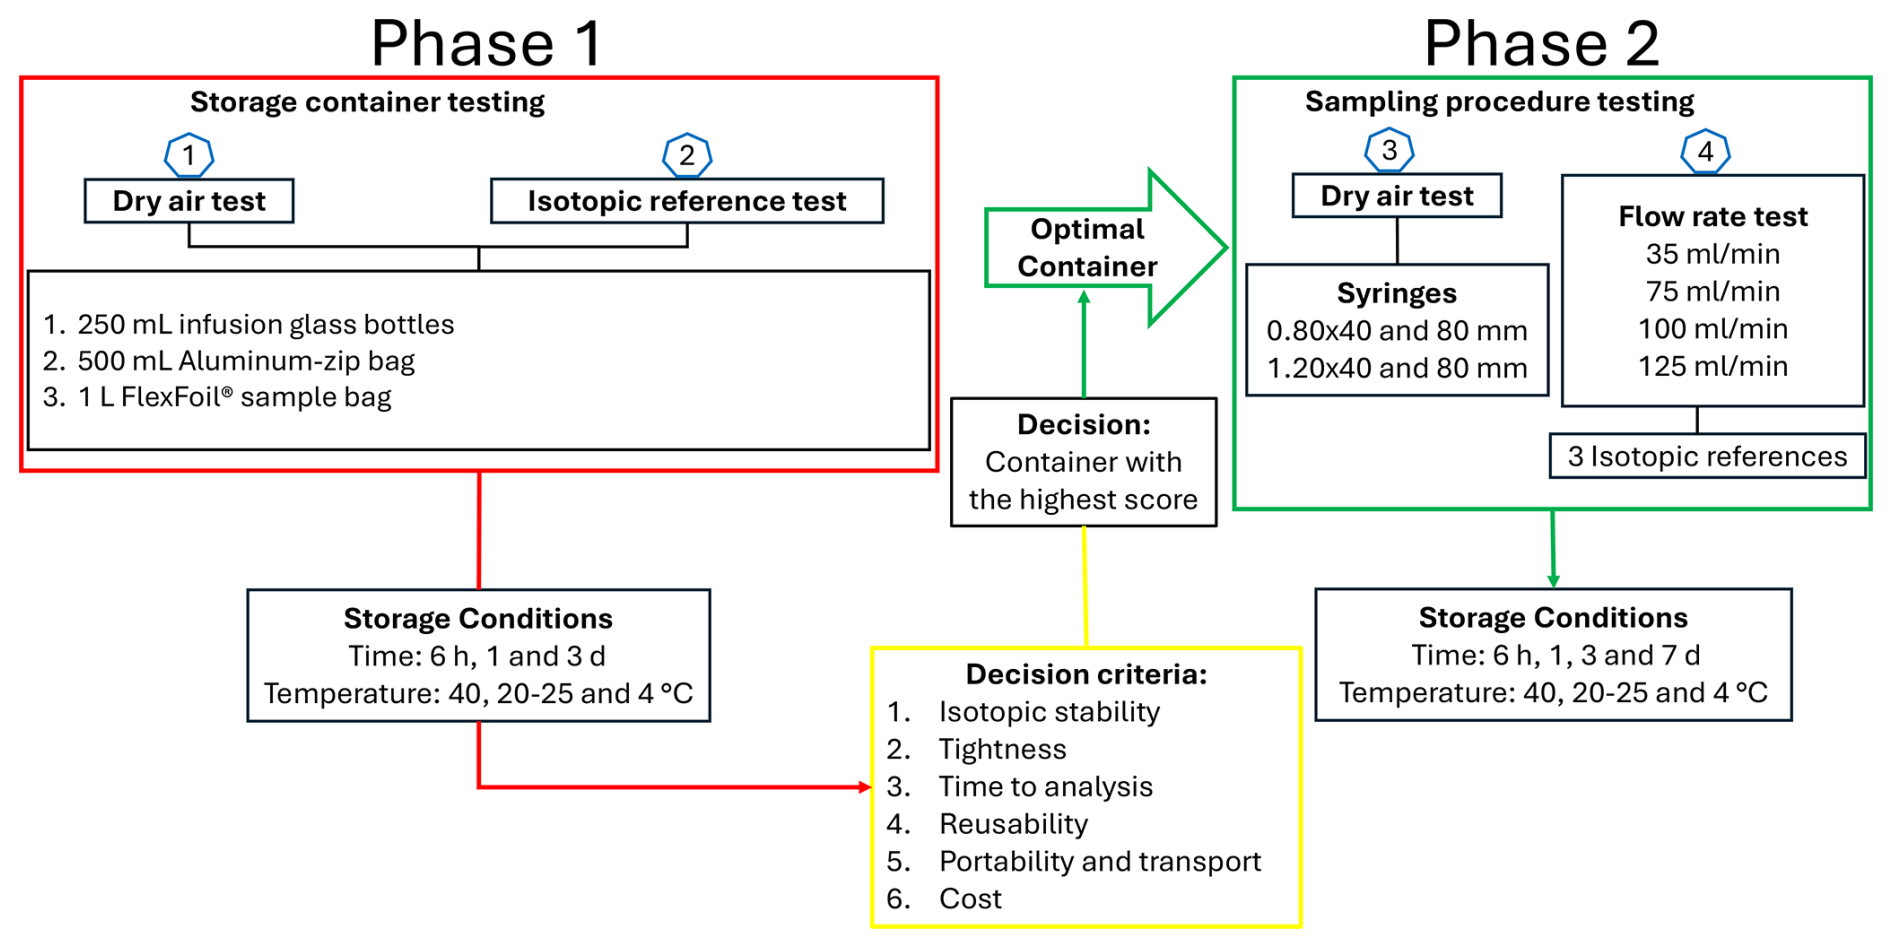
Figure 1Illustration of the experimental design for water vapor testing sampling and storage and. Phase 1 (red box) was dedicated to the testing of storage containers, and Phase 2 (green box), focused on optimizing the sampling procedure. Blue hexagons indicate the four experiments carried out: [1] dry air airtightness test; [2] isotopic stability test for container selection; [3] dry air leakage test for syringe-septum interaction; and [4] flow rate performance test using three isotopic references. The decision on the ideal container was made by a multi-criteria decision analysis (yellow box).
Using the most suitable container, we conducted two additional experiments (experiments 3 and 4) in Phase 2. In these, we expanded the parameters to include 7 d storage, tested two syringe sizes, and evaluated four different flow rates (35, 75, 100 and 125 mL min−1) using three isotopic standards. Experiment 3 examined whether sealing integrity was affected by puncture diameter or septum properties, while experiment 4 determined the optimal flow rate for maximizing isotopic precision and ensuring of isotopic equilibrium. The technical details are provided in the following sections.
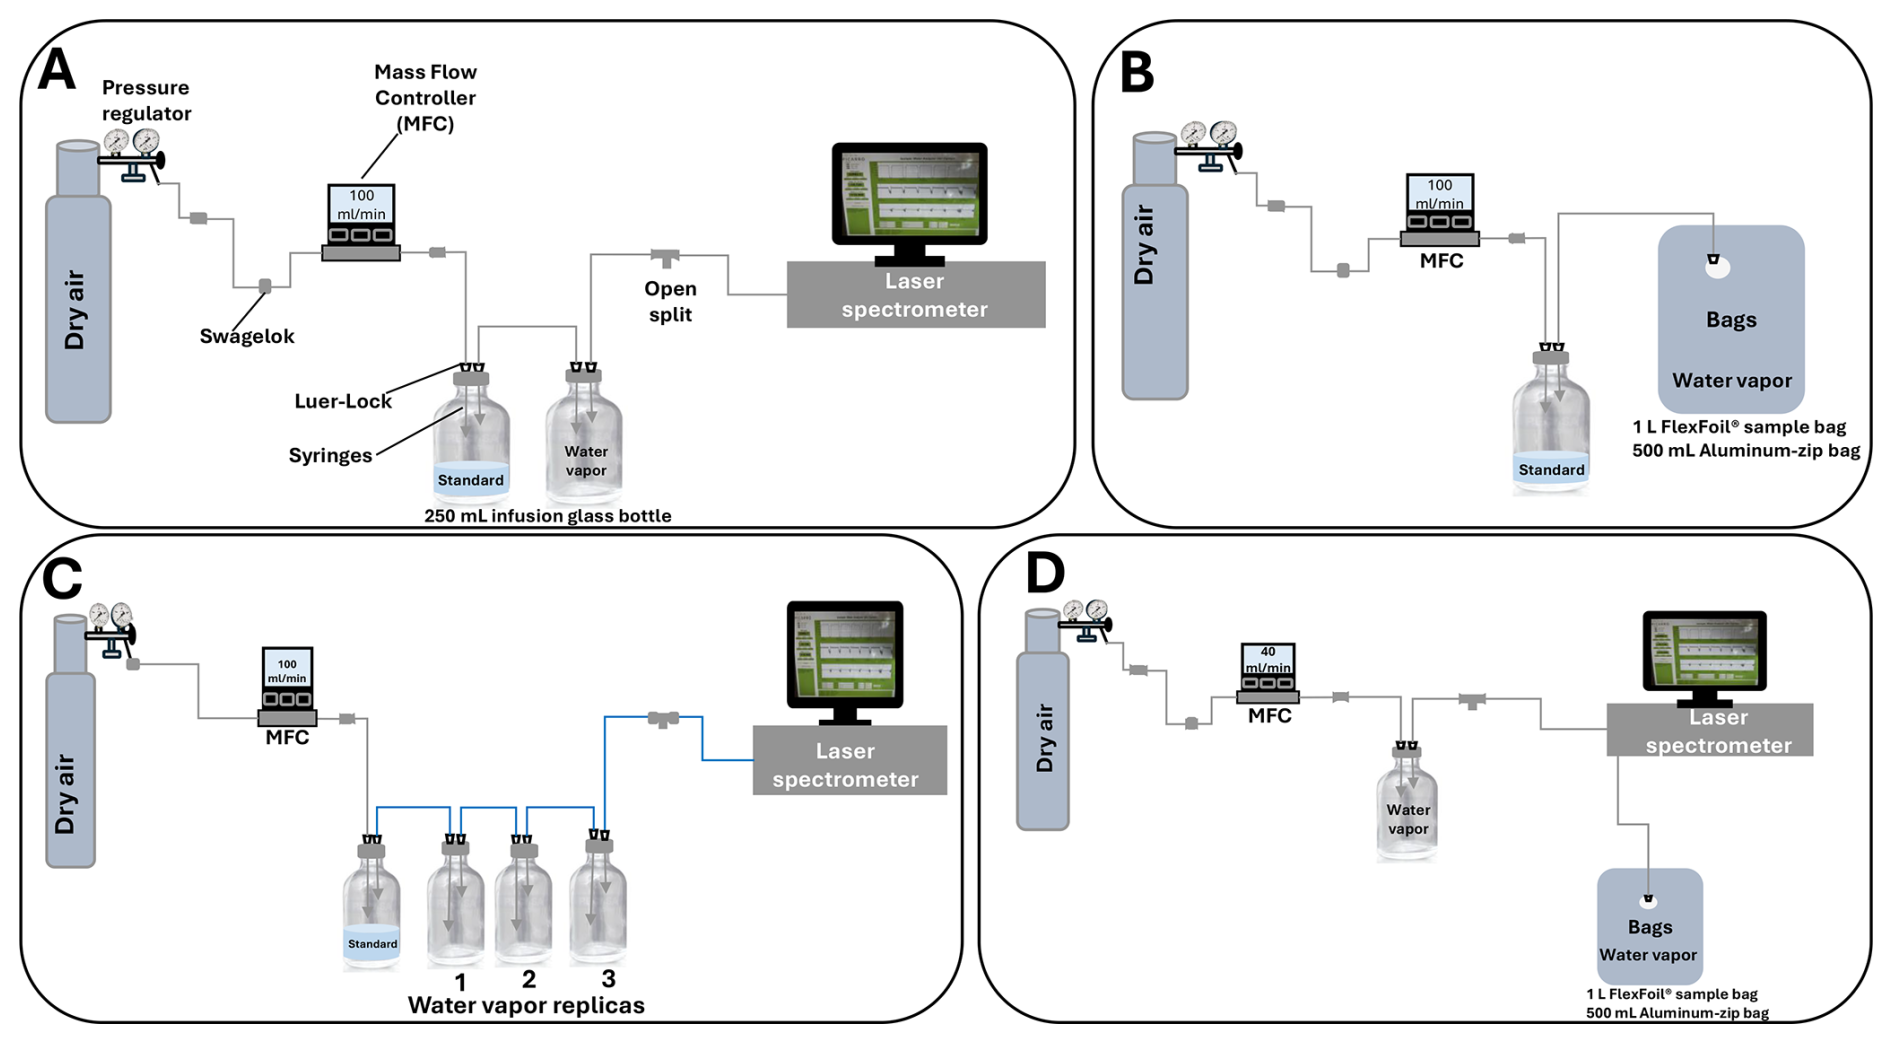
Figure 2Technical implementation of the experiments. The schemes show the components used throughout the experiments: (A) setup for continuous generation of reference water vapor from a liquid isotopic standard and direct analysis via laser spectroscopy (Picarro L2130-i); (B) configuration for filling 1 L FlexFoil sample bags and 500 mL Aluminum-zip storage bags with reference vapor; (C) system for simultaneous filling of three 250 mL infusion glass bottle replicates to ensure consistent water vapor isotopic composition for flow rate experiments; and (D) measurement configurations for stored samples, including a dry air push system with a T-junction open split for 250 mL infusion glass bottles and bags (left), and a direct inlet connection for gas bag analysis (right). In all configurations, gas flow rates were precisely controlled using a pressure regulator and an electronic mass flow controller (MFC).
The methodological framework outlined in Fig. 1 was implemented using setups specifically designed for water vapor sampling and analysis with a CRDS isotope analyzer. The technical implementation of the experiments is detailed in Fig. 2.
2.2 Storage container testing
The first phase of the experiments focused on evaluating different storage containers to assess their tightness and the isotopic stability of water vapor (Fig. 1). To test this the storage containers were filled with dry air (experiment 1) and with a reference with known isotope values (experiment 2). The dry air and water vapor samples were stored under three temperature conditions. Two of these were controlled: a fridge at 4 °C and an oven at 40 °C. The third condition were ambient conditions in our laboratory where the temperature fluctuated between 20 and 25 °C and was uncontrolled. Three storage times were tested for each temperature condition: 6 h, 1 d, and 3 d.
2.2.1 Experiment 1 – Tightness of the containers
Before the experiment several preparatory measures were taken. The 250 mL infusion glass bottles were dried overnight in an oven at 60 °C to remove residues, then sealed with a butyl stopper and an aluminum cap secured with a 32 mm aluminum cap closure clip. The glass bottles were flushed with dry air for 5 min before sampling. After measuring the samples, the bottles were cleaned and dried again for 24 h at 60–80 °C for reuse. For the 500 mL Aluminum-zip bags with zippers (these bags were not reused because reusing sampling bags is impractical; it requires thorough and repeated preparation to remove isotopic memory effects and maintain accurate measurements, a process that is too labor-intensive for routine field or laboratory use (Herbstritt et al., 2023)), silicone was applied as a septum for the syringes and dried at room temperature for three days. The bags were then heated overnight at 50 °C to remove potential organic residues. The bags were tightly sealed by folding the top opening and securing it with folding clips, without using heat sealing, to prevent the emission of any compounds potentially affecting the isotope values. The 1 L FlexFoil sample bags were purged three times with dry air through the valves prior to sampling to minimize memory effects and allow reuse.
After the preparatory measures, the containers were filled with dry air from a cylinder regulated by a pressure regulator connected to a mass flow controller. The air was passed through PTFE tubing (outer diameter: ) connected to a syringe using a Luer adapter. Fine syringes (0.80×40 mm) were used for sampling to minimize the size of the perforations in the septa. Consequently, five 250 mL infusion glass bottles were purged with the sample for 12 min at a flow rate of 100 mL min−1, with equilibrium between the inlet and outlet of dry air established by an additional connection to the CRDS isotope analyzer. An open split was used to avoid overpressure in the analyzer. Five 500 mL Aluminum-zip bags were filled in six minutes under the same flow conditions by inserting the syringe through the silicone septum into the bag. For the 1 L FlexFoil sample bags, a PTFE tube was attached. This tube was connected via a Swagelok connector to a second tube, which carried the dry air until the bag was filled.
2.2.2 Experiment 2 – Isotopic reference test
The sampling configuration and container types were identical to those described above. However, this experiment differed by storing saturated water vapor of a known isotopic composition within the containers. Each container type (250 mL infusion glass bottle, 1 L FlexFoil sample bag and 500 mL Aluminum-zip bag) was prepared in five replicates and stored for 6 h, 1 d, and 3 d at different temperatures: Fridge, Room, and Oven (4, 20–25, and 40 °C).
An initial measurement was performed by directly measuring the isotopic water vapor with the CRDS analyzer; these values were used as comparison values for the evaluation. The vapor flow rate was chosen at 100 mL min−1 for all containers. Based on preliminary testing, a 12 min sampling time was selected for glass bottles to achieve optimal isotopic stability and minimize memory effects. Conversely, a shorter sampling time 6 min was sufficient for the bags to prevent overpressurization and subsequent leakage. The vapor was generated in a closed system (headspace) where dry air flowed through a glass bottle containing the known isotopic reference. This system included connections with syringes and PTFE tubing regulated by an electronic mass flow controller, and an open T-shaped split before entering the analyzer to prevent overpressure (Fig. 2A and B).
2.2.3 Decision criteria for the selection of the optimal container
Experiments 1 and 2 were essential for selecting the optimal container. Six evaluation criteria were defined (Fig. 1) to ensure objective selection process. These were divided into critical (criteria 1–3) and non-critical (criteria 4–6) categories. Critical decision criteria were: (1) isotopic stability; the capability of the sampling container to maintain the isotopic signature without significant changes; (2) tightness; the prevention of exchange with atmospheric air; and (3) storage time; the storage time of a particular water vapor sample. Non-critical criteria were: (4) reusability of the storage container; a measure to sustainability and long-term cost reduction; (5) portability and transport resistance; a handling criteria including weight, volume, and risk of damage or loss of tightness during transport; and (6) cost, based on supplier prices in the European market. Each criterion was rated on a scale from 1 to 5 (1= poor, 5= excellent) and assigned a relative importance which we defined as follows: isotope stability (70 %), tightness (10 %), storage time (5 %), reusability (5 %), portability and transport (5 %), and cost (5 %). The sum of the weighted scores allowed for an objective comparison among the evaluated containers. The container with the highest total score from the combined decision criteria was considered the optimal choice and used in the detailed testing in phase 2.
2.3 Sampling procedure testing
In the second phase of the experiment, we only used the best container from phase 1. The main objective was to optimize the water vapor sampling process and define optimal conditions and procedures by evaluating key factors such as container, temperature, storage time, and flow rate to ensure high-quality water isotope data. Additionally, this phase tested a longer storage period, with samples kept for up to 7 d after sampling. The use of different storage intervals (6 h, 1 d, 3 and 7 d) allowed a more accurate assessment of whether the isotopic variation remained similar to that observed after 3 d or increased with longer storage times. Three replicates were prepared for each interval, all were collected simultaneously but measured only at their respective storage times.
Experiment 3 was conducted with dry air and two syringe sizes, with samples stored at 40, 20–25, and 4 °C (Oven, Room, and Fridge temperatures, respectively) and four storage times: 6 h, 1 d, 3 and 7 d. In experiment 4, four sampling flow rates (35, 75, 100 and 125 mL min−1) were tested with three isotope references (Table 1) for water vapor sampling. The minimum flow rate was 35 mL min−1, which corresponds roughly to the operating flow rate of our CDRS isotope analyzer.
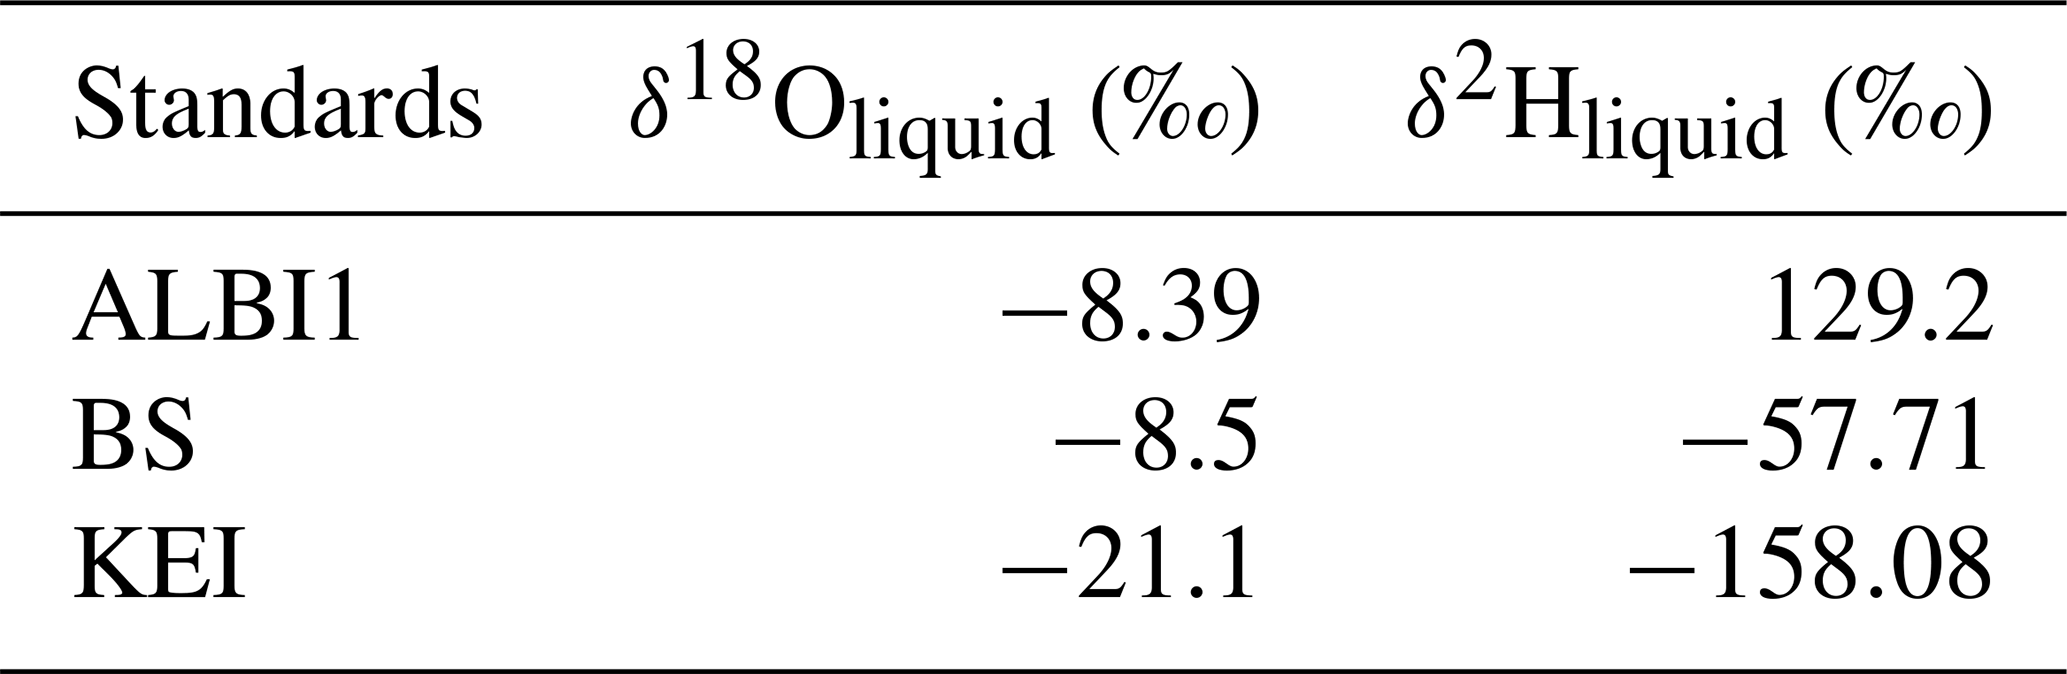
Table 1Liquid isotope concentrations of the reference standards.
2.3.1 Experiment 3 – Influence of syringe size on the tightness of the optimal container
As both sampling of water vapor and measurement on the laser spectroscope require puncturing of the septum with a syringe, we were interested in the effect of the syringe sizes responsible for the puncture – in particular the syringe diameter. Though theoretically sealing, use of a thick syringe creates a substantial hole in the septum which might cause intrusion of atmospheric air and effect isotopic stability. On the other hand, a syringe to thin might not allow for the desired flow rates. Despite being a very detailed aspect, we considered it worth testing. Two syringe sizes (0.80×40 mm, 80 mm, and 1.20×40 mm, 80 mm) were used to assess whether the puncture in the septum affected container tightness isotope values. Tests were conducted using 250 mL infusion glass bottles filled with dry air. After sampling with both syringes, the bottles containing air samples were stored under different temperatures and storage times. This evaluation identified whether syringe puncture had a negative effect on tightness or whether tightness depended mainly on the closure system (see Fig. 1). It also determined the most suitable syringe size for water vapor sampling.
2.3.2 Experiment 4 – Testing the flow rate of the sampling in the optimal container
The precision of the water vapor sampling method was evaluated at different sampling flow rates using only the containers previously identified as the most suitable. Three reference waters with known isotopic compositions were used in this experiment, namely ALBI1 (enriched in deuterium oxide), BS (intermediate isotopic composition), and KEI (light isotopic composition). Their isotope values are summarized in Table 1.
The water vapor samples were generated under controlled laboratory conditions (Fig. 1). Sampling occurred at four different flow rates: 35, 75, 100, and 125 mL min−1. Each combination of reference water and flow rate was repeated three times. This experimental design allowed us to assess the uncertainty of the sampling method and to identify whether specific flow rates significantly affect the accuracy of the isotope values measured in water vapor. Before sampling, the 250 mL infusion glass bottles were cleaned by placing them in an oven at 60–80 °C for 24 h. After drying, the warm bottles were transferred to a dry, insulated aluminum box and allowed to cool under protected conditions to minimize exposure to ambient humidity and prevent condensation caused by rapid temperature changes. Before use, each bottle was flushed with a strong flow of dry air for 1 to 2 min to remove any residual from the interior. The bottles were then sealed by placing a butyl stopper on the opening, and sealing it with and aluminum crimp cap and crimping pliers to ensure a secure and gas-tight closure. During water vapor sampling, the temperature was monitored using a sensor (Sensirion AG, Sht4x Smart Gadget). Approximately 100 mL of the reference standard was placed in a 250 mL infusion glass bottle. During the sampling period, a dynamic equilibrium was established between the liquid water and the headspace vapor, allowing isotope exchange to approach the temperature-dependent equilibrium fractionation factor.
The sampling system was designed to pass a controlled stream of dry air through the bottle containing the reference water, generating water vapor that had equilibrated isotopically with the liquid water before flushing the sampling bottles. A synthetic dry air cylinder (20.5 vol % O2, Rest N2, KW-free) with a pressure regulator was connected to an electronic mass flow controller (PN 35828, Analyt MTC, Müllheim, Germany), allowing the sampling flow rate be precisely regulated. Connections were made with PTFE tubing. The end connected to the mass flow controller used Swagelok connectors, while the other end had a Luer-lock adapter with a long needle inserted through the septum into the glass bottle. A second, shorter needle was inserted through the septum to transfer the generated water vapor to the sampling bottles.
The three replicate sampling bottles were connected in series in this setup, vapor generated from the reference water first passed through the first replicate bottle, then the second, and finally the third. The sampling was conducted for 35 min. The outlet of the third bottle was connected to the CRDS to monitor the vapor signal and obtain an initial reference measurement. Before connecting to the CRDS, an open-split configuration was used to prevent overpressure in the analytical system. The sampling system configuration is shown in Fig. 2C.
For each of the three reference waters, samples were prepared at each of the four sampling flow rates: 35, 75, 100, and 125 mL min−1. Each reference-water and flow-rate combination was replicated three times, resulting in 36 samples per storage time (3 reference waters ×4 flow rates ×3 replicates). Across the four storage times, this resulted in 144 samples per temperature condition and 432 samples for the entire experiment.
2.4 Measurement of the water vapor samples
Before measurement, the water vapor samples were kept at Room temperature for one hour, ensuring that this temperature was higher than the temperature during sampling to achieve a homogeneous temperature inside the bottles and to prevent condensation.
The measurements were carried out with a Picarro L2130-i isotope analyzer, which determines the isotope-ratios of δ18O and δ2H using Cavity Ring-Down Spectroscopy (CRDS). The samples in the 500 mL Aluminum-zip bags were connected directly to the isotope analyzer using a Swagelok connector and diameter PTFE tubing. At the other end, a Luer lock adapter was attached to a syringe, which was inserted through the silicone septum into the bag, allowing the isotope analyzer to extract the water vapor at a flow rate of approximately 35 mL min−1. For the 1 L FlexFoil sample bags with a gas valve, the measurement was made through the valve connected to a PTFE tube. This tube was connected via a Swagelok connector to a second tube that directed the vapor directly to the CRDS (see Fig. 2D).
The 250 mL infusion glass bottles were connected to the isotope analyzer using PTFE tube attached to a Luer lock adapter with a 0.80×40 mm syringe inserted into the bottle. The other end of the tubing was connected via a Swagelok connector to a stainless-steel T-piece and from there to the isotope analyzer. In contrast to the bags, the bottles were connected to a second tube with a 1.20×40 mm syringe, which introduced a constant flow of dry air into the bottle at a rate of 40 mL min−1, controlled by a mass flow controller. This strategy was used because the applied flow exceeded the analyzer demand, maintaining positive pressure and minimizing atmospheric air intrusion. A T-piece vented excess flow (open split), preventing overpressure, and ensuring continuous sample delivery. An electronic rotameter confirmed excess venting at 5–7 mL min−1, indicating that the analyzer received only sample (Fig. 2D). Each sample was measured for 6 min. Between measurement, the isotope analyzer was purged with dry air for 2 min to clean the measurement system and minimize the risk of memory effects (see Fig. S2).
2.5 Data processing
Water vapor isotope values are presented in delta notation (δ) relative to the international standard VSMOW (Vienna Standard Mean Ocean Water) according to equation 1 (Craig, 1961; Coplen, 2011):
where: Rsample is the isotopic ratio (18O 16O or 2H 1H) of the sample, and RVSMOW is the ratio of the international standard VSMOW.
The first and the last 2 min of each 6 min measurement were excluded to minimize potential memory effects in the system and water vapor concentration-dependent isotope effects. This was necessary because during measurements of stored samples, the water vapor concentration decreased over time, which could potentially affect the isotope values. Therefore, mean values for each replicate were calculated from the remaining central 2 min of the measurement.
From these data, the average values per replicate were calculated, and the isotopic values corresponding to the liquid phase of each sample were determined. For this purpose, the temperatures recorded during the sampling period were used and the equations for isotope fractionation in equilibrium between vapor and liquid were applied. These equations (2, 3, and 4) are based on the temperature-dependent fractionation factor in Kelvin [K] (Horita et al., 2008).
Equation (2); equilibrium fractionation ratio (α) for δ18O
Equation (3); fractionation ratio at equilibrium (α) for δ2H
Equation (4); liquid phase isotopic value
where: δl is the liquid isotopic value, δv is the vapor isotopic value, and α is the fractionation factor for 18O and 2H obtained from Eqs. (2) and (3).
Based on obtained liquid values, a linear regression was calculated between the measured and known values. This regression was applied to correct and standardize all samples so that the final isotopic values were determined in accordance with the international VSMOW scale.
As part of the data processing, a quality check of the replicates was performed by comparing them with the known isotopic signatures of the standards. To ensure the precision and reliability of the standardization, a quality filter was applied in Python, excluding replicates that showed significant deviations from the expected value. All possible subsets of 2 and 3 replicates were evaluated for each combination of experimental conditions (standard type, temperature, storage time and flow rate). For each subset, the mean and standard deviation of δ18O and δ2H, as well as their distance from the target value, were calculated. The subgroup with the lowest sum of standard deviations was selected, favoring subgroups with the highest number of replicates. This procedure allowed the determination of the most representative and reliable replicates for each experimental condition, maximizing both the accuracy and precision of the measurements.
2.6 Data analysis
The data was analyzed using the Python programming language (version 3.13.1) with libraries such as Pandas, NumPy, Matplotlib, Seaborn and SciPy. Graphical and statistical comparisons were conducted to evaluate the effects of storage temperature and container type on the stability of isotope values. Differences between groups were visualized with boxplots and statistically evaluated using non-parametric Kruskal-Wallis test, as the data did not follow a normal distribution.
To validate the precision of the isotope values, the Mean Absolute Error (MAE) between the measured values and the known values of the reference standards was calculated. This metric represents the average deviation from the reference value, providing an objective measure of the quality of the fit.
3.1 Storage container testing
3.1.1 Tightness of storage containers
Figure 3 shows the results for the tightness of the various containers. It indicates a clear increase in H2O concentration (ppm) over time (= intrusion of atmospheric water vapor) in the dry air samples, depending on the type of container, storage time, temperature, and volume.
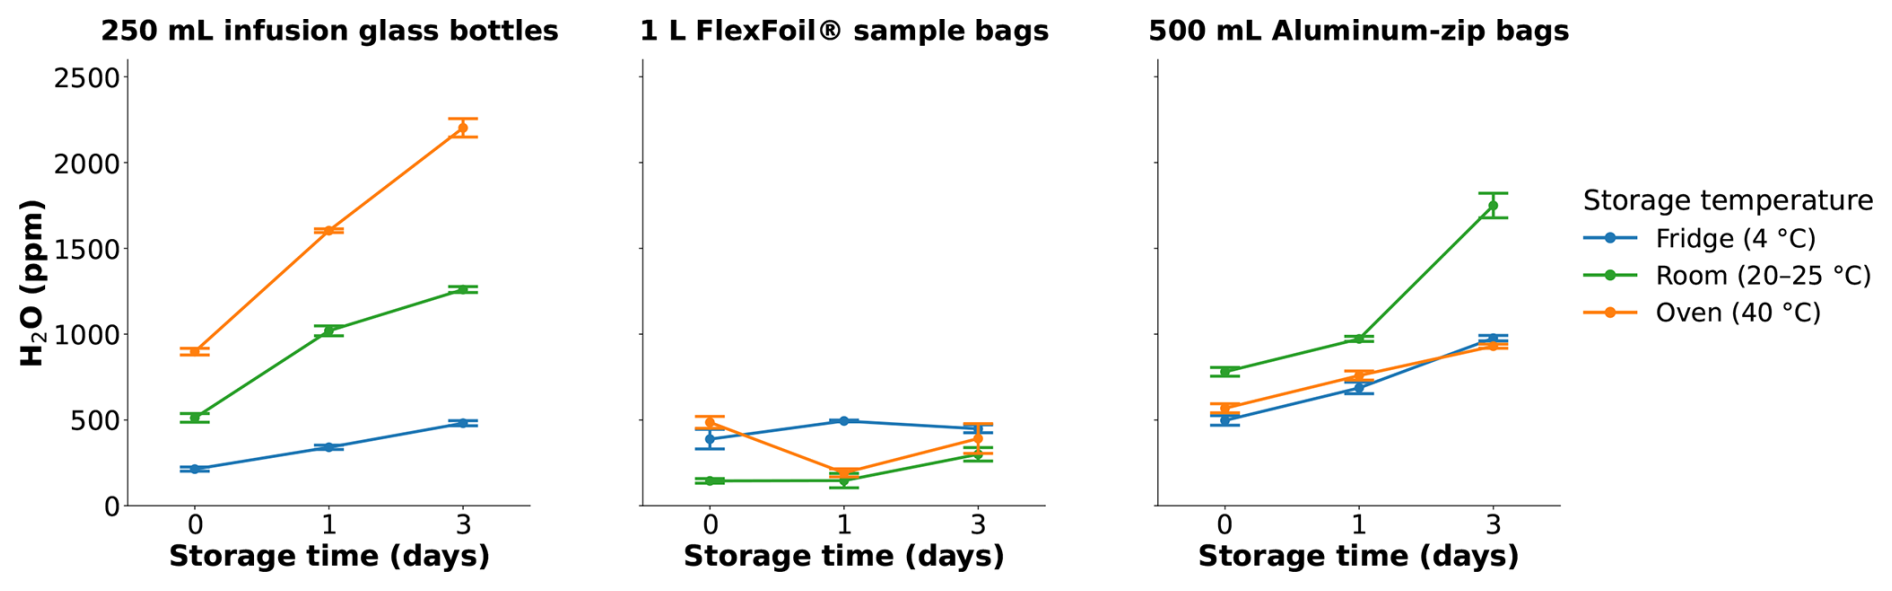
Figure 3The graph shows the changes in water vapor concentration (H2O, in ppm) in dry air samples after different storage times (0, 1, and 3 d) in three types of containers (250 mL infusion glass bottles, 1 L FlexFoil sample bags and 500 mL Aluminum-zip bags) and under three temperature conditions (Fridge, Room and Oven).
The 250 mL infusion glass bottles showed a substantial increase in H2O concentration after 3 d of storage, reaching approximately ∼2200 ppm at 40 °C and about ∼1250 ppm under ambient conditions (20–25 °C), while values at 4 °C remained lower at around ∼480 ppm. The 500 mL Aluminum-zip bags showed a similar pattern, but with the strongest increase under ambient conditions (∼1750 ppm). Under extreme temperature conditions, such as the Oven (40 °C) and Fridge (4 °C), they showed comparable concentrations of ∼1000 ppm after 3 d. The 1 L FlexFoil sample bags showed the least variability, with values of approximately ∼100 and ∼600 ppm across all storage conditions and times, with no significant increase.
3.1.2 The efficiency of containers in preserving the isotopic composition of water vapor
An isotopic reference was used to assess whether the isotopic composition remained stable after sampling in three types of containers and during storage at different temperatures and times. The results show a varying degree isotopic deviation of the measured values from the known values of the isotopic reference source. This deviation strongly depends on temperature, storage time and container type, and generally increases with longer storage time. In the 250 mL infusion glass bottles, the isotopic deviations in δ18O remained stable within a range of ±0.9 ‰ across all three storage times (0, 1, and 3 d) under all temperature conditions. Slight variations in δ2H were observed, particularly for samples stored in the Oven (+5 ‰) and Fridge (−5 ‰) after three days, while samples stored at Room temperature showed a stable deviation of ±0.5 ‰ at all storage times. Overall, the results show that analyzing of the samples until 24 h after sampling provides reliable values without deviations of −1 ‰ for δ18O and δ2H (+2.3 ‰ was observed exclusively in the Oven for δ2H; see Fig. 4).
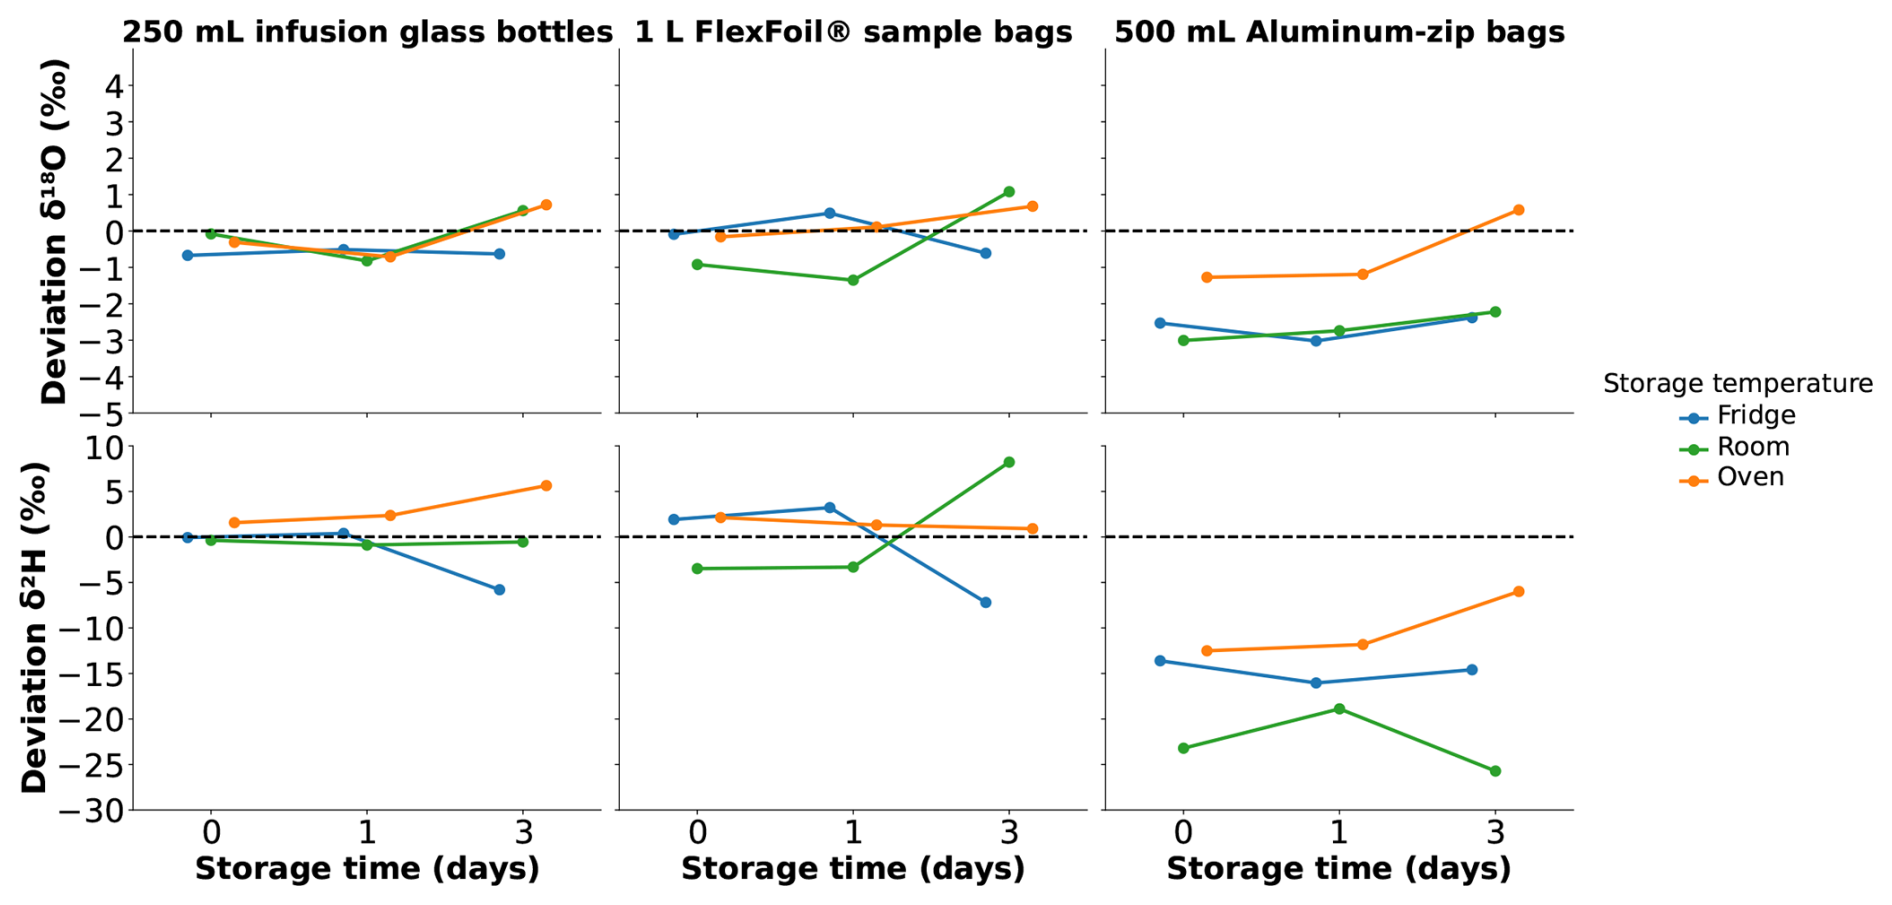
Figure 4Isotopic deviations (δ18O and δ2H) in water vapor samples stored in different containers (250 mL infusion glass bottles, 1 L FlexFoil sample bags, and 500 mL Aluminum-zip bags) at three storage temperatures (Fridge, Room, Oven) for 0, 1 and 3 d. The dashed line represents the reference value (0 ‰), indicating no isotope deviation.
In contrast, the 1 L FlexFoil sample bags showed δ18O deviations within ±1 ‰ for samples stored under Fridge and Oven conditions on days 0, 1, and 3. However, samples stored at Room temperature showed deviations of −1.35 ‰ on the first day and a +1.08 ‰ enrichment after three days. The deviations in δ2H were more pronounced from 0 to 1 d, with Room temperature showing deviations of −3 ‰, and values reaching up to ±8 ‰ after three days under Room and Fridge conditions. In the Oven, deviations remained close to +2 ‰, indicating a clear trend toward isotopic enrichment under these conditions. These results show that deviations are expected in this type of container from the first day of storage and tend to increase over time. Additionally, the fact that the deviations varied depending on the temperature conditions indicates that this material reacts differently to temperature changes, which significantly affects the isotopic signature of the water vapor (Fig. 4).
Finally, the 500 mL Aluminum-zip bags showed the largest increase in isotopic deviations for δ18O, reaching −3 ‰ under Fridge and Room conditions. In the Oven, the samples had values of −2.5 ‰ on days 0 and 1, followed by a slight enrichment to +1 ‰ on the third day. For δ2H, isotopic fractionation toward depletion was observed under all three temperature conditions, with deviations of up to −25 ‰ in the Room, −16 ‰ in the Fridge and −12 ‰ in the Oven (Fig. 4).
3.1.3 Selection of the optimal container
Figure 5 shows the results of the multicriteria analysis performed to determine the optimal container.
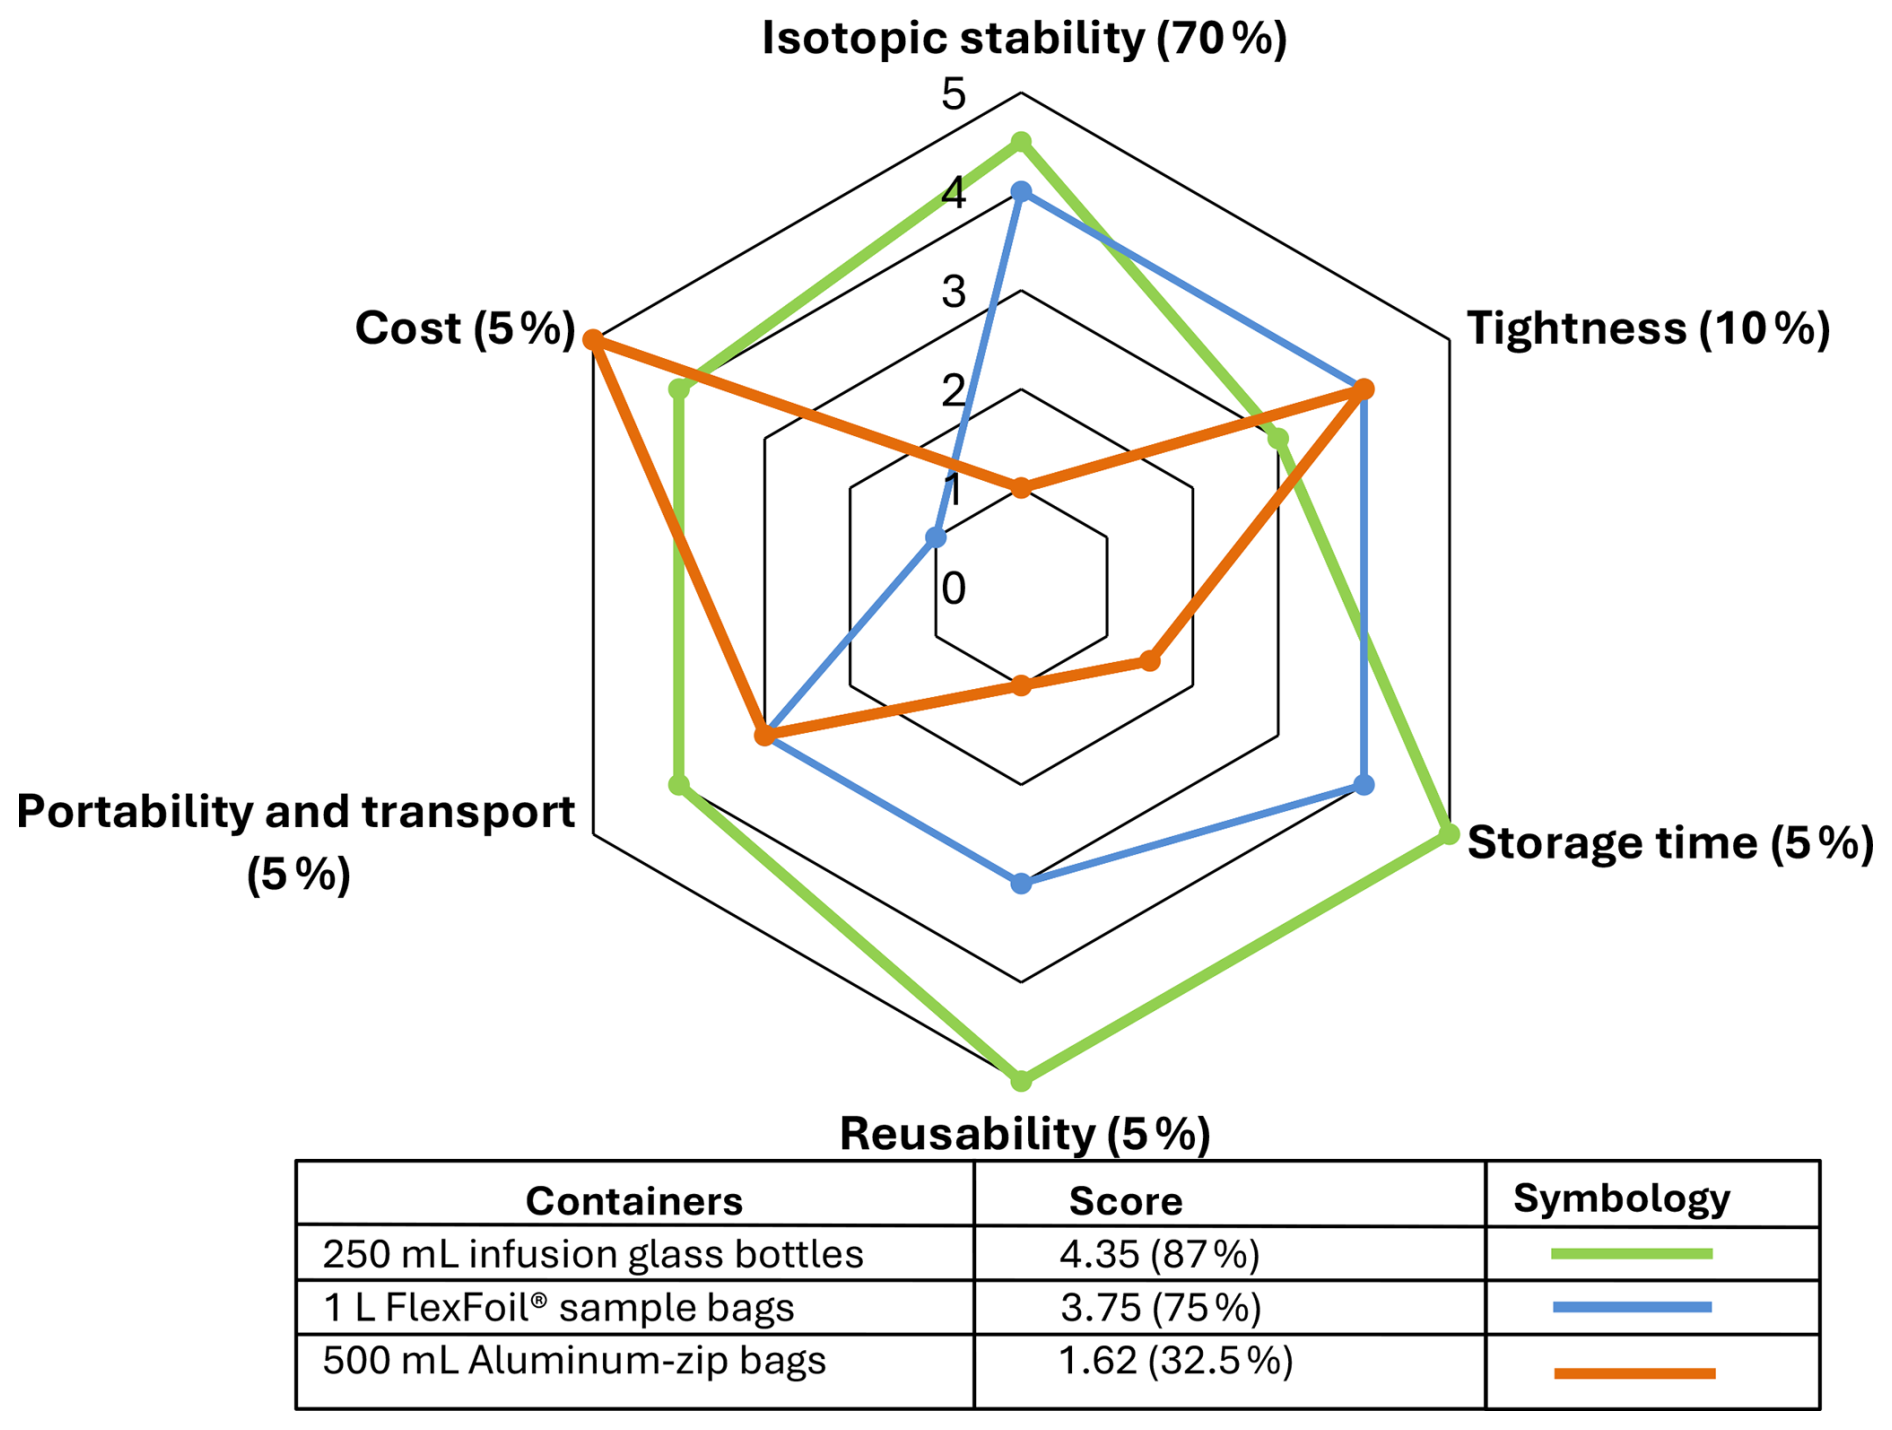
Figure 5Evaluation and scoring of decision criteria (1= poor; 5= excellent) for the optimal container for water vapor isotope measurements. Critical criteria: isotopic stability (70 %), tightness (10 %), and storage time (5 %). Non-critical criteria: reusability (5 %), portability and transport (5 %) and cost (5 %).
The 250 mL infusion glass bottles achieved the highest overall score of 4.35 (87 %) and were therefore the optimal container for water vapor sampling and “winner” of the testing. They were characterized by isotopic stability during the first days of storage (±1 ‰ deviation for both δ18O and δ2H; Fig. 4). Although they showed a greater increase in H2O compared to the other containers (Fig. 3), their reusability, low cost in the European market, and reasonable transport stability make them a practical and cost-effective option for field sampling campaigns.
As a second option, the 1 L FlexFoil sample bag performed well in terms of tightness with a score of 3.75 (75 %) (Fig. 5), although it showed greater isotopic deviations than the glass bottles, especially under Room temperature conditions (Fig. 4). Its reusability is limited to a maximum of three cycles, and it is the most expensive container on the European market. Its main disadvantage is its portability, as the occupied volume increases when filled, making it difficult to transport and store large numbers of samples and increasing the risk of damage during handling.
Finally, the 500 mL Aluminum-zip bags received the lowest score of 1.62 (32.5 %). This poor performance was mainly due to their limited isotopic stability (Fig. 4) and the increase in H2O observed during the tightness tests, especially after 3 d of storage. Although they offer the advantage of low cost, their reusability is practically limited to a single use. In addition, their portability and resistance to transportation are unfavorable, as the occupied volume makes handling multiple samples difficult and the material is prone to punctures.
Overall, glass bottles offer advantages that make them the preferable container. The criteria supporting this choice are particularly related to their ability to maintain a reliable isotopic signature during the first day of storage under various temperature conditions. Additional information and the rationale for each assessed criterion are provided in Table S2 in the Supplement.
3.2 Results of sampling procedure testing with 250 mL infusion glass bottles
3.2.1 Effect of syringe size on the tightness of 250 mL infusion glass bottles
The values obtained include the initial H2O concentration, which was 200 to 350 ppm. The results show that the H2O content in ppm increases progressively with storage time and is higher at higher temperatures. Samples stored at 40 °C reached the highest concentrations after 7 d, around ∼4000 ppm, followed by samples stored at 20–25 °C at approximately ∼2000 ppm, and finally samples stored at 4 °C, which had the lowest H2O concentrations of about ∼700 ppm after 7 d.
The trends in H2O concentration in the dry air samples in the 250 mL infusion glass bottles were consistent between the two syringe sizes, indicating that syringe size had no significant effect on the increase in H2O concentration as a function of storage time and temperature, as shown in Fig. 6.
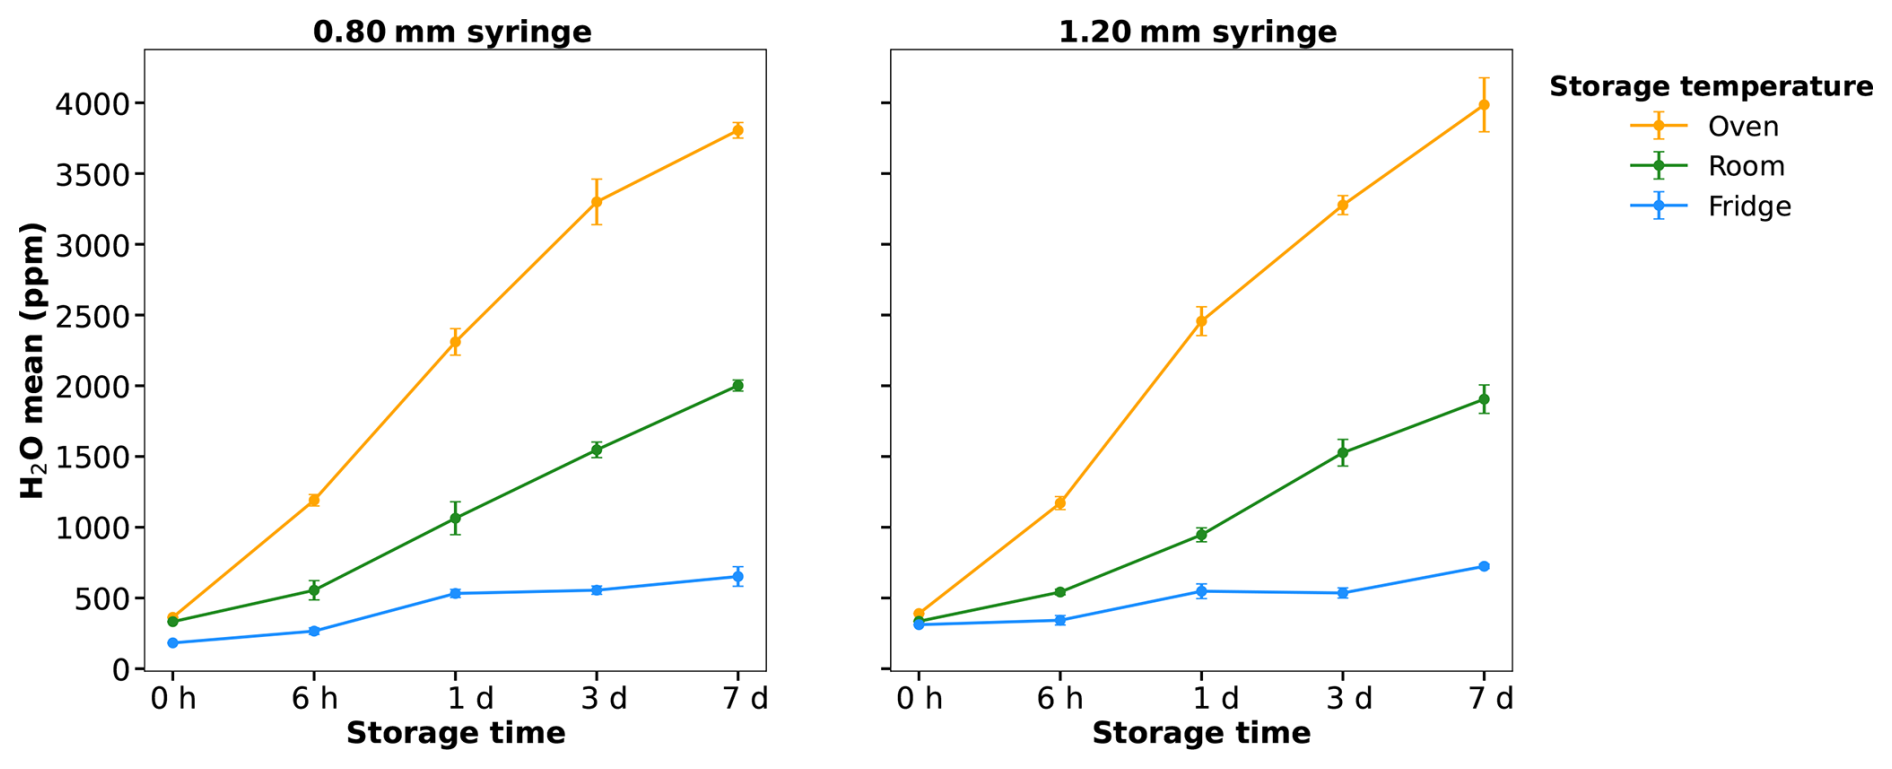
Figure 6Absolute H2O concentration (ppm) in synthetic dry air samples stored in 250 mL infusion glass bottles and analyzed with small and large syringes at different temperatures and times. The initial H2O at 0 h was approximately 200–300 ppm; the reported values represent the total measured concentration, including any increase during storage.
3.2.2 Effect of sampling flow rate on water vapor stored in 250 mL infusion glass bottles
Water vapor sampling was conducted at four flow rates (35, 75, 100, and 125 mL min−1). The H2O concentration (ppm)measured during sampling with the CRDS, reached a plateau after approximately 25 min at 100 and 125 mL min−1 and after 31 min at 75 mL min−1, whereas, it did not fully stabilize within 35 min at 35 mL min−1. A stable plateau was observed at 100 and 125 mL min−1, but at 35 and 75 mL min−1, the isotopic plateau developed more gradually over the sampling period, particularly for δ2H (Fig. S1 in the Supplement).
Impact of sampling flow rate on δ18O and δ2H isotopic composition
The stability of the water vapor samples was highly dependent on flow rate, with δ2H showing much larger fluctuations than δ18O. The 35 mL min−1 rate showed the greatest variability, with δ2H interquartile range (IQR) of ±5.38 ‰ and outliers reaching ±15 ‰, this was mirrored in the δ18O by a noticeable shift toward negative deviations (±1 ‰). Optimal precision was found between 75 to 125 mL min−1, where 75 % of δ2H values remained below ±1.5 ‰. In this range, the 75 mL min−1 rate achieved the lowest median deviation (±0.18 ‰), suggesting that higher flows stabilize the vapor stream against ambient interference (Fig. 7A). However, isotopic integrity degraded proportionally with time, a trend visible in both isotopes but amplified in the δ2H signal. At 1 d, the system reached its peak stability with a δ2H IQR of, only ±2.04 ‰ and median near zero (±0.22 ‰). However, by day 7, the median deviation climbed to ±0.76 ‰ with a dispersion of ±3.76 ‰. Notably, at this 7 d mark, δ18O displayed significant negative outliers, confirming that long-term storage triggers a coupled fractionation process-likely due to vapor escape-that affects both isotopic signatures (Fig. 7B).
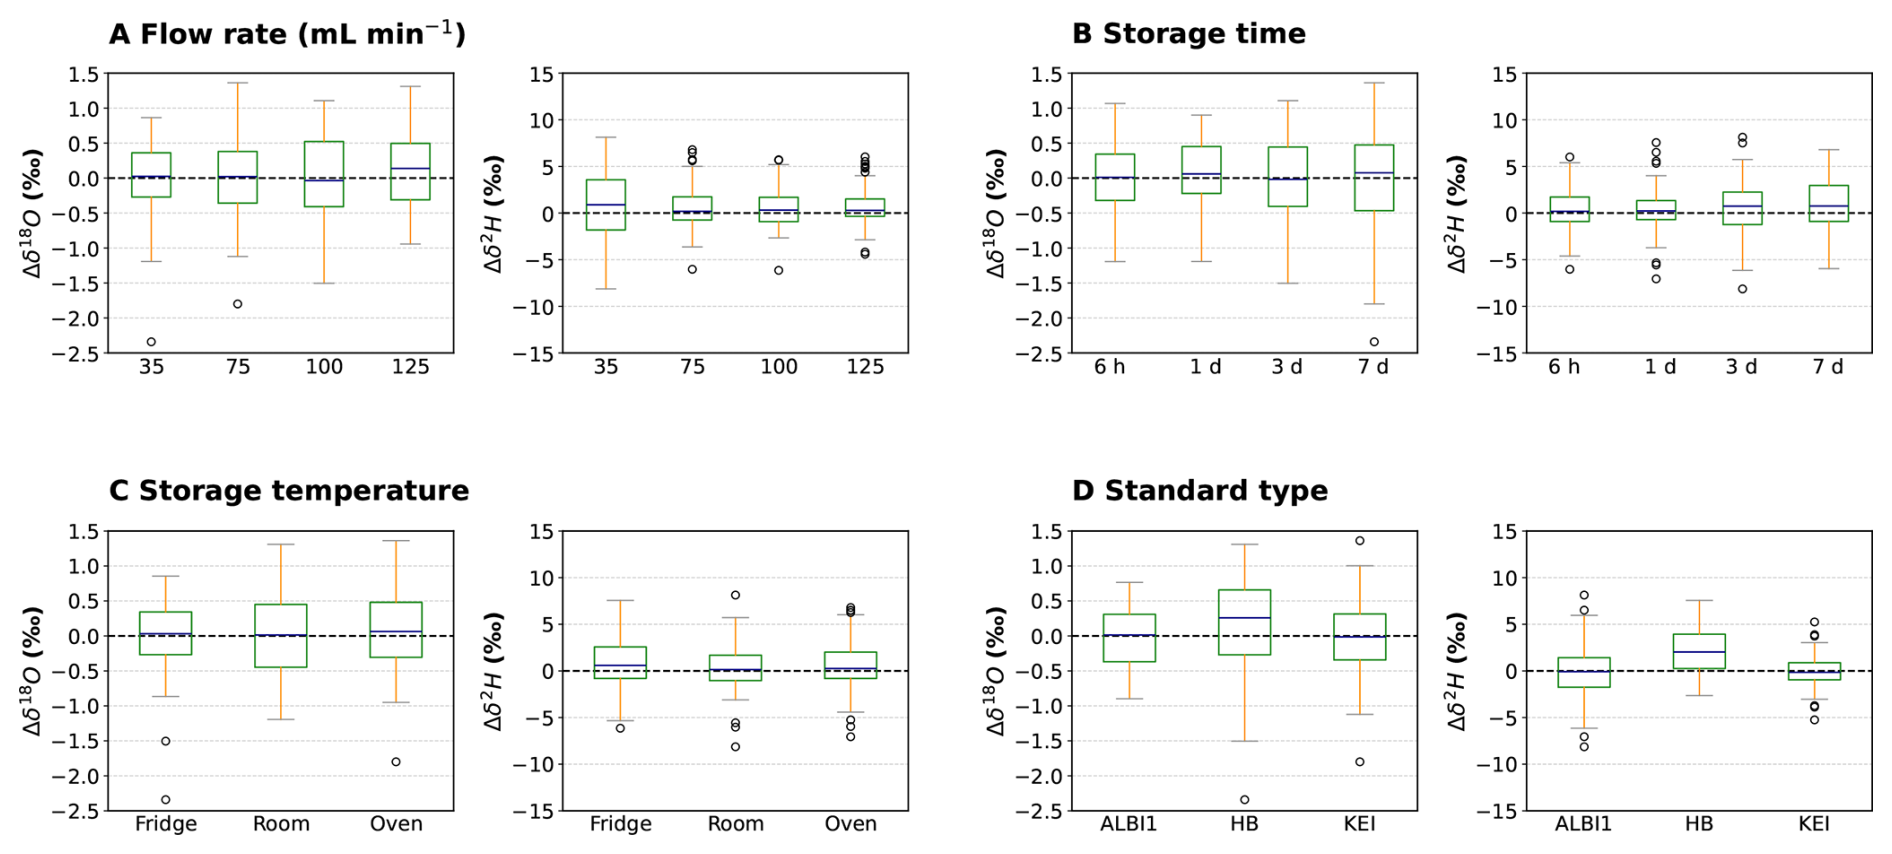
Figure 7Isotopic deviations (Δδ18O and Δδ2H) of water vapor samples under different factors: (A) Flow rates (mL min−1), (B) Storage time, (C) Storage temperature, and (D) Standard type. Boxplots represents the median (blueline), the interquartile range (green box) and the whiskers extend to the most extreme data points not considered outliers. Circles represent individual outliers. The dashed horizontal line indicates zero deviation from the reference value (Total sample set 432).
Contrary to our expectations, Room temperature storage yielded the highest precision (median: ±0.14 ‰; IQR: ±2.72 ‰ for δ2H). While the Oven samples showed slightly more scatter, the Fridge treatment was surprisingly the least stable. It produced the highest δ2H median deviation ±0.59 ‰ and the widest IQR ±3.38 ‰, with extreme outliers of ±15 ‰. This increased variability in the Fridge, visible in both δ2H and δ18O, suggests that cold conditions might interface with the internal equilibrium of the 250 mL glass bottle (Fig. 7C). Finally, the deviations for δ2H were strongly influenced by the isotopic weight of the standards. KEI was the most consistent (IQR: ±1.83 ‰), whereas HB showed the highest deviation values with ±2.03 ‰ and an IQR of ±3.68 ‰, indicating greater dispersion and lower stability compared to the other standards. However, ALBI1 had a larger spread with an IQR of ±3.16 ‰ and outliers of ±15 ‰. δ18O fluctuations up to ±1 ‰ indicating that heavier isotopes are more susceptible to memory effects (Fig. 7D).
3.2.3 Mean Absolute Error (MAE) and relative error of the results obtained under optimal sampling conditions
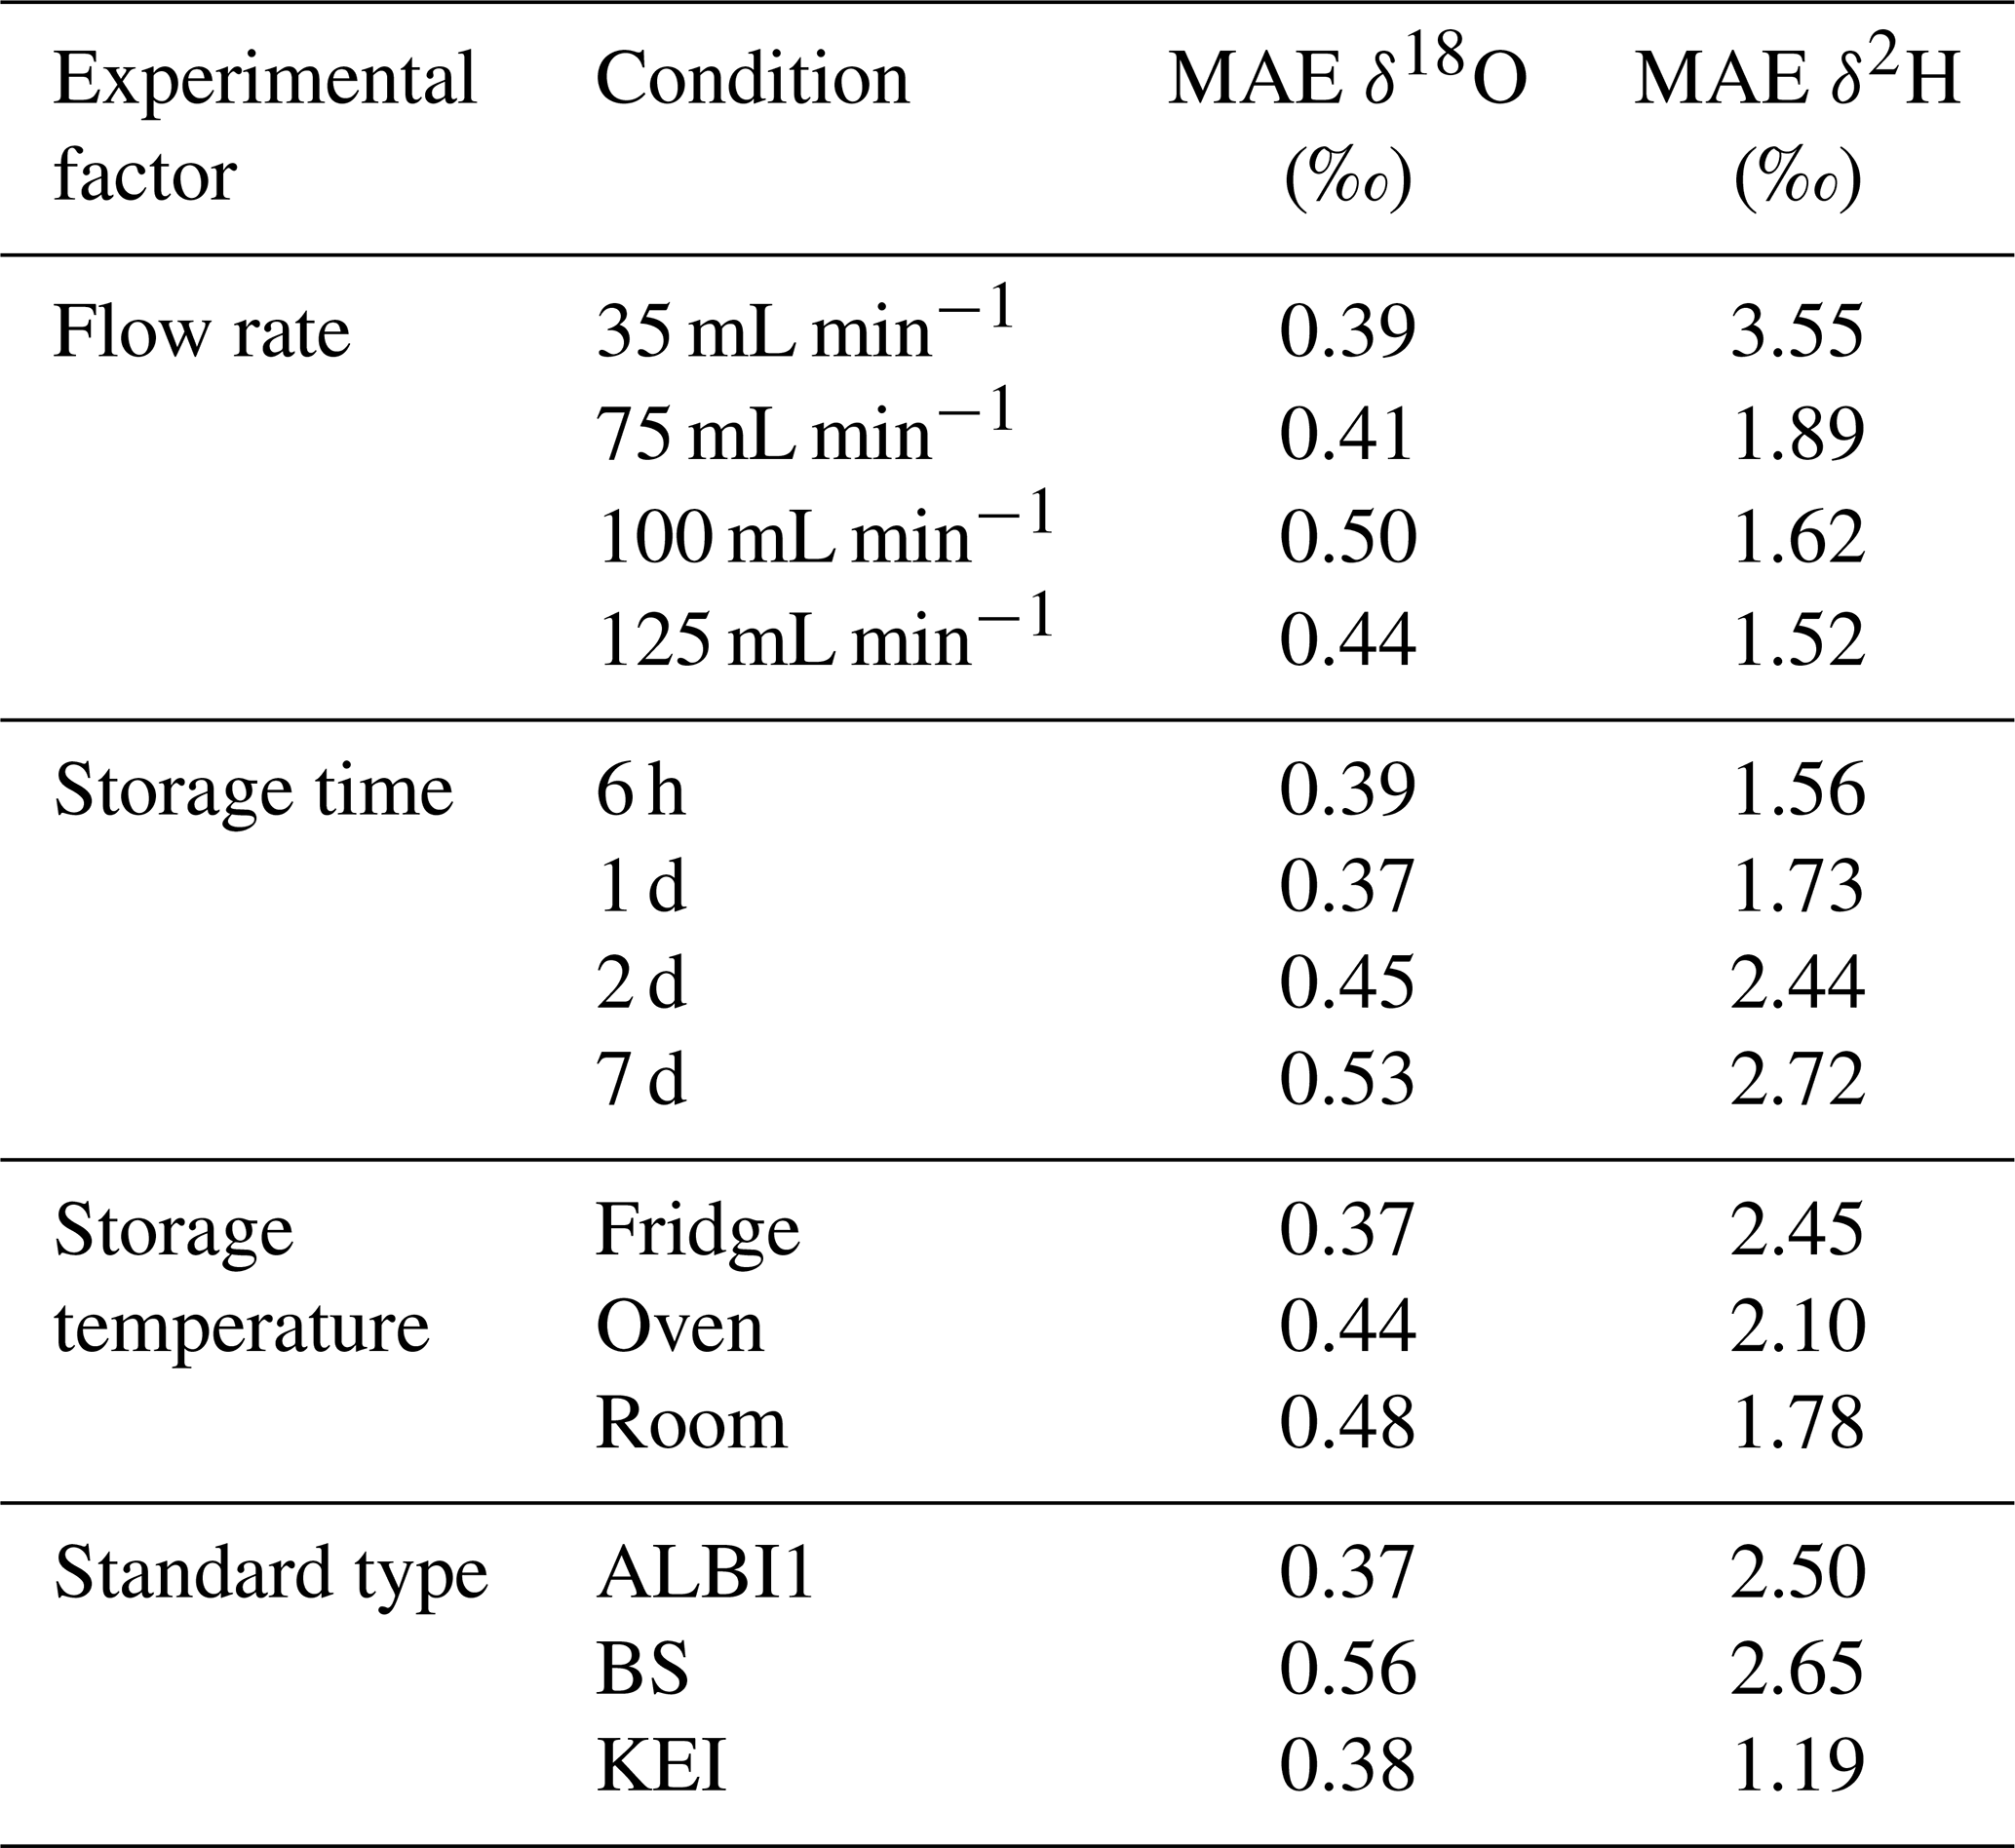
The Mean Absolute Error analysis confirmed that the experimental conditions significantly affect the precision of water vapor isotope measurements, especially for δ2H. The smallest deviations between measured and target values occurred when flow rates of 75, 100, or 125 mL min−1 were used for water vapor sampling and samples were stored for 6 h to 1 d at ambient conditions with temperatures between 20 and 25 °C. Under these conditions the best isotope values are obtained, with deviations of ±1.52 to ±1.89 ‰. However, at a flow rate of 35 mL min−1, the deviations increase to 3.55 ‰, and if samples are stored for more than 1 d (e.g., 3 or 7 d), the deviations also increase. Similarly, very low (4 °C) or high (40 °C) temperatures result in larger deviations. For δ18O, the MAE indicates that deviations are small, with a precision of ±0.6 ‰ under all evaluated conditions, indicating that only δ2H is directly affected by variations in temperature, air flow, storage time and isotope concentration (Standard), as shown in Table 2.
Table 2Mean Absolute Error of δ18O (A) and δ2H measurements under different experimental factors and conditions, including flow rate, storage time, temperature, and standard type.
The analysis of optimal conditions for water vapor extraction indicates that more than one flow rate may be suitable, depending on measurement duration and temperature conditions. For samples stored for 6 h, both 100 and 125 mL min−1 produced small and consistent errors for δ2H () and δ18O (), while 75 mL min−1 was acceptable for δ18O but showed variability up to ±3 ‰ for δ2H and therefore can only be considered a partial alternative. After 1 d, the flow rate of 125 mL min−1 was most optimal, yielding errors below ±0.5 ‰ for δ18O and ±0.3 ‰–1.5 ‰ for δ2H. However, 100 mL min−1 may still be acceptable under certain conditions, provided the vapor samples are not exposed to extreme temperatures, as this could otherwise result in δ2H errors exceeding ±2 ‰. During prolonged storage (3 and 7 d), only the flow rate of 125 mL min−1 remained within the range of ±1.5 to ±4 ‰, while the other flow rates showed greater variability, resulting in lower reliability. Therefore, if samples are analyzed within a short time (6 h), 100 mL min−1 is the optimal flow rate, while 125 mL min−1 provides greater stability under storage conditions of one day or longer (>1 d) (see Table 3).
Table 3Recommended optimal flow rates for water vapor samples as a function of time and storage conditions in 250 mL infusion glass bottles.
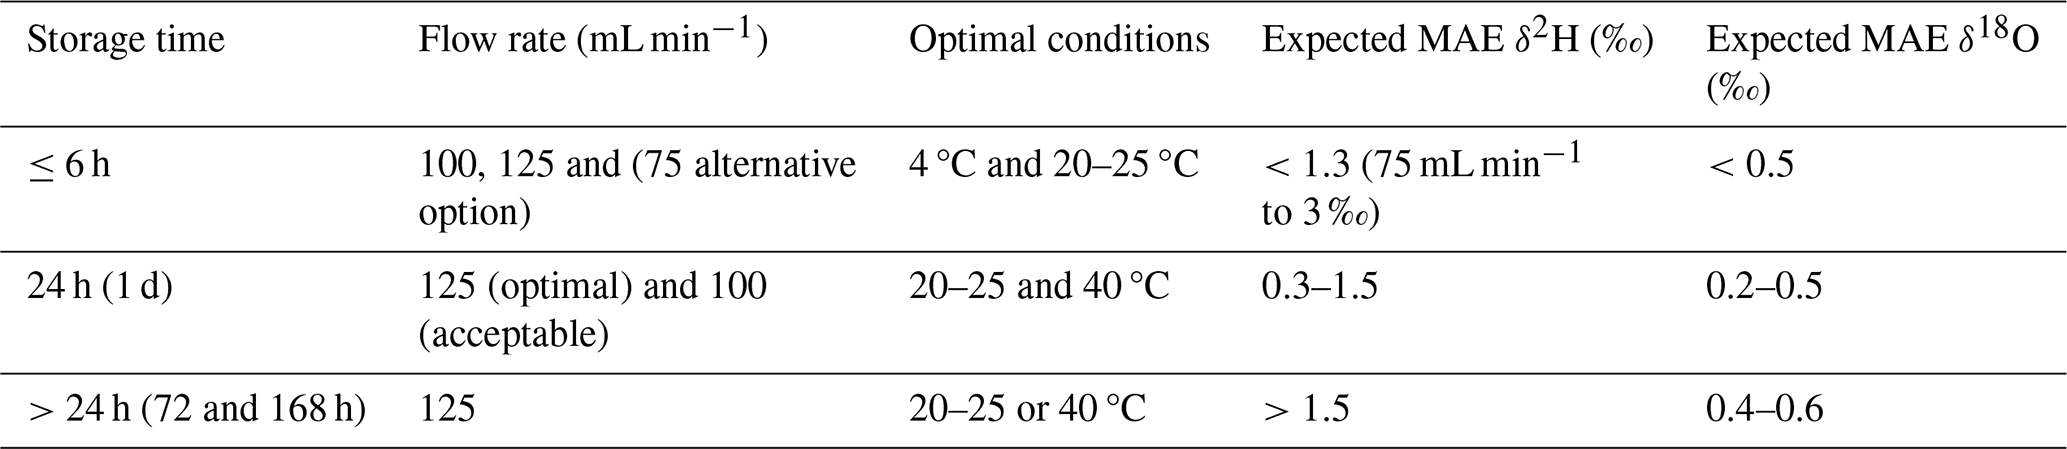
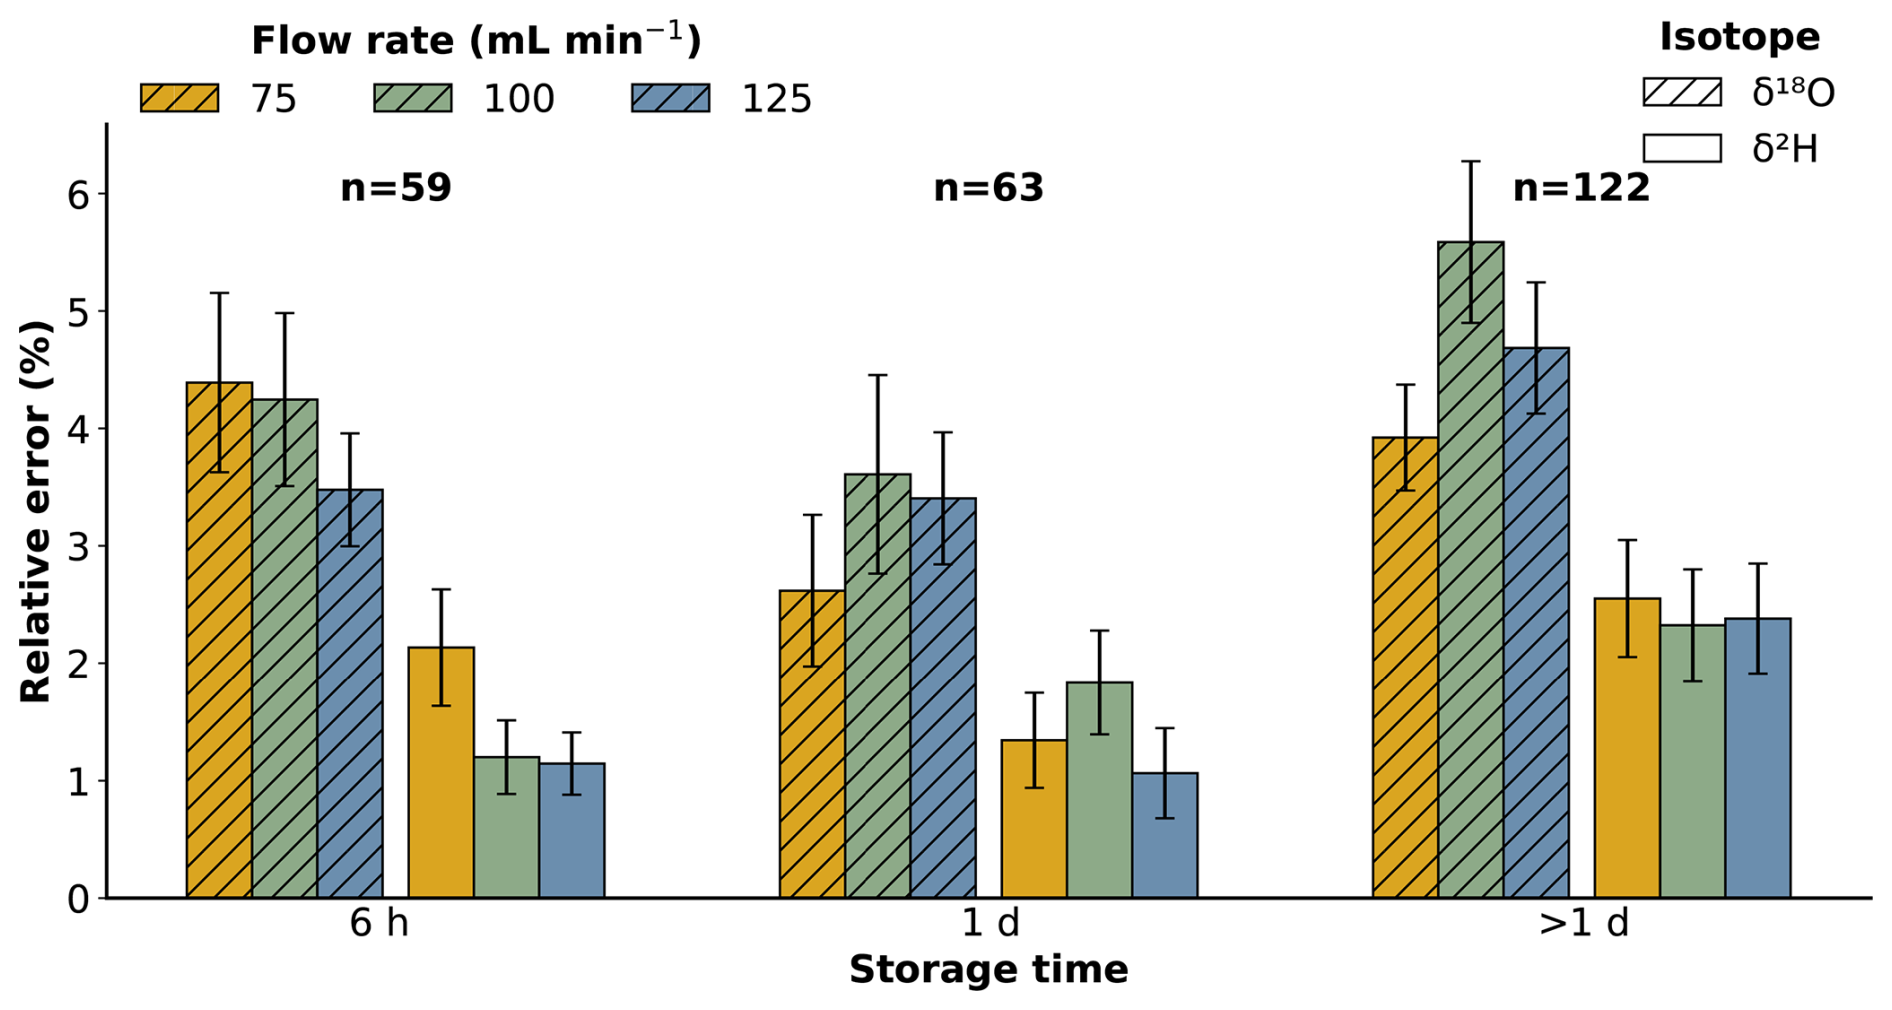
Figure 8Relative error (%) for δ18O (hatched bars) and δ2H (solid bars) as a function of storage time (6 h, 1 d, and >1 d) and sampling flow rates (75, 100, and 125 mL min−1). The number of observations (n) for each storage category is shown above the bars. Error bars represent the standard deviation.
Relative errors were calculated for the sampling flow rates considered optimal (75 to 125 mL min−1), with data categorized into three storage duration groups (6 h, 1 d, and >1 d). Figure 8 shows that isotopic concentrations remained relatively stable for up to 24 h after sampling, with values generally below 4.5 % for δ18O and 2.5 % for δ2H across all analyzed flow rates. However, a distinct increase in relative error occurred when storage duration exceeded 1 d; this trend was particularly pronounced for δ18O, which reached a maximum relative error of 5.6 % at a flow rate of 100 mL min−1. In contrast, δ2H showed greater stability over time, with relative errors remaining below 3 %. Although sampling flow rates influenced the magnitude of the error, storage duration was the primary factor determining isotopic variability.
4.1 Evaluation of containers and criteria for water vapor storage
Our results show that vapor exchange with dry air depended on container type as well as storage temperature and duration. The 250 mL infusion glass bottles exhibited the highest H2O concentration (ppm) among the tested containers. The most likely reason for this is the puncturing of the septum with the syringe needle during sampling. Similar low-level increases during dry-air storage were reported by Magh et al. (2022), indicating that even high-quality vial systems are not completely diffusion-tight when punctured. However, this aspect did not seem to effect water vapor isotope values substantially because in the stability test the 250 mL infusion glass bottles performed best. The 500 mL Aluminum-zip bags had the highest H2O increase under ambient conditions rather than extreme temperatures, suggesting gradual exchange through zip-seal microleaks. In contrast, the 1 L FlexFoil sample bags remained the most stable system, with low variability and no significant increase across storage treatments.
To evaluate whether this minor diffusive exchange could affect isotope values, we tested the reproducibility of a reference water with a known isotopic composition. The 250 mL infusion glass bottles yielded the most stable isotope values, particularly for δ18O, with noticeable δ2H deviations occurring only after 3 d of storage. Although FlexFoil sample bags effectively limited exchange, deviations from the reference water, especially for δ2H, were detectable after 1 d, indicating that low vapor leakage does not necessarily ensure isotopic stability. In contrast, the 500 mL Aluminum-zip bags showed the largest isotopic deviations under the procedures used in this study. These patterns indicate that δ2H was more sensitive than δ18O to storage-related effects, consistent with previous storage assessments (e.g., Magh et al., 2022). Temperature changes promoting condensation, evaporation, and incomplete internal equilibration, together with potential isotope exchange with the bag material (Herbstritt et al., 2023), likely contributed to the greater variability observed in the bag systems.
The combined evaluation of container tightness, vapor storage performance, and practical criteria such as analysis time, reusability, cost, portability, and transport, provided a robust basis for selecting the most suitable container for water vapor sampling. Although secondary criteria were less decisive (see Fig. 5), they helped support the final methodological recommendation. Overall, the 250 mL infusion glass bottles offered best compromise between isotopic preservation and practical applicability, particularly when analyzed shortly after sampling. They can be reused after drying at 60–80 °C and are suitable for field campaigns because large numbers can be transported in insulated cases. For longer storage periods, for instance when sampling at a remote site, we recommend sealing the needle punctures after sampling. Although this procedure was not tested in the present study, it would likely further reduce diffusive exchange and improve the storage performance of glass bottles.
Preservation of the original isotopic signature was the most important criterion. The performance of the 250 mL glass bottles suggests that moderate changes in internal H2O vapor concentration do not necessarily compromise isotope stability when the stored vapor originates from a highly saturated source. This interpretation is consistent with previous observations that limited diffusive exchange may have only minor effects on isotopic composition under high water vapor concentrations (Magh et al., 2022). In contrast, bag systems appeared more susceptible to storage-related isotopic variability under the filling and storage procedures used in this study. These findings indicate that rigid glass containers are more suitable for short-term vapor storage, whereas bag systems require more careful consideration of storage duration, temperature conditions, and potential material-related isotope exchange.
We offer the following possible explanations for the observed differences in isotope values between the bag-type containers and the glass bottles:
- i.
Differences in the sampling of water vapor.
When sampling water vapor in bottles, two syringes are inserted through the septum, serving as an inlet and an outlet for the equilibrated water vapor. Once the sampling time is reached, both syringes are removed. In contrast, both types of bags are filled with equilibrated air using a single syringe. The throughflow sampling may provide a more stable isotope signature because the throughflow duration is longer than the filling time for the bags (12 min per sample vs. 6 min per sample).
- ii.
Isotopic exchange with container material.
Adsorptive isotope exchange between the Aluminum bags material and the sample air may account for their poorer performance (Herbstrit et al., 2023). Thies effect is absent in glass bottles and appears less pronounced in FlexFoil sample bags. Therefore, the production of the aluminum bags might have an influence if they are not pre-treated.
Although 1 L FlexFoil sample bags ranked as the second-best option in our evaluation (Fig. 5), their suitability appears more limited than that of glass bottles. They performed well in leak-tightness tests but this did not translate into comparable isotopic stability during storage. From a practical perspective, their higher cost and larger volume may complicate transport logistics, and their durability may become a limitation when large numbers of samples are required. Reuse in another important consideration, as it requires labor-intensive cleaning to reduce memory effects. For example, Dahlmann et al. (2025) used affordable multilayer 1 L gas bags with modified valves and reported good performance when the bags were new. However, they also identified a storage–time–dependent memory effect, indicating that reuse may be problematic when samples cover broad isotopic ranges or when consecutive sampling events are involved. This is particularly relevant in tracer experiments, where cross-contamination between samples may compromise data quality.
Finally, the 500 mL Aluminum-zip bags performed least favorably among the tested systems, combining limited storage stability with only moderate leak-tightness after prolonged storage. Despite their low cost, they are effectively single-use and more vulnerable to handling damage during transport. Under the filling and storage conditions applied in this study, their use therefore appears less suitable when accurate isotope preservation is required.
The contrasting performance among the tested systems indicates that both leak-tightness and isotopic stability depend on interactions among container material, closure design, internal headspace conditions and temperature sensitivity. For short-term sampling under variable field temperatures, the 250 mL infusion glass bottles remained the most robust option due to their reusability, cost-effectiveness, practical transport capacity, and comparatively stable isotope fluctuation.
4.2 Protocol and optimal container for water vapor sampling and storage
Methods for measuring stable isotopes of water are constantly improved. Water vapor sampling has emerged a novel approach to overcoming the reported limitations and potential biases of extraction-based methods (Kübert et al., 2020; Mennekes et al., 2021). However, this technique requires proper implementation and rigorous, efficient sampling procedures. To reduce uncertainties in water vapor sampling and analysis, we propose a refined protocol that controls those factors most affecting the isotopic signature while ensuring data quality. According to our results, it is essential to consider container type, flow rate, storage time, and temperature conditions, a necessity previously underscored in the literature (Van Duren, 2004; Benetti et al., 2017; Bagheri et al., 2021; Magh et al., 2022; Herbstritt et al., 2023). Our data show that experimental conditions substantially influence the precision of water vapor isotope measurements, especially for δ2H, whereas δ18O remains relatively stable. Therefore, we emphasize maintaining controlled temperature conditions to minimize measurement errors, due to the greater sensitivity to kinetic and diffusive processes (Horita and Wesolowski, 1994; Wen et al., 2008; Lamb et al., 2017; Wei et al., 2022; Weng et al., 2024;).
The results confirmed a progressive increase in H2O vapor concentration, and the septum perforation diameter does not appear to be the cause, as both syringe sizes showed similar patterns. The most plausible explanation is diffusive exchange with ambient air, which initiates immediately after septum perforation during sampling and measurement, although this mechanism warrants further investigation. This pattern was consistent with stronger, δ2H deviations after prolonged storage, highlighting that short storage times are critical to minimize isotopic drift (see Table 3).
Our results regarding the optimal time window for high-quality measurements are consistent with other studies. Dahlmann et al. (2025) and Herbstritt et al. (2023) reported acceptable results for samples stored up to 24 h (±0.7 and ±2.3 ‰ for δ2H and ±0.2 to ±0.9 ‰ for δ18O). Similarly, Magh et al. (2022) indicated that reliable measurements could be obtained up to 3 d after sampling, emphasizing short-term stability while noting an increasing bias by day 7, which closely aligns with our observations. In contrast, Havranek et al. (2023) implemented an automated soil water isotope storage system based on 650 mL flasks that maintained isotope values (±0.9 ‰ for δ18O and ±3.7 ‰ for δ2H) for substantially longer periods under both laboratory and field conditions. This extended stability may be attributed to the larger flask volume, although such setup may be less practical for rapid field sampling and handling. Regardless, sample analysis within the first 24 h should be considered the most robust and conservative approach, though storage up to 3 d can still yield reliable results under controlled conditions. According to our findings, more prolonged storage may lead to significant isotopic deviations, particularly under temperature fluctuations (4 to 40 °C), suggesting progressive vapor exchange and subsequent fractionation over time. Consequently, the system developed by Havranek et al. (2023) represents a platform specifically optimized for autonomous, leak-resistant long-term storage.
Storing water vapor under ambient conditions can preserve the isotopic signal without refrigeration, supporting the feasibility of this method for field campaigns in remote areas or regions with limited infrastructure. Our findings further demonstrate that δ18O was consistently more stable than δ2H and can therefore be used more reliably in ecohydrological applications. Precise measurements require controlling the sampling flow rate, storage time, and temperature, with the best performance obtained under moderate-to-high flow rates, storage within 1 d, and stable conditions. Prolonged storage or extreme temperatures increased deviations, particularly for δ2H, and may compromise data interpretation (Bagheri Dastgerdi et al., 2021; Magh et al., 2022). Minimizing isotopic memory through appropriate material selection therefore remains an important practical challenge (Weng et al., 2024).
We optimized a practical sampling and storage protocol for water vapor isotope analysis by systematically evaluating multiple parameters, including container type, temperature, storage time, and sampling flow rate. Detailed experiments showed that 250 mL infusion glass bottles were the most reliable system for collecting and storing vapor samples for isotope analysis, outperforming 1 L FlexFoil sample bags and 500 mL Aluminum-zip bags. Our results demonstrate that the isotopic stability of water vapor is influenced by container type, storage temperature, storage time, and flow rate. The optimal sampling configuration was achieved at flow rates of 100–125 mL min−1 and temperatures of 20–25 °C. Storage for up to 3 d yields reliable results under controlled conditions. δ18O remained highly stable under nearly all tested conditions, whereas δ2H was more sensitive to storage time and temperature variation. This indicates that faster sample processing, preferably within 1 d, is the most robust strategy to minimize isotopic deviations. Overall, our systematic testing and developed protocol provide a rigorous framework for sampling water vapor for stable isotope analysis, which has great potential for ecohydrological research. It could serve as a semi-in situ alternative for measuring soil and plant water isotopes when true in situ measurements are not feasible, and it can be further applied to sampling atmospheric water vapor (e.g., for studies on ET partitioning).
A potential source of error identified in our sampling configuration is leakage through the septum after syringe perforation, which may allow vapor loss or ambient air intrusion thereby contributing to isotopic fractionation. Increasing the number of replicates number and modestly extending the sampling time can reduce variability and improve quality control. Future applications may benefit from improved sealing systems (e.g., resistant septa, integrated valves, or secondary seals) and experimental controls to better quantify leakage effects, thereby enhancing reproducibility under variable field conditions. Specifically for sampling campaigns in remote locations, we recommend sealing the syringe puncture points immediately after collection. Although not explicitly tested in this study, this measure is expected to further enhance the long-term integrity and performance of the 250 mL infusion glass bottles by minimizing diffusive exchange.
All data supporting the findings of this study, including raw and processed water vapor isotope measurements, calibration files, and experimental metadata, are openly available in the Zenodo repository: https://doi.org/10.5281/zenodo.17667032 (Iraheta et al., 2025).
The supplement related to this article is available online at https://doi.org/10.5194/hess-30-5005-2026-supplement.
AI and EMF designed the study and conducted the laboratory experiments. AI analyzed the data, wrote the first draft of the manuscript, and implemented the revisions. MG developed Python scripts for data analysis and visualization and contributed to the manuscript review. MB supervised the study and contributed to the review and editing of the manuscript.
The contact author has declared that none of the authors has any competing interests.
Publisher's note: Copernicus Publications remains neutral with regard to jurisdictional claims made in the text, published maps, institutional affiliations, or any other geographical representation in this paper. The authors bear the ultimate responsibility for providing appropriate place names. Views expressed in the text are those of the authors and do not necessarily reflect the views of the publisher.
We are grateful to the German Academic Exchange Service (DAAD) for the doctoral scholarship. We kindly appreciate their support. We thank R. Magh and one anonymous reviewer for their constructive and encouraging feedback.
This research has been supported by the Deutsche Forschungsgemeinschaft (grant no. 501530203).
This open-access publication was funded by Technische Universität Braunschweig.
This paper was edited by Miriam Coenders-Gerrits and reviewed by Ruth-Kristina Magh and one anonymous referee.
Allen, S. T. and Kirchner, J. W.: Potential effects of cryogenic extraction biases on plant water source partitioning inferred from xylem-water isotope ratios, Hydrol. Process., 36, e14483, https://doi.org/10.1002/hyp.14483, 2022.
Bagheri Dastgerdi, S., Behrens, M., Bonne, J.-L., Hörhold, M., Lohmann, G., Schlosser, E., and Werner, M.: Continuous monitoring of surface water vapour isotopic compositions at Neumayer Station III, East Antarctica, The Cryosphere, 15, 4745–4767, https://doi.org/10.5194/tc-15-4745-2021, 2021.
Barbeta, A., Burlett, R., Martín-Gómez, P., Fréjaville, B., Devert, N., Wingate, L., Domec, J.-C., and Ogée, J.: Evidence for distinct isotopic compositions of sap and tissue water in tree stems: consequences for plant water source identification, New Phytol., 233, 1121–1132, https://doi.org/10.1111/nph.17857, 2022.
Benetti, M., Reverdin, G., Aloisi, G., and Sveinbjörnsdóttir, Á.: Stable isotopes in surface waters of the Atlantic Ocean: indicators of ocean–atmosphere water fluxes and oceanic mixing processes, J. Geophys. Res.-Oceans, 122, 4723–4742, https://doi.org/10.1002/2017JC012712, 2017.
Beyer, M., Kühnhammer, K., and Dubbert, M.: In situ measurements of soil and plant water isotopes: a review of approaches, practical considerations and a vision for the future, Hydrol. Earth Syst. Sci., 24, 4413–4440, https://doi.org/10.5194/hess-24-4413-2020, 2020.
Ceperley, N., Gimeno, T. E., Jacobs, S. R., Beyer, M., Dubbert, M., Fischer, B., Geris, J., Holko, L., Kübert, A., Le Gall, S., Lehmann, M. M., Llorens, P., Millar, C., Penna, D., Prieto, I., Radolinski, J., Scandellari, F., Stockinger, M., Stumpp, C., Stumpp, C., Tetzlaff, D., Meerveld, I., Werner, C., Yildiz, O., Zuecco, G., Barbeta, A., Orlowski, N., and Rothfuss, Y.: Toward a common methodological framework for the sampling, extraction, and isotopic analysis of water in the Critical Zone to study vegetation water use, WIREs Water, 11, e1727, https://doi.org/10.1002/wat2.1727, 2024.
Chen, Y., Helliker, B. R., Tang, X., Li, F., Zhou, Y., and Song, X.: Stem water cryogenic extraction biases estimation in deuterium isotope composition of plant source water, P. Natl. Acad. Sci. USA, 117, 33345–33350, https://doi.org/10.1073/pnas.2014422117, 2020.
Coplen, T. B.: Guidelines and recommended terms for expression of stable-isotope-ratio and gas-ratio measurement results, Rapid Commun. Mass Spectrom., 25, 2538–2560, https://doi.org/10.1002/rcm.5129, 2011.
Craig, H.: Isotopic variations in meteoric waters, Science, 133, 1702–1703, 1961.
Dahlmann, A., Marshall, J. D., Dubbert, D., Hoffmann, M., and Dubbert, M.: Simple water vapor sampling for stable isotope analysis using affordable valves and bags, Atmos. Meas. Tech., 18, 2607–2618, https://doi.org/10.5194/amt-18-2607-2025, 2025.
De Deurwaerder, H. P. T., Visser, M. D., Detto, M., Boeckx, P., Meunier, F., Kuehnhammer, K., Magh, R.-K., Marshall, J. D., Wang, L., Zhao, L., and Verbeeck, H.: Causes and consequences of pronounced variation in the isotope composition of plant xylem water, Biogeosciences, 17, 4853–4870, https://doi.org/10.5194/bg-17-4853-2020, 2020.
Diekmann, C. J., Schneider, M., Knippertz, P., Trent, T., Boesch, H., Roehling, A. N., Worden, J., Ertl, B., Khosrawi, F., and Hase, F.: Water vapour isotopes over West Africa as observed from space: which processes control tropospheric H2O ∕ HDO pair distributions?, Atmos. Chem. Phys., 25, 5409–5431, https://doi.org/10.5194/acp-25-5409-2025, 2025.
Dubbert, M. and Werner, C.: Water fluxes mediated by vegetation: emerging isotopic insights at the soil and atmosphere interfaces, New Phytol., 221, 1754–1763, https://doi.org/10.1111/nph.15547, 2019.
Gaj, M., Beyer, M., Koeniger, P., Wanke, H., Hamutoko, J., and Himmelsbach, T.: In situ unsaturated zone water stable isotope (2H and 18O) measurements in semi-arid environments: a soil water balance, Hydrol. Earth Syst. Sci., 20, 715–731, https://doi.org/10.5194/hess-20-715-2016, 2016.
Galewsky, J., Steen-Larsen, H. C., Field, R. D., Worden, J., Risi, C., and Schneider, M.: Stable isotopes in atmospheric water vapor and applications to the hydrologic cycle, Rev. Geophys., 54, 809–865, https://doi.org/10.1002/2015RG000512, 2016.
Gunther Liebhard, A., Klik, A., Stumpp, C., and Nolz, R.: Partitioning evapotranspiration using water stable isotopes and information from lysimeter experiments, Hydrolog. Sci. J., 67, 646–661, https://doi.org/10.1080/02626667.2022.2030866, 2022.
Haberstroh, S., Kübert, A., and Werner, C.: Two common pitfalls in the analysis of water-stable isotopologues with cryogenic vacuum extraction and cavity ring-down spectroscopy, Analytical Science Advances, 5, 2300053, https://doi.org/10.1002/ansa.202300053, 2024.
Havranek, R. E., Snell, K., Kopf, S., Davidheiser-Kroll, B., Morris, V., and Vaughn, B.: Technical note: Lessons from and best practices for the deployment of the Soil Water Isotope Storage System, Hydrol. Earth Syst. Sci., 27, 2951–2971, https://doi.org/10.5194/hess-27-2951-2023, 2023.
Havranek, R. E., Snell, K. E., Davidheiser-Kroll, B., Bowen, G. J.,and Vaughn, B.: The Soil Water Isotope Storage System (SWISS): An integrated soil water vapor sampling and multiport storage system for stable isotope geochemistry, Rapid Commun. Mass Spectrom., 34, e8783, https://doi.org/10.1002/rcm.8783, 2020.
Herbstritt, B., Gralher, B., Seeger, S., Rinderer, M., and Weiler, M.: Technical note: Discrete in situ vapor sampling for subsequent lab-based water stable isotope analysis, Hydrol. Earth Syst. Sci., 27, 3701–3718, https://doi.org/10.5194/hess-27-3701-2023, 2023.
Horita, J. and Wesolowski, D. J.: Liquid–vapor fractionation of oxygen and hydrogen isotopes of water from the freezing to the critical temperature, Geochim. Cosmochim. Ac., 58, 3425–3437, https://doi.org/10.1016/0016-7037(94)90096-5, 1994.
Horita, J., Rozanski, K., and Cohen, S.: Isotope effects in the evaporation of water: a status report of the Craig–Gordon model, Isot. Environ. Healt. S., 44, 23–49, https://doi.org/10.1080/10256010801887174, 2008.
Iraheta, A., Malsch-Fröhlich, E., Gerchow, M., and Beyer, M.: Water vapor isotope sampling dataset for the study “Technical note: Water vapor sampling for the analysis of water stable isotopes in trees and soils – optimizing sampling protocols” (Version 1.0), Zenodo [data set], https://doi.org/10.5281/zenodo.17667032, 2025.
Koeniger, P., Marshall, J. D., Link, T., and Mulch, A.: An inexpensive, fast, and reliable method for vacuum extraction of soil and plant water for stable isotope analyses by mass spectrometry, Rapid Commun. Mass Spectrom., 20, https://doi.org/10.1002/rcm.5198, 2011.
Kübert, A., Paulus, S., Dahlmann, A., Werner, C., Rothfuss, Y., Orlowski, N., and Dubbert, M.: Water stable isotopes in ecohydrological field research: comparison between in situ and destructive monitoring methods to determine soil water isotopic signatures, Front. Plant Sci., 11, 387, https://doi.org/10.3389/fpls.2020.00387, 2020.
Kühnhammer, K., Dahlmann, A., Iraheta, A., Gerchow, M., Birkel, C., Marshall, J. D., and Beyer, M.: Continuous in situ measurements of water stable isotopes in soils, tree trunk and root xylem: field approval, Rapid Commun. Mass Spectrom., 36, e9232, https://doi.org/10.1002/rcm.9232, 2022.
Lamb, M., Horita, J., and Arakawa, A.: Measurement of equilibrium fractionation factor of HDO/H2O at temperatures between −86 and +5 ° C: implications for Antarctic ice core records, Isot. Environ. Healt. S., 54, 615–627, https://doi.org/10.1080/10256016.2018.1435533, 2017.
Magh, R.-K., Gralher, B., Herbstritt, B., Kübert, A., Lim, H., Lundmark, T., and Marshall, J.: Technical note: Conservative storage of water vapour – practical in situ sampling of stable isotopes in tree stems, Hydrol. Earth Syst. Sci., 26, 3573–3587, https://doi.org/10.5194/hess-26-3573-2022, 2022.
Mennekes, D., Rinderer, M., Seeger, S., and Orlowski, N.: Ecohydrological travel times derived from in situ stable water isotope measurements in trees during a semi-controlled pot experiment, Hydrol. Earth Syst. Sci., 25, 4513–4530, https://doi.org/10.5194/hess-25-4513-2021, 2021.
Orlowski, N., Breuer, L., Angeli, N., Boeckx, P., Brumbt, C., Cook, C. S., Dubbert, M., Dyckmans, J., Gallagher, B., Gralher, B., Herbstritt, B., Hervé-Fernández, P., Hissler, C., Koeniger, P., Legout, A., Macdonald, C. J., Oyarzún, C., Redelstein, R., Seidler, C., Siegwolf, R., Stumpp, C., Thomsen, S., Weiler, M., Werner, C., and McDonnell, J. J.: Inter-laboratory comparison of cryogenic water extraction systems for stable isotope analysis of soil water, Hydrol. Earth Syst. Sci., 22, 3619–3637, https://doi.org/10.5194/hess-22-3619-2018, 2018.
Orlowski, N., Rinderer, M., Dubbert, M., Ceperley, N., Hrachowitz, M., Gessler, A., Rothfuss, Y., Sprenger, M., Heidbüchel, I., Kübert, A., Beyer, M., Zuecco, G., and McCarter, C.: Challenges in studying water fluxes within the soil–plant–atmosphere continuum: a tracer-based perspective on pathways to progress, Sci. Total Environ., 881, 163510, https://doi.org/10.1016/j.scitotenv.2023.163510, 2023.
Penna, D., Hopp, L., Scandellari, F., Allen, S. T., Benettin, P., Beyer, M., Geris, J., Klaus, J., Marshall, J. D., Schwendenmann, L., Volkmann, T. H. M., von Freyberg, J., Amin, A., Ceperley, N., Engel, M., Frentress, J., Giambastiani, Y., McDonnell, J. J., Zuecco, G., Llorens, P., Siegwolf, R. T. W., Dawson, T. E., and Kirchner, J. W.: Ideas and perspectives: Tracing terrestrial ecosystem water fluxes using hydrogen and oxygen stable isotopes – challenges and opportunities from an interdisciplinary perspective, Biogeosciences, 15, 6399–6415, https://doi.org/10.5194/bg-15-6399-2018, 2018.
Rothfuss, Y. and Javaux, M.: Reviews and syntheses: Isotopic approaches to quantify root water uptake: a review and comparison of methods, Biogeosciences, 14, 2199–2224, https://doi.org/10.5194/bg-14-2199-2017, 2017.
Rothfuss, Y., Quade, M., Brüggemann, N., Graf, A., Vereecken, H., and Dubbert, M.: Reviews and syntheses: Gaining insights into evapotranspiration partitioning with novel isotopic monitoring methods, Biogeosciences, 18, 3701–3732, https://doi.org/10.5194/bg-18-3701-2021, 2021.
Seeger, S. and Weiler, M.: Dye-tracer-aided investigation of xylem water transport velocity distributions, Hydrol. Earth Syst. Sci., 27, 3393–3404, https://doi.org/10.5194/hess-27-3393-2023, 2023.
Simonin, K. A., Roddy, A. B., Link, P., Apodaca, R., Tu, K. P., Hu, J., Dawson, T. E., and Barbour, M. M.: Isotopic composition of transpiration and rates of change in leaf water isotopologue storage in response to environmental variables, Plant Cell Environ., 36, 2190–2206, https://doi.org/10.1111/pce.12129, 2013.
Sprenger, M., Leistert, H., Gimbel, K., and Weiler, M.: Illuminating hydrological processes at the soil–vegetation–atmosphere interface with water stable isotopes, Rev. Geophys., 54, 674–704, https://doi.org/10.1002/2015RG000515, 2016.
Sturm, P. and Knohl, A.: Water vapor δ2H and δ18O measurements using off-axis integrated cavity output spectroscopy, Atmos. Meas. Tech., 3, 67–77, https://doi.org/10.5194/amt-3-67-2010, 2010.
Tetzlaff, D., Smith, A., Kleine, L., Daempfling, H., Freymueller, J., and Soulsby, C.: Integrated ecohydrological hydrometric and stable water isotope data of a drought-sensitive mixed land use lowland catchment, Earth Syst. Sci. Data, 15, 1543–1554, https://doi.org/10.5194/essd-15-1543-2023, 2023.
Van Duren, M.: Investigation on effects of bottle material on water evaporation and isotopic changes in δ2H and δ18O during sample storage, International Symposium on Quality Assurance for Analytical Methods in Isotope Hydrology, 85–87, https://inis.iaea.org/records/36330-9kf23, 2004.
Volkmann, T. H. M., Haberer, K., Gessler, A., and Weiler, M.: High-resolution isotope measurements resolve rapid ecohydrological dynamics at the soil–plant interface, New Phytol., 210, 839–849, https://doi.org/10.1111/nph.13868, 2016.
Magh, R.-K., Gralher, B., Herbstritt, B., Kübert, A., Lim, H., Lundmark, T., and Marshall, J.: Technical note: Conservative storage of water vapour – practical in situ sampling of stable isotopes in tree stems, Hydrol. Earth Syst. Sci., 26, 3573–3587, https://doi.org/10.5194/hess-26-3573-2022, 2022.
Wen, M., He, D., Li, M., Ren, R., Jin, J., and Si, B.: Causes and factors of cryogenic extraction biases on isotopes of xylem water, Water Resour. Res., 58, e2022WR032182, https://doi.org/10.1029/2022WR032182, 2022.
Wen, X., Lee, X., and Xiao, W.: Simultaneous measurement of water vapor δD and δ18O using TDLAS: field deployment and application, J. Hydrol., 349, 489–500, https://doi.org/10.1016/j.jhydrol.2007.11.021, 2008.
Meyer, A. L. and Welp, L. R.: Water vapor stable isotope memory effects of common tubing materials, Atmos. Meas. Tech., 17, 6193–6212, https://doi.org/10.5194/amt-17-6193-2024, 2024.
Zhang, B., Xu, Q., Gao, D., Wang, T., Xu, W., Huang, J., and Zuo, H.: Ecohydrological separation between tree xylem water and groundwater: insights from two types of forests in subtropical China, Plant Soil, 480, 625–635, https://doi.org/10.1007/s11104-022-05607-x, 2022.