
the Creative Commons Attribution 4.0 License.
the Creative Commons Attribution 4.0 License.
 | 28 Jul 2026
Continuous in situ monitoring of a labeled-water pulse through a boreal Scots pine forest: vertical and horizontal fluxes
Maren Dubbert
Teresa E. Gimeno
Ruth-Kristina Magh
Kathrin Kühnhammer
David Dubbert
Paul Koeniger
Matthias Cuntz
Water labeled with stable isotopes provides a conservative tracer, being neither produced nor consumed, for water flowpaths within soils and root systems. We added a strong, evenly distributed 2HHO label to one m2 of soil surface and continuously monitored its passage downward into the soil and upward into the stems of surrounding trees, with the objective of illuminating spatiotemporal lateral root water uptake and overlap. The study was conducted during the historic drought of 2018 in a mature Scots pine (Pinus sylvestris) forest growing on sandy soil in northern Sweden. Continuous in situ isotopic measurements of tree xylem water evidenced root system overlap of six trees within the labeled square meter. This result is consistent with previous estimates from labelled nutrient uptake measurements at this site. However, label uptake differed sharply among trees, even within the same radius; 90 % of the label was taken up by one of the two trees closest to the labelled plot. Horizontal transport rates in tree roots averaged 0.17±0.05 m d−1, meaning that the arrival of label pulse in tree stems was delayed by 6–33 d from first tree to last. Root water uptake by trees appeared restricted to the upper 60 cm of mineral soil, even at the peak of the drought; the volume-weighted average depth of uptake was 30.6±1.2 cm throughout the study period. Label intensity of the mineral soil weakened throughout the drought, consistent with the notion that the label was being dispersed or diluted into pre-event water. Our data provide a daily and three-dimensional description of the passage of a labeled water pulse, highlighting the heterogeneity in horizontal water distribution by roots and the uneven partitioning of label among individual trees in a boreal forest.
- Article
(1223 KB) - Full-text XML
-
Supplement
(654 KB) - BibTeX
- EndNote


Trees take up enormous quantities of water from the soil to grow and survive. This uptake is driven by atmospheric demand for water vapor (Campbell and Norman, 2012), and is constrained by soil moisture availability and root distributions (Bachofen et al., 2024; McCulloh et al., 2003). In forests, roots of different individuals, and their mycorrhizae, extend and overlap both vertically and horizontally, thus sampling across heterogenous water availabilities (Bachofen et al., 2024; Goldsmith et al., 2019), while also competing for water and nutrients (Henriksson et al., 2021; Lutter et al., 2021). So far, vertical patterns of root water uptake have been studied more often than horizontal patterns (Beyer et al., 2016; Jackson et al., 1996; Stocker et al., 2023).
In one of the rare studies investigating horizontal uptake patterns in forests, isotopical label uptake was detected as far as 3–6 m from the stem (Sternberg et al., 2002, 2005). Whether vertical or horizontal, long-distance transport comes at a considerable carbon expense to the tree (Guswa, 2008), which must ultimately limit the benefits of long horizontal roots. The costs and benefits are complicated by the near universality of common mycorrhizal networks (Martin and van der Heijden, 2024; Simard and Durall, 2004), which could extend uptake zones beyond the range of individual root systems. At present, the physiological significance of these networks is insufficiently quantified (Henriksson et al., 2023; Martin and van der Heijden, 2024). Here, we use “root” water uptake as shorthand to refer to tree roots plus their mycorrhizal partners.
These observations raise questions about the degree of overlap in uptake zones between individual trees (Henriksson et al., 2021; Kulmatiski et al., 2020). One might argue that, at the extreme, root systems might be so territorial that we observe no overlap in water uptake and the label would be detected in only one tree around the plot. Each tree's roots system might grow as if it owned property, perhaps avoiding other roots when they are approached (Mahall and Callaway, 1992). At the other extreme, root systems might overlap extensively, making use of the limited soil volume in their immediate vicinity, whether it is occupied by other roots or not. Most data suggest the latter (Kulmatiski et al., 2010; Lutter et al., 2021; Lwila et al., 2024), but there are also instances of some degree of territoriality (e.g., Kuiper and Coutts, 1992). If this is a continuous variable, then quantification of this overlap might be as simple as counting the labelled trees around a 1 m2 labelling plot. Such quantification is needed for scaling water and nutrient uptake from individual trees to forest stands (Manoli et al., 2014), as well as for estimating belowground competition in silviculture and production ecology (Lutter et al., 2021). The overlap might reveal novel underground ecological processes, for example water sharing (Kakouridis et al., 2022) or stealing among individuals, which would influence the benefits of water-use efficiency (Cohen, 1970).
Tracing water flowpaths within soils is challenging and often involves destructive sampling, which implies large disturbances to the soil column and potentially irreversible harm to the root system. In situ methods, based on online monitoring of soil and tree xylem water isotopic composition, allow for tracking water through the soil-plant-atmospheric continuum in real time (Beyer et al., 2020). But so far, there have been few isotopic assessments of water uptake dynamics (Gessler et al., 2022; Kühnhammer et al., 2022, 2023; Landgraf et al., 2022; Seeger and Weiler, 2021; Volkmann et al., 2016).
We studied these questions using in situ methods in a boreal forest in northern Sweden during the “drought of the century” in the summer of 2018 (Gutierrez Lopez et al., 2021). This episode provided a unique condition wherein long horizontal or deep vertical roots might have been important, especially if they reached into distant water sources (Bachofen et al., 2024). Such a shift in water sources might (Lindroth et al., 2020) or might not (Gessler et al., 2022) compensate for soil drying, holding canopy evapotranspiration constant (Bachofen et al., 2024). Responses to this drought event have already been described elsewhere in terms of sap flow (Gutierrez Lopez et al., 2021), latent heat flux (Lindroth et al., 2020; Mensah et al., 2021), and vertical water uptake patterns (Gessler et al., 2022). Horizontal water uptake over the whole growing season was described in an earlier study at the same site (Henriksson et al., 2021), but the short-term dynamics during the peak of the drought and the recovery period have not been investigated previously.
Here, we monitored continuously and in situ soil and tree xylem water isotopic composition during the peak and drought recovery periods. This experiment followed the dynamics and spatial distributions of a point-labeling with 2HHO in a mature pine forest. We aimed to quantify the degree of territoriality in water uptake by counting labelled tree individuals, to quantify rates of horizontal water transport through roots, and to describe the fate of a label pulse applied to the mineral soil surface of a deep sandy soil.
2.1 Study site
This study was conducted in a ∼100-year-old naturally regenerated, homogeneous forest dominated by Scots pine (Pinus sylvestris L.), in northern Sweden (Rosinedalsheden, 64°10′ N, 19°45′ E, 145 ). Understory vegetation was composed of ericaceous shrubs (Vaccinium myrtillus L. and Vaccinium vitis-idaea L.) and a layer of mosses and lichens. In 2013, the leaf area index was 2.7 m2 m−2. The stand averaged 18.6 (SD =0.1) cm in diameter and 17.5 (SD <0.1 m) m in total height in 2013 (Lim et al., 2015). The climate is typical of the northern boreal zone: average annual temperature and precipitation are 2.4 (SD =0.8) °C and 638 (SD =107) mm, respectively (Klosterhalfen et al., 2023). Winters are cold and long; summers are usually cool and wet. The photosynthetically active period extends from mid-April to mid-November (Tarvainen et al., 2018; Vernay et al., 2020). A soil description was performed at a nearby forest, approximately 6 km away, under similar stand and landscape conditions. The soil was labeled a Regosol that had formed on fluvial sediment. The texture was considered loamy sand to sandy loam with lenses of silt loam at 25–45 cm depth. The clay content was less than 11 % (Plamboeck et al., 1999).
The sample plot was located approximately 30 m from an eddy covariance system installed on a tower above the uniform canopy (21.5 m above the ground) (Lindroth et al., 2020; Zhao et al., 2022). The eddy covariance system measured latent energy fluxes from the canopy over the whole study period using H2O mixing ratios measured with a gas analyzer (LI-7200, LI-COR Environmental, Lincoln, USA) at 20 Hz frequency (Jocher et al., 2017).
The study was conducted from June to September 2018, when northern Scandinavia, like much of central Europe, underwent an exceptional drought; in Scandinavia, it was the driest period in fifty years (Gutierrez Lopez et al., 2021; Lindroth et al., 2020). From snowmelt (18 May) until 23 July, a period of more than two months, the study area received only 56 mm precipitation. The drought was then broken by a series of strong rainfall events that delivered 85 mm in eight days. We applied the soil label in the middle of the drought period and tracked its passage through the last two weeks of the drought and into the wetter period afterward.
2.2 Continuous measurements of water isotopic composition
Experimental design
We selected 15 Scots pines within a circular plot of 12 m radius around the labeled area (Fig. 1). To study horizontal transport of water, we applied isotopic tracer on 10 July 2018 over a 1 m2 area in the center of the experimental plot. We present the isotopic data in δ-notation (Gonfiantini, 1978), with units of per mil (‰) relative to the VSMOW-SLAP scale. The tracer consisted of a mixture of 25 L of deionized tap water (δ2H: −90 ‰) with 200 mL of 2H-enriched water (2H2HO, 99.5 %), yielding a 2H atom fraction of 0.0163 (δ2H≅106 000 ‰). The 2H-enriched water was injected at the surface of the mineral soil (i.e., underneath the moss and humus layers) by forcing a rigid plastic tube through the organic layer and injecting water into the created hole using a syringe. To ensure homogeneous distribution of the tracer, we applied 70 mL at each of five points within each 12.5 cm×12.5 cm grid across the 1 m2 label area, totaling 320 injections (22.4 L). After injections on the grid were complete, we injected the small volume of remaining label randomly within the labeled area.

Figure 1Map of studied trees (numbered and yellow-filled circles). The 1 m2 plot labeled with 2H2O is shown in the center as a red square. The trees labeled with and subsequently dropped from the study are filled with white. Two Picarro L2130i analyzers were placed in a covered box adjacent to the plot center. Horizontal distance from the center of the labeled plot is indicated by the blue concentric rings and blue numbers. Distances of individual trees from the plot center are presented in Table S1 in the Supplement.
For the sake of completeness, it should be noted that two additional labeling experiments were attempted. The first, on the 6 June 2018 (soon after snowmelt), consisted of applying a weaker (δ2H=3500 ‰) label to the same 1 m2 plot. The label was briefly detected in the surface soils but did not show up in the trees at all. Therefore, we repeated the labeling with the stronger (δ2H≅106 000 ‰) label solution described above, on 10 July. The second experiment, on the 20 July 2018, was designed to detect deep water uptake (Burgess et al., 1998; Caldwell and Richards, 1989; Dawson and Pate, 1996; Moreira et al., 2000). We applied 1 L of deionized water containing 2.94 mL of (δ18O≅470 ‰), at a depth of 50 cm, directly under the stems of five trees (see Beyer et al., 2016, 2018) for further application details). We did not detect the 18O label in any of these trees (data not shown). However, to avoid potential interferences between labeling experiments, these trees were dropped from consideration. They are represented by purple symbols in Fig. 1 and not addressed further.
2.3 Volumetric water content
Volumetric soil water content (VWC) was measured along a vertical profile inside the labeled area using TDR probes (5TM, Metergroup, Pullman, USA). The TDR probes were placed at 10, 30, 50, 70, and 100 cm soil depth. For our sandy soils, we used the factory-default calibration. We took particular care when installing both the TDR and the isotope probes (see Sect. 2.3.2) to avoid damaging roots during probe installation, hoping that the roots from all surrounding trees would continue to take up water normally from the labeled block of soil. We estimated total water uptake by measuring the daily decline in VWC at each depth, multiplying VWC by the soil depth represented by that sample, and accumulating the decline over all depths (the single-step, multi-layer water balance of Guderle and Hildebrandt, 2015):
Where ΣU is the sum of uptake per day, ΔVWCn is the daily change in VWC at depth n, Dn is the thickness of the layer represented by each VWC (always 20 cm). This approach yields a water consumption rate (ΣU) in cm d−1, integrated over the upper 60 cm of mineral soil. Because the uppermost TDR probe was located 10 cm deep in the mineral soil and was covered by the forest floor, we assumed there would be little contribution of soil surface evaporation to this measured change in VWC and that it would therefore be dominated by root uptake. We return to the broader topic of surface evaporation in the discussion.
We then measured the mean depth of uptake was by weighting ΔVWCn⋅Dn of each layer by its mean depth, summing, and dividing by the total uptake, thus:
Where UD is mean uptake depth and 10, 30, 50 cm are the depths of each VWC sensor.
In situ measurements of the soil and plant water isotopic composition
From June to September 2018, we measured the stable isotopic composition (δ2H and δ18O) and soil VWC across depth inside the 1 m2 plot. The isotopic composition was measured with custom-made equilibration probes inserted at depths of 5, 10, 15, 20, 30, 50, 70, and 100 cm depth in the center of the labeled soil volume. The probes consisted of two PFA Teflon tubes (1/8′′AD, 1/16′′ID, Teddington AB, Skogås, Sweden) that were glued (Pattex Kraft-Mix, Henkel AG & Co. KGaA, Düsseldorf, Germany) into a gas-permeable membrane (Accurel GP V8/2HF, 3 M, Germany; 0.155 cm wall thickness, 0.55 cm i.d., 0.86 cm o.d.) of 10 cm length. One of the two Teflon tubes was inserted a short distance into the probe. It provided air drawn through a desiccant tower (Drierite, Hammond, Xenia, OH, USA) reducing potential contamination with ambient water vapor. The second tube was placed at the opposite end of the probe to ensure that the air stream would equilibrate isotopically with soil water before leaving the probe. This tube was connected to a Picarro 16-port distribution manifold (A0311, Picarro Inc., Santa Clara, USA). The manifold was connected to a Picarro L2130i CRDS (Cavity Ring-Down Spectroscopy) water isotope analyzer. We verified that materials used did not affect measured isotopic composition by placing them in ambient air and comparing to measurements without soil probes. To prevent condensation, the PFA tubes were heated by electrical heating lines (TE's Raychem, TE Connectivity, Schaffhausen, Switzerland) wrapped in foam insulation tubes (Armacell, Münster, Germany).
We also measured the isotopic composition of tree xylem using the borehole equilibration method (Marshall et al., 2020). To measure xylem δ2H and δ18O, a borehole was drilled all the way through the center of each tree. All trees were cored along the N–S axis at a height of 1.3 m using an electric drill with a 5 mm bit. We rinsed the boreholes with acetone to avoid the obstruction of cells by pitch (Marshall et al., 2020). The inlet of the borehole was open to the atmosphere to allow equilibration of ambient water vapor with liquid xylem water evaporated inside the borehole. We have previously shown that equilibration occurs even if ambient water vapor is added at the borehole inlet (Marshall et al., 2020). Although the continuity of the xylem tracheids is broken by the drilling, the borehole walls remain in communication with the flowing water in the adjacent xylem (Marshall et al., 2020) such that arrival time of a water label matches predictions based on sap flow (Kathrin Kühnhammer, personal communication, 2025). The outlet of the borehole was coupled to 6 mm PFA tube (Teddington AB, Skogås, Sweden) using stainless steel connectors (Swagelok) plumbed to a rotary 16-port valve (Vici, Valco Europe, Schenkon, Switzerland). The valve was connected to a second Picarro L2130i CRDS water isotope analyzer. Again, electrical heating lines wrapped in foam insulation pipes were installed to prevent condensation in the PFA tubing and the valve. This setup allowed continuous measurements of water concentration and isotopic composition of the water vapor equilibrated inside the borehole and allowed us to calculate the isotopic composition of the xylem water (Marshall et al., 2020).
All trees and the water isotope values of the atmosphere were monitored sequentially. Automatic calibration of the analyzer was performed every five hours using the Picarro Standard Delivery Module (SDM). The SDM injects a water standard of known isotopic composition into the analyzer's vaporizer. Each of the standards was measured in vapor phase for 20 min at two flow rates: 0.08 and 0.05 µL s−1. The two injection rates produced different water vapor concentrations, which we used to correct for the concentration-dependence of the isotope measurements. At each injection rate, we used two standards covering the range of expected variability in δ2H and δ18O: depleted deionized water ( and ) and a homemade δ2H-enriched standard (δ2H=225.8 ‰, ). Any drift in instrument readings would have been detected and corrected for the multiple calibrations within each day. The isotopic composition of the two standards was determined on an isotope ratio mass spectrometer (DeltaV, Thermo Fisher) at the Stable Isotope Laboratory of the Swedish University of Agricultural Science (Umeå, Sweden). Each tree was measured for at least 30 min and the duration of the measurement interval for each tree was adjusted depending on the tube length. To avoid memory effects when the valve had just turned, we used only the data from the last five minutes in each valve position. To further avoid non-steady state conditions, as when condensation may have been present or stem temperatures were rapidly changing, we deleted values of water concentration with a standard deviation higher than 1000 µmol mol−1 or values of water concentration that were higher than 50 000 µmol mol−1.
Borehole temperature is a critical parameter for calculating xylem isotopic composition because it is needed for the conversion of water isotope values in measured vapor phase to liquid xylem water (Eqs. 1–3). Copper-constantan thermocouples (Omega Engineering, Norwalk, CT, USA) were installed at approximately 2 cm depth within the borehole and in contact with the surface of the xylem tissue to measure the temperature of the xylem surface. We further filtered all data for which difference in temperature between the borehole and the atmosphere was higher than 5 °C, which occurred most often when the temperature was rapidly changing in the morning and evening. As above, this was done to reduce the effects of condensation within the borehole or the tubing and to avoid the risk of non-steady state temperatures conditions within the borehole.
2.4 Data processing and analyses
2.4.1 Calculation of δ2H and δ18O of xylem water
After calibration and instrument drift-correction, the xylem liquid water δ18O and δ2H values were estimated using the relations proposed by Majoube (1971) for describing the equilibrium fractionation between the liquid and vapor phases of δ2H and δ18O based on the temperature (T in K) measured by the thermocouples in the borehole:
The resulting α-values were multiplied by the raw isotope ratios (R, e.g., 2H/1H) of equilibrated water vapor () to estimate liquid water isotopic ratio ():
They were then converted back to delta notation.
The soil liquid water values were estimated using a “regression” method that uses a polynomial calibration curve to simultaneously account for isotopic equilibration (Majoube, 1971), device-specific effects of water vapor concentration, and the interaction of the sampling probe with the soil (Beyer et al., 2018, 2020; Oerter and Bowen, 2017). Regressions were fitted to measurements of dried bulk soil from the field site, placed in impermeable bags and filled with liquid water of known isotopic composition (“standards”). As with the xylem, these calibration measurements were made each time the manifold cycled through the samples throughout the field campaign. The resulting regression equations were:
with adjusted R2=0.9987, and:
with adjusted R2=0.85.
2.4.2 Calculation of line-conditioned excess
To detect subtle increases in the δ2H-enriched water in the trees, we used the local meteoric water line to calculate line-conditioned deuterium-excess (lc-excess) (Landwehr and Coplen, 2006). The local meteoric water line was estimated from precipitation collected at the Svartberget field station (https://www.icos-sweden.se/Svartberget, last access: 29 June 2026), 8 km away. There were 225 samples collected at least biweekly during the whole of 2017 and 2018. The resulting LMWL was:
with R2=0.97.
The lc-excess was then calculated as:
Values of lc-excess above zero were interpreted as evidence of the uptake of δ2H-enriched water. The advantage of this approach is that it removes background variation in δ2H that is correlated with δ18O, revealing low levels of labeling more clearly than the raw isotopic compositions. All analyses were performed using either excel or the base package of R (R Core Team, 2023).
The summer of 2018 began with only one significant rainfall after the snowpack melted. During the drought that followed, ecosystem evapotranspiration fell by about 50 % but recovered immediately after the first rains (Fig. 2).
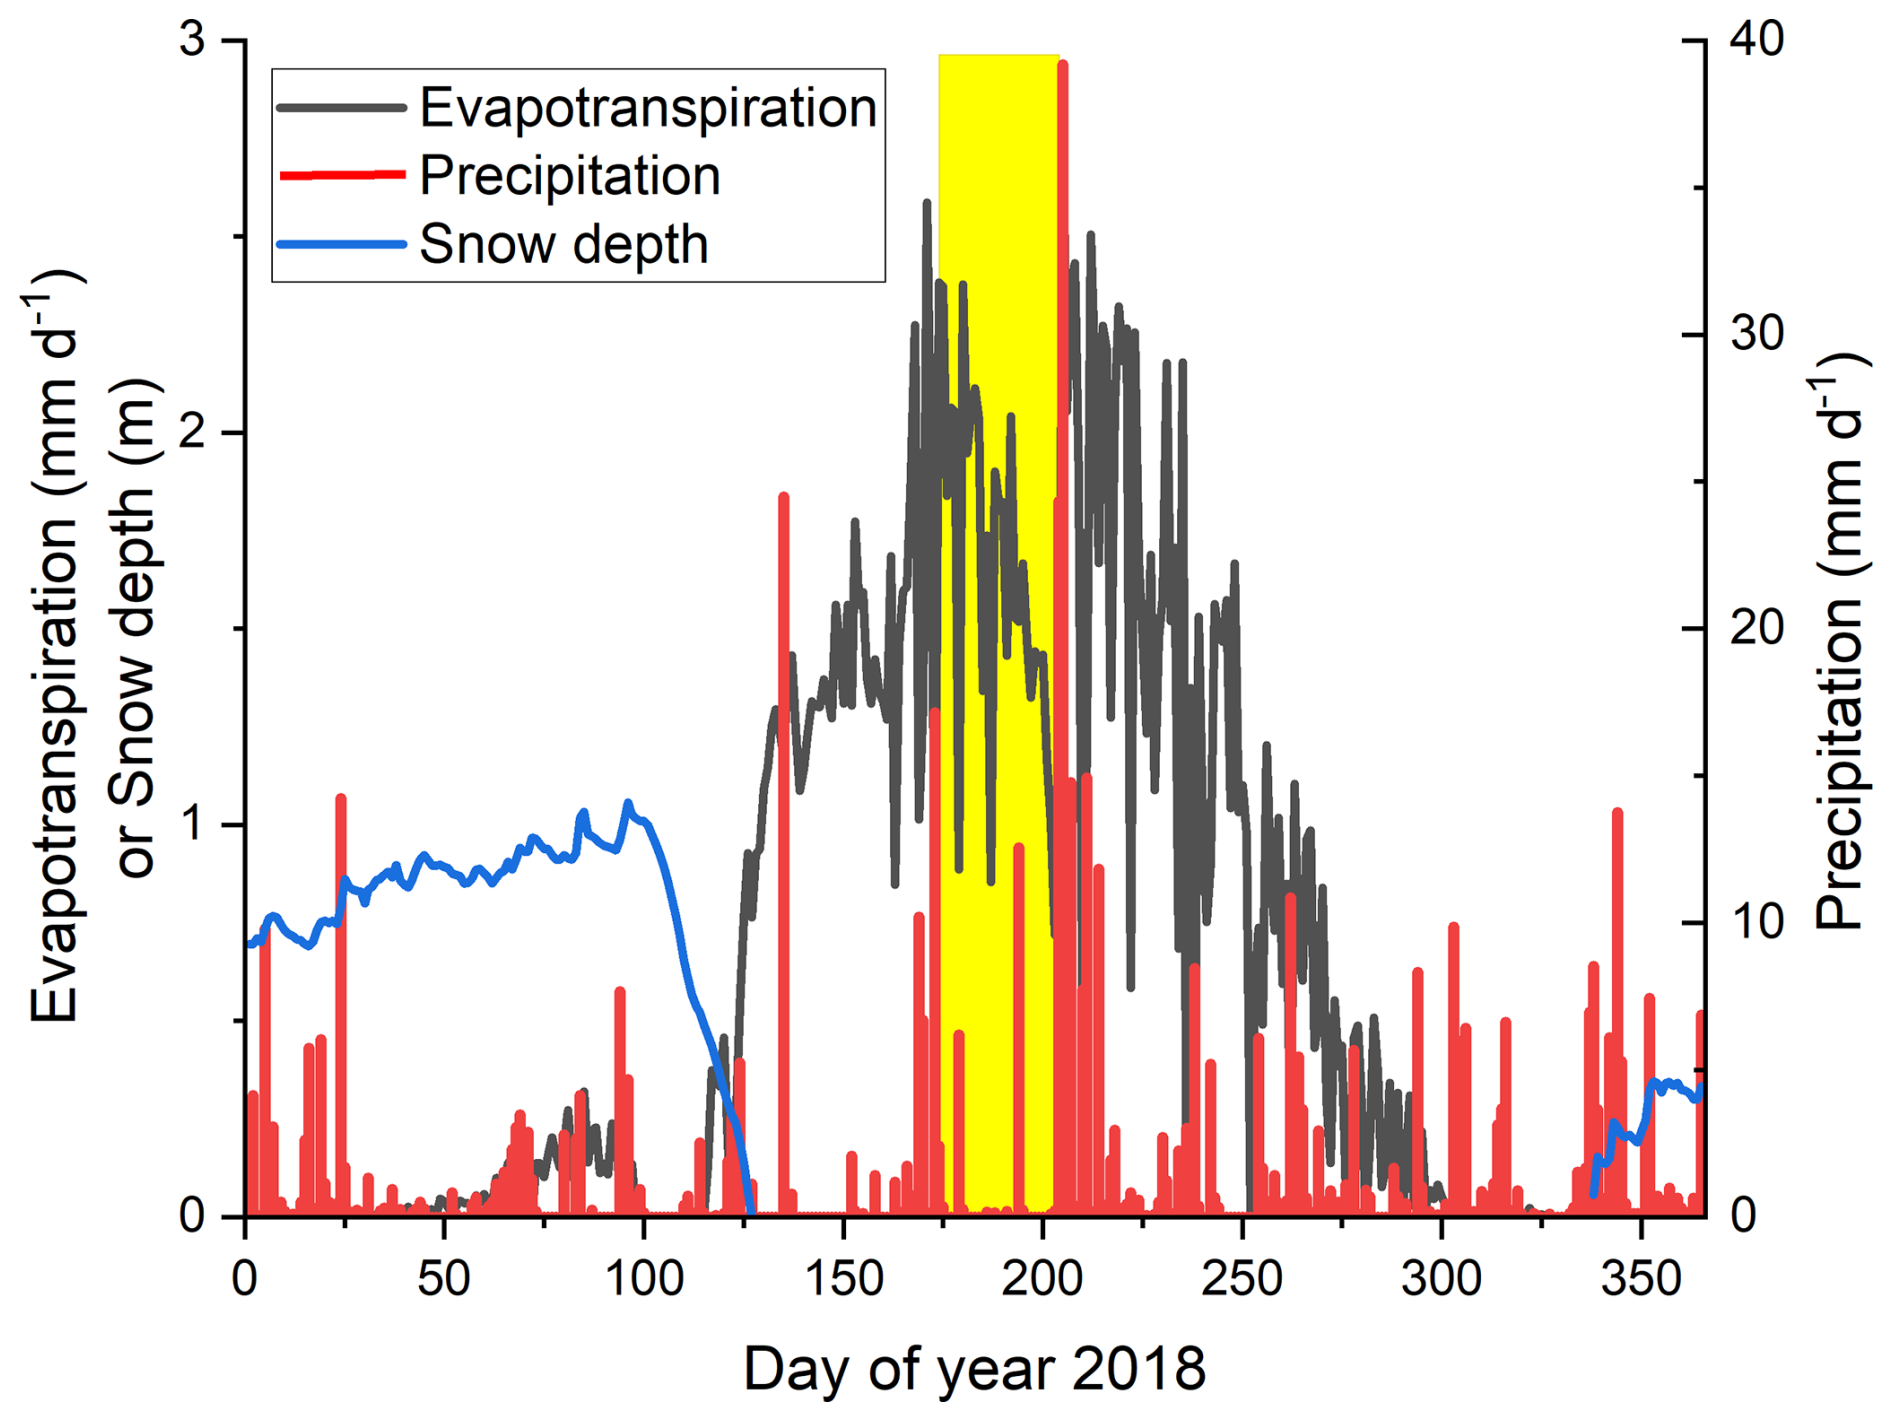
Figure 2Daily evapotranspiration at the Rosinedalheden boreal pine forest in calendar year 2018. The yellow box highlights the period of the drought. The drought began on day 174, more than a month after the snowpack melted (blue line), and was interrupted by only one small precipitation event (red bars). The drought ended with a series of large events beginning on day 204.

Figure 3(a) Soil VWC (VWC) by depth under the labeled 1 m2 area; (b) Total water storage summed over 60 cm of soil depth. Slopes of regression lines were fitted to the drought-induced decline, neglecting the day after the labeling (m); (c) Mean daily water uptake depth. The strong positive excursions are associated with labeling and rainfall events. In all panels, the drought period is shown by the yellow box and the labeling date is shown as a vertical, dashed red line.
During the drought, the VWC fell at all depths within the upper 50 cm of soil (Fig. 3a). In contrast, the 70 cm depth showed almost no variation in VWC, consistent with our visual observations that there were few roots there. The isotopic labeling, which amounted to 25 mm of water on this plot, occurred on DOY 191, and was accompanied by small, short-lived increases in VWC at 10 and 30 cm. The depth-weighted VWC in the upper 60 cm of soil (Fig. 3b) declined by 0.57 mm d−1 in the early part of the drought and 0.83 mm d−1 during the latter part (both R2>0.99). Mean water uptake depth (Fig. 3c) reflected the steep decline at 30 cm depth, averaging approximately 30 cm throughout the drought. Brief excursions were detected after the water additions due to labeling (DOY 191) and the first rains (DOY 203). In general, mean water uptake depth moved towards the surface during the drying event. After the rains began on DOY 203, VWC sharply increased at all depths down to 50 cm, with the sharpest increase detected at 30 cm.
After the 2HHO labeling, the isotopic signature observed in the 5 cm probe briefly rose above 35 000 ‰, in the 10 cm probe above 20 000 ‰, and in the 15 cm probe above 2000 ‰ (Fig. 4a). The probes at 20, 30, 50, and 70 cm responded more slowly and less strongly (Fig. 4b). We detected no increase in δ2H at 100 cm depth by the end of August (DOY 240). Thus the label was concentrated in the upper 10–15 cm, especially in the period immediately after the labeling. In these upper depths, the label intensity fell by around 1000 ‰ d−1 over the drought period and then dropped sharply when the rains arrived on day 204. Below, label intensity increased at 20 and 30 cm even before the rains arrived. The probe at 50 cm detected the label weakly, but the 70 cm probe detected it clearly; both the 50 and 70 cm probes responded about four weeks after the labeling. The δ18O also increased at 5 and 10 cm after the 2HHO labeling, but the increase was at most ≈20 ‰ (Fig. S1 in the Supplement), three orders of magnitude smaller than for δ2H (Fig. 4a).

Figure 4Isotopic composition (δ2H) of soil water by depth showing (a) δ2H of depths up to 15 cm, (b) δ2H of depths 20 cm and below. Note the differences in y-axis scaling. In both panels, the drought period is shown by the yellow box and the labelling date is shown as a vertical, dashed red line at DOY 191.
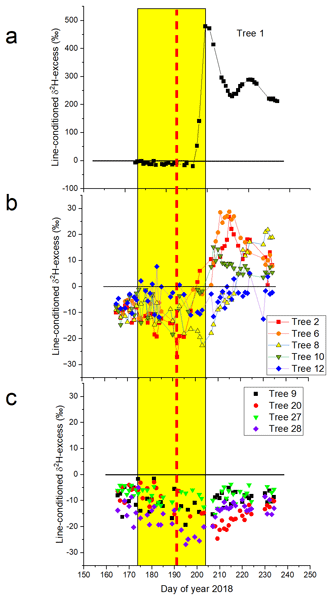
Among the trees surrounding the 1 m2 label plot, we detected the label in six (i.e. lc-excess >0). Tree 1 showed by far the highest δ2H values (Fig. 5a) and was responsible for 90 % of the cumulative label water uptake in the study (Fig. S2). The δ2H of the xylem sap of this tree (at 1.3 m height) began to change about four days after labeling and it reached its maximum (nearly 500 ‰) eight days after the labeling (Fig. 5a). The label intensity then decreased, maintaining relatively high enrichment until the end of the experiment. In contrast, δ18O of this tree displayed only a slight increase (≈2 ‰) during this period (Fig. S3). Four other trees on the plot increased δ2H steadily over about two weeks after the labelling (Fig. 5b) reaching lc-excess values greater than zero. All these trees were within 4 m of the plot center. Three of the four trees within the 4 m radius began to respond before the rains started. Although it was more than 4 m from the plot center, Tree 12 also displayed lc-excess values greater than zero, but only briefly (Fig. 5b). The other trees that were more than 4 m from the plot center showed no response to the labeling (Fig. 5c).

Figure 5Line-conditioned deuterium-excess (lc-excess) of xylem water in tree stems. Values above zero, denoted by the horizontal black line, show likely label uptake. Panel (a) Tree 1, near the soil-labeling plot; (b) Labeled trees with lc-excess at some point greater than zero; (c) Unlabeled trees, all more than 4 m from the center of the labeling plot. Note that the y-axes are on different scales and the zero-intercepts are at different locations on panel (a) vs. panels (b) and (c). In all panels, the drought period is shown by the yellow box and the labelling date is shown as a vertical, dashed red line at DOY 191.
Among the six trees that showed label uptake, the breakthrough time varied with distance (Fig. 6). The first tree (Tree 1, 1.2 m from plot center, Table S1) required four days for label arrival and the last (Tree 12, 6.7 m from plot center) required 33 d. The x-intercept was approximately equal to the label date (0 on this x-axis) and the slope of the regression line (0.172 (0.05) m d−1) described the maximum horizontal transport rate.

Figure 6Distance from the plot center vs. number of days after labelling. Only trees that responded to the labeling are shown.
We added a strong δ2H-labeled water pulse to 1 m2 of the mineral soil surface in a mature boreal Scots pine forest and monitored water isotopic composition in soils and tree xylem continuously afterward. The label initially remained near the soil surface, but it gradually moved deeper into the soil and was eventually detected as deep as 70 cm. The label was also taken up by roots, as evidenced by the label presence in xylem water of six surrounding trees, including all trees within 4 m of the labeled plot center. The labeling occurred during a drought of rare intensity in the boreal north. We were able to observe labeling patterns both during the drought and after the rainfall events that relieved it.
4.1 Horizontal transport and xylem water isotope dynamics
The experiment was designed primarily to detect and quantify patterns of root (and mycorrhizal) overlap and dynamics of horizontal water uptake by trees. We found the label in stems of six surrounding trees, meaning that the root systems of individual trees do not express complete territoriality at this scale. We therefore conclude that all these trees had roots in the labeled 1 m2 plot. This is far more overlap than in the crowns, which scarcely overlapped at all.
There are relatively few studies describing horizontal water uptake patterns in forest trees (Göttlicher et al., 2008; Henriksson et al., 2021; Lutter et al., 2021). Root distributions have been mapped in some temperate forests (Gao et al., 2021; Kuiper and Coutts, 1992; Lwila et al., 2024), but the presence of roots is not sufficient to predict water uptake (Göttlicher et al., 2008). Long-distance horizontal transport through overlapping root systems might increase uniformity in water availability among trees. It might also favour trees near openings by providing access to the unused soil water in the openings (Lutter et al., 2021; Moreira et al., 2000; Sternberg et al., 2002, 2005). This favouring might, as with deep vertical roots, provide a “lifeline” to trees growing under extreme drought conditions (Bachofen et al., 2024). However, it might also represent a significant carbon cost (Guswa, 2008), perhaps reducing partitioning to aboveground production (Fernandez-Tschieder et al., 2024; Marshall et al., 2023).
The rate of uptake varied among tree individuals. For example, the stem of Tree 2 was at the edge of the labeled plot (0.7 m from the center of the plot) and yet it showed far less label than Tree 1, which was slightly farther away (Fig. 5a and b). The label intensity detected in tree xylem became rather weak with greater distance from the plot, which we addressed by calculating the lc-excess. This parameter corrected for event-based variation using the strong correlation between natural abundance of δ2H and δ18O, allowing us to detect low levels of labeling. When we focused simply on the first appearance of the label, as defined by lc-excess greater than zero, we found that there was a correlation with distance from the plot (Fig. 6), suggesting that the label took some time to traverse the horizontal distance to the stems. The slope of this relationship, 0.17 (0.05) m d−1, is an estimate of the maximum horizontal transport rate. For comparison, measurements of water flow through pine stems are typically around 1 m d−1 (Plamboeck et al., 1999; Tarvainen et al., 2018). Note also that the label appeared in Tree 1 in only four days. This suggests that the surface roots were alive and ready to begin water uptake, despite the severe drought (Marshall, 1986). The peak label intensity in Tree 1 appeared eight days after the labeling, perhaps due to the arrival of label via slower flow paths after its initial breakthrough (Gao et al., 2021; Seeger and Weiler, 2021; Werner et al., 2021). Alternatively, as the drought advanced, the tree could have increased the amount of water taken up from deeper soil layers (e.g., Gessler et al., 2022); however, our VWC data suggest that deep water uptake did not increase as a proportion of the total (Fig. 3c) late in the drought.
We also observed a brief, weak pulse in δ18O of the surface soil horizons after the labeling. This might have occurred due to δ18O-enrichment of the 2H2O used for labeling (not measured), but we believe it is more likely interference in the spectrometer by the strong 2H1H16O absorption peak with the adjacent 1H1H18O peak, which has been observed in other studies using high concentrations of δ2H (Beyer et al., 2016, 2018). In any case, the apparent δ18O pulse was orders of magnitude weaker than the δ2H pulse and can be considered negligible.
4.2 Territoriality
The water uptake benefits of long horizontal roots could be assessed not only by the detection of label in surrounding trees, but also by the label intensity. One can imagine a continuum between complete domination of uptake by a single tree, analogous to owned and defended property, vs. complete sharing of the benefit by all trees within some radial distance from the tree stem. The distinction is important, in part, because conservation of soil water for later use would be favored by territorial rooting and disfavored by extensive root overlap (Cohen, 1970). Although six trees were labeled in our plot, we detected a strong preference for uptake by one of the two trees nearest the plot center, while the other tree at a similar distance took up very little of the label. This preference remained remarkably constant even as the label pulse dissipated (Fig. S2).
In order to investigate this territoriality further, we have used the data from this earlier experiment to rank the trees from each of their plots according to label intensity (Henriksson et al., 2021) (Fig. 7). The ranking shows a strong preference for the labeling of one or two trees, with much lighter labeling in several more (Fig. 7b). Henriksson et al. (2021) found that the most heavily labeled trees were not necessarily those nearest the labeled plot. We interpret these and our results as evidence of territorial water uptake, but not to the point of exclusion.

Figure 7Water isotopic composition (δ2H) of xylem wood in trees surrounding three labelled 1 m2 plots (data reprinted with permission from Henriksson et al., 2021). The trees surrounding each plot are ranked according to labeling intensity. Filled symbols represent trees that were identified as “labeled.” Panel (a) shows the full data range and panel (b) highlights the transition from lightly labelled to unlabelled trees.
Our results may have been influenced by choosing a microsite with particularly high tree density (1600 trees per hectare relative to 1010 (SD =125) trees per hectare in the stand, Lim et al., 2015). This was done to facilitate access to the central isotopic analyzer. However, in an earlier study in the same stand with 1 m2 water-labelled plots, Henriksson et al. also reported 8 (SE =2) labelled trees per plot. We therefore conclude that our results were not atypical.
The territoriality interpretation draws attention to the orientation of the trunk boreholes in our study. Ours were oriented north–south while the boreholes in Henriksson et al. (2021) were oriented toward the plot center. We initially believed that borehole orientation would not matter because an earlier report had shown that label was evenly distributed throughout the tree circumference rather quickly in white pine (White et al., 1985). More recent evidence from our site (Tarvainen et al., 2018) suggests that the stem label distribution is not uniform near the ground. Our borehole orientation (N–S) may have contributed to the weak labeling observed for Tree 2 (on the western edge of the labeled plot) compared to Tree 1 (to the northeast) despite the proximity of Tree 2 to the labelled plot. Therefore, we recommend orienting boreholes toward the center of small labelled plots in future work.
4.3 Soil water content and vertical root water uptake
We interpret daily declines in soil VWC during the drought period as evidence of tree root water uptake throughout the upper 50 cm of mineral soil (Fig. 3a). The slopes of the declines at 10 and 50 cm are similar, but that at 30 cm is steeper. There was no evidence of change in water content at 70 cm, consistent with our informal observation that roots were rare below 50 cm depth. The integrated water loss rate averaged 0.057 cm d−1 in the early part of the drought and increased to 0.083 cm d−1 in the last part, meaning that water uptake from these depths increased slightly as the drought proceeded. However, this conclusion is based on only three measurements across depth, the uppermost at 10 cm. Note that if there were evaporation in addition to root water uptake from the 10 cm depth, it would be included in water uptake depth estimate. Although there was almost certainly some evaporation from the injection sites at the surface of the mineral soil (0 cm depth), we speculate that evaporation was small at the measured 10 cm depth.
The maximum amount of label found in the soil was 4 %–5 %, which is small in comparison to the amount added (see “Partial Label Recovery” in the Supplement). However, we did not measure evaporation from the soil surface during the labelling and thereafter, which probably consumed a majority of the remainder. We tried to minimize surface evaporation by injecting at the mineral soil surface, but perhaps the injected water was drawn back up into the litter and moss and humus layers and above the topmost soil probes by matric forces during the injection.
After the injection, the labelled water was expected to flow downward under unsaturated conditions for as long as the water potential exceeded field capacity (Bonan, 2015). Remembering that the drought had already begun when the label was applied, the downward flow was expected to cease when field capacity was reached. One might expect a bit of short-range mixing by diffusion to continue after this point. This is consistent with the timing and intensity of the label peaks in Fig. 4a and b, where the label intensity decreased sharply between 15 cm (2027 ‰ maximum) and 20 cm depth (400 ‰ maximum, 8 d later). The added label could also have escaped detection by flowing down preferential flow paths (Clothier et al., 2008; Weiler, 2017), e.g. due to differences in soil density or along macropores or tree roots, leading to uneven infiltration and potentially bypassing probes and sensors. This might explain, for example, the higher maximum labelling at 70 cm than at 50 cm and at 30 cm than at 20 cm. However, the labelling patterns are largely consistent with the field-capacity scenario.
The current study follows on the classic study of Plamboeck et al. (1999), which was conducted at a nearby site with similar soils. Plamboeck et al. (1999) estimated that, without irrigation, the 2 cm humus layer provided 10 % of total uptake in July. When we estimated the mean depth of water uptake (Fig. 3c), it was remarkably stable throughout this severe drought, with a slight upward shift toward the end. Our estimated mean uptake depth (30.6 (SE =1.2) cm) was similar to a depth-weighted estimate based on Plamboeck et al.'s (1999) isotopic data (30.3 (0.07) cm). Both our results and those of Plamboeck et al. (1999) suggest a rather constant water uptake depth as a drought develops (Fig. 3c). This differs from a global meta-analysis, which found a downward shift in response to drought (Bachofen et al., 2024). If our trees cannot shift deeper under drought, then it may make the broad horizontal root distribution even more important as an emergency source of soil water.
4.4 Simplified borehole method
The method used to measure xylem water here included several simplifications of the borehole method used in previous studies. In particular, we did not use dry air (e.g., Kühnhammer et al., 2022) relying instead on the two-way exchange and equilibration of water vapor during the borehole passage (Marshall et al., 2020). In addition, we relied on the pump within the analyzer to draw air through the boreholes under negative pressure, apparently without significant air leakage into the downstream flows. This eliminates the need for the upstream pump used in some other applications (e.g., Kühnhammer et al., 2022). Finally, we did not use any screening material to inhibit microbial growth (Landgraf et al., 2022), relying instead on the natural defensive compartmentation of the xylem to serve that purpose (Shigo, 1984). Although a visible band of brown tissue formed around the borehole, our data showed that the borehole vapor continued to respond to xylem-water changes until the end of the experiment, more than three months after the boreholes were drilled. This is somewhat surprising given that the drilling must cavitate the xylem conduits that are cut, but our data, like previously published results with this method (Kühnhammer et al., 2022, 2022; Marshall et al., 2020), suggest that hydraulic contact with the xylem flow is maintained. As a reminder, we note that modeled results suggest that the equilibration is so fast that it would best reflect the isotopic composition of the water in the last few mm of the borehole (Marshall et al., 2020). Fortunately, this is where the flow is fastest and the circumference is greatest, both contributing to high proportions of the total stem flux.
One complication that remained was the placement of an analyzer in the field. Several recent papers describe methods for field sampling and storage of water vapor for stable isotope analysis (Havranek et al., 2020; Herbstritt et al., 2023; Magh et al., 2022), which would mean sacrificing the continuous data streams collected here, but would circumvent the need for an analyzer in the field and provide opportunities for more replication.
These results provide a dynamic description of soil water storage, transport, and root water uptake, including passage of the label through surrounding tree stems as they take up the label for transpiration. The timing and detection of the label are consistent with expectations insofar as it supports the notion that the root systems of several trees overlap on each square meter of ground surface. However, the concentration of the label in a single tree was inconsistent with the notion of extensive horizontal sharing. This question deserves more attention as it influences the scaling of transpiration from trees to stands.
The data are available on request from JM or MB.
The supplement related to this article is available online at https://doi.org/10.5194/hess-30-4757-2026-supplement.
JDM, MD, and MB conceptualized the work. MB and JDM managed data curation and analysis. Funding support was organized by MB and MD. Methodology was organized by MB, DD, PK, KK, MC, and JDM. JSM wrote the initial draft, but all authors contributed to writing and visualization.
The contact author has declared that none of the authors has any competing interests.
Publisher's note: Copernicus Publications remains neutral with regard to jurisdictional claims made in the text, published maps, institutional affiliations, or any other geographical representation in this paper. The authors bear the ultimate responsibility for providing appropriate place names. Views expressed in the text are those of the authors and do not necessarily reflect the views of the publisher.
We thank Noelia Saavedra, Nils Henriksson, and Hyungwoo Lim (SLU-Umeå) for their help with the labeling and measurement of these plots, and Nils Henriksson for permission to reanalyze his published data. Tomas Lundmark and the Svartberget Field Station of SITES provided housing for the group during the most intense part of this fieldwork. Tomas also provided the Picarro analyzer that we used for the tree measurements. We are also grateful to the Svartberget field staff for provision of the eddy covariance and meteorological data. Hector Correia (TU-Braunschweig) helped with the field work. R-KM acknowledges the funding bodies Knut and Alice Wallenberg foundation within the project Future Forests KAW 2018.0259. She was also financially supported by the AquaDiva CRC 1076 within the project B02. MD was supported by DFG MD1688/1-1 and 6-1. TEG received funding from the Spanish Ministry of Science and Universities (MCIN/AEI/10.13039/501100011033/, projects: CNS2024-154609 and RYC2021-031759-I) and from the Catalan Government (SGR-Cat 2021 00849). KK was financially supported by the Volkswagen Foundation (contract no. A122505; reference no. 92889 to MB). MC acknowledges support from a grant by the French National Research Agency (ANR, ANR-21-CE02-0033-01) and from a grant overseen by ANR as part of the “Investissements d'Avenir” program (ANR-11-LABX-0002-01, Lab of Excellence ARBRE).
This research has been supported by the Knut och Alice Wallenbergs Stiftelse (Future Forests and 2018.0259), the Deutsche Forschungsgemeinschaft (Collaborative Research Center Aqua Diva B02), the Deutsche Forschungsgemeinschaft (grant nos. MD1688/1-1 and 6-1), the Ministerio de Ciencia e Innovación (grant no. MCIN/AEI/10.13039/501100011033/, projects: CNS2024-154609 and RYC2021-031759-I), the Volkswagen Foundation (contract no. A122505; reference no. 92889 to MB), the Deutsche Forschungsgemeinschaft (grant no. SFB 1537 ECOSENSE), the Agence Nationale de la Recherche (grant no. ANR-21-CE02-0033-01), and the Agence Nationale de la Recherche (grant no. ANR-11-LABX-0002-01, Lab of Excellence ARBRE).
The publication of this article was funded by the Swedish Research Council, Forte, Formas, and Vinnova.
This paper was edited by Laurent Pfister and reviewed by two anonymous referees.
Bachofen, C., Tumber-Dávila, S. J., Mackay, D. S., McDowell, N. G., Carminati, A., Klein, T., Stocker, B. D., Mencuccini, M., and Grossiord, C.: Tree water uptake patterns across the globe, New Phytol., 242, 1891–1910, https://doi.org/10.1111/nph.19762, 2024.
Beyer, M., Koeniger, P., Gaj, M., Hamutoko, J. T., Wanke, H., and Himmelsbach, T.: A deuterium-based labeling technique for the investigation of rooting depths, water uptake dynamics and unsaturated zone water transport in semiarid environments, J. Hydrol., 533, 627–643, https://doi.org/10.1016/j.jhydrol.2015.12.037, 2016.
Beyer, M., Hamutoko, J. T., Wanke, H., Gaj, M., and Koeniger, P.: Examination of deep root water uptake using anomalies of soil water stable isotopes, depth-controlled isotopic labeling and mixing models, J. Hydrol., 566, 122–136, https://doi.org/10.1016/j.jhydrol.2018.08.060, 2018.
Beyer, M., Kühnhammer, K., and Dubbert, M.: In situ measurements of soil and plant water isotopes: a review of approaches, practical considerations and a vision for the future, Hydrol. Earth Syst. Sci., 24, 4413–4440, https://doi.org/10.5194/hess-24-4413-2020, 2020.
Bonan, G. (Ed.): Soil Physics. In: Ecological Climatology: Concepts and Applications, Cambridge, Cambridge University Press, 143–154, https://doi.org/10.1017/CBO9781107339200, 2015.
Burgess, S. S. O., Adams, M. A., Turner, N. C., and Ong, C. K.: The redistribution of soil water by tree root systems, Oecologia, 115, 306–311, https://doi.org/10.1007/s004420050521, 1998.
Caldwell, M. M. and Richards, J. H.: Hydraulic lift: water efflux from upper roots improves effectiveness of water uptake by deep roots, Oecologia, 79, 1–5, https://doi.org/10.1007/BF00378231, 1989.
Campbell, G. S. and Norman, J.: An Introduction to Environmental Biophysics, Springer Science & Business Media, 296 pp., https://doi.org/10.1007/978-1-4612-1626-1, 2012.
Clothier, B. E., Green, S. R., and Deurer, M.: Preferential flow and transport in soil: progress and prognosis, Eur. J. Soil Sci., 59, 2–13, 2008.
Cohen, D.: The expected efficiency of water utilization in plants under different competition and selection regimes, Israel J. Bot., 19, 50–54, 1970.
Dawson, T. E. and Pate, J. S.: Seasonal water uptake and movement in root systems of Australian phraeatophytic plants of dimorphic root morphology: a stable isotope investigation, Oecologia, 107, 13–20, https://doi.org/10.1007/BF00582230, 1996.
Fernandez-Tschieder, E., Marshall, J. D., and Binkley, D.: Carbon budget at the individual-tree scale: dominant Eucalyptus trees partition less carbon belowground, New Phytol., 242, 1932–1943, https://doi.org/10.1111/nph.19764, 2024.
Gao, D., Joseph, J., Werner, R. A., Brunner, I., Zürcher, A., Hug, C., Wang, A., Zhao, C., Bai, E., Meusburger, K., Gessler, A., and Hagedorn, F.: Drought alters the carbon footprint of trees in soils – tracking the spatio-temporal fate of 13C-labelled assimilates in the soil of an old-growth pine forest, Glob. Change Biol., 27, 2491–2506, https://doi.org/10.1111/gcb.15557, 2021.
Gessler, A., Bächli, L., Rouholahnejad Freund, E., Treydte, K., Schaub, M., Haeni, M., Weiler, M., Seeger, S., Marshall, J., Hug, C., Zweifel, R., Hagedorn, F., Rigling, A., Saurer, M., and Meusburger, K.: Drought reduces water uptake in beech from the drying topsoil, but no compensatory uptake occurs from deeper soil layers, New Phytol., 233, 194–206, https://doi.org/10.1111/nph.17767, 2022.
Goldsmith, G. R., Allen, S. T., Braun, S., Engbersen, N., González-Quijano, C. R., Kirchner, J. W., and Siegwolf, R. T. W.: Spatial variation in throughfall, soil, and plant water isotopes in a temperate forest, Ecohydrology, 12, e2059, https://doi.org/10.1002/eco.2059, 2019.
Gonfiantini, R.: Standards for stable isotope measurements in natural compounds, Nature, 271, 534–536, https://doi.org/10.1038/271534a0, 1978.
Göttlicher, S. G., Taylor, A. F. S., Grip, H., Betson, N. R., Valinger, E., Högberg, M. N., and Högberg, P.: The lateral spread of tree root systems in boreal forests: Estimates based on 15N uptake and distribution of sporocarps of ectomycorrhizal fungi, Forest Ecol. Manag., 255, 75–81, https://doi.org/10.1016/j.foreco.2007.08.032, 2008.
Guderle, M. and Hildebrandt, A.: Using measured soil water contents to estimate evapotranspiration and root water uptake profiles – a comparative study, Hydrol. Earth Syst. Sci., 19, 409–425, https://doi.org/10.5194/hess-19-409-2015, 2015.
Guswa, A. J.: The influence of climate on root depth: A carbon cost-benefit analysis, Water Resour. Res., 44, https://doi.org/10.1029/2007WR006384, 2008.
Gutierrez Lopez, J., Tor-ngern, P., Oren, R., Kozii, N., Laudon, H., and Hasselquist, N. J.: How tree species, tree size, and topographical location influenced tree transpiration in northern boreal forests during the historic 2018 drought, Glob. Change Biol., 27, 3066–3078, https://doi.org/10.1111/gcb.15601, 2021.
Havranek, R. E., Snell, K. E., Davidheiser-Kroll, B., Bowen, G. J., and Vaughn, B.: The Soil Water Isotope Storage System (SWISS): An integrated soil water vapor sampling and multiport storage system for stable isotope geochemistry, Rapid Commun. Mass Sp., 34, e8783, https://doi.org/10.1002/rcm.8783, 2020.
Henriksson, N., Lim, H., Marshall, J., Franklin, O., McMurtrie, R. E., Lutter, R., Magh, R., Lundmark, T., and Näsholm, T.: Tree water uptake enhances nitrogen acquisition in a fertilized boreal forest – but not under nitrogen-poor conditions, New Phytol., 232, 113–122, https://doi.org/10.1111/nph.17578, 2021.
Henriksson, N., Marshall, J., Högberg, M. N., Högberg, P., Polle, A., Franklin, O., and Näsholm, T.: Re-examining the evidence for the mother tree hypothesis – resource sharing among trees via ectomycorrhizal networks, New Phytol., 239, 19–28, https://doi.org/10.1111/nph.18935, 2023.
Herbstritt, B., Gralher, B., Seeger, S., Rinderer, M., and Weiler, M.: Technical note: Discrete in situ vapor sampling for subsequent lab-based water stable isotope analysis, Hydrol. Earth Syst. Sci., 27, 3701–3718, https://doi.org/10.5194/hess-27-3701-2023, 2023.
Jackson, R. B., Canadell, J., Ehleringer, J. R., Mooney, H. A., Sala, O. E., and Schulze, E. D.: A global analysis of root distributions for terrestrial biomes, Oecologia, 108, 389–411, https://doi.org/10.1007/BF00333714, 1996.
Jocher, G., Marshall, J., Nilsson, M. B., Linder, S., De Simon, G., Hörnlund, T., Lundmark, T., Näsholm, T., Ottosson Löfvenius, M., Tarvainen, L., Wallin, G., and Peichl, M.: Impact of Canopy Decoupling and Subcanopy Advection on the Annual Carbon Balance of a Boreal Scots Pine Forest as Derived From Eddy Covariance, J. Geophys. Res.-Biogeo., 123, 303–325, https://doi.org/10.1002/2017JG003988, 2017.
Kakouridis, A., Hagen, J. A., Kan, M. P., Mambelli, S., Feldman, L. J., Herman, D. J., Weber, P. K., Pett-Ridge, J., and Firestone, M. K.: Routes to roots: direct evidence of water transport by arbuscular mycorrhizal fungi to host plants, New Phytol., 236, 210–221, https://doi.org/10.1111/nph.18281, 2022.
Klosterhalfen, A., Chi, J., Kljun, N., Lindroth, A., Laudon, H., Nilsson, M. B., and Peichl, M.: Two-level eddy covariance measurements reduce bias in land–atmosphere exchange estimates over a heterogeneous boreal forest landscape, Agr. Forest Meteorol., 339, 109523, https://doi.org/10.1016/j.agrformet.2023.109523, 2023.
Kühnhammer, K., Dahlmann, A., Iraheta, A., Gerchow, M., Birkel, C., Marshall, J. D., and Beyer, M.: Continuous in situ measurements of water stable isotopes in soils, tree trunk and root xylem: Field approval, Rapid Commun. Mass Sp., 36, e9232, https://doi.org/10.1002/rcm.9232, 2022.
Kühnhammer, K., van Haren, J., Kübert, A., Bailey, K., Dubbert, M., Hu, J., Ladd, S. N., Meredith, L. K., Werner, C., and Beyer, M.: Deep roots mitigate drought impacts on tropical trees despite limited quantitative contribution to transpiration, Sci. Total Environ., 893, 164763, https://doi.org/10.1016/j.scitotenv.2023.164763, 2023.
Kuiper, L. C. and Coutts, M. P.: Spatial disposition and extension of the structural root system of Douglas-fir, Forest Ecol. Manag., 47, 111–125, https://doi.org/10.1016/0378-1127(92)90269-F, 1992.
Kulmatiski, A., Beard, K. H., Verweij, R. J. T., and February, E. C.: A depth-controlled tracer technique measures vertical, horizontal and temporal patterns of water use by trees and grasses in a subtropical savanna, New Phytol., 188, 199–209, https://doi.org/10.1111/j.1469-8137.2010.03338.x, 2010.
Kulmatiski, A., Adler, P. B., and Foley, K. M.: Hydrologic niches explain species coexistence and abundance in a shrub–steppe system, J. Ecol., 108, 998–1008, https://doi.org/10.1111/1365-2745.13324, 2020.
Landgraf, J., Tetzlaff, D., Dubbert, M., Dubbert, D., Smith, A., and Soulsby, C.: Xylem water in riparian willow trees (Salix alba) reveals shallow sources of root water uptake by in situ monitoring of stable water isotopes, Hydrol. Earth Syst. Sci., 26, 2073–2092, https://doi.org/10.5194/hess-26-2073-2022, 2022.
Landwehr, J. M. and Coplen, T. B.: Line-conditioned excess: a new method for characterizing stable hydrogen and oxygen isotope ratios in hydrologic systems, International Conference on Isotopes in Environmental Studies, Monte-Carlo, Monaco, 132–135, ISBN 92-0-111305-X, 2006.
Lim, H., Oren, R., Palmroth, S., Tor-ngern, P., Mörling, T., Näsholm, T., Lundmark, T., Helmisaari, H.-S., Leppälammi-Kujansuu, J., and Linder, S.: Inter-annual variability of precipitation constrains the production response of boreal Pinus sylvestris to nitrogen fertilization, Forest Ecol. Manag., 348, 31–45, https://doi.org/10.1016/j.foreco.2015.03.029, 2015.
Lindroth, A., Holst, J., Linderson, M.-L., Aurela, M., Biermann, T., Heliasz, M., Chi, J., Ibrom, A., Kolari, P., Klemedtsson, L., Krasnova, A., Laurila, T., Lehner, I., Lohila, A., Mammarella, I., Mölder, M., Löfvenius, M. O., Peichl, M., Pilegaard, K., Soosaar, K., Vesala, T., Vestin, P., Weslien, P., and Nilsson, M.: Effects of drought and meteorological forcing on carbon and water fluxes in Nordic forests during the dry summer of 2018, Philos. T. Roy. Soc. B, 375, 20190516, https://doi.org/10.1098/rstb.2019.0516, 2020.
Lutter, R., Henriksson, N., Lim, H., Blaško, R., Magh, R.-K., Näsholm, T., Nordin, A., Lundmark, T., and Marshall, J. D.: Belowground resource utilization in monocultures and mixtures of Scots pine and Norway spruce, Forest Ecol. Manag., 500, 119647, https://doi.org/10.1016/j.foreco.2021.119647, 2021.
Lwila, A., Ammer, C., Gailing, O., Leinemann, L., and Mund, M.: Root overlap and allocation of above- and belowground growth of European beech in pure and mixed stands of Douglas fir and Norway spruce, For. Ecosyst., 11, 100217, https://doi.org/10.1016/j.fecs.2024.100217, 2024.
Magh, R.-K., Gralher, B., Herbstritt, B., Kübert, A., Lim, H., Lundmark, T., and Marshall, J.: Technical note: Conservative storage of water vapour – practical in situ sampling of stable isotopes in tree stems, Hydrol. Earth Syst. Sci., 26, 3573–3587, https://doi.org/10.5194/hess-26-3573-2022, 2022.
Mahall, B. E. and Callaway, R. M.: Root Communication Mechanisms and Intracommunity Distributions of Two Mojave Desert Shrubs, Ecology, 73, 2145–2151, https://doi.org/10.2307/1941462, 1992.
Majoube, M.: Fractionnement en oxygène 18 et en deutérium entre l'eau et sa vapeur, J. Chim. Phys., 68, 1423–1436, 1971.
Manoli, G., Bonetti, S., Domec, J.-C., Putti, M., Katul, G., and Marani, M.: Tree root systems competing for soil moisture in a 3D soil–plant model, Adv. Water Resour., 66, 32–42, https://doi.org/10.1016/j.advwatres.2014.01.006, 2014.
Marshall, J. D.: Drought and shade interact to cause fine-root mortality in Douglas-fir seedlings, Plant Soil, 91, 51–60, 1986.
Marshall, J. D., Cuntz, M., Beyer, M., Dubbert, M., and Kuehnhammer, K.: Borehole Equilibration: Testing a New Method to Monitor the Isotopic Composition of Tree Xylem Water in situ, Front. Plant Sci., 11, https://doi.org/10.3389/fpls.2020.00358, 2020.
Marshall, J. D., Tarvainen, L., Zhao, P., Lim, H., Wallin, G., Näsholm, T., Lundmark, T., Linder, S., and Peichl, M.: Components explain, but do eddy fluxes constrain? Carbon budget of a nitrogen-fertilized boreal Scots pine forest, New Phytol., 239, 2166–2179, https://doi.org/10.1111/nph.18939, 2023.
Martin, F. M. and van der Heijden, M. G. A.: The mycorrhizal symbiosis: research frontiers in genomics, ecology, and agricultural application, New Phytol., 242, 1486–1506, https://doi.org/10.1111/nph.19541, 2024.
McCulloh, K. A., Sperry, J. S., and Adler, F. R.: Water transport in plants obeys Murray's law, Nature, 421, 939–942, https://doi.org/10.1038/nature01444, 2003.
Mensah, C., Šigut, L., Fischer, M., Foltýnová, L., Jocher, G., Acosta, M., Kowalska, N., Kokrda, L., Pavelka, M., Marshall, J. D., Nyantakyi, E. K., and Marek, M. V.: Assessing the Contrasting Effects of the Exceptional 2015 Drought on the Carbon Dynamics in Two Norway Spruce Forest Ecosystems, Atmosphere, 12, 988, https://doi.org/10.3390/atmos12080988, 2021.
Moreira, M. Z., Sternberg, L. da S. L., and Nepstad, D. C.: Vertical patterns of soil water uptake by plants in a primary forest and an abandoned pasture in the eastern Amazon: an isotopic approach, Plant Soil, 222, 95–107, https://doi.org/10.1023/A:1004773217189, 2000.
Oerter, E. J. and Bowen, G.: In situ monitoring of H and O stable isotopes in soil water reveals ecohydrologic dynamics in managed soil systems, Ecohydrology, 10, e1841, https://doi.org/10.1002/eco.1841, 2017.
Plamboeck, A. H., Grip, H., and Nygren, U.: A hydrological tracer study of water uptake depth in a Scots pine forest under two different water regimes, Oecologia, 119, 452–460, https://doi.org/10.1007/s004420050807, 1999.
R Core Team: R: A language and environment for statistical computing, R v4.3.2, R Foundation for Statistical Computing, Vienna, Austria, https://www.R-project.org/ (last access: 24 July 2026), 2023.
Seeger, S. and Weiler, M.: Temporal dynamics of tree xylem water isotopes: in situ monitoring and modeling, Biogeosciences, 18, 4603–4627, https://doi.org/10.5194/bg-18-4603-2021, 2021.
Shigo, A. L.: Compartmentalization: A Conceptual Framework for Understanding How Trees Grow and Defend Themselves, Annu. Rev. Phytopathol., 22, 189–214, https://doi.org/10.1146/annurev.py.22.090184.001201, 1984.
Simard, S. W. and Durall, D. M.: Mycorrhizal networks: a review of their extent, function, and importance, Can. J. Bot., 82, 1140–1165, https://doi.org/10.1139/b04-116, 2004.
Sternberg, L. da S. L., Moreira, M. Z., and Nepstad, D. C.: Uptake of water by lateral roots of small trees in an Amazonian Tropical Forest, Plant Soil, 238, 151–158, 2002.
Sternberg, L. da S. L., Bucci, S., Franco, A., Goldstein, G., Hoffman, W. A., Meinzer, F. C., Moreira, M. Z., and Scholz, F.: Long range lateral root activity by neo-tropical savanna trees, Plant Soil, 270, 169–178, https://doi.org/10.1007/s11104-004-1334-9, 2005.
Stocker, B. D., Tumber-Dávila, S. J., Konings, A. G., Anderson, M. C., Hain, C., and Jackson, R. B.: Global patterns of water storage in the rooting zones of vegetation, Nat. Geosci., 16, 250–256, https://doi.org/10.1038/s41561-023-01125-2, 2023.
Tarvainen, L., Wallin, G., Lim, H., Linder, S., Oren, R., Ottosson Löfvenius, M., Räntfors, M., Tor-Ngern, P., and Marshall, J.: Photosynthetic refixation varies along the stem and reduces CO2 efflux in mature boreal Pinus sylvestris trees, Tree Physiol., 38, 558–569, https://doi.org/10.1093/treephys/tpx130, 2018.
Vernay, A., Tian, X., Chi, J., Linder, S., Mäkelä, A., Oren, R., Peichl, M., Stangl, Z. R., Tor-Ngern, P., and Marshall, J. D.: Estimating canopy gross primary production by combining phloem stable isotopes with canopy and mesophyll conductances, Plant Cell Environ., 43, 2124–2142, https://doi.org/10.1111/pce.13835, 2020.
Volkmann, T. H. M., Kühnhammer, K., Herbstritt, B., Gessler, A., and Weiler, M.: A method for in situ monitoring of the isotope composition of tree xylem water using laser spectroscopy, Plant Cell Environ., 39, 2055–2063, https://doi.org/10.1111/pce.12725, 2016.
Weiler, M.: Macropores and preferential flow – a love-hate relationship, Hydrol. Process., 31, 15–19, 2017.
Werner, C., Meredith, L. K., Ladd, S. N., Ingrisch, J., Kübert, A., van Haren, J., Bahn, M., Bailey, K., Bamberger, I., Beyer, M., Blomdahl, D., Byron, J., Daber, E., Deleeuw, J., Dippold, M. A., Fudyma, J., Gil-Loaiza, J., Honeker, L. K., Hu, J., Huang, J., Klüpfel, T., Krechmer, J., Kreuzwieser, J., Kühnhammer, K., Lehmann, M. M., Meeran, K., Misztal, P. K., Ng, W.-R., Pfannerstill, E., Pugliese, G., Purser, G., Roscioli, J., Shi, L., Tfaily, M., and Williams, J.: Ecosystem fluxes during drought and recovery in an experimental forest, Science, 374, 1514–1518, https://doi.org/10.1126/science.abj6789, 2021.
White, J. W. C., Cook, E. R., Lawrence, J. R., and Wallace, S., B.: The DH ratios of sap in trees: Implications for water sources and tree ring DH ratios, Geochim. Cosmochim. Ac., 49, 237–246, https://doi.org/10.1016/0016-7037(85)90207-8, 1985.
Zhao, P., Chi, J., Nilsson, M. B., Löfvenius, M. O., Högberg, P., Jocher, G., Lim, H., Mäkelä, A., Marshall, J., Ratcliffe, J., Tian, X., Näsholm, T., Lundmark, T., Linder, S., and Peichl, M.: Long-term nitrogen addition raises the annual carbon sink of a boreal forest to a new steady-state, Agr. Forest Meteorol., 324, 109112, https://doi.org/10.1016/j.agrformet.2022.109112, 2022.