
the Creative Commons Attribution 4.0 License.
the Creative Commons Attribution 4.0 License.
 | 14 Jul 2026
Beyond Runoff Coefficient: Revealing Global Patterns of Process Connectivity in Runoff Generation through Intensity Integration
Hanxu Liang
Dedi Liu
Jiayu Zhang
Feng Yue
Yuling Zhang
Climate change has profoundly altered the connectivity of runoff generation (i.e., the transformation process from precipitation to runoff). It is critical to understand this connectivity for climate change adaptation and water-related risk management. However, the runoff coefficient (RC), as the most common connectivity indicator, only describes the ratio of precipitation transformed into runoff, failing to characterize the rate of the transformation. Here we develop a novel framework to assess process connectivity in runoff generation through intensity integration. The RC and runoff intensity (RI) are adopted to represent the transformation ratio and rate from precipitation to runoff, respectively, and a composite metric runoff efficiency (RE), calculated as the product of RC and RI, is proposed to capture both dimensions. Applying this framework to 6603 catchments globally over 1950–2020, we quantify the spatial patterns of process connectivity, diagnose their influencing factors, and examine their long-term trends and event-scale responses to precipitation intensity. According to their multi-year average values, we find a relatively high RC and RI in wet and dry areas, respectively. Interpretable machine learning further reveals that climatic attributes primarily control the process connectivity globally. The results of long-term trends show that the hotspots of increasing process connectivity are South America and central North America, which are typically associated with a higher potential for flood generation. Event-scale results indicate a high sensitivity of precipitation intensity on RE in dry climate zones. These findings not only enhance our understanding of runoff generation processes under the changing climate but also offer valuable insights into adaptive water resources management.
- Article
(2349 KB) - Full-text XML
-
Supplement
(1570 KB) - BibTeX
- EndNote


The global hydrological cycle is an integrated system of interconnected components, including evapotranspiration, precipitation, snowmelt, runoff, groundwater, etc. (Yang et al., 2021; Oki and Kanae, 2006). Hydrological connectivity, defined as the water transfer within or between components of the hydrologic cycle, is characterised by both the ratio and rate of the transfer process (Bracken et al., 2013). This broad concept manifests across various hydrological processes such as runoff generation, channel routing, and groundwater recharge (Van Tiel et al., 2024; Wang et al., 2025; Gou et al., 2025; Phillips et al., 2011). Among these, the process connectivity of runoff generation – the transformation from precipitation to runoff – is of particular importance because it determines what fraction of precipitation actually becomes available for streamflow (rather than being lost to evaporation or infiltration) and how rapidly this transformation occurs before the subsequent routing process (Bronstert et al., 2002; Shen et al., 2020). Over the past decades, climate change has profoundly altered this connectivity by modifying both rainfall characteristics and snow-related processes (Richter and Marty, 2026; Zhang et al., 2024). For example, warming has intensified precipitation extremes, leading to more frequent and intense heavy rainfall events (Yin et al., 2018; Zhang et al., 2023). Such changes can generate flash floods with higher peaks and larger volumes, thereby increasing flood hazards and socioeconomic risks (Blöschl, 2022; Miller and Hess, 2017). Moreover, global warming significantly reshapes snowpack dynamics by decreasing the proportion of precipitation being stored as snowpack, along with a faster melting rate (Li and Fan, 2025; Guan et al., 2022). This shifts the seasonal runoff pattern, triggering earlier and more pronounced spring flow peaks followed by the diminished summer baseflow, which exacerbates agricultural drought and water scarcity in downstream regions (Han et al., 2024). Therefore, a comprehensive understanding of the process connectivity in runoff generation is critical to enhancing climate adaptation and mitigating water-related hazards.
For quantifying the process connectivity in runoff generation, the most common indicator is the runoff coefficient (RC), defined as the volume ratio of precipitation to runoff (Viglione et al., 2009). While the concept of RC originates from Sherman (1932), investigations into controls on its spatiotemporal variability are still active in hydrology (Massari et al., 2023; Viglione et al., 2009). Many previous studies concentrate on small scales, such as agricultural irrigation plots (Badoux et al., 2006; Taye et al., 2013; Sumner et al., 1996; Nyssen et al., 2010) and hillslopes (Kinnell, 2014; Gomi et al., 2008b; Penna et al., 2011; Gomi et al., 2008a), partly due to the advantages of dense instrumentation and process experiments (e.g., soil moisture networks, tracers) that are often infeasible at larger scales, thereby supporting hypothesis testing and mechanistic understanding of thresholds and connectivity (Bishop et al., 2024; Hövel et al., 2025; Wu et al., 2025). These investigations reveal that the spatial variability of RC could be attributed to the spatial pattern of saturated conductivity (Bush et al., 2020; Sheldon and Fiedler, 2008), land degradation (Bush et al., 2020; Sadeghi et al., 2020), land use and cover (Bush et al., 2020; Ziegler et al., 2007), within-plot heterogeneity in soil characteristics (Herbst et al., 2006; Kuhn and Yair, 2004), and interactions among these factors (Li et al., 2025; Xiao et al., 2025). Several studies further investigated the temporal dynamics of the spatial pattern for RC across events and found that the spatial pattern may not persist over time (Jiang et al., 2023; Chen et al., 2019; López-Vicente et al., 2016). However, partly owing to the scale dependency of hydrological laws (Oda et al., 2024; Hunt et al., 2025), as the spatial heterogeneity of landscape properties increases with catchment size, it is often problematic to extrapolate the discoveries derived from small-scale investigations to larger catchments. Scientific endeavours analysing the RC at the catchment scale are therefore necessary and crucial.
At the catchment scale, several studies have explored the spatial–temporal variability and influencing factors of RC across diverse climates and catchments. These studies indicate a wide range of factors, and their effects differ across various locations. A classical regional analysis of more than 400 Austrian catchments showed that climatic attributes, particularly mean annual precipitation, exert a dominant control on the spatial distribution of RC (Merz and Blöschl, 2009). These findings have also been confirmed by other further studies in Australia and Italy (Norbiato et al., 2009; Wasko and Guo, 2022). In contrast, other large-sample studies conducted in the United Kingdom and Germany revealed that geological conditions and soil properties are key driving factors for the spatial variability of RC (Zheng et al., 2023; Tarasova et al., 2018a). Regarding temporal variability, studies reveal that event rainfall or snowmelt volume, and antecedent soil moisture are the dominant influencing factors (Merz et al., 2006; Tarasova et al., 2018b; Wu et al., 2021). Despite these valuable regional findings, existing studies are inherently limited in their spatial scope and covariate diversity. Within constrained hydroclimatic and physiographic domains, the limited variability among controlling factors gives rise to significant multicollinearity, posing a substantial challenge to disentangling their independent contributions and quantifying their relative importance at broader spatial scales (Do Nascimento et al., 2025; Clerc-Schwarzenbach et al., 2024). Consequently, the extrapolation of region-specific findings to ungauged or hydroclimatically divergent catchments is inherently associated with high levels of uncertainty. A global-scale analysis encompassing a more diverse covariate space is therefore essential to disentangle these confounding controls and advance toward a more generalized understanding of runoff generation. More importantly, RC only describes the fraction of precipitation that is transformed into runoff, without reflecting how fast this transformation proceeds. This limitation hinders our comprehensive understanding of the process connectivity in runoff generation.
To address this limitation, we propose a systematic analytical framework for assessing process connectivity in runoff generation through intensity integration. The aim is to understand spatiotemporal variations in the runoff generation process from the perspective of two-dimensional connectivity (i.e., transformation ratio and rate). Specifically, the RC reflects the transformation ratio of precipitation into runoff. The runoff intensity (RI), defined as the ratio of runoff depth to net rainfall duration, can directly indicate the transformation rate. This indicator is closely related to the surface runoff generation rate and the magnitude of peak discharge (Bronstert et al., 2023; Léonard et al., 2006), providing critical insights into the dynamic response of catchments to precipitation events. In other words, two events with identical RC values but contrasting RI values could exhibit markedly different peak discharge behaviors, a distinction that RC alone cannot capture. To achieve a more holistic characterization of the runoff generation process connectivity, runoff efficiency (RE) is further developed to encapsulate both the volumetric ratio of precipitation transformed into runoff (captured by RC) and the temporal rate of this transformation process (reflected by RI). The higher RE value may imply a larger proportion of precipitation is transformed into runoff at a faster rate within an event. It is typically associated with a larger event runoff volume and higher peak discharge, and thus a greater potential for flood generation. Applying this framework in 6603 catchments worldwide over 1950–2020, we answer the following critical questions: (a) What are the global spatial patterns of the process connectivity indicators, and to what extent do climate and landscape attributes drive their spatial heterogeneity? (b) What are the temporal dynamics of process connectivity indicators across multiple temporal scales, including long-term trends and event-to-event variability?
To quantify the runoff generation connectivity indicators, the quickflow is first derived from the in situ streamflow observations. Subsequently, a conceptual hydrological model is developed to simulate the quickflow generation process forced by other hydro-meteorological data, and the rainfall–runoff events are further identified. Finally, the spatio-temporal variability of these connectivity indicators is investigated by interpretable machine learning, Sen's slope analysis, and function fitting approaches. The workflow of this study is illustrated in Fig. 1.
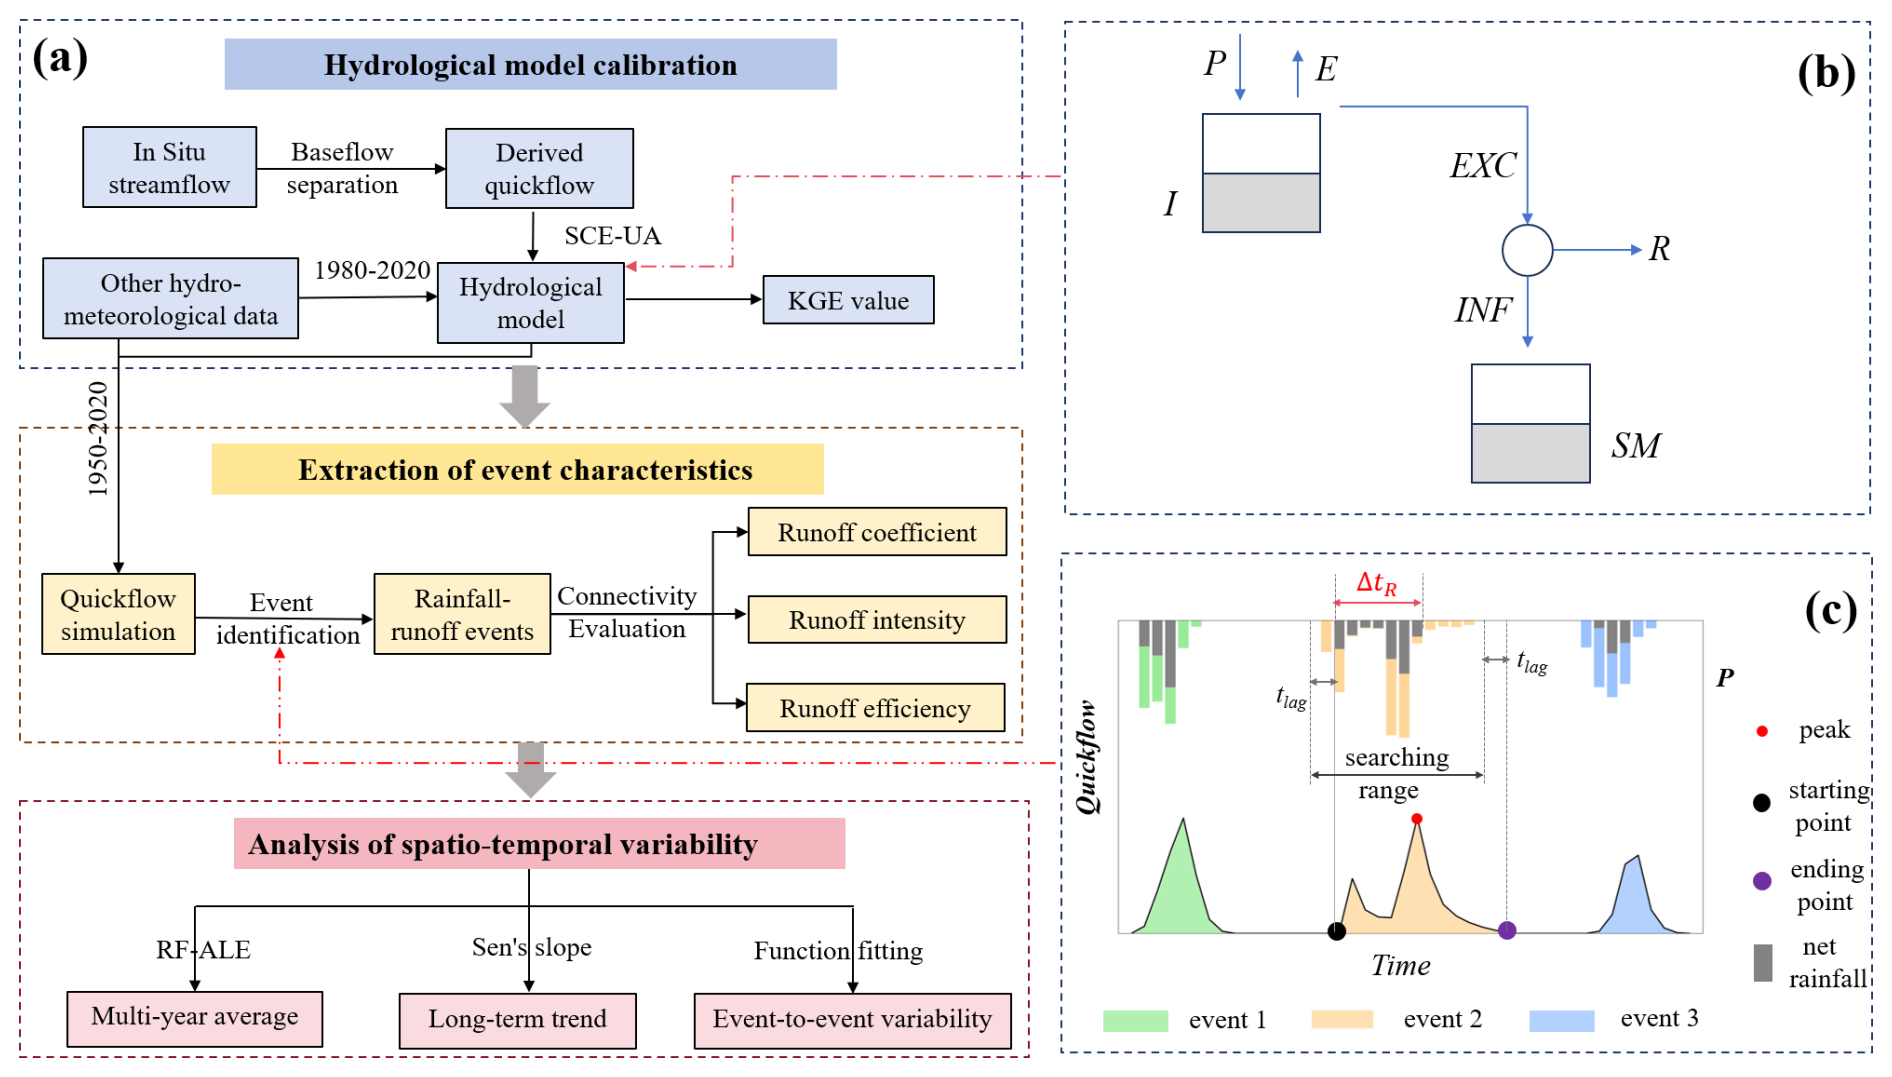
Figure 1The workflow of this study. (a) General framework. (b) Structure of the conceptual hydrological model. (c) Identification of rainfall–runoff event.
2.1 Quantification of the Process Connectivity in Runoff Generation
2.1.1 Hydrological modeling
As the event runoff-generation process relates to direct runoff (i.e., quickflow), we first separate the baseflow from the observed daily streamflow and then derive the direct-runoff component before running the hydrological modeling (Merz et al., 2006). The baseflow separation is conducted using the one-parameter filter approach (Lyne and Hollick, 1979), a widely employed method in hydrological research (Mei et al., 2024; Xie et al., 2024; Zhang et al., 2022). To simulate the direct runoff generation process, we develop a conceptual rainfall–runoff model based on the initial-loss and the continuing-loss framework (O'Shea et al., 2021), which conceptually captures the effects of interception and infiltration losses in a simplified manner (Fig. 1b). The interception part by vegetation in the hydrological modeling can be described as:
where P (mm d−1) represents the liquid-water input, that is, the sum of daily rainfall and snowmelt; I (mm) refers to the current interception storage; E (mm d−1) and EXC (mm d−1) correspond to the evaporation from the interception store and the excess rainfall, respectively. Evaporation is assumed to occur at the potential rate Ep (mm d−1) when possible. Once I surpasses the maximum interception capacity Imax, the surplus water is routed into the remainder of the model as excess input EXC.
The subsequent infiltration processes can be described as:
where INF (mm d−1) represents the infiltration rate, determined by the maximum infiltration rate fmax, soil moisture SM (%), and the infiltration exponent b. The surface runoff (R; mm d−1) occurs once the excess rainfall intensity surpasses the infiltration rate of the soil:
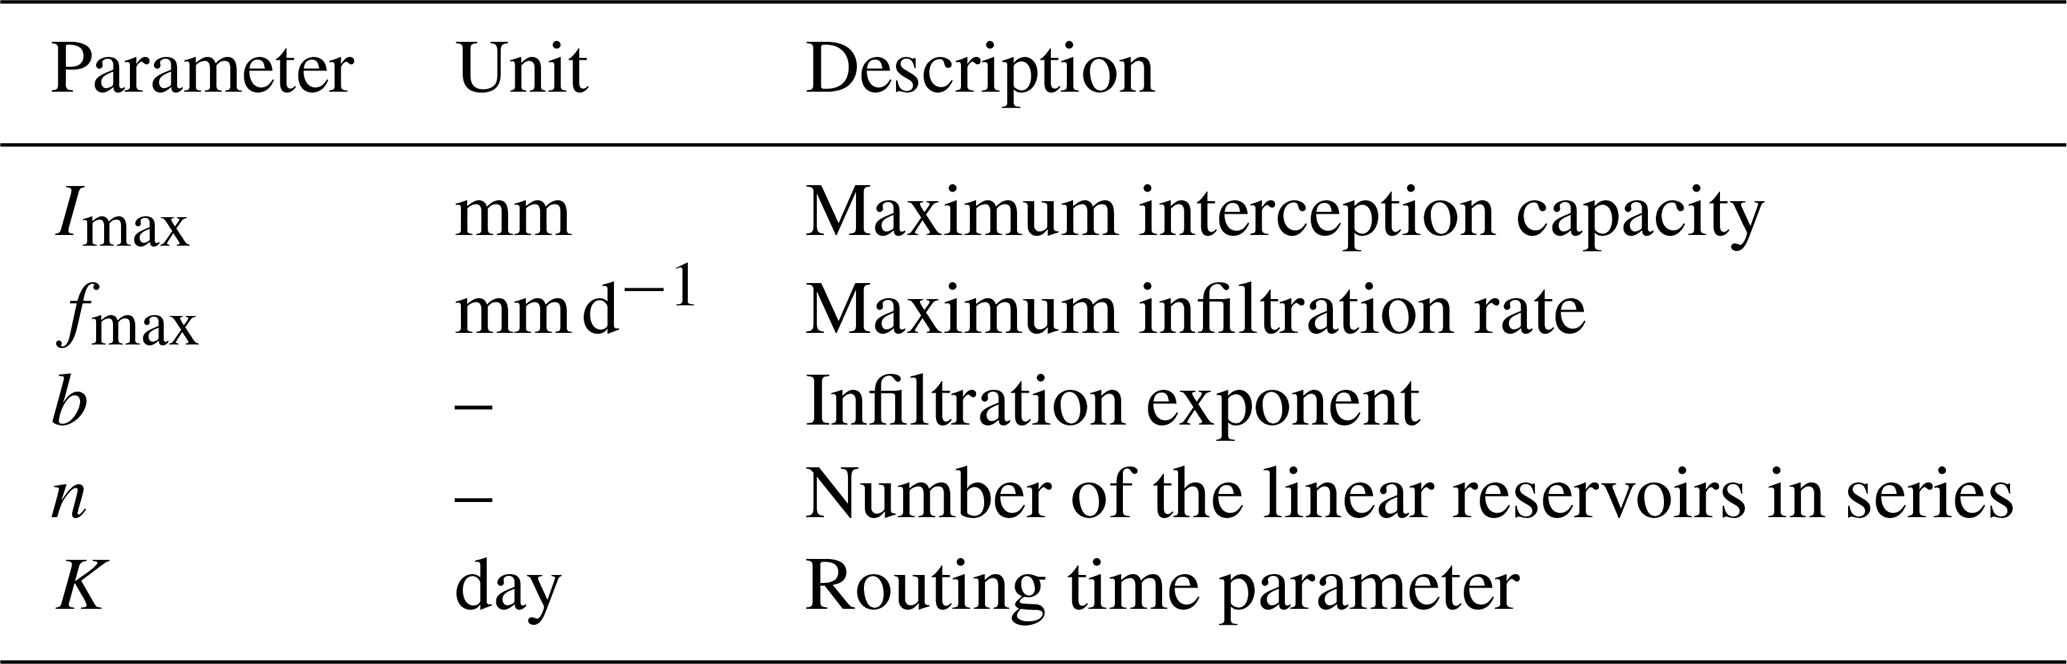
The runoff routing is simulated through the classical Nash instantaneous unit hydrograph (Nash, 1957), with two parameters n and K. The parameters n and K are the number of linear reservoirs and the routing time, respectively. All five parameters of the hydrological model (as listed in Table 1) are optimized by the Shuffled Complex Evolution algorithm (SCE-UA), which is a widely adopted stochastic optimization technique for model calibration and parameter tuning (Duan et al., 1992). To ensure a global search of the parameter space for the hydrological model, multiple simplexes are utilized to explore potential solutions concurrently (Kang et al., 2023). The Kling–Gupta Efficiency (KGE) is employed as the objective function:
where r represents the correlation coefficient between the simulated and observed values; α denotes the ratio of the standard deviation of simulated results to that of observations; and β indicates the ratio of the mean value of simulated to that of observed streamflow. The calibration and validation of the hydrological model follow the cross-validation technique recommended by Arsenault et al. (2017) and Yin et al. (2021), in which odd-numbered years are chosen for calibration and even-numbered years for validation, with the first two years serving as the model warm-up period. Catchments with KGE values higher than 0.5 during the validation period are retained for further analysis (Fig. S1 in the Supplement), and their hydrological processes are subsequently simulated over the full 1950–2020 period.
2.1.2 Identification of Rainfall–Runoff Events
We first identify runoff events using the simulated quickflow time series, and then match them to their corresponding rainfall (snowmelt) events. To identify runoff events, following the procedure described by Wu et al. (2021), each quickflow time series is examined starting from the highest peak and then moving to the second-highest peak. The onset of a runoff event is defined as the closest time prior to the peak when quickflow is equal to zero, and the termination is the first time thereafter when quickflow returns to zero, as shown in Fig. 1c. This definition allows multiple peaks to occur within a single runoff event. We then match each identified runoff event with one or several contributing rainfall (including snowmelt) events. Rainfall (or snowmelt) events are defined as periods of rainfall that are separated by no-rainfall periods, with a distinguished threshold of 0.1 mm d−1 for all catchments to remove trace or inconsequential events (Wu et al., 2021). For each runoff event in the time series, the total rainfall (or snowmelt) from all events whose centroids lie within a specified range is assigned as the corresponding event rainfall, as illustrated in Fig. 1c. The range refers to the lag time of catchments in event runoff generation, and is determined by a detrending moving-average cross-correlation method (Giani et al., 2021), which has been extensively utilized in hydrology due to its independence from event selection and parameter estimation (Zheng et al., 2023; Costabile et al., 2024; Zhang et al., 2022).
2.1.3 Evaluation of process connectivity for runoff generation
We evaluate the process connectivity for runoff generation from the transformation ratio of rainfall to runoff (i.e., runoff coefficient, RC) and the transformation rate (i.e., runoff intensity, RI) for each matched rainfall–runoff event, respectively, as follows:
where R denotes the event runoff depth (i.e., the net rainfall depth), and P refers to the event rainfall (including the snowmelt) depth. ΔtR is the runoff generation duration of the event and is named as the net rainfall duration, specifically referring to the time during which R>0 within the event, distinct from the event rainfall period of the event (Fig. 1c). Thus, ΔtR is expected to be shorter than the rainfall duration as interception, infiltration, and other hydrological losses delay or prevent rainfall from transforming directly into runoff (Gyasi-Agyei and Melching, 2012; Hashino et al., 2002). The higher the RC, the higher the transformation ratio in runoff generation. The greater the RI, the faster the transformation rate.
To comprehensively characterize the process connectivity of the two aspects, we further define a new metric, runoff efficiency (RE), as the product of RC and RI:
The higher RE value may imply a larger proportion of precipitation is transformed into runoff at a faster rate within an event. It is typically associated with a larger event runoff volume and higher peak discharge, and thus a greater potential for flood generation.
2.2 Analysis of spatio-temporal variability for process connectivity
2.2.1 Analysis of multi-year average
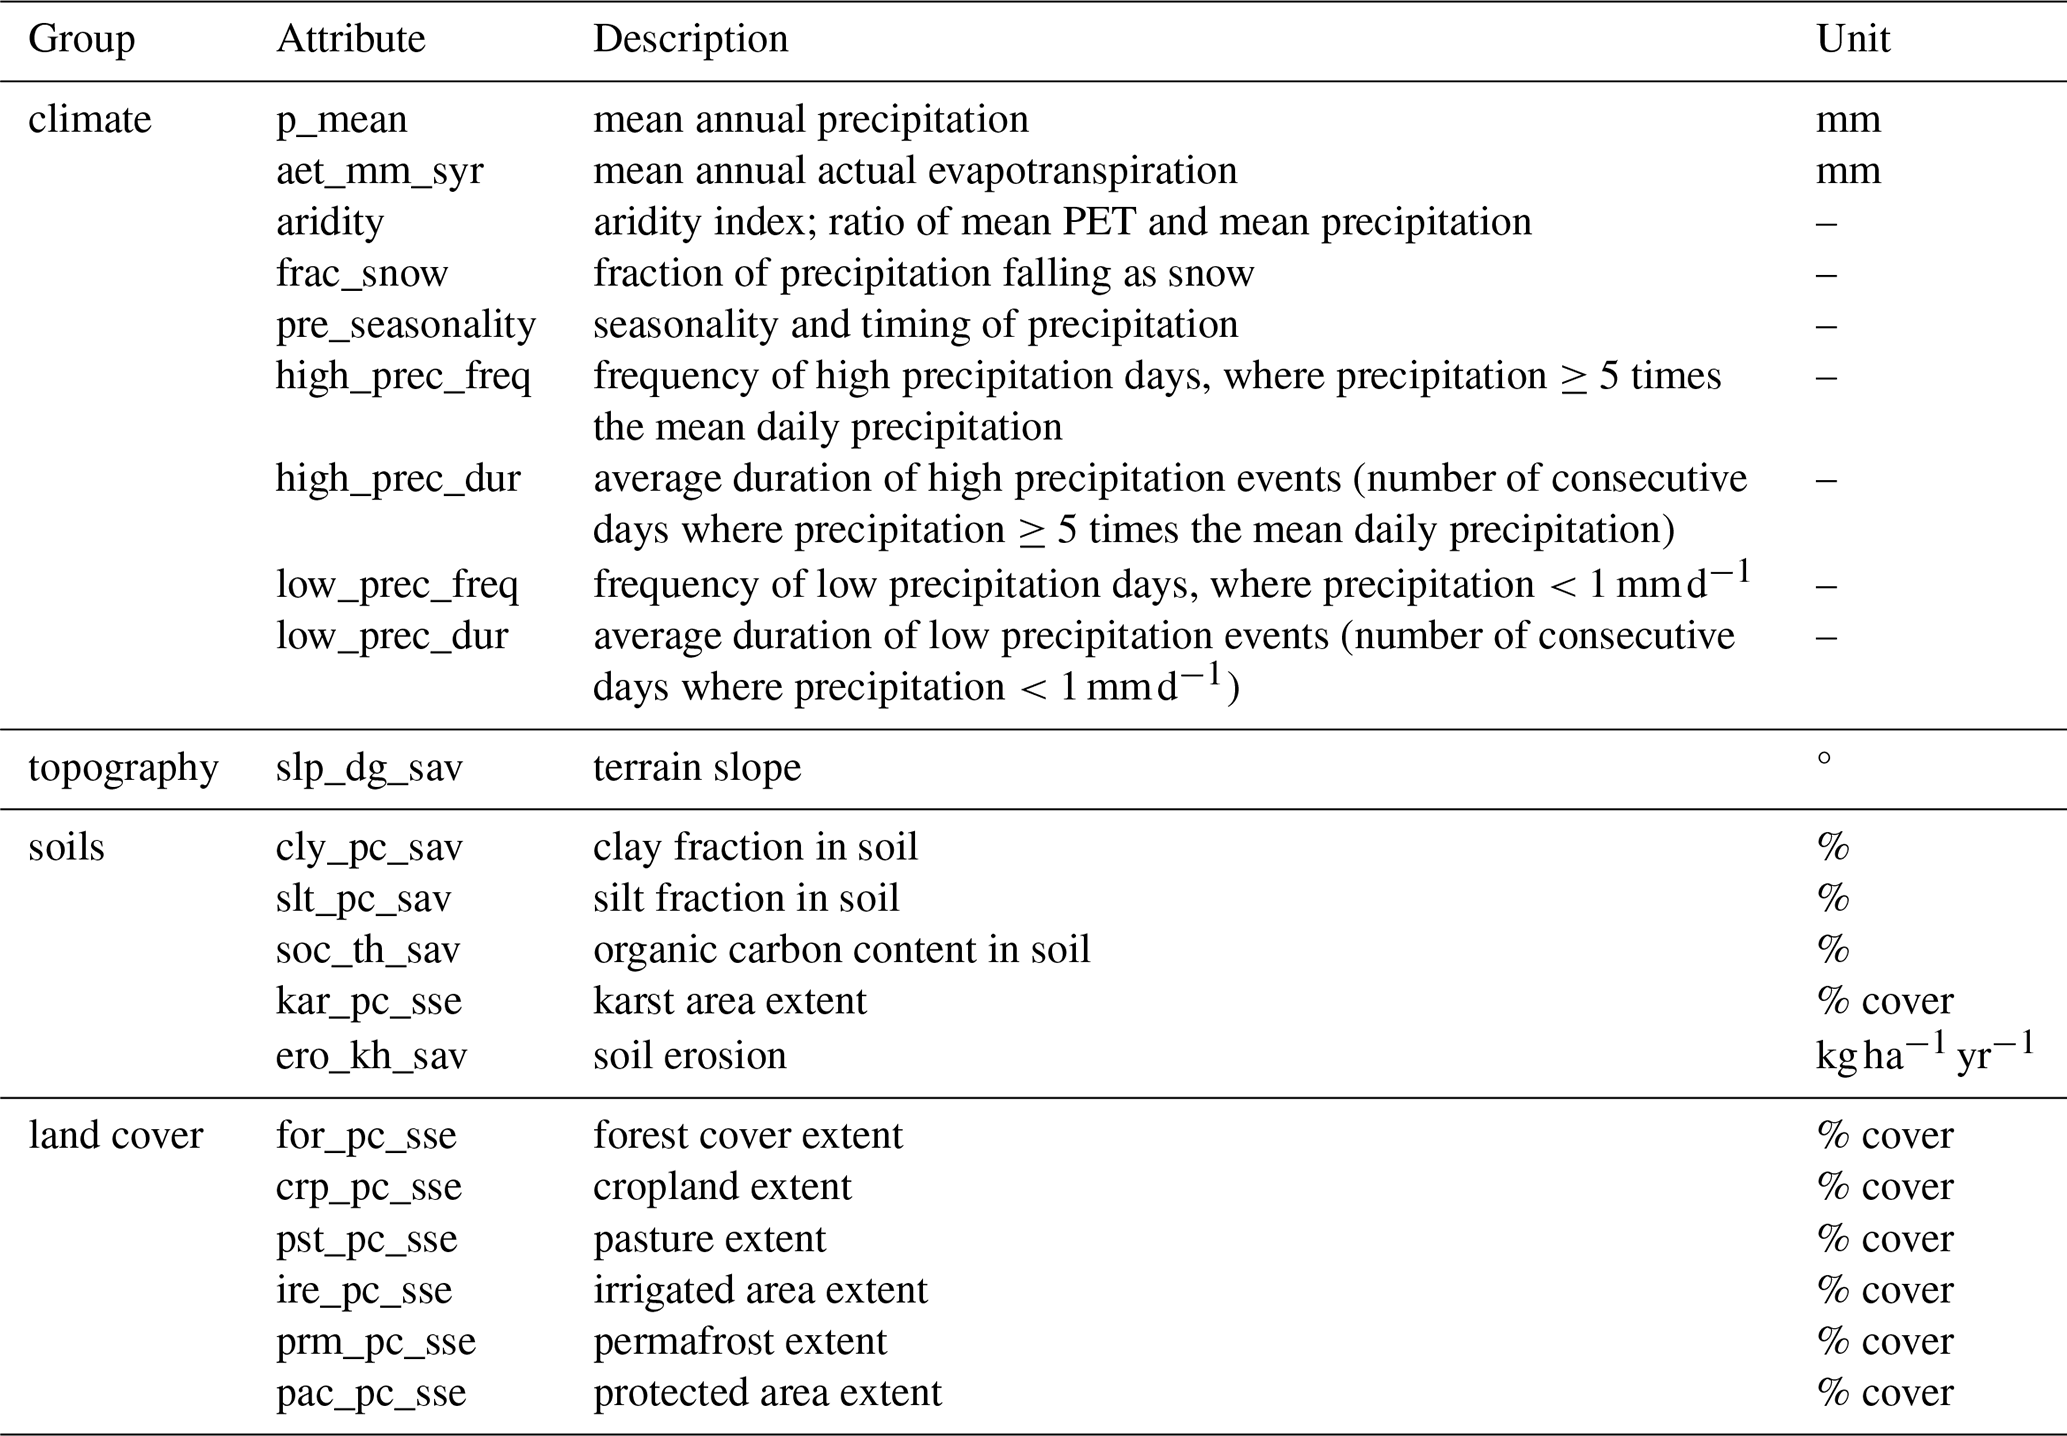
Random Forest (RF)-accumulated local effects (ALE) are employed as an interpretable machine learning approach to explore the spatial patterns of the multi-year average of RCs. The Random Forest (RF) is a traditional machine learning approach constructing an ensemble of regression trees (Breiman, 2001). Compared with single regression tree algorithms, RF offers notable strengths, such as the ability to handle highly correlated input variables, capture nonlinear interactions, and improve predictive stability via ensemble aggregation. The RF approach has been widely adopted across a broad spectrum of hydrological applications (Zheng et al., 2023; Brown et al., 2023; Stein et al., 2021). The input features incorporated into RF encompass four categories of catchment characteristics: climate, topography, soil, and land cover (Zheng et al., 2023; Kemter et al., 2023). To avoid the redundancy of the input features, following the approach outlined by Brêda et al. (2024) and Liang et al. (2026), catchment attributes are removed if their Pearson correlation coefficient exceeds 0.75 across different attribute groups or 0.9 within the same group (Fig. S2 in the Supplement). Ultimately, a total of 21 catchment variables covering all four predefined categories are retained, with detailed descriptions provided in Table. 2. To eliminate overfitting in RF, a 10-fold cross-validation strategy is employed to evaluate its predictive performance (Stein et al., 2021). The dataset is partitioned into ten subsets of equal size. Nine of these subsets are adopted to train the RF, while the remaining one reserved for testing purpose. The coefficient of determination (R2) is employed as a metric to evaluate the performance of RF. Model robustness is evaluated by conducting 100 independent training iterations of RF training with varying random seeds. The overall performance of the RF model is quantified by the average R2 obtained across all 100 independent iterations.
To quantify the average effects of the inputs on the performance of the RF, the ALE is adopted (Apley and Zhu, 2020). As a model-agnostic interpretability technique, ALE extends the concept of partial dependence plots, and provides enhanced computational efficiency and reliability, particularly when dealing with correlated predictors or data with complex structures (Shelef et al., 2022; Kemter et al., 2023). Its robustness stems from focusing on localized variations around observed values rather than the entire predictor range. By concentrating on the empirical distribution of the data, ALE estimates the causal influence of inputs on predictions while reducing extrapolation errors, thereby improving interpretability. To quantify the primary effect of a predictor, the uncentred effect is determined by the accumulating differences in the predictions across the quantiles of the predictor as indicated in Eq. (10) (Apley and Zhu, 2020).
where x refers to a given value of predictor j used to generate the ALE plot; m corresponds to a specific quantile within the set of M quantiles (M=10) that subdivide the range of x. The range is partitioned into ten equal intervals for a balance between result robustness and low computational cost. The term nj(m) refers to the number of values of x that lie in the mth interval Nj(m) ranging from , and n represents the total sample size; zm,j refers to the boundary value of x for the given quantile; g(⋅) denotes the prediction model output, and corresponds to the values of all other predictors for instance i except predictor j. The primary effect estimator of the ALE can be further estimated through deducting the average for uncentred effect value of all quantiles:
To quantify the contribution of each predictor, the average absolute values of ALE are obtained and normalized into the range [0,1] through maximum–minimum normalization, ensuring comparability across all predictors (Stein et al., 2021).
2.2.2 Analysis of long-term trend
To investigate the long-term evolution of process connectivity indicators, we employ Sen's slope, a robust and nonparametric method, to detect temporal trends, which is commonly used in hydro-meteorological research to estimate linear trends (Bloeschl et al., 2019; Kemter et al., 2023; Wang et al., 2024).
where k is the slope; Y denotes the process connectivity indicator; i and j (where i<j) represent all possible year pairs within the time series.
2.2.3 Analysis of event-to-event variability
To analyze the event-to-event variability of process connectivity indicators, we first examine the variations of the indicators across events that are grouped by distinct discharge quantile intervals (0–20th, 20–40th, 40–60th, 60–80th, and 80–100th percentiles) for each catchment. Besides, we analyse the impact of precipitation intensity on runoff efficiency across events by fitting a power function using the least squares method. The power function is selected due to its universality in numerous hydrological formulas (Ijjaszvasquez et al., 1992; Schwemmle and Weiler, 2024; Li and Sivapalan, 2011).
where PI represents the precipitation intensity. RE10 and m are the fitted model parameters. The former denotes the runoff efficiency at a reference precipitation intensity of 10 mm d−1, which falls within the commonly observed range of precipitation intensity across global catchments. The latter denotes the sensitivity of runoff efficiency to changes in precipitation intensity.
The hydrological and meteorological data come from the Caravan large sample dataset (Färber et al., 2025; Kratzert et al., 2023), a comprehensive repository that systematically compiles daily time series and key catchment attribute information for more than 20 000 catchments across the globe. Specifically, daily observed discharge (Q) is sourced from gauge stations, while daily precipitation (P), temperature (T), soil moisture (SM), and snow water equivalent (SWE) are sourced from the ERA5-Land reanalysis dataset. The potential evapotranspiration (PET) is estimated by the FAO Penman–Monteith equation. The key catchment attributes are derived from the HydroATLAS dataset (Linke et al., 2019). All meteorological data have been spatially aggregated to the catchment scale to ensure consistency with the hydrological response unit of interest. To guarantee the data quality, only those with at least 20 consecutive years of daily observed Q records between 1980 and 2020, and no single gap in the discharge time series exceeding 10 d are selected in the study (Han et al., 2020); any remaining missing values are imputed using linear interpolation (Jiang et al., 2024). Subsequently, catchments exhibiting unsatisfactory hydrological simulation performance are filtered out (see Sect. 2.1). Application of these criteria results in the selection of a total of 6603 catchments for subsequent analysis.
To investigate the differences across climates, catchments are classified into three climatic categories: wet, dry, and snow. Wet catchments are characterized by an aridity index below 1, where mean potential evapotranspiration is lower than precipitation, indicating energy-limited conditions. Dry catchments correspond to an aridity index exceeding 1, in which mean potential evapotranspiration surpasses precipitation, reflecting water-limited conditions. Snow-dominated catchments are identified by a snow fraction greater than 0.2, independent of the aridity index (Wang et al., 2024; Stein et al., 2021). To further highlight regional hydrological characteristics, the catchments are additionally grouped into 14 reference regions defined by the Intergovernmental Panel on Climate Change (IPCC), with each region encompassing over 30 catchments to ensure a robust sample size for analysis (Iturbide et al., 2020). The spatial distribution of all the sampled catchments is illustrated in Fig. 2, and their area statistics are shown in Fig. S3 in the Supplement.
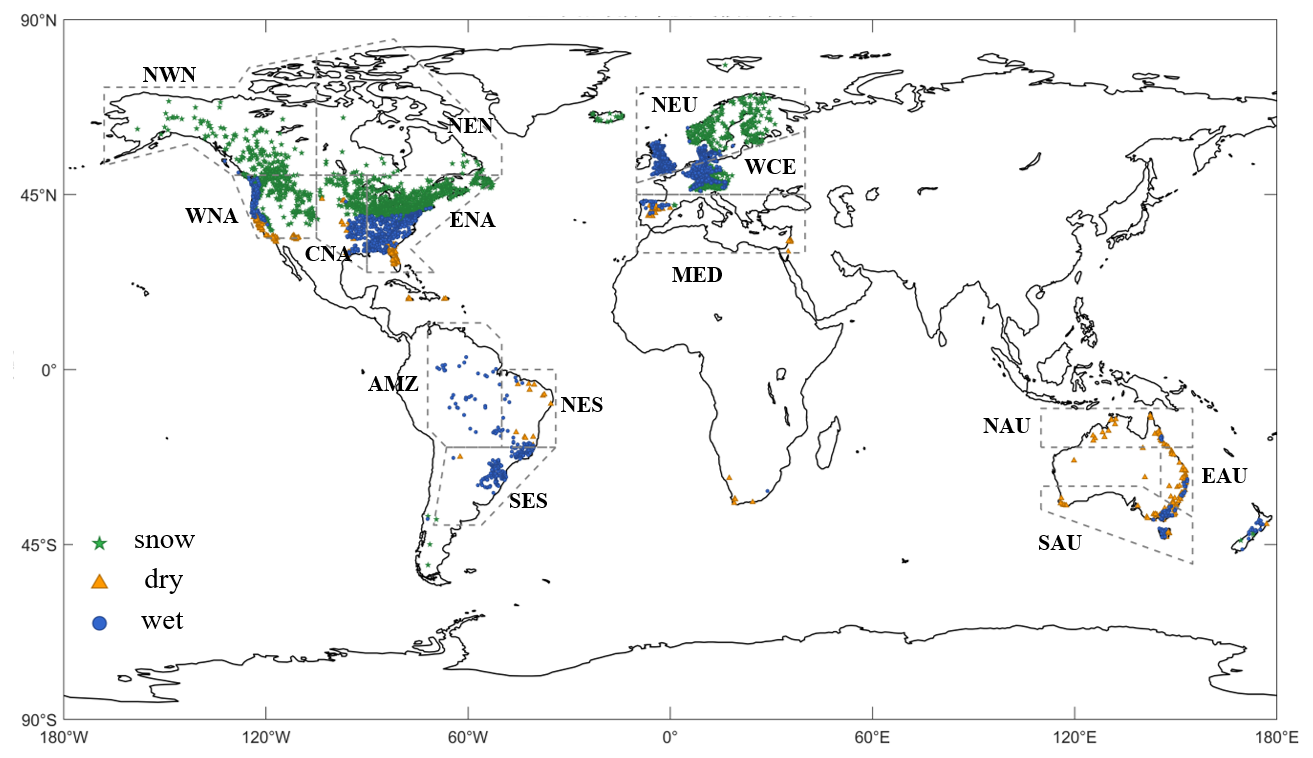
Figure 2Spatial distribution of 6603 sample catchments for analysis. Green stars, orange triangles, and blue circles indicate the catchments in snow, dry, and wet climate zones, respectively. AMZ, Amazon; CNA, central North America; EAU, eastern Australia; ENA, eastern North America; MED, Mediterranean; NAU, northern Australia; NEN, north-eastern North America; NEU, northern Europe; NES, northeastern South America; NWN, northwestern North America; SAU, southern Australia; SES, southeastern South America; WCE, western and central Europe; WNA, western North America.
4.1 Spatial Patterns of Process Connectivity and Influencing Factors
A total of 2 553 834 rainfall–runoff events occurring between 1950 and 2020 across 6603 catchments have been identified through the simulation conducted with a conceptual hydrological model. The mean value of each connectivity indicator across all events is determined, and its spatial pattern of the multi-year average is illustrated in Fig. 3. Given the uneven spatial distribution of catchments across regions and climate zones, median values are adopted for group-level comparisons to mitigate the influence of unequal sample sizes and outliers. For the runoff coefficient (Fig. 3a–c), the dry climates are found to exhibit the lowest value, with a median of 0.15, indicating minimal loss in this hydrological transformation process. In contrast, the wet and snow climate zones show notably higher median values of 0.25 and 0.33, respectively, indicating a lower loss in the transformation process. It is also interesting that the highest values are found in western North America (WNA) and northwestern North America (NWN), with a median higher than 0.3, while the lowest values are found in eastern Australia (EAU), northeastern South America (NES), and southern Australia (SAU), with a median lower than 0.15.
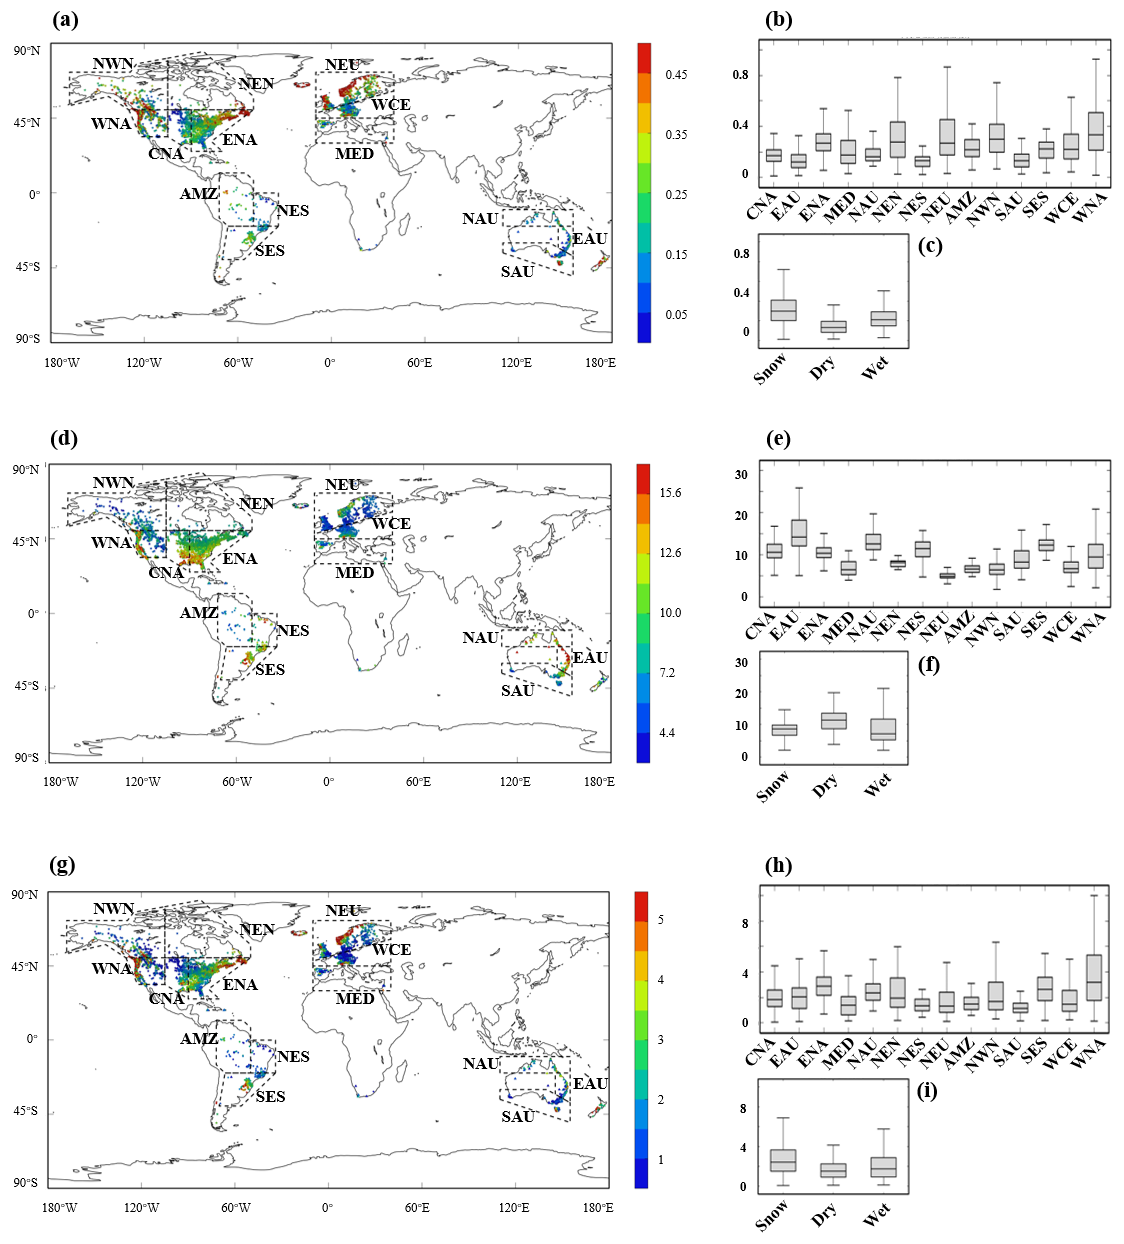
Figure 3The spatial pattern for the multi-year average values for the process connectivity indicators across the globe. (a–c) for the runoff coefficient. (d–f) for the runoff intensity (unit: mm d−1). (g–i) for the runoff efficiency (unit: mm d−1).
However, in terms of the runoff intensity as shown in Fig. 3d–f, the highest value can be found in the dry climate zones, with a median of 11.3 mm d−1, signifying a rapid transformation rate from precipitation to runoff. In contrast, the wet and snow climate zones are found to have relatively lower median values of 8.6 and 8.5 mm d−1, respectively, indicating a slower transformation rate. From the spatial distribution, the highest median runoff intensity (exceeding 12 mm d−1) are found in the eastern Australia (EAU), northeastern South America (NES), and northern Australia (NAU) In contrast, the lowest median values (below 6.5 mm d−1) are concentrated in northern Europe (NEU), northwestern North America (NWN), and Mediterranean (MED). It should be noted that the spatial pattern of the runoff coefficient is inconsistent with that of the runoff intensity. For instance, NWN exhibits a relatively high runoff coefficient of 0.3, yet its runoff intensity is comparatively low at 6.5 mm d−1.
In terms of the runoff efficiency as shown in Fig. 3g–i, which is the product of the runoff coefficient and runoff intensity, its relatively high values are found in snow climates with a median of 2.41 mm d−1, while lower values are found in both wet (median =1.75 mm d−1) and dry (median =1.51 mm d−1) climates, indicating a balance between runoff coefficient and runoff intensity. Besides, its spatial distribution differs from that of the runoff coefficient and the runoff intensity. The highest median runoff efficiency values (exceeding 2.5 mm d−1) are found in western North America (WNA), eastern North America (ENA), and southeastern South America (SES), indicating a higher level of comprehensive connectivity for runoff generation, and consequently, a greater potential for flood generation. In contrast, the lowest median runoff efficiency values (below 1.35 mm d−1) are found in southern Australia (SAU), northern Europe (NEU), and northeastern South America (NES), indicating a lower level of comprehensive connectivity for runoff generation.
An interpretable machine-learning framework combining RF and ALE is subsequently employed to systematically investigate the key drivers governing the spatial heterogeneity of the process connectivity indicators. A total of 21 catchment attributes serve as input variables into the RF model to predict each of the process connectivity metrics. The cross-validated R2 values for the RF models are presented in Figs. S4–S6 in the Supplement. Generally, the RF model demonstrates robust predictive performance, achieving a mean R2 over 0.8 for all process connectivity indicators under 10-fold cross-validation. Figure 4 illustrates the ALE interpretable results of each indicator. For the runoff coefficient as shown in Fig. 4a, the aridity shows the greatest impact, followed by mean annual precipitation, organic carbon content in soil, fraction of snow, and seasonality of precipitation. For the runoff intensity as shown in Fig. 4b, the mean annual precipitation has the greatest impact, followed by the mean actual evapotranspiration, the average duration of high precipitation, and the frequency of high precipitation days. For the runoff efficiency as shown in Fig. 4c, the mean annual precipitation shows the greatest impact, followed by the frequency of high precipitation days, seasonality of precipitation, fraction of snow, and pasture extent. It can be noted that climate attributes dominate the impacts on all connectivity metrics, contributing 63.2 %, 89.6 %, and 79.3 % to the runoff coefficient, runoff intensity, and runoff efficiency, respectively.
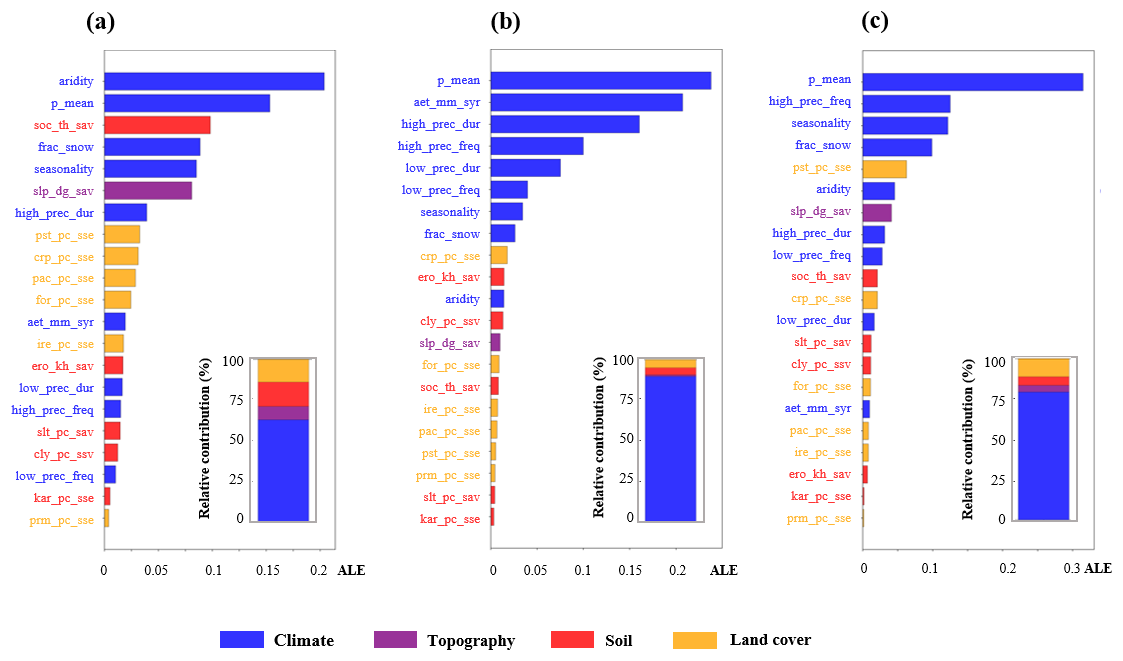
Figure 4The Influence of catchment attributes on process connectivity indicators based on the interpretable machine learning approach (RF-ALE). (a) Runoff coefficient. (b) Runoff intensity. (c) Runoff efficiency. Blue, purple, red, and yellow correspond to the categories of catchment attributes related to climate, topography, soil properties, and land cover, respectively. The proportional contribution of each category is illustrated by the bar height in the lower-right corner.
4.2 Long-Term Trends of Process Connectivity
Figure 5 depicts the long-term trends of process connectivity spanning from 1950 to 2020. For the runoff coefficient as shown in Fig. 5a–c, the increasing trends are observed across the majority of catchments in both dry and wet climate zones, with a median relative Sen's slope of 0.6 % per decade and 0.3 % per decade, respectively. In contrast, the majority of catchments in snow climates exhibit declining trends, with a median relative Sen's slope of −0.2 % per decade. The high increasing trends are mainly located in the Amazon (AMZ; 1.6 % per decade), northern Australia (NAU, 1.2 % per decade), central North America (CNA; 1.2 % per decade), southeastern South America (SES, 1.1 % per decade), and northeastern South America (NES, 1.0 % per decade). Meanwhile, significant decreasing trends are mainly observed in the Mediterranean (MED, −1.0 % per decade) and western North America (WNA, −0.6 % per decade). For the runoff intensity (Fig. 5e and f), the spatial distribution of long-term trends matches that of the runoff coefficient, with the high increasing trends in the AMZ (2.6 % per decade), SES (2.0 % per decade), NES (1.9 % per decade), NAU (1.8 % per decade) and CNA (1.4 % per decade), and the high decreasing trends in WNA (−0.9 % per decade) and MED (−0.7 % per decade). This indicates that long-term trends of the transformation ratio (i.e., runoff coefficient) and the transformation rate (i.e., runoff intensity) from precipitation to runoff show great synergy, meaning that regions with a higher transformation ratio may simultaneously experience a faster transformation rate under climate change. For runoff efficiency as shown in Fig. 5g–i, the high increasing trends also lie in the AMZ (3.4 % per decade), SES (2.5 % per decade), CNA (2.3 % per decade), NAU (1.8 % per decade), and NES (3.0 % per decade), and the high decreasing trends are also in the WNA (−1.5 % per decade) and MED (−0.9 % per decade), with the magnitude of change exceeding that of both runoff coefficient and runoff intensity.
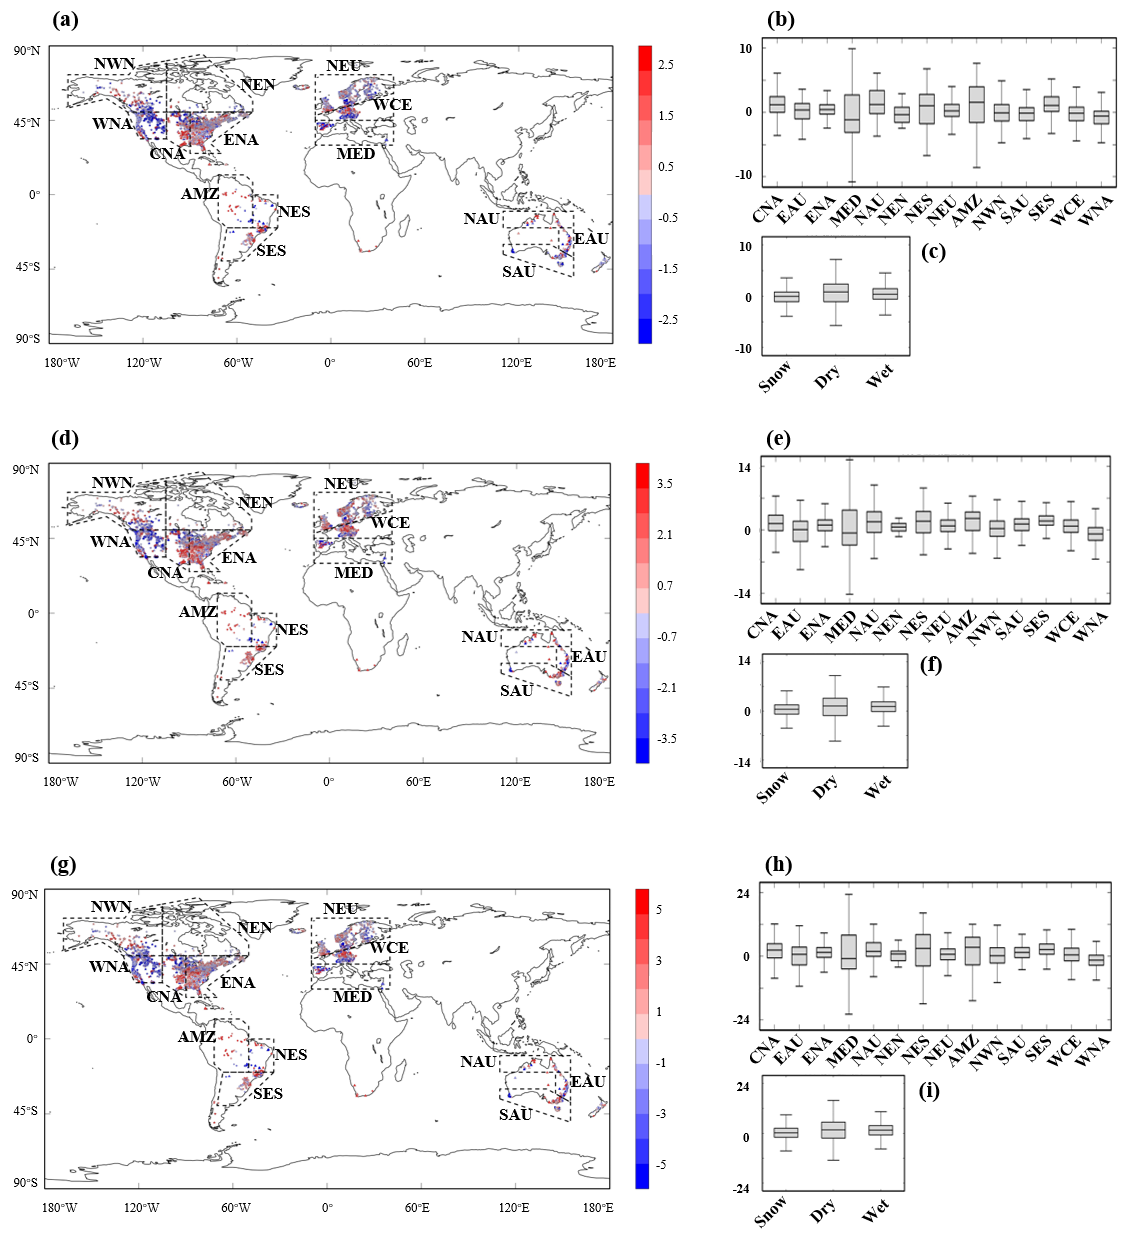
Figure 5The long-term trends of the process connectivity indicators over 1950–2020. (a–c) for the runoff coefficient (unit: % per decade). (d–f) for the runoff intensity (unit: % per decade). (g–i) for the runoff efficiency (unit: % per decade).
Overall, the hotspots of increasing process connectivity for runoff generation under climate change are the Amazon, southeastern South America, central North America, northern Australia, and northeastern South America. In these regions, a larger proportion of rainfall is transformed to runoff at a faster rate, typically accompanied by greater event runoff volumes and higher peak discharges, thereby elevating the potential for flood generation. By contrast, the hotspots of decreasing process connectivity are western North America and the Mediterranean, with relatively lower potential for flood generation.
4.3 Event-To-Event Variability of Process Connectivity
By examining the variations in process connectivity indicators across events grouped by peak discharge quantile ranges (Figs. S7–S9 in the Supplement), we find that these connectivity indicators increase consistently with increasing discharge quantiles, demonstrating a robust positive association between the runoff generation process connectivity and the event peak discharges. To highlight the contrast between the extreme conditions, we further quantified the fold-change in the connectivity indicators across peak-discharge quantile ranges, specifically the ratios of values in the highest range (i.e., 80–100th percentile) to those in the lowest range (i.e., 0–20th percentile), as shown in Fig. 6. Across all catchments, the runoff coefficient, runoff intensity, and runoff efficiency associated with events in the high peak discharge quantiles range are 3, 4, and 11 times those for low peak discharge quantile range, respectively. For the runoff coefficient (Fig. 6a–c), the highest fold-change ratios are found in the dry climate zones, with a median value of 5.4. In contrast, wet and snow climate zones exhibit relatively lower values, with a median value of 3.5 and 2.7, respectively. Spatially, the high values are found in EAU, NAU, CNA, and SAU, with a median value of 6.6, 4.8, 4.1, and 4.1, respectively, while the low values are found in NEN, NWN, and AMZ, with a median value of 1.6, 1.9, and 2.5. For the runoff intensity and runoff efficiency as shown in Fig. 6d–i, the spatial distribution is similar to that of the runoff coefficient, with the high values in EAU (17.1 for runoff intensity; 87.3 for runoff efficiency), NAU (11.5; 46.5), CNA (8.0; 27.5), and SAU (6.7; 21.9), and low values in NEN (2.3; 2.9), NWN (2,2; 3.6), and AMZ (1.9; 3.6) for both indicators. Furthermore, the highest fold-change ratios are found in the dry climate zones, where runoff intensity and runoff efficiency reach 10.7 and 54.4 folds, respectively, suggesting the significant nonlinear response of runoff processes to peak discharge.
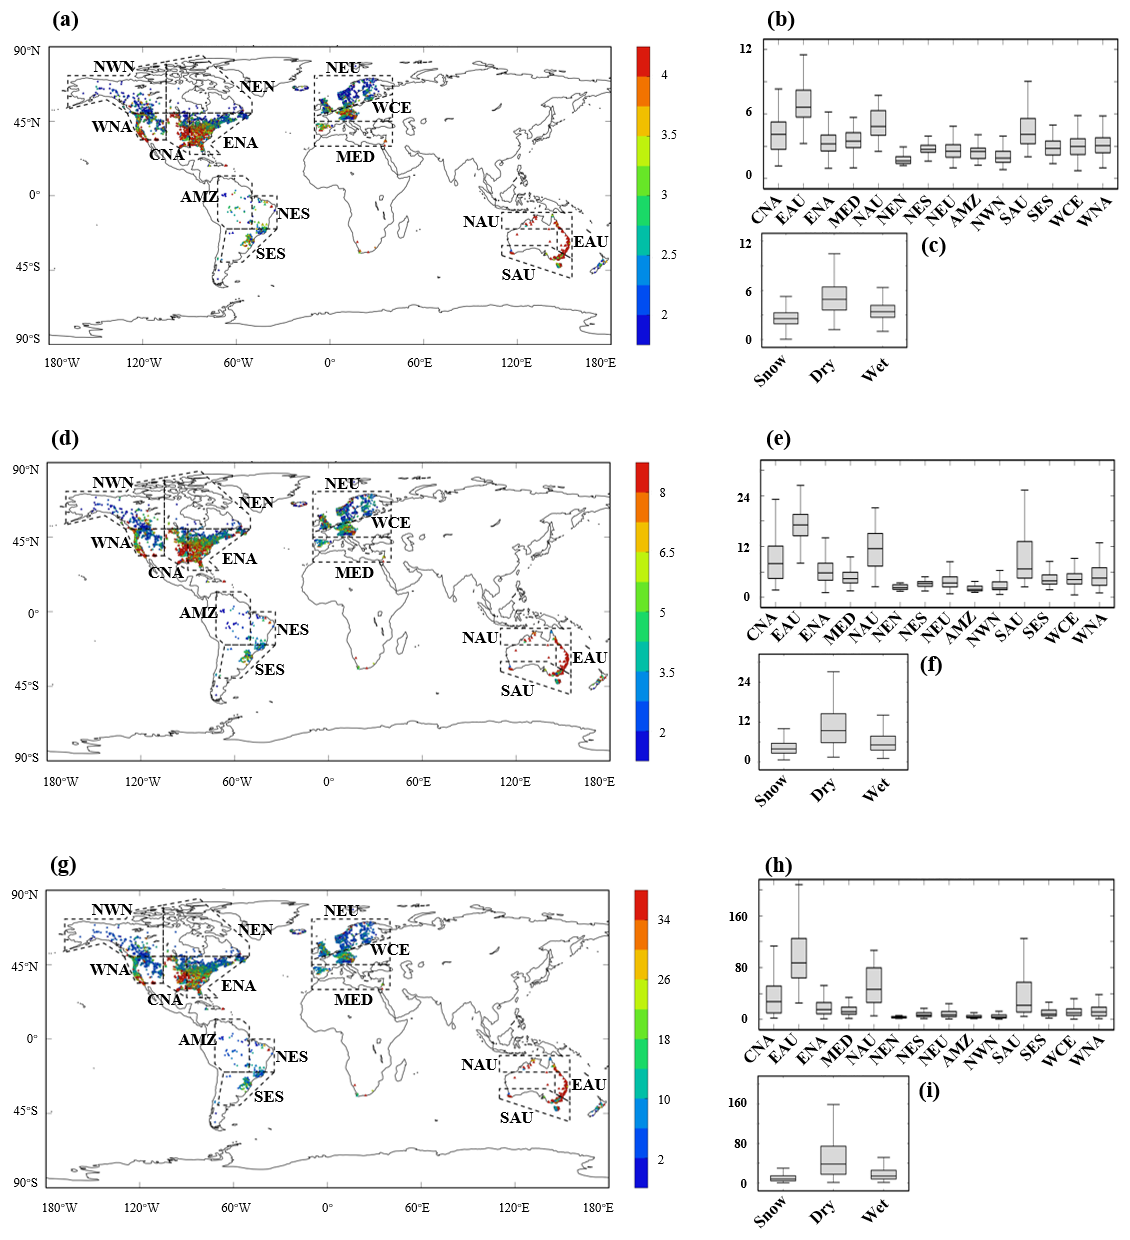
Figure 6The fold-change in the connectivity indicators from the highest to the lowest peak-discharge quantile ranges, i.e., (80–100th percentile)(0–20th percentile). (a–c) for the runoff coefficient. (d–f) for the runoff intensity. (g–i) for the runoff efficiency.
To investigate how precipitation intensity influences runoff efficiency, we adopt a power function to fit event-based data for each individual catchment, with model parameters calibrated by the least squares method. A representative fitting example is illustrated in Fig. S10 in the Supplement, while the overall fitting performance across all catchments is summarized in Fig. S11 in the Supplement, with a mean R2 of 0.37. The spatial distributions of the two fitted parameters RE10, defined as the runoff efficiency under a unit precipitation intensity of 10 mm d−1, and m, representing the sensitivity of runoff efficiency to changes in precipitation intensity, are illustrated in Fig. 7. The regional statistical summaries for these parameters are provided in Table 3. For the parameter RE10 (Fig. 7a–c), its spatial distribution closely aligns well with that of multi-year average runoff efficiency (Fig. 4c). Dry climate zones exhibit relatively lower values, with a median of 1.9 mm d−1, whereas wet and snow climate zones show higher median values of 2.8 and 3.8 mm d−1, respectively. Regionally, the highest values (i.e., 3.9 mm d−1) are found in NEN and WNA, whereas the lowest values (0.9 mm d−1) are found in EAU. For the parameter m (Fig. 7d–f), the highest median value of 1.65 is found in the dry climate zones, while wet and snow climate zones exhibit relatively lower median values of 1.17 and 1.05, respectively. Thus, dry climate zones exhibit relatively high RE10 values that are associated with high sensitivity, whereas wet and snow climate zones show relatively low RE10 values that are associated with low sensitivity. Regionally, the highest sensitivity values are found in EAU (1.88) and NAU (1.70), while the lowest are found in MED (0.67) and NEN (0.72).
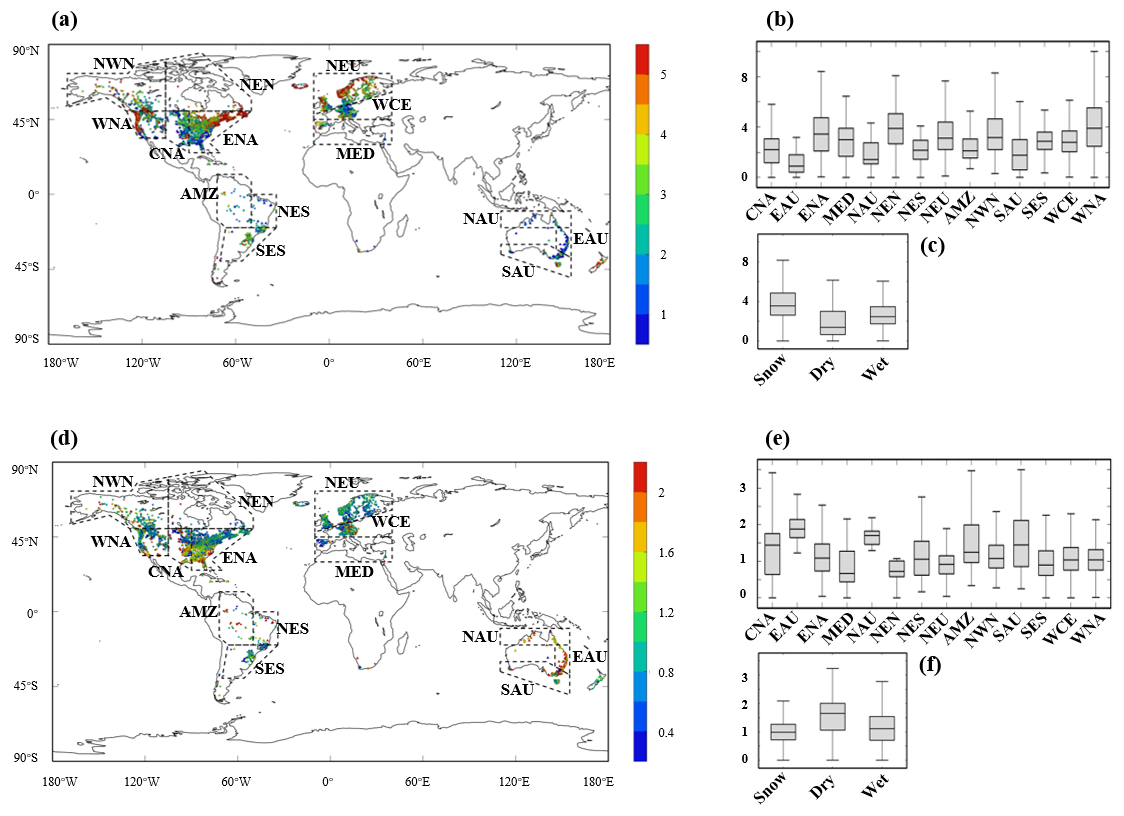
Figure 7The spatial pattern of parameters of the power-law relationships between precipitation intensity and runoff efficiency. (a–c) for the parameter RE10. (d–f) for the parameter m.
Table 3Parameters and determination coefficients (R2) of the power-law relationships between precipitation intensity and runoff efficiency across regions.

5.1 Factors driving RC, RI, and RE
Through an interpretable machine learning approach, we revealed the factors driving the spatial variability of the process connectivity indicators across the globe (Fig. 4). For the runoff coefficient (RC), the dominant factors are aridity and mean annual precipitation. This finding aligns with previous regional investigations, which demonstrated that mean runoff coefficients are primarily governed by climatic factors, particularly the multi-year average of precipitation and the ratio of evapotranspiration to precipitation (Merz and Blöschl, 2009; Merz et al., 2006). Thus the climatic water–energy balance largely determines the average fraction of precipitation that transforms into runoff, consistent with the classical Budyko framework that a higher climatic aridity index increases the evaporative fraction () and reduces the runoff coefficient, leading to low runoff coefficients in dry areas and higher runoff coefficients in wet areas (Liang et al., 2015; Cheng et al., 2025; Cavalcante et al., 2019). It is worth highlighting that snow-dominated catchments exhibit the highest multi-year mean RC, which is likely attributed to the generally lower evaporative losses and the reduced infiltration capacity in frozen or near-saturated soils (Lundberg et al., 2016). This finding is further supported by the importance of snow fraction in explaining spatial RC variations (Fig. 4a). For the runoff intensity (RI), however, average duration and frequency of high-precipitation events show strong impacts, suggesting that shorter and/or more frequent intense precipitation events tend to generate more temporally concentrated runoff events with shorter ΔtR and consequently higher RI values. For the runoff efficiency (RE), the dominant factors are the multi-year average of precipitation, frequency of high-precipitation events, and seasonality of precipitation, indicating the rationality of this integrated connectivity metric that can capture both quantity and speed dimensions of runoff generation processes. In terms of categorical attributions, the explainable machine learning reveals that climate-related attributes account for a substantial portion of the cross-catchment variability in RC, RI and RE, suggesting that climatic water–energy availability acts as a first-order constraint on long-term runoff-generation connectivity at the global scale, while landscape characteristics (e.g., topography, soils and land cover) exert potentially region-specific regulatory effects. This finding is consistent with previous large-sample research on the dominant role of climate attributes in runoff generation processes (Kuentz et al., 2017; Jehn et al., 2020). It is also important to note that the strong climate gradients inherent in global datasets may mask subtler (yet process-relevant) controls from soils and geology characteristics that are frequently emphasized in field-based studies on the connectivity of the runoff generation process (Tromp-Van Meerveld and Mcdonnell, 2006).
By analysing long-term trends of the process connectivity indicators for runoff generation over 1950–2020, we identified several hotspots (Fig. 5). In general, trends in the RC and RI are highly coherent across most catchments worldwide, with regions experiencing increases in runoff transformation ratios tending to exhibit simultaneous increases in transformation intensity, and vice versa. Under the changing climate, the Amazon, southeastern and northeastern South America, central North America, and northern Australia exhibit pronounced increases in process connectivity. This might be attributed to the increases in occurrence frequency and magnitude of extreme precipitation events, which result in a greater fraction of precipitation being rapidly transformed into runoff (Donat et al., 2016; Harp and Horton, 2022). The increasing connectivity brings larger event runoff volumes and higher peak discharges, and thus causes a greater potential for flood generation. In contrast, the decreasing trends in runoff generation connectivity are found in western North America and the Mediterranean, which might be attributed to the reduction of total precipitation and enhanced evaporation. Thus, there are drier soils, lower runoff coefficients, and weaker runoff intensity, and consequently a reduction in average potential for flood generation (Zhan et al., 2019). It is important to note that a lower connectivity does not guarantee complete safety, as extreme events can still occur unexpectedly (Yan et al., 2025). Overall, the trends of the runoff generation connectivity offer a process-based perspective on acceleration or deceleration of the global hydrological cycle and reveal how the spatial pattern of potential for flood generation evolves in response to climate change.
At the event scale, we developed an empirical power-law model that quantifies the linkage between precipitation intensity and runoff efficiency. Characterized by its simplicity and flexibility, this two-parameter model effectively captures how runoff-generation connectivity evolves in response to precipitation intensity from weak to strong events. Across all catchments, the mean coefficient of determination is around 0.37, indicating that precipitation intensity alone can explain a substantial portion of the variability in runoff efficiency. Cross-climate analyses reveal that dry catchments exhibit a low baseline runoff efficiency per unit precipitation intensity (RE10), while exhibiting the highest sensitivity parameter m (Fig. 7c and f). This pattern implies that strong evaporation and infiltration losses keep low runoff-generation connectivity under ordinary storms, whereas sufficiently intense events can temporarily exceed the soil infiltration capacity, causing the amount and intensity of runoff to increase sharply and leading to an amplification effect to precipitation intensity (m>1). In contrast, wet catchments exhibit high baseline RE10 but low values for the sensitivity parameter m. Even small to moderate storm events in these hydrologically saturated regions generate a relatively large fraction of runoff, and further increases in precipitation intensity might not translate into proportional gains in runoff efficiency. This contrast reflects the fundamental differences in runoff-generation mechanisms: runoff generation in dry catchments is typically dominated by the infiltration-excess runoff with clear intensity thresholds, whereas it is more prone to saturation-excess runoff in wet catchments, where near-saturated soils allow even modest storms to produce runoff, leading to high baseline efficiency but much smoother changes with intensity. As the precipitation regime is projected to change under future climates (Song et al., 2024; Liu et al., 2024), regional empirical relationships between precipitation intensity and runoff efficiency provide a practical way for assessing shifts in runoff-generation connectivity, with potential applicability across the globe.
Our results show that at the multi-year mean scale, RE predominantly reflects a trade-off between RC and RI spatially. Specifically, under long-term average hydrological conditions, catchments with high RC tend to exhibit relatively low RI, and vice versa (Fig. 3). This contrast highlights the long-term regulatory role of climatic conditions in shaping the process connectivity for runoff generation, that is, water-abundant conditions tend to “win by quantity”, whereas water-limited conditions “win by rate”, revealing a fundamental compensatory balance between RC and RI. Besides, at the event scale, RE exhibits a strongly nonlinear response to meteorological forcing within a given catchment, particularly marked by a pronounced amplification with increasing precipitation intensity. Specifically, our analysis reveals that RE increases nonlinearly with the intensity of individual precipitation events, where high-intensity storms produce substantially greater RE values compared with low-intensity events (Fig. 7). Such behaviour is difficult to detect in long-term averages, where the effects of individual events with varying intensities are smoothed out over time. This nonlinear amplification indicates that, during heavy storms, both the ratio and the rate of precipitation to runoff transformation increase simultaneously and substantially, owing to the threshold effect inherent in the precipitation–runoff process (Zhang et al., 2021). More precipitation could be transformed into runoff at a faster rate, causing a sharp increase in RE. Such threshold-triggered nonlinear responses in runoff generation have been reported in many previous studies (Detty and Mcguire, 2010; Mahmood and Vivoni, 2011; Willgoose and Perera, 2001). Moreover, it should be noted that the RE is an integrated connectivity indicator for runoff generation, and a given RE value can result from different combinations of RC and RI. For instance, a high RE may stem from a scenario of high RC and low RI, or, conversely, from a scenario of low RC paired with exceptionally high RI. This multiplicity of pathways highlights that RE is not determined by a single factor but emerges from the nonlinear integration of catchment-specific connectivity and infiltration processes. It is necessary to comprehensively use these indicators for characterising the connectivity of the runoff generation to improve our understanding of how the water cycle responds to the changing climate from a process perspective.
5.2 Limitations
It is also important to acknowledge the limitations of our study. First, our analysis only relies on a single conceptual rainfall–runoff model with its own assumptions and simplifications, which may not be universally applicable across the diverse range of global catchments and introduces structural uncertainty (Parasuraman and Elshorbagy, 2008). Although parameter calibration and performance screening have already secured a reasonable level of accuracy, future work could be done for ensembling hydrological models to better capture runoff-generation processes and to enhance the robustness of the results (Solanki et al., 2025). Second, the selected catchments exhibit uneven spatial distribution across regions and climate zones, a limitation that could undermine the representativeness of data-sparse areas. Although median-based summaries can reduce the effects of uneven spatial distribution, interpretation of the regional results from these underrepresented areas should be cautious. More data from the available hydrological stations would enable more refined and robust regional analyses. Third, uncertainties also exist in the identification and matching of rainfall–runoff events. Runoff events are currently defined to end when simulated quickflow returns to zero, yet in humid catchments, slow recession and structural biases from baseflow separation and model simulation may prevent strict zero-flow conditions, potentially causing event splitting or merging. In addition, the 0.1 mm d−1 threshold employed to delineate rainfall events is an empirical truncation criterion that may alter event boundaries, especially under hydroclimatic extremes. Moreover, rainfall–runoff matching relies on the DCMA-based lag window and the assumption that the rainfall-event centroid falls within that window; this assumption may be violated by nonlinear responses, particularly for long-duration and low-intensity events, thereby introducing matching errors. These uncertainties potentially affect event-scale identification and matching to some degree, but are expected to be partially mitigated in our analysis of multi-event averages and large-scale spatial patterns. Finally, the empirical power-law relationship developed here does not exactly account for event total precipitation depth and antecedent soil moisture, which can influence runoff-generation connectivity by governing storage filling and the expansion of saturated contributing areas, particularly in wet catchments where saturation-excess runoff is more prevalent (Zhang et al., 2021). Two storms with similar precipitation intensities can produce significantly different runoff efficiencies. For instance, a storm following a prolonged dry period generally tends to produce lower efficiency compared to one occurring under wet antecedent conditions. Since future climate change is projected to alter both the distribution of precipitation characteristics and soil moisture conditions (Yao et al., 2025), the empirical relationship calibrated under current conditions is likely to become invalid under future climate scenarios. These acknowledged limitations and uncertainties will be addressed and mitigated in future work.
A novel framework has been developed for assessing process connectivity in runoff generation through intensity integration. The RC and RI are adopted to represent the transformation ratio and rate from precipitation to runoff, respectively, and a composite metric RE is proposed to characterise process connectivity in runoff generation across both dimensions. Applying this developed framework to 6603 catchments globally over 1950–2020, we quantify the spatial patterns of process connectivity, figure out their climatic and landscape controls using interpretable machine learning, and examine their long-term trends and event-scale responses to precipitation intensity. According to the long-term average values of the metrics, we find a relatively high RC and low RI in wet areas, while a relatively low RC and high RI in dry areas, highlighting a trade-off between the transformation ratio and rate across climates. Interpretable machine learning further reveals that climatic attributes, especially aridity, mean annual precipitation, average duration and frequency of high-precipitation events, and the seasonality of precipitation, primarily control the process connectivity indicators at the global scale. The analysis of long-term trends reveals a synergy of transformation ratio and rate, with hotspots of increasing process connectivity identified in the Amazon, southeastern South America, central North America, northern Australia, and northeastern South America, suggesting a larger event runoff volume and higher peak discharge, and thus a higher potential for flood generation. In contrast, hotspots of decreasing process connectivity are found in western North America and the Mediterranean, associated with a relatively lower potential for flood generation. Event-scale analysis reveals that across all selected catchments, the RC, RI, and RE for events with the highest peak discharge quantiles are three times, four times, and 11 times higher than corresponding values for events with the lowest peak discharge quantiles, respectively. We further establish an empirical power-law relationship between precipitation intensity and RE and find a high sensitivity under dry climates, indicating the nonlinear amplification effect of runoff generation in water-limited regions during intense storm events. Overall, our proposed process-connectivity framework, integrated both the transformation ratio and rate from precipitation to runoff, offers a novel and multi-dimensional perspective to understand spatiotemporal variations in the runoff generation process. And the framework allows for extension to other critical processes in the global hydrological cycle, including precipitation recycling and runoff routing dynamic processes.
The Caravan dataset (Kratzert et al., 2023) can be accessed publicly via https://doi.org/10.5281/zenodo.7540792 (Kratzert et al., 2022). The Random Forest algorithm was implemented using the Python scikit-learn library, which is available at https://scikit-learn.org/stable/ (last access: 30 June 2026). The code for computing accumulated local effects (ALE) can be obtained from https://github.com/DanaJomar/PyALE (last access: 30 June 2026).
The supplement related to this article is available online at https://doi.org/10.5194/hess-30-4321-2026-supplement.
HL designed the model architecture, performed the computations, conducted the statistical analysis, and drafted the manuscript. DL acquired funding, contributed to the study design, provided research data, supervised the project, and guided the manuscript revision. JZ contributed to manuscript revision discussions and provided advice on submission procedures. FY and YZ participated in revision discussions and contributed to figure and chart preparation. All authors reviewed and approved the final version of the manuscript for submission.
The contact author has declared that none of the authors has any competing interests.
Publisher's note: Copernicus Publications remains neutral with regard to jurisdictional claims made in the text, published maps, institutional affiliations, or any other geographical representation in this paper. The authors bear the ultimate responsibility for providing appropriate place names. Views expressed in the text are those of the authors and do not necessarily reflect the views of the publisher.
The authors gratefully acknowledge the financial support from the National Key Research and Development Project of China (2024YFC3012402) and the National Natural Science Foundation of China (No. 52379022).
This research has been supported by the National Key Research and Development Program of China (grant no. 2024YFC3012402) and the National Natural Science Foundation of China (grant no. 52379022).
This paper was edited by Rohini Kumar and reviewed by three anonymous referees.
Apley, D. W. and Zhu, J. Y.: Visualizing the effects of predictor variables in black box supervised learning models, J. Roy. Stat. Soc. B, 82, 1059–1086, https://doi.org/10.1111/rssb.12377, 2020.
Arsenault, R., Essou, G. R. C., and Brissette, F. P.: Improving Hydrological Model Simulations with Combined Multi-Input and Multimodel Averaging Frameworks, J. Hydrol. Eng., 22, https://doi.org/10.1061/(asce)he.1943-5584.0001489, 2017.
Badoux, A., Witzig, J., Germann, P. F., Kienholz, H., Lüscher, P., Weingartner, R., and Hegg, C.: Investigations on the runoff generation at the profile and plot scales, Swiss Emmental, Hydrol. Process., 20, 377–394, https://doi.org/10.1002/hyp.6056, 2006.
Bishop, K., Ameli, A., Grabs, T., Laudon, H., Amvrosiadi, N., Kolbe, T., Seibert, J., and van Meerveld, I.: Identifying Subsurface Connectivity From Observations: Experimentation With Equifinality Defines Both Challenges and Pathways to Progress, Hydrol. Process., 38, https://doi.org/10.1002/hyp.15324, 2024.
Blöschl, G.: Three hypotheses on changing river flood hazards, Hydrol. Earth Syst. Sci., 26, 5015–5033, https://doi.org/10.5194/hess-26-5015-2022, 2022.
Bloeschl, G., Hall, J., Viglione, A., Perdigao, R. A. P., Parajka, J., Merz, B., Lun, D., Arheimer, B., Aronica, G. T., Bilibashi, A., Bohác, M., Bonacci, O., Borga, M., Canjevac, I., Castellarin, A., Chirico, G. B., Claps, P., Frolova, N., Ganora, D., Gorbachova, L., Gül, A., Hannaford, J., Harrigan, S., Kireeva, M., Kiss, A., Kjeldsen, T. R., Kohnová, S., Koskela, J. J., Ledvinka, O., Macdonald, N., Mavrova-Guirguinova, M., Mediero, L., Merz, R., Molnar, P., Montanari, A., Murphy, C., Osuch, M., Ovcharuk, V., Radevski, I., Salinas, J. L., Sauquet, E., Sraj, M., Szolgay, J., Volpi, E., Wilson, D., Zaimi, K., and Zivkovic, N.: Changing climate both increases and decreases European river floods, Nature 573, 108–111, https://doi.org/10.1038/s41586-019-1495-6, 2019.
Bracken, L. J., Wainwright, J., Ali, G. A., Tetzlaff, D., Smith, M. W., Reaney, S. M., and Roy, A. G.: Concepts of hydrological connectivity: Research approaches, pathways and future agendas, Earth-Sci. Rev., 119, 17–34, https://doi.org/10.1016/j.earscirev.2013.02.001, 2013.
Brêda, J. P. L. F., Melsen, L. A., Athanasiadis, I., Van Dijk, A., Siqueira, V. A., Verhoef, A., Zeng, Y., and van der Ploeg, M.: Predictor Importance for Hydrological Fluxes of Global Hydrological and Land Surface Models, Water Resour. Res., 60, https://doi.org/10.1029/2023wr036418, 2024.
Breiman, L.: Random forests, Mach. Learn., 45, 5–32, https://doi.org/10.1023/a:1010933404324, 2001.
Bronstert, A., Niehoff, D., and Bürger, G.: Effects of climate and land-use change on storm runoff generation: present knowledge and modelling capabilities, Hydrol. Process., 16, 509–529, https://doi.org/10.1002/hyp.326, 2002.
Bronstert, A., Niehoff, D., and Schiffler, G. R.: Modelling infiltration and infiltration excess: The importance of fast and local processes, Hydrol. Process., 37, https://doi.org/10.1002/hyp.14875, 2023.
Brown, B. C., Fullerton, A. H., Kopp, D., Tromboni, F., Shogren, A. J., Webb, J. A., Ruffing, C., Heaton, M., Kuglerová, L., Allen, D. C., McGill, L., Zarnetske, J. P., Whiles, M. R., Jones, J. B., and Abbott, B. W.: The Music of Rivers: The Mathematics of Waves Reveals Global Structure and Drivers of Streamflow Regime, Water Resour. Res., 59, https://doi.org/10.1029/2023wr034484, 2023.
Bush, S. A., Stallard, R. F., Ebel, B. A., and Barnard, H. R.: Assessing plot-scale impacts of land use on overland flow generation in Central Panama, Hydrol. Process., 34, 5043–5069, https://doi.org/10.1002/hyp.13924, 2020.
Cavalcante, R. B. L., Pontes, P. R. M., Souza, P. W. M., and de Souza, E. B.: Opposite Effects of Climate and Land Use Changes on the Annual Water Balance in the Amazon Arc of Deforestation, Water Resour. Res., 55, 3092–3106, https://doi.org/10.1029/2019wr025083, 2019.
Chen, B., Krajewski, W. F., Helmers, M. J., and Zhang, Z. D.: Spatial Variability and Temporal Persistence of Event Runoff Coefficients for Cropland Hillslopes, Water Resour. Res., 55, 1583–1597, https://doi.org/10.1029/2018wr023576, 2019.
Cheng, S. J., Hulsman, P., Koppa, A., Beck, H. E., Xia, J., Xu, J. J., Cheng, L., and Miralles, D. G.: Global Runoff Partitioning Based on Budyko-Constrained Machine Learning, Water Resour. Res., 61, https://doi.org/10.1029/2025wr039863, 2025.
Clerc-Schwarzenbach, F., Selleri, G., Neri, M., Toth, E., van Meerveld, I., and Seibert, J.: Large-sample hydrology – a few camels or a whole caravan?, Hydrol. Earth Syst. Sci., 28, 4219–4237, https://doi.org/10.5194/hess-28-4219-2024, 2024.
Costabile, P., Barbero, G., Nagy, E. D., Négyesi, K., Petaccia, G., and Costanzo, C.: Predictive capabilities, robustness and limitations of two event-based approaches for lag time estimation in heterogeneous watersheds, J. Hydrol., 642, https://doi.org/10.1016/j.jhydrol.2024.131814, 2024.
Detty, J. M. and McGuire, K. J.: Threshold changes in storm runoff generation at a till-mantled headwater catchment, Water Resour. Res., 46, https://doi.org/10.1029/2009wr008102, 2010.
do Nascimento, T. V. M., Rudlang, J., Gnann, S., Seibert, J., Hrachowitz, M., and Fenicia, F.: How do geological map details influence the identification of geology-streamflow relationships in large-sample hydrology studies?, Hydrol. Earth Syst. Sci., 29, 7173–7200, https://doi.org/10.5194/hess-29-7173-2025, 2025.
Donat, M. G., Lowry, A. L., Alexander, L. V., O'Gorman, P. A., and Maher, N.: More extreme precipitation in the world's dry and wet regions, Nat. Clim. Change, 6, 508–513, https://doi.org/10.1038/nclimate2941, 2016.
Duan, Q., Sorooshian, S., and Gupta, V.: Effective and efficient global optimization for conceptual rainfall–runoff models. Water Resour. Res., 28, 1015–1031, https://doi.org/10.1029/91WR02985, 1992.
Färber, C., Plessow, H., Mischel, S. A., Kratzert, F., Addor, N., Shalev, G., and Looser, U.: GRDC-Caravan: extending Caravan with data from the Global Runoff Data Centre, Earth Syst. Sci. Data, 17, 4613–4625, https://doi.org/10.5194/essd-17-4613-2025, 2025.
Giani, G., Rico-Ramirez, M. A., and Woods, R. A.: A Practical, Objective, and Robust Technique to Directly Estimate Catchment Response Time, Water Resour. Res., 57, https://doi.org/10.1029/2020wr028201, 2021.
Gomi, T., Sidle, R. C., Miyata, S., Kosugi, K., and Onda, Y.: Dynamic runoff connectivity of overland flow on steep forested hillslopes: Scale effects and runoff transfer, Water Resour. Res., 44, https://doi.org/10.1029/2007wr005894, 2008a.
Gomi, T., Sidle, R. C., Ueno, M., Miyata, S., and Kosugi, K.: Characteristics of overland flow generation on steep forested hillslopes of central Japan, J. Hydrol., 361, 275–290, https://doi.org/10.1016/j.jhydrol.2008.07.045, 2008b.
Gou, J. J., Miao, C. Y., Ni, J. R., Sorooshian, S., Duan, Q. Y., Yan, D. H., Slater, L., Xu, Z. X., Borthwick, A. G. L., Su, L., Zhang, Q., and Wada, Y.: Warming climate and water withdrawals threaten river flow connectivity in China, P. Natl. Acad. Sci. USA, 122, https://doi.org/10.1073/pnas.2421046122, 2025.
Guan, X. D., Guo, S. Y., Huang, J. P., Shen, X. H., Fu, L., and Zhang, G. L.: Effect of seasonal snow on the start of growing season of typical vegetation in Northern Hemisphere, Geography and Sustainability, 3, 268–276, https://doi.org/10.1016/j.geosus.2022.09.001, 2022.
Gyasi-Agyei, Y. and Melching, C. S.: Modelling the dependence and internal structure of storm events for continuous rainfall simulation, J. Hydrol., 464, 249–261, https://doi.org/10.1016/j.jhydrol.2012.07.014, 2012.
Han, J., Liu, Z., Woods, R., McVicar, T. R., Yang, D., Wang, T., Hou, Y., Guo, Y., Li, C., and Yang, Y.: Streamflow seasonality in a snow-dwindling world, Nature, 629, 1075–1081, https://doi.org/10.1038/s41586-024-07299-y, 2024.
Han, J. T., Yang, Y. T., Roderick, M. L., McVicar, T. R., Yang, D. W., Zhang, S. L., and Beck, H. E.: Assessing the Steady-State Assumption in Water Balance Calculation Across Global Catchments, Water Resour. Res., 56, https://doi.org/10.1029/2020wr027392, 2020.
Harp, R. D. and Horton, D. E.: Observed Changes in Daily Precipitation Intensity in the United States, Geophys. Res. Lett., 49, https://doi.org/10.1029/2022gl099955, 2022.
Hashino, M., Yao, H. X., and Yoshida, H.: Studies and evaluations on interception processes during rainfall based on a tank model, J. Hydrol., 255, 1–11, https://doi.org/10.1016/s0022-1694(01)00506-6, 2002.
Herbst, M., Diekkrüger, B., and Vanderborght, J.: Numerical experiments on the sensitivity of runoff generation to the spatial variation of soil hydraulic properties, J. Hydrol., 326, 43–58, https://doi.org/10.1016/j.jhydrol.2005.10.036, 2006.
Hövel, A., Stumpp, C., Bogena, H., Lücke, A., Strauss, P., Blöschl, G., and Stockinger, M.: Hydro-Meteorological Drivers of Event Runoff Characteristics Under Analogous Soil Moisture Patterns in Three Small-Scale Headwater Catchments, Hydrol. Process., 39, https://doi.org/10.1002/hyp.70173, 2025.
Hunt, A., Ghanbarian, B., Sahimi, M., and Duan, Q. Y.: Scale Effect on Evapotranspiration: Predicting the Continental and Global Scale Water Balance Based on Percolation Theory and Optimality Principle, Water Resour. Res., 61, https://doi.org/10.1029/2024wr039658, 2025.
Ijjaszvasquez, E. J., Bras, R. L., and Moglen, G. E.: Sensitivity of a basin evolution model to the nature of runoff production and to initial conditions, Water Resour. Res., 28, 2733–2741, https://doi.org/10.1029/92wr01561, 1992.
Iturbide, M., Gutiérrez, J. M., Alves, L. M., Bedia, J., Cerezo-Mota, R., Cimadevilla, E., Cofiño, A. S., Di Luca, A., Faria, S. H., Gorodetskaya, I. V., Hauser, M., Herrera, S., Hennessy, K., Hewitt, H. T., Jones, R. G., Krakovska, S., Manzanas, R., Martínez-Castro, D., Narisma, G. T., Nurhati, I. S., Pinto, I., Seneviratne, S. I., van den Hurk, B., and Vera, C. S.: An update of IPCC climate reference regions for subcontinental analysis of climate model data: definition and aggregated datasets, Earth Syst. Sci. Data, 12, 2959–2970, https://doi.org/10.5194/essd-12-2959-2020, 2020.
Jehn, F. U., Bestian, K., Breuer, L., Kraft, P., and Houska, T.: Using hydrological and climatic catchment clusters to explore drivers of catchment behavior, Hydrol. Earth Syst. Sci., 24, 1081–1100, https://doi.org/10.5194/hess-24-1081-2020, 2020.
Jiang, S. J., Tarasova, L., Yu, G., and Zscheischler, J.: Compounding effects in flood drivers challenge estimates of extreme river floods, Science Advances, 10, https://doi.org/10.1126/sciadv.adl4005, 2024.
Jiang, Y. J., Zhang, Y. L., Fan, B. H., Wen, J. H., Liu, H., Mello, C. R., Cui, J. F., Yuan, C., and Guo, L.: Preferential flow influences the temporal stability of soil moisture in a headwater catchment, Geoderma, 437, https://doi.org/10.1016/j.geoderma.2023.116590, 2023.
Kang, S. Y., Yin, J. B., Gu, L., Yang, Y. H., Liu, D. D., and Slater, L.: Observation-Constrained Projection of Flood Risks and Socioeconomic Exposure in China, Earths Future, 11, https://doi.org/10.1029/2022ef003308, 2023.
Kemter, M., Marwan, N., Villarini, G., and Merz, B.: Controls on Flood Trends Across the United States, Water Resour. Res., 59, https://doi.org/10.1029/2021wr031673, 2023.
Kinnell, P. I. A.: Applying the RUSLE and the USLE-M on hillslopes where runoff production during an erosion event is spatially variable, J. Hydrol., 519, 3328–3337, https://doi.org/10.1016/j.jhydrol.2014.10.016, 2014.
Kratzert, F., Nearing, G., Addor, N., Erickson, T., Gauch, M., Gilon, O., Gudmundsson, L., Hassidim, A., Klotz, D., Nevo, S., Shalev, G., and Matias, Y.: Caravan – A global community dataset for large-sample hydrology, Sci. Data, 10, 61, https://doi.org/10.1038/s41597-023-01975-w, 2023.
Kratzert, F., Nearing, G., Addor, N., Erickson, T., Gauch, M., Gilon, O., Gudmundsson, L., Hassidim, A., Klotz, D., Nevo, S., Shalev, G., and Matias, Y.: Caravan – A global community dataset for large-sample hydrology (1.0), Zenodo [data set], https://doi.org/10.5281/zenodo.7540792, 2022.
Kuentz, A., Arheimer, B., Hundecha, Y., and Wagener, T.: Understanding hydrologic variability across Europe through catchment classification, Hydrol. Earth Syst. Sci., 21, 2863–2879, https://doi.org/10.5194/hess-21-2863-2017, 2017.
Kuhn, N. J. and Yair, A.: Spatial distribution of surface conditions and runoff generation in small arid watersheds, Zin Valley Badlands, Israel, Geomorphology, 57, 183–200, https://doi.org/10.1016/s0169-555x(03)00102-8, 2004.
Léonard, J., Ancelin, O., Ludwig, B., and Richard, G.: Analysis of the dynamics of soil infiltrability of agricultural soils from continuous rainfall–runoff measurements on small plots, J. Hydrol., 326, 122–134, https://doi.org/10.1016/j.jhydrol.2005.10.026, 2006.
Li, H. Y. and Sivapalan, M.: Effect of spatial heterogeneity of runoff generation mechanisms on the scaling behavior of event runoff responses in a natural river basin, Water Resour. Res., 47, https://doi.org/10.1029/2010wr009712, 2011.
Li, X. Y. and Fan, H. M.: Characteristics of the spatiotemporal differences in snowmelt phenology in the Northern Hemisphere, Journal of Hydrology-Regional Studies, 59, https://doi.org/10.1016/j.ejrh.2025.102358, 2025.
Li, Y., Zhou, Q. W., Zhao, Y. L., Cai, L. L., Li, K. P., Chen, Z. S., and Guo, Q.: Regulation of shallow soil hydrological processes by rainfall characteristics and vegetation type on karst hillslopes: Insights from plot-scale field experiments, J. Hydrol., 663, https://doi.org/10.1016/j.jhydrol.2025.134199, 2025.
Liang, H., Liu, D., Wang, W., Yue, F., and Zhang, J.: Understanding Multiscale Hydrological Interactions From Spectral Perspective: A Large Sample Investigation Across the United States, Water Resour. Res., 62, e2025WR041886, https://doi.org/10.1029/2025WR041886, 2026.
Liang, W., Bai, D., Wang, F. Y., Fu, B. J., Yan, J. P., Wang, S., Yang, Y. T., Long, D., and Feng, M. Q.: Quantifying the impacts of climate change and ecological restoration on streamflow changes based on a Budyko hydrological model in China's Loess Plateau, Water Resour. Res., 51, 6500–6519, https://doi.org/10.1002/2014wr016589, 2015.
Linke, S., Lehner, B., Dallaire, C. O., Ariwi, J., Grill, G., Anand, M., Beames, P., Burchard-Levine, V., Maxwell, S., Moidu, H., Tan, F., and Thieme, M.: Global hydro-environmental sub-basin and river reach characteristics at high spatial resolution, Scientific Data, 6, https://doi.org/10.1038/s41597-019-0300-6, 2019.
Liu, Z. Y., Yue, Y., Slater, L., Borthwick, A. G. L., Chai, Y. F., Luan, X. F., Miao, C. Y., and Yang, Z. H.: Constrained Precipitation Extremes Reveal Unequal Future Socioeconomic Exposure, Earths Future, 12, https://doi.org/10.1029/2024ef004825, 2024.
López-Vicente, M., García-Ruiz, R., Guzmán, G., Vicente-Vicente, J. L., Van Wesemael, B., and Gómez, J. A.: Temporal stability and patterns of runoff and runon with different cover crops in an olive orchard (SW Andalusia, Spain), Catena, 147, 125–137, https://doi.org/10.1016/j.catena.2016.07.002, 2016.
Lundberg, A., Ala-Aho, P., Eklo, O., Klöve, B., Kværner, J., and Stumpp, C.: Snow and frost: implications for spatiotemporal infiltration patterns – a review, Hydrol. Process., 30, 1230–1250, https://doi.org/10.1002/hyp.10703, 2016.
Lyne, V. and Hollick, M.: Stochastic time-variable rainfall-runoff modelling, in: Institute of Engineers Australia National Conference, Perth, Australia, 379–387, https://www.researchgate.net/publication/272491803 (last access: 30 June 2026), 1979.
Mahmood, T. H. and Vivoni, E. R.: A climate-induced threshold in hydrologic response in a semiarid ponderosa pine hillslope, Water Resour. Res., 47, https://doi.org/10.1029/2011wr010384, 2011.
Massari, C., Pellet, V., Tramblay, Y., Crow, W. T., Gründemann, G. J., Hascoet, T., Penna, D., Modanesi, S., Brocca, L., Camici, S., and Marra, F.: On the relation between antecedent basin conditions and runoff coefficient for European floods, J. Hydrol., 625, https://doi.org/10.1016/j.jhydrol.2023.130012, 2023.
Mei, Y. W., Wang, D. G., Zhu, J. X., Tang, G. P., Cai, C. K., Shen, X. Y., Hong, Y., and Zhang, X. X.: Optimal Baseflow Separation Through Chemical Mass Balance: Comparing the Usages of Two Tracers, Two Concentration Estimation Methods, and Four Baseflow Filters, Water Resour. Res., 60, https://doi.org/10.1029/2023wr036386, 2024.
Merz, R. and Blöschl, G.: A regional analysis of event runoff coefficients with respect to climate and catchment characteristics in Austria, Water Resour. Res., 45, https://doi.org/10.1029/2008wr007163, 2009.
Merz, R., Blöschl, G., and Parajka, J.: Spatio-temporal variability of event runoff coefficients, J. Hydrol., 331, 591–604, https://doi.org/10.1016/j.jhydrol.2006.06.008, 2006.
Miller, J. D. and Hess, T.: Urbanisation impacts on storm runoff along a rural-urban gradient, J. Hydrol., 552, 474–489, https://doi.org/10.1016/j.jhydrol.2017.06.025, 2017.
Nash, J. E.: The form of the instantaneous unit hydrograph, IAHS-AISH P., 45, 114–121, 1957.
Norbiato, D., Borga, M., Merz, R., Blöschl, G., and Carton, A.: Controls on event runoff coefficients in the eastern Italian Alps, J. Hydrol., 375, 312–325, https://doi.org/10.1016/j.jhydrol.2009.06.044, 2009.
Nyssen, J., Clymans, W., Descheemaeker, K., Poesen, J., Vandecasteele, I., Vanmaercke, M., Zenebe, A., Van Camp, M., Haile, M., Haregeweyn, N., Moeyersons, J., Martens, K., Gebreyohannes, T., Deckers, J., and Walraevens, K.: Impact of soil and water conservation measures on catchment hydrological response – a case in north Ethiopia, Hydrol. Process., 24, 1880–1895, https://doi.org/10.1002/hyp.7628, 2010.
Oda, T., Iwasaki, K., Egusa, T., Kubota, T., Iwagami, S., Iida, S., Momiyama, H., and Shimizu, T.: Scale-Dependent Inter-Catchment Groundwater Flow in Forested Catchments: Analysis of Multi-Catchment Water Balance Observations in Japan, Water Resour. Res., 60, https://doi.org/10.1029/2024wr037161, 2024.
Oki, T. and Kanae, S.: Global hydrological cycles and world water resources, Science, 313, 1068–1072, https://doi.org/10.1126/science.1128845, 2006.
O'Shea, D., Nathan, R., Wasko, C., and Hill, P.: Implications of event-based loss model structure on simulating large floods, J. Hydrol., 595, https://doi.org/10.1016/j.jhydrol.2021.126008, 2021.
Parasuraman, K. and Elshorbagy, A.: Toward improving the reliability of hydrologic prediction: Model structure uncertainty and its quantification using ensemble-based genetic programming framework, Water Resour. Res., 44, https://doi.org/10.1029/2007wr006451, 2008.
Penna, D., Tromp-van Meerveld, H. J., Gobbi, A., Borga, M., and Dalla Fontana, G.: The influence of soil moisture on threshold runoff generation processes in an alpine headwater catchment, Hydrol. Earth Syst. Sci., 15, 689–702, https://doi.org/10.5194/hess-15-689-2011, 2011.
Phillips, R. W., Spence, C., and Pomeroy, J. W.: Connectivity and runoff dynamics in heterogeneous basins, Hydrol. Process., 25, 3061–3075, https://doi.org/10.1002/hyp.8123, 2011.
Richter, B. and Marty, C.: Technical note: Literature based approach to estimate future snow, Hydrol. Earth Syst. Sci., 30, 659–670, https://doi.org/10.5194/hess-30-659-2026, 2026.
Sadeghi, S. H., Kheirfam, H., and Darki, B. Z.: Controlling runoff generation and soil loss from field experimental plots through inoculating cyanobacteria, J. Hydrol., 585, https://doi.org/10.1016/j.jhydrol.2020.124814, 2020.
Schwemmle, R. and Weiler, M.: Consistent Modeling of Transport Processes and Travel Times-Coupling Soil Hydrologic Processes With StorAge Selection Functions, Water Resour. Res., 60, https://doi.org/10.1029/2023wr034441, 2024.
Sheldon, S. A. and Fiedler, F. R.: Direct numerical simulation of Hortonian runoff resulting from heterogeneous saturated hydraulic conductivity, J. Hydrol. Eng., 13, 948–959, https://doi.org/10.1061/(asce)1084-0699(2008)13:10(948), 2008.
Shelef, E., Griffore, M., Mark, S., Coleman, T., Wondolowski, N., Lasher, G. E., and Abbott, M.: Sensitivity of Erosion-Rate in Permafrost Landscapes to Changing Climatic and Environmental Conditions Based on Lake Sediments From Northwestern Alaska, Earths Future, 10, https://doi.org/10.1029/2022ef002779, 2022.
Shen, Y. J., Liu, D. D., Yin, J. B., Xiong, L. H., and Liu, P.: Integrating hybrid runoff generation mechanism into variable infiltration capacity model to facilitate hydrological simulations, Stoch. Env. Res. Risk A., 34, 2139–2157, https://doi.org/10.1007/s00477-020-01878-x, 2020.
Sherman, L. K.: Streamflow from rainfall by the unit-graph method, Eng. News Records, 108, 501–505, 1932.
Solanki, H., Vegad, U., Kushwaha, A., and Mishra, V.: Improving Streamflow Prediction Using Multiple Hydrological Models and Machine Learning Methods, Water Resour. Res., 61, https://doi.org/10.1029/2024wr038192, 2025.
Song, Y. H., Chung, E. S., and Shahid, S.: Global Future Climate Signal by Latitudes Using CMIP6 GCMs, Earths Future, 12, https://doi.org/10.1029/2022ef003183, 2024.
Stein, L., Clark, M. P., Knoben, W. J. M., Pianosi, F., and Woods, R. A.: How Do Climate and Catchment Attributes Influence Flood Generating Processes? A Large-Sample Study for 671 Catchments Across the Contiguous USA, Water Resour. Res., 57, https://doi.org/10.1029/2020wr028300, 2021.
Sumner, H. R., Wauchope, R. D., Truman, C. C., Dowler, C. C., and Hook, J. E.: Rainfall simulator and plot design for mesoplot runoff studies, T. ASAE, 39, 125–130, 1996.
Tarasova, L., Basso, S., Poncelet, C., and Merz, R.: Exploring Controls on Rainfall–Runoff Events: 2. Regional Patterns and Spatial Controls of Event Characteristics in Germany, Water Resour. Res., 54, 7688–7710, https://doi.org/10.1029/2018wr022588, 2018a.
Tarasova, L., Basso, S., Zink, M., and Merz, R.: Exploring Controls on Rainfall–Runoff Events: 1. Time Series – Based Event Separation and Temporal Dynamics of Event Runoff Response in Germany, Water Resour. Res., 54, 7711–7732, https://doi.org/10.1029/2018wr022587, 2018b.
Taye, G., Poesen, J., Van Wesemael, B., Vanmaercke, M., Teka, D., Deckers, J., Goosse, T., Maetens, W., Nyssen, J., Hallet, V., and Haregeweyn, N.: Effects of land use, slope gradient, and soil and water conservation structures on runoff and soil loss in semi-arid Northern Ethiopia, Phys. Geogr., 34, 236–259, https://doi.org/10.1080/02723646.2013.832098, 2013.
Tromp-van Meerveld, H. J. and McDonnell, J. J.: On the interrelations between topography, soil depth, soil moisture, transpiration rates and species distribution at the hillslope scale, Adv. Water Resour., 29, 293–310, https://doi.org/10.1016/j.advwatres.2005.02.016, 2006.
van Tiel, M., Aubry-Wake, C., Somers, L., Andermann, C., Avanzi, F., Baraer, M., Chiogna, G., Daigre, C., Das, S., Drenkhan, F., Farinotti, D., Fyffe, C. L., de Graaf, I., Hanus, S., Immerzeel, W., Koch, F., McKenzie, J. M., Mueller, T., Popp, A. L., Saidaliyeva, Z., Schaefli, B., Schilling, O. S., Teagai, K., Thornton, J. M., and Yapiyev, V.: Cryosphere-groundwater connectivity is a missing link in the mountain water cycle, Nature Water, 2, 624–637, https://doi.org/10.1038/s44221-024-00277-8, 2024.
Viglione, A., Merz, R., and Blöschl, G.: On the role of the runoff coefficient in the mapping of rainfall to flood return periods, Hydrol. Earth Syst. Sci., 13, 577–593, https://doi.org/10.5194/hess-13-577-2009, 2009.
Wang, H., Liu, J. G., Klaar, M., Chen, A. F., Gudmundsson, L., and Holden, J.: Anthropogenic climate change has influenced global river flow seasonality, Science, 383, 1009–1014, https://doi.org/10.1126/science.adi9501, 2024.
Wang, Y. Y., Miao, C. Y., Zhang, Q., Su, J. J., Gou, J., Duan, Q. Y., and Borthwick, A. G. L.: Vegetation and wind speed dominate precipitation-evaporation recycling processes during 1980–2021, Sci. Bull., 70, 2426–2430, https://doi.org/10.1016/j.scib.2025.02.044, 2025.
Wasko, C. and Guo, D. L.: Understanding event runoff coefficient variability across Australia using the hydroEvents R package, Hydrol. Process., 36, https://doi.org/10.1002/hyp.14563, 2022.
Willgoose, G. and Perera, H.: A simple model of saturation excess runoff generation based on geomorphology, steady state soil moisture, Water Resour. Res., 37, 147–155, https://doi.org/10.1029/2000wr900265, 2001.
Wu, S., Zhao, J., Wang, H., and Sivapalan, M.: Regional Patterns and Physical Controls of Streamflow Generation Across the Conterminous United States, Water Resour. Res., 57, e2020WR028086, https://doi.org/10.1029/2020WR028086, 2021.
Wu, S. J., Tetzlaff, D., Yang, X. Q., Sauter, T., and Soulsby, C.: Hydrological Connectivity Dominates NO3-N Cycling in Complex Landscapes – Insights From Integration of Isotopes and Water Quality Modeling, Water Resour. Res., 61, https://doi.org/10.1029/2025wr040525, 2025.
Xiao, L. L., Li, R., Cai, F. Y., Wu, P. P., and Pan, L. H.: Effects of vegetation cover and rock embedding landscape types and configurations on regulating runoff generation and sediment yields in karst slope under simulated experiment, J. Hydrol., 661, https://doi.org/10.1016/j.jhydrol.2025.133681, 2025.
Xie, J. X., Liu, X. M., Jasechko, S., Berghuijs, W. R., Wang, K. W., Liu, C. M., Reichstein, M., Jung, M., and Koirala, S.: Majority of global river flow sustained by groundwater, Nat. Geosci., 17, https://doi.org/10.1038/s41561-024-01483-5, 2024.
Yan, H. X., Duan, Z. R., Wigmosta, M. S., Sun, N., Leung, L. R., Thurber, T. B., Gutmann, E. D., and Arnold, J. R.: How Flood Hazards in a Warming Climate Could Be Amplified by Changes in Spatiotemporal Patterns and Mechanisms of Water Available for Runoff, Earths Future, 13, https://doi.org/10.1029/2024ef005619, 2025.
Yang, D. W., Yang, Y. T., and Xia, J.: Hydrological cycle and water resources in a changing world: A review, Geography and Sustainability, 2, 115–122, https://doi.org/10.1016/j.geosus.2021.05.003, 2021.
Yao, L., Leng, G. Y., Yu, L. F., Li, H. Y., Tang, Q. H., Python, A., Hall, J. W., Liao, X. Y., Li, J., Qiu, J. L., Quaas, J., Huang, S. Z., Jin, Y., Zscheischler, J., and Peng, J.: Emergent constraints on global soil moisture projections under climate change, Communications Earth & Environment, 6, https://doi.org/10.1038/s43247-025-02024-7, 2025.
Yin, J. B., Gentine, P., Zhou, S., Sullivan, S. C., Wang, R., Zhang, Y., and Guo, S. L.: Large increase in global storm runoff extremes driven by climate and anthropogenic changes, Nat. Commun., 9, https://doi.org/10.1038/s41467-018-06765-2, 2018.
Yin, J. B., Guo, S. L., Gentine, P., Sullivan, S. C., Gu, L., He, S. K., Chen, J., and Liu, P.: Does the Hook Structure Constrain Future Flood Intensification Under Anthropogenic Climate Warming?, Water Resour. Res., 57, https://doi.org/10.1029/2020wr028491, 2021.
Zhan, S., Song, C. Q., Wang, J. D., Sheng, Y. W., and Quan, J. P.: A Global Assessment of Terrestrial Evapotranspiration Increase Due to Surface Water Area Change, Earths Future, 7, 266–282, https://doi.org/10.1029/2018ef001066, 2019.
Zhang, G. T., Cui, P., Gualtieri, C., Zhang, J. L., Bazai, N. A., Zhang, Z. T., Wang, J., Tang, J. B., Chen, R., and Lei, M. Y.: Stormflow generation in a humid forest watershed controlled by antecedent wetness and rainfall amounts, J. Hydrol., 603, https://doi.org/10.1016/j.jhydrol.2021.127107, 2021.
Zhang, S. L., Zhou, L. M., Zhang, L., Yang, Y. T., Wei, Z. W., Zhou, S., Yang, D. W., Yang, X. F., Wu, X. C., Zhang, Y. Q., Li, X. Y., and Dai, Y. J.: Reconciling disagreement on global river flood changes in a warming climate, Nat. Clim. Change, 12, 1160–1167, https://doi.org/10.1038/s41558-022-01539-7, 2022.
Zhang, W. X., Zhou, T. J., and Wu, P. L.: Anthropogenic amplification of precipitation variability over the past century, Science, 385, 427–432, https://doi.org/10.1126/science.adp0212, 2024.
Zhang, Y. C., Long, M. S., Chen, K. Y., Xing, L. X., Jin, R. H., Jordan, M. I., and Wang, J. M.: Skilful nowcasting of extreme precipitation with NowcastNet, Nature, 619, 526–532, https://doi.org/10.1038/s41586-023-06184-4, 2023.
Zheng, Y. C., Coxon, G., Woods, R., Li, J. Z., and Feng, P.: Controls on the Spatial and Temporal Patterns of Rainfall–Runoff Event Characteristics – A Large Sample of Catchments Across Great Britain, Water Resour. Res., 59, https://doi.org/10.1029/2022wr033226, 2023.
Ziegler, A. D., Giambelluca, T. W., Plondke, D., Leisz, S., Tran, L. T., Fox, J., Nullet, M. A., Vogler, J. B., Troung, D. M., and Vien, T. D.: Hydrological consequences of landscape fragmentation in mountainous northern Vietnam: Buffering of Hortonian overland flow, J. Hydrol., 337, 52–67, https://doi.org/10.1016/j.jhydrol.2007.01.031, 2007.