
the Creative Commons Attribution 4.0 License.
the Creative Commons Attribution 4.0 License.
 | 06 Jul 2026
Combining traditional nutrient load analysis with storm hydrograph separation reveals concealed patterns in event-driven nutrient export in a rural headwater catchment
Caroline Spill
Matthias Gassmann
Flushing and dilution are major phenomena of solute export dynamics during precipitation events in headwater catchments but are hard to predict, even if catchment properties are well known. Normalized cumulative load (NCL) functions have been used to visualize and classify event-based discharge–load relationships, distinguishing between dilution, flushing, and constant export behavior. This study presents an enhanced version of the classical NCL function approach by combining it with hydrograph separation. Over an 18 month period, discharge and solute concentrations were monitored in an agriculturally influenced headwater catchment in the German low mountain ranges, with a focus on nitrate () and total phosphorus, and a complementary dataset of major ions. Discharge was separated using stable water isotope signals into event water and total discharge. Both discharge components were then analyzed for solute loads (, total phosphorus, and major ions). The results reveal significant differences in solute export dynamics between event water and total discharge, including unexpected similarities in the export patterns of nitrate and total phosphorus. The proposed method also highlights a shift from predominantly constant export behavior in the total discharge (coefficient of variation: 0.13) to more pronounced flushing or dilution patterns in the event water (coefficient of variation: 0.36). These findings indicate a fundamental difference between the hydrological processes governing the solute export dynamics of the catchment. While the signal of total event discharge indicates constant behavior, the separated event water exhibits strong flushing or dilution tendencies. The observed shifts in the export patterns, which are likely linked to the activation of drainage systems and depletion of legacy storages, raise the question if the event water fraction should be monitored more closely in terms of its potential for dynamic pollutant transport. The proposed method is straightforward to implement, yields statistically robust results for the dataset and provides new insights into solute input pathways in headwater catchments.
- Article
(2456 KB) - Full-text XML
-
Supplement
(1110 KB) - BibTeX
- EndNote


In recent years, the development of new methods for tracking nutrient export from headwater catchments have seen great improvements (Vaughan et al., 2017; Zimmer et al., 2019; Peter et al., 2020). The advent of high-frequency in-situ measurement techniques now allows for the continuous monitoring of solutes like nutrients in stream discharge under both baseflow and stormflow conditions (Werner et al., 2019; Richards et al., 2021; Ritson et al., 2022; Bieroza et al., 2023; Spill et al., 2023, 2024). Difficult questions like the quantification of nutrient sources or the detection of varying input pathways are now more approachable. Nutrient pollution from nitrate () and total phosphorus (Ptot) remains a pressing question to both ecosystem health and water quality (Smil, 2000; Seitzinger et al., 2005; Cassidy and Jordan, 2011; Mekonnen and Hoekstra, 2017; Richards et al., 2021; Weitzmann et al., 2022). Recent research has shown that headwater catchments are significant contributors to the nutrient export of river networks, exhibiting highly variable export dynamics during precipitation events, often only detectable by high-resolution sampling (Jarvie et al., 2012; Wade et al., 2012; Müller et al., 2018). These detailed time series enable the application of advanced analytical tools such as hysteresis analysis, concentration–discharge relationships and normalized cumulative load (NCL) functions (Hathaway et al., 2012; Musolff et al., 2015; Vaughan et al., 2017; Winter et al., 2024). Those methods provide detailed insights into catchment nutrient export dynamics and are able to capture and quantify effects like the first-flush phenomenon.
The “first flush” or “first foul flush” effects are non-linear phenomena in catchments, highly dependent on land use, season, and event intensity (Kincaid et al., 2020; Winter et al., 2024) and is defined by an overweight of solute mass in the beginning of the event. A first flush can for example appear after a dry period, when the pre-event wetness is low and solutes are washed out with the next strong precipitation event (e.g., Winter et al., 2022). With the use of NCL functions for load analysis, introduced by Bertrand-Krajewski et al. (1998) and improved by Obermann et al. (2007), the classification of event-driven solute export dynamics in sewer systems and agriculturally dominated landscapes became more accessible. More recent studies have used NCL functions to compare the strength of the first flush between catchments and solutes (Hathaway et al., 2012; Di Modugno et al., 2015; Christian et al., 2020; Mamun et al., 2020) or expanded the method to include pesticides, pharmaceuticals (Peter et al., 2020) or even microplastics (Lin et al., 2024).
While highly resolved nutrient data is becoming more widely available, identifying the governing hydrological pathways of nutrient export dynamics remains a key challenge (Burns et al., 2019; Ma et al., 2023). A traditional tool for exploring those pathways is stormwater hydrograph separation based on stable water isotopes as tracer (Blume et al., 2007; Klaus and McDonnell, 2013). It is often applied to separate pre-event from event water (Fritz et al., 1976; Uhlenbrook et al., 2002; Weiler et al., 2003) but has also been modified to differentiate more than two components (Genereux and Hooper, 1998; Klaus and McDonnell, 2013; Semenov and Zimnik, 2015; Marin-Ramirez et al., 2024). Recent studies with access to high frequency data of stable isotopes in the precipitation and discharge were able to increase the precision of stormwater hydrograph separation, by, for example, using the relationship between discharge volumes and precipitation (e.g. von Freyberg et al., 2018). Stable water isotopes act as ideal conservative tracers since they are part of the H2O molecule and do not adsorb onto soil particles (Clark and Fritz, 1997; Klaus and McDonnell, 2013).
Although cumulative load–discharge relationships are commonly calculated, separating discharge components and applying them to NCL function analysis has not yet been explored. This study addresses that gap by combining hydrograph separation with NCL functions analysis, to map solute export dynamics to the separated components. Specifically, we evaluate the export behavior of , Ptot, and major ions (Na+, Ca2+, , K+, Mg2+, Cl−) in both total discharge and the event water fraction. This approach enables a detailed comparison of solute loads between hydrological flow components during precipitation events and provides new insights into event-scale export dynamics in headwater catchments.
2.1 Study site
The Nesselbach catchment (51°26′54′′ N, 9°22′59′′ E) is located in the geological region of the “Westhessische Senke,” part of the Central Uplands, Germany. It directly drains into the Esse River, a tributary of the Weser. The Nesselbach has a mean discharge of 8.1 L s−1 and a stream length of 1.8 km from its source to the monitoring station. The monitored catchment area covers 3.2 km2 and consists of 65 % agricultural area, 25 % mixed forest, and 10 % settlement/commercial areas. Some agricultural fields are equipped with drainage systems that directly discharge into the stream. The drainage system in the area could not be monitored and seemed to be self-organized by the farmers. One drainage outlet could be identified as a road drainage and was located near the point of measurement but was never observed active. There is no data on the drainage system nor are there any official maps of the drainage network. Elevation in the monitored area ranges from 173 to 306 m, as shown in Fig. 1. Soils are predominantly classified as Vertisol (90 %), with Cambisol and Leptosol found in the forested regions. The underlying bedrock comprises red Sandstone and Muschelkalk. Meteorological data were collected from a WMO-compliant weather station (Thies Clima, DL-15) near the catchment area (51°28′2′′ N, 9°22′41′′ E) from August 2020 to November 2022 (Spill et al., 2023). The area has a temperate climate, with a measured mean annual air temperature of 8.6 °C and an annual precipitation of 635 mm for the year 2021. During the monitoring period, the Nesselbach catchment experienced relatively low precipitation (635 mm a−1) compared to the multi-annual mean of 792 mm a−1 (DWD 2025). Precipitation was measured by a tipping bucket rain gauge.
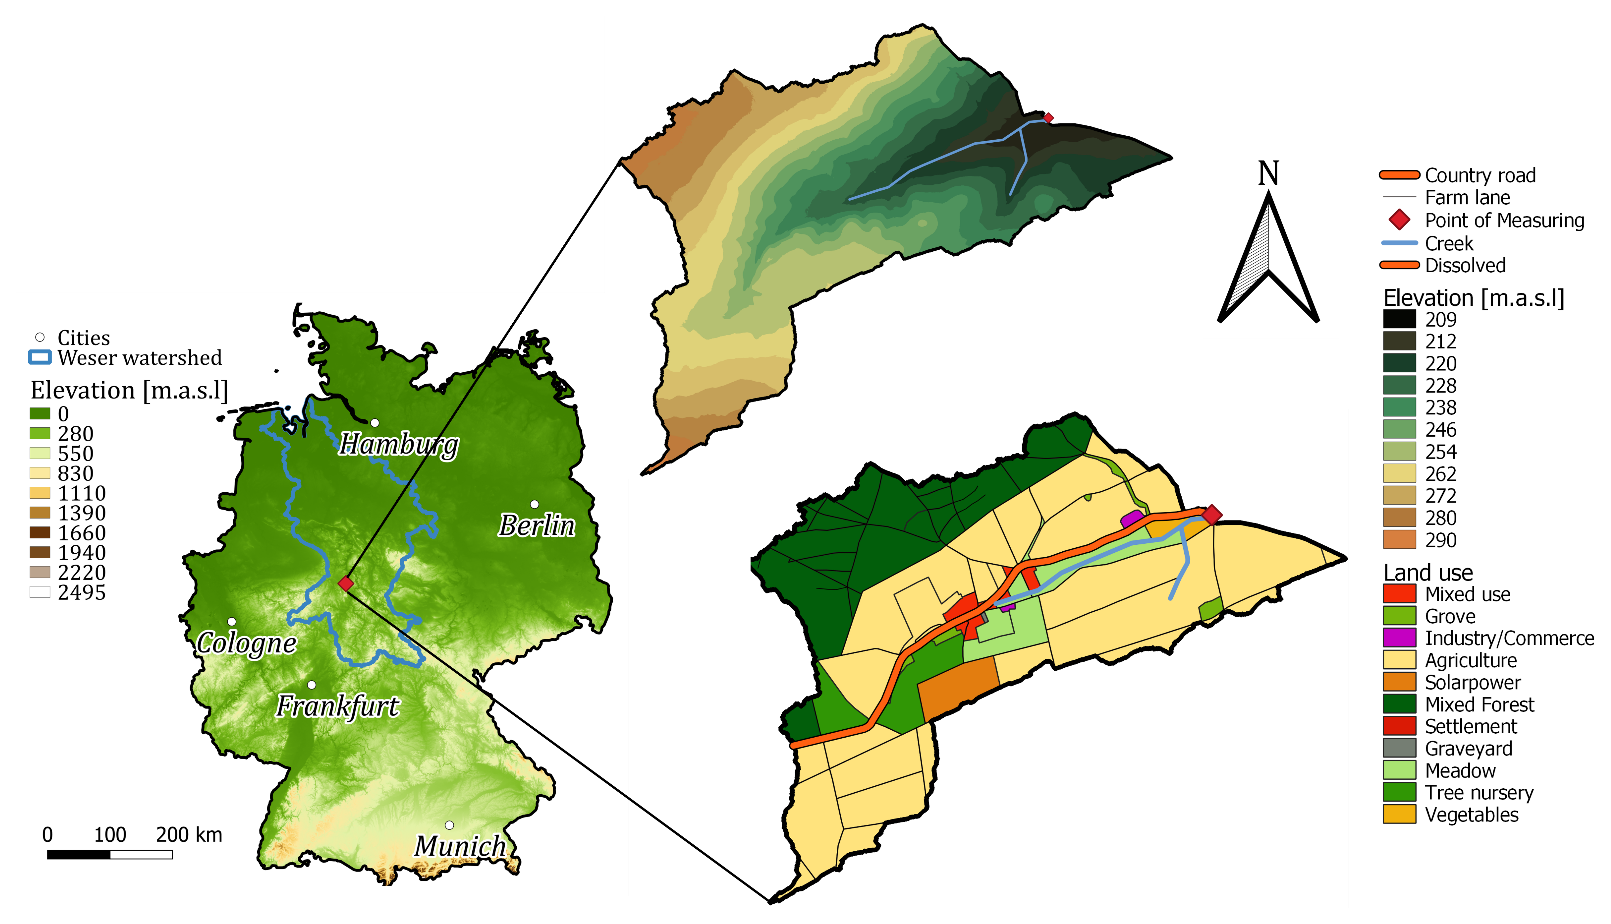
Figure 1(a) Overview, elevation map of Germany; (b) Study area, digital elevation model (elevation in meters above sea level, ), raster cell resolution 1 m. (c) Study area, land-use, resolution 1:10 000.
2.2 Sampling and Measurement
All necessary parameters, except climate parameters, were measured at the same location (Fig. 1), where the Nesselbach crosses a road and flows through a 1 m inner diameter concrete pipe. The measurement took place between February 2021 and June 2022, the setup had to be removed until July 2022 due to institutional restrictions. In situ devices were installed at the end of the pipe together with a small weir, ensuring that all devices were always submerged. concentrations were measured in situ using a UV-VIS probe (S::can Spectro::lyzer) with a temporal resolution of 5 min and an automated cleaning procedure, utilizing compressed air. Continuous measurements were complemented by biweekly grab samples for calibration purposes (Fig. S1 in the Supplement), and additional samples taken during precipitation events. Discharge was determined by measuring water depth and velocity using an ultrasonic probe (Nivus), employing cross-correlation techniques to detect the flow velocity of particles in the water. The temporal resolution of the measurement was set to 5 min. Due to the often highly scattered discharge data, caused by low particle density in the water, smoothing of the discharge curve was performed using Spearman correlation between discharge and water depth, followed by applying a Nadaraya-Watson density estimator with a Gaussian kernel to the data. The smoothed discharge was assessed using the Nash–Sutcliffe Efficiency, a flowchart and an example is provided in Fig. S2. Stream water samples during precipitation events were collected using an automatic sampler (ISCO) with a resolution of 15 min. The automatic sampler, equipped with 24 bottles (1000 mL), was activated by a water level actuator (ISCO) at an activation threshold of approximately 5 mm precipitation equivalent. The activation and deactivation of the automated sampler also mark the beginning and endpoint of the events we use for the NCL-analysis. Events start with the incoming signal from the actuator to the sampler and end with signal termination. This approach was getting more precise over the course of the sampling campaign, while the optimal position of the actuator was approximated by trial and error. Every activation and deactivation signal was compared to the water level and precipitation measurement to minimize activation error. Due to the maximum capacity of the automated sampler of 24 bottles and frequent errors during sampling, we only considered events with at least 6 consecutive samples. Samples were analyzed in the laboratory using UV-VIS photometry for nitrate, major ions and Ptot concentrations. Stable water isotope ratios in the discharge during precipitation events were sampled at a resolution of 15 min. For the determination of the background signal biweekly grab samples and, if possible, anticipated grab samples before a precipitation event, were taken. Isotope samples in precipitation were collected using a tipping bucket coupled with a sequential precipitation gauge with a 5 mm resolution, based on the design by Fischer et al. (2019). The isotopic signal of the collected 5 mm sample was aligned to the samples from the automated discharge sampler via the timestamps of both instruments. A cavity ring-down spectrometer (Picarro L2130-i) was used to determine isotope ratios. Electrical conductivity was measured every 5 min using an in-situ probe (HOBO). Major ions were also included into the testing of the new approach. The available data covers major ions for 8 events.
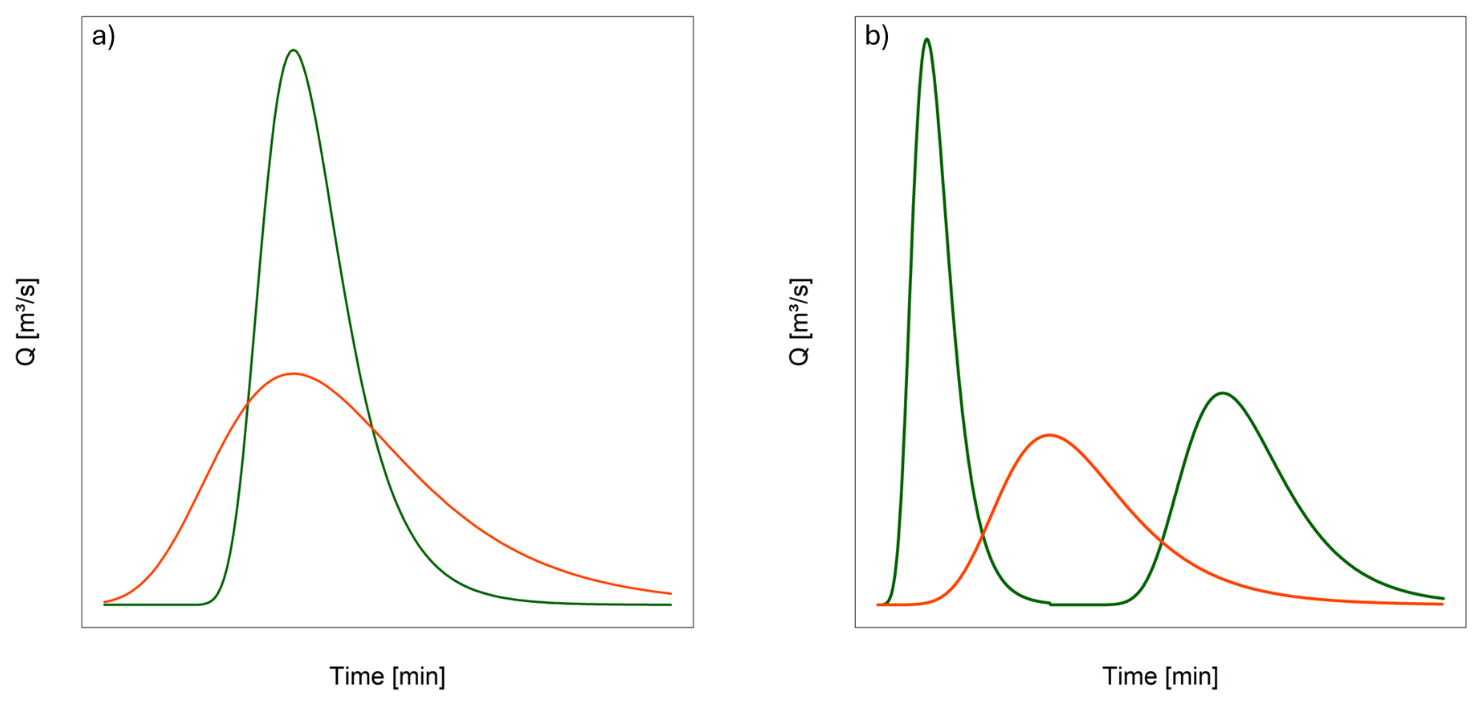
Figure 2(a) Example for mean rate of change, the green function shows high mean rate of change, the red function shows lower values. (b) Example for function volatility, the green function shows high volatility compared to the red function.
2.3 Hydrological event analysis
The two-component hydrograph separation is based on the deuterium signal in precipitation and discharge during events (Clark and Fritz, 1997):
where Qpre equals the volume of pre-event water, Qt the discharge at a given timestep t, δt the isotope composition in the discharge at a given timestep, δpre the isotope composition of the pre-event discharge and δr the isotope composition in precipitation. Due to the sub-hourly resolution of the event samples and the nature of the stable isotopes, it is possible to separate the hydrograph with very high precision. A dual isotope plot (in Fig. S3) was drawn to identify potential influences of evaporation on the stable water isotopes signal in the precipitation, but the dataset showed no such influence. Two samples had to be excluded from the analysis because their isotopic signals in precipitation were distorted and not clearly assignable to the discharge signal. This is exemplary for the difficulties coming with stable isotope hydrograph separation, besides already occurring technological challenges and cost effectiveness (e.g. Seeger and Weiler, 2014). Due to the spatial and temporal heterogeneous nature of precipitation (Allen et al., 2019), stable isotopes are only meaningful to use if enough data is available to identify different volumes of water. In best case scenarios, time series spanning years of data are available for the stable isotope signature of the groundwater, discharge and precipitation to account for all seasonal changes and to determine the isotopic fingerprints for robust solutions of Eq. (1) (Klaus et al., 2015). But since this is seldom the case, researchers have to be careful handling isotopic data and collect as many samples as possible for creating reliable datasets. In case of this study, the exclusion of two samples was due to a leakage in the sequential rain gauge, leading to mixing and therefore dampening of the isotopic fingerprint. There were 13 events suitable for stable isotope-based hydrograph separation. These events consisted of at least 6 consecutive discharge isotope samples [15 min time increment] and successfully sampled clearly assignable precipitation samples. For a better understanding of the differences in the event dynamics, the events were clustered by k-means cluster analysis, a common and classical method (Lloyd 1982). Cluster analysis can be used to categorize the discharge functions into groups such as fast reacting curves, bi- or multi-modal functions and strength of function volatility (Bloomfield et al., 2015; Wunsch et al., 2022). K-means algorithm is based on the following assumption (Lloyd 1982):
where J equals the target function, k equals the number of pre-identified clusters, x equals the datapoints, μ equals the mean values of each cluster S. The k-means algorithm aims at minimizing the squared distance of the datapoints to the cluster means. After necessary normalization of the data, a Scree-plot (in Fig. S4) was drawn to visually identify the best number of clusters (Cattell 1966). The k-means algorithm was computed in R (R Core Team 2025). Cluster pairs comprised the following parameters: precipitation [mm] and event water portion [%], function mean volatility [L s−1] and mean rate of change [L s−1], function mean volatility [L s−1] and area of the best power function fit of the NCL function [-].The function mean volatility and mean rate of change of the hydrographs are mathematical parameters delineated from the empirical discharge hydrograph. We calculated these parameters with the sole purpose of grouping the hydrographs by their mathematical behavior. Comparing the mean rate of change, or the abruptness of rising and falling function behavior, is the first step to sorting the hydrograph behavior. To delineate the mean rate of change of a discharge function (Fig. 2), the first derivative of each discharge function k was calculated and its values averaged to compare the rate of change between the discharge functions f(Q):
With k equal to the value of the first derivative of the discharge function at a given timestep and equal to the first derivative of the discharge function f(Q) at timestep t. Combined with the calculation of the average first absolute derivative, which describes the average volatility of a function, it is possible to get a detailed insight into the dynamics of the catchment's hydrology. The average volatility of a hydrograph can be interpreted as the average length of the path the function is taking from the start of an event to the end (Fig. 2):
With kabs equal to the absolute derivative of f(Q).
Clusters of separated discharge functions are finally compared by a number of corresponding variables likely influencing event discharge dynamics: total precipitation [mm], antecedent precipitation index of the preceding 14 d before an event (API14 [mm]) and precipitation intensity [mm h−1]. Following Köhler and Linsley (1951), API14 is inversely calculated by the weighted sum of daily precipitation 14 d before the referred event:
With recession coefficient r [–] being 0.9 for Germany as proposed by Schröter et al. (2015), P equals precipitation [mm], m equals time span (14 d). API is considered as proxy for the pre-event wetness conditions in a catchment and therefore impacts runoff generation during events (Blanchard et al., 1981).
2.4 Cumulative load analysis
Event water and total discharge were analyzed for their relative contributions to , Ptot and Major Ions (Ca2+, Mg2+, K+, Cl−, Na+, ) loads. Loads in the Event water and total discharge were compared against a bisector line, which represents a perfect constant behavior of cumulative discharge and load (Obermann et al., 2009). Functions above this line indicate a strong influence of rising concentrations on the loads (flushing), while curves below the bisector indicate lower concentrations relative to the discharge (dilution) (Obermann et al., 2009). This method can be used to determine which factor of the load equation dominates the system during an event. The complete formulation of the function can be found in Bertrand-Krajewski et al. (1998). The functions of the events were fitted to a power law function for better visualization and interpretation (Bertrand-Krajewski et al., 1998). The fitting procedure for the load/discharge power law relationship is derived from Bertrand-Krajewski et al. (1998) and follows a simple power function fit:
where X equals the series of normalized discharge samples and b an exponential factor. The optimal value for b can be found by minimizing the root mean square error (RMSE):
where y equals the observed and (in our case ) the predicted value. RMSE can express values between 0 and infinity, with 0 indicating a perfect fit. Figure 3 visualizes the algorithm as conducted for our analysis.
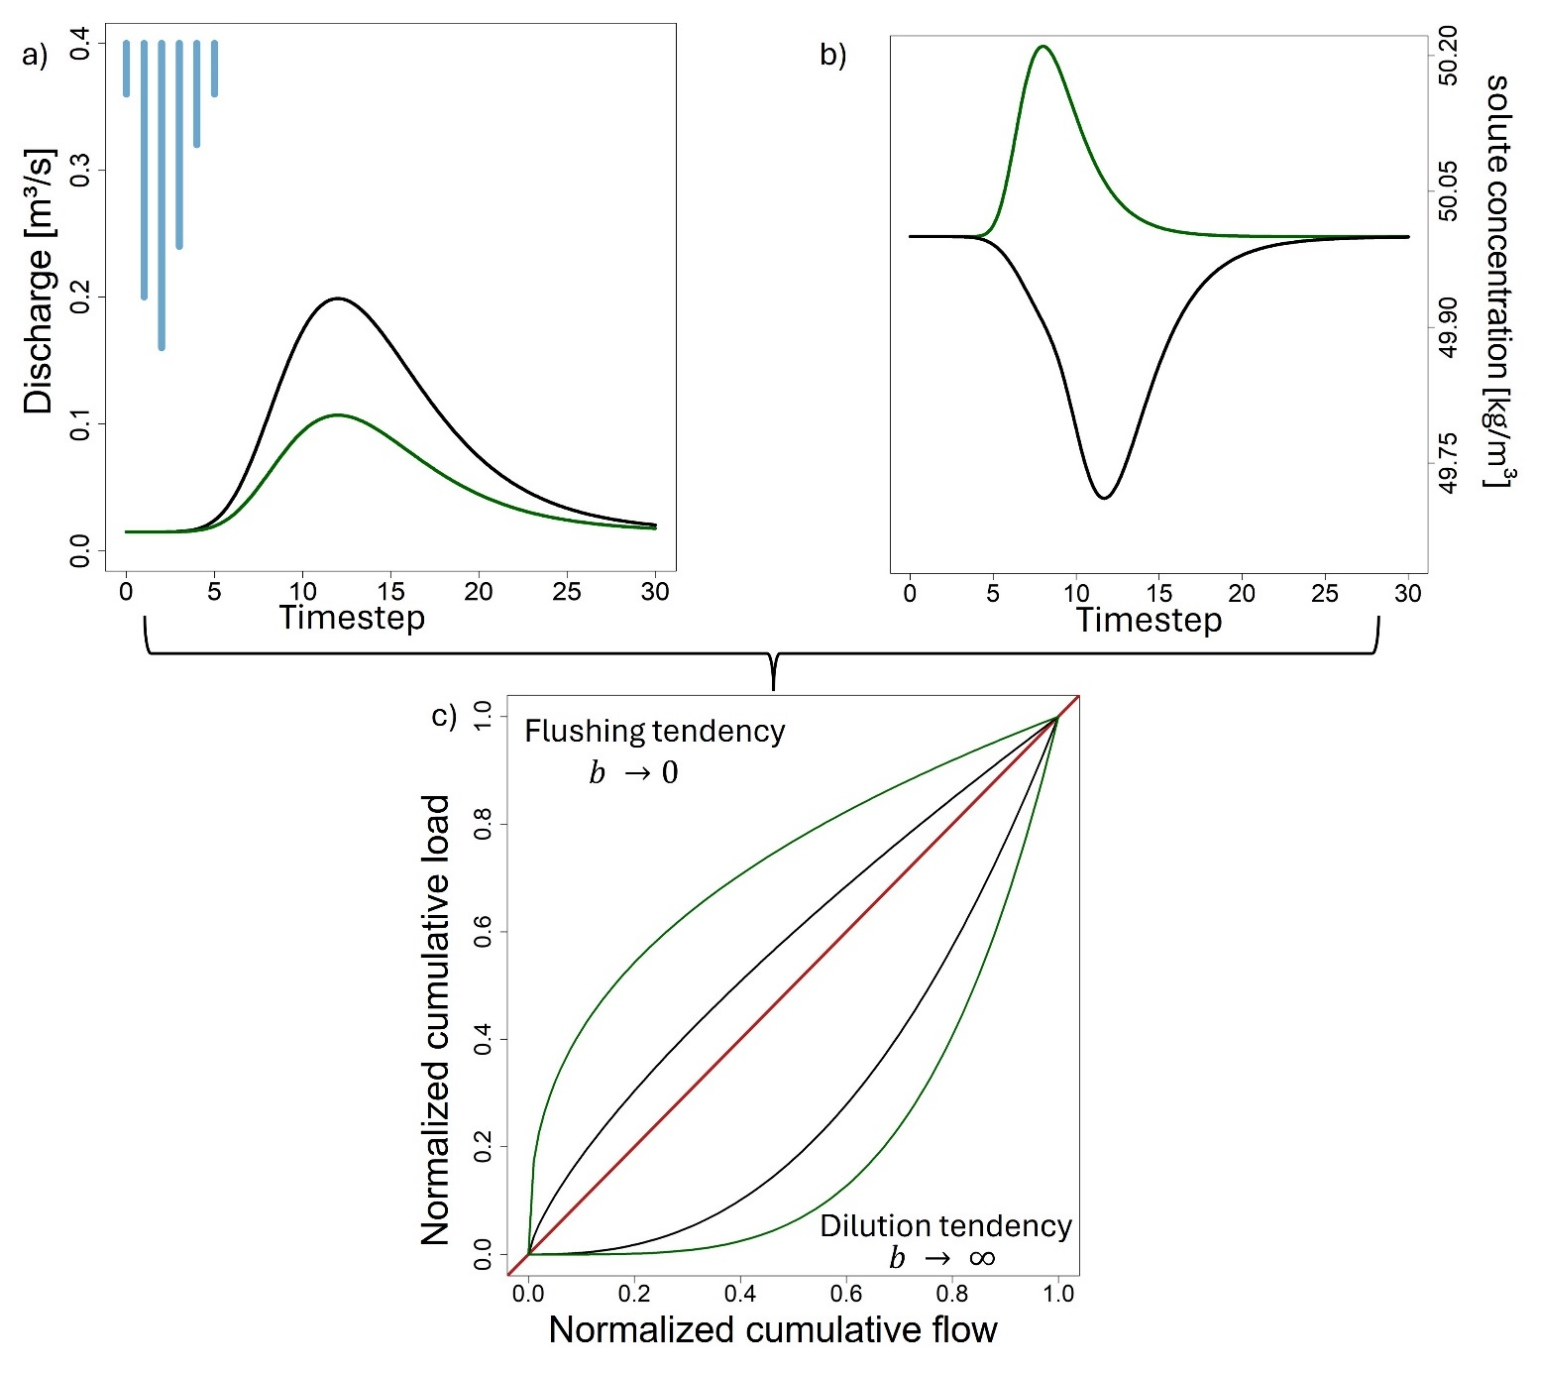
Figure 3Visualization of proposed algorithm. Empirical discharge (a) and load (b) data are normalized, fitted with a power function and plotted against each other, resulting in (c), a normalized cumulative distribution function (NCDF) with a bisector (red line). The color coding, green for a hypothetical event water fraction and black for total discharge, shows different exemplary event behavior.
The values of the exponential factor b show the behavior of power functions fitted to total load functions (Bertrand-Krajewski et al., 1997). A b value of 1 indicates a steady function aligned with the bisector (constant load and discharge), while values greater than 1 suggest functions below the bisector (dilution) and values less than 1 indicate functions above it (flushing). Because the calculation of cumulative loads is by definition a steadily and monotonously rising process, it allows for a straightforward normalization of the parameter space. Normalizing the parameter space to [0,1] allows us to constrain the power function to pass through the fixed points of (0,0) and (1,1), which forces all transformed curves to remain in the positive/positive quadrant of the Cartesian coordinate system. Under these circumstances, negative curves would be hyperbolic, or even outside of the defined parameter space and would be regarded as measurement errors. On the other side, a b value of 1 indicates a steady function aligned with the bisector (constant load and discharge), while values greater than 1 suggest functions below the bisector (dilution) and values less than 1 indicate functions above it (flushing). Approaching 0 or infinity reflects increasingly divergent behaviors. Separating event water from total discharge yields two distinct NCL functions per component, revealing significant behavioral differences through b values. To complement the exponent analysis with a more interpretable metric of flow component disparities, we calculated areas under the curve using the antiderivative of Eq. (6):
An area of 0.5 indicates constant export behavior. Values > 0.5 imply flushing, and < 0.5 indicate dilution. Areas with very small deviation from 0.5 can be regarded as expressions of quasi-constant curves. Thus, areas under the curve (< 0.5) represent stronger dilution during events and areas > 0.5 indicate flushing. This calculation was performed separately for total and event water discharge.
Correlations between nutrients in separated discharge and total discharge were calculated using Spearman correlation, differences between distributions were quantified using Kolmogorov–Smirnov test (KS test) and t-test (p < 0.05 each). For deeper insights, we compared the behavior of and Ptot during events.
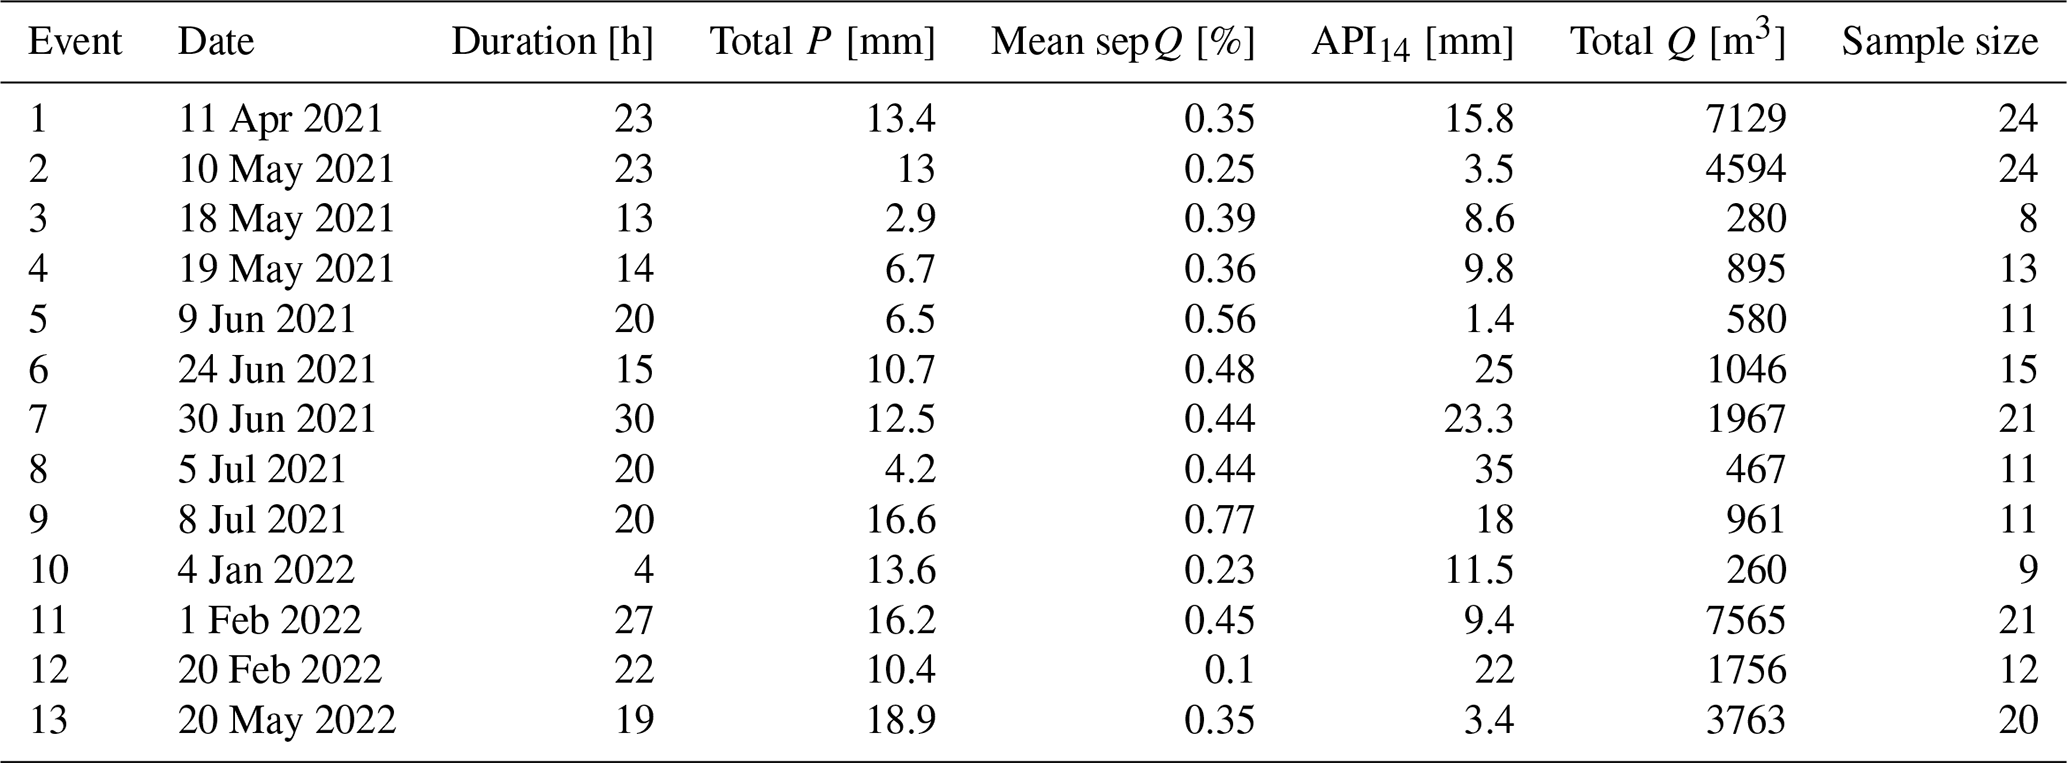
Table 1Overview of recorded events, sorted by running index. Total P [mm] equals total precipitation per event, Mean sepQ [%] equals the average portion of separated event water, API14 [mm] equals the API of the last 14 d and Total Q [m3] equals the cumulative total discharge of an event. The date column shows the beginning of an event (first sample).
2.5 Results and Discussion
2.6 Catchment hydrology
Most discharge events were characterized by total precipitation between 6 and 14 mm, and durations between 15 and 23 h (Table 1). However, events number 7 and 13 stand out with a duration of 30 h and, respectively a total precipitation of 18.9 mm.
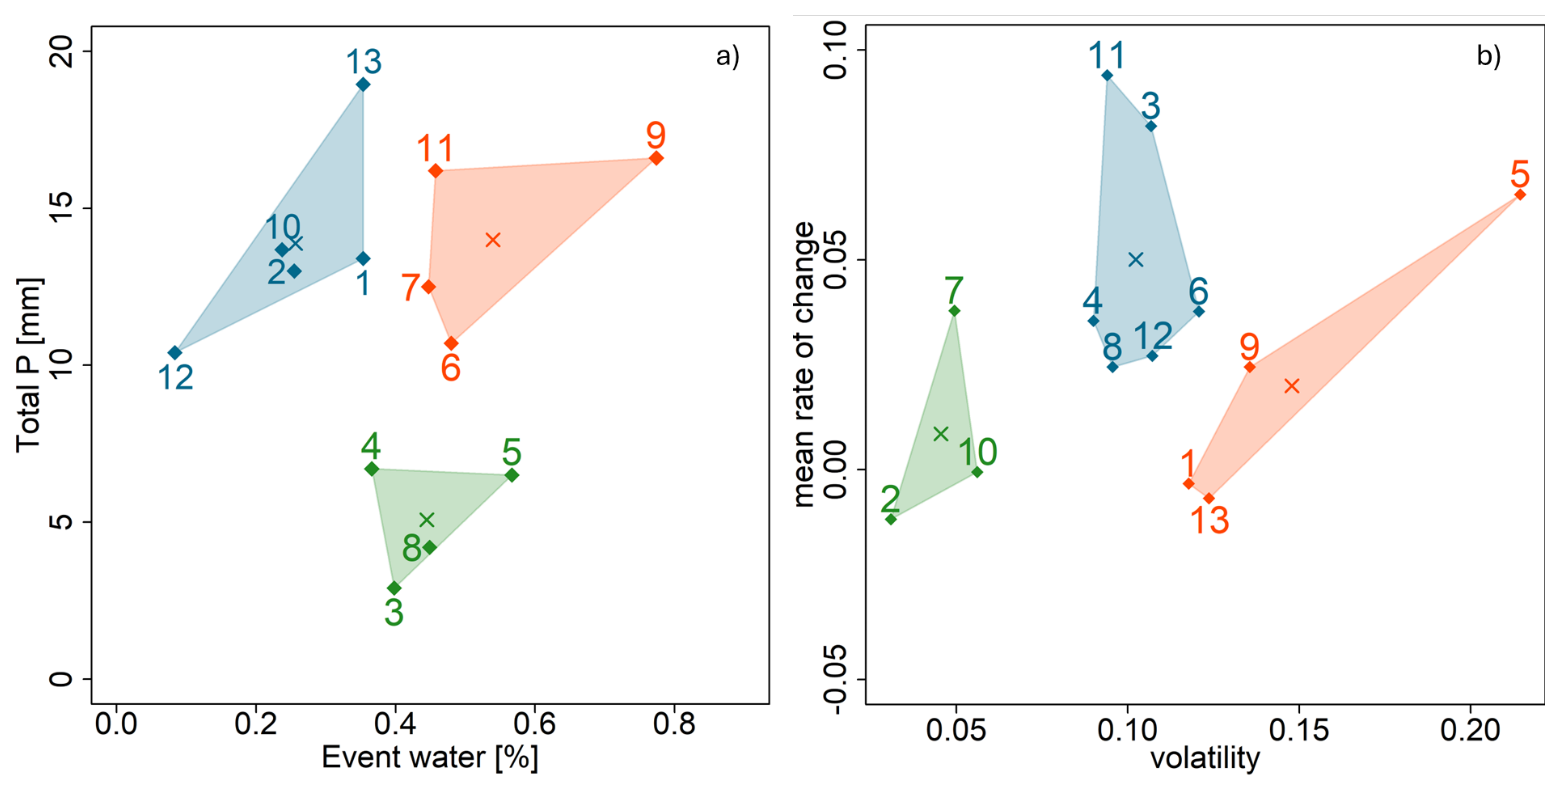
Figure 4(a) Visualization of K-means cluster analysis of total precipitation per event [mm] vs. mean event water portion [%], clusters are colored. Numbers stand for index numbers of events, see Table 1 for details on each event. Centroids of each cluster are marked with x. (b) K-means Cluster analysis of mean volatility of each separated event water function and mean rate of change in the relative amount of event water. See Fig. S5 for a visualization of discharge curves per cluster. Note that the clusters were tested for significance using the cross product of the parameters (t-test, p < 0.05).
The mean event precipitation sum was 14.6 mm, and the mean event water portion was 41 %, ranging from 8 % to 85 %. API14 had a maximum of 35 mm in July 2021 and its minimum in June 2021 with 1.6 mm with a mean value of 14.2 mm. Total measured discharge is lowest in January 2022 (260 m3) and highest in February 2022 (7129 m3), with a mean value of 2837 m3. K-means cluster analysis was performed on the percentage of event water and precipitation sum (Fig. 4a).
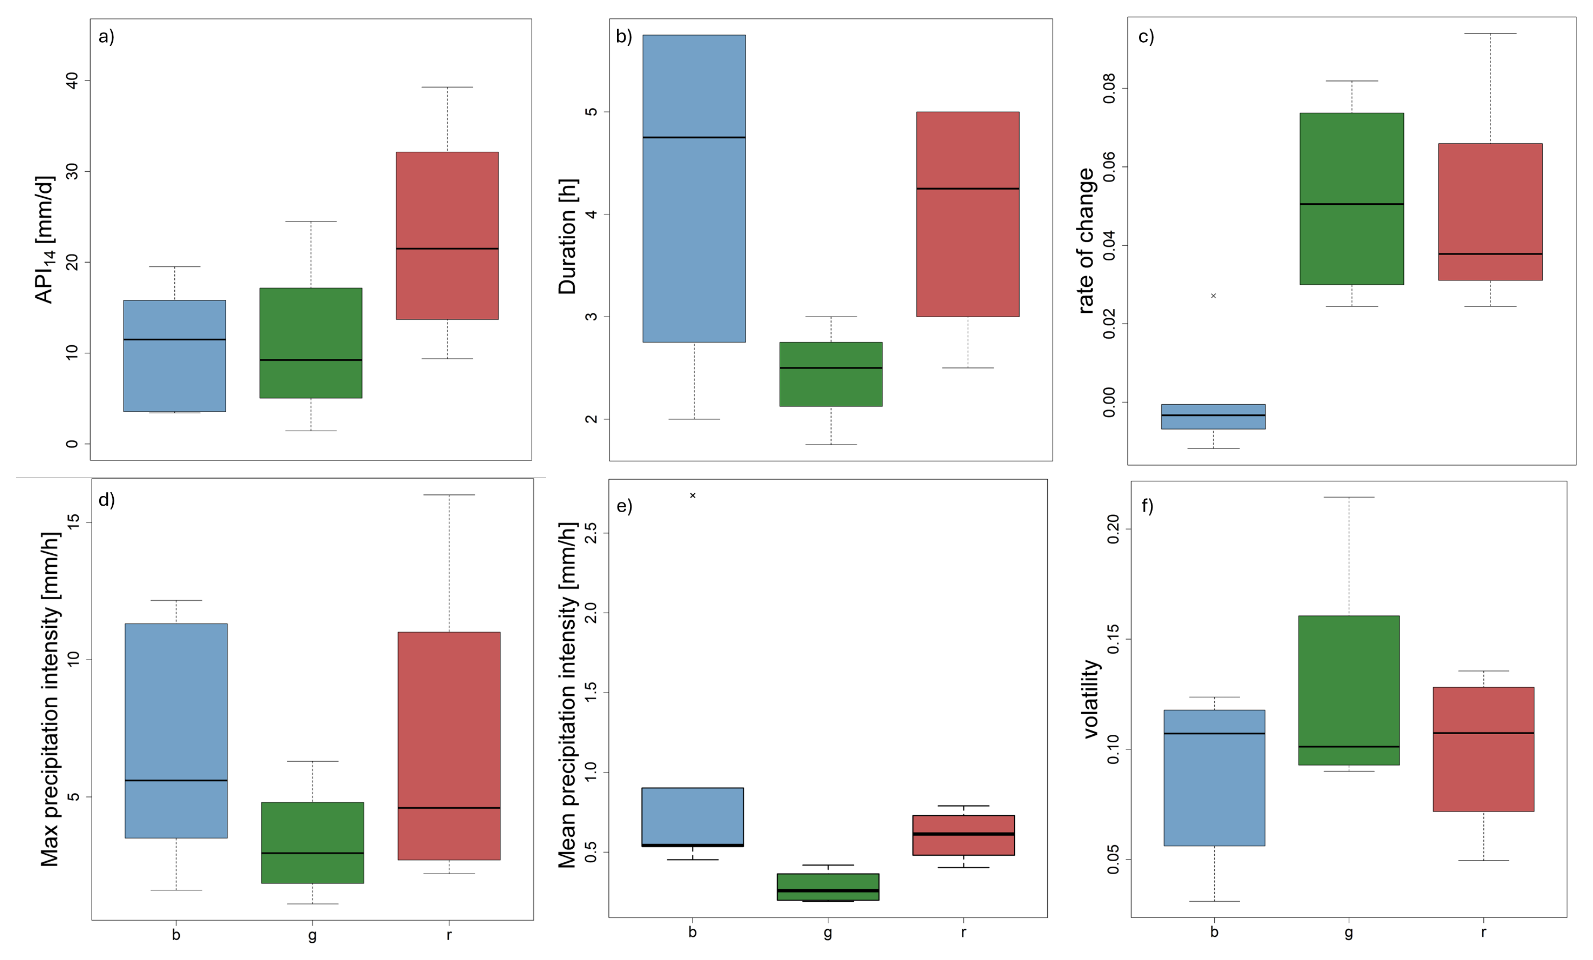
Figure 5Boxplots of hydrological parameters for each cluster of Fig. 4a, x-axis values correspond to the cluster color (blue, green, red); (a) API14 [mm d−1]; (b) event duration [h]; (c) mean rate of change [L s−1]; (d) maximum precipitation intensity in 1 h [mm h−1]; (e) mean precipitation intensity [mm h−1]; (f) volatility [L s−1].
K-means cluster analysis identified 3 clusters for this combination. The first cluster (blue) comprises 5 events and has its centroid at 14 mm precipitation and 25 % event water. The cluster ranges from low event water portions (< 10 %) to moderate portions (25 %–35 %), not exceeding the value of 50 % mean event water during any event. The second cluster (green) comprises 4 events with the centroid at 5 mm precipitation and 45 % event water. Event water ranges from 35 % up to 55 %. The centroid of the third cluster (red) is located at 14 mm precipitation and 55 % event water. The cluster is formed by 4 datapoints and ranges from moderate to high event water fraction (77 %). While the majority of datapoints are found in the region between > 35 % and < 50 % event water (8 datapoints), all clusters contain data further away from their centroids. The blue cluster covers events with moderate to high precipitation and low to moderate event water fractions, the green cluster covers events with comparatively low precipitation and moderate fractions of event water. The red cluster shows moderate to high precipitation and moderate to high event water fractions, therefore showing expected hydrological behavior. The behavior of the green and blue cluster and especially of event 5 and 12 was not expected, since high precipitation usually leads to higher event water portions and vice versa. Some explanation why event 5 shows very high event discharge at only 6.5 mm precipitation might be due to a road drainage that is close to the point of measurement. Another technical explanation can be found in the activation threshold of the water level actuator, which might have led to late activation during short events and therefore shifting the sampling window to the discharge peak, creating high event water means. The explanation for the difference between the blue and the red cluster, might be found in the pre-event wetness of the catchment, which can activating additional flow paths for the event water or enabling significant surface runoff (Duncan et al., 2017). Figure 5 supports this assumption by showing that the red cluster shows greater values of API14, compared to the blue cluster, while precipitation intensity and event duration show less difference.
API14 also serves as an explanation for the difference between the blue and the red cluster for mean rate of change, even if precipitation intensity is similar, the higher pre-event wetness enables a greater dynamic in the discharge behavior. But neither API14 nor precipitation intensity can explain the high rate of change of the green cluster, which is accompanied by high volatility A high rate of change can be attributed to the abruptness of changes in the discharge function, while high volatility, as defined in this study, describes situations in which discharge peaks are concentrated within a short fraction of the overall event duration.
Therefore, short but abrupt events with a single peak can express such high values, especially if a road drainage could be involved. The observations suggest that the Nesselbach catchment is, at least for the monitored timespan, a system with fast reacting discharge dynamics sensitive to pre-event wetness (API14). To sufficiently explain the observed differences in the behavior of separated event water functions, a second analysis was conducted by clustering the mean rate of change (Eq. 3) and volatility of the separated discharge functions (Eq. 4) (Fig. 4b). Three clusters were identified by the k-means clustering. The blue cluster contains events (6 in total) with moderate volatility and high rate of change, indicating overall low function dynamics. The second cluster (green), which consists of 3 events, shows low function volatility at moderate rate of change in discharge. The third cluster (red) consists of 4 events and shows a high rate of change and moderate to high volatility. On an interpretational level, the red cluster contains events that exhibit fast rising discharge and multiple amplitudes or waves. In contrast, the blue cluster consists of events that show only one amplitude and a quick and steady rise or recession in discharge. Most events fall into the blue cluster that shows a steady rise or recession in discharge with one or more amplitudes. The statistical interpretation of the dataset is limited due to the small sample size of 13 events and the different length of each event. Groups of functions, corresponding to the results of the k-means cluster analysis are depicted in Fig. S5. This behavior of differing function dynamics may be attributed to multiple factors like the precipitation sum, land cover, climatic parameters like temperature and pre-event wetness and the soil type and geology of the catchment (Outram et al., 2016; Peter et al., 2020). It is not uncommon for small catchments to exhibit fast reacting discharge behavior (e.g. Alexander et al., 2007; Birkel et al., 2011), but it is necessary to classify the events individually for any monitored catchment to get deeper insights into the nutrient export dynamics. In general, event discharge in the Nesselbach catchment is not only governed by precipitation sum but by a variety of parameters. This is especially true for event discharge with greater dynamic behavior, as can be seen in Fig. 6.
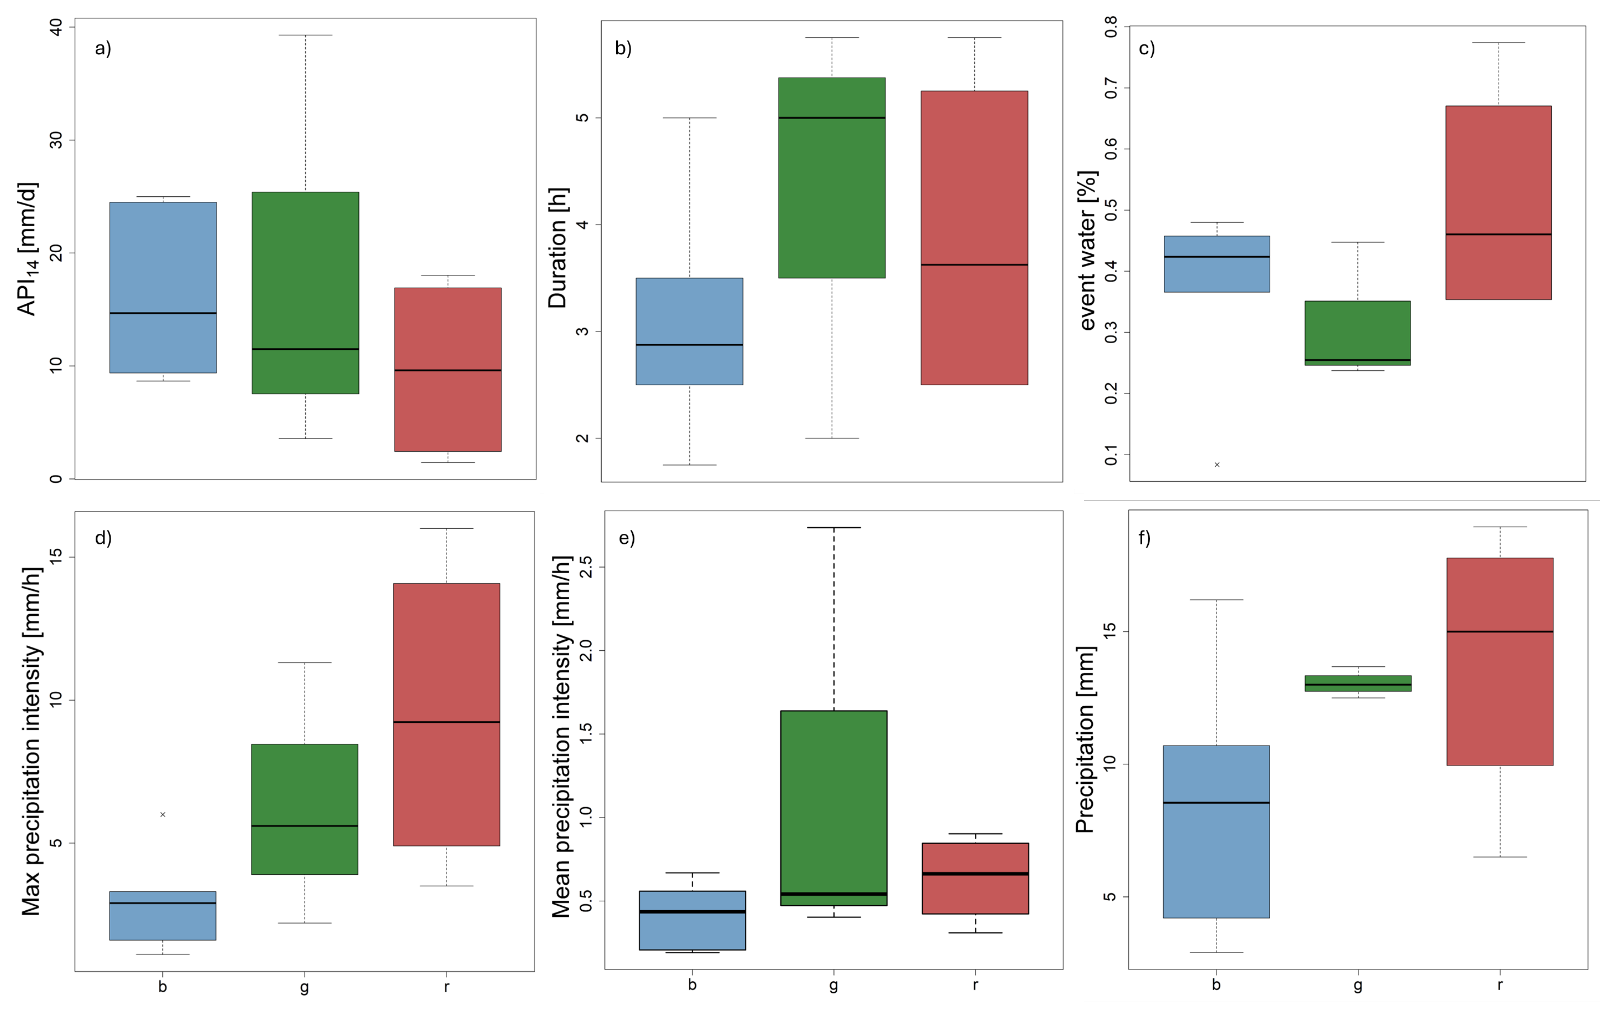
Figure 6Boxplots of hydrological parameters for each cluster of Fig. 4b, x-values correspond to the cluster color (blue, green, red); (a) API14 [mm d−1]; (b) event length [h]; (c) mean event water [%]; (d) maximum precipitation intensity in 1 h [mm h−1]; (e) mean precipitation intensity [mm h−1]; (f) total amount of precipitation per event [mm].
While the green cluster (lowest volatility and lowest mean rate of change) is a good example for discharge behavior primarily governed by the incoming precipitation signal. It exhibits the widest range for the parameters API14, mean precipitation intensity and event duration (Fig. 6) but shows the lowest range of precipitation levels. Events with high volatility and high mean rate of change can only be found in the red and blue clusters. Which show a much broader range of precipitation levels. The red cluster also comprises the highest maximum precipitation intensity and event water fraction values, while the blue cluster has the highest mean of API14 and also higher event water fraction compared to the green cluster. The low mean values of the red cluster for the API14 is due to the presence of event 5 in the cluster which has to be labeled as an outlier. For the observed time span, fast rising and changing discharge events are more common in the Nesselbach catchment than slowly rising events with a single amplitude (see Fig. S5) A partial explanation for this observation might be the seasonal compaction of agricultural topsoil, which reduces infiltration capacity and enables infiltration-excess overland flow (Kirkby, 2014; Peñuela et al., 2016; Stewart et al., 2019). Unfortunately, there are not enough events to test the assumption robustly, and it is based on the observation of agricultural activity in the catchment. While the occurrence of respective datapoints in May and November support the assumption, the datapoints in the month of June are contradictory. Because the temporal distribution of precipitation during the sampling period was unusual, with only just one event big enough to sample in autumn of 2021 and frequent precipitation in summer, the observed pattern is likely biased by the overweight of summer and spring events. General behavior of the catchment cannot be inferred from the available data. Combined with the spatial heterogeneity of the catchment, this results in waves of event discharge and therefore a high mean rate of change.., A moderate to high amount of precipitation triggers volatile events if pre-event wetness or maximum precipitation intensity is high.. This second cluster analysis confirms the findings of the first by highlighting that the Nesselbach catchment shows highly dynamic discharge during periods of high to moderate API (red cluster), high maximum precipitation intensity and moderate to high precipitation levels. Still, compared to a neighboring catchment with more urban infrastructure, the discharge response of the Nesselbach is moderate (Spill et al., 2023).
2.7 Load Analysis
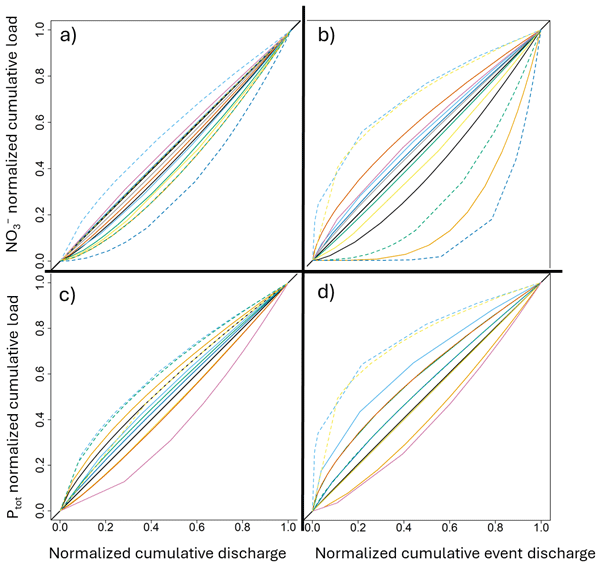
The NCL plots of Ptot and in the total discharge differ visually from each other (Fig. 7a and c). shows a narrower distribution of fitted curves that are more aligned with the bisector, indicating constant behavior (Winter et al., 2022). Because the main bulk of is entering the stream steadily mainly through groundwater, it was expected to show constant export behavior in many cases. Ptot loads are expressing a wider range of curve distribution, indicating a higher rate of dynamic behavior, with a small overweight on flushing. A difference in the pattern of nutrient mobilization was expected and follows the literature (Frazar et al., 2019; Ebeling et al., 2021; Spill et al., 2024). The range of values for the area under the curve of the total discharge power functions is 0.33 to 0.57 for loads and 0.38 to 0.62 for Ptot loads. It can be observed that there are more events with functions below the bisector for loads (6) than for Ptot loads (4) (Fig. 7a and c).
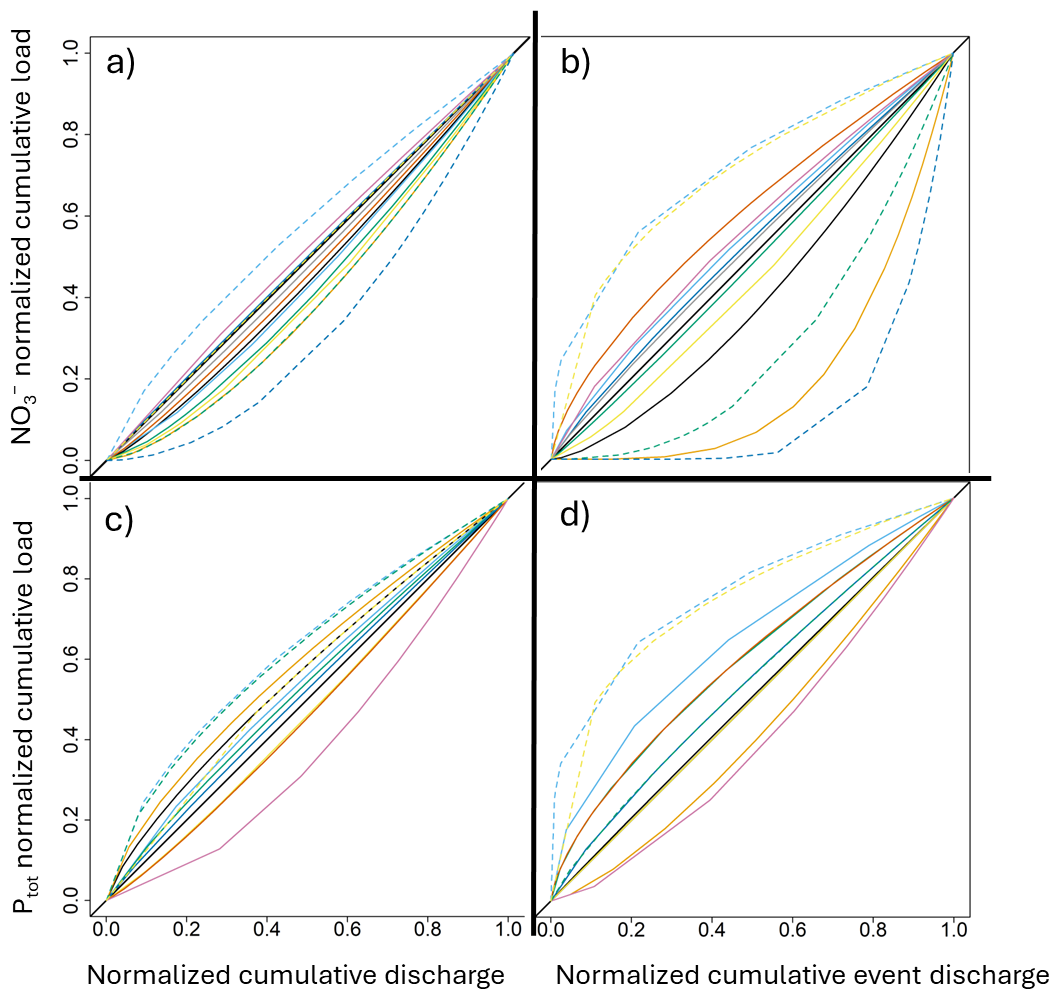
Figure 7Fitted NCL functions for (a) Nitrate in total discharge; (b) Nitrate in event discharge; (c) Ptot in total discharge; (d) Ptot in event water. Events are coded by color and line type.
Applying the NCL analysis to the separated discharge dataset changes the outcome and reveals a different distribution of NCL functions (Fig. 7b and d). While the relationship between total discharge and load is mostly constant, with little deviation from the bisector (Fig. 7a), the NCL functions for the separated discharge show higher distances from the bisector (Fig. 7b), both visual and in more than doubling their range of values for the area under the curve (0.12 to 0.72). These increases in the parameter range in the event water fraction of discharge show a tendency for loads to express dilution or flushing behavior that is not observable or way less pronounced in the total discharge. This does not mean that the whole event can be classified as a flushing or dilution event, but that the transport processes differ between portions of discharge. A constant load in the total discharge can appear as a dilution or flushing behavior if the NCL curve is using the event water fraction of the same event (Fig. 7). While some events show hardly any alteration, other events are way more sensitive to the observed effect (Fig. 7a and b; Table S1).
A similar but less pronounced pattern is also observed for Ptot loads. Visually detectable differences in the distribution of curves for Ptot loads are backed by an increase in area range from 0.38–0.62 to 0.27–0.77. The Spearman correlation coefficient (ρ) for the area under the curve values of the event water fraction of and Ptot loads is significant (p < 0.05) and positive (ρ: 0.64), indicating a robust correlation of both parameters and a mutual reaction to the precipitation signal. Figure 8 summarizes this analysis by showing the ranges of calculated areas under the curve for the fitted NCL functions of the separated fractions for and Ptot (coefficient of variation: 0.38 and 0.21, respectively) compared to the total discharge (coefficient of variation: 0.13; 0.14). An overview of the changes in area for every nutrient and event can be found in the Supplement (Table S1).
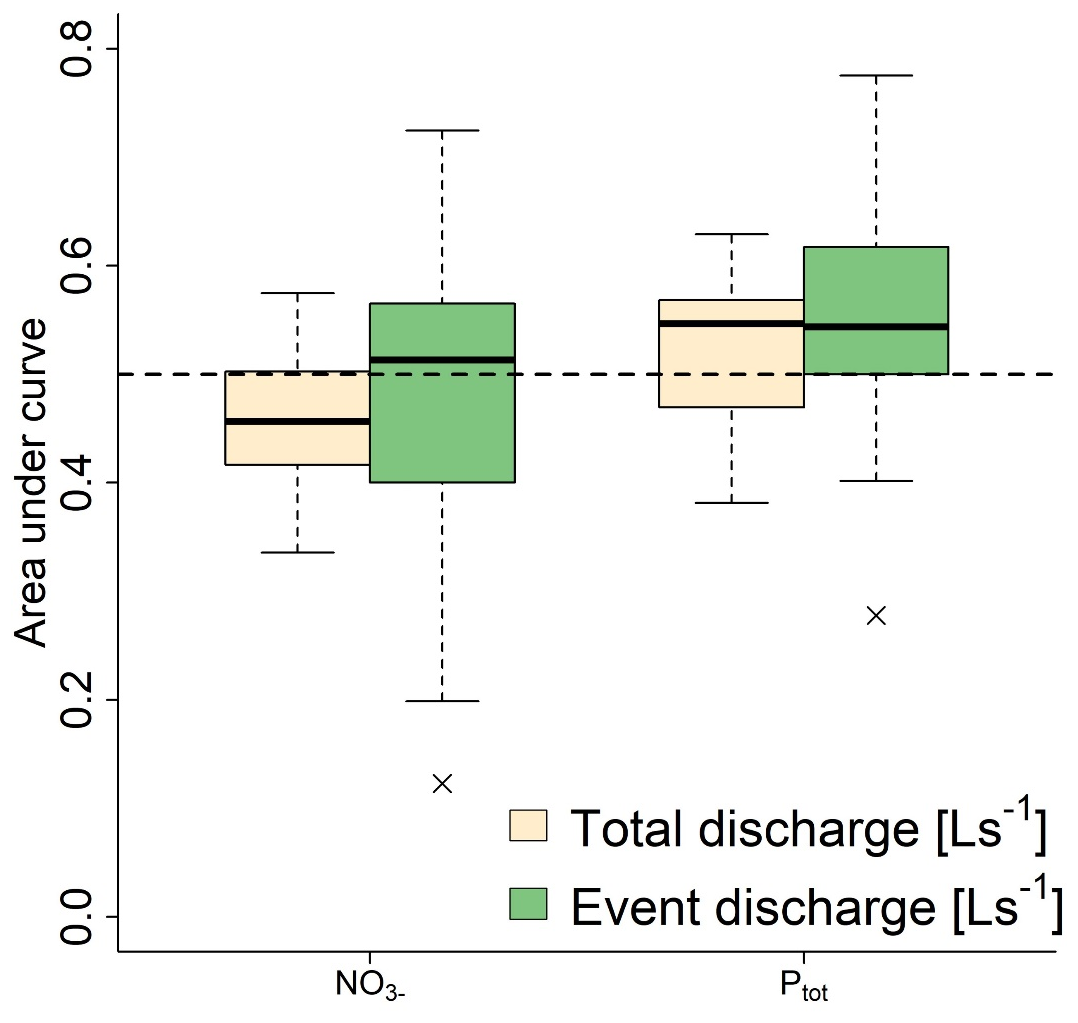
Figure 8Boxplots of the values of area under the curve, for event and total discharge NCL functions of and Ptot. High and low values indicate flushing or source depletion.
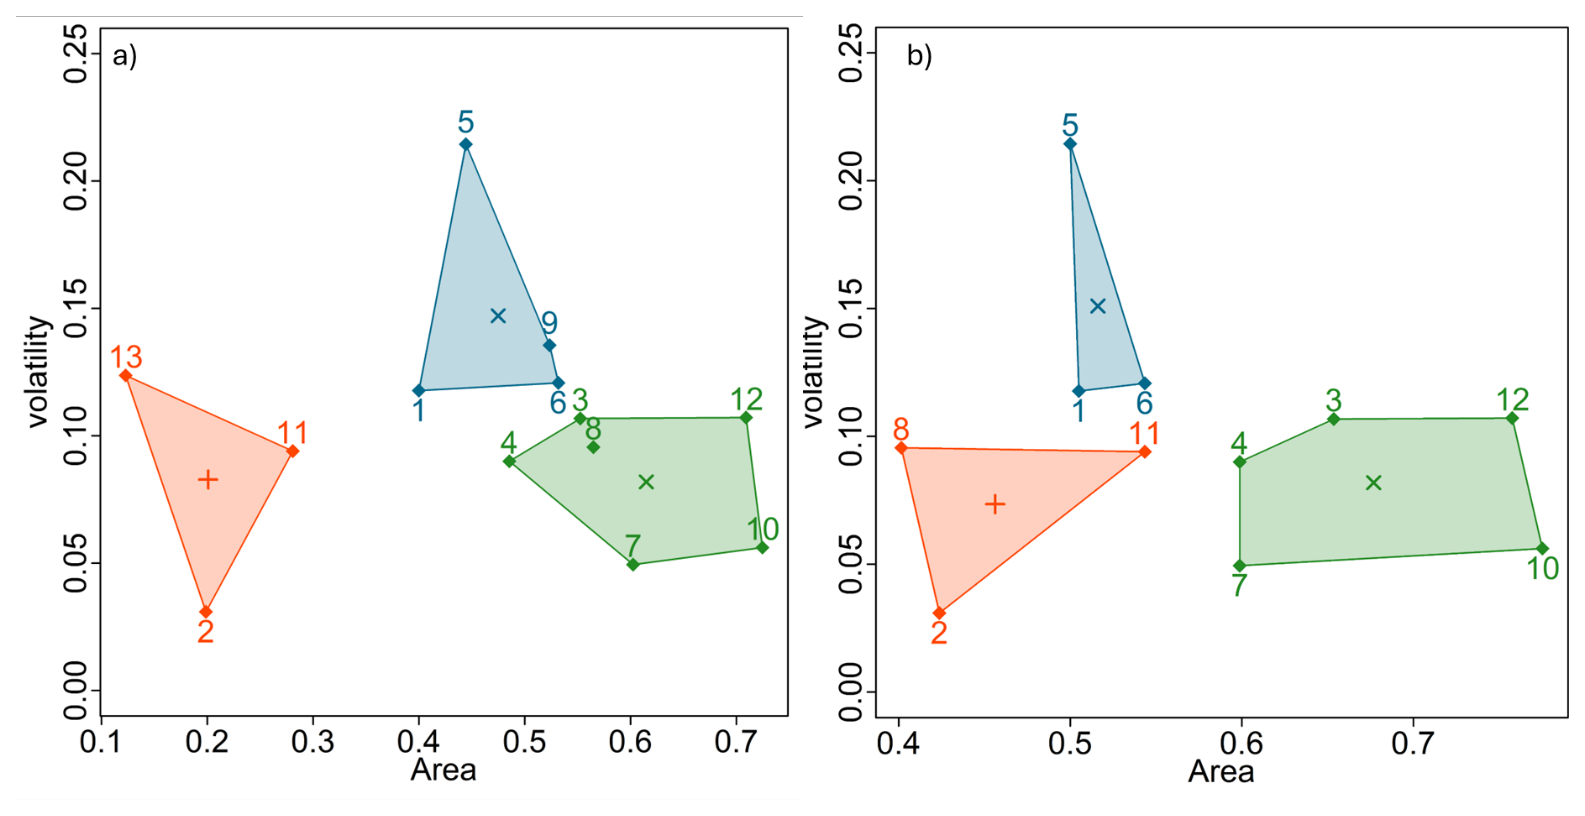
Figure 9K-Means cluster analysis for volatility of event water discharge functions and area under the curve of fitted NCL functions per event. (a) Nitrate load, (b) Ptot load. Centroids of each cluster are marked with x.
The changes in the distribution of NCL functions when using separated discharge instead of the total discharge, especially for loads, were not apparent, because the total discharge signal masked stronger dilution or flushing tendencies. This shows the potential of the proposed method for contributing to better understanding nutrient export processes in headwater catchments. From the literature we get an ambivalent description of Ptot and behavior if compared to discharge. Frazar et al. (2019) and Kincaid et al. (2020) found that concentrations are decreasing while Ptot concentrations increase due to greater mobilization by fast overland flow in rural catchments. Ebeling et al. (2021) showed, in contrast, enrichment patterns for in over 700 catchments in Germany for long term timeseries. And Winter et al. (2024) showed that long-term export patterns of may diverge from event export patterns but show similar tendencies for flushing or dilution. But to our best knowledge there are no other studies that try to differentiate between the export patterns of Ptot and in the event water fraction and the total discharge. Those signals of flushing and dilution in the event water were dampened in the NCL functions of total discharge and would have remained undetected without hydrograph separation. To answer the question under which conditions those sudden changes occur, a cluster analysis for the volatility of the separated discharge function of event water and the value of the area under the curve for each nutrient was conducted (Fig. 9).
load (Fig. 9a) shows three clusters, with the red cluster clearly showing dilution tendency at moderate volatility, the green cluster showing mostly constant behavior and flushing tendency at moderate volatility, and a blue cluster expressing high volatility at constant behavior. The pattern of clustering is quite similar for Ptot load (Fig. 9b) but with different events and a less pronounced dilution behavior. Ptot loads in the event water express flushing tendency more often. Overall, the range of areas under the curve is smaller for Ptot but volatility patterns are quite similar to nitrate. The comparison of the cluster analysis shows that the volatility of event discharge is in some way a governing factor for the expressed behavior of nutrient export dynamics. Flushing and dilution tendencies can be found both during high volatile and low volatile events, while constant export behavior is centered at moderate and even highly volatile discharges. An explanation for this observation can be found in the mechanics of flushing and dilution: both need a strong signal of precipitation intensity to initialize the effects. Flushing needs an overweight of the cumulative solute load in the beginning of the event and vice versa for dilution patterns. Moreover, highly volatile event discharge is rarely capable of mobilizing enough to initialize the phenomenon of first flush. Despite flushing tendencies, a NCL curve clearly showing a first-flush, could not be observed in this dataset. A first-flush would occur if a maximum distance of 0.2 between a function and the bisector could have been observed (Lee et al., 2002) A steady supply of event water at the beginning of an event, transporting the in soil water and overland flow, is needed (Obermann et al., 2009). The same is true for dilution effects: during events, a steady supply of fresh precipitation water, mostly free of nutrients, can dilute the nutrient background signal stemming from diffuse or even point sources (Ebeling et al.,2021). NCL functions aligned to the bisector on the other hand, are not dominated by one of the effects. Due to the more evenly distributed event water discharge and nutrient concentration, they reflect neither the fast mobilization and enrichment of the discharge with nutrients nor a significant dilution. The reasons for the occurrence of flushing or dilution events are therefore not only attributed to the hydrological functioning of this catchment, but also to the capacity of nutrient storage or seasonally varying effects like pre-event wetness, land use and soil conductivity (Schwientek et al., 2013; Duncan et al., 2015; Winter et al., 2024). This is of great interest, because it was not expected to see such dynamic changes in the load patterns between portions of discharge during precipitation events by using a method originally developed to compare long term solute export behavior. Event water is partly composed of surface runoff, which is often associated with lower loads (Outram et al., 2016; Frazar et al., 2019). These observations contradict the expected behavior of stronger differences between and Ptot loads (Kincaid et al., 2020). The method reveals previously concealed dynamics of nutrient export in this specific catchment. By focusing on the nutrient signal of the event water fraction, it adds an additional dimension to the NCL-method, enabling it to compare different nutrient export processes during the same event. Unexpected nutrient export patterns in the event water might be attributed to catchment properties like the catchments drainage system, unknown point sources, or its legacy storage (mean concentration in discharge:68 mg L−1) (Blaen et al., 2017; Ehrhardt et al., 2019; Spill et al., 2023).
2.8 Method validation using major ions
To evaluate the robustness of the proposed method, it was also applied to major ion concentrations sampled in the same catchment (Fig. 10). Major ions are suitable for testing the method independently of seasonal nutrient patterns and hydrological conditions.
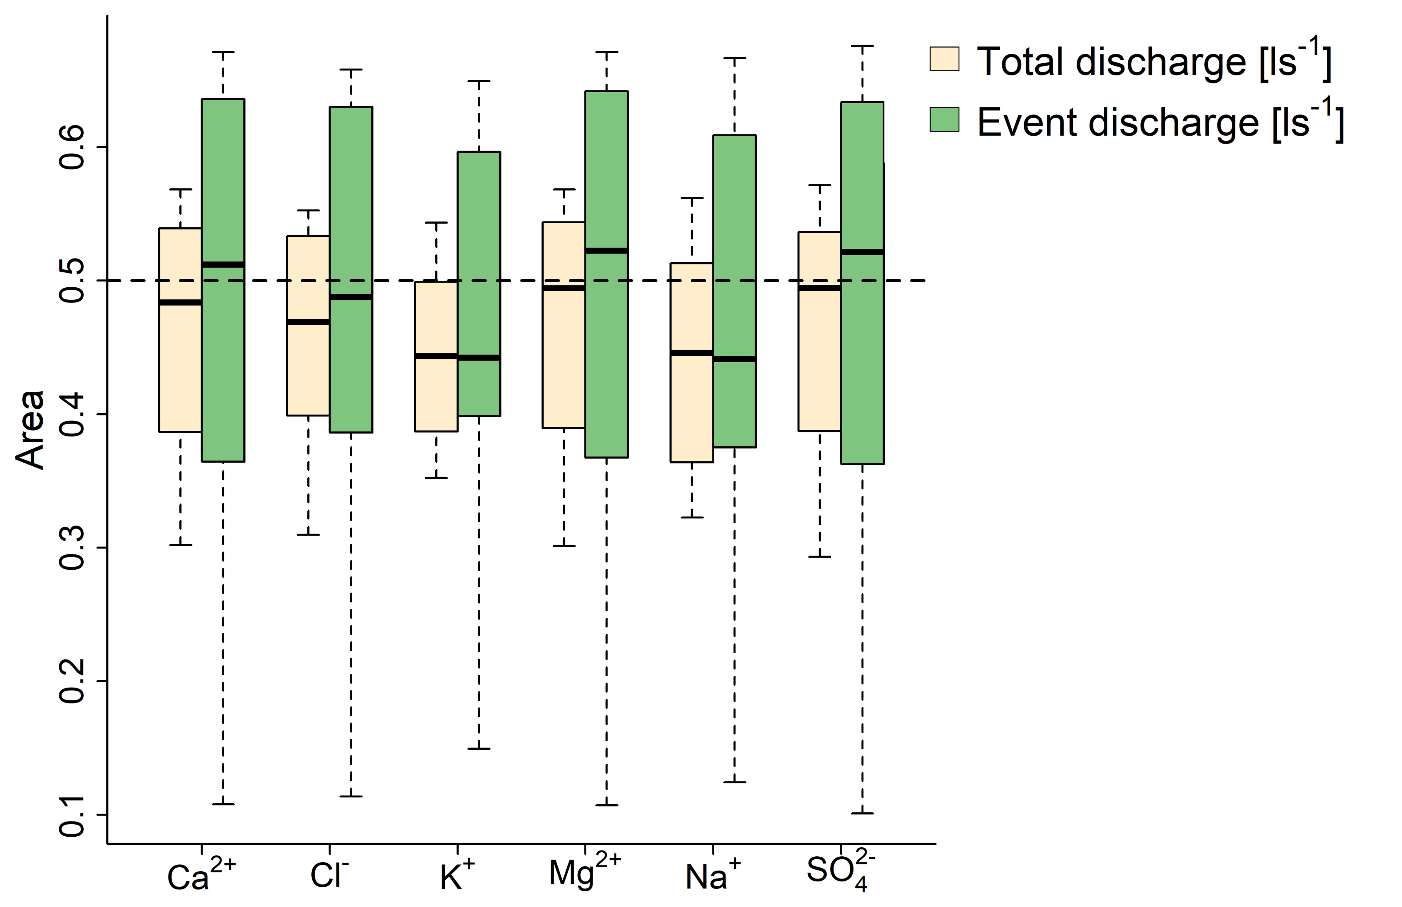
Figure 10Boxplots of areas under the curve for each sampled ion species, the dashed line at 0.5 represents constant export behavior.
While the differences between major ion loads are not as strong as between and Ptot loads, differences between event water and total discharge are also prevalent in the distributions of power functions fitted to the ion data. The distributions differ significantly when tested with KS test (p < 0.05). Potassium loads express the biggest difference between total discharge and event water, and magnesium loads express the smallest. Calcium, magnesium, and sulphate loads shift from near-constant or slight dilution tendencies in the total discharge to mild flushing behavior in the event water. The range of calculated areas drastically increases for all ion species (Fig. 10), indicating overall more volatile dynamics of discharge and mobilization of ions in the event water, which is supported by the strong increase in the coefficient of variation for each ion species (Table 2).
Table 2Coefficient of variation for areas of ion loads in total discharge and event water.
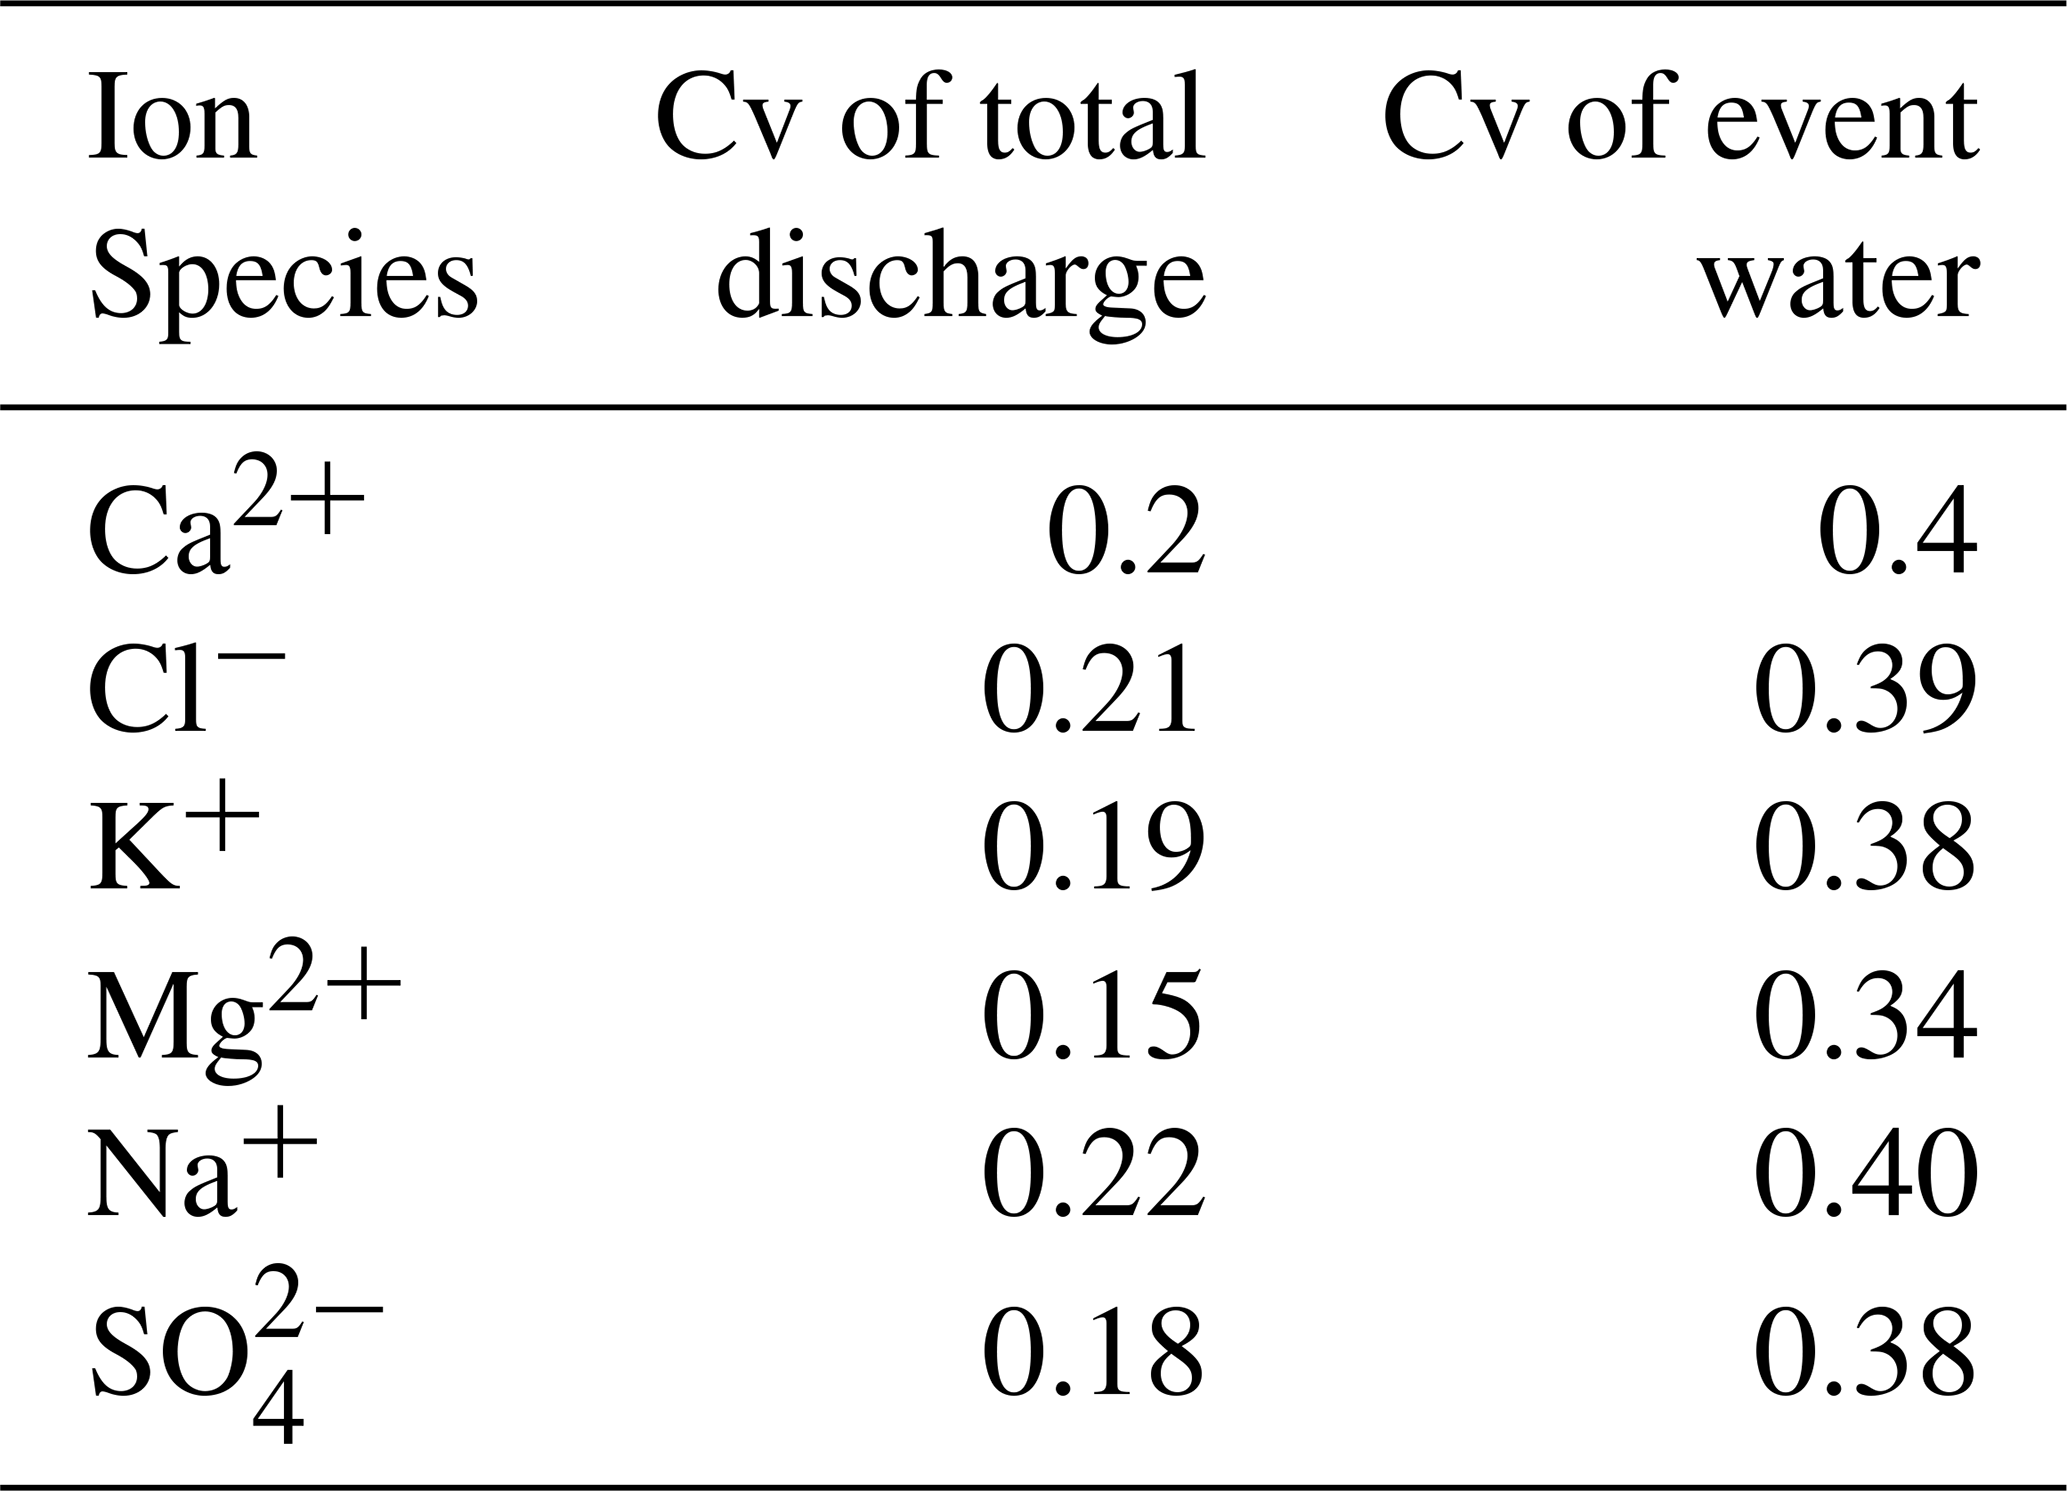
The more pronounced flushing tendencies in the event water fraction were unexpected, given the generally conservative behavior of these solutes under typical flow conditions (Shanley et al., 2011; Moatar et al., 2017). This observation in the monitored catchment can possibly be linked to an influence of either a frequent overland flow or temporary activation of the catchments drainage system. Spearman correlation analysis (p < 0.05) reveals strong positive relationships between the concentrations of most ion species in discharge. These correlations are likely governed by shared hydrological drivers rather than direct chemical dependencies between ions. As discharge rises, all major ion species are mobilized throughout the duration of an event.
2.9 Methodological limitations
Like all data-driven empirical analyses, this method needs a robust sample size from which to draw. 13 events over multiple parameters, as presented in this study, are sufficient to satisfy rigorous statistical thresholds. However, the more data is available, the more robust the method becomes. At first glance, it appears difficult to interpret the comparison between the total discharge and the event water by using baseline descriptive methods like arithmetic mean, median or standard deviation, because they might show no significant changes. However, statistical methods like calculating the range of values and coefficient of variation show a clear difference, which indicates a more complex nature of the observed export dynamics. Using the range of values seems to be the easiest way to highlight differences, but it lacks interpretational power, which could be enhanced by applying a KS test. As an inherited limitation from the NCL function analysis, this method does not allow for interpretation of the influence of event duration and the thresholds for identifying flushing and dilution behavior remain somewhat arbitrary (Bertrand-Krajewski et al., 1998; Hathaway et al., 2012). Therefore, the method requires a broader framework of supporting parameters and complementary statistical analysis like cluster analysis to gain interpretive power. This method is not a stand-alone tool, and it is not suited to quantify the governing processes of the catchment's nutrient export. Rather, it serves to detect whether changing patterns in the catchment's transport processes occur during events. Additionally, we recommend increasing the cleaning interval of the Spectrolyzer, both automated cleaning with pressure and manual cleaning to ensure less instrument failure. Since we used an hourly cleaning with compressed air in this setup, we recommend going down to 30 min, to minimize the influence of sediments covering the optical slit. For the manual cleaning we did a 1 week cleaning interval with brushes and hydrochloric acid (2 %) to remove any biofilm. Recommendations for catchments with a higher biological turnover or water treatment plants influencing the discharge see Spill et al. (2024). Finally, the method would profit from a higher temporal and spatial resolution of tracers in discharge and precipitation within in the catchment, like for example achieved by Freyberg et al., 2018.
The combination of hydrograph separation with solute load functions provides a detailed characterization of catchment export dynamics. Enabled through a combination of hydrograph separation with stable water isotopes and high frequency solute data, the proposed method is capable of detecting differences in the pattern of solute export dynamics between distinct fractions of discharge. Additionally, due to its general approach, it allows for the comparison of water quality parameters with widely differing chemical properties and behavior, making it easier to detect unexpected patterns and dependencies. The behavior of loads in the event water and its resemblance to the Ptot load patterns in the study catchment raises new questions about the input pathways of in headwater catchments: Is the export in the event water primarily driven by point sources or by diffuse sources like drainage outlets or wastewater-related discharge? What is the role of intermittent flow and surface runoff, and are decision-makers able to use this knowledge for effective countermeasures against high loads during events? Focusing on the event water fraction for mitigation measures for solute export in affected catchments could result in a more targeted and cost-effective strategy than concentrating on the total discharge. This would not only apply to nutrients, but to all types of solutes mobilized by the event water, like pesticides, microplastics, or pharmaceuticals. Combined with the flushing tendencies of major ions in the event water, it can be stated that a closer look at the event water solute export dynamics may unveil solute input patterns previously obscured by the solute export signal of total discharge. The proposed method demonstrates robustness across a spectrum of applicable and relevant water quality parameters. While the approach is straightforward and easy to implement, cluster analysis combined with discharge function classification is one way of evaluating the dataset. Although successful in discerning nutrient export variations in this specific catchment, its applicability to catchments with varying export dynamics requires further investigation. For broader validation, the method should be evaluated using larger datasets from diverse catchments. The relatively budget friendly setup and the low number of parameters needed for the analysis present an opportunity for researchers to understand a headwater catchment in greater detail. The method is not limited to stable water isotopes as a tracer, any tracer suited for hydrograph separation can be applied. Since we encountered challenges with the statistical analysis due to the limited sample size, we recommend employing datasets from extended hydrological events or those with high temporal resolution.
Processing algorithms are available upon request from the corresponding author. Field data is part of the Supplement.
The supplement related to this article is available online at https://doi.org/10.5194/hess-30-4209-2026-supplement.
MG conceptualized the research. CS and LD collected the data. LD analysed the data and wrote the manuscript. All coauthors reviewed and edited the manuscript.
The contact author has declared that none of the authors has any competing interests.
Publisher's note: Copernicus Publications remains neutral with regard to jurisdictional claims made in the text, published maps, institutional affiliations, or any other geographical representation in this paper. The authors bear the ultimate responsibility for providing appropriate place names. Views expressed in the text are those of the authors and do not necessarily reflect the views of the publisher.
The authors acknowledge the assistance provided by the laboratory of Urban Water Engineering and Water Quality at the University of Kassel, as well as the assistance of our technicians during data collection and laboratory analyses.
This paper was edited by Paul Wagner and reviewed by two anonymous referees.
Allen, S. T., Jasechko, S., Berghuijs, W. R., Welker, J. M., Goldsmith, G. R., and Kirchner, J. W.: Global sinusoidal seasonality in precipitation isotopes, Hydrol. Earth Syst. Sci., 23, 3423–3436, https://doi.org/10.5194/hess-23-3423-2019, 2019.
Alexander, R. B., Boyer, E. W., Smith, R. A., Schwarz, G. E., and Moore, R. B.: The role of headwater streams in downstream water quality, JAWRA J. Am. Water Resour. As., 43, 41–59, https://doi.org/10.1111/j.1752-1688.2007.00005.x, 2007.
Bertrand-Krajewski, J. L., Chebbo, G., and Saget, A.: Distribution of pollutant mass vs volume in stormwater discharges and the first flush phenomenon, Water Res., 32, 2341–2356, https://doi.org/10.1016/S0043-1354(97)00420-X, 1998.
Bieroza, M., Acharya, S., Benisch, J., Ter Borg, R. N., Hallberg, L., Negri, C., Pruitt, A., Pucher, M., Saavedra, F., Staniszewska, K., Van'T Veen, S. G. M., Vincent, A., Winter, C., Basu, N. B., Jarvie, H. P., and Kirchner, J. W.: Advances in Catchment Science Hydrochemistry, and Aquatic Ecology enabled by High-Frequency Water Quality Measurements, Environ. Sci. Tech., 57, 4701–471, https://doi.org/10.1021/acs.est.2c07798, 2023.
Birkel, C., Tetzlaff, D., Dunn, S. M., and Soulsby, C.: Using lumped conceptual rainfall–runoff models to simulate daily isotope variability with fractionation in a nested mesoscale catchment, Adv. Water Resour., 34, 383–394, https://doi.org/10.1016/j.advwatres.2010.12.006, 2011.
Blaen, P. J., Khamis, K., Lloyd, C., Comer-Warner, S., Ciocca, F., Thomas, R. M., MacKenzie, R., and Krause, S.: High-frequency monitoring of catchment nutrient exports reveals highly variable storm event responses and dynamic source zone activation, J. Geophys. Res.-Biogeo., 122, 2265–2281, https://doi.org/10.1002/2017JG003904, 2017.
Blanchard, B. J., McFarland, M. J., Schmugge, T. J., and Rhoades, E.: Estimation of soil moisture with API algorithms and microwave emission, J. Am. Water Resour. As., 17, 767–774, https://doi.org/10.1111/j.1752-1688.1981.tb01296.x., 1981.
Bloomfield, J. P., Marchant, B. P., Bricker, S. H., and Morgan, R. B.: Regional analysis of groundwater droughts using hydrograph classification, Hydrol. Earth Syst. Sci., 19, 4327–4344, https://doi.org/10.5194/hess-19-4327-2015, 2015.
Blume, T., Zehe, E., and Bronstert, A.: Rainfall–runoff response, event-based runoff coefficients and hydrograph separation, Hydrolog. Sci. J., 52, 843–862, https://doi.org/10.1623/hysj.52.5.843, 2007.
Burns, D. A., Pellerin, B. A., Miller, M. P., Capel, P. D., Tesoriero, A. J., and Duncan, J. M.: Monitoring the riverine pulse: Applying high-frequency nitrate data to advance integrative understanding of biogeochemical and hydrological processes, WIREs Water, 6, e1348, https://doi.org/10.1002/wat2.1348, 2019.
Cassidy, R. and Jordan, P.: Limitations of instantaneous water quality sampling in surface-water catchments: Comparison with near-continuous phosphorus time-series data, J. Hydrol., 405, 182–193, https://doi.org/10.1016/j.jhydrol.2011.05.020, 2011.
Cattell, R.: The scree test for the number of factors, Multivar. Behav. Res., 1, 245–276, https://doi.org/10.1207/s15327906mbr0102_10, 1966.
Clark, I. D. and Fritz, P.: Environmental Isotopes in Hydrogeology, CRC Press, https://doi.org/10.1201/9781482242911, 1997.
Christian, L., Epps, T., Diab, G., and Hathaway, J.: Pollutant Concentration Patterns of In-Stream Urban Stormwater Runoff, Water, 12, 2534, https://doi.org/10.3390/w12092534, 2020.
Di Modugno, M., Gioia, A., Gorgoglione, A., Iacobellis, V., La Forgia, G., Piccinni, A. F., and Ranieri, E.: Build-Up/Wash-Off Monitoring and Assessment for Sustainable Management of First Flush in an Urban Area, Sustainability, 7, 5050–5070, https://doi.org/10.3390/su7055050, 2015.
Duncan, J. M., Band, L. E., Groffman, P. M., and Bernhardt, E. S.: Mechanisms driving the seasonality of catchment scale nitrate export: Evidence for riparian ecohydrologic controls, Water Resour. Res., 51, 3982–3997, https://doi.org/10.1002/2015WR016937, 2015.
Duncan, J. M., Welty, C., Kemper, J. T., Groffman, P. M., and Band, L. E.: Dynamics of nitrate concentration-discharge patterns in an urban watershed, Water Resour. Res., 53, 7349–7365, https://doi.org/10.1002/2017WR020500, 2017.
DWD: Observed data from DWD stations, Climate Data Center (CDC), Deutscher Wetterdienst, Offenbach, https://opendata.dwd.de/climate_environment/CDC/ (last access: 15 May 2025), 2025.
Ebeling, P., Kumar, R., Weber, M., Knoll, L., Fleckenstein, J. H., Musolff, A.: Archetypes and Controls of Riverine Nutrient Export Across German Catchments, Water Resour. Res., 57, e2020WR028134, https://doi.org/10.1029/2020WR028134, 2021.
Ehrhardt, S., Kumar, R., Fleckenstein, J. H., Attinger, S., and Musolff, A.: Trajectories of nitrate input and output in three nested catchments along a land use gradient, Hydrol. Earth Syst. Sci., 23, 3503–3524, https://doi.org/10.5194/hess-23-3503-2019, 2019.
Fischer, B. M., Aemisegger, F., Graf, P., Sodemann, H., and Seibert, J.: Assessing the Sampling Quality of a Low-Tech Low-Budget Volume-Based Rainfall Sampler for Stable Isotope Analysis, Front. Earth Sci., 7, 244, https://doi.org/10.3389/feart.2019.00244, 2019.
Frazar, S., Gold, A. J., Addy, K., Moatar, F., Birgand, F., Schroth, A. W., Kellogg, D. Q., and Pradhanang, S. M.: Contrasting behavior of nitrate and phosphate flux from high flow events on small agricultural and urban watersheds, Biogeochemistry, 145, 141–160, https://doi.org/10.1007/s10533-019-00596-z, 2019.
Fritz, P., Cherry, J., Weyer, K., and Sklash, M.: Storm runoff analyses using environmental isotopes and major ions, Interpretation of Environmental Isotope and Hydrochemical Data in Groundwater, Panel Proceedings Series-International Atomic Energy Agency, International Atomic Energy Agency, Vienna, Austria, 111–130, ISBN 92-0-141076-X, 1976.
Genereux, D. P. and Hooper, R. P.: Oxygen and hydrogen isotopes in rainfall-runoff studies, in: Isotope Tracers in Catchment Hydrology, edited by: Kendall, C. and McDonnell, J. J., Elsevier, 319–346, https://doi.org/10.1016/B978-0-444-81546-0.50017-3, 1998.
Hathaway, J. M., Tucker, R. S., Spooner, J. M., and Hunt, W. F.: A traditional analysis of the first flush effect for nutrients in stormwater runoff from two small urban catchments, Water Air Soil Poll., 223, 5903–5915, https://doi.org/10.1007/s11270-012-1327-x, 2012.
Jarvie, H. P., Sharpley, A. N., Scott, J. T., Haggard, B. E., Bowes, M. J., and Massey, L. B.: Within-river phosphorus retention: accounting for a missing piece in the watershed phosphorus puzzle, Environ. Sci. Tech., 46, 13284–13292, https://doi.org/10.1021/es303562y, 2012.
Kincaid, D. W., Seybold, E. C., Adair, E. C., Bowden, W. B., Perdrial, J. N., Vaughan, M. C. H., and Schroth, A. W.: Land Use and Season Influence Event-Scale Nitrate and Soluble Reactive Phosphorus Exports and Export Stoichiometry from Headwater Catchments, Water Resour. Res., 56, e2020WR027361, https://doi.org/10.1029/2020WR027361, 2020.
Kirkby, M. J.: Do not only connect: a model of infiltration-excess overland flow based on simulation, Earth Surf. Proc. Land., 39, 952–963, https://doi.org/10.1002/esp.3556, 2014.
Klaus, J. and McDonnell, J. J.: Hydrograph separation using stable isotopes: Review and evaluation, J. Hydrol., 505, 47–64, https://doi.org/10.1016/j.jhydrol.2013.09.006, 2013.
Klaus, J., Chun, K. P., McGuire, K. J., and McDonnell, J. J.: Temporal dynamics of catchment transit times from stable isotope 580 data, Water Resour. Res., 51, 4208–4223, https://doi.org/10.1002/2014WR016247, 2015.
Köhler, M. A. and Linsley Jr., R. K.: Prediciting runoff from storm rainfall, US Weather Bureau, Washington D. C., https://www.nrc.gov/docs/ML0819/ML081900279.pdf (last access: 15 December 2025), 1951.
Lee, J. H., Bang, K. W., Ketchum, L. H., Choe, J. S., Yu, M. J.: First flush analysis of urban storm runoff, Sci. Total Environ., 293, 163–175, https://doi.org/10.1016/S0048-9697(02)00006-2, 2002.
Lin, Y., Wang, Y., Ho, Y., Fang, J., and Li, Y.: Characterization and ecological risks of microplastics in urban road runoff, Sci. Total Environ., 954, 176590, https://doi.org/10.1016/j.scitotenv.2024.176590, 2024.
Lloyd, S.: Least squares quantization in PCM, IEEE T. Inform. Theory, 28, 129–137, https://doi.org/10.1109/TIT.1982.1056489, 1982.
Ma, Z., Guan, K., Peng, B., Sivapalan, M., Li, L., Pan, M., Zhou, W., Warner, R., and Zhang, J.: Agricultural nitrate export patterns shaped by crop rotation and tile drainage, Water Res., 229, 119468, https://doi.org/10.1016/j.watres.2022.119468, 2023.
Mamun, A. A., Shams, S., and Nuruzzaman, M.: Review on uncertainty of the first-flush phenomenon in diffuse pollution control, Applied Water Science, 10, 53, https://doi.org/10.1007/s13201-019-1127-1, 2020.
Marin-Ramirez, A., Mahoney, D. T., Riddle, B., Bettel, L., and Fox, J. F.: Response time of fast flowing hydrologic pathways controls sediment hysteresis in a low-gradient watershed, as evidenced from tracer results and machine learning models, J. Hydrol., 645, 132207, https://doi.org/10.1016/j.jhydrol.2024.132207, 2024.
Mekonnen, M. M. and Hoekstra, A. Y.: Global Anthropogenic Phosphorus Loads to Freshwater and Associated Grey Water Footprints and Water Pollution Levels: A High-Resolution Global Study, Water Resour. Res., 54, 345–358, https://doi.org/10.1002/2017WR020448, 2017.
Moatar, F., Abbott, B. W., Minaudo, C., Curie, F., and Pinay, G. : Elemental properties, hydrology, and biology interact to shape concentration-discharge curves for carbon, nutrients, sediment, and major ions, Water Resour. Res., 53, 1270–1287, https://doi.org/10.1002/2016WR019635, 2017.
Müller, C., Musolff, A., Strachauer, U., Brauns, M., Tarasova, L., Merz, R., and Knöller, K.: Tomography of anthropogenic nitrate contribution along a mesoscale river, Sci. Total Environ., 615, 773–783, https://doi.org/10.1016/j.scitotenv.2017.09.297, 2018.
Musolff, A., Schmidt, C., Selle, B., and Fleckenstein, J. H.: Catchment controls on solute export, Adv. Water Resour., 86, S. 133–146, https://doi.org/10.1016/j.advwatres.2015.09.026, 2015.
Obermann, M., Froebrich, J., Perrin, J. L., and Tournoud, M. G.: Impact of significant floods on the annual load in an agricultural catchment in the Mediterranean, J. Hydrol., 334, 99–108, https://doi.org/10.1016/j.jhydrol.2006.09.029, 2007.
Obermann, M., Rosenwinkel, K. H., and Tournoud, M. G.: Investigation of first flushes in a medium-sized mediterranean catchment, J. Hydrol., 373, 405–415, https://doi.org/10.1016/j.jhydrol.2009.04.038, 2009.
Outram, F. N., Cooper, R. J., Sünnenberg, G., Hiscock, K. M., and Lovett, A. A.: Antecedent conditions, hydrological connectivity and anthropogenic inputs: Factors affecting nitrate and phosphorus transfers to agricultural headwater streams, Sci. Total Environ., 545–546, 184–199, https://doi.org/10.1016/j.scitotenv.2015.12.025, 2016.
Peñuela, A., Darboux, F., Javaux, M., and Bielders, C. L.: Evolution of overland flow connectivity in bare agricultural plots, Earth Surf. Proc. Land., 41, 1595–1613, https://doi.org/10.1002/esp.3938, 2016.
Peter, K. T., Hou, F., Tian, Z., Wu, C., Goehring, M., Liu, F., and Kolodziej, E. P.: More than a first flush: Urban creek storm hydrographs demonstrate broad contaminant pollutographs, Environ. Sci. Tech., 54, 6152–6165, https://doi.org/10.1021/acs.est.0c00872, 2020.
R Core Team: R: A Language and Environment for Statistical Computing, R Foundation for Statistical Computing, Vienna, Austria, https://www.r-project.org/ (last access: 15 December 2025), 2025.
Richards, G., Gilmore, T. E., Mittelstet, A. R., Messer, T. L., and Snow, D. D.: Baseflow nitrate dynamics within nested watersheds of an agricultural stream in Nebraska, USA, Agr. Ecosyst. Environ., 308, 107223, https://doi.org/10.1016/j.agee.2020.107223, 2021.
Ritson, J. P., Kennedy-Blundell, O., Croft, J., Templeton, M. R., Hawkins, C. E., Clark, J. M., Evans, M. G., Brazier, R. E., Smith, D., and Graham, N. J. D.: High frequency UV–Vis sensors estimate error in riverine dissolved organic carbon load estimates from grab sampling, Environ. Monitor. Assess., 194, 831, https://doi.org/10.1007/s10661-022-10515-9, 2022.
Schröter, K., Kunz, M., Elmer, F., Mühr, B., and Merz, B.: What made the June 2013 flood in Germany an exceptional event? A hydro-meteorological evaluation, Hydrol. Earth Syst. Sci., 19, 309–327, https://doi.org/10.5194/hess-19-309-2015, 2015.
Schwientek, M., Osenbrück, K., and Fleischer, M.: Investigating hydrological drivers of nitrate export dynamics in two agricultural catchments in Germany using high-frequency data series, Environ. Earth Sci., 69, 381–393, https://doi.org/10.1007/s12665-013-2322-2, 2013.
Seeger, S. and Weiler, M.: Reevaluation of transit time distributions, mean transit times and their relation to catchment topography, Hydrol. Earth Syst. Sci., 18, 4751–4771, https://doi.org/10.5194/hess-18-4751-2014, 2014.
Seitzinger, S. P., Harrison, J. A., Dumont, Egon, Beusen, Arthur H. W., and Bouwman, A. F.: Sources and delivery of carbon, nitrogen, and phosphorus to the coastal zone: An overview of Global Nutrient Export from Watersheds (NEWS) models and their application, Global Biogeochem. Cy., 19, 2005GB002606, https://doi.org/10.1029/2005GB002606, 2005.
Semenov, M. Y. and Zimnik, E. A.: A three-component hydrograph separation based on relationship between organic and inorganic component concentrations: a case study in Eastern Siberia, Russia, Environ. Earth Sci., 73, 611–620, https://doi.org/10.1007/s12665-014-3533-x, 2015.
Shanley, J. B., McDowell, W. H., and Stallard, R. F.: Long-term patterns and short-term dynamics of stream solutes and suspended sediment in a rapidly weathering tropical watershed, Water Resour. Res., 47, https://doi.org/10.1029/2010WR009788, 2011.
Smil, V.: Phosphorus in the environment: Natural Flows and Human Interferences, Annu. Rev. Env. Resour., 25, 53–88, https://doi.org/10.1146/annurev.energy.25.1.53, 2000.
Spill, C., Ditzel, L., and Gassmann, M.: Small villages and their sanitary infrastructure – an unnoticed influence on water quantity and a threat to water quality in headwater catchments, Environ. Monit. Assess., 195, https://doi.org/10.1007/s10661-023-12051-6, 2023.
Spill, C., Ditzel, L., and Gassmann, M.: In-stream nitrogen dynamics in a point source influenced headwater stream during baseflow conditions, Water Resour. Res., 60, https://doi.org/10.1029/2023WR036672, 2024.
Stewart, R. D., Bhaskar, A. S., Parolari, A. J., Herrmann, D. L., Jian, J., Schifman, L. A., and Shuster, W. D.: An analytical approach to ascertain saturation-excess versus infiltration-excess overland flow in urban and reference landscapes, Hydrol. Process., 33, 3349–3363, https://doi.org/10.1002/hyp.13562, 2019.
Uhlenbrook, S., Frey, M., Leibundgut, C., Maloszewski, P.: Hydrograph separations in a mesoscale mountainous basin at event and seasonal timescales, Water Resour. Res., 38, 1096, https://doi.org/10.1029/2001WR000938, 2002.
Vaughan, M. C. H., Bowden, W. B., Shanley, J. B., Vermilyea, A., Sleeper, R., Gold, A. J., Pradhanang, S. M., Inamdar, S. P., Levia, D. F., Andres, A. S., Birgand, F., and Schroth, A. W.: High-frequency dissolved organic carbon and nitrate measurements reveal differences in storm hysteresis and loading in relation to land cover and seasonality, Water Resour. Res., 53, 5345–5363, https://doi.org/10.1002/2017WR020491, 2017.
von Freyberg, J., Studer, B., Rinderer, M., and Kirchner, J. W.: Studying catchment storm response using event- and pre-event-water volumes as fractions of precipitation rather than discharge, Hydrol. Earth Syst. Sci., 22, 5847–5865, https://doi.org/10.5194/hess-22-5847-2018, 2018.
Wade, A. J., Palmer-Felgate, E. J., Halliday, S. J., Skeffington, R. A., Loewenthal, M., Jarvie, H. P., Bowes, M. J., Greenway, G. M., Haswell, S. J., Bell, I. M., Joly, E., Fallatah, A., Neal, C., Williams, R. J., Gozzard, E., and Newman, J. R.: Hydrochemical processes in lowland rivers: insights from in situ, high-resolution monitoring, Hydrol. Earth Syst. Sci., 16, 4323–4342, https://doi.org/10.5194/hess-16-4323-2012, 2012.
Weiler, M., McGlynn, B. L., McGuire, K. J., and McDonnell, J. J.: How does rainfall become runoff? A combined tracer and runoff transfer function approach, Water Resour. Res., 39, 1315, https://doi.org/10.1029/2003WR002331, 2003.
Weitzman, J. N., Brooks, J. R., Compton, J. E., Faulkner, B. R., Mayer, P. M., Peachey, R. E., Rugh, W. D., Coulombe, R. A., Hatteberg, B., and Hutchins, S. R.: Deep soil nitrogen storage slows nitrate leaching through the vadose zone, Agr. Ecosyst. Environ., 332, 1–13, https://doi.org/10.1016/j.agee.2022.107949, 2022.
Werner, B. J., Musolff, A., Lechtenfeld, O. J., de Rooij, G. H., Oosterwoud, M. R., and Fleckenstein, J. H.: High-frequency measurements explain quantity and quality of dissolved organic carbon mobilization in a headwater catchment, Biogeosciences, 16, 4497–4516, https://doi.org/10.5194/bg-16-4497-2019, 2019.
Winter, C., Tarasova, L., Lutz, S. R., Musolff, A., Kumar, R., and Fleckenstein, J. H.: Explaining the Variability in High-Frequency Nitrate Export Patterns Using Long-Term Hydrological Event Classification, Water Resour. Res., 58, e2021WR030938, https://doi.org/10.1029/2021WR030938, 2022.
Winter, C., Jawitz, J. W., Ebeling, P., Cohen, M. J., Musolff, A.: Divergence Between Long-Term and Event-Scale Nitrate Export Patterns, Geophys. Res. Lett., 51, e2024GL108437, https://doi.org/10.1029/2024GL108437, 2024.
Wunsch, A., Liesch, T., and Broda, S.: Feature-based groundwater hydrograph clustering using unsupervised self-organizing map-ensembles, Water Resour. Manag., 36, 39–54, https://doi.org/10.1007/s11269-021-03006-y, 2022.
Zimmer, M. A., Pellerin, B., Burns, D. A., and Petrochenkov, G.: Temporal variability in nitrate-discharge relationships in large rivers as revealed by high-frequency data, Water Resour. Res., 55, 973–989, https://doi.org/10.1029/2018WR023478, 2019.