the Creative Commons Attribution 4.0 License.
the Creative Commons Attribution 4.0 License.
 | 03 Jul 2026
Enhanced understanding of dominant drivers of Water Yield change across China through the improved coupled carbon and water model
Huilan Shen
Changming Li
Rapid environmental changes, including climate change, escalating atmospheric CO2 concentration ([CO2]), and vegetation dynamics, have been significantly impacting hydrological processes. Yet it remains difficult to disentangle the contributions of climate, vegetation, and [CO2] change to water yield (WY), especially clarifying [CO2]-driven physiological effects. Therefore, this study improved the coupled carbon and water (CCW) model by integrating dynamic water use efficiency (WUE) to capture [CO2]-physiological effects, and quantified the attribution of WY changes across China from 1982 to 2017 using a scenario analysis based on this model. The results showed that WY changes were attributed to the changes in climate, vegetation, and [CO2]. Among them, climate change (especially precipitation change) emerged as the dominant driver, directly affecting over 70 % land area of China. The vegetation change was the second largest factor, especially in central China. The escalating [CO2] had a relatively small effect. Spatially, the changes in vegetation and [CO2] exerted greater influence within the 400–1600 mm precipitation range. Remarkably, under CMIP6 SSP585 projections, an accelerating [CO2] rise will lead to a +1.29 % yr−1 increase in annual WY by 2100 based on the elasticity estimate, which surpasses vegetation influence (−0.26 % yr−1). By using dynamic WUE, this improved framework advances WY attribution and confirms that [CO2] physiological regulation can partly offset vegetation-induced WY reductions. These findings deliver novel references for adaptive regional water resource management under climate change.
- Article
(7048 KB) - Full-text XML
- BibTeX
- EndNote


The global environment has been undergoing rapid changes, impacting hydrological processes through climate change, escalating atmospheric CO2 concentration [CO2], and vegetation dynamics (Piao et al., 2007; Wei et al., 2024). Notably, China has experienced a visible greening trend in recent decades, prompting a heightened focus on ecological and water resource concerns (Chen et al., 2019). Investigating the influence of vegetation changes on runoff has thus emerged as a pivotal research area, aligning with China's increasing emphasis on environmental sustainability. Among hydrological metrics, water yield (WY) is especially relevant because it directly represents the amount of water remaining after evapotranspiration and is therefore closely linked to runoff generation and regional water availability. China's diverse climatic zones and pronounced greening make it an ideal natural laboratory for investigating these ecohydrological feedbacks, with implications for both China (Ogutu et al., 2021; Yang et al., 2019) and other semi-arid and monsoon-influenced regions such as the Sahel, South Asia, and the Mediterranean Basin (Nkiaka et al., 2025; Rahman et al., 2025; Serrano-Notivoli et al., 2022). Understanding how vegetation dynamics, climate change, and [CO2] interact to regulate WY is therefore of both scientific and practical importance for water resource management and ecological restoration under accelerating environmental change.
Several methods have been employed to separate the effects of climate, vegetation, and [CO2] change on runoff change, including paired catchment experiments, statistical methods, and modeling approaches (Zeng et al., 2020). Given that annual water yield (WY) equates to runoff through negligible soil water storage changes, these methodological evaluations directly inform WY attribution frameworks (Zhang et al., 2022b). The paired catchment experiment method, though classical, is limited to small-scale watersheds and is less applicable to larger regions (Peng et al., 2016). Statistical methods, while helpful in identifying correlations, lack a physical basis and are insufficient for explaining the underlying mechanisms of runoff changes (Chen et al., 2022). Modeling approaches for attribution fall into two broad classes: (i) process-based models that explicitly simulate coupled water–energy–carbon processes, and (ii) conceptual models that approximate these processes with parsimonious, physically interpretable relationships (Zhai and Tao, 2021). Process-based models can capture detailed mechanisms, but they require extensive inputs and many parameters, are sensitive to calibration and equifinality, and are computationally demanding – limitations that hinder basin-to-continental applications over long periods (Jiao et al., 2017; Ma et al., 2023). By contrast, conceptual models retain key ecohydrological mechanisms with far fewer parameters, scale well to large regions, and thus are well suited for large-scale attribution while preserving physical interpretability. Among these conceptual models, the Budyko framework, widely used to separate climate change effects on runoff, quantifies water balance through the aridity index (PET/precipitation) and incorporates a catchment-specific Budyko parameter (n) representing integrated land surface characteristics (e.g., vegetation, soil, topography) (Zhang et al., 2022a, 2016a). However, most Budyko-based applications primarily emphasize climate-driven attribution; vegetation and [CO2] influences are typically introduced only indirectly – by assigning temporal changes in the Budyko parameter (n) to vegetation (Tan et al., 2024; Xue et al., 2022; Zhou et al., 2023) or correlating the Budyko parameter (n) with NDVI (Liu et al., 2024; Tan et al., 2023), and by embedding [CO2] effects through PET adjustments (Liu et al., 2024). These practices conflate vegetation with other controls captured by the Budyko parameter (n) (e.g., soil, topography) and mix [CO2]-physiological impacts with meteorological drivers in PET, making it difficult to isolate vegetation structural change from [CO2]-induced stomatal adjustments and to ascribe mechanisms robustly (Gan et al., 2021). But accurately representing the physiological effects of elevated [CO2] is critical for runoff attribution, because rising [CO2] can reduce stomatal conductance, thereby suppressing vegetation transpiration and evapotranspiration (Lammertsma et al., 2011; Xu et al., 2016).
Meanwhile, the coupled carbon and water (CCW) model provides a suitable basis for mechanistic WY attribution, because its calculation framework explicitly couples carbon and water fluxes and links vegetation dynamics with evapotranspiration (Li et al., 2024b; Zhang et al., 2021b, 2022b). In contrast to empirical parameter n in the Budyko framework, the CCW model estimates actual evapotranspiration using gross primary productivity (GPP), vapor pressure deficit (VPD), and underlying water-use efficiency (UWUE), expressed as ET = GPP ⋅ VPD0.5 UWUE. This carbon and water coupling enables ET to be directly derived from vegetation processes, making the attribution framework useful for separating vegetation effects from climate effects in WY. Nevertheless, the original CCW model, adopts a static UWUE and does not account for [CO2]-induced physiological changes, specifically long-term enhancements in water use efficiency (WUE) resulting from elevated [CO2], thereby limiting its capacity to isolate [CO2] physiological effects from vegetation structural and climate influences (Adams et al., 2020; Li et al., 2023).
Therefore, our study prepares to enhance the CCW framework by incorporating dynamic WUE responses to [CO2], allowing explicit attribution of runoff changes to three distinct drivers, namely climate change (e.g. precipitation, temperature, and so on), vegetation structural change (NDVI, and land use and land cover (LULC)), and [CO2]-physiological effects (stomatal optimization). This extension advances beyond empirical or regression-based attribution, clarifies how [CO2] modulates vegetation and hydrology interactions across large spatial scales, and provides policy-relevant evidence for sustainable water resource management and ecological restoration in China under accelerating environmental change.
2.1 Data sources and processing
Four main datasets were employed in the improved CCW model: vegetation data (NDVI), climate data (precipitation, temperature, shortwave radiation, vapor pressure deficit, and atmospheric pressure), land use and land cover (LULC), and [CO2]. The monthly NDVI dataset used in this study (Table 1) was derived from a daily 0.05° gap-free NDVI dataset in China (https://doi.org/10.6084/m9.figshare.c.7002225.v1, Li et al., 2024a), which was developed from the NOAA's daily NDVI dataset, applying effective data recognition and spatiotemporal gap-filling techniques. The dataset spans 1981–2023 and provides a spatial resolution of 0.05°, and we used bilinear interpolation to generate the dataset with a spatial resolution of 0.1°.
Climate data (Table 1), including precipitation, air temperature, surface downward shortwave radiation, relative humidity, and atmospheric pressure, were sourced from the China Meteorological Forcing Dataset (CMFD) at the National Tibetan Plateau Data Center (TPDC) of the Institute of Tibetan Plateau Research, Chinese Academy of Sciences (He et al., 2020). The dataset spans 1979–2018 and provides a spatial resolution of 0.1° and temporal resolutions at 3 h, daily, monthly, and annual scales. As the dataset did not provide vapor pressure deficit (VPD), we calculated VPD using the method from Howell and Dusek (1995), based on atmospheric pressure, temperature, and relative humidity.
LULC data (Table 1) were obtained from the Zhang et al. (2024) global dataset, which provides consistent multi-temporal global LULC maps at 30 m spatial resolution for 1985–2022. The dataset includes 35 fine-resolution LULC types. For the purposes of this study, and to facilitate LULC change analysis, we merged these 35 LULC types into 17 types using the IGBP classification, based on the method by Yang et al. (2017). Four primary LULC types – cropland, forest, grassland, and bare land – were determined following the method described by Mu et al. (2013). The data were resampled to the 0.1° spatial resolution, ensuring compatibility for modeling within the modified CCW framework.
[CO2] data were sourced from the Mauna Loa Observatory (MLO), Hawaii (20° N, 156° W) (https://gml.noaa.gov/ccgg/trends/data.html, last access: 1 June 2026), with yearly observations used to represent national [CO2] levels due to the minimal spatial variation in [CO2] across China (Table 1). These datasets were then used to drive the improved CCW model.
In this study, the hydrological data for model validation from 145 hydrological stations (Fig. 1), each with at least 15 years of continuous data since 1982, was collected from the Hydrological Bureau of the Ministry of Water Resources of China (https://www.mwr.gov.cn/english/, last access: 18 June 2026). Annual runoff data were calculated from the daily runoff and the catchment area controlled by each hydrological station.
Table 1Hydrology, climate, and vegetation data for the improved CCW model.
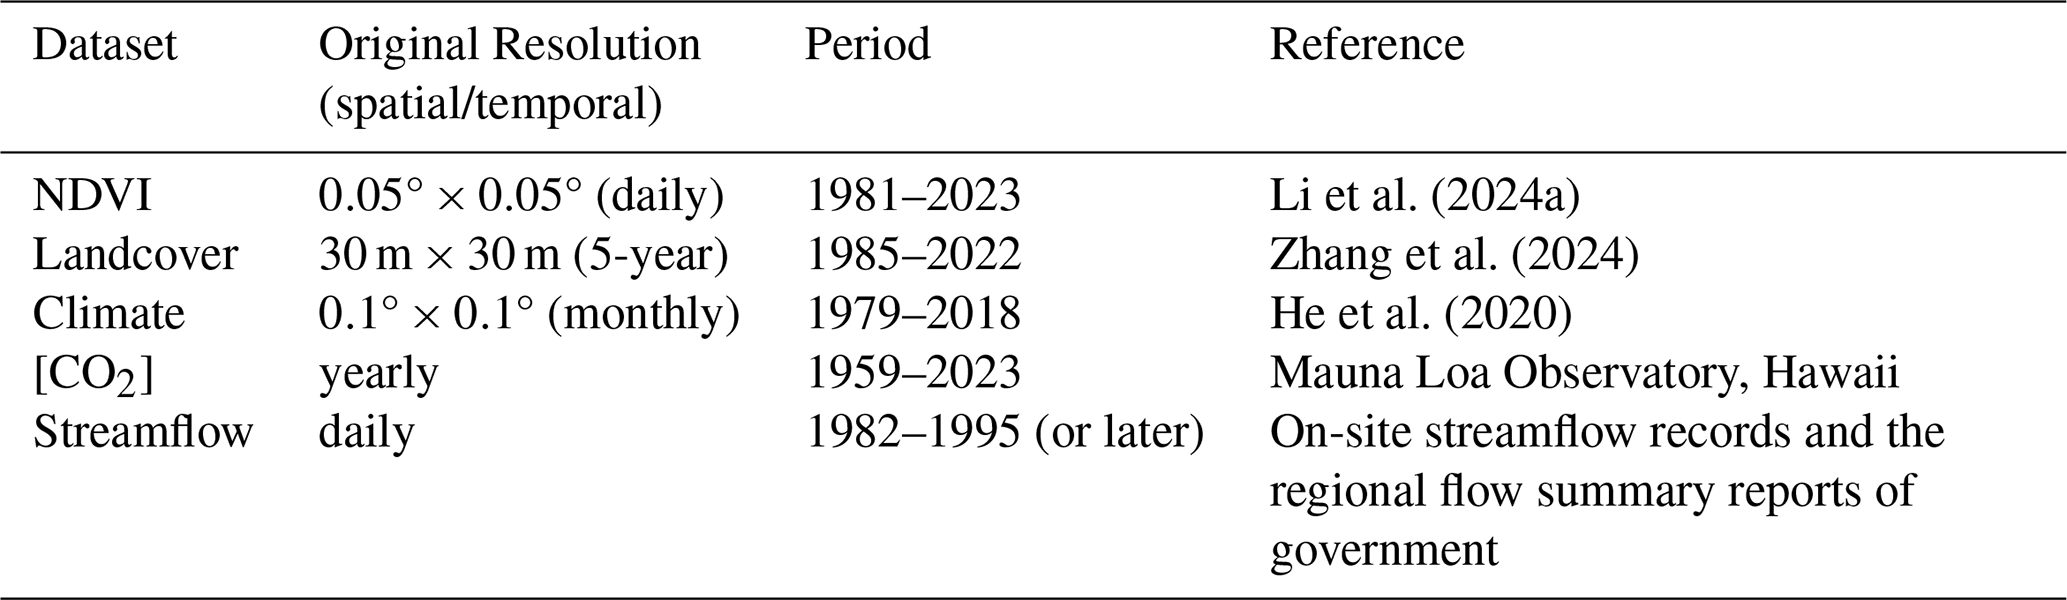
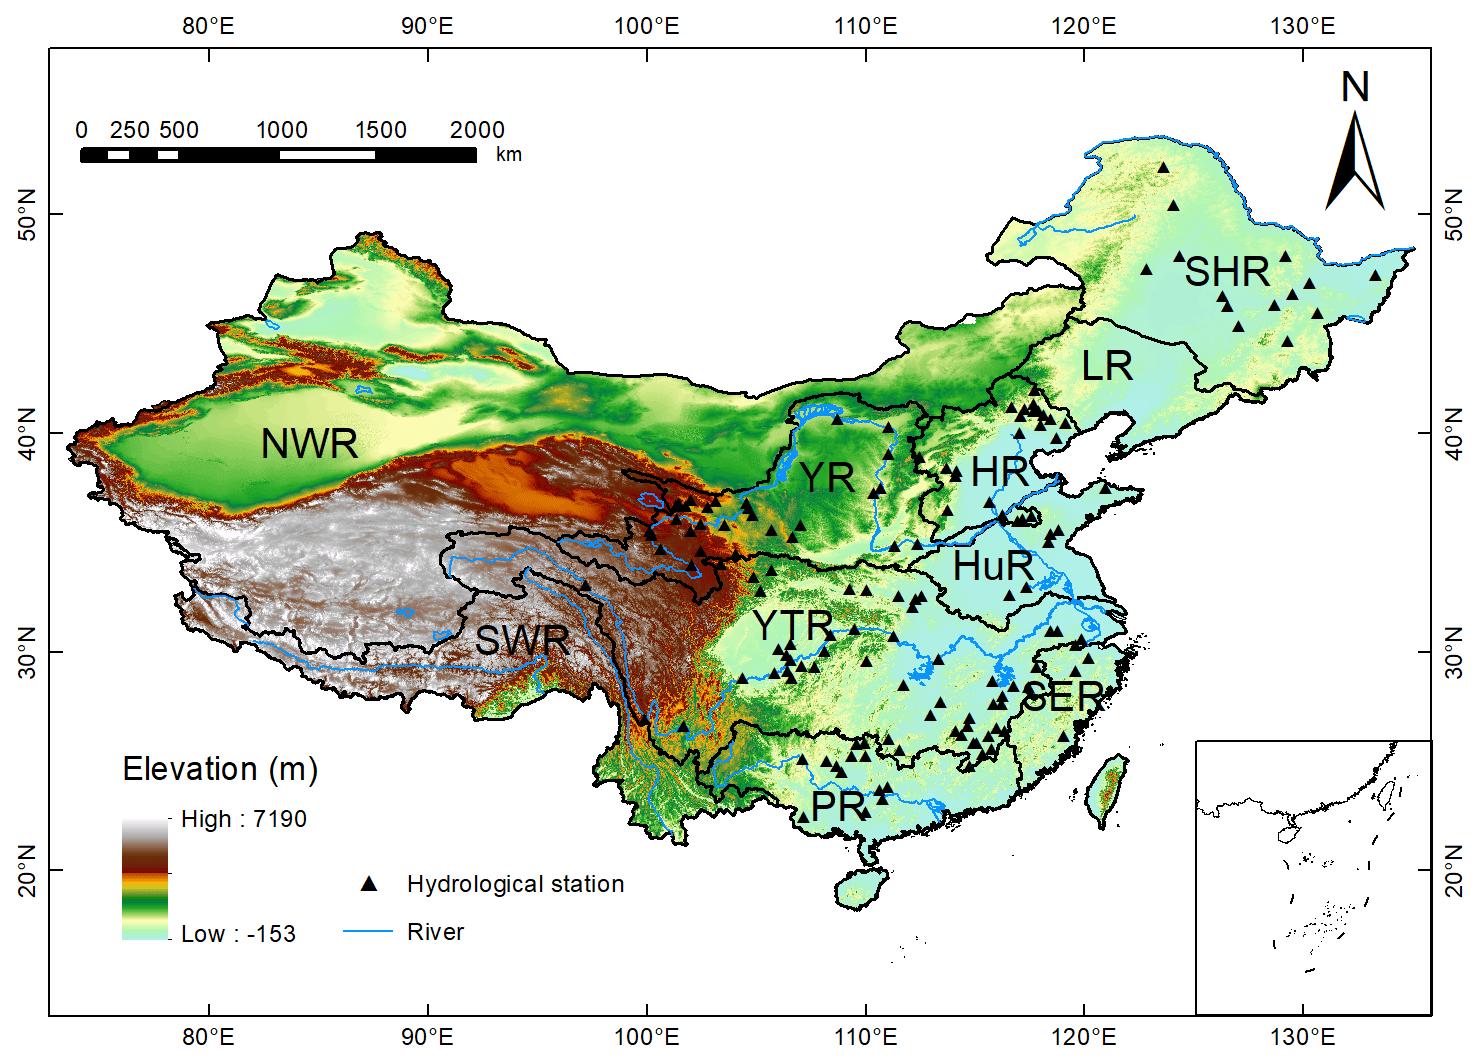
Figure 1The geographic location and topography of the study area, where the black triangles mark the location of the hydrological gauging stations for model evaluation. Ten river basins considered in this study are: Songhua River basin (SHR), Liao River basin (LR), Hai River basin (HR), Huai River basin (HuR), Yangtze River basin (YZR), Yellow River basin (YR), Pearl River basin (PR), Southeast Rivers (SER), Southwest Rivers (SWR) and Northwest Rivers (NWR).
2.2 The improved CCW model
The Coupled Carbon and Water (CCW) model is a remote-sensing driven ecosystem model that mechanistically links terrestrial carbon uptake and water dynamics (Zhang et al., 2016b), and its detailed information is provided in Appendix A. In this study, we improve the CCW model by replacing the static underlying water use efficiency (UWUE) in the original CCW model with a dynamic ecosystem-scale WUE that responds to changing [CO2], vapor pressure deficit (VPD), atmospheric pressure, and vegetation structure.
In the improved CCW model, evapotranspiration (ET) is calculated as the ratio of GPP to WUE:
where WUE is defined as the ratio of GPP (Gross primary productivity) to total ecosystem evapotranspiration. GPP is estimated as:
where APAR is the absorbed photosynthetically active radiation (MJ m−2), which is calculated as the product of incident photosynthetically active radiation (PAR) and the fraction of PAR absorbed by vegetation (FPAR). PAR is typically assumed to be 45 % of the total shortwave radiation (Running et al., 2000), and FPAR is determined by the normalized difference vegetation index (NDVI) (Sims et al., 2005). ε is the realized light-use efficiency (g C MJ−1), which is calculated by multiplying the potential light-use efficiency (εpot) and environmental scalars for diffuse radiation (Rs), temperature (Ts), and moisture stress (Ws).
WUE is estimated using the WEC (Water Efficiency and Carbon) equation proposed by Cheng et al. (2017):
where Ca is atmospheric CO2 concentration (mol(CO2) mol−1(air)); Pa is atmospheric pressure (kPa); VPD is vapor pressure deficit (kPa); g1 is an empirical parameter of the Ball stomatal conductance model; k is the radiation extinction coefficient, typically set at 0.6; LAI is the leaf area index; and fi is fraction of interception to total evapotranspiration. In this study, the interception evaporation factor (fi) was set to zero, since Cheng et al. (2017) reported that canopy interception account for a minor portion of total evapotranspiration at annual scales. Given that the improved CCW model focused on yearly water yield (WY) dynamics, neglecting interception loss reduces model complexity without substantially affecting WY estimation.
In order to ensure the consistency of NDVI and LAI trends, LAI is calculated using NDVI (Gutman and Ignatov, 1998):
where NDVI0=0.04, NDVI1=0.52
Under this framework, ET should be interpreted as an effective annual ecosystem-scale evapotranspiration suitable for long-term WY attribution, rather than a detailed partitioning of individual ET components. Compared with the original CCW model, this modification allows ET to vary with dynamic WUE and therefore enables the model to represent [CO2]-induced physiological regulation in addition to vegetation structural and climatic effects.
Finally, the water yield (WY) is calculated as the difference between precipitation (P) and ET:
On an annual scale, WY can be approximately equal to runoff, as changes in soil water storage over long periods (one year or longer) are considered negligible (Xiao et al., 2020; Zhang et al., 2021b). Thus, the attribution of WY can also be considered as the attribution of runoff. Accordingly, in this study, WY is used as the modelled output, while the term “runoff” is reserved for observed streamflow or literature values explicitly labelled as such. This approximation is most suitable for annual to multi-year analyses in regions without substantial long-term groundwater depletion or strong reservoir regulation.
2.3 Attribution analysis framework
In this study, we proposed an attribution analysis framework based on scenarios simulation to explore the combined and individual effects of climate, vegetation, and [CO2] change on WY. Four scenarios were designed (Table 2). Scenario 1 (Actual) aimed to validate the improved CCW model and estimate the combined effects of climate, vegetation, and [CO2] change on WY by allowing all factors to vary from 1982 to 2017. Scenario 2 (Vegetation Change) focused on estimating the direct effects of vegetation change on WY by allowing vegetation factors (NDVI and LULC) to vary while keeping climate and [CO2] fixed at 1982 levels. In this case, the trend in WY obtained reflects the impact of vegetation change alone. Scenario 3 (Climate Change) aimed to estimate the direct effects of climate change on WY by allowing climate factors (precipitation, temperature, relative humidity, solar radiation, and atmospheric pressure) to change, while fixing vegetation and [CO2] at 1982 levels. This scenario helps isolate the effects of climate change on WY. Scenario 4 ([CO2] Change) was designed to estimate the direct effects of [CO2] change on WY by varying [CO2] levels from 1982 to 2017, while climate and vegetation factors were fixed at 1982 levels. The resulting WY trend reflects the impact of [CO2] change alone. The resulting WY series under each scenario represents the direct impact of the corresponding driver under the assumption that the other drivers are fixed.
Table 2Designed scenarios in the improved CCW model for WY attribution. LULC: Land use and land cover types; NDVI: Normalized difference vegetation index; TMP: Temperature; SRAD: Shortwave radiation; VPD: Vapor pressure deficit.
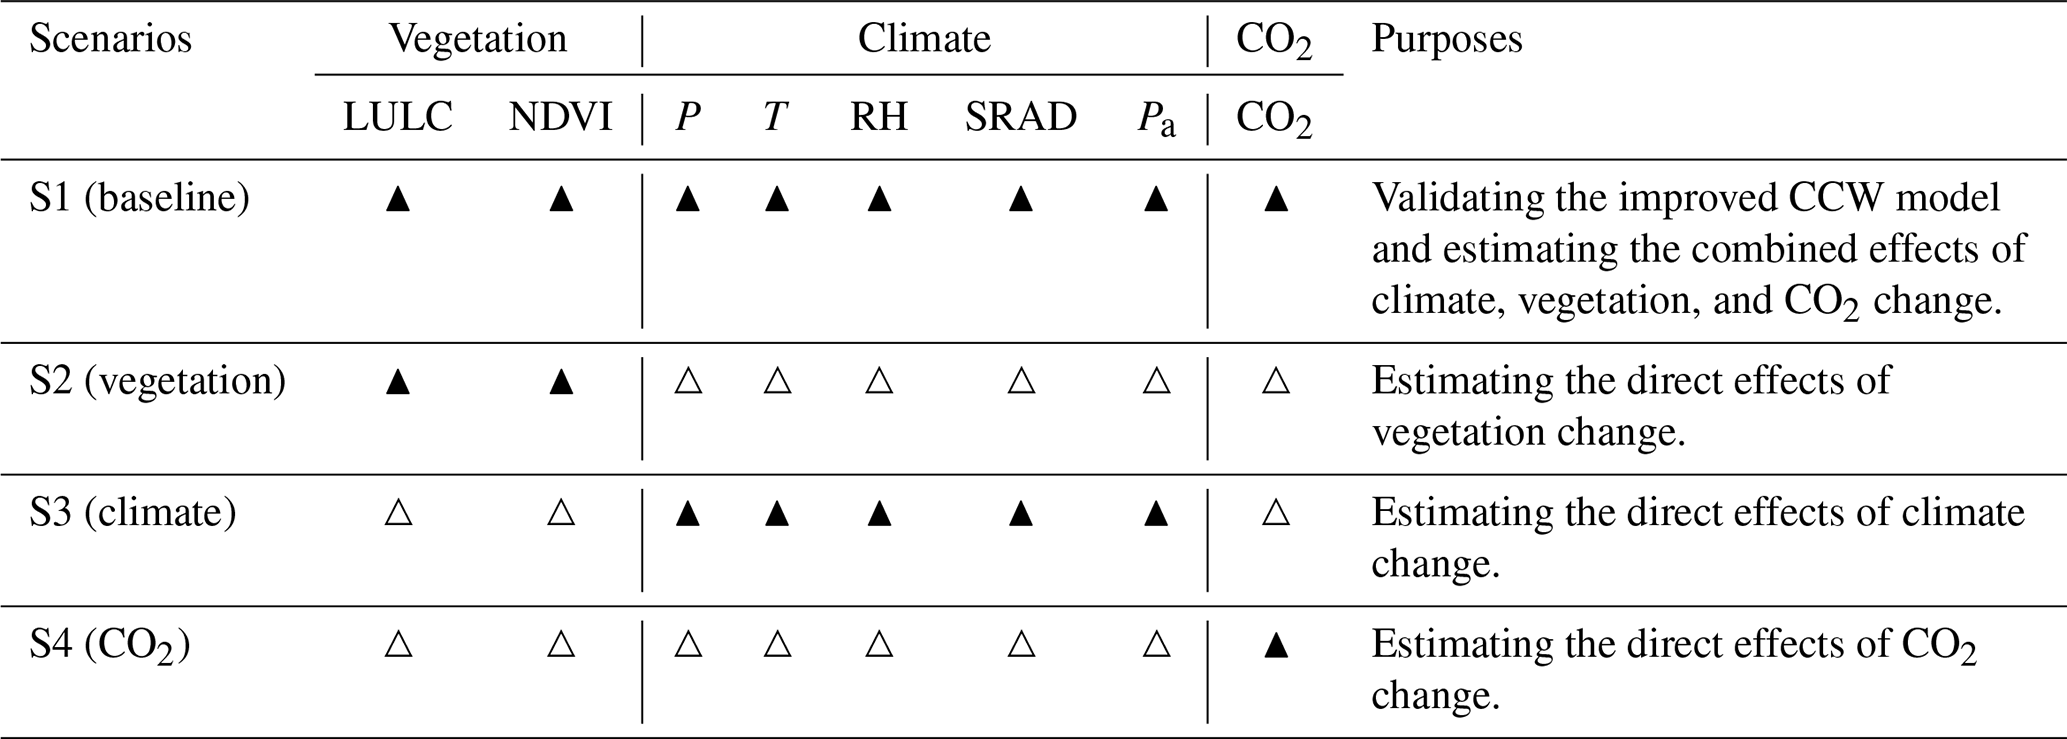
Note: The symbol “▴” denotes a changing input factor over time, whereas the symbol “△” represents a fixed input factor at the level of the initial year (1982).
For each scenario, the long-term “trend” in annual WY over 1982–2017 was quantified using the Theil–Sen slope of the annual WY series (Sen, 1968; Theil, 1992). The relative contributions of climate, vegetation, and [CO2] to changes in WY were calculated using the following formula (Ma et al., 2023; Wang et al., 2022):
where trendvegetation, trendclimate, and denote the Theil–Sen slopes of the annual WY series under vegetation, climate, and [CO2] scenarios, respectively. These slopes represent the long-term rates of WY change attributable to each driver within the scenario framework; the relative contributions (RCvegetation, RCclimate, and ) are expressed as percentages, indicating the normalized magnitude of the scenario-derived direct effects.
At each grid, the dominant driver of WY change is identified as the factor with the largest absolute relative contribution among climate, vegetation, and [CO2]. When the absolute difference in relative contributions between two factors do not exceed 5 %, these two factors are considered as joint significant contributors to the changes in WY at that grid (Jia et al., 2022). This criterion is used to distinguish grids dominated by a single factor from those where two drivers contributed comparably to WY change.
Furthermore, elasticity analysis is implemented to quantify the sensitivity of WY to individual drivers. Elasticity is defined as the relative change in WY caused by a 1 % perturbation in a given driver (Yang and Yang, 2011). We specifically focus on precipitation because, despite not always having the highest sensitivity, it is integral to the hydrological cycle and essential for assessing water yield (WY) under various climate change scenarios (Liu et al., 2017). Specifically, for each driver (x), including precipitation, NDVI, and [CO2], the baseline S1 series is increased by 1 % over the entire 1982–2017 period while all other factors are held unchanged. Then the elasticity coefficient is estimated as:
where (x) represents precipitation, NDVI, or [CO2]; is the mean annual WY under the baseline scenario S1 during 1982–2017; and is the mean annual WY after increasing driver (x) by 1 % while keeping all other factors unchanged.
Mathematically, the elasticity coefficient is defined as the runoff change rate divided by 1 %, and the formula is as follows:
Generally, while the scenario analysis above has identified which factors are most influential based on their relative contributions, the elasticity coefficients allow us to explain why these factors are critical by demonstrating their respective impacts on WY through sensitivity analysis. By separating the sensitivity of WY from the historical magnitude of driver changes, the elasticity analysis extends the scenario-based attribution and provides a basis for approximating future WY responses when projected changes in precipitation, vegetation, or [CO2] are available.
3.1 Changes in hydrometeorological factors
Figure 2 demonstrates the trends of annual precipitation, air temperature, relative humidity, atmospheric pressure, solar radiation, and NDVI across China during 1982–2017. Annual precipitation change exhibited a clear spatial distribution pattern, specifically decreases in central China, including the middle reaches of the Yellow River and the Yangtze River basins, and increases in the northwest and southeast. Air temperature exhibited a consistent warming trend across China. In contrast, relative humidity generally decreased across most China. Atmospheric pressure remained relatively stable. Regarding solar radiation, decreases were in northern China, while an increase was in southern regions. The decreasing solar radiation in northern China is likely due to increased aerosol concentrations (Liang et al., 2024). NDVI showed a significant increasing trend, which indicates an overall enhancement in vegetation growth across China. This trend was especially prominent in central and eastern regions, including the Yellow River Basin and the Yangtze River Basin. In these regions, LULC changes, such as afforestation and agricultural practices, likely contributed to the observed increases in NDVI (Chen et al., 2019).
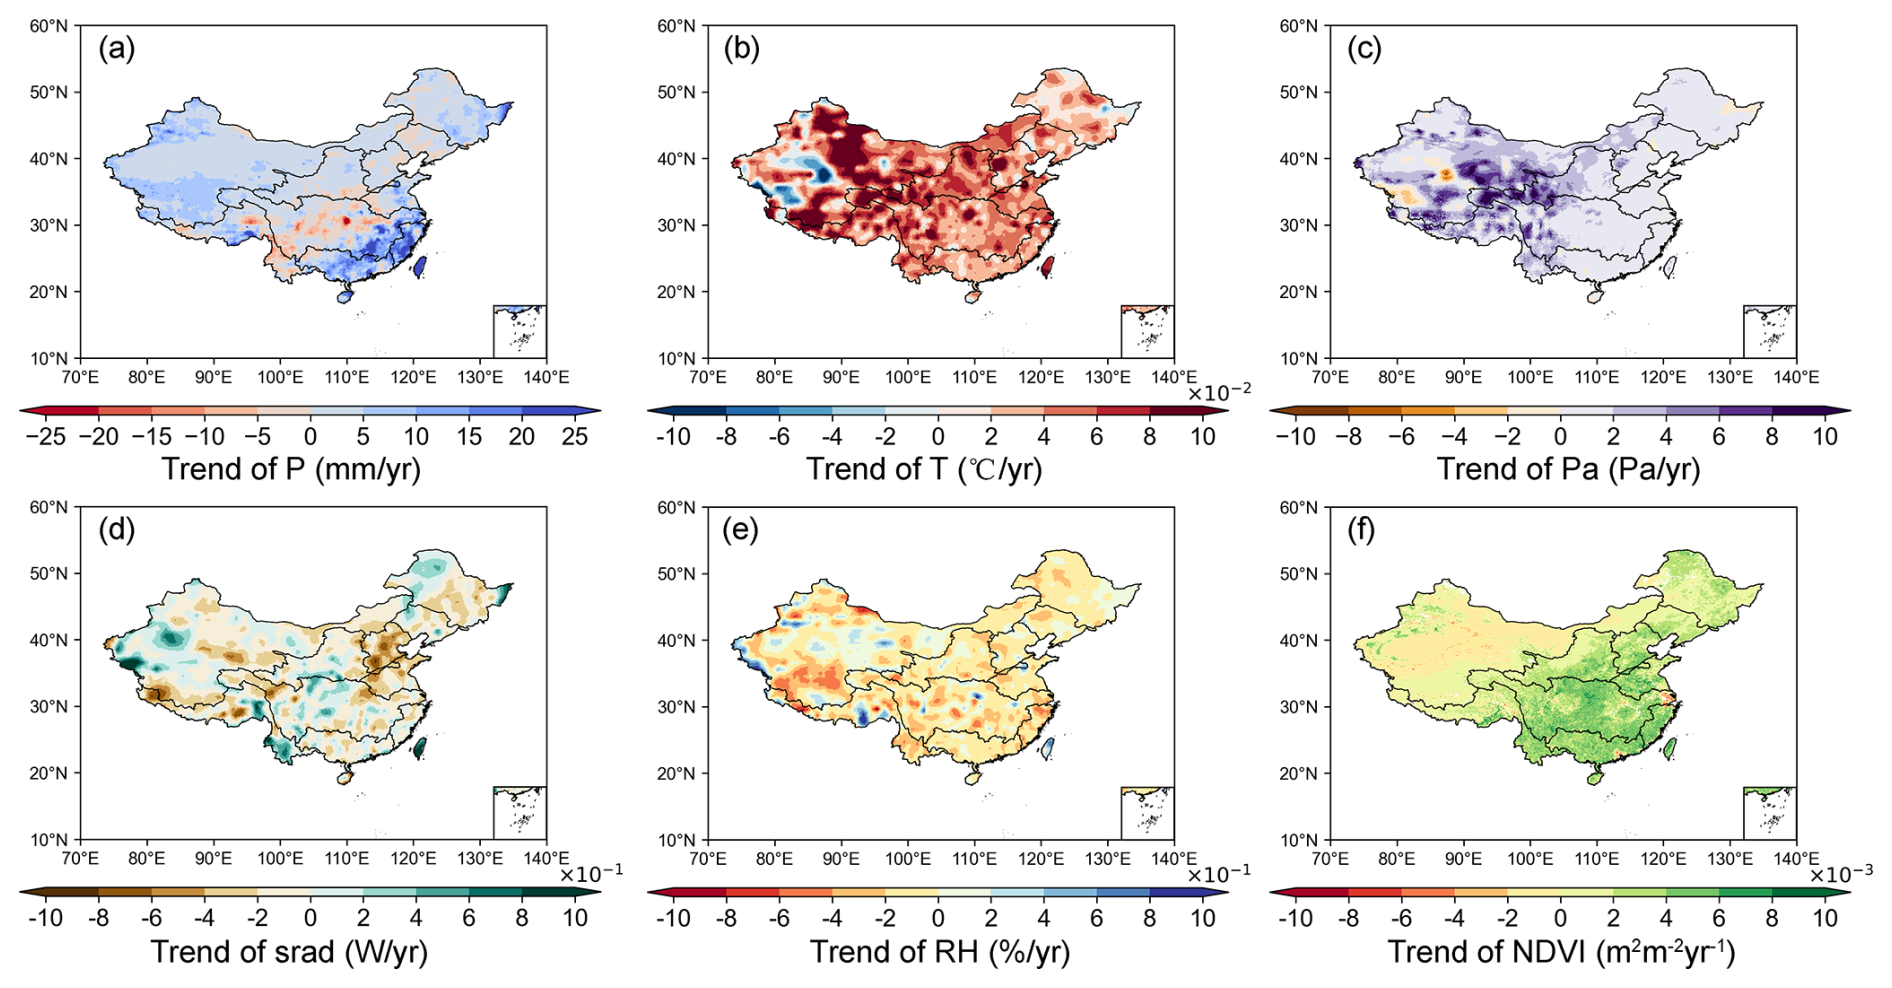
Figure 2Spatial patterns of trends in annual climatic and vegetation factors during 1982–2017. (a) Precipitation (mm yr−1); (b) air temperature (°C yr−1); (c) atmospheric pressure (Pa yr−1); (d) shortwave radiation (W m−2 yr−1); (e) relative humidity (% yr−1); (f) NDVI (yr−1).
Significant changes in land use and land cover (LULC) occurred in China during 1982–2017, as illustrated in Fig. 3. Although the overall percentage distribution of major land cover types, namely grasslands, forests, croplands, and bare lands, remained relatively stable, these four categories dominated the landscape, with most changes concentrated within them. Notably, the transitions among these categories were characterized by mutual conversions, particularly from bare land to grasslands (Fig. 3). Spatially, the changes exhibited distinct regional patterns. In southern China, LULC changes were mainly characterized by the conversion of land to forests and grasslands. In contrast, the northeastern regions exhibited more complex transformations, with some areas shifting to bare land and croplands (Fig. 3).
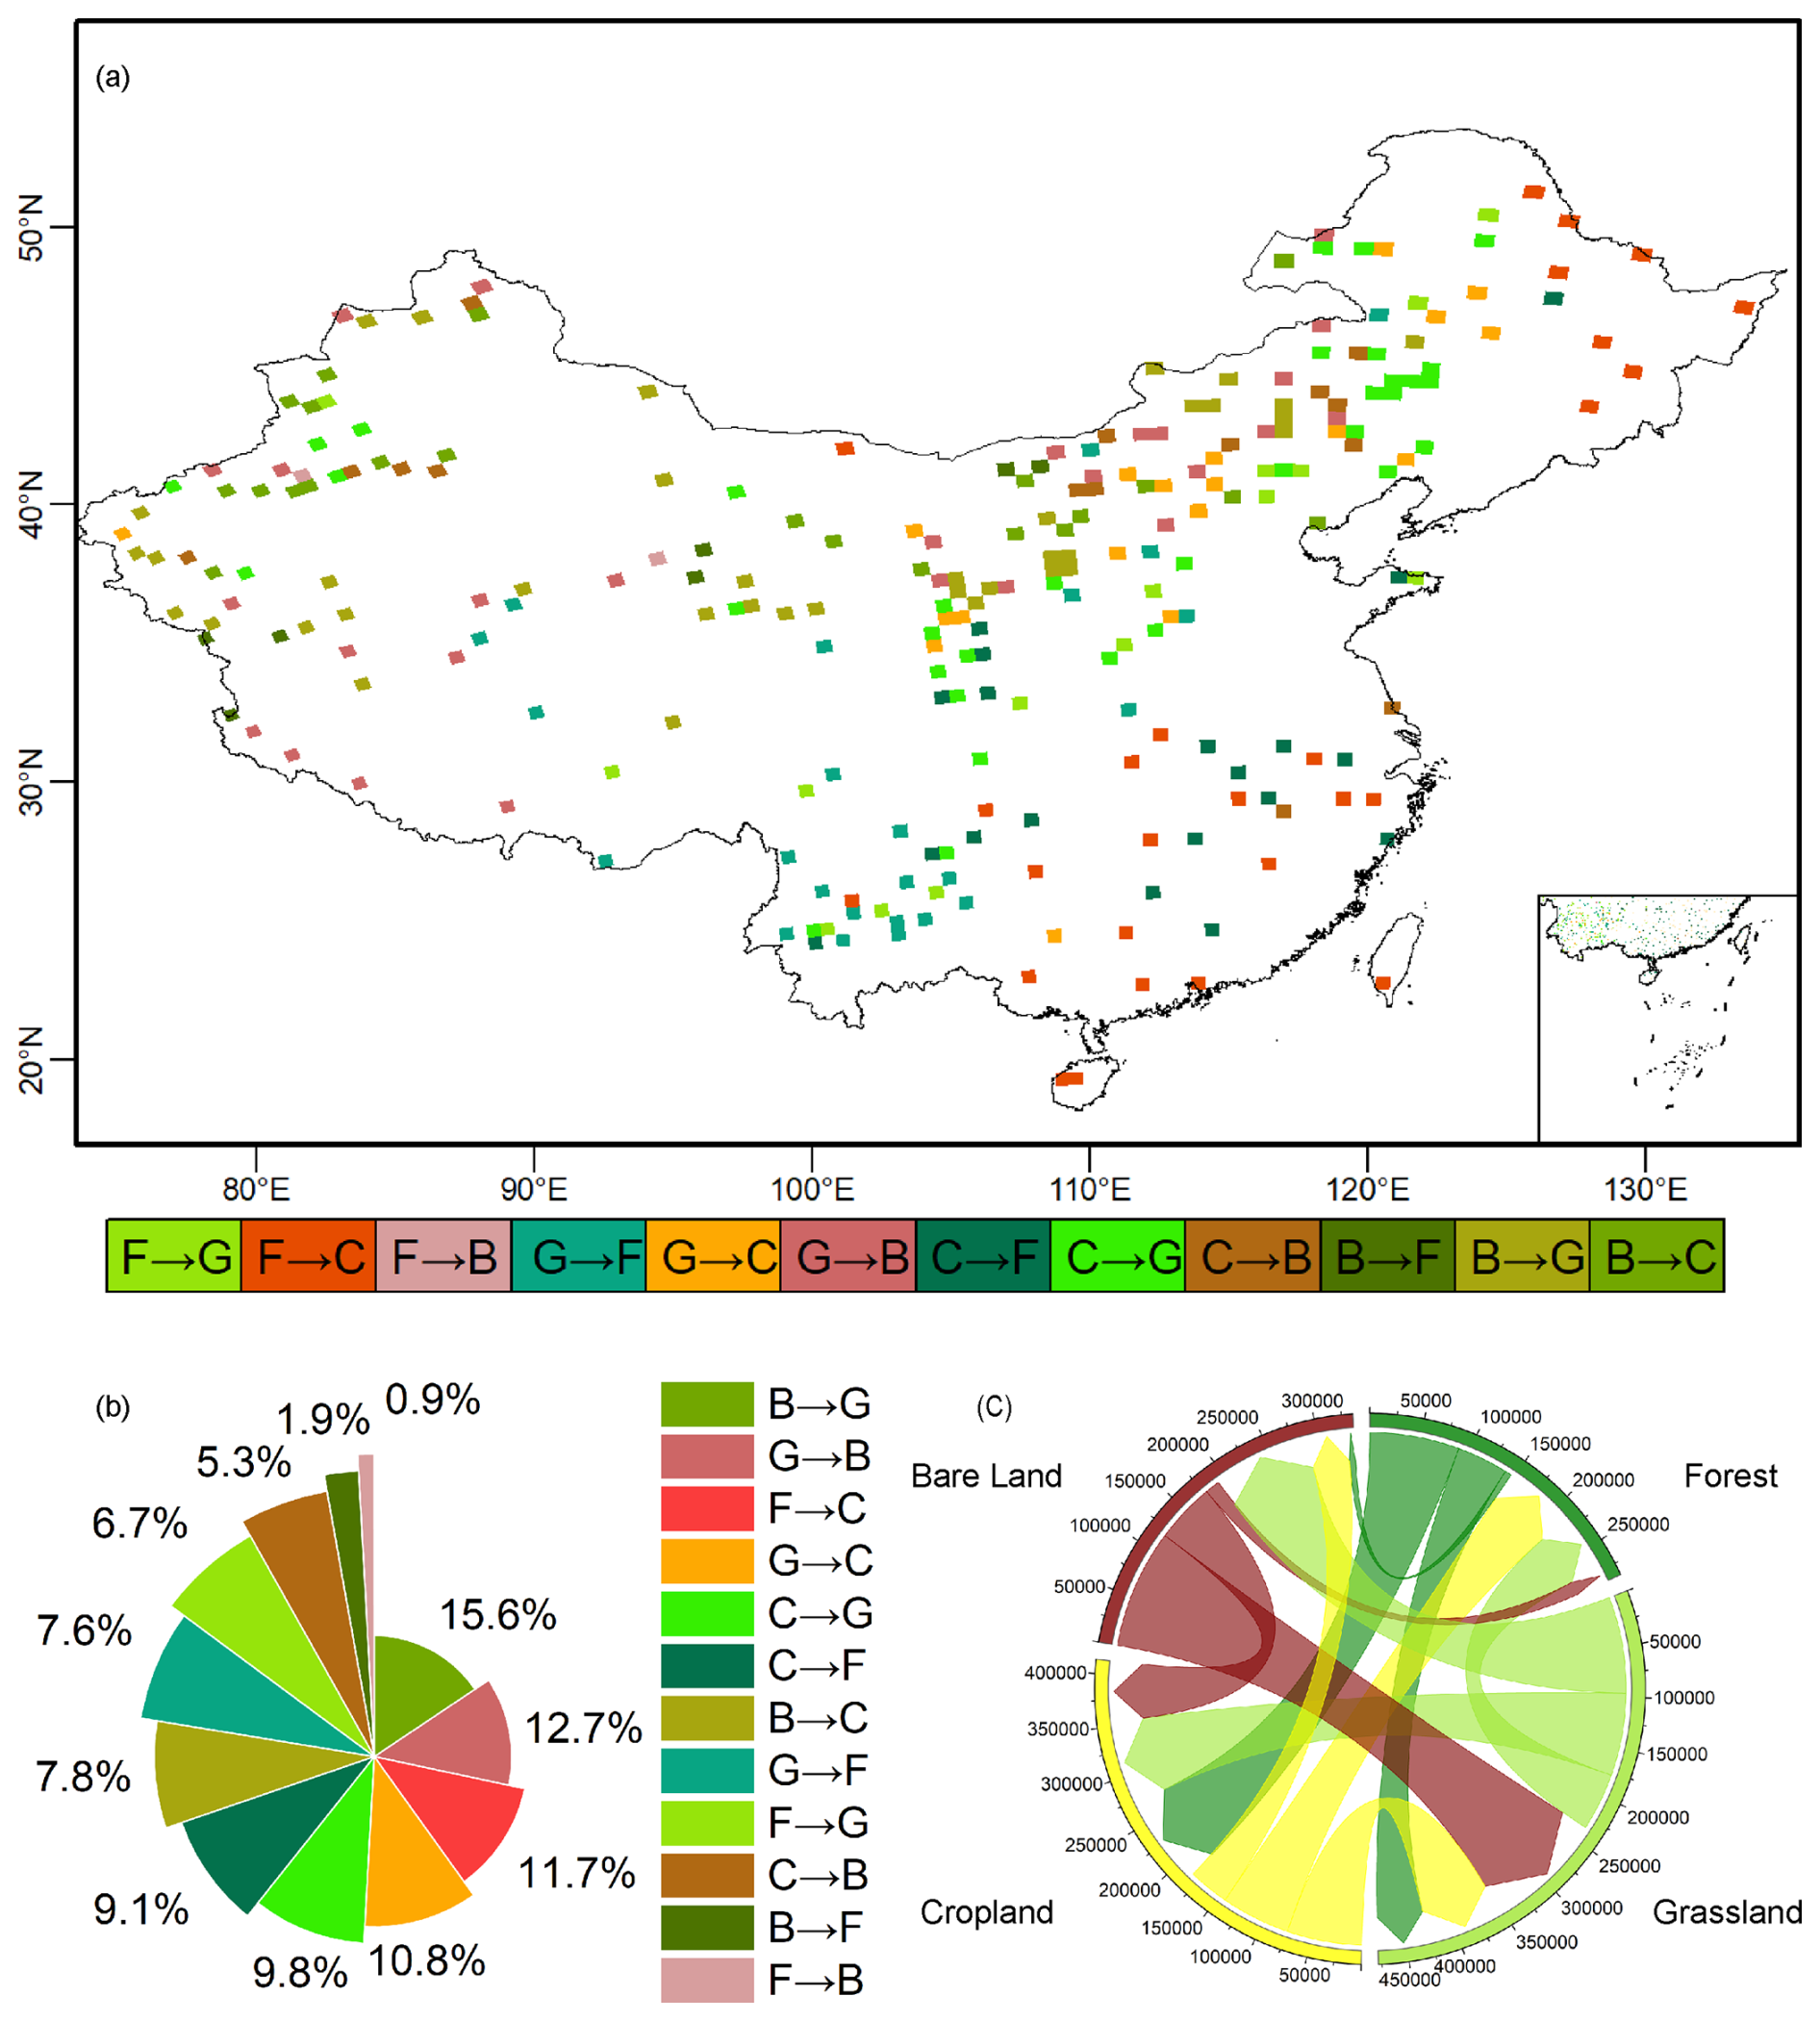
Figure 3Land use and land cover (LULC) changes from 1982–2017. (a) Spatial distribution of major conversion types among the four dominant LULC classes. F = forest, G = grassland, C = cropland, and B = bare land. The arrow indicates the direction of conversion from the original land-cover type to the converted type. (b) Percentage share of each major conversion type in the total converted area (%). (c) Chord diagram of the corresponding conversion flows, where the labels around the circle denote land-cover classes, and the surrounding axis values indicate converted area (km2).
3.2 Performance of the improved CCW model
As shown in Fig. 4a and b, the observed annual water yield (WY) and the simulated annual WY by the improved CCW model showed strong linear correlations (R2 = 0.7), with the regression line slope being 1.45, R2 being 0.7, and RMSE being 9.54 mm yr−1. By contrast, the initial model without WUE showed weaker skill (slope = 1.45, R2 = 0.68, RMSE = 9.62 mm yr−1), indicating that explicitly representing [CO2]-induced regulation of water-use efficiency measurably improves accuracy and reduces bias.
The estimated annual WY trends had distinct spatial patterns (Fig. 4c), which closely aligned with that of precipitation. Specifically, decrease trends in WY occurred in the central regions of the Yellow River Basin and the middle section of the Yangtze River Basin, while increase trends were found in other regions, with the southeast exhibiting the highest rate of increase.
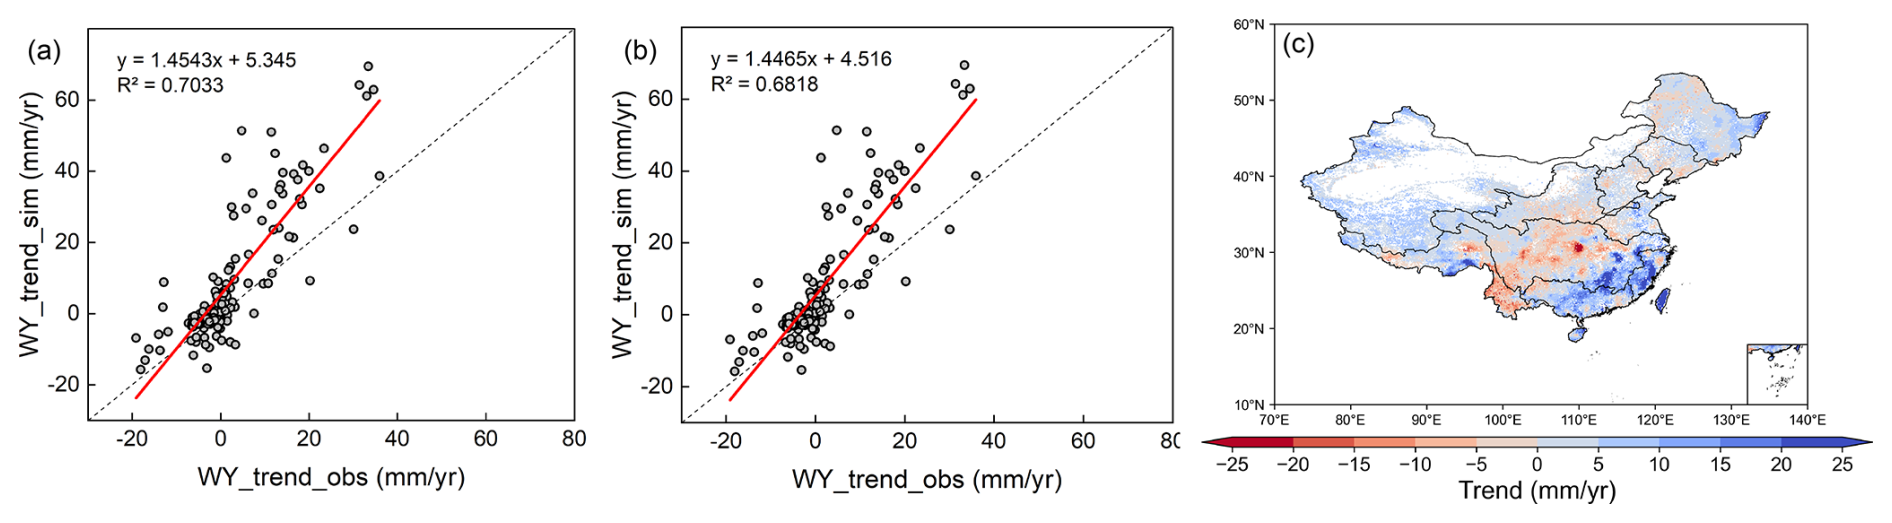
Figure 4(a) Validation of simulated WY trend using the improved CCW model; (b) validation of simulated WY trend using the original CCW model; (c) spatial distribution of WY trends under scenario S1 (actual situation) during 1982–2017.
3.3 Attribution analysis of annual WY changes
Figure 5 shows the distribution of WY changes caused by climate, vegetation, and [CO2] changes, integrating both absolute magnitude (Fig. 5a, c, e) and relative dominance (Fig. 5b, d, f) of their contributions. Climate-driven WY changes exhibited marked spatial heterogeneity, with absolute increases exceeding 15 mm yr−1 in southeastern China (Fig. 5a), corresponding to 60 %–90 % relative contributions (Fig. 5b). Central basins showed contrasting declines of 0–6 mm yr−1 under climate forcing, while northeastern transitional zones displayed mixed positive/negative absolute changes (Fig. 5a) despite maintaining 40 %–70 % relative climate dominance (Fig. 5b). This spatial heterogeneity aligned with precipitation change patterns (Fig. 2a).
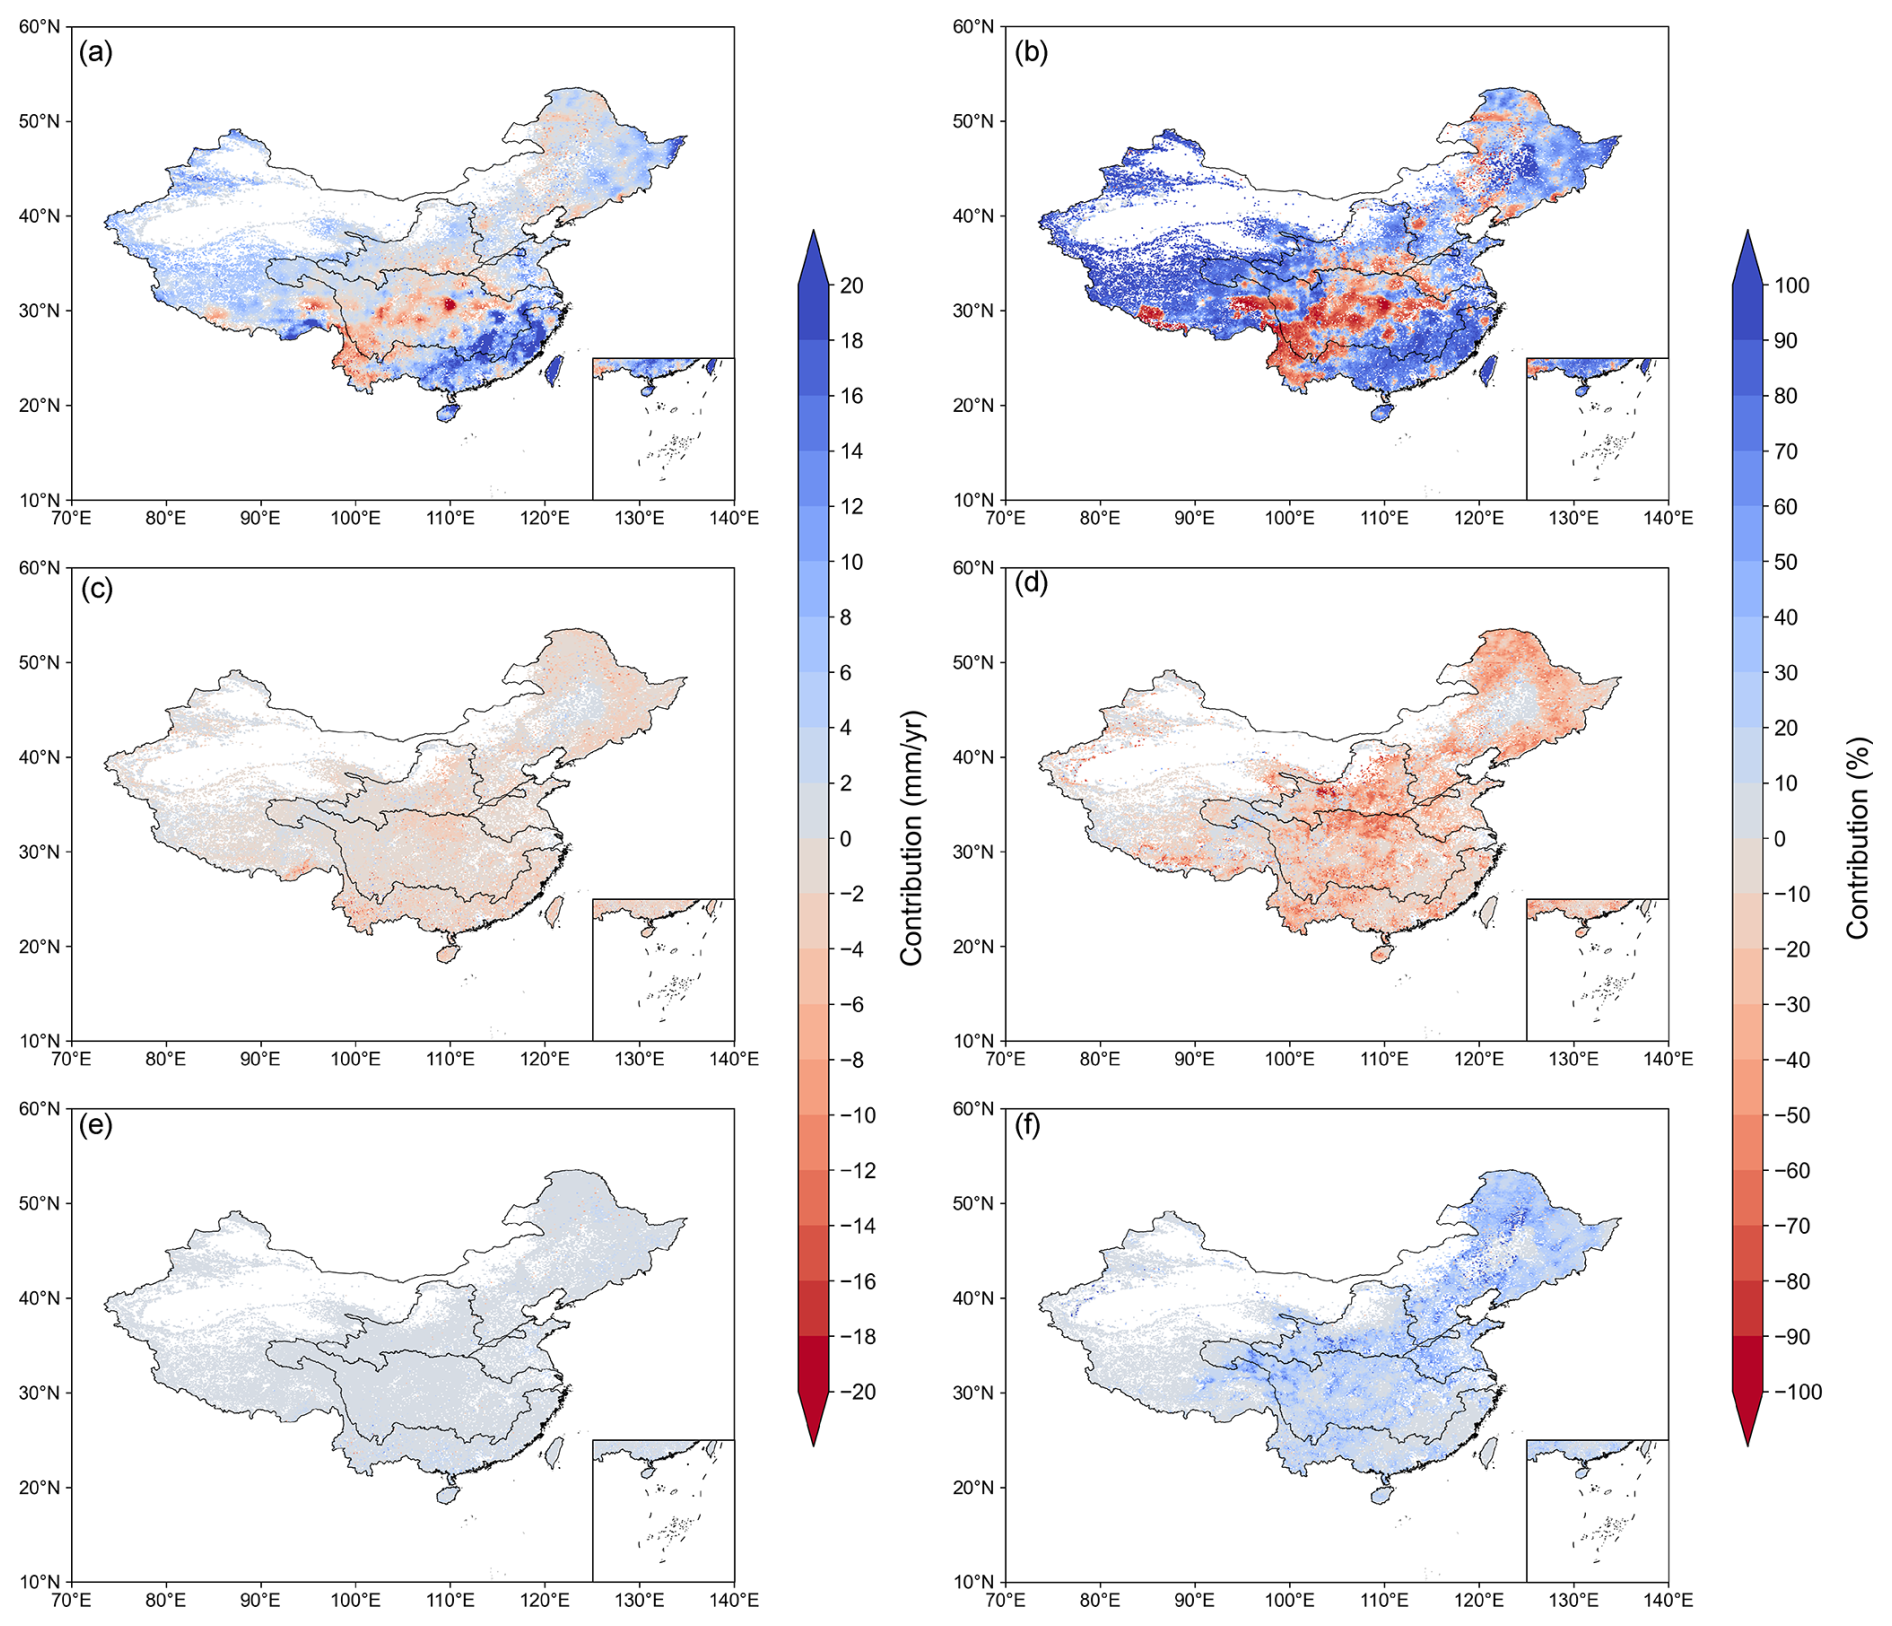
Figure 5The absolute contributions of (a) climate, (c) vegetation, and (e) [CO2], and the relative contributions of (b) climate, (d) vegetation, and (f) [CO2] to changes in WY trends for 1982–2017.
Vegetation-mediated WY reductions reached 0–6 mm yr−1 (Fig. 5c), accompanied by 0 %–60 % relative contributions (Fig. 5d). These effects originated from enhanced evapotranspiration through LULC changes and vegetation greening, particularly pronounced in central China. Specific regions in the Yangtze, Yellow, and northeastern rivers showed vegetation-driven relative contributions reaching 40 %–60 % (Fig. 5d). [CO2] effects generated limited direct absolute impacts (< 5 mm yr−1, Fig. 5e) but exerted 10 %–40 % relative influences (Fig. 5f) through stomatal closure mechanisms. This process partially counteracted vegetation-related WY decreases in transitional climates like northeastern China, where competing drivers created complex ecohydrological interactions (Fig. 5).
Figure 6 illustrated the spatial distribution of WY trend drivers over the past four decades. Climate change was the dominant factor of WY variation in more than 70 % regions, mainly in the Northwest, Southwest, Southeast, Pearl River basins, and other parts of the Yangtze and Yellow River basins. Vegetation changes ranked as the secondary control, dominating WY changes in parts of the Yangtze, Yellow, Songhua, Liao, and Hai Rivers. Remarkably, it was shown that the region where vegetation and [CO2] had the dominant influence mainly distributes within precipitation ranges of 400–1600 mm. [CO2]-induced effects were least influential at a national scale. This three-tiered hierarchy – climate changes as the primary forcing, vegetation changes as the secondary control, and [CO2] effects as a localized modifier – reveals how hydrological regimes govern the spatial succession of dominant drivers across China's diverse ecohydrological gradients.
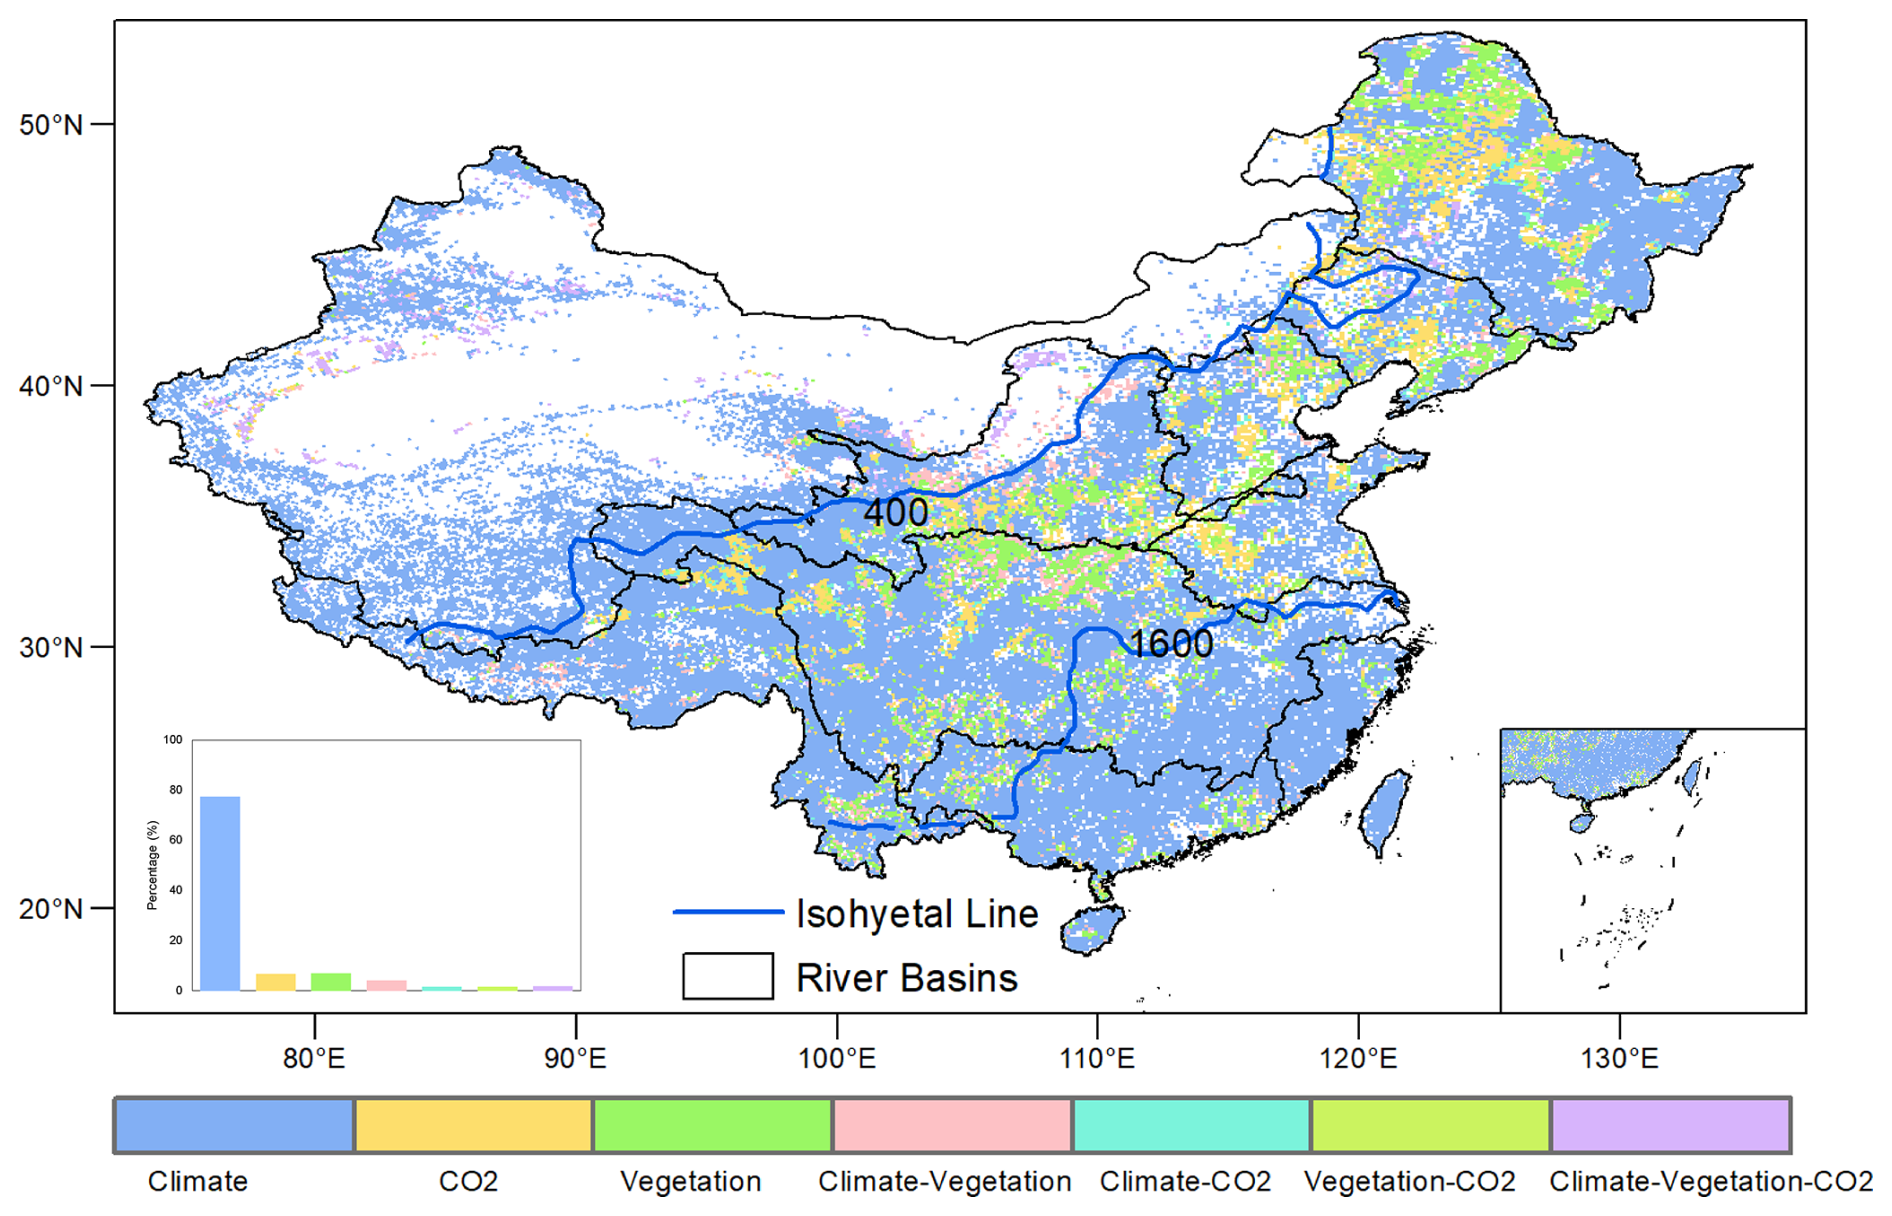
Figure 6Spatial distributions of dominant factors controlling WY change. Driving factors include climate, vegetation, and [CO2]. Climate: Areas where climate (e.g., precipitation, temperature) is the dominant factor influencing WY change; CO2: Areas where [CO2] is the primary driver of WY change; Vegetation: Areas where vegetation changes (e.g., NDVI, LULC) primarily drive WY changes. Climate-Vegetation: Areas where both climate and vegetation jointly influence WY; Climate-CO2: Areas where both climate and [CO2] jointly contribute to WY change; Vegetation-CO2: Areas where vegetation changes and [CO2] jointly control WY; Climate-Vegetation-CO2: Areas where the combined effect of climate, vegetation, and [CO2] jointly controls WY change. Additionally, the approximate isohyetal line shown in the figure were derived based on annual precipitation data from 1982–2017.
3.4 Elasticity of WY to main factors
The elasticity of WY to precipitation (εP), NDVI (εNDVI), and [CO2] (εCO2) exhibits distinct spatial patterns in Fig. 7. Nationally averaged elasticity coefficients showed that a 10 % increase in precipitation, [CO2], and NDVI altered WY by 15.5 % (εP=1.55), 5.5 % (εCO2=0.55), and −4.4 % (εNDVI = −0.44), respectively, indicating that, in terms of the sensitivity of runoff to changes in each factor, the ranking was precipitation > [CO2] > NDVI. The historical relative changes in precipitation (0.48 % yr−1), [CO2] (0.49 % yr−1), and NDVI (0.67 % yr−1), suggest that precipitation increased WY by 27.2 %, [CO2] increased WY by 9.97 %, and NDVI decreased WY by 10.7 % over 1982–2017. Therefore, although [CO2] had a higher elasticity than NDVI, its historical contribution to WY change was slightly smaller than that of vegetation.
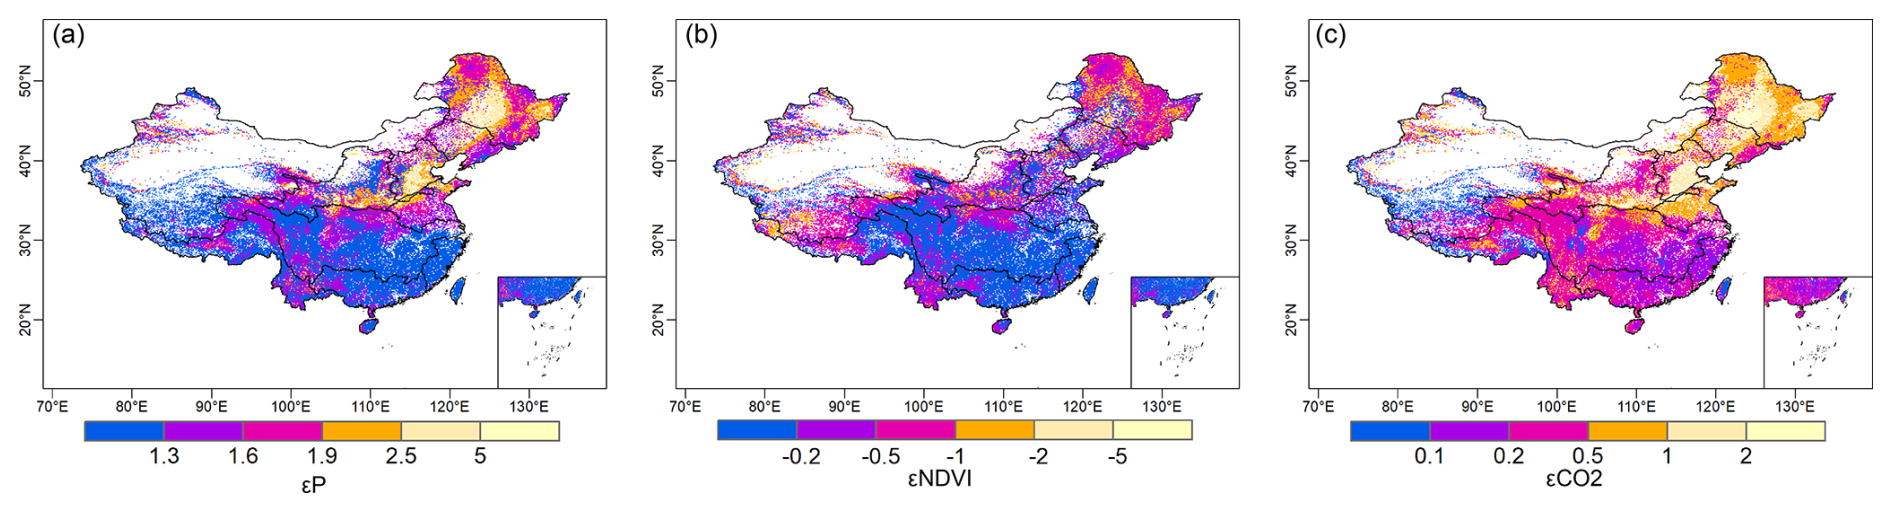
Figure 7Spatial distribution of elasticity coefficients of WY relative to changes in hydrological factors such as (a) annual precipitation, (b) NDVI, and (c) [CO2].
The elasticity coefficients of precipitation (εP), [CO2] (εCO2), and vegetation (|εNDVI|) all exhibited a coherent latitudinal decline across China's river basins, showing systematically higher sensitivity in northern regions than southern counterparts. Quantitatively, εP decreased from 2.09 in the Songhua River basin to 1.15 in the Southeastern Basin, accompanied by similar reductions in |εNDVI| (from 0.76 to 0.13) and εCO2 (from 1.08 to 0.16) (Table 3).
A distinct abrupt transition zone in elasticity coefficients was identified around 33° N, closely aligning with China's traditional North-South physiographic divide. Around the zone, elasticity coefficients exhibited an abrupt decline from the Yellow River Basin to the Yangtze River Basin. Specifically, the Yellow River Basin showed higher sensitivities to precipitation (εP=1.87), [CO2] (εCO2=0.86), and NDVI (εNDVI = −0.53), which were approximately 1.4, 2.8, and 2.8 times greater, respectively, than those in the Yangtze River Basin (εP=1.31, εCO2=0.31, εNDVI = −0.19).
Table 3Elasticity Coefficients of Runoff to Precipitation, NDVI, and CO2 in Different Watersheds.
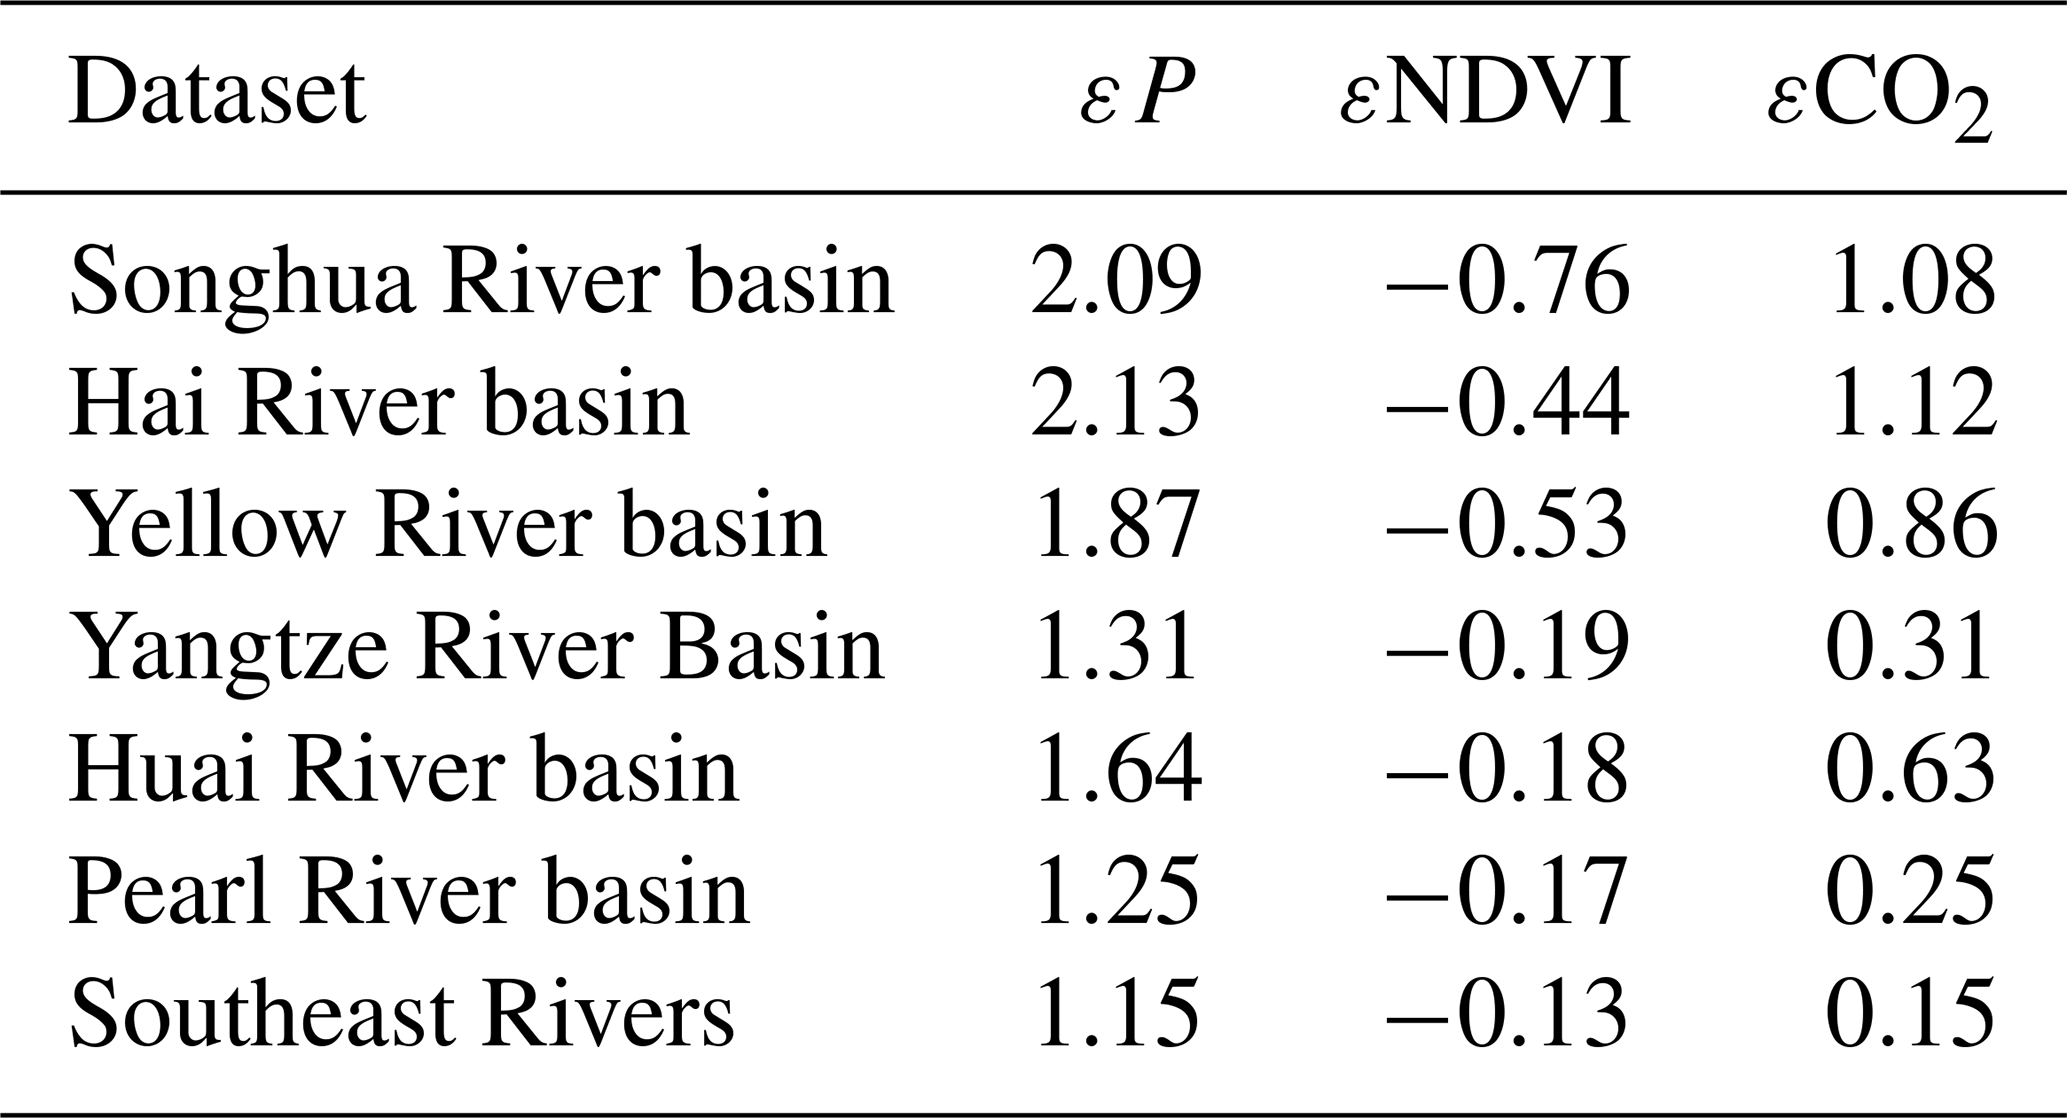
Note: Some LULC types were excluded from the analysis. Due to many missing data points, the Liao River, Southwest, and Northwest river basins were also omitted.
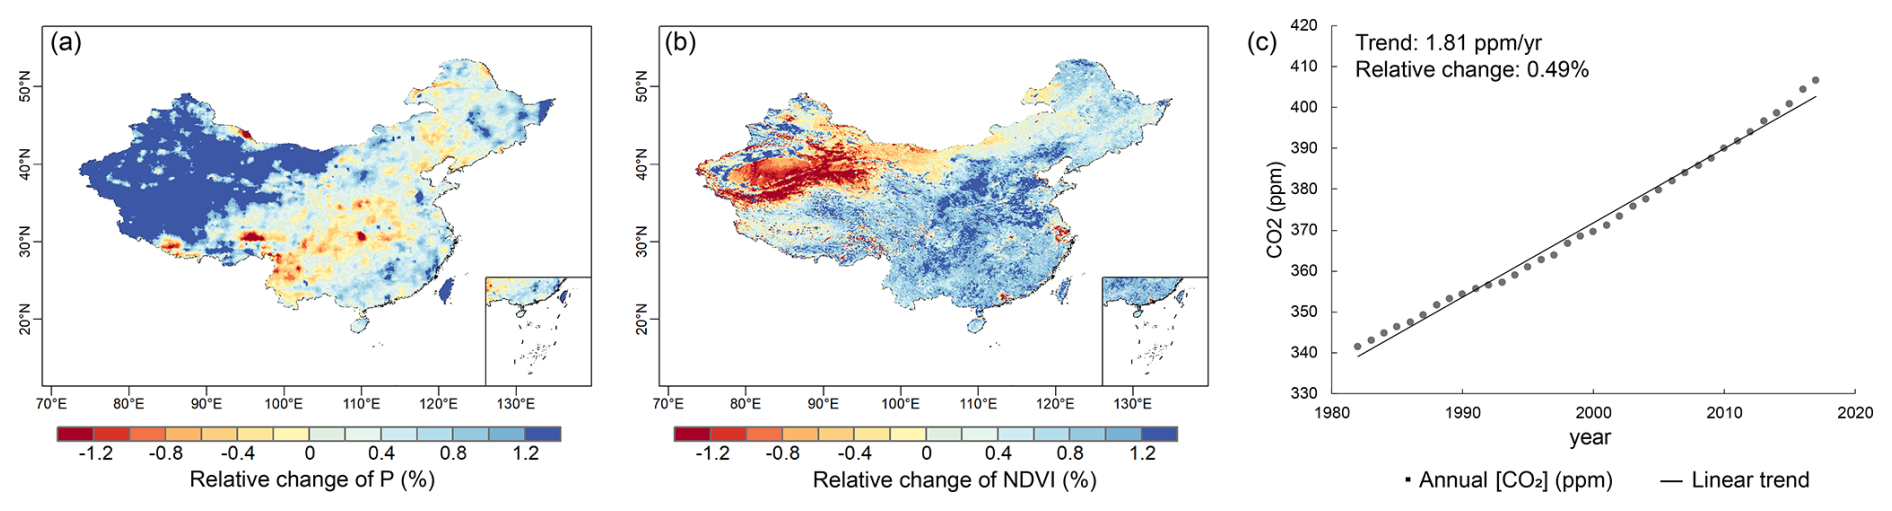
Figure 8Changes in different factors during 1982–2017: (a) relative change in annual precipitation, (b) relative change in NDVI, and (c) [CO2] with its trend and relative annual change rate.
4.1 Strength of the attribution analysis framework
This study developed an attribution framework based on the improved CCW model to separate the effects of climate change, vegetation structural change, and [CO2]-induced physiological changes on WY changes. A key strength of this framework is that it explicitly links vegetation dynamics and [CO2] effects to actual evapotranspiration at grid scale, rather than representing them indirectly through empirical catchment parameters or potential evapotranspiration adjustments.
First, the improved framework addresses a major limitation of Budyko approaches. Traditional Budyko approaches often attribute vegetation effects to temporal variations in the Budyko parameter n by either statistically regressing the Budyko parameter against vegetation proxies such as NDVI (Liu et al., 2024; Tan et al., 2023) or simplistically equating the Budyko parameter to vegetation effects (Li et al., 2020b; Zhou et al., 2023). In addition, some Budyko approaches account for [CO2] effects by adjusting potential evapotranspiration (Liu et al., 2024). These treatments can conflate vegetation change and [CO2] change with other catchment properties embedded in n (Zeng et al., 2020). Moreover, when [CO2] effects are represented through PET adjustments, their influence on WY is transmitted through the Budyko function and further constrained by n, making it difficult to isolate [CO2]-induced physiological effects from vegetation structural change and other land-surface controls. In contrast, our framework estimates actual ET through a carbon–water coupling structure and explicitly separates the effects of climate, LAI-related vegetation structural change, and [CO2]-driven physiological changes, thereby providing a more direct basis for attributing WY changes than Budyko approaches.
Second, compared with the original CCW model using a static UWUE, our framework replaces it with a dynamic WUE formulation that accounts for long-term WUE changes associated with variations in [CO2], VPD, and vegetation structure. Elevated [CO2] reduces stomatal aperture, thereby lowering stomatal conductance and transpiration flux while only modestly increasing carbon assimilation, leading to an overall enhancement in WUE. This process is represented by the Medlyn-type stomatal conductance model (Medlyn et al., 2011), which links photosynthetic rate (A), transpiration (T), and vapor pressure deficit (D) as:
where Ca is atmospheric CO2 concentration, Pa is air pressure, D is vapor pressure deficit, and g1 is an empirical slope parameter that quantifies plant sensitivity to [CO2] and humidity. This formulation also indicates that WUE varies with [CO2] and atmospheric water demand, rather than remaining constant over time. Incorporating this relationship into the CCW framework enables the model to distinguish NDVI-driven vegetation change effects on WY from [CO2]-induced stomatal effects. Therefore, this improvement is not merely a statistical refinement, but also a process-based modification that helps explain why [CO2] can partly offset vegetation-related WY reductions in some regions.
Third, the grid-scale implementation of the framework allows spatial heterogeneity in attribution results to be identified within basins. Many previous runoff attribution studies have been conducted at the basin scale (Liu et al., 2024, 2017; Yang et al., 2022), which is useful for summarizing overall basin responses but may mask substantial intra-basin differences. By conducting attribution at the grid scale, our framework captures spatial heterogeneity in WY controls within the same basin, distinguishing areas dominated by climatic variability from those more strongly affected by vegetation greening. This spatially explicit attribution provides more detailed and differentiated information for regional water resource assessment and ecological restoration planning within a basin.
4.2 New insights into attribution analysis
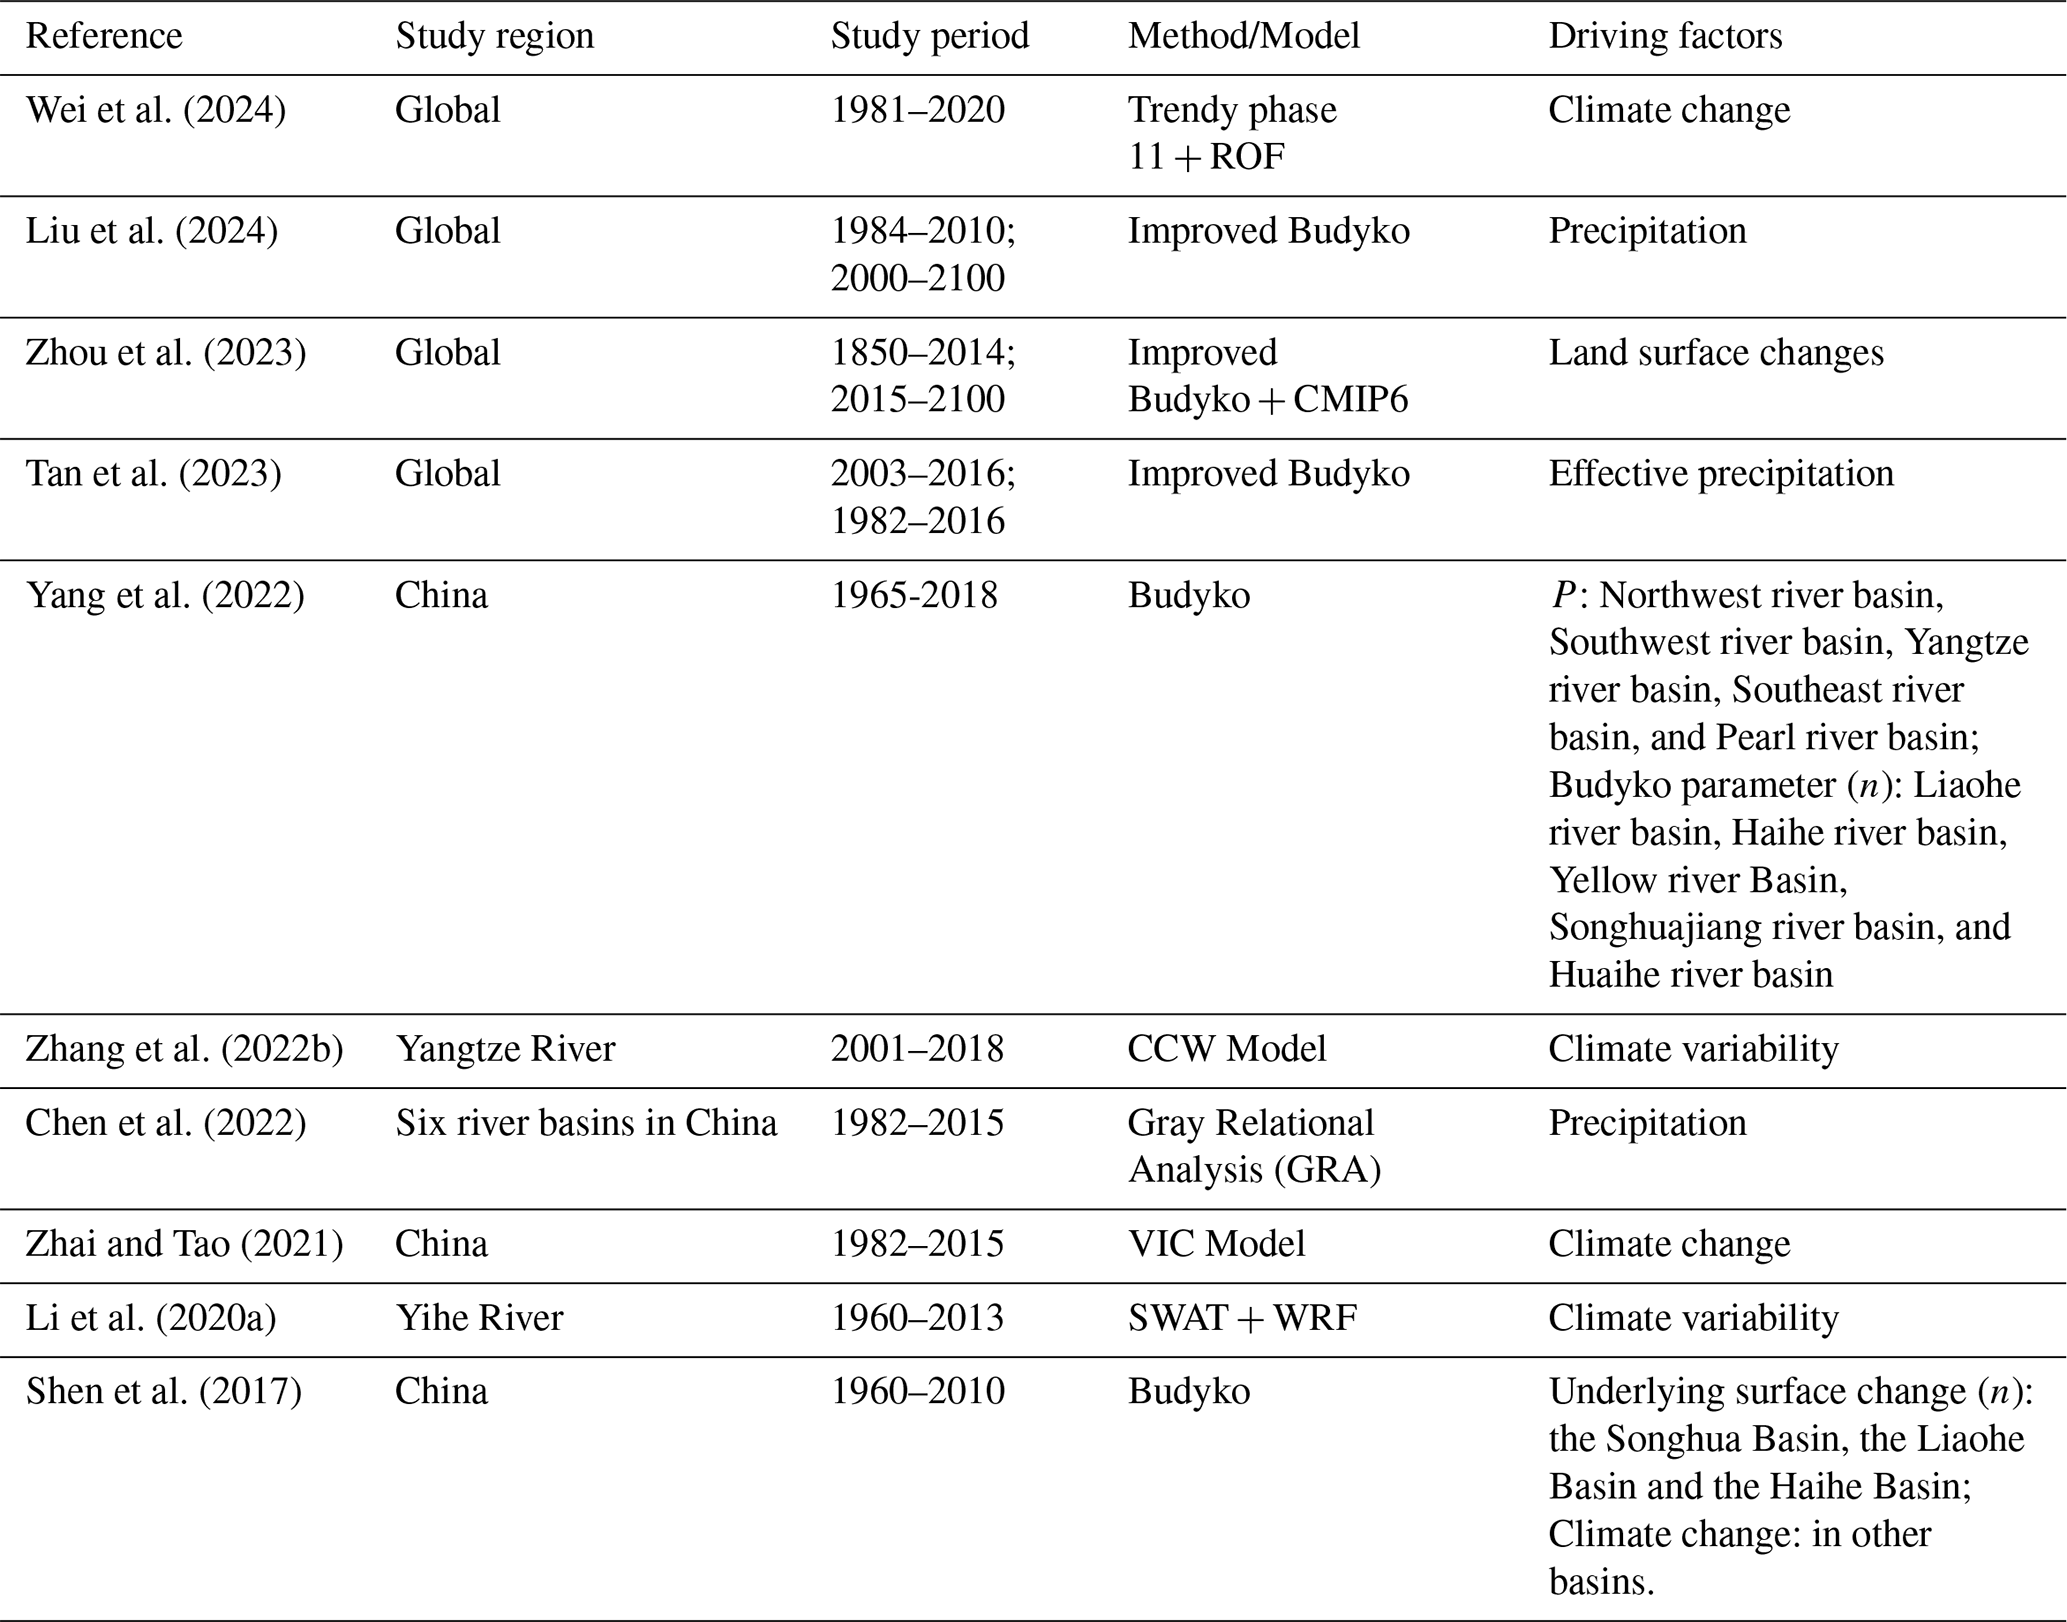
Our findings highlight climate change as the dominant driver of water yield (WY) changes (contributing > 70 %), which is consistent with previous assessments (Table 4). Climate impacts dominate in the Northwest and Southwest River Basins, as well as parts of the Yangtze, Yellow, Southeast, and Pearl River Basins. In contrast, vegetation and CO2 dominate WY change in central China (portions of the Yangtze, Yellow, Songhua, Liao, and Hai River basin). The spatial pattern is slightly distinct from previous studies (Table 4), with noticeable discrepancies in some regions. These discrepancies may arise from differences in study periods, as vegetation effects have become more pronounced after 2000 in several regions but may be weakened when averaged over longer historical periods. This basin-scale contrast is also consistent with a broader hydroclimatic gradient, as vegetation and [CO2] effects become relatively more important in the intermediate precipitation zone of 400–1600 mm. The relative importance of vegetation and [CO2] is not randomly distributed but is concentrated along transitional hydroclimatic zones, where water availability is sufficient to support vegetation growth yet remains sensitive to changes in evapotranspiration.
Table 4Comparative studies of the contribution of climate variability and vegetation to runoff changes.
Elasticity analysis (Sect. 3.4) revealed distinct sensitivities of WY to environmental drivers: precipitation exhibited the highest elasticity coefficient for the whole China (εP = 1.55), followed by [CO2] (εCO2=0.55) and NDVI (εNDVI = −0.44). However, spatial analysis showed that vegetation and [CO2] collectively dominated WY changes in the 400–1600 mm precipitation zones, despite their lower sensitivity rankings. The contribution of each driver is determined by its elasticity multiplying the magnitude of its change. In the 400–1600 mm precipitation zones, NDVI displayed a larger relative temporal variation compared with precipitation (Fig. 8), which fluctuated within a narrower range. Therefore, high elasticity does not necessarily indicate high historical contribution. The larger relative change in NDVI enhanced the contribution of vegetation to WY change despite its lower elasticity, whereas the historical contribution of [CO2] was limited by its slower accumulation rate (0.49 % yr−1) despite its relatively high elasticity.
Although the historical contribution of [CO2] was limited by its slow increase during 1982–2017, future [CO2] may substantially amplify its effect on WY. Projections from the CMIP6 SSP585 scenario indicate [CO2] will rise at 2.34 % yr−1, which is nearly five times faster than the historical rate (Cheng et al., 2022). Using the historical elasticity coefficient as a simple sensitivity-based approximation, the increase of [CO2] would drive a +1.29 % yr−1 increase in annual WY by 2100. By comparison, future NDVI will increase at approximately 0.59 % yr−1 under CMIP6 SSP585 (Li et al., 2025), its effect on WY would be only −0.26 % yr−1. Therefore, hydrological effect of rising [CO2] may be much larger than the direct effect of future vegetation greening and therefore should not be ignored in future WY assessments. However, this estimate assumes that the historical [CO2] elasticity remains unchanged and does not account for possible counteracting effects, such as rising VPD, drought stress, or saturation of WUE under elevated [CO2] (Adams et al., 2020; Li et al., 2023).
From a policy perspective, these spatial contrasts have distinct implications for regional water management. In regions primarily affected by vegetation change, such as the Yangtze and Yellow River basins, priority should be given to optimizing vegetation composition and preventing overgreening that may reduce runoff. Conversely, in regions primarily affected by climate change, such as Northwest and Southeast China, adaptive measures that emphasize precipitation variability, water storage capacity, and drought resilience are crucial. Tailoring water management strategies to these distinct regional conditions can enhance the effectiveness of both ecological restoration and climate adaptation programs across China.
4.3 Uncertainty in attribution analysis
This study used an improved CCW model to attribute annual WY changes in China to climate change, vegetation structural change, and [CO2]-induced physiological effects, providing a more mechanistic understanding of vegetation and [CO2] effects of hydrological responses. However, several limitations remain that need to be addressed in future work to improve the accuracy and robustness of the results.
First, the adopted WUE formulation is defined at the ecosystem scale, but the present implementation simplifies the interception term by assuming fi=0. Soil evaporation is still implicitly represented through the LAI-based partitioning term, whereas canopy interception is not explicitly allowed to vary across space or time. This simplification may bias the absolute magnitude of ET and WY, particularly in humid and forested regions, although its influence on long-term WY trends is expected to be small. Nevertheless, given the small interannual variation of fi (Zhao et al., 2022), its influence on runoff trends is negligible in our study (Cheng et al., 2017). Future work should prioritize its explicit calculation.
Second, the attribution framework treats climate, vegetation, and [CO2] as separate drivers, whereas these factors interact with each other in real ecohydrological systems. Vegetation exhibits interactions and feedbacks with climate, making it difficult to strictly separate the impacts of climate change, vegetation dynamics, and [CO2] on hydrological responses. Changes in vegetation, such as NDVI, reflect a combination of climate change, human activities (e.g., reforestation and irrigation), and natural vegetation growth. Additionally, vegetation greening in upwind regions can increase atmospheric moisture, potentially enhancing precipitation downwind (Zhang et al., 2021a), which may counteract some of the negative impacts of increased evapotranspiration on local WY. Although the climate data used in our model may implicitly capture some of these feedbacks, they cannot be explicitly separated in this analysis. This limitation also affects the simple elasticity-based SSP585 estimate of [CO2] effects, because the estimate does not account for concurrent changes in VPD, drought stress, or possible saturation of WUE under elevated [CO2]. Consequently, our results represent an attempt to estimate the direct first-order net impacts of climate, vegetation greening, and [CO2] increase on WY (Zhang et al., 2021b). Future research should adopt more comprehensive models that consider soil-vegetation-atmosphere interactions to better differentiate the contributions of each driving factor to WY.
Third, the improved CCW model does not incorporate certain human activities, such as large-scale irrigation, groundwater pumping, and reservoir regulation, which also limits the assumption that WY = P − ET with negligible storage change. This assumption is mainly appropriate at the annual scale and becomes less reliable in regions where long-term groundwater depletion or reservoir operation substantially alters water storage and runoff routing. For instance, irrigation can sustain vegetation greening during dry seasons, potentially amplifying the vegetation–climate feedback on water yield. Incorporating such anthropogenic processes into the CCW framework through coupled irrigation and water management modules would enable more comprehensive attribution analyses in future studies. Our research also excludes water bodies and built-up land. While urbanization can increase flood risks due to the growing proportion of impervious surfaces (Wasko and Sharma, 2017), these land-use changes represent a small fraction of China's land area.
In this study, we improved the coupled carbon and water (CCW) model incorporating a dynamic water use efficiency (WUE) calculation to explicitly represent the [CO2] physiological feedback on water yield (WY). This improvement enabled a comprehensive national-scale assessment quantifying the relative contributions of climate forcing, vegetation structural changes, and [CO2]-driven stomatal changes to WY dynamics in China. The main conclusions are as follows:
-
The improved CCW model effectively simulated WY variations in most basins under elevated [CO2] scenarios, demonstrating its applicability and reliability for modeling WY changes.
-
Climate change, particularly variations in precipitation, emerged as the primary driver influencing WY, with significant regional disparities in its effects. Vegetation change constituted the second most critical factor, predominantly resulting in WY reduction, notably in central China, whereas the effect of [CO2]-induced stomatal closure on WY was comparatively minor. Spatial analysis aligned with isohyetal lines further revealed that vegetation change and [CO2] exerted greater influence within the 400–1600 mm precipitation range.
-
The elasticity analysis of WY indicated that northern basins exhibit higher sensitivity to influencing factors, whereas southern basins demonstrate relatively lower elasticity. Specifically, the absolute elasticity coefficients for the whole China were ranked in descending order as follows: precipitation > [CO2] > NDVI. Thus, under SSP585, rising [CO2] may have a stronger effect on future WY than vegetation greening, with an estimated +1.29 % yr−1 WY effect compared with −0.26 % yr−1 from projected NDVI increases, although VPD changes and possible WUE saturation are not considered.
These insights provide a nuanced understanding of regional hydrological responses, which is essential for sustainable water resource management under changing environment.
The Coupled Carbon and Water (CCW) model is a data-driven, remote sensing-based model that estimates gross primary productivity (GPP) and evapotranspiration (ET) through a coupled carbon–water formulation (Zhang et al., 2016b). In the original CCW model, GPP is estimated using a light-use efficiency approach:
where APAR is the absorbed photosynthetically active radiation (MJ m−2), which is calculated as the product of incident photosynthetically active radiation (PAR) and the fraction of PAR absorbed by vegetation (FPAR). PAR is typically assumed to be 45 % of the total shortwave radiation (Running et al., 2000), and FPAR is determined by the normalized difference vegetation index (NDVI) (Sims et al., 2005). ε is the realized light-use efficiency (g C MJ−1), which is calculated by multiplying the potential light-use efficiency (εpot) and environmental scalars for diffuse radiation (Rs), temperature (Ts), and moisture stress (Ws).
ET is then derived from GPP using the underlying water-use efficiency (UWUE):
where VPD is vapor pressure deficit and UWUE is the underlying water-use efficiency. The UWUE parameter is prescribed by vegetation type and is calibrated using FLUXNET observations (Zhou et al., 2014; Zhang et al., 2016b). Therefore, UWUE is treated as static in the original CCW framework and does not explicitly vary with rising [CO2], atmospheric pressure, vegetation structure, or long-term physiological adjustment.
The source code for the attribution framework used in this research is available by contacting the authors upon reasonable request.
Datasets used for driving models were obtained from different sources described in Table 1. All the data related to our results in this study can be found online: the NDVI data (https://doi.org/10.6084/m9.figshare.c.7002225.v1, Li, 2024; Li et al., 2024a); the climate data (https://www.tpdc.ac.cn/zh-hans/data/8028b944-daaa-4511-8769-965612652c49/, last access: 1 June 2026); the land use and land cover (LULC) data (https://doi.org/10.5281/zenodo.8239305, Liu et al., 2023); and the [CO2] (https://gml.noaa.gov/ccgg/trends/data.html, last access: 1 June 2026), except for the streamflow records for hydrological gauging stations, which are available upon reasonable request.
HS designed the study, developed the model code, did the simulation experiments, and wrote the first draft of the paper. HY designed the research and edited the manuscript. CL provided feedback on the results and edited the manuscript.
The contact author has declared that none of the authors has any competing interests.
Publisher's note: Copernicus Publications remains neutral with regard to jurisdictional claims made in the text, published maps, institutional affiliations, or any other geographical representation in this paper. The authors bear the ultimate responsibility for providing appropriate place names. Views expressed in the text are those of the authors and do not necessarily reflect the views of the publisher.
This research was supported by the China National Key R&D Program (grant no. 2024YFF1306901) and Open Research Fund Program of the State Key Laboratory of Hydroscience and Engineering (grant no. sklhse-KF-2026-A-03).
This paper was edited by Yongping Wei and reviewed by two anonymous referees.
Adams, M. A., Buckley, T. N., and Turnbull, T. L.: Diminishing CO2-driven gains in water-use efficiency of global forests, Nat. Clim. Change, 10, 466–471, https://doi.org/10.1038/s41558-020-0747-7, 2020.
Chen, C., Park, T., Wang, X., Piao, S., Xu, B., Chaturvedi, R. K., Fuchs, R., Brovkin, V., Ciais, P., Fensholt, R., Tømmervik, H., Bala, G., Zhu, Z., Nemani, R. R., and Myneni, R. B.: China and India lead in greening of the world through land-use management, Nat. Sustain., 2, 122–129, https://doi.org/10.1038/s41893-019-0220-7, 2019.
Chen, S., Fu, Y. H., Geng, X., Hao, Z., Tang, J., Zhang, X., Xu, Z., and Hao, F.: Influences of Shifted Vegetation Phenology on Runoff Across a Hydroclimatic Gradient, Front. Plant Sci., 12, 802664, https://doi.org/10.3389/fpls.2021.802664, 2022.
Cheng, L., Zhang, L., Wang, Y.-P., Canadell, J. G., Chiew, F. H. S., Beringer, J., Li, L., Miralles, D. G., Piao, S., and Zhang, Y.: Recent increases in terrestrial carbon uptake at little cost to the water cycle, Nat. Commun., 8, 110, https://doi.org/10.1038/s41467-017-00114-5, 2017.
Cheng, W., Dan, L., Deng, X., Feng, J., Wang, Y., Peng, J., Tian, J., Qi, W., Liu, Z., Zheng, X., Zhou, D., Jiang, S., Zhao, H., and Wang, X.: Global monthly gridded atmospheric carbon dioxide concentrations under the historical and future scenarios, Sci. Data, 9, 83, https://doi.org/10.1038/s41597-022-01196-7, 2022.
Gan, G., Liu, Y., and Sun, G.: Understanding interactions among climate, water, and vegetation with the Budyko framework, Earth-Sci. Rev., 212, 103451, https://doi.org/10.1016/j.earscirev.2020.103451, 2021.
Gutman, G. and Ignatov, A.: The derivation of the green vegetation fraction from NOAA/AVHRR data for use in numerical weather prediction models, Int. J. Remote Sens., 19, 1533–1543, https://doi.org/10.1080/014311698215333, 1998.
He, J., Yang, K., Tang, W., Lu, H., Qin, J., Chen, Y., and Li, X.: The first high-resolution meteorological forcing dataset for land process studies over China, Sci. Data, 7, 25, https://doi.org/10.1038/s41597-020-0369-y, 2020.
Howell, T. A. and Dusek, D. A.: Comparison of Vapor-Pressure-Deficit Calculation Methods – Southern High Plains, J. Irrig. Drain Eng., 121, 191–198, https://doi.org/10.1061/(ASCE)0733-9437(1995)121:2(191), 1995.
Jia, Y., Li, C., Yang, H., Yang, W., and Liu, Z.: Assessments of three evapotranspiration products over China using extended triple collocation and water balance methods, J. Hydrol., 614, 128594, https://doi.org/10.1016/j.jhydrol.2022.128594, 2022.
Jiao, Y., Lei, H., Yang, D., Huang, M., Liu, D., and Yuan, X.: Impact of vegetation dynamics on hydrological processes in a semi-arid basin by using a land surface-hydrology coupled model, J. Hydrology, 551, 116–131, https://doi.org/10.1016/j.jhydrol.2017.05.060, 2017.
Lammertsma, E. I., Boer, H. J. D., Dekker, S. C., Dilcher, D. L., Lotter, A. F., and Wagner-Cremer, F.: Global CO2 rise leads to reduced maximum stomatal conductance in Florida vegetation, P. Natl. Acad. Sci. USA, 108, 4035–4040, https://doi.org/10.1073/pnas.1100371108, 2011.
Li, A., Yin, S., Li, N., and Shi, C.: Comprehensive Analysis of the Driving Forces Behind NDVI Variability in China Under Climate Change Conditions and Future Scenario Projections, Atmosphere, 16, 738, https://doi.org/10.3390/atmos16060738, 2025.
Li, B., Shi, X., Lian, L., Chen, Y., Chen, Z., and Sun, X.: Quantifying the effects of climate variability, direct and indirect land use change, and human activities on runoff, J. Hydrol., 584, 124684, https://doi.org/10.1016/j.jhydrol.2020.124684, 2020a.
Li, F., Xiao, J., Chen, J., Ballantyne, A., Jin, K., Li, B., Abraha, M., and John, R.: Global water use efficiency saturation due to increased vapor pressure deficit, Science, 381, 672–677, https://doi.org/10.1126/science.adf5041, 2023.
Li, H.: A daily gap-free normalized difference vegetation index product from 1981 to 2023 in China, figshare [data set], https://doi.org/10.6084/m9.figshare.c.7002225.v1, 2024.
Li, H., Cao, Y., Xiao, J., Yuan, Z., Hao, Z., Bai, X., Wu, Y., and Liu, Y.: A daily gap-free normalized difference vegetation index dataset from 1981 to 2023 in China, Sci. Data, 11, 527, https://doi.org/10.1038/s41597-024-03364-3, 2024a.
Li, H., Shi, C., Zhang, Y., Ning, T., Sun, P., Liu, X., Ma, X., Liu, W., and Collins, A. L.: Using the Budyko hypothesis for detecting and attributing changes in runoff to climate and vegetation change in the soft sandstone area of the middle Yellow River basin, China, Sci. Total Environ., 703, 135588, https://doi.org/10.1016/j.scitotenv.2019.135588, 2020b.
Li, X., Xu, X., Sonnenborg, T. O., Andreasen, M., and He, C.: Effect of ecological restoration on evapotranspiration and water yield in the agro-pastoral ecotone in northern China during 2000–2018, J. Hydrol., 638, 131531, https://doi.org/10.1016/j.jhydrol.2024.131531, 2024b.
Liang, L., Han, Z., Chen, W., Li, J., Liang, M., and Shen, S.: The source, transport, deposition and direct radiative effect of mineral dust over western China: A modeling study of July 2022 with focus on the Tibetan Plateau, Atmos. Res., 311, 107708, https://doi.org/10.1016/j.atmosres.2024.107708, 2024.
Liu, C., Feng, S., Zhang, Q., Hu, J., Ma, N., Ci, H., Kong, D., and Gu, X.: Critical influence of vegetation response to rising CO2 on runoff changes, Sci. Total Environ., 906, 167717, https://doi.org/10.1016/j.scitotenv.2023.167717, 2024.
Liu, J., Zhang, Q., Singh, V. P., and Shi, P.: Contribution of multiple climatic variables and human activities to streamflow changes across China, J. Hydrol., 545, 145–162, https://doi.org/10.1016/j.jhydrol.2016.12.016, 2017.
Liu, L., Zhang, X., and Zhao, T.: GLC_FCS30D: the first global 30-m land-cover dynamic monitoring product with fine classification system from 1985 to 2022, Zenodo [data set], https://doi.org/10.5281/zenodo.8239305, 2023.
Ma, T., Wang, T., Yang, D., and Yang, S.: Impacts of vegetation restoration on water resources and carbon sequestration in the mountainous area of Haihe River basin, China, Sci. Total Environ., 869, 161724, https://doi.org/10.1016/j.scitotenv.2023.161724, 2023.
Medlyn, B. E., Duursma, R. A., Eamus, D., Ellsworth, D. S., Prentice, I. C., Barton, C. V. M., Crous, K. Y., De Angelis, P., Freeman, M., and Wingate, L.: Reconciling the optimal and empirical approaches to modelling stomatal conductance: Reconciling optimal and empirical stomatal models, Glob. Change Biol., 17, 2134–2144, https://doi.org/10.1111/j.1365-2486.2010.02375.x, 2011.
Mu, S., Zhou, S., Chen, Y., Li, J., Ju, W., and Odeh, I. O. A.: Assessing the impact of restoration-induced land conversion and management alternatives on net primary productivity in Inner Mongolian grassland, China, Glob. Planet. Change, 108, 29–41, https://doi.org/10.1016/j.gloplacha.2013.06.007, 2013.
Nkiaka, E., Bryant, R. G., and Dembélé, M.: Quantifying Sahel Runoff Sensitivity to Climate Variability, Soil Moisture and Vegetation Changes Using Analytical Methods, Earth Syst. Environ., 9, 491–504, https://doi.org/10.1007/s41748-024-00464-3, 2025.
Ogutu, B. O., D'Adamo, F., and Dash, J.: Impact of vegetation greening on carbon and water cycle in the African Sahel-Sudano-Guinean region, Glob. Planet. Change, 202, 103524, https://doi.org/10.1016/j.gloplacha.2021.103524, 2021.
Peng, H., Tague, C., and Jia, Y.: Evaluating the eco-hydrologic impacts of reforestation in the Loess Plateau, China, using an eco-hydrologic model, Ecohydrology, 9, 498–513, https://doi.org/10.1002/eco.1652, 2016.
Piao, S., Friedlingstein, P., Ciais, P., De Noblet-Ducoudré, N., Labat, D., and Zaehle, S.: Changes in climate and land use have a larger direct impact than rising CO2 on global river runoff trends, P. Natl. Acad. Sci. USA, 104, 15242–15247, https://doi.org/10.1073/pnas.0707213104, 2007.
Rahman, G., Farooq, U., Jung, M.-K., and Kwon, H.-H.: Spatiotemporal vegetation dynamics in South Asia (2001–2023): roles of climate and anthropogenic activities, Geosci. Lett., 12, 31, https://doi.org/10.1186/s40562-025-00403-8, 2025.
Running, S. W., Thornton, P. E., Nemani, R., and Glassy, J. M.: Global Terrestrial Gross and Net Primary Productivity from the Earth Observing System, in: Methods in Ecosystem Science, edited by: Sala, O. E., Jackson, R. B., Mooney, H. A., and Howarth, R. W., Springer New York, New York, NY, 44–57, https://doi.org/10.1007/978-1-4612-1224-9_4, 2000.
Sen, P. K.: Estimates of the Regression Coefficient Based on Kendall's Tau, J. Am. Stat. Assoc., 63, 1379–1389, https://doi.org/10.1080/01621459.1968.10480934, 1968.
Serrano-Notivoli, R., Martínez-Salvador, A., García-Lorenzo, R., Espín-Sánchez, D., and Conesa-García, C.: Rainfall–runoff relationships at event scale in western Mediterranean ephemeral streams, Hydrol. Earth Syst. Sci., 26, 1243–1260, https://doi.org/10.5194/hess-26-1243-2022, 2022.
Shen, Q., Cong, Z., and Lei, H.: Evaluating the impact of climate and underlying surface change on runoff within the Budyko framework: A study across 224 catchments in China, J. Hydrol., 554, 251–262, https://doi.org/10.1016/j.jhydrol.2017.09.023, 2017.
Sims, D. A., Rahman, A. F., Cordova, V. D., Baldocchi, D. D., Flanagan, L. B., Goldstein, A. H., Hollinger, D. Y., Misson, L., Monson, R. K., Schmid, H. P., Wofsy, S. C., and Xu, L.: Midday values of gross CO2 flux and light use efficiency during satellite overpasses can be used to directly estimate eight-day mean flux, Agr. Forest Meteorol., 131, 1–12, https://doi.org/10.1016/j.agrformet.2005.04.006, 2005.
Tan, X., Tan, X., Liu, B., and Huang, Z.: Contribution of changes in vegetation composition and climate variability on streamflow across the global watersheds, CATENA, 232, 107394, https://doi.org/10.1016/j.catena.2023.107394, 2023.
Tan, X., Jia, Y., Yang, D., Niu, C., and Hao, C.: Impact ways and their contributions to vegetation-induced runoff changes in the Loess Plateau, J. Hydrol., 51, 101630, https://doi.org/10.1016/j.ejrh.2023.101630, 2024.
Theil, H.: A Rank-Invariant Method of Linear and Polynomial Regression Analysis, in: Henri Theil's Contributions to Economics and Econometrics, Vol. 23, edited by: Raj, B. and Koerts, J., Springer Netherlands, Dordrecht, 345–381, https://doi.org/10.1007/978-94-011-2546-8_20, 1992.
Wang, D. L., Feng, H. M., Zhang, B. Z., Wei, Z., and Tian, Y. L.: Quantifying the impacts of climate change and vegetation change on decreased runoff in china's yellow river basin, Ecohydrol. Hydrobiol., 22, 310–322, https://doi.org/10.1016/j.ecohyd.2021.10.002, 2022.
Wasko, C. and Sharma, A.: Global assessment of flood and storm extremes with increased temperatures, Sci. Rep., 7, 7945, https://doi.org/10.1038/s41598-017-08481-1, 2017.
Wei, H., Zhang, Y., Huang, Q., Chiew, F. H. S., Luan, J., Xia, J., and Liu, C.: Direct vegetation response to recent CO2 rise shows limited effect on global streamflow, Nat. Commun., 15, 9423, https://doi.org/10.1038/s41467-024-53879-x, 2024.
Xiao, M., Gao, M., Vogel, R. M., and Lettenmaier, D. P.: Runoff and Evapotranspiration Elasticities in the Western United States: Are They Consistent With Dooge's Complementary Relationship?, Water Resour. Res., 56, e2019WR026719, https://doi.org/10.1029/2019WR026719, 2020.
Xu, Z., Jiang, Y., Jia, B., and Zhou, G.: Elevated-CO2 Response of Stomata and Its Dependence on Environmental Factors, Front. Plant Sci., 7, https://doi.org/10.3389/fpls.2016.00657, 2016.
Xue, B., A, Y., Wang, G., Helman, D., Sun, G., Tao, S., Liu, T., Yan, D., Zhao, T., Zhang, H., Chen, L., Sun, W., and Xiao, J.: Divergent Hydrological Responses to Forest Expansion in Dry and Wet Basins of China: Implications for Future Afforestation Planning, Water Resour. Res., 58, e2021WR031856, https://doi.org/10.1029/2021WR031856, 2022.
Yang, H. and Yang, D.: Derivation of climate elasticity of runoff to assess the effects of climate change on annual runoff: Derivation of climate elasticity of runoff, Water Resour. Res., 47, https://doi.org/10.1029/2010WR009287, 2011.
Yang, L., Zhao, G., Tian, P., Mu, X., Tian, X., Feng, J., and Bai, Y.: Runoff changes in the major river basins of China and their responses to potential driving forces, J. Hydrol., 607, 127536, https://doi.org/10.1016/j.jhydrol.2022.127536, 2022.
Yang, Y., Xiao, P., Feng, X., and Li, H.: Accuracy assessment of seven global land cover datasets over China, ISPRS J. Photogramm. Remote Sens., 125, 156–173, https://doi.org/10.1016/j.isprsjprs.2017.01.016, 2017.
Yang, Y., Roderick, M. L., Zhang, S., McVicar, T. R., and Donohue, R. J.: Hydrologic implications of vegetation response to elevated CO2 in climate projections, Nat. Clim. Change, 9, 44–48, https://doi.org/10.1038/s41558-018-0361-0, 2019.
Zeng, F., Ma, M.-G., Di, D.-R., and Shi, W.-Y.: Separating the Impacts of Climate Change and Human Activities on Runoff: A Review of Method and Application, Water, 12, 2201, https://doi.org/10.3390/w12082201, 2020.
Zhai, R. and Tao, F.: Climate Change in China Affects Runoff and Terrestrial Ecosystem Water Retention More Than Changes in Leaf Area Index and Land Use/Cover Over the Period 1982–2015, J. Geophys. Res.-Biogeo., 126, e2020JG005902, https://doi.org/10.1029/2020JG005902, 2021.
Zhang, B., Tian, L., Zhao, X., and Wu, P.: Feedbacks between vegetation restoration and local precipitation over the Loess Plateau in China, Sci. China Earth Sci., 64, 920–931, https://doi.org/10.1007/s11430-020-9751-8, 2021a.
Zhang, C., Wu, C., Kuai, S., Peng, Z., Chang, R., and Zhang, S.: Water-heat coupling model-based study on runoff driving mechanism of Zhenjiangguan Watershed, Water Resources and Hydropower Engineering, 53, 78–87, https://doi.org/10.13928/j.cnki.wrahe.2022.08.008, 2022a.
Zhang, J., Zhang, Y., Sun, G., Song, C., Dannenberg, M. P., Li, J., Liu, N., Zhang, K., Zhang, Q., and Hao, L.: Vegetation greening weakened the capacity of water supply to China's South-to-North Water Diversion Project, Hydrol. Earth Syst. Sci., 25, 5623–5640, https://doi.org/10.5194/hess-25-5623-2021, 2021b.
Zhang, J., Zhang, Y., Sun, G., Song, C., Li, J., Hao, L., and Liu, N.: Climate Variability Masked Greening Effects on Water Yield in the Yangtze River Basin During 2001–2018, Water Resour. Res., 58, e2021WR030382, https://doi.org/10.1029/2021WR030382, 2022b.
Zhang, S., Yang, H., Yang, D., and Jayawardena, A. W.: Quantifying the effect of vegetation change on the regional water balance within the Budyko framework, Geophys. Res. Lett., 43, 1140–1148, https://doi.org/10.1002/2015GL066952, 2016a.
Zhang, X., Zhao, T., Xu, H., Liu, W., Wang, J., Chen, X., and Liu, L.: GLC_FCS30D: the first global 30 m land-cover dynamics monitoring product with a fine classification system for the period from 1985 to 2022 generated using dense-time-series Landsat imagery and the continuous change-detection method, Earth Syst. Sci. Data, 16, 1353–1381, https://doi.org/10.5194/essd-16-1353-2024, 2024.
Zhang, Y., Song, C., Sun, G., Band, L. E., McNulty, S., Noormets, A., Zhang, Q., and Zhang, Z.: Development of a coupled carbon and water model for estimating global gross primary productivity and evapotranspiration based on eddy flux and remote sensing data, Agr. Forest Meteorol., 223, 116–131, https://doi.org/10.1016/j.agrformet.2016.04.003, 2016b.
Zhao, F., Wu, Y., Ma, S., Lei, X., and Liao, W.: Increased Water Use Efficiency in China and Its Drivers During 2000–2016, Ecosystems, 25, 1476–1492, https://doi.org/10.1007/s10021-021-00727-4, 2022.
Zhou, S., Yu, B., Huang, Y., and Wang, G.: The effect of vapor pressure deficit on water use efficiency at the subdaily time scale, Geophys. Res. Lett., 41, 5005–5013, https://doi.org/10.1002/2014GL060741, 2014.
Zhou, S., Yu, B., Lintner, B. R., Findell, K. L., and Zhang, Y.: Projected increase in global runoff dominated by land surface changes, Nat. Clim. Change, 13, 442–449, https://doi.org/10.1038/s41558-023-01659-8, 2023.